Abstract
The World Health Organization (WHO) suggests that mental disorders, neurological disorders, and suicide are growing causes of morbidity. Depressive disorders, schizophrenia, bipolar disorder, Alzheimer’s disease, and other dementias account for 1.84%, 0.60%, 0.33%, and 1.00% of total Disability Adjusted Life Years (DALYs). Furthermore, suicide, the 15th leading cause of death worldwide, could be linked to mental disorders. More than 68 computer-aided diagnosis (CAD) methods published in peer-reviewed journals from 2016 to 2021 were analyzed, among which 75% were published in the year 2018 or later. The Preferred Reporting Items for Systematic Reviews and Meta-Analyses (PRISMA) protocol was adopted to select the relevant studies. In addition to the gold standard, the sample size, neuroimaging techniques or biomarkers, validation frameworks, the classifiers, and the performance indices were analyzed. We further discussed how various performance indices are essential based on the biostatistical and data mining perspective. Moreover, critical information related to the Transparent reporting of a multivariable prediction model for individual prognosis or diagnosis (TRIPOD) guidelines was analyzed. We discussed how balancing the dataset and not using external validation could hinder the generalization of the CAD methods. We provided the list of the critical issues to consider in such studies.
1. Introduction
Mental health is a state of successful cognitive function resulting in adapting to change and coping with everyday stresses of life [1,2]. Mental disorders refer to a wide range of conditions affecting mood, thinking, and behavior. They could be occasional or chronic [3]. Some major mental disorders include depression, bipolar disorder (BD), and schizophrenia (SZ) [4]. Mental illnesses are globally among the leading causes of disability in Disability Adjusted Life Years (DALYs) [5]. Figure 1 shows the composition of mental disorder DALYs by type of disorder for both sexes combined worldwide from 1990 to 2019 [6]. Depressive disorders (29.74%), followed by anxiety disorders (22.86%), and schizophrenia (11.66%) are the top three contributors to mental disorder DALYs [6].
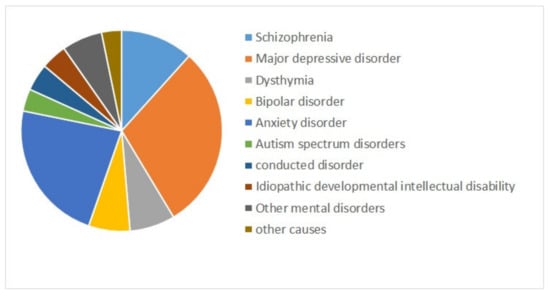
Figure 1.
The contribution of mental disorders to Disability Adjusted Life Years (DALYs) worldwide, for both sexes combined, 2019 [6].
Among mental disorders, depressive disorders account for 1.84%, anxiety disorders for 1.13%, schizophrenia for 0.60%, and BD for 0.33% of total DALYs [6]. As mentioned in Figure 2 (Source: Institute for Health Metrics Evaluation. Used with permission. All rights reserved.), countries with the highest age-standardized mental disorder DALYs rates were Portugal 2603.92, Greece 2510.55, Greenland 2486.44, Iran 2436.44, and Spain 2396.768 DALYs per 100,000, in 2019 [6]. The World Health Organization (WHO) reported that over 450 million people worldwide suffer from mental disorders [7].
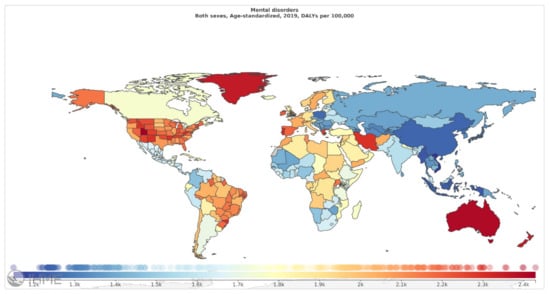
Figure 2.
Mental disorders, age-standardized DALY rates (per 100 000) by location, both sexes combined, 2019 (reproduced with permission from [6]).
Every year, almost 25% of people experience a mental disorder [8]. However, due to the lack of access to adequate mental illness services and stigmatization, most patients do not receive help [9]. The increasing rate of mental disorders could be related to political and social violence, economic change, and cultural disruptions [10].
In addition to mental disorders, neurological disorders are illnesses causing psychological symptoms [11]. Such disorders have become important causes of death and disability worldwide [12]. The primary neurological disorders include Alzheimer’s disease (AD) and other dementias [12]. Figure 3 shows the composition of neurological disorders DALYs by type of disorder for both sexes combined worldwide from 1990 to 2019 [6]. About 20% of neurological disorders are AD and other dementias [13]. Today, almost 35.6 million people suffer from AD worldwide. This number will approximately double to 65.7 million cases by 2030 and may even triple to 115.4 million cases by 2050 [14]. The rapidly growing potential of sufferers and the inevitable enormous economic effects of AD on health and social services have led governments to take swift action to eradicate the disease [15]. Therefore, although AD is not at the top in Figure 3, it could be one of the most critical neurological disorders.
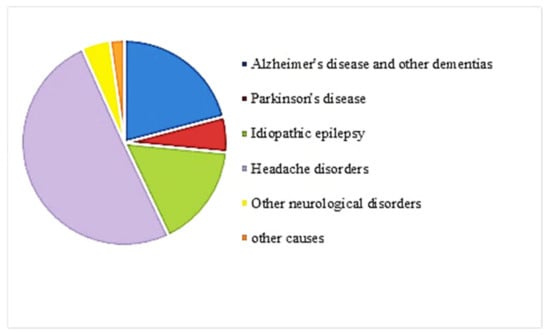
Figure 3.
Contribution by neurological disorders to DALYs worldwide, both sexes combined, 2019 [6].
According to the Global Burden of Disease (GBD) 2019, AD and other dementias account for 1% of total DALYs. As mentioned in Figure 4 (Source: Institute for Health Metrics Evaluation. Used with permission. All rights reserved.), countries with the highest age-standardized neurological disorders DALYs rates were: Japan 1612.77, Italy 1109.73, Greece 923.58, France 880.49, and Estonia 854.71 DALYs per 100,000, in 2019 [6].
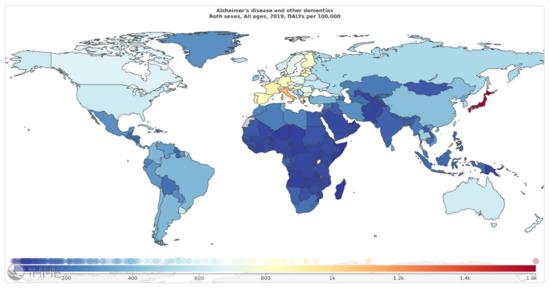
Figure 4.
Alzheimer’s disease and other dementias, age-standardized DALY rates (per 100 000) by location, both sexes combined, 2019 (reproduced with permission from [6]).
Suicide, a death caused by intentional termination of one’s own life, has been known to be a critical public health issue by the WHO [16]. Each year, around one million people die due to suicide [17]. It is also one of the leading causes of death among young people worldwide, and, as such, it is responsible for a massive amount of pointless suffering and a substantial number of premature deaths [18]. Suicide has disruptive psychosocial effects [18] and is thus a global public health issue [19]. It shows considerable differences between geographic regions, socio-political realities, age groups, and genders [19]. Suicide was in the leading ten causes of death in five GBD regions [20].
The WHO data suggests that mental disorders, neurological disorders, and suicide are growing causes of morbidity [16,21]. The World Health Report 2001 and the Mental Health Action Plan 2013–2020 focused on mental disorders such as depression and schizophrenia, some neurological disorders like AD [22], and suicide [16]. In 2017, mental disorders were the sixth leading cause of DALYs and the second leading cause of disease burden in terms of years lived with disability (YLDs) in the world [23]. Furthermore, neurological disorders ranked as the second-leading cause of death and DALYs’ major cause in 2015 [12]. Suicide is the 15th leading cause of death worldwide [24]. Meanwhile, the total number of deaths from suicide increased by 6.7% globally from 1990 to 2016 [20]. It is also considered the second cause of unnatural death for those between 15 and 29 years old [25,26].
Significant proportions of mental and neurological disorders arise in low- and middle-income countries [27,28]. Mental disorders lead to significant social, personal, and economic loss, including functional impairment, psychosocial disability [29], low quality of life [30], and loss of productivity [31]. Patients with mental disorders have a shorter life expectancy than the general population; there is a strong dose–response effect between mortality and psychological distress [32]. Furthermore, milder disorders could impair functional capacity, which causes difficulties in social and marital relations [33].
Although in low-income and middle-income countries, 75·5% of deaths by suicide occur, suicide’s prevalence is higher in high-income countries [24]. Suicide could be linked to mental disorders [34]. Almost 90% of individuals who committed suicide have been subjected, at least, to one mental disorder [35]. Mental disorders contribute between 47% and 74% of suicide risks [18]. In around 50–65% of suicide cases, depression was observed [18]. Schizophrenia also accounts for very few of all youth suicides [36]. Furthermore, associations between suicide and anxiety disorders have been observed [18]. Accordingly, suicide prediction and diagnosis were also analyzed in our study.
Failure to detect mental disorders results in not receiving potentially effective treatment for the patients [32]. Long-lasting psychological distress has profound effects on the prospect of having a reasonable quality of life in patients and their work capacity and family [32]. It has been shown that early detection of mental disorders could shorten the duration of a disorder, reduce the number of further consultations, and result in less social impairment [32]. Furthermore, early detection of neurological disorders is critical to achieve optimal disease control [37].
There are various methods to detect and diagnose mental and neurological disorders at early stages, from interpreting participants’ answers to questions about their lives to using diagnostic equipment such as electroencephalogram (EEG), magnetoencephalogram (MEG), positron emission tomography (PET), magnetic resonance imaging (MRI), etc. [38,39]. However, manual assessment of such techniques is time-consuming and sensitive to error [39]. In fact, because of the differences in experts’ experience, manual methods of diagnosis are subjective to the examiner and are thus prone to errors and biases. Computer-aided diagnosis (CAD) was recently used as the second opinion to assist the diagnosis procedure [39].
Machine learning methods, with the inputs from different sources such as functional MRI (fMRI) [40], clinical and sociodemographic variables [41], information posted on social networks [26], or Patient Health and other related Questionnaire [42], were used in the literature for suicide diagnosis and prediction. CAD systems have been used to help clinicians, medical doctors, or neurologists diagnose certain diseases or disorders [43]. CAD systems’ goal is to improve the accuracy of experts interpreting big medical data so that the analysis time can be reduced and the diagnosis consistency is improved [44]. Numerous CAD frameworks and methods have been developed in the literature to analyze medical signals and images [43]. CAD systems are suitable to complete the neuropsychological assessments conducted by expert clinicians and improve prediction accuracy. In this sense, many studies used the CAD system to detect mental disorders, neurological disorders, and suicide. Thus, this review aimed to analyze the current CAD method for diagnosing depressive disorders, BD, schizophrenia, AD, dementia, and suicide.
2. Materials and Methods
2.1. Gold Standard
Due to the multiplicity of mental disorders and the importance of proper diagnosis and treatment, the need to classify these disorders has always existed and led to the publication of the Diagnostic and Statistical Manual of Mental Disorders (DSM). Its latest version, DSM-5, was released in 2013. Structured Clinical Interview for DSM-5 (SCID-5) is a structured diagnostic interview to diagnose mental disorders according to the criteria characterized in the DSM-5, which a trained clinician should prescribe. This structure specifies the order of the questions, how the questions are worded, and how the subject’s responses are classified. The primary diagnosis methods are summarized as the following [45].
2.1.1. Depression Disorder
SCID is considered to be the commonly used gold standard for a depression diagnosis. Major depressive disorder (MDD) is a type of depression characterized by separate episodes of at least 14 days. Critical symptoms of MDD are depressed mood, loss of interest, weight loss or weight gain without any particular diet, insomnia or hypersomnia, frequent thoughts of death or suicide, decreased ability to concentrate and think, feelings of being worthless and guilty, psychomotor agitation or retardation, feelings of energy loss and indecisiveness. Five or more of the above symptoms, when at least one of them is one of the first two symptoms is required for a depression diagnosis [46]
2.1.2. Bipolar Disorder
SCID is used as the gold standard among diagnostic interviews, but its validity will not be known until the discovery of related biomarkers. At least one period of mania is necessary for a specific diagnosis of bipolar disorder I (BD-I), while one hypomania and major depressive episode without a manic episode is essential for bipolar II (BD-II) diagnosis [47,48]
2.1.3. Schizophrenia
Patients’ description of symptoms, mental state tests, and behavioral observations help psychiatrists diagnose schizophrenia based on DSM-5 criteria, which is the gold standard of diagnosis to date. The most important symptoms are delusions, hallucinations, disorganized speech, extremely catatonic behavior, and negative symptoms such as decreased emotional expression. Two or more of these symptoms, when at least one of them is one of the first three symptoms is required for a schizophrenia diagnosis, and each of them should be present for a considerable period within a month [49,50].
2.1.4. Alzheimer’s
AD is a specific type of dementia. The gold standard hallmarks for definitive diagnosis of AD are cortical atrophy, amyloid-predominant neuritic plaques, and tau-predominant neurofibrillary tangles validated by postmortem histopathological examination. Amyloid precursor protein (APP), presenilin 1 (PSENl), or presenilin 2 (PSEN2) are known causative genes of the AD where genetic tests can show their mutation in early-onset cases. Furthermore, amyloid-based diagnostic tests such as positron emission tomography (PET) and cerebrospinal fluid (CSF) scans can be useful diagnostic tools [51]
2.1.5. Dementia
In DSM-5, major neurocognitive disorder (MCD) is considered an alternative term for dementia that was used in previous versions. A significant decrease in the level of the subject’s cognitive performance; for example, in learning and memory functions, followed by interference with independent daily activities, is a sign of dementia. Clinical Dementia Rating (CDR) is a cognitive diagnostic assessment widely used as the gold standard for diagnosing dementia. The CDR test is a semi-structured interview with the patient and a trustful informant, consisting of 46 questions, that takes 30–90 min to be completed and must be done by a trained clinician [52,53,54].
2.1.6. Suicide
Validated questionnaires have been used in the literature to diagnose high-risk individuals for suicidal behaviors [55]. Suicide Behaviors Questionnaire-Revised (SBQ-R) is a globalized test for identifying individuals at increased risk of suicidal behaviors, including ideation and attempts [56]. The SBQ-R test was designed based on the SBQ test, a 34-item questionnaire measuring the suicide tendency. It is a self-report test distinguishing between suicidal and non-suicidal subjects. The SBQ-R test includes four Likert-type questions that measure the risk of suicide according to the subject’s suicide ideation/attempt during lifetime, suicidal ideation rate in the last year, expressing thoughts of committing suicide with others, and suicidal behavior occurrence probability in the future. Each question has different points from 0 to 6 based on the subject’s choice. Two scoring criteria have been proposed so far to classify suicidal and non-suicidal individuals based on SBQ-R results: SBQ-R Item 1 and SBQ-R total score varying between 3 and 18. Clinical and non-clinical samples have an identical cutoff score of 2 in the SBQ-R Item 1. The SBQ-R total score’s cutoff scores were 7 and 8 for clinical and non-clinical samples, respectively [42].
2.2. The Literature Review
There are currently not enough biomarkers in psychiatry to classify disease state from the normal state, so diagnosis mostly depends on patient–physician interactions and questionnaires. Clinical observations based on patient self-reports are subjective and inaccurate even if they are based on DSM-5 criteria since they cannot identify false positives and recognize disorders from risks. This is where artificial intelligence (AI) comes in handy. AI is a general term in psychiatry that denotes the use of advanced computerized techniques and algorithms to diagnose, prevent, and treat mental disorders, such as automatic speech processing and machine learning algorithms applied on electronic medical databases and health records to assess a patient’s mental state. AI-based interventions reduce false negative and positive diagnoses and annihilate the stigma associated with mental illness symptoms to the clinician. They are also affordable and have significant benefits for patients suffering from restricted movement due to their symptoms. AI-based methods are not replacing clinicians; they can complement human clinical decisions by providing more comprehensive information to empower the health care system [57,58]. Here, we provided the literature review of the CAD systems for suicide, neurological disorders, and mental disorders focusing on the sample size, input features, classifiers, type of validations, and their performance indices.
2.2.1. PRISMA Guideline
We reviewed the works focusing on the diagnosis and prediction of CAD methods proposed in the literature for suicide, neurological disorders, and mental disorders. The Preferred Reporting Items for Systematic Reviews and Meta-Analyses (PRISMA) statement [59,60] was proposed in the literature to enrich and standardize medical reviewer papers [61]. We adopted the PRISMA guideline to select the relevant studies.
2.2.2. Search Strategy
A literature search of the online database of PubMed between 2016 and 2021 was performed using the terms (“bipolar” OR “bipolar disorder” OR “schizophrenia” OR “suicide” OR “Alzheimer” OR “dementia” OR “major depressive disorder” OR “depression”) AND (“machine learning” OR “deep learning”) AND “accuracy”. The reference lists of the identified publications were also reviewed. Peer-reviewed articles in English on Humans were analyzed.
2.2.3. Eligibility Criteria
Published studies were included in the review if they met the following criteria: (1) at least a measure of the diagnostic accuracy was provided, (2) at least the classifier, the validation framework, or the validation type were provided. Figure 5 shows a flow diagram describing the study selection process. Among 563 records screened, 71 studies were excluded as irrelevant to the original research question. Among the remaining 492 studies, 424 studies did not meet the eligibility criteria. Thus, 68 studies were included in our analysis.
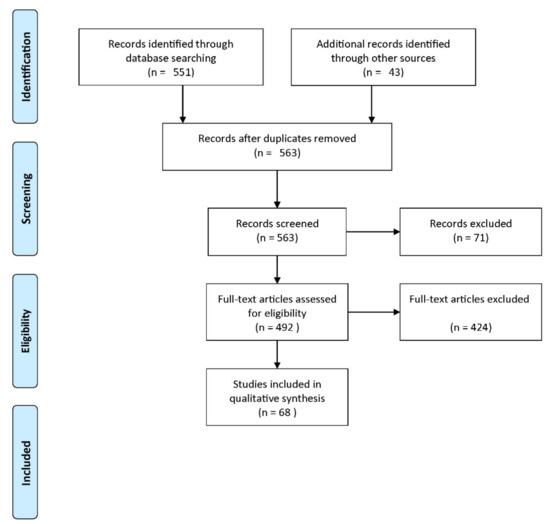
Figure 5.
Flow diagram of the study selection process (reproduced with permission from [60]).
2.2.4. Data Abstraction
The following characteristics were recorded for each study included in our analysis: publication reference (the first author’s surname and the year of publication), the sample size, the case and control groups, input features, classifiers, internal or external validation, type of validation (holdout or resampling), and the diagnostic accuracy.
3. Results
The CAD methods for mental and neurological disorders are listed in Table 1, Table 2, Table 3, Table 4, Table 5, Table 6, Table 7, while the CAD methods for suicide prediction are provided in Table 8, Table 9, Table 10, Table 11.

Table 1.
CAD methods for mental and neurological disorders.
Table 2.
CAD methods for mental and neurological disorders (cont’d).
Table 3.
CAD methods for mental and neurological disorders (cont’d).
Table 4.
CAD methods for mental and neurological disorders (cont’d).
Table 5.
CAD methods for mental and neurological disorders (cont’d).
Table 6.
CAD methods for mental and neurological disorders (cont’d).
Table 7.
CAD methods for mental and neurological disorders (cont’d).
Table 8.
CAD methods for suicide prediction.
Table 9.
CAD methods for suicide prediction (cont’d).
Table 10.
CAD methods for suicide prediction (cont’d).
Table 11.
CAD methods for suicide prediction (cont’d).
3.1. Validation Frameworks and Performance Indices
3.1.1. Validation Frameworks
The validation framework is one of the critical issues in data mining approaches. In “holdout,” the most straightforward cross-validation, the data set is randomly assigned to two sets: the training set and the test set. In addition to the data’s inefficient use, the method’s limitations are pessimistically biased error estimations [127,128]. Moreover, testing hypotheses proposed by the data are not guarded by this method (type III errors [129]) as the data may be permuted until there would be an acceptable accuracy on the training and test sets in a “holdout” setting. Therefore, other validation frameworks such as repeated holdout, leave-one-out validation, 0.632+ bootstrap, and cross-validation [130] are preferred. These issues are also addressed in the TRIPOD guideline from a clinical perspective [131].
Choi et al. [104] proposed a framework for early detection of dementia using holdout validation. Moreira et al. [105] presented a hybrid data mining model for the diagnosis of dementia using holdout setting. Lin et al. [97] designed a convolutional neural network (CNN)-based approach to predict mild cognitive impairment to Alzheimer’s disease (MCI-to-AD) conversion using MRI data with leave-one-out cross-validation (CV). Ding et al. [98] proposed a hybrid computational approach to classify AD with holdout and resampling; synthetic minority oversampling technique (SMOTE). Aidos et al. [101] presented a new methodology to obtain an efficient CAD system for predicting AD using longitudinal information with holdout validation. Li et al. [132] developed a spectral CNN for a reliable AD prediction with 10-fold CV. Sayed et al. [133] designed an automatic system for AD diagnosis with 7-fold CV.
3.1.2. Subject-Wise Cross-Validation
The other critical issue is using leave-one-subject-out cross-validation when there are repeated measurements for each subject [134]. Thus, we must take out the entire measurements of a subject from the training set and report the trained system’s performance for the test subject. Otherwise, if we use other internal validation methods and perform training and test set random permutations on the entire measurements, rather than subjects, the probability of some measurements of one subject being in the training set and others in the test set is high. If there is a high correlation in such repeated measurements, the accuracy of the diagnosis system is overestimated. To reduce estimation variance, it is preferred to use subject-wise cross-validation with a more extensive test sample size, rather than leave-one-subject-out cross-validation [135].
3.1.3. Critical Performance Indices
It is also essential to report various performance indices since they convey critical information that is very important in clinical systems. One of the most important formulas related to the posterior probability is the following [136]:
where, Se is the sensitivity, Sp is the specificity, Prev is the prevalence of the disease, D is the positive condition event determined by the gold standard, and E is the test outcome positive event determined by the diagnosis system. The parameter PPV is the disease probability given that the patient test result is positive, which is essential when the system is used in practice. The PPV significantly drops in imbalanced datasets, in which the prevalence of the disease is low. For example, when a CAD with the Se and Sp of 80% and 95% is tested in practice where Prev is 10%, the expected PPV is 64%.
The minimum sensitivity of 80% and specificity of 95% [137], maximum False Discovery Rate (FDR = 1-PPV, Positive Predictive Value) of 5% [138], and the minimum Diagnostic Odds Ratio (DOR) of 100 [139] could be considered a reasonable requirement of a reliable clinical diagnosis system. As a complementary condition, the minimum Negative Predictive Value (NPV) of 95% could be listed [136].
Some of the published works on mental health provided a variety of performance indices. For example, Lee et al. [62] designed a diagnostic model using biomarkers in peripheral blood to diagnose BD-II with a 90% specificity and sensitivity of 85%. Ildiz et al. [73] obtained 94% sensitivity, specificity, and precision of their analytical model to diagnose SZ and BD. Alici et al. [63] proposed the utility of optical coherence tomography (OCT) data to distinguish BD-I patients from controls with a sensitivity of 87.5%, a specificity of 47.5%, positive predictive value (PPV) of 52.5%, and negative predictive value (NPV) of 79.2%. Fernandes et al. [66] reached a sensitivity of 88.29% and specificity of 71.11% for BD vs. control, a sensitivity of 84% and specificity of 81% for SZ vs. control, and sensitivity of 71% and specificity of 73% for BD and SZ. Achalia et al. [74] used multimodal neuroimaging and neurocognitive measures to differentiate BD patients from healthy controls and obtained a sensitivity of 82.3% and specificity of 92.7%. Li et al. [140] obtained a sensitivity of 80.6% and specificity of 86.3% in predicting AD with Actigraphy Data. Li et al. [132] showed that their spectral CNN could achieve a sensitivity of 88.24% and specificity of 95.45% in AD and normal control classification, a sensitivity of 92.86% and specificity of 77.78% in AD and MCI classification, and sensitivity of 84.38% and specificity of 92% in MCI and normal control classification.
A machine learning approach was used by Bin-Hezam and Ward [102] to detect dementia and yielded a precision of 91.34%, a sensitivity of 91.53%, and F1 score of 91.41% for dementia vs. non-dementia, a precision of 76.76%, sensitivity of 77.00%, and F1 score of 76.35% for control normal (CN) vs. MCI vs. dementia. Choi et al. [104] proposed a novel framework for dementia identification with an F1 score of 78%, sensitivity of 93.43%, specificity of 89.66%, positive likelihood ratio of 9.0319, a negative likelihood ratio of 0.0732, PPV of 0.5064, and NPV of 0.9917. Chen et al. [117] used ensemble learning to predict suicide attempts/death following a visit to psychiatric specialty care. The sensitivity, specificity, PPV, and NPV of the 90-day prediction model were 47.2%, 96.6%, 34.9%, and 97.9%. Ensemble learning was also used by Naghavi et al. [42] for the prediction of suicide ideation/behavior. The proposed system had the sensitivity, specificity, PPV, and DOR of 81%, 98%, 94%, and 227, respectively. In such examples, various performance indices could provide valuable information about the designed systems’ clinical reliability. Otherwise, it is not possible to judge the clinical applications of CAD systems.
3.1.4. The 95% Confidence Interval
Following the STARD and TRIPOD guidelines, it is necessary to provide the confidence interval (CI) 95% of the performance indices [141,142]. Such CI 95% values could identify the reliability of the performance indices estimation [143]. For example, in the study by Shang-Ming Zhou et al. [103], effective predictors related to hospital admission of dementia patients such as blood glucose were found with a sensitivity of 0.758 (95% CI 0.731–0.785), specificity of 0.759 (95% CI 0.710–0.808), precision of 0.766 (95% CI 0.735–0.797), and negative predictive value of 0.751 (95% CI 0.741–0.761). Xuemei Ding et al. [98] achieved a multiclass accuracy of 0.8 (95% CI 0.67–0.89) to classify Alzheimer’s disease severity. Kelvin KF Tsoi et al. [144] showed that the combination of drawing behavioral data and digital platform could be useful in early detection of dementia with a sensitivity of 0.742 (95% CI 0.702–0.779), specificity of 0.724 (95% CI 0.668–0.776), positive predictive value of 0.833 (95% CI 0.804–0.859), and negative predictive value of 0.601 (95% CI 0.562–0.640).
Klaus Munkholm et al. [70] demonstrated that a composite marker containing different molecular levels and tissue data is an operational biomarker to discriminate bipolar disorder from healthy subjects with an Area Under the ROC Curve (AUC) of 0.826 (95% CI 0.749–0.904). Utilizing optical coherence tomography, Soner Alici et al. [64] indicated an AUC of 0.688 (95% CI 0.604–0.771) in comparing bipolar disorder and healthy individuals. In 2016, Guoqing Zhao et al. [64] performed a study and mentioned that plasma mBDNF and proBDNF levels were the best biomarkers in identifying bipolar disorder among patients in depressive episodes with an AUC of 0.858 (95% CI 0.753–0.963). In the study by Noa Tsujii et al. [67], a high AUC of 0.917 (95% CI 0.849–0.985) was provided based on hemodynamic response and mitochondrial dysfunction to diagnose bipolar disorder and major depressive disorder. Naghavi et al. [42] assessed the suicide ideation/behavior performance using different indices and CI 95%. Based on the cross-validated confusion matrix, the AUC, Matthews Correlation Coefficient (MCC), Discriminative Factor (DP), and Cohen’s Kappa were 0.90 (CI 95%: 0.86–0.93), 0.83 (0.81–0.86), 227 (100–512), 2.30 (1.96–2.65), and 0.83 (0.78–0.88). Chen et al. [117] predicted the suicide attempt/death with an AUC of 0.88 (0.87–0.89) for the outcome within 90 days.
3.2. Input Features
Various inputs were used in the literature for mental and neurological disorder diagnosis. They include, for example, Child Behavior Checklist [145], serum miRNA [62], blood serum Raman spectra [73], optical coherence tomography [63], blood samples [64,65], immune and inflammatory biomarkers in peripheral blood and cognitive biomarkers [66], blood sample Nuclear Magnetic Resonance (NMR) [69], optical coherence tomography [64], MRI [76,82], fMRI [103,114,118], rs-fMRI [72,86], PET [96], EEG [79,81], steady-state visual evoked potentials (SSVEP) [71], speech signal [86], demographics and medical history [102], or drawing behavior [144].
Moreover, demographic, socioeconomic and medical records [109], fMRI [40], Weibo posts [109], questionnaire and web-based survey [40], and Reddit social media dataset [126] were used to predict or diagnose suicide ideation, behavior, or death.
Functional neuroimaging techniques—such as PET and fMRI—enable mapping the brain’s physiology by measuring blood flow, receptor–ligand binding, and metabolism. Such techniques have been recently used in mental health, which improved understanding of the underlying mechanisms [146]. Functional imaging is divided into resting state (e.g., rs-fMRI) and studies in active conditions. On the other hand, structural neuroimaging, such as NMR and MRI, has been widely used to exclude organic brain disease in mental disorders. It was shown in the literature that structural brain imaging is clinically useful to discriminate mental disorders, including SZ, BD, depression (MDD), and AD [147].
Both of the functional and structural—except CT-scan—neuroimaging techniques were shown to be useful for suicided diagnosis [148]. Both techniques have advantages and disadvantages (e.g., spatial versus temporal resolution) [149], and their combination, a.k.a., multimodal neuroimaging, can yield important insights due to its complementary spatiotemporal resolution [150]. Lei et al. used the combination of MRI and rs-fMRI for diagnosing SZ patients. In this study, the multimodal neuroimaging showed better performance than structural or functional neuroimaging separately [151].
A promising feature for the BD-II diagnosis was introduced by Lee et al. [62], which was the serum miRNA. In this study, serum expression levels of miR-7-5p, miR-23b-3p, miR-142-3p, miR-221-5p, and miR-370-3p significantly reduced in healthy control compared with BD-II (Figure 6). The diagnostic model with support vector machine (SVM) reached good diagnostic accuracy (AUC: 0.907) when using expression of miRNA miR-7-5p + miR-142-3p + miR-221-5p + miR-370-3p.
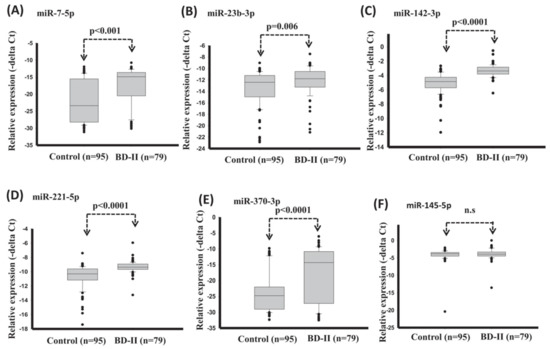
Figure 6.
Expression levels of circulating miRNAs in serum in healthy controls and BD-II using t-test (training set). (A) miR-7-5p (B) miR-23b-3p (C) miR-142-3p (D) miR-221-5p (E) miR-370-3p (F) miR-145-5p. (Reproduced with permission from [62]).
Perhaps the mostly used features for suicide ideation/attempts prediction are demographics, socioeconomic status (SES), and life-style variables. For example, Jung et al. [113] designed a suicide prediction model for middle and high school students based on the multivariate logistic regression and reached the prediction accuracy of 77.9%. The selected significant features included gender, school grade, city type, academic achievement, living with parents, family SES, father’s and mother’s education, physical activity, and self-rated weight and health.
3.3. Classification Methods
A variety of classification methods were used in the literature to classify mental and neurological disorders. The support vector machine (SVM) was used to diagnose BD [62]. Partial least squares discriminant analysis (PLS-DA) [66], k-nearest neighbor [71], deep convolutional neural network (CNN) [78], and Fisher linear discriminant (FLD) [86] were used for SZ classification. The multivariate logistic regression (MLR) [67], deep integrated support vector machine (DISVM) [93], CNN [94], and SVM [96] were used to classify depression. The SVM, artificial neural network (ANN), decision tree [106], and CNN [99] were used for AD/MCI diagnosis.
Many classifiers were used for suicide ideation, behavior, or death prediction in the literature, including logistic regression with/without regularization [99], deep neural networks (DNNs) [104,125], decision tree algorithm [99], SVM [40], random forests [104,125], Gaussian Naive Bayes (GNB) [40], extreme gradient boosting (XGB) [40], Cox regression [116], ensemble learning [117], elastic net [41], and long short-term memory convolutional neural network (LSTM-CNN) [126].
Decision tree, or its ensemble extensions such as random forests were frequently used for mental health in the literature [42,105,106,107,108,112,118,120,122]. A decision tree is a rule-based system, wherein its simplest form is a clinically interpretable structure for clinicians used in clinical decision analysis [152]. Naghavi et al. [42] used the combination of stability feature selection and stacked ensembled decision trees (Figure 7) for suicide ideation/behavior diagnosis and reached an AUC of 0.9. In this study, a variety of questionnaires and demographic information was used.
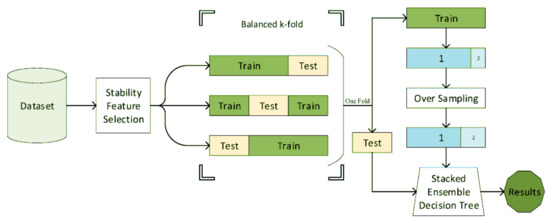
Figure 7.
The block diagram of the suicide diagnosis algorithm. The features are first selected using stability feature selection. Using the stratified sampling, the features are then classified using a stacked ensemble decision tree (reproduced with permission from [42]).
The classifiers used for mental health could be categorized into two main categories: traditional machine learning (e.g., DA and its variants, SVM, decision tree), and deep learning (LSTM, CNN). A deep neural network (DNN) is an artificial neural network with more than one hidden layer. Unlike many traditional classifiers such as linear discriminative analysis (LDA), SVM, or Decision Tree (DT), where few parameters must be estimated or tuned, DNNs have many tunable variables. Thus, they require massive amounts of data to estimate their parameters accurately. When the available data is limited, various issues must be considered to avoid overfitting [153]. Strategies such as early stopping criteria, data augmentation, dropouts, and regularization are used [154]. Moreover, when the dataset is imbalanced (e.g., the mental disorder classification) specific deep learning techniques must be taken into account [155]. Geometrical augmentation is usually used to increase the image sample size by random rotation, translation, and horizontal flipping. However, it was shown that such augmentations do not necessarily improve the predictive accuracy of the deep learning methods [156].
DNNs were used in the literature for multimodal neuroimaging classification in mental health [157]. Although DNNs are promising, they usually appear to be black boxes. The input is the raw data, and the output is the predicted class, and no internal interpretation is provided. It is problematic since clinicians require proper interpretation of abnormal brain regions, for example, in neuroimaging data [158]. There have been some attempts to visualize the black box of the DNNs in the literature [159].
Statistical models such as MLR and Cox regressions were used in mental health literature [67,116]. MLR is an extension of the linear regression when the outcome is binary. It not only provides the probability that a sample belongs to an output class, but it also identifies the significant features in the model. Thus, it is also a feature selection method [160]. On the other hand, Cox regressions are time-to-event models where the event of interest (e.g., committing suicide) and the event’s time (e.g., the time from the suicide attempt to the previous hospitalization) are essential. Such models are usually used in survival analysis. When a proper threshold is estimated, it is possible to dichotomize the model’s continuous output risk for discrimination between output classes [161]. Unlike other classification methods, both MLR and Cox models support mixed-type input data, and no transformation is required to perform on nominal or ordinal data.
3.4. Balancing the Dataset and Generalization of the Results
Bayes’ theorem (Equation (1)) was addressed in the literature as a confounding effect of the low prevalence of a disorder on the performance of the CAD systems [162], even when the AUC is very high [163]. Events such as suicide attempt/death have a low prevalence in the population (e.g., 10.7 per 100,000 individuals [164]). Other mental and neurological disorders have a relatively low prevalence (e.g., the global prevalence of 1% for SZ [165]). Thus, they can only be reliably predicted using an extraordinary discrimination capability between higher and lower risk groups. Suppose that a CAD system has a Sensitivity of 90% and a Specificity of 95% based on the cross-validated confusion matrix, which is very good for an imbalanced dataset. The probability that the new subject has the disorder, subject to the positive CAD result, could be estimated using Equation (1) for different disease prevalence (Figure 8).
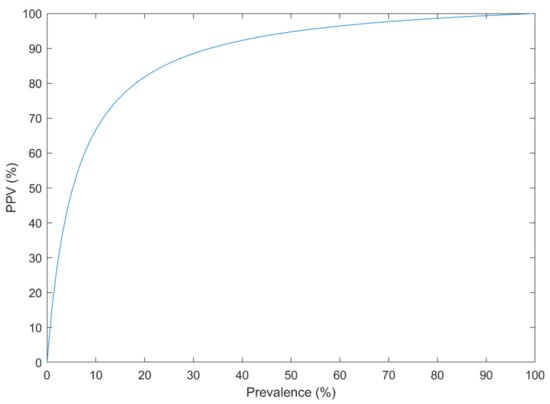
Figure 8.
The Positive Predictive Value (PPV) of a diagnosis system with the sensitivity of 90% and specificity of 95% at different disease prevalence.
For example, with the prevalence of 1% in such disorders, the PPV is only 15%. If the dataset is balanced for the analysis (e.g., 3549 suicide-indicative posts, versus 3652 non-suicidal posts in [126]), the PPV is 95% on the analyzed dataset. However, when the system is used in practice (the prevalence of 1%), the PPV drops down to 15%. Thus, the analyzed dataset must resemble the population. It is only preserved when proper sampling and sample size calculation is performed.
3.5. EEG-Based Diagnosis
Among the studies analyzed in Table 1, Table 2, Table 3, Table 4, Table 5, Table 6, Table 7, Table 8, Table 9, Table 10, Table 11, some use the EEG signal for diagnosis. In such studies, the number of EEG channels was shown in the tables. It is also necessary to report discriminative features based on the traditional frequency bands as important clinical biomarkers in such studies. It is not enough to show whether the classification system has an acceptable accuracy, as these discriminative features are very important for clinicians. The spatial distribution of such features must also be provided over the skull [166]. In EEG studies, either the resting state [166] or evoked or cognitive functions [167] were used for mental disorders.
An example was provided from the comparison between schizophrenia and healthy subjects during cognitive functions in Figure 9. It showed significantly lower power in gamma, beta, theta, and alpha bands in healthy subjects than schizophrenia patients. It also showed that more or less, it includes the entire brain. In agreement with the theory that schizophrenia is not a lesion of a part of the brain, it is a disconnection syndrome. This disconnection would be expressed in a failure to modulate synchronous activity caused by disturbances in the dopaminergic mechanism [168].
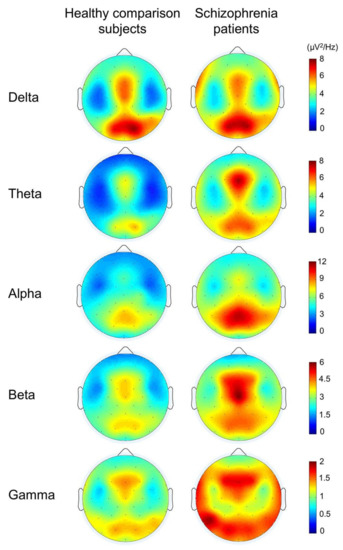
Figure 9.
The topographies for grand average spectral power in schizophrenia patients and healthy comparison subjects (reproduced with permission from [167]).
It is hypothesized that information flow across larger cortical networks is projected by low-frequency brain oscillations, while local cortical information processing is represented by high-frequency oscillations [169]. Thus, the interaction between different high- and low-frequency bands, also known as cross-frequency coupling (CFC) (Figure 10), could provide valuable insights into brain functions [170] and mental disorder diagnosis [171]. Such a representation is currently used instead of simple energy representation of different frequency bands. However, as the dimension increases, it is essential to select connected or disconnected regions of interest and representative interactions.
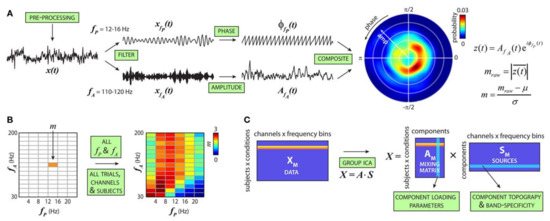
Figure 10.
Cross-frequency modulation analysis. (A) Steps to compute the cfM index (m). (B) Steps in (A) are repeated for all fP and fA combinations to produce the comodulogram. (C) For each subject, comodulograms are averaged over trials. A single row for each condition is generated by merging data from all channels (reproduced with permission from [171]).
The EEG amplitude modulation analysis (Figure 11) has been used to diagnose AD [172]. First, the full-band EEG signal was decomposed into five sub-bands (delta, theta, alpha, beta, and gamma). The Hilbert transform was used to extract the envelope of each sub-band signal. A second frequency decomposition was then used based on modulation filters to represent cross-frequency modulation interaction [173].
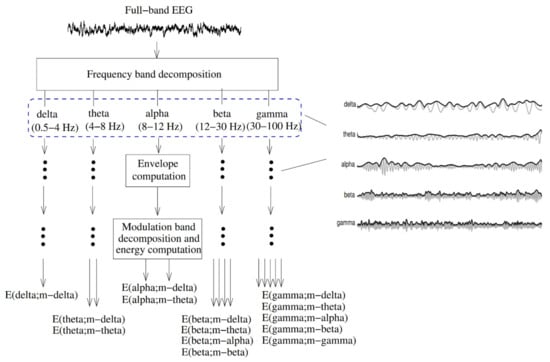
Figure 11.
Signal processing steps used to compute resting EEG spectro-temporal modulation energy (reproduced with permission from [172]).
The modulation frequency bands were shown as m-delta (0.5–4 Hz) or m-theta (4–8 Hz). The m-delta modulation frequency content in the theta frequency band could discriminate between the healthy normal, mild, and moderate AD (Figure 12).
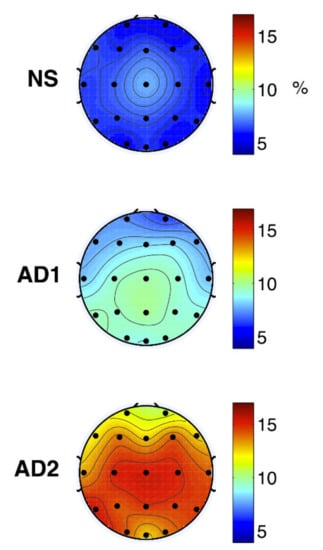
Figure 12.
Topographical maps of average NS (top), AD1 (middle; mild AD), and AD2 (bottom; moderate AD) modulation frequency responses (reproduced with permission from [172]).
4. Discussion
This review focused on the data mining methods proposed in the literature to classify major mental and neurological disorders, namely SZ, BD, MDD, AD, suicide ideation, attempt, or death. More than 68 recently peer-reviewed published journal papers since 2016 were considered, among which 75% were published in the year 2018 or later. Alonso et al. [174] provided a systematic review of the major mental and neurological disorders. However, they analyzed papers published by 2017, and the data mining validation frameworks and methods focused on in our study were not covered in their study.
Moreover, other (systematic) reviews were published in the literature on this topic [175]. Jo et al. [153] analyzed deep learning papers on AD diagnosis and prognosis published between January 2013 and July 2018 in which neuroimaging data were used. Librenza-Garcia et al. [176] analyzed machine learning papers on BD diagnosis, personalized treatment, and prognosis published up to January 2017. de Filippis et al. [177] analyzed machine learning methods for structural and functional MRI SZ diagnosis published between 2012 and 2019. Castillo-Sánchez et al. [26] reviewed machine learning methods for suicide risk assessment on social networks from 2010 until December 2019. Although the classifiers, sample size, input features, and their performance were taken into account in such studies, the validation type and framework were not directly analyzed. In addition to not following the related clinical standards such as STARD and TRIPOD, these issues would avoid the widespread application of machine learning methods in practice.
Our study has some limitations. First, we only considered PubMed for the search strategy. Other online databases such as ISI, Embase, Google Scholar, and Cochrane Collaboration could improve our initial screening records. We only focused on SZ, BD, depression (MDD), AD, dementia, and suicide. Other significant disorders, including anxiety and headache were not considered. Moreover, we mainly focused on the validation type and framework with the biostatistical perspective. However, feature extraction, selection, and classifiers are essential issues in machine learning.
In our study, the epidemiological information from the GBD was provided to identify the importance of such disorders, and the gold standard methods for their diagnosis were briefly reviewed. The CAD systems were classified based on the classification goal, sample size, neuroimaging techniques, the number of channels (in EEG signals), type of validation in terms of internal and external (subject-based) methods, type of validation based on holdout, cross-validation, and resampling methods, the performance index, and its value. We also discussed the importance of reporting a variety of performance indices and their CI 95%. Some frequency–domain features used in the literature were reviewed for major mental and neurological disorders.
Some issues must be taken into account for better clinical applications of the CAD systems in this field [136]. A simple and intuitive method must present the classification features’ discrimination over the recording electrodes and (or) their interactions. The system must be validated using proper performance indices and statistical tests. The proposed system’s clinical reliability must also be identified based on Type I, II, and III errors. The clinical interpretation, using the activity maps (for example), must be provided. The rule-based systems or interaction networks are preferred over black box methods to facilitate clinical interpretation and validation [178]. Standardization (e.g., in terms of the brain frequency bands) and benchmark datasets could facilitate the comparison of the state-of-the-art and thus improve the CAD systems’ effectiveness to diagnose major mental disorders, neurological disorders, and suicide.
5. Conclusions
The following issues must be taken into account to improve the clinical application of the CAD systems for mental health:
- The related standards, including STARD and TRIPOD, must be used. TRIPOD-Artificial intelligence (AI) is now underway due to AI applications in CAD [179,180].
- Proper performance indices must be provided in addition to their interpretation. This issue is especially critical when the database is imbalanced, and some indices could be biased [136].
- The CI 95% of the performance indices must be provided. It is especially critical for the AUC. If its CI 95% includes 0.5, the diagnostic method’s performance is not significantly better than a random generator.
- The prevalence of the disorder in the analyzed dataset must resemble its actual prevalence in the population. Otherwise, the performance of the method in practice, a.k.a. PPV, is highly deteriorated.
- A proper validation framework must be used to avoid Type III error. External validation is the best method to improve the generalization of the designed CAD.
- The clinical interpretation of the input features, their ranking, and the classifier structure must be provided for clinicians.
Author Contributions
Conceptualization, H.R.M.; methodology, M.M., S.K., and H.R.M.; software, M.M.; validation, H.R.M.; formal analysis, M.M., S.K., and H.R.M.; investigation, H.R.M., M.M., and S.K.; resources, H.R.M.; data curation, S.K.; writing—original draft preparation, M.M. and S.K.; writing—review and editing, H.R.M.; visualization, H.R.M., M.M., and S.K.; supervision, H.R.M.; project administration, H.R.M.; funding acquisition, H.R.M. All authors have read and agreed to the published version of the manuscript.
Funding
This research received no external funding.
Conflicts of Interest
The authors declare no conflict of interest.
References
- Herrman, H.; Jané-Llopis, E. The status of mental health promotion. Public Health Rev. 2012, 34. [Google Scholar] [CrossRef]
- Cook, L. Mental Health in Australia: A Quick Guide; Parliament of Australia: Canberra, ACT, Australia, 2019. [Google Scholar]
- Statewide Peer Network Development Program for Recovery and Resiliency Grants; Department of Health and Human Services Substance Abuse and Mental Health Services Administration: Fishers Lane Rockville, MD, USA, 2005.
- Kessler, T.; Lev-Ran, S. The association between comorbid psychiatric diagnoses and hospitalization-related factors among individuals with schizophrenia. Compr. Psychiatry 2019, 89, 7–15. [Google Scholar] [CrossRef] [PubMed]
- Whiteford, H.A.; Ferrari, A.J.; Degenhardt, L.; Feigin, V.; Vos, T. The global burden of mental, neurological and substance use disorders: An analysis from the Global Burden of Disease Study 2010. PLoS ONE 2015, 10, e0116820. [Google Scholar] [CrossRef]
- Institute for Health Metrics and Evaluation (IHME). GBD Compare Data Visualization; IHME, University of Washington: Seattle, WA, USA, 2019; Available online: http://vizhub.healthdata.org/gbd-compare (accessed on 20 February 2021).
- Jha, S. The Mental Healthcare Act, 2017: A Ray of Hope. 2020. Available online: https://papers.ssrn.com/sol3/papers.cfm?abstract_id=3564919 (accessed on 20 February 2021).
- Wittchen, H.U.; Jacobi, F.; Rehm, J.; Gustavsson, A.; Svensson, M.; Jönsson, B.; Olesen, J.; Allgulander, C.; Alonso, J.; Faravelli, C.; et al. The size and burden of mental disorders and other disorders of the brain in Europe 2010. Eur. Neuropsychopharmacol. 2011, 21, 655–679. [Google Scholar] [CrossRef]
- Reddy, V. Mental health issues and challenges in India: A review. J. Soc. Sci. Manag. Entrep. (IJSSME) 2019, 3, 1–3. [Google Scholar]
- Ogunsemi, O.O.; Oluwole, F.A.; Abasiubong, F.; Erinfolami, A.R.; Amoran, O.E.; Ariba, A.J.; Alebiosu, C.O.; Olatawura, M.O. Detection of mental disorders with the Patient Health Questionnaire in primary care settings in Nigeria. Ment. Illn. 2010, 2, e10. [Google Scholar] [CrossRef] [PubMed]
- White, P.D.; Rickards, H.; Zeman, A.Z.J. Time to end the distinction between mental and neurological illnesses. BMJ 2012, 344, e3454. [Google Scholar] [CrossRef]
- Feigin, V.L.; Abajobir, A.A.; Abate, K.H.; Abd-Allah, F.; Abdulle, A.M.; Abera, S.F.; Abyu, G.Y.; Ahmed, M.B.; Aichour, A.N.; Aichour, I.; et al. Global, regional, and national burden of neurological disorders during 1990–2015: A systematic analysis for the Global Burden of Disease Study 2015. Lancet Neurol. 2017, 16, 877–897. [Google Scholar] [CrossRef]
- Ho, A.J.; Hua, X.; Lee, S.; Leow, A.D.; Yanovsky, I.; Gutman, B.; Dinov, I.D.; Leporé, N.; Stein, J.L.; Toga, A.W.; et al. Comparing 3 T and 1.5 T MRI for tracking Alzheimer’s disease progression with tensor-based morphometry. Hum. Brain Mapp. 2010, 31, 499–514. [Google Scholar] [CrossRef]
- Aggarwal, N.T.; Tripathi, M.; Dodge, H.H.; Alladi, S.; Anstey, K.J. Trends in Alzheimer’s disease and dementia in the asian-pacific region. Int. J. Alzheimers. Dis. 2012, 2012, 171327. [Google Scholar] [CrossRef] [PubMed]
- DeTure, M.A.; Dickson, D.W. The neuropathological diagnosis of Alzheimer’s disease. Mol. Neurodegener. 2019, 14, 32. [Google Scholar] [CrossRef]
- Saxena, S.; Setoya, Y. World health organization’s comprehensive mental health action plan 2013–2020. Psychiatry Clin. NeuroSci. 2014, 68, 585–586. [Google Scholar] [CrossRef]
- WHO Organization. Others Public Health Action for the Prevention of Suicide: A Framework; WHO: Geneva, Switzerland, 2012. [Google Scholar]
- Bilsen, J. Suicide and Youth: Risk Factors. Front. Psychiatry 2018, 9, 540. [Google Scholar] [CrossRef]
- Turecki, G.; Brent, D.A. Suicide and suicidal behaviour. Lancet 2016, 387, 1227–1239. [Google Scholar] [CrossRef]
- Naghavi, M. Global Burden of Disease Self-Harm Collaborators Global, regional, and national burden of suicide mortality 1990 to 2016: Systematic analysis for the Global Burden of Disease Study 2016. BMJ 2019, 364, l94. [Google Scholar] [CrossRef]
- Jamison, D.T.; Breman, J.G.; Measham, A.R.; Alleyne, G.; Claeson, M.; Evans, D.B.; Jha, P.; Mills, A.; Musgrove, P. Disease Control Priorities in Developing Countries; The World Bank: Washington, DC, USA, 2006. [Google Scholar]
- WHO. Mental and Neurological Disorders; WHO: Geneva, Switzerland, 2005. [Google Scholar]
- Kohn, R.; Saxena, S.; Levav, I.; Saraceno, B. The treatment gap in mental health care. Bull. World Health Organ. 2004, 82, 858–866. [Google Scholar]
- Iemmi, V.; Bantjes, J.; Coast, E.; Channer, K.; Leone, T.; McDaid, D.; Palfreyman, A.; Stephens, B.; Lund, C. Suicide and poverty in low-income and middle-income countries: A systematic review. Lancet Psychiatry 2016, 3, 774–783. [Google Scholar] [CrossRef]
- Franco-Martín, M.A.; Muñoz-Sánchez, J.L.; Sainz-de-Abajo, B.; Castillo-Sánchez, G.; Hamrioui, S.; de la Torre-Díez, I. A systematic literature review of technologies for suicidal behavior prevention. J. Med. Syst. 2018, 42, 71. [Google Scholar] [CrossRef]
- Castillo-Sánchez, G.; Marques, G.; Dorronzoro, E.; Rivera-Romero, O.; Franco-Martín, M.; De la Torre-Díez, I. Suicide risk assessment using machine learning and social networks: A scoping review. J. Med. Syst. 2020, 44, 205. [Google Scholar] [CrossRef]
- Winkler, A.S. The growing burden of neurological disorders in low-income and middle-income countries: Priorities for policy making. Lancet Neurol. 2020, 19, 200–202. [Google Scholar] [CrossRef]
- Druss, B.G.; Hwang, I.; Petukhova, M.; Sampson, N.A.; Wang, P.S.; Kessler, R.C. Impairment in role functioning in mental and chronic medical disorders in the United States: Results from the National Comorbidity Survey Replication. Mol. Psychiatry 2009, 14, 728–737. [Google Scholar] [CrossRef]
- Saarni, S.I.; Suvisaari, J.; Sintonen, H.; Pirkola, S.; Koskinen, S.; Aromaa, A.; Lönnqvist, J. Impact of psychiatric disorders on health-related quality of life: General population survey. Br. J. Psychiatry 2007, 190, 326–332. [Google Scholar] [CrossRef] [PubMed]
- Moncrieff, J.; Pomerleau, J. Trends in sickness benefits in Great Britain and the contribution of mental disorders. J. Public Health Med. 2000, 22, 59–67. [Google Scholar] [CrossRef]
- Mykletun, A.; Overland, S.; Dahl, A.A.; Krokstad, S.; Bjerkeset, O.; Glozier, N.; Aarø, L.E.; Prince, M. A population-based cohort study of the effect of common mental disorders on disability pension awards. Am. J. Psychiatry 2006, 163, 1412–1418. [Google Scholar] [CrossRef] [PubMed]
- El-Rufaie, O.E. Primary care psychiatry: Pertinent Arabian perspectives. East. Mediterr. Health J. 2005, 11, 449–458. [Google Scholar] [PubMed]
- Russ, T.C.; Stamatakis, E.; Hamer, M.; Starr, J.M.; Kivimäki, M.; Batty, G.D. Association between psychological distress and mortality: Individual participant pooled analysis of 10 prospective cohort studies. BMJ 2012, 345, e4933. [Google Scholar] [CrossRef] [PubMed]
- Bridge, J.A.; Goldstein, T.R.; Brent, D.A. Adolescent suicide and suicidal behavior. J. Child Psychol. Psychiatry 2006, 47, 372–394. [Google Scholar] [CrossRef]
- Gould, M.S. Suicide and the media. Ann. N. Y. Acad. Sci. 2001, 932, 200–224. [Google Scholar] [CrossRef]
- Palmer, B.A.; Pankratz, V.S.; Bostwick, J.M. The lifetime risk of suicide in schizophrenia: A reexamination. Arch. Gen. Psychiatry 2005, 62, 247–253. [Google Scholar] [CrossRef] [PubMed]
- De Cola, M.C.; Triglia, G.; Camera, M.; Corallo, F.; Di Cara, M.; Bramanti, P.; Lo Buono, V. Effect of neurological screening on early dementia detection in southern Italy. J. Int. Med. Res. 2020, 48. [Google Scholar] [CrossRef]
- Brammer, M. The role of neuroimaging in diagnosis and personalized medicine—Current position and likely future directions. Dialogues Clin. Neurosci. 2009, 11, 389–396. [Google Scholar] [PubMed]
- Faraz, S.; Azhar Ali, S.S.; Hasan Adil, S. Machine learning and stress assessment: A review. In Proceedings of the 2018 3rd International Conference on Emerging Trends in Engineering, Sciences and Technology (ICEEST), Karachi, Pakistan, 21–22 December 2018. [Google Scholar]
- Just, M.A.; Pan, L.; Cherkassky, V.L.; McMakin, D.L.; Cha, C.; Nock, M.K.; Brent, D. Machine learning of neural representations of suicide and emotion concepts identifies suicidal youth. Nat. Hum. Behav. 2017, 1, 911–919. [Google Scholar] [CrossRef]
- Agne, N.A.; Tisott, C.G.; Ballester, P.; Passos, I.C.; Ferrão, Y.A. Predictors of suicide attempt in patients with obsessive-compulsive disorder: An exploratory study with machine learning analysis. Psychol. Med. 2020, 1–11. [Google Scholar] [CrossRef]
- Naghavi, A.; Teismann, T.; Asgari, Z.; Mohebbian, M.R.; Mansourian, M.; Mañanas, M.Á. Accurate Diagnosis of Suicide Ideation/Behavior Using Robust Ensemble Machine Learning: A University Student Population in the Middle East and North Africa (MENA) Region. Diagnostics 2020, 10, 956. [Google Scholar] [CrossRef]
- Siuly, S.; Zhang, Y. Medical Big Data: Neurological Diseases Diagnosis Through Medical Data Analysis. Data Sci. Eng. 2016, 1, 54–64. [Google Scholar] [CrossRef]
- Arimura, H.; Magome, T.; Yamashita, Y.; Yamamoto, D. Computer-Aided Diagnosis Systems for Brain Diseases in Magnetic Resonance Images. Algorithms 2009, 2, 925–952. [Google Scholar] [CrossRef]
- Structured Clinical Interview for the DSM (SCID). In The Encyclopedia of Clinical Psychology; Cautin, R.L., Lilienfeld, S.O., Eds.; John Wiley & Sons, Inc.: Hoboken, NJ, USA, 2014; Volume 26, pp. 1–6. ISBN 9781118625392. [Google Scholar]
- Li, F.; He, H. Assessing the Accuracy of Diagnostic Tests. Shanghai Arch. Psychiatry 2018, 30, 207–212. [Google Scholar] [CrossRef]
- Malhi, G.S. The right services, at the right time, for the right people. Lancet Psychiatry 2019, 6, 800–802. [Google Scholar] [CrossRef]
- Kelly, T. Prospective: Is bipolar disorder being overdiagnosed? Int. J. Methods Psychiatr. Res. 2018, 27, e1725. [Google Scholar] [CrossRef]
- Lawrie, S.M.; Olabi, B.; Hall, J.; McIntosh, A.M. Do we have any solid evidence of clinical utility about the pathophysiology of schizophrenia? World Psychiatry 2011, 10, 19–31. [Google Scholar] [CrossRef]
- Kapur, S. Looking for a “biological test” to diagnose “schizophrenia”: Are we chasing red herrings? World Psychiatry 2011, 10, 32. [Google Scholar] [CrossRef]
- Lantero Rodriguez, J.; Karikari, T.K.; Suárez-Calvet, M.; Troakes, C.; King, A.; Emersic, A.; Aarsland, D.; Hye, A.; Zetterberg, H.; Blennow, K.; et al. Plasma p-tau181 accurately predicts Alzheimer’s disease pathology at least 8 years prior to post-mortem and improves the clinical characterisation of cognitive decline. Acta Neuropathologica 2020, 140, 267–278. [Google Scholar] [CrossRef]
- Miller, J.B.; Kauwe, J.S.K. Predicting Clinical Dementia Rating Using Blood RNA Levels. Genes 2020, 11, 706. [Google Scholar] [CrossRef]
- Douglas, V.C.; Neuhaus, J.; Johnson, J.K.; Racine, C.A.; Miller, B.L.; Josephson, S.A. Dementia=(MC)2: A 4-item screening test for mild cognitive impairment and dementia. Alzheimer Dis. Assoc. Disord. 2011, 25, 220–224. [Google Scholar] [CrossRef]
- Nguyen, V.T.; Quach, T.H.T.; Pham, A.G.; Tran, T.C. Feasibility, Reliability, and Validity of the Vietnamese Version of the Clinical Dementia Rating. Dement. Geriatr. Cogn. Disord. 2019, 48, 308–316. [Google Scholar] [CrossRef] [PubMed]
- Batterham, P.J.; Ftanou, M.; Pirkis, J.; Brewer, J.L.; Mackinnon, A.J.; Beautrais, A.; Fairweather-Schmidt, A.K.; Christensen, H. A systematic review and evaluation of measures for suicidal ideation and behaviors in population-based research. Psychol. Assess. 2015, 27, 501–512. [Google Scholar] [CrossRef]
- Osman, A.; Bagge, C.L.; Gutierrez, P.M.; Konick, L.C.; Kopper, B.A.; Barrios, F.X. The Suicidal Behaviors Questionnaire-Revised (SBQ-R): Validation with clinical and nonclinical samples. Assessment 2001, 8, 443–454. [Google Scholar] [CrossRef] [PubMed]
- Kobak, K.; Townsend, L.; Birmaher, B.; Milham, M.; Kaufman, J. Computer-Assisted Psychiatric Diagnosis. J. Am. Acad. Child Adolesc. Psychiatry 2020, 59, 213–215. [Google Scholar] [CrossRef]
- Fakhoury, M. Artificial Intelligence in Psychiatry. Adv. Exp. Med. Biol. 2019, 1192, 119–125. [Google Scholar] [CrossRef] [PubMed]
- Gülpınar, Ö.; Güçlü, A.G. How to write a review article? Turk. J. Urol. 2013, 39, 44–48. [Google Scholar] [CrossRef] [PubMed]
- Moher, D.; Liberati, A.; Tetzlaff, J.; Altman, D.G. PRISMA Group Preferred reporting items for systematic reviews and meta-analyses: The PRISMA statement. PLoS Med. 2009, 6, e1000097. [Google Scholar] [CrossRef]
- 10 Guidelines for Review Papers. Available online: https://journals.sagepub.com/page/mcr/suppl/review-paper-tips (accessed on 7 February 2021).
- Lee, S.-Y.; Lu, R.-B.; Wang, L.-J.; Chang, C.-H.; Lu, T.; Wang, T.-Y.; Tsai, K.-W. Serum miRNA as a possible biomarker in the diagnosis of bipolar II disorder. Sci. Rep. 2020, 10, 1131. [Google Scholar] [CrossRef]
- Alici, S.; Onur, Ö.Ş.; Çavuôlu, E.; Onur, I.U.; Erkiran, M. Optical coherence tomography findings in bipolar disorder: a preliminary receiver operating characteristic analysis on ganglion cell layer volume for diagnosis. Archives Clin. Psychiatry 2019, 46, 125–131. [Google Scholar]
- Zhao, G.; Zhang, C.; Chen, J.; Su, Y.; Zhou, R.; Wang, F.; Xia, W.; Huang, J.; Wang, Z.; Hu, Y.; et al. Ratio of mBDNF to proBDNF for Differential Diagnosis of Major Depressive Disorder and Bipolar Depression. Mol. Neurobiol. 2016, 54, 5573–5582. [Google Scholar] [CrossRef] [PubMed]
- Haenisch, F.; Cooper, J.D.; Reif, A.; Kittel-Schneider, S.; Steiner, J.; Leweke, F.M.; Rothermundt, M.; van Beveren, N.J.M.; Crespo-Facorro, B.; Niebuhr, D.W.; et al. Towards a blood-based diagnostic panel for bipolar disorder. Brain Behav. Immun. 2016, 52, 49–57. [Google Scholar] [CrossRef]
- Fernandes, B.S.; Karmakar, C.; Tamouza, R.; Tran, T.; Yearwood, J.; Hamdani, N.; Laouamri, H.; Richard, J.-R.; Yolken, R.; Berk, M.; et al. Precision psychiatry with immunological and cognitive biomarkers: a multi-domain prediction for the diagnosis of bipolar disorder or schizophrenia using machine learning. Transl. Psychiatry 2020, 10, 162. [Google Scholar] [CrossRef] [PubMed]
- Tsujii, N.; Otsuka, I.; Okazaki, S.; Yanagi, M.; Numata, S.; Yamaki, N.; Kawakubo, Y.; Shirakawa, O.; Hishimoto, A. Mitochondrial DNA Copy Number Raises the Potential of Left Frontopolar Hemodynamic Response as a Diagnostic Marker for Distinguishing Bipolar Disorder From Major Depressive Disorder. Front. Psychiatry 2019, 10, 312. [Google Scholar] [CrossRef] [PubMed]
- Faurholt-Jepsen, M.; Busk, J.; Þórarinsdóttir, H.; Frost, M.; Bardram, J.E.; Vinberg, M.; Kessing, L.V. Objective smartphone data as a potential diagnostic marker of bipolar disorder. Aust. N. Z. J. Psychiatry 2019, 53, 119–128. [Google Scholar] [CrossRef]
- Tasic, L.; Larcerda, A.L.T.; Pontes, J.G.M.; da Costa, T.B.B.C.; Nani, J.V.; Martins, L.G.; Santos, L.A.; Nunes, M.F.Q.; Adelino, M.P.M.; Pedrini, M.; et al. Peripheral biomarkers allow differential diagnosis between schizophrenia and bipolar disorder. J. Psychiatr. Res. 2019, 119, 67–75. [Google Scholar] [CrossRef] [PubMed]
- Munkholm, K.; Vinberg, M.; Pedersen, B.K.; Poulsen, H.E.; Ekstrøm, C.T.; Kessing, L.V. A multisystem composite biomarker as a preliminary diagnostic test in bipolar disorder. Acta Psychiatr. Scand. 2019, 139, 227–236. [Google Scholar] [CrossRef]
- Alimardani, F.; Cho, J.-H.; Boostani, R.; Hwang, H.-J. Classification of bipolar disorder and schizophrenia using steady-state visual evoked potential based features. IEEE Access 2018, 6, 40379–40388. [Google Scholar] [CrossRef]
- Wang, Y.; Sun, K.; Liu, Z.; Chen, G.; Jia, Y.; Zhong, S.; Pan, J.; Huang, L.; Tian, J. Classification of Unmedicated Bipolar Disorder Using Whole-Brain Functional Activity and Connectivity: A Radiomics Analysis. Cereb. Cortex 2020, 30, 1117–1128. [Google Scholar] [CrossRef] [PubMed]
- Ogruc Ildiz, G.; Bayari, S.; Aksoy, U.M.; Yorguner, N.; Bulut, H.; Yilmaz, S.S.; Halimoglu, G.; Kabuk, H.N.; Yavuz, G.; Fausto, R. Auxiliary differential diagnosis of schizophrenia and phases of bipolar disorder based on the blood serum Raman spectra. J. Raman Spectrosc. 2020, 51, 2233–2244. [Google Scholar] [CrossRef]
- Achalia, R.; Sinha, A.; Jacob, A.; Achalia, G.; Kaginalkar, V.; Venkatasubramanian, G.; Rao, N.P. A proof of concept machine learning analysis using multimodal neuroimaging and neurocognitive measures as predictive biomarker in bipolar disorder. Asian J. Psychiatr. 2020, 50, 101984. [Google Scholar] [CrossRef] [PubMed]
- Wu, M.-J.; Passos, I.C.; Bauer, I.E.; Lavagnino, L.; Cao, B.; Zunta-Soares, G.B.; Kapczinski, F.; Mwangi, B.; Soares, J.C. Individualized identification of euthymic bipolar disorder using the Cambridge Neuropsychological Test Automated Battery (CANTAB) and machine learning. J. Affect. Disord. 2016, 192, 219–225. [Google Scholar] [CrossRef]
- Sutcubasi, B.; Metin, S.Z.; Erguzel, T.T.; Metin, B.; Tas, C.; Arikan, M.K.; Tarhan, N. Anatomical connectivity changes in bipolar disorder and schizophrenia investigated using whole-brain tract-based spatial statistics and machine learning approaches. Neural Comput. Appl. 2019, 31, 4983–4992. [Google Scholar] [CrossRef]
- Zeng, L.-L.; Wang, H.; Hu, P.; Yang, B.; Pu, W.; Shen, H.; Chen, X.; Liu, Z.; Yin, H.; Tan, Q.; et al. Multi-Site Diagnostic Classification of Schizophrenia Using Discriminant Deep Learning with Functional Connectivity MRI. EBioMedicine 2018, 30, 74–85. [Google Scholar] [CrossRef] [PubMed]
- Oh, J.; Oh, B.-L.; Lee, K.-U.; Chae, J.-H.; Yun, K. Identifying Schizophrenia Using Structural MRI With a Deep Learning Algorithm. Front. Psychiatry 2020, 11, 16. [Google Scholar] [CrossRef]
- Aslan, Z.; Akin, M. Automatic Detection of Schizophrenia by Applying Deep Learning over Spectrogram Images of EEG Signals. Traitement du Signal 2020, 37, 235–244. [Google Scholar] [CrossRef]
- Shalbaf, A.; Bagherzadeh, S.; Maghsoudi, A. Transfer learning with deep convolutional neural network for automated detection of schizophrenia from EEG signals. Australas. Phys. Eng. Sci. Med. 2020. [Google Scholar] [CrossRef]
- Naira, C.A.T.; Jos´e, C. Classification of People who Suffer Schizophrenia and Healthy People by EEG Signals using Deep Learning. Int. J. Adv. Comput. Sci. Appl. 2019, 10. [Google Scholar] [CrossRef]
- Rozycki, M.; Satterthwaite, T.D.; Koutsouleris, N.; Erus, G.; Doshi, J.; Wolf, D.H.; Fan, Y.; Gur, R.E.; Gur, R.C.; Meisenzahl, E.M.; et al. Multisite Machine Learning Analysis Provides a Robust Structural Imaging Signature of Schizophrenia Detectable Across Diverse Patient Populations and Within Individuals. Schizophr. Bull. 2018, 44, 1035–1044. [Google Scholar] [CrossRef]
- Shim, M.; Hwang, H.-J.; Kim, D.-W.; Lee, S.-H.; Im, C.-H. Machine-learning-based diagnosis of schizophrenia using combined sensor-level and source-level EEG features. Schizophr. Res. 2016, 176, 314–319. [Google Scholar] [CrossRef]
- Winterburn, J.L.; Voineskos, A.N.; Devenyi, G.A.; Plitman, E.; de la Fuente-Sandoval, C.; Bhagwat, N.; Graff-Guerrero, A.; Knight, J.; Chakravarty, M.M. Can we accurately classify schizophrenia patients from healthy controls using magnetic resonance imaging and machine learning? A multi-method and multi-dataset study. Schizophr. Res. 2019, 214, 3–10. [Google Scholar] [CrossRef]
- Lin, E.; Lin, C.-H.; Lai, Y.-L.; Huang, C.-H.; Huang, Y.-J.; Lane, H.-Y. Combination of G72 Genetic Variation and G72 Protein Level to Detect Schizophrenia: Machine Learning Approaches. Front. Psychiatry 2018, 9, 566. [Google Scholar] [CrossRef]
- Cai, X.-L.; Xie, D.-J.; Madsen, K.H.; Wang, Y.-M.; Bögemann, S.A.; Cheung, E.F.C.; Møller, A.; Chan, R.C.K. Generalizability of machine learning for classification of schizophrenia based on resting-state functional MRI data. Hum. Brain Mapp. 2020, 41, 172–184. [Google Scholar] [CrossRef]
- Qureshi, M.N.I.; Oh, J.; Cho, D.; Jo, H.J.; Lee, B. Multimodal Discrimination of Schizophrenia Using Hybrid Weighted Feature Concatenation of Brain Functional Connectivity and Anatomical Features with an Extreme Learning Machine. Front. Neuroinform. 2017, 11, 59. [Google Scholar] [CrossRef]
- Juneja, A.; Rana, B.; Agrawal, R.K. A novel fuzzy rough selection of non-linearly extracted features for schizophrenia diagnosis using fMRI. Comput. Methods Programs Biomed. 2018, 155, 139–152. [Google Scholar] [CrossRef]
- de Boer, J.N.; van Hoogdalem, M.; Mandl, R.C.W.; Brummelman, J.; Voppel, A.E.; Begemann, M.J.H.; van Dellen, E.; Wijnen, F.N.K.; Sommer, I.E.C. Language in schizophrenia: relation with diagnosis, symptomatology and white matter tracts. NPJ Schizophr 2020, 6, 10. [Google Scholar] [CrossRef]
- Oh, S.L.; Vicnesh, J.; Ciaccio, E.; Rajamanickam, Y.; Acharya, U.R. Deep Convolutional Neural Network Model for Automated Diagnosis of Schizophrenia Using EEG Signals. NATO Adv. Sci. Inst. Ser. E Appl. Sci. 2019, 9, 2870. [Google Scholar] [CrossRef]
- Santos-Mayo, L.; San-Jose-Revuelta, L.M.; Arribas, J.I. A Computer-Aided Diagnosis System With EEG Based on the P3b Wave During an Auditory Odd-Ball Task in Schizophrenia. IEEE Trans. Biomed. Eng. 2017, 64, 395–407. [Google Scholar] [CrossRef] [PubMed]
- Chatterjee, I.; Agarwal, M.; Rana, B.; Lakhyani, N.; Kumar, N. Bi-objective approach for computer-aided diagnosis of schizophrenia patients using fMRI data. Multimed. Tools Appl. 2018, 77, 26991–27015. [Google Scholar] [CrossRef]
- Ding, Y.; Chen, X.; Fu, Q.; Zhong, S. A depression recognition method for college students using deep integrated support vector algorithm. IEEE Access 2020, 8, 75616–75629. [Google Scholar] [CrossRef]
- Li, X.; La, R.; Wang, Y.; Niu, J.; Zeng, S.; Sun, S.; Zhu, J. EEG-based mild depression recognition using convolutional neural network. Med. Biol. Eng. Comput. 2019, 57, 1341–1352. [Google Scholar] [CrossRef] [PubMed]
- Byeon, H. Chi-Square Automatic Interaction Detection Modeling for Predicting Depression in Multicultural Female Students. Int. J. Adv. Comput. Sci. Appl. 2017, 8. [Google Scholar] [CrossRef]
- Kautzky, A.; James, G.M.; Philippe, C.; Baldinger-Melich, P.; Kraus, C.; Kranz, G.S.; Vanicek, T.; Gryglewski, G.; Wadsak, W.; Mitterhauser, M.; et al. The influence of the rs6295 gene polymorphism on serotonin-1A receptor distribution investigated with PET in patients with major depression applying machine learning. Transl. Psychiatry 2017, 7, e1150. [Google Scholar] [CrossRef]
- Lin, W.; Tong, T.; Gao, Q.; Guo, D.; Du, X.; Yang, Y.; Guo, G.; Xiao, M.; Du, M.; Qu, X.; et al. Convolutional Neural Networks-Based MRI Image Analysis for the Alzheimer’s Disease Prediction From Mild Cognitive Impairment. Front. Neurosci. 2018, 12, 777. [Google Scholar] [CrossRef]
- Ding, X.; Bucholc, M.; Wang, H.; Glass, D.H.; Wang, H.; Clarke, D.H.; Bjourson, A.J.; Dowey, L.R.C.; O’Kane, M.; Prasad, G.; et al. A hybrid computational approach for efficient Alzheimer’s disease classification based on heterogeneous data. Sci. Rep. 2018, 8, 9774. [Google Scholar] [CrossRef]
- Lu, D.; Popuri, K.; Ding, G.W.; Balachandar, R.; Beg, M.F. Alzheimer’s Disease Neuroimaging Initiative Multiscale deep neural network based analysis of FDG-PET images for the early diagnosis of Alzheimer’s disease. Med. Image Anal. 2018, 46, 26–34. [Google Scholar] [CrossRef]
- Fiscon, G.; Weitschek, E.; Cialini, A.; Felici, G.; Bertolazzi, P.; De Salvo, S.; Bramanti, A.; Bramanti, P.; De Cola, M.C. Combining EEG signal processing with supervised methods for Alzheimer’s patients classification. BMC Med. Inform. Decis. Mak. 2018, 18, 35. [Google Scholar] [CrossRef]
- Aidos, H.; Fred, A. For the Alzheimer’s Disease Neuroimaging Initiative Discrimination of Alzheimer’s Disease using longitudinal information. Data Min. Knowl. Discov. 2017, 31, 1006–1030. [Google Scholar] [CrossRef]
- Bin-Hezam, R. Tomas A Machine Learning Approach towards Detecting Dementia based on its Modifiable Risk Factors. Int. J. Adv. Comput. Sci. Appl. 2019, 10. [Google Scholar] [CrossRef]
- Zhou, S.-M.; Tsang, G.; Xie, X.; Huo, L.; Brophy, S.; Lyons, R.A. Mining electronic health records to identify influential predictors associated with hospital admission of patients with dementia: an artificial intelligence approach. Lancet 2018, 392, S9. [Google Scholar] [CrossRef]
- Choi, H.-S.; Choe, J.Y.; Kim, H.; Han, J.W.; Chi, Y.K.; Kim, K.; Hong, J.; Kim, T.; Kim, T.H.; Yoon, S.; et al. Deep learning based low-cost high-accuracy diagnostic framework for dementia using comprehensive neuropsychological assessment profiles. BMC Geriatr. 2018, 18, 234. [Google Scholar] [CrossRef] [PubMed]
- Moreira, L.B.; Namen, A.A. A hybrid data mining model for diagnosis of patients with clinical suspicion of dementia. Comput. Methods Programs Biomed. 2018, 165, 139–149. [Google Scholar] [CrossRef]
- Bang, S.; Son, S.; Roh, H.; Lee, J.; Bae, S.; Lee, K.; Hong, C.; Shin, H. Quad-phased data mining modeling for dementia diagnosis. BMC Med. Inform. Decis. Mak. 2017, 17, 60. [Google Scholar] [CrossRef]
- Walsh, C.G.; Ribeiro, J.D.; Franklin, J.C. Predicting Risk of Suicide Attempts Over Time Through Machine Learning. Clin. Psychol. Sci. 2017, 5, 457–469. [Google Scholar] [CrossRef]
- Walsh, C.G.; Ribeiro, J.D.; Franklin, J.C. Predicting suicide attempts in adolescents with longitudinal clinical data and machine learning. J. Child Psychol. Psychiatry 2018, 59, 1261–1270. [Google Scholar] [CrossRef] [PubMed]
- Cheng, Q.; Li, T.M.; Kwok, C.-L.; Zhu, T.; Yip, P.S. Assessing Suicide Risk and Emotional Distress in Chinese Social Media: A Text Mining and Machine Learning Study. J. Med. Internet Res. 2017, 19, e243. [Google Scholar] [CrossRef]
- Oh, J.; Yun, K.; Hwang, J.-H.; Chae, J.-H. Classification of Suicide Attempts through a Machine Learning Algorithm Based on Multiple Systemic Psychiatric Scales. Front. Psychiatry 2017, 8, 192. [Google Scholar] [CrossRef]
- Hettige, N.C.; Nguyen, T.B.; Yuan, C.; Rajakulendran, T.; Baddour, J.; Bhagwat, N.; Bani-Fatemi, A.; Voineskos, A.N.; Mallar Chakravarty, M.; De Luca, V. Classification of suicide attempters in schizophrenia using sociocultural and clinical features: A machine learning approach. Gen. Hosp. Psychiatry 2017, 47, 20–28. [Google Scholar] [CrossRef] [PubMed]
- Ryu, S.; Lee, H.; Lee, D.-K.; Park, K. Use of a Machine Learning Algorithm to Predict Individuals with Suicide Ideation in the General Population. Psychiatry Investig. 2018, 15, 1030–1036. [Google Scholar] [CrossRef] [PubMed]
- Jung, J.S.; Park, S.J.; Kim, E.Y.; Na, K.-S.; Kim, Y.J.; Kim, K.G. Prediction models for high risk of suicide in Korean adolescents using machine learning techniques. PLoS ONE 2019, 14, e0217639. [Google Scholar] [CrossRef]
- Lin, G.-M.; Nagamine, M.; Yang, S.-N.; Tai, Y.-M.; Lin, C.; Sato, H. Machine learning based suicide ideation prediction for military personnel. IEEE J. Biomed. Health Inform. 2020, 24, 1907–1916. [Google Scholar] [CrossRef] [PubMed]
- Su, C.; Aseltine, R.; Doshi, R.; Chen, K.; Rogers, S.C.; Wang, F. Machine learning for suicide risk prediction in children and adolescents with electronic health records. Transl. Psychiatry 2020, 10, 413. [Google Scholar] [CrossRef] [PubMed]
- Choi, S.B.; Lee, W.; Yoon, J.-H.; Won, J.-U.; Kim, D.W. Ten-year prediction of suicide death using Cox regression and machine learning in a nationwide retrospective cohort study in South Korea. J. Affect. Disord. 2018, 231, 8–14. [Google Scholar] [CrossRef]
- Chen, Q.; Zhang-James, Y.; Barnett, E.J.; Lichtenstein, P.; Jokinen, J.; D’Onofrio, B.M.; Faraone, S.V.; Larsson, H.; Fazel, S. Predicting suicide attempt or suicide death following a visit to psychiatric specialty care: A machine learning study using Swedish national registry data. PLoS Med. 2020, 17, e1003416. [Google Scholar] [CrossRef]
- Edgcomb, J.B.; Thiruvalluru, R.; Pathak, J.; Brooks, J.O., 3rd. Machine Learning to Differentiate Risk of Suicide Attempt and Self-harm After General Medical Hospitalization of Women With Mental Illness. Med. Care 2021, 59, S58–S64. [Google Scholar] [CrossRef]
- Haroz, E.E.; Walsh, C.G.; Goklish, N.; Cwik, M.F.; O’Keefe, V.; Barlow, A. Reaching Those at Highest Risk for Suicide: Development of a Model Using Machine Learning Methods for use With Native American Communities. Suicide Life Threat. Behav. 2020, 50, 422–436. [Google Scholar] [CrossRef]
- Ryu, S.; Lee, H.; Lee, D.-K.; Kim, S.-W.; Kim, C.-E. Detection of Suicide Attempters among Suicide Ideators Using Machine Learning. Psychiatry Investig. 2019, 16, 588–593. [Google Scholar] [CrossRef]
- Miché, M.; Studerus, E.; Meyer, A.H.; Gloster, A.T.; Beesdo-Baum, K.; Wittchen, H.-U.; Lieb, R. Prospective prediction of suicide attempts in community adolescents and young adults, using regression methods and machine learning. J. Affect. Disord. 2020, 265, 570–578. [Google Scholar] [CrossRef] [PubMed]
- Shen, Y.; Zhang, W.; Chan, B.S.M.; Zhang, Y.; Meng, F.; Kennon, E.A.; Wu, H.E.; Luo, X.; Zhang, X. Detecting risk of suicide attempts among Chinese medical college students using a machine learning algorithm. J. Affect. Disord. 2020, 273, 18–23. [Google Scholar] [CrossRef]
- Parghi, N.; Chennapragada, L.; Barzilay, S.; Newkirk, S.; Ahmedani, B.; Lok, B.; Galynker, I. Assessing the predictive ability of the Suicide Crisis Inventory for near-term suicidal behavior using machine learning approaches. Int. J. Methods Psychiatr. Res. 2020, e1863. [Google Scholar] [CrossRef]
- Cohen, J.; Wright-Berryman, J.; Rohlfs, L.; Wright, D.; Campbell, M.; Gingrich, D.; Santel, D.; Pestian, J. A Feasibility Study Using a Machine Learning Suicide Risk Prediction Model Based on Open-Ended Interview Language in Adolescent Therapy Sessions. Int. J. Environ. Res. Public Health 2020, 17, 8187. [Google Scholar] [CrossRef] [PubMed]
- Zheng, L.; Wang, O.; Hao, S.; Ye, C.; Liu, M.; Xia, M.; Sabo, A.N.; Markovic, L.; Stearns, F.; Kanov, L.; et al. Development of an early-warning system for high-risk patients for suicide attempt using deep learning and electronic health records. Transl. Psychiatry 2020, 10, 72. [Google Scholar] [CrossRef]
- Tadesse, M.M.; Lin, H.; Xu, B.; Yang, L. Detection of Suicide Ideation in Social Media Forums Using Deep Learning. Algorithms 2019, 13, 7. [Google Scholar] [CrossRef]
- Devijver, P.A.; Kittler, J. Pattern Recognition: A Statistical Approach; Prentice Hall: Upper Saddle River, NJ, USA, 1982. [Google Scholar]
- Webb, A.R. Statistical Pattern Recognition; John Wiley & Sons: Hoboken, NJ, USA, 2003; ISBN 9780470854785. [Google Scholar]
- Mosteller, F. A k-Sample Slippage Test for an Extreme Population. In Selected Papers of Frederick Mosteller; Fienberg, S.E., Hoaglin, D.C., Eds.; Springer New York: New York, NY, USA, 2006; ISBN 9780387449562. [Google Scholar]
- Theodoridis, S.; Koutroumbas, K. Others Pattern recognition. IEEE Trans. Neural Netw. 2008, 19, 376. [Google Scholar]
- Moons, K.G.M.; Altman, D.G.; Reitsma, J.B.; Ioannidis, J.P.A.; Macaskill, P.; Steyerberg, E.W.; Vickers, A.J.; Ransohoff, D.F.; Collins, G.S. Transparent Reporting of a multivariable prediction model for Individual Prognosis or Diagnosis (TRIPOD): explanation and elaboration. Ann. Intern. Med. 2015, 162, W1-73. [Google Scholar] [CrossRef]
- Li, X.; Li, Y.; Li, X. Predicting Clinical Outcomes of Alzheimer’s Disease from Complex Brain Networks. In International Conference on Advanced Data Mining and Applications; Springer: Cham, Switzerland, 2017; pp. 519–525. [Google Scholar]
- Sayed, G.I.; Hassanien, A.E.; Nassef, T.M.; Pan, J.-S. Alzheimer’s Disease Diagnosis Based on Moth Flame Optimization. In Proceedings of the Genetic and Evolutionary Computing; Springer International Publishing: Cham, Switzerland, 2017; pp. 298–305. [Google Scholar]
- Saeb, S.; Lonini, L.; Jayaraman, A.; Mohr, D.C.; Kording, K.P. The need to approximate the use-case in clinical machine learning. Gigascience 2017, 6, 1–9. [Google Scholar] [CrossRef]
- Little, M.A.; Varoquaux, G.; Saeb, S.; Lonini, L.; Jayaraman, A.; Mohr, D.C.; Kording, K.P. Using and understanding cross-validation strategies. Perspectives on Saeb et al. Gigascience 2017, 6. [Google Scholar] [CrossRef]
- Mansourian, M.; Marateb, H.R.; Mansourian, M.; Mohebbian, M.R.; Binder, H.; Mañanas, M.Á. Rigorous performance assessment of computer-aided medical diagnosis and prognosis systems: a biostatistical perspective on data mining. In Modelling and Analysis of Active Biopotential Signals in Healthcare, Volume 2; IOP Publishing: Bristol, UK, 2020; ISBN 9780750334112. [Google Scholar]
- Ellis, P.D. The essential guide to effect sizes: statistical power, meta-analysis, and the interpretation of research results. Choice 2011, 48, 48–5742. [Google Scholar] [CrossRef]
- Colquhoun, D. An investigation of the false discovery rate and the misinterpretation of p-values. R. Soc. Open Sci. 2014, 1, 140216. [Google Scholar] [CrossRef]
- Ghosh, A.K. Mayo Clinic Internal Medicine Review, Eighth Edition; CRC Press: Boca Raton, FL, USA, 2008; ISBN 9781420084788. [Google Scholar]
- Li, J.; Rong, Y.; Meng, H.; Lu, Z.; Kwok, T.; Cheng, H. TATC: Predicting Alzheimer’s Disease with Actigraphy Data. In Proceedings of the KDD’18, 24th ACM SIGKDD International Conference on Knowledge Discovery & Data Mining, London, UK, 19–23 August 2018; pp. 509–518. [Google Scholar]
- Collins, G.S.; Reitsma, J.B.; Altman, D.G.; Moons, K.G.M. Transparent reporting of a multivariable prediction model for individual prognosis or diagnosis (TRIPOD): the TRIPOD Statement. BMC Med. 2015, 13, 1. [Google Scholar] [CrossRef] [PubMed]
- Bossuyt, P.M.; Reitsma, J.B.; Bruns, D.E.; Gatsonis, C.A.; Glasziou, P.P.; Irwig, L.; Lijmer, J.G.; Moher, D.; Rennie, D.; de Vet, H.C.W.; et al. STARD 2015: an updated list of essential items for reporting diagnostic accuracy studies. BMJ 2015, 351, h5527. [Google Scholar] [CrossRef] [PubMed]
- Hazra, A. Using the confidence interval confidently. J. Thorac. Dis. 2017, 9, 4125–4130. [Google Scholar] [CrossRef] [PubMed]
- Tsoi, K.K.F.; Lam, M.W.Y.; Chu, C.T.K.; Wong, M.P.F.; Meng, H.M.L. Machine Learning on Drawing Behavior for Dementia Screening; Association for Computing Machinery: New York, NY, USA, 2018; pp. 131–132. [Google Scholar]
- Yule, A.; Fitzgerald, M.; Wilens, T.; Wozniak, J.; Woodworth, K.Y.; Pulli, A.; Uchida, M.; Faraone, S.V.; Biederman, J. Further Evidence of the Diagnostic Utility of the Child Behavior Checklist for Identifying Pediatric Bipolar I Disorder. Scand. J. Child Adolescent Psychiatry Psychol. 2019, 7, 29–36. [Google Scholar] [CrossRef]
- McGuire, P.K.; Matsumoto, K. Functional neuroimaging in mental disorders. World Psychiatry 2004, 3, 6–11. [Google Scholar]
- Peter, F.; Andrea, S.; Nancy, A. Forty years of structural brain imaging in mental disorders: is it clinically useful or not? Dialogues Clin. Neurosci. 2018, 20, 179–186. [Google Scholar] [CrossRef]
- Desmyter, S.; van Heeringen, C.; Audenaert, K. Structural and functional neuroimaging studies of the suicidal brain. Progress Neuro-Psychopharmacol. Biol. Psychiatry 2011, 35, 796–808. [Google Scholar] [CrossRef]
- Hirsch, G.V.; Bauer, C.M.; Merabet, L.B. Using structural and functional brain imaging to uncover how the brain adapts to blindness. Ann. Neurosci. Psychol. 2015, 2, 7. [Google Scholar] [CrossRef]
- Uludağ, K.; Roebroeck, A. General overview on the merits of multimodal neuroimaging data fusion. Neuroimage 2014, 102 Pt 1, 3–10. [Google Scholar] [CrossRef]
- Lei, D.; Pinaya, W.H.L.; Young, J.; van Amelsvoort, T.; Marcelis, M.; Donohoe, G.; Mothersill, D.O.; Corvin, A.; Vieira, S.; Huang, X.; et al. Integrating machining learning and multimodal neuroimaging to detect schizophrenia at the level of the individual. Hum. Brain Mapp. 2020, 41, 1119–1135. [Google Scholar] [CrossRef]
- Aleem, I.S.; Jalal, H.; Aleem, I.S.; Sheikh, A.A.; Bhandari, M. Clinical decision analysis: Incorporating the evidence with patient preferences. Patient Prefer. Adherence 2008, 21. [Google Scholar] [CrossRef] [PubMed]
- Jo, T.; Nho, K.; Saykin, A.J. Deep learning in Alzheimer’s disease: Diagnostic classification and prognostic prediction using neuroimaging data. Front. Aging Neurosci. 2019, 11, 220. [Google Scholar] [CrossRef]
- Ghojogh, B.; Crowley, M. The theory behind overfitting, cross validation, regularization, bagging, and boosting: Tutorial. arXiv 2019, arXiv:1905.12787. [Google Scholar]
- Johnson, J.M.; Khoshgoftaar, T.M. Survey on deep learning with class imbalance. J. Big Data 2019, 6. [Google Scholar] [CrossRef]
- Elgendi, M.; Nasir, M.; Tang, Q.; Smith, D.; Grenier, J.-P.; Batte, C.; Spieler, B.; Leslie, W.D.; Menon, C.; Fletcher, R.; et al. The effectiveness of image augmentation in deep learning networks for detecting COVID-19: A geometric transformation perspective. Front. Med. 2021, 8, 153. [Google Scholar] [CrossRef]
- Lu, D.; Popuri, K.; Ding, G.W.; Balachandar, R.; Beg, M.F.; Alzheimer’s Disease Neuroimaging Initiative. Multimodal and Multiscale Deep Neural Networks for the Early Diagnosis of Alzheimer’s Disease using structural MR and FDG-PET images. Sci. Rep. 2018, 8. [Google Scholar] [CrossRef]
- Su, C.; Xu, Z.; Pathak, J.; Wang, F. Deep learning in mental health outcome research: a scoping review. Transl. Psychiatry 2020, 10, 116. [Google Scholar] [CrossRef] [PubMed]
- Samek, W.; Binder, A.; Montavon, G.; Lapuschkin, S.; Muller, K.-R. Evaluating the visualization of what a deep neural network has learned. IEEE Trans. Neural Netw. Learn. Syst. 2017, 28, 2660–2673. [Google Scholar] [CrossRef]
- Cheng, Q.; Varshney, P.K.; Arora, M.K. Logistic regression for feature selection and soft classification of remote sensing data. IEEE Geosci. Remote Sens. Lett. 2006, 3, 491–494. [Google Scholar] [CrossRef]
- Sarrafzadegan, N.; Hassannejad, R.; Marateb, H.R.; Talaei, M.; Sadeghi, M.; Roohafza, H.R.; Masoudkabir, F.; Oveisgharan, S.; Mansourian, M.; Mohebian, M.R.; et al. PARS risk charts: A 10-year study of risk assessment for cardiovascular diseases in Eastern Mediterranean Region. PLoS ONE 2017, 12, e0189389. [Google Scholar] [CrossRef] [PubMed]
- McHugh, C.M.; Large, M.M. Can machine-learning methods really help predict suicide? Curr. Opin. Psychiatry 2020, 33, 369–374. [Google Scholar] [CrossRef] [PubMed]
- Szmukler, G.; Everitt, B.; Leese, M. Risk assessment and receiver operating characteristic curves. Psychol. Med. 2012, 42, 895–898. [Google Scholar] [CrossRef] [PubMed]
- Bachmann, S. Epidemiology of suicide and the psychiatric perspective. Int. J. Environ. Res. Public Health 2018, 15, 1425. [Google Scholar] [CrossRef]
- McGrath, J.; Saha, S.; Chant, D.; Welham, J. Schizophrenia: a concise overview of incidence, prevalence, and mortality. Epidemiol. Rev. 2008, 30, 67–76. [Google Scholar] [CrossRef]
- Newson, J.J.; Thiagarajan, T.C. EEG Frequency Bands in Psychiatric Disorders: A Review of Resting State Studies. Front. Hum. Neurosci. 2018, 12, 521. [Google Scholar] [CrossRef] [PubMed]
- Tanaka-Koshiyama, K.; Koshiyama, D.; Miyakoshi, M.; Joshi, Y.B.; Molina, J.L.; Sprock, J.; Braff, D.L.; Light, G.A. Abnormal Spontaneous Gamma Power Is Associated With Verbal Learning and Memory Dysfunction in Schizophrenia. Front. Psychiatry 2020, 11, 832. [Google Scholar] [CrossRef]
- Uhlhaas, P.J.; Singer, W. Oscillations and neuronal dynamics in schizophrenia: the search for basic symptoms and translational opportunities. Biol. Psychiatry 2015, 77, 1001–1009. [Google Scholar] [CrossRef]
- Salimpour, Y.; Anderson, W.S. Cross-Frequency Coupling Based Neuromodulation for Treating Neurological Disorders. Front. Neurosci. 2019, 13, 125. [Google Scholar] [CrossRef]
- Dürschmid, S.; Zaehle, T.; Kopitzki, K.; Voges, J.; Schmitt, F.C.; Heinze, H.-J.; Knight, R.T.; Hinrichs, H. Phase-amplitude cross-frequency coupling in the human nucleus accumbens tracks action monitoring during cognitive control. Front. Hum. Neurosci. 2013, 7, 635. [Google Scholar] [CrossRef]
- Allen, E.A.; Liu, J.; Kiehl, K.A.; Gelernter, J.; Pearlson, G.D.; Perrone-Bizzozero, N.I.; Calhoun, V.D. Components of cross-frequency modulation in health and disease. Front. Syst. Neurosci. 2011, 5, 59. [Google Scholar] [CrossRef] [PubMed]
- Fraga, F.J.; Falk, T.H.; Kanda, P.A.M.; Anghinah, R. Characterizing Alzheimer’s disease severity via resting-awake EEG amplitude modulation analysis. PLoS ONE 2013, 8, e72240. [Google Scholar] [CrossRef]
- Buzsáki, G.; Draguhn, A. Neuronal oscillations in cortical networks. Science 2004, 304, 1926–1929. [Google Scholar] [CrossRef] [PubMed]
- Alonso, S.G.; de la Torre-Díez, I.; Hamrioui, S.; López-Coronado, M.; Barreno, D.C.; Nozaleda, L.M.; Franco, M. Data Mining algorithms and techniques in Mental Health: A systematic review. J. Med. Syst. 2018, 42, 161. [Google Scholar] [CrossRef]
- Thieme, A.; Belgrave, D.; Doherty, G. Machine learning in mental health. ACM Trans. Comput. Hum. Interact. 2020, 27, 1–53. [Google Scholar] [CrossRef]
- Librenza-Garcia, D.; Kotzian, B.J.; Yang, J.; Mwangi, B.; Cao, B.; Pereira Lima, L.N.; Bermudez, M.B.; Boeira, M.V.; Kapczinski, F.; Passos, I.C. The impact of machine learning techniques in the study of bipolar disorder: A systematic review. Neurosci. Biobehav. Rev. 2017, 80, 538–554. [Google Scholar] [CrossRef] [PubMed]
- de Filippis, R.; Carbone, E.A.; Gaetano, R.; Bruni, A.; Pugliese, V.; Segura-Garcia, C.; De Fazio, P. Machine learning techniques in a structural and functional MRI diagnostic approach in schizophrenia: a systematic review. Neuropsychiatr. Dis. Treat. 2019, 15, 1605–1627. [Google Scholar] [CrossRef]
- Marateb, H.R.; Tasdighi, Z.; Mohebian, M.R.; Naghavi, A.; Hess, M.; Motlagh, M.E.; Heshmat, R.; Mansourian, M.; Mananas, M.A.; Binder, H.; et al. Computer-aided diagnosis of psychiatric distress in children and adolescents using deep interaction networks: The CASPIAN-IV study. Res. Square 2020. [Google Scholar] [CrossRef]
- Collins, G.S.; Moons, K.G.M. Reporting of artificial intelligence prediction models. Lancet 2019, 393, 1577–1579. [Google Scholar] [CrossRef]
- Zamanipoor Najafabadi, A.H.; Ramspek, C.L.; Dekker, F.W.; Heus, P.; Hooft, L.; Moons, K.G.M.; Peul, W.C.; Collins, G.S.; Steyerberg, E.W.; van Diepen, M. TRIPOD statement: a preliminary pre-post analysis of reporting and methods of prediction models. BMJ Open 2020, 10, e041537. [Google Scholar] [CrossRef] [PubMed]


Publisher’s Note: MDPI stays neutral with regard to jurisdictional claims in published maps and institutional affiliations. |
© 2021 by the authors. Licensee MDPI, Basel, Switzerland. This article is an open access article distributed under the terms and conditions of the Creative Commons Attribution (CC BY) license (http://creativecommons.org/licenses/by/4.0/).