
A Comprehensive Review of Machine Learning Used to Combat COVID-19

 ,
,  , , ,
, , ,
Abstract
:1. Introduction
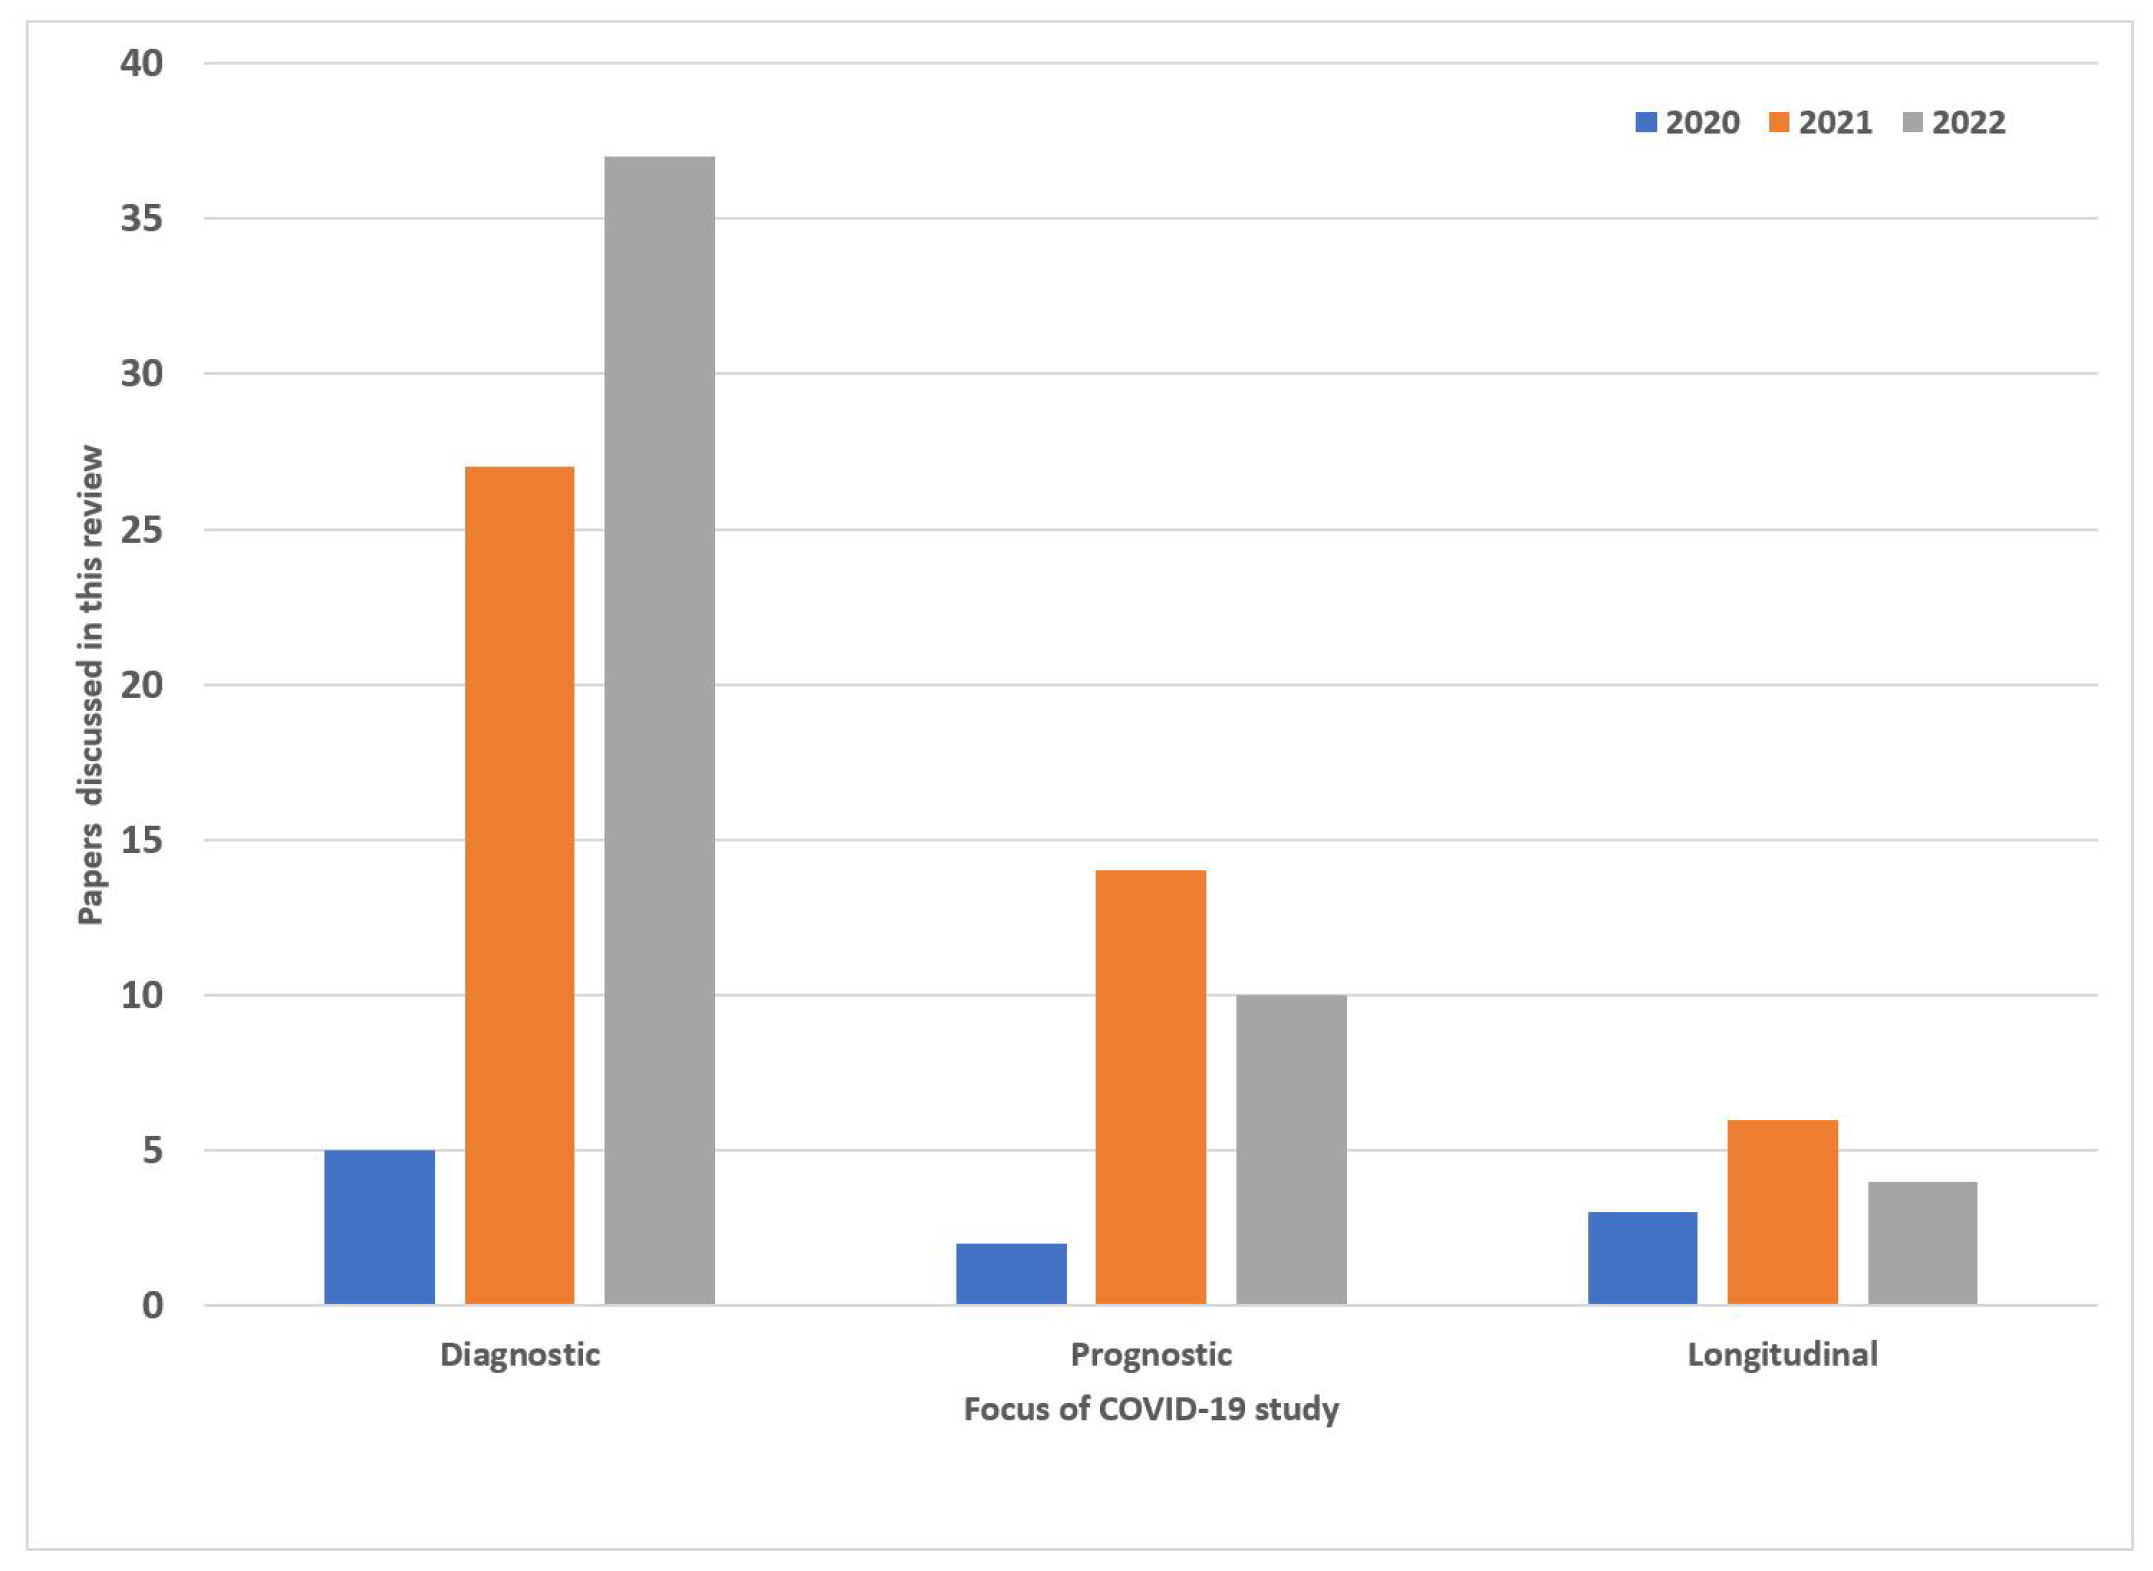
- Summary of the current AI applications in the COVID-19 setting ranging diagnostic, to prognostic models.
- In diagnostic models, classification and segmentation approaches have been presented. The diagnostic models are primarily focused on deep learning while the prognostic and longitudinal study explores machine learning.
- Longitudinal studies were reported in order to better understand how COVID-19 affected patients over time. This involved using serial medical imaging data that showed disease progression at different points in time. This gave researchers the ability to track disease severity and improve classification and segmentation models.
- The development of prognostic models allowed researchers to diagnose COVID-19 more accurately at different disease stages while providing critical information on a patient’s prognosis. Some of the patient outcomes that could be predicted included: Mortality, Hospital admission, Intensive care unit admission, and Hospital length of stay These predictors also provided valuable information to healthcare systems for the allocation of scarce medical resources.
2. Machine Architectures Used in COVID-19 Diagnosis
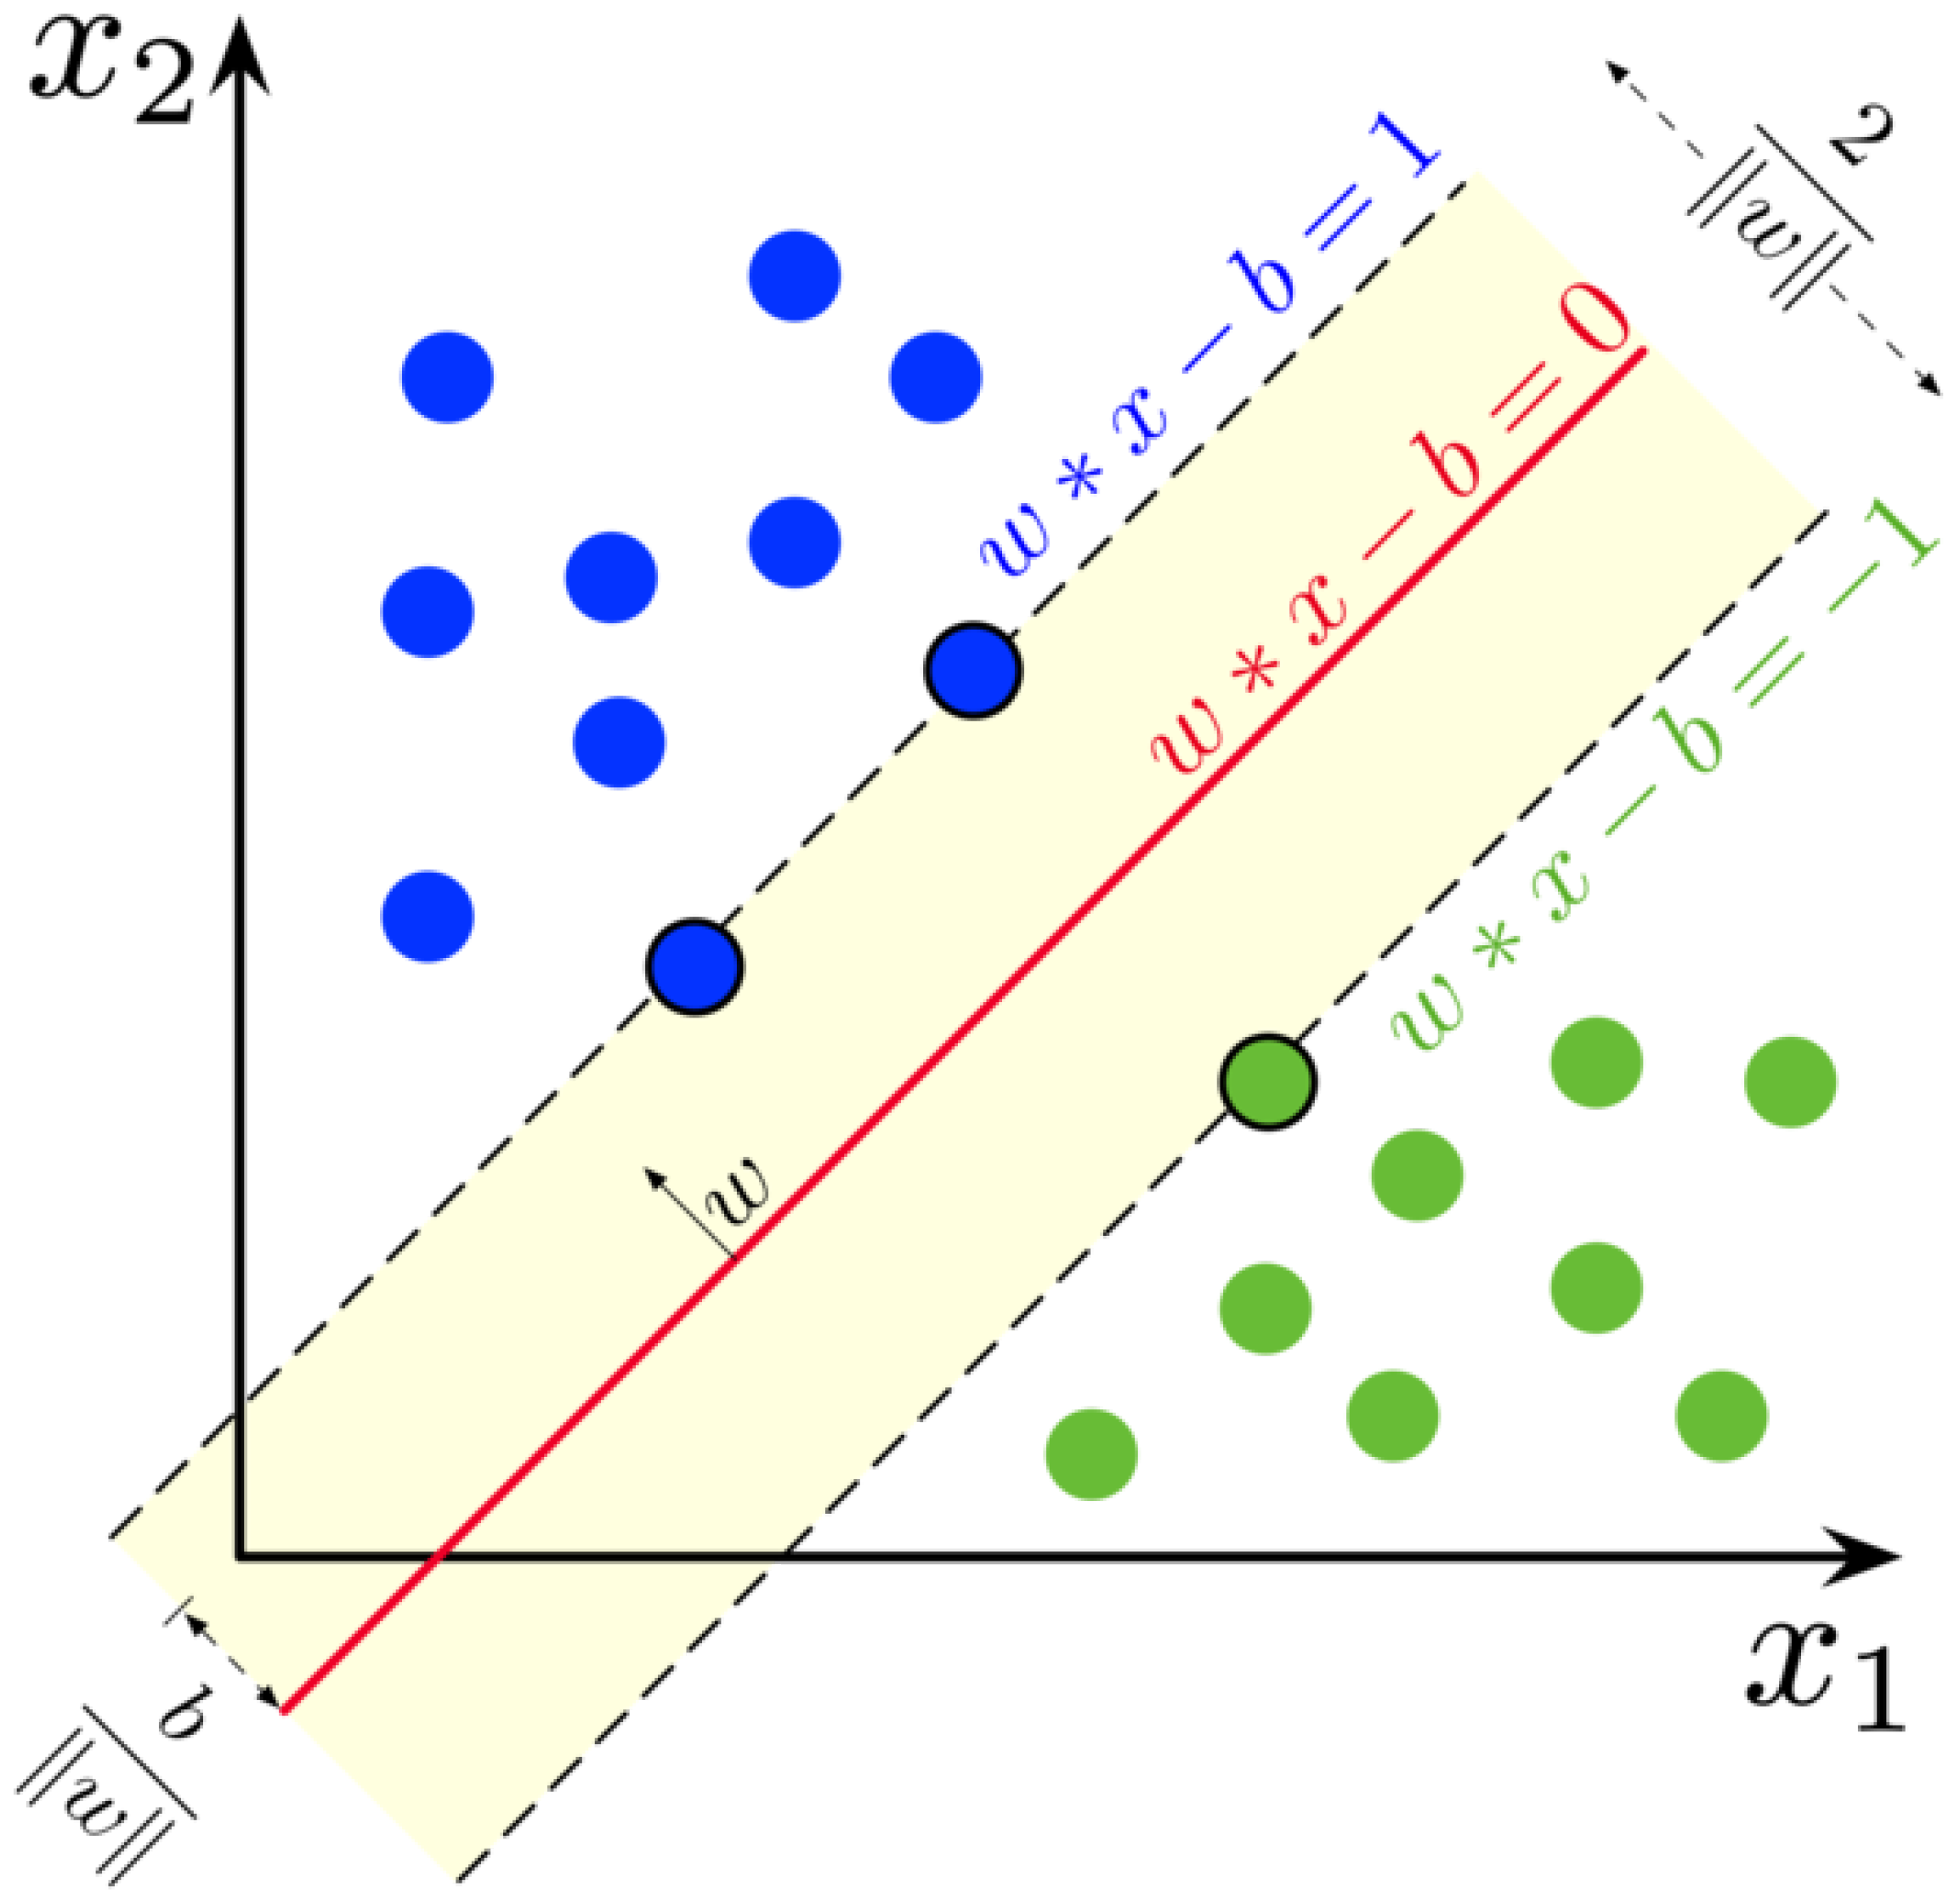
2.1. Machine Learning Models
2.2. Deep Neural Networks
2.3. Convolutional Neural Networks
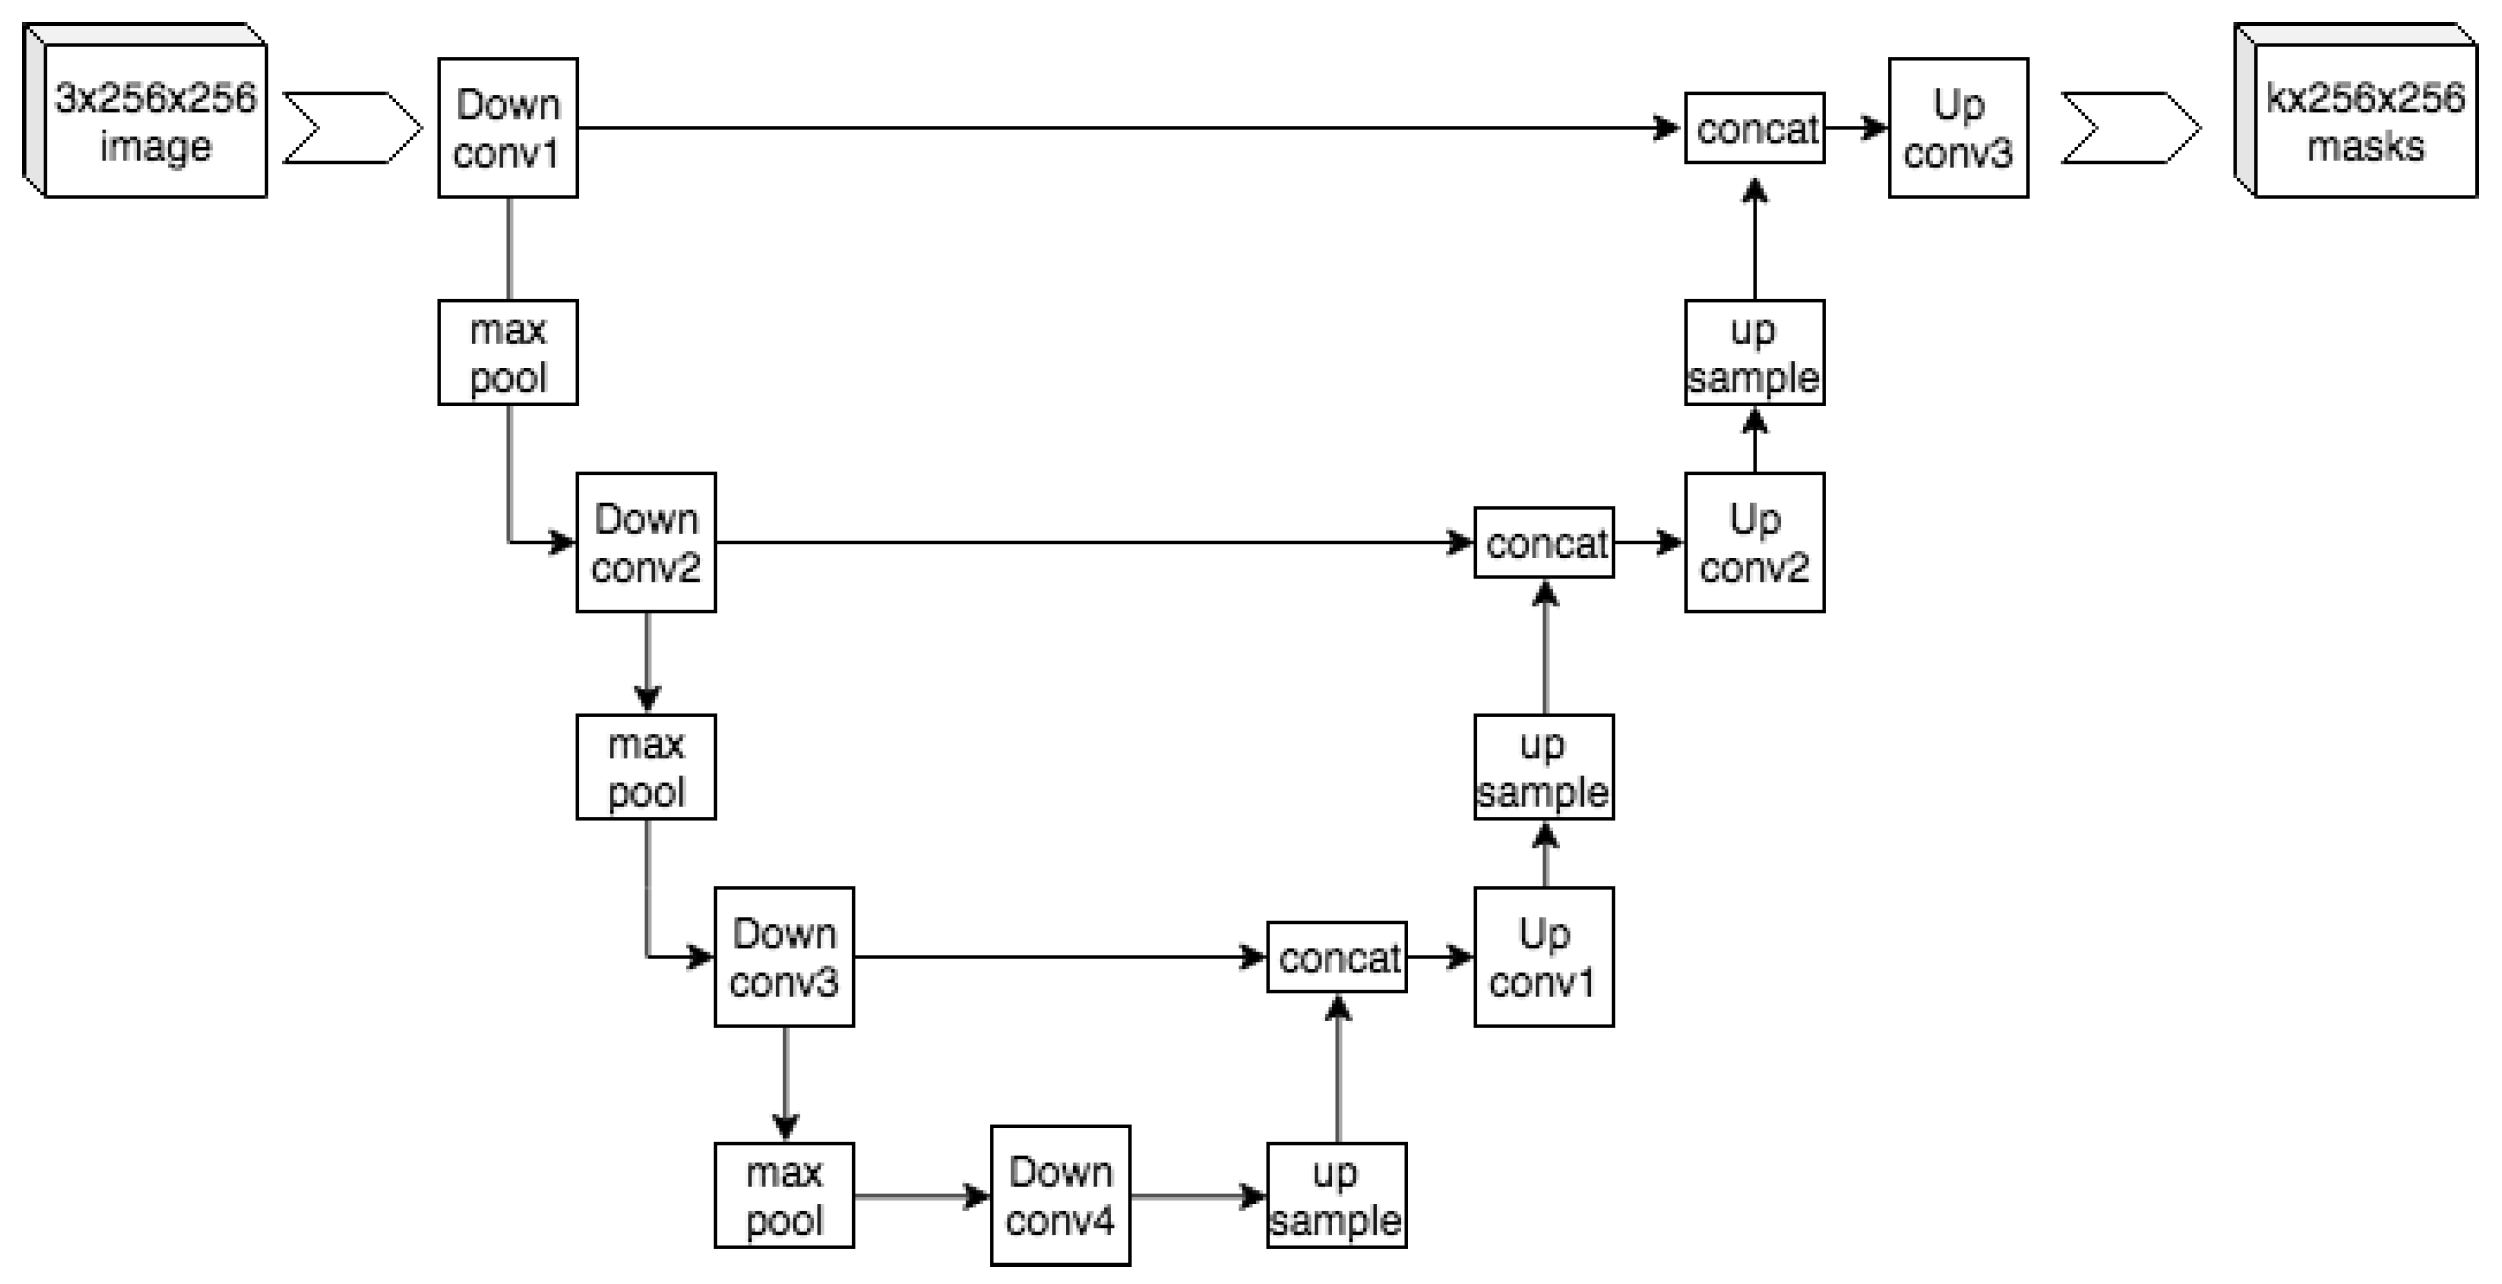
2.3.1. UNet
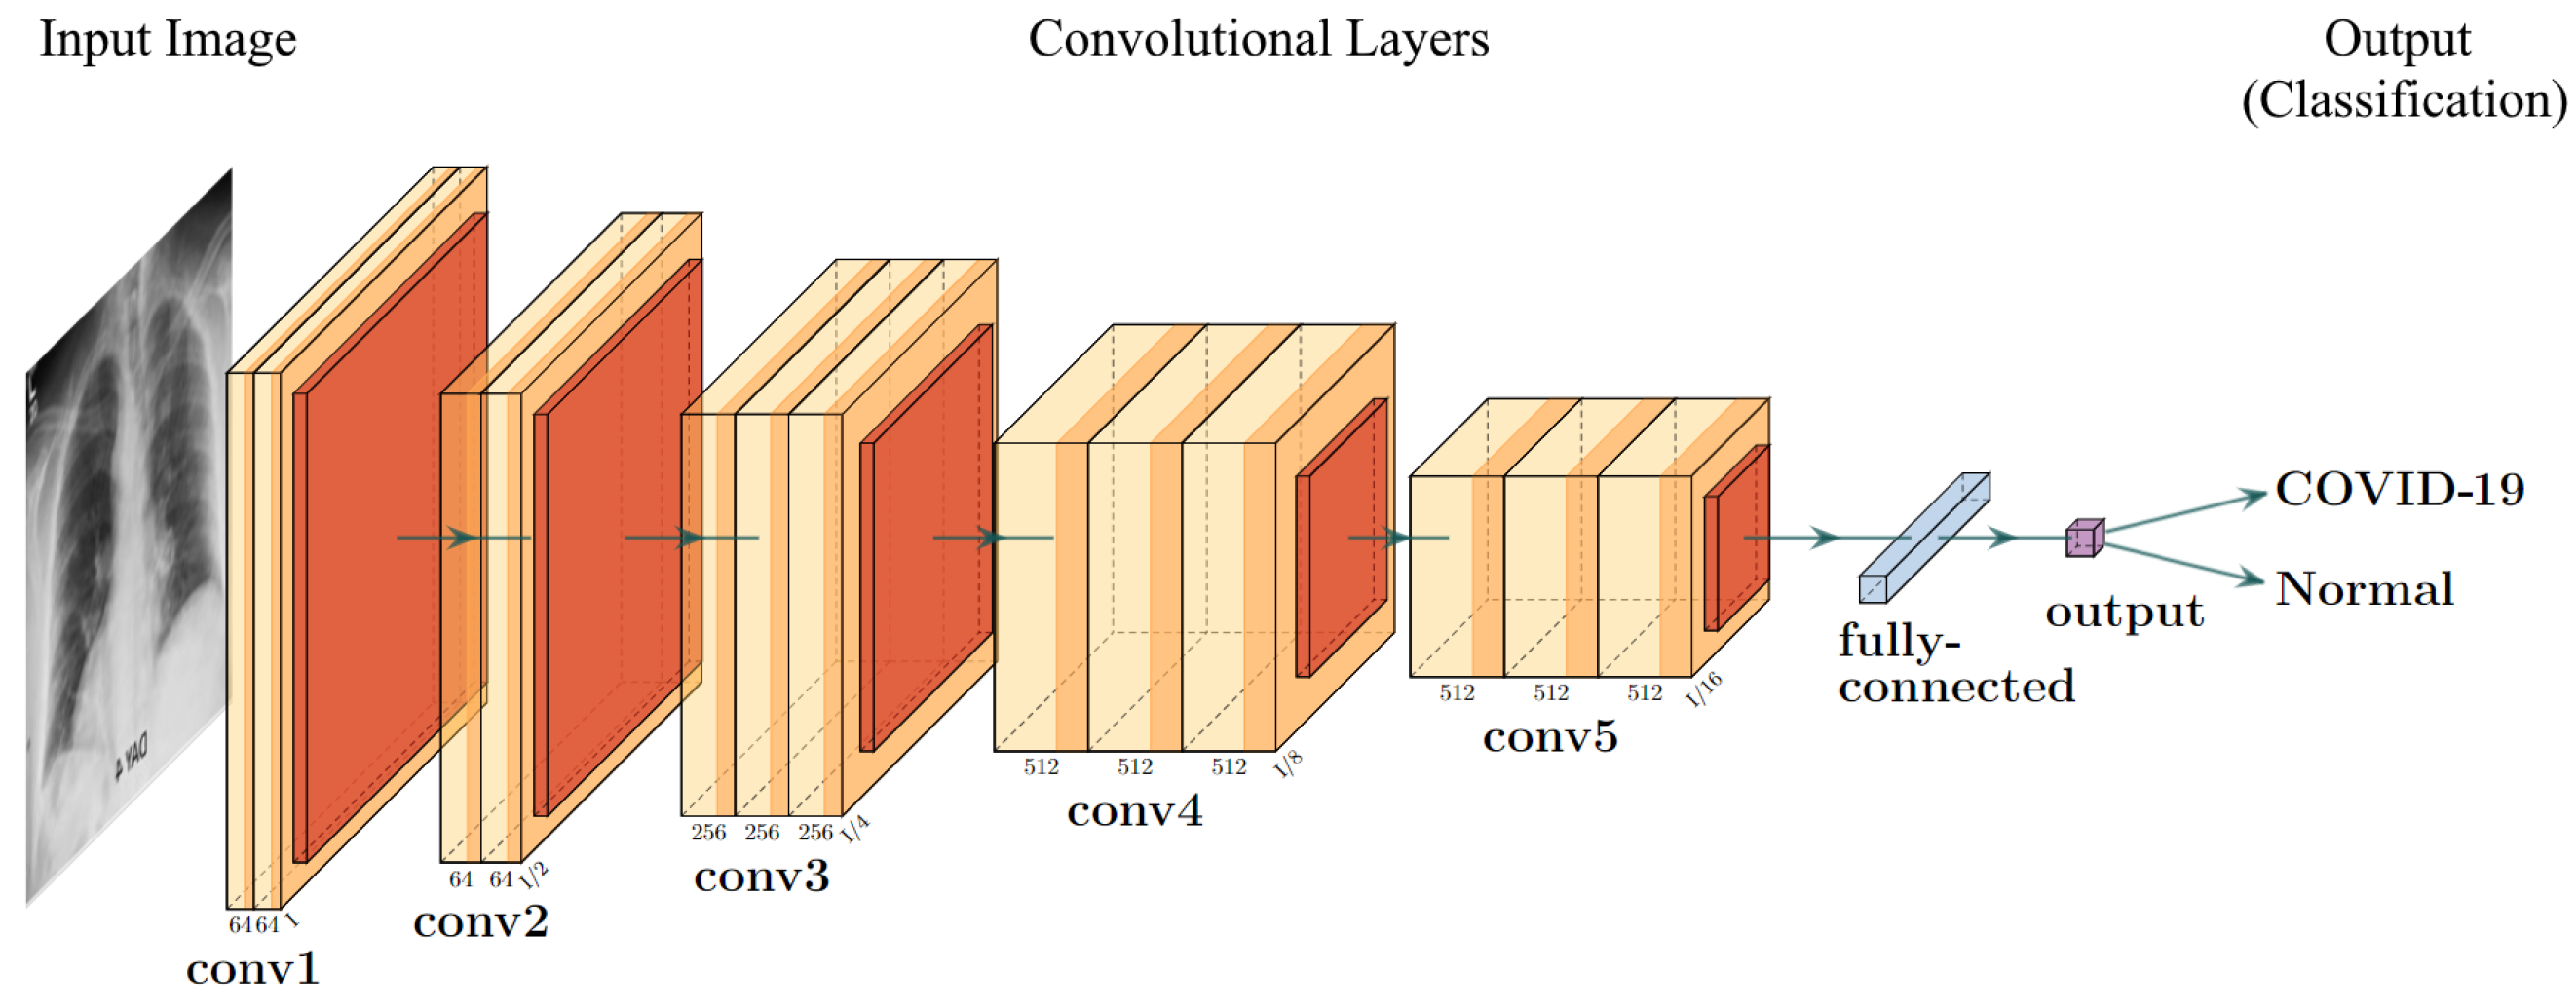
2.3.2. VGG Frameworks
2.3.3. Residual Networks
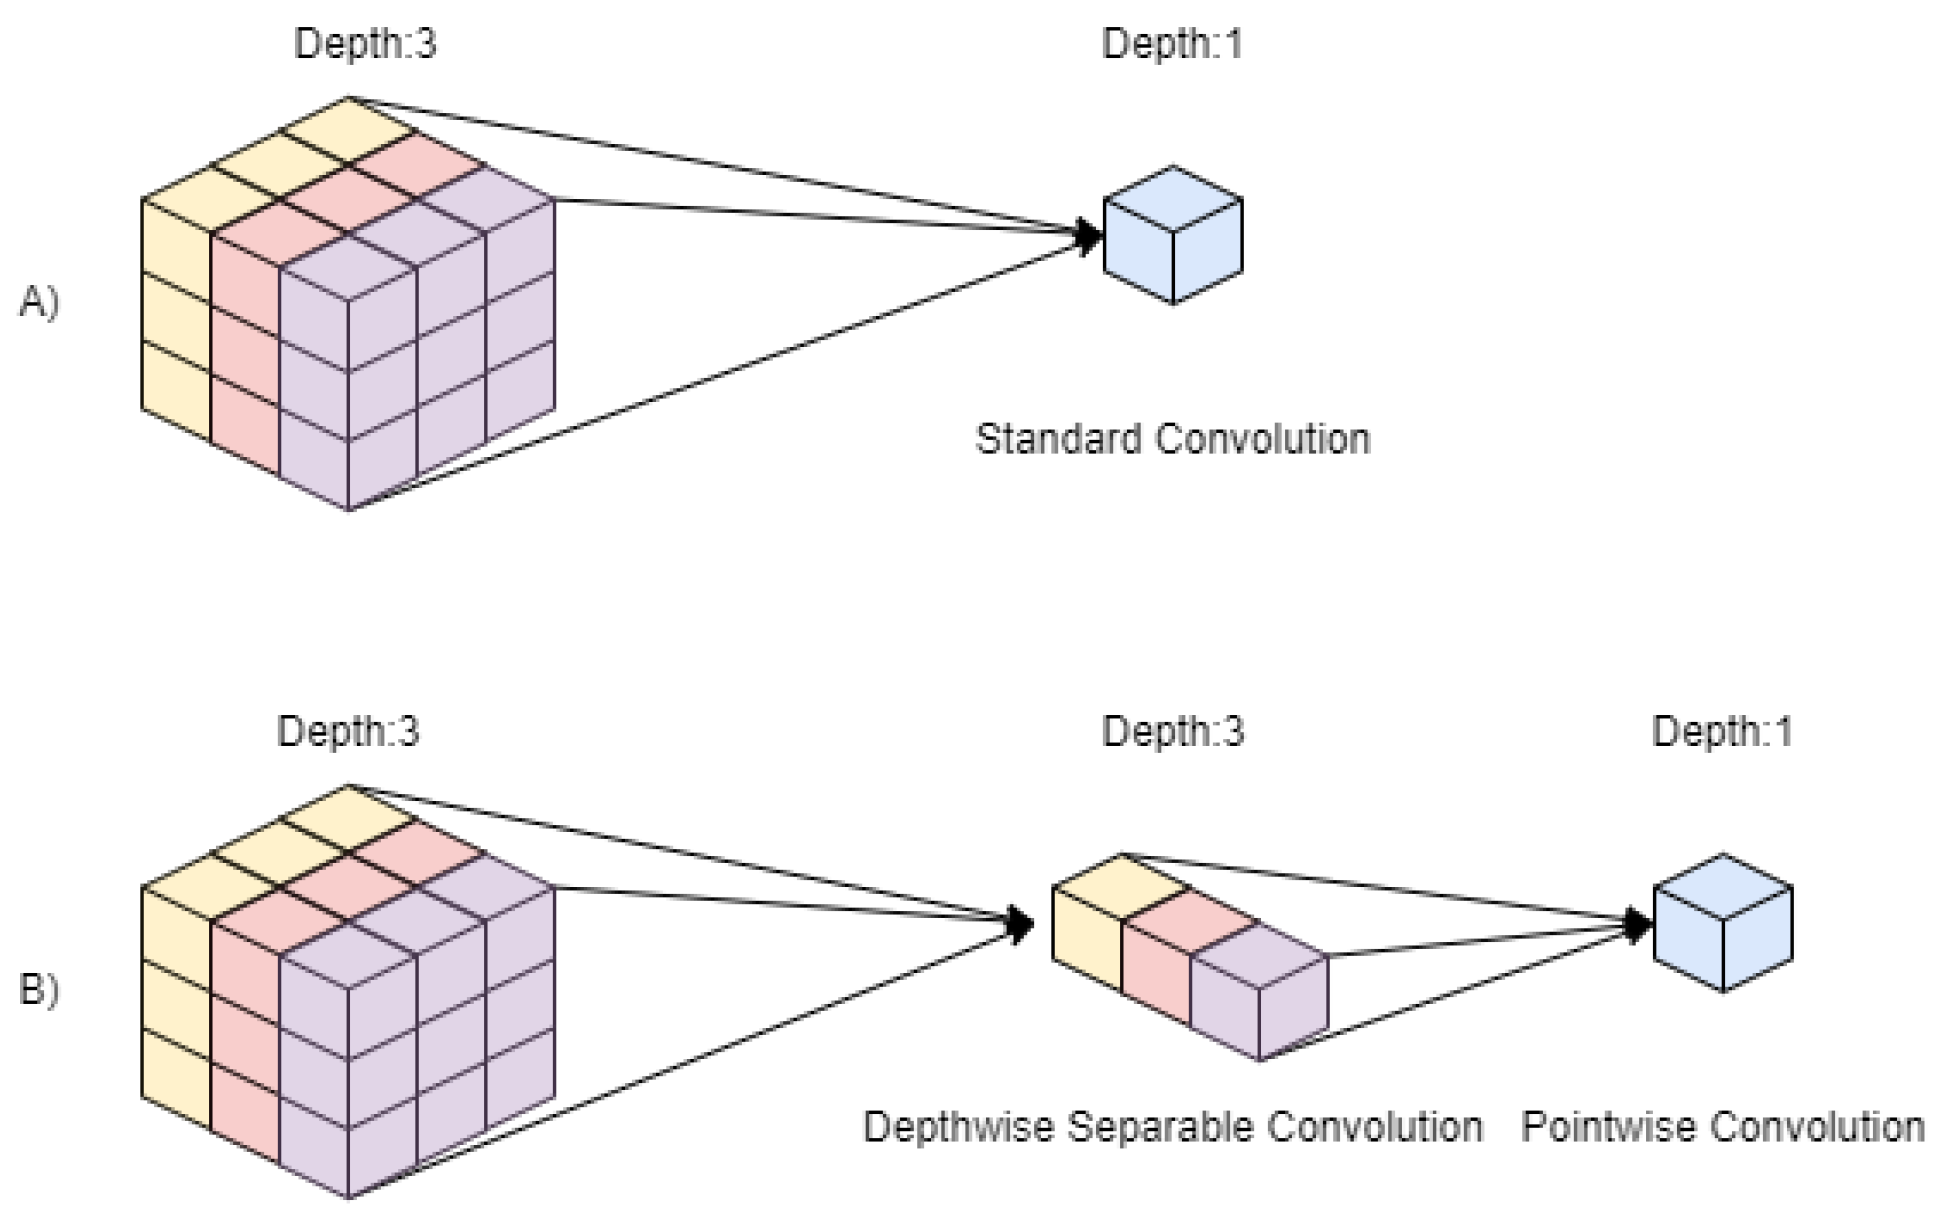
2.3.4. MobileNet
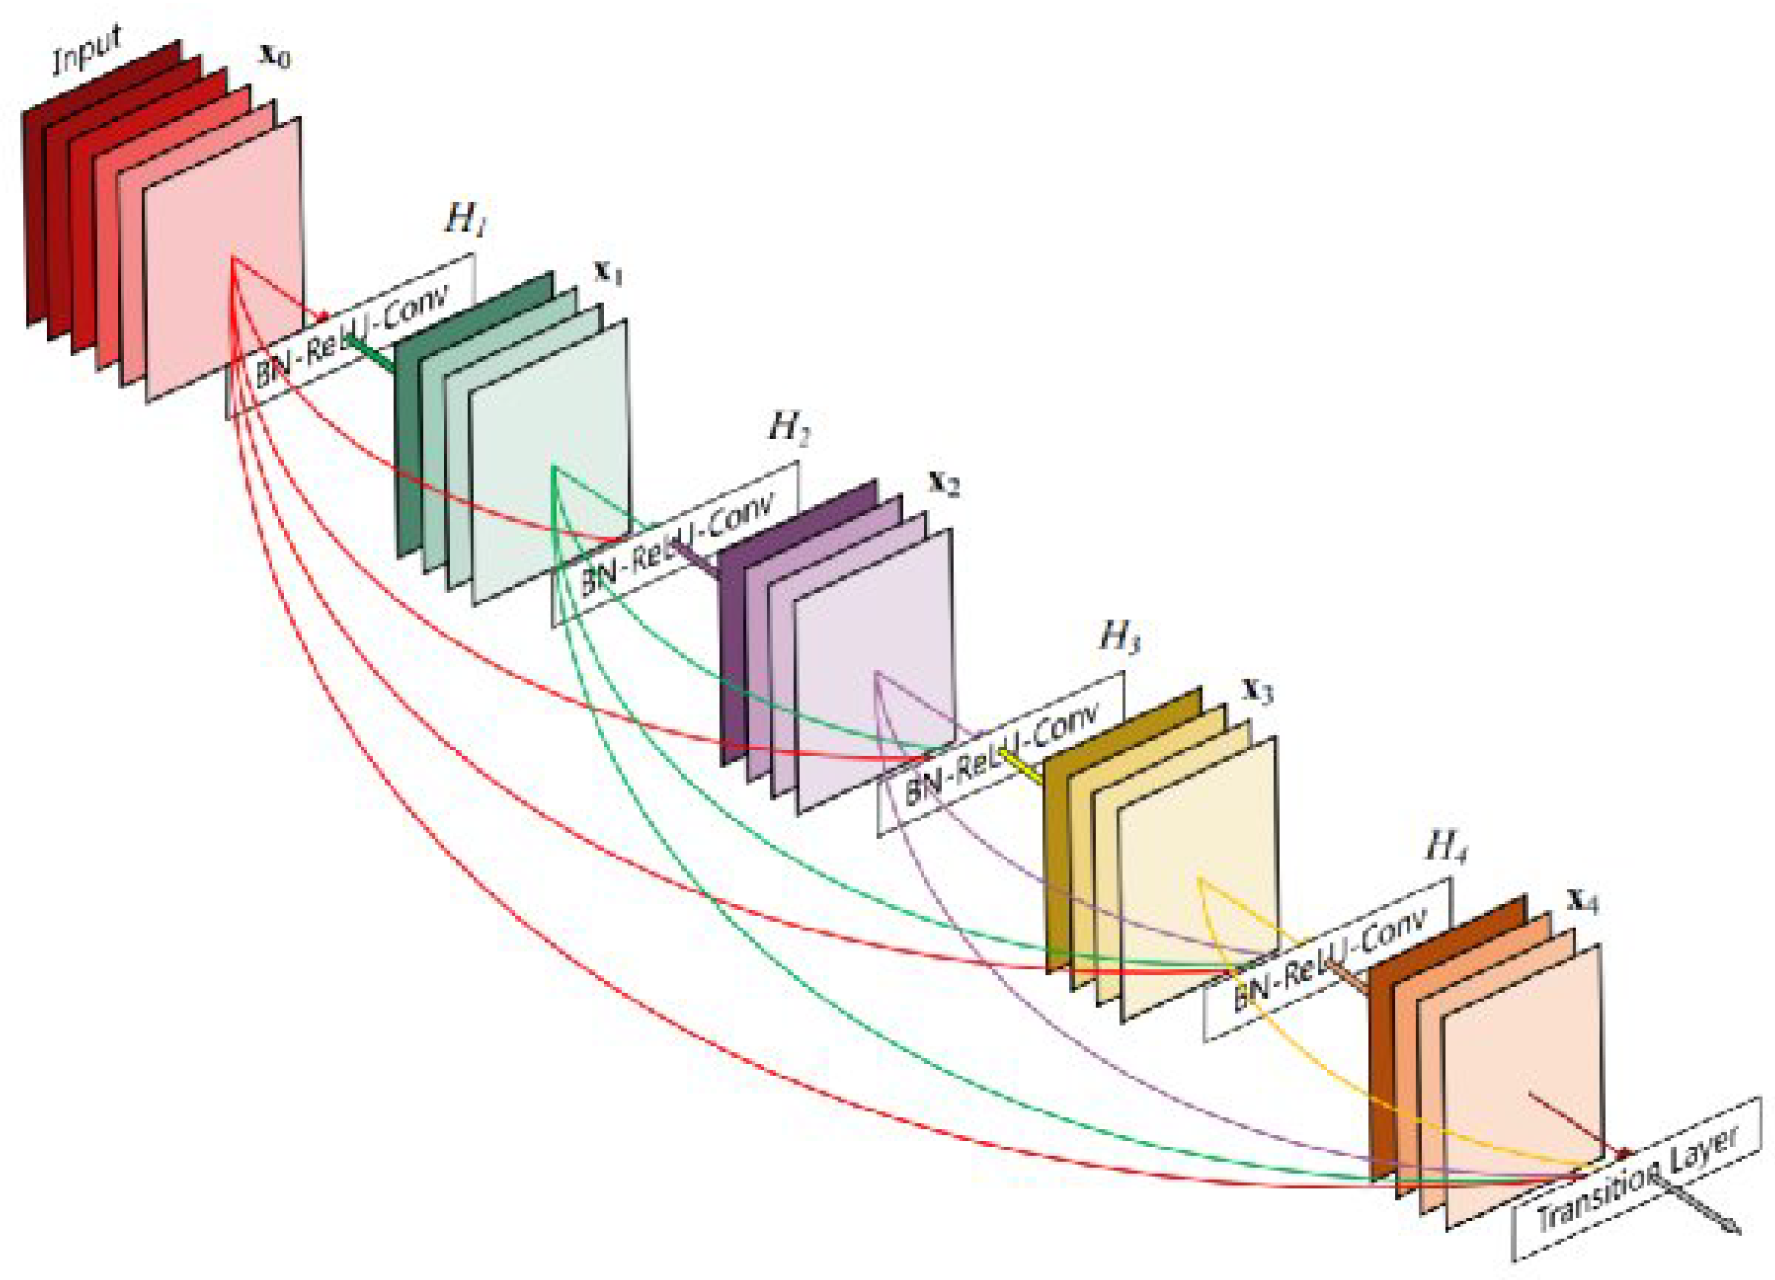
2.3.5. DenseNet
2.3.6. Recurrent Neural Networks
3. Datasets for Research
4. COVID-19 Prediction Using Deep Learning
4.1. Diagnosis Using Chest Radiographs
4.2. Diagnosis Using Primarily CT Imaging
4.3. Diagnosis Using Ensemble Techniques
4.4. Diagnosis Using Additional Data
5. COVID-19 Prognostic and Longitudinal Models
5.1. Prognostic Models
5.2. Longitudinal Models
6. Conclusions
Author Contributions
Funding
Institutional Review Board Statement
Informed Consent Statement
Data Availability Statement
Conflicts of Interest
Abbreviations
| CNN | Convolutional Neural Network |
| CXR | Chest X-rays |
| VGG | Visual Geometry Group |
| FLOPS | Floating Point Operations per second |
| SVM | Support Vector Machines |
| LSTM | Long Short-Term Memory |
References
- Feng, W.; Newbigging, A.M.; Le, C.; Pang, B.; Peng, H.; Cao, Y.; Wu, J.; Abbas, G.; Song, J.; Wang, D.B.; et al. Molecular diagnosis of COVID-19: Challenges and research needs. Anal. Chem. 2020, 92, 10196–10209. [Google Scholar] [CrossRef] [PubMed]
- Kanne, J.P.; Little, B.P.; Chung, J.H.; Elicker, B.M.; Ketai, L.H. Essentials for radiologists on COVID-19: An update—Radiology scientific expert panel. Radiology 2020, 296, E113–E114. [Google Scholar] [CrossRef] [PubMed] [Green Version]
- Sousa, R.T.; Marques, O.; Soares, F.A.A.; Sene, I.I., Jr.; de Oliveira, L.L.; Spoto, E.S. Comparative performance analysis of machine learning classifiers in detection of childhood pneumonia using chest radiographs. Procedia Comput. Sci. 2013, 18, 2579–2582. [Google Scholar] [CrossRef] [Green Version]
- Ahsan, M.; Gomes, R.; Denton, A. Application of a convolutional neural network using transfer learning for tuberculosis detection. In Proceedings of the 2019 IEEE International Conference on Electro Information Technology (EIT), Brookings, SD, USA, 20–22 May 2019; pp. 427–433. [Google Scholar]
- Bentley, P.; Ganesalingam, J.; Jones, A.L.C.; Mahady, K.; Epton, S.; Rinne, P.; Sharma, P.; Halse, O.; Mehta, A.; Rueckert, D. Prediction of stroke thrombolysis outcome using CT brain machine learning. NeuroImage Clin. 2014, 4, 635–640. [Google Scholar] [CrossRef] [Green Version]
- Li, Y.; Hara, S.; Shimura, K. A machine learning approach for locating boundaries of liver tumors in ct images. In Proceedings of the 18th International Conference on Pattern Recognition (ICPR’06), Hong Kong, China, 20–24 August 2006; Volume 1, pp. 400–403. [Google Scholar]
- Garapati, S.S.; Hadjiiski, L.; Cha, K.H.; Chan, H.P.; Caoili, E.M.; Cohan, R.H.; Weizer, A.; Alva, A.; Paramagul, C.; Wei, J.; et al. Urinary bladder cancer staging in CT urography using machine learning. Med. Phys. 2017, 44, 5814–5823. [Google Scholar] [CrossRef] [PubMed]
- El-Rashidy, N.; Abdelrazik, S.; Abuhmed, T.; Amer, E.; Ali, F.; Hu, J.W.; El-Sappagh, S. Comprehensive survey of using machine learning in the COVID-19 pandemic. Diagnostics 2021, 11, 1155. [Google Scholar] [CrossRef]
- Alyasseri, Z.A.A.; Al-Betar, M.A.; Doush, I.A.; Awadallah, M.A.; Abasi, A.K.; Makhadmeh, S.N.; Alomari, O.A.; Abdulkareem, K.H.; Adam, A.; Damasevicius, R.; et al. Review on COVID-19 diagnosis models based on machine learning and deep learning approaches. Expert Syst. 2022, 39, e12759. [Google Scholar] [CrossRef] [PubMed]
- Rozario, P.; Gomes, R. Comparison of data mining algorithms in remote sensing using Lidar data fusion and feature selection. In Proceedings of the 2021 IEEE International Conference on Electro Information Technology (EIT), Mt. Pleasant, MI, USA, 14–15 May 2021; pp. 236–243. [Google Scholar]
- Gomes, R.; Ahsan, M.; Denton, A. Fusion of SMOTE and Outlier Detection Techniques for Land-Cover Classification Using Support Vector Machines. In Proceedings of the 2018 Midwest Instruction and Computing Symposium (MICS), Duluth, MN, USA, 6–7 April 2018; p. 42. [Google Scholar]
- Breiman, L. Random forests. Mach. Learn. 2001, 45, 5–32. [Google Scholar] [CrossRef] [Green Version]
- Cortes, C.; Vapnik, V. Support-vector networks. Mach. Learn. 1995, 20, 273–297. [Google Scholar] [CrossRef]
- Mahdavifar, S.; Ghorbani, A.A. Application of deep learning to cybersecurity: A survey. Neurocomputing 2019, 347, 149–176. [Google Scholar] [CrossRef]
- Yang, H.; An, Z.; Zhou, H.; Hou, Y. Application of machine learning methods in bioinformatics. AIP Conf. Proc. 2018, 1967, 040015. [Google Scholar]
- Zhu, Q.; Li, X.; Conesa, A.; Pereira, C. GRAM-CNN: A deep learning approach with local context for named entity recognition in biomedical text. Bioinformatics 2018, 34, 1547–1554. [Google Scholar] [CrossRef] [Green Version]
- Ronneberger, O.; Fischer, P.; Brox, T. U-net: Convolutional networks for biomedical image segmentation. In International Conference on Medical Image Computing and Computer-Assisted Intervention; Springer: Berlin/Heidelberg, Germany, 2015; pp. 234–241. [Google Scholar]
- Simonyan, K.; Zisserman, A. Very deep convolutional networks for large-scale image recognition. arXiv 2014, arXiv:1409.1556. [Google Scholar]
- He, K.; Zhang, X.; Ren, S.; Sun, J. Deep residual learning for image recognition. In Proceedings of the IEEE Conference on Computer Vision and Pattern Recognition, Las Vegas, NV, USA, 27–30 June 2016; pp. 770–778. [Google Scholar]
- Howard, A.G.; Zhu, M.; Chen, B.; Kalenichenko, D.; Wang, W.; Weyand, T.; Andreetto, M.; Adam, H. Mobilenets: Efficient convolutional neural networks for mobile vision applications. arXiv 2017, arXiv:1704.04861. [Google Scholar]
- Huang, G.; Liu, Z.; Van Der Maaten, L.; Weinberger, K.Q. Densely connected convolutional networks. In Proceedings of the IEEE Conference on Computer Vision and Pattern Recognition, Honolulu, HI, USA, 21–26 July 2017; pp. 4700–4708. [Google Scholar]
- Mendoza, M.M.; Chang, Y.; Dmitriev, A.V.; Lin, C.; Tsai, L.; Li, Y.; Hsieh, M.; Hsu, H.; Huang, G.; Lin, Y.; et al. Recovery of Ionospheric Signals Using Fully Convolutional DenseNet and Its Challenges. Sensors 2021, 21, 6482. [Google Scholar] [CrossRef]
- Zhang, X.; Zhou, X.; Lin, M.; Sun, J. Shufflenet: An extremely efficient convolutional neural network for mobile devices. In Proceedings of the IEEE Conference on Computer Vision and Pattern Recognition, Salt Lake City, UT, USA, 18–22 June 2018; pp. 6848–6856. [Google Scholar]
- Noori, M.; Bahri, A.; Mohammadi, K. Attention-guided version of 2D UNet for automatic brain tumor segmentation. In Proceedings of the 2019 9th International Conference on Computer and Knowledge Engineering (ICCKE), Mashhad, Iran, 24–25 October 2019; pp. 269–275. [Google Scholar]
- Medical Imaging Data Resource Center (MIDRC)|RSNA. Available online: https://www.rsna.org/COVID-19/COVID-19-ricord (accessed on 5 May 2022).
- Gunraj, H.; Sabri, A.; Koff, D.; Wong, A. COVID-Net CT-2: Enhanced Deep Neural Networks for Detection of COVID-19 From Chest CT Images Through Bigger, More Diverse Learning. Front. Med. 2021, 8, 729287. [Google Scholar] [CrossRef]
- El-Shafai, W.; El-Samie, F.A. Extensive COVID-19 X-ray and CT Chest Images Dataset. Mendeley Data 2020. Available online: https://data.mendeley.com/datasets/8h65ywd2jr/3 (accessed on 5 May 2022). [CrossRef]
- Morozov, S.; Andreychenko, A.; Blokhin, I.; Vladzymyrskyy, A.; Gelezhe, P.; Gombolevskiy, V.; Gonchar, A.; Ledikhova, N.; Pavlov, N.; Chernina, V. MosMedData: Chest CT Scans with COVID-19 Related Findings. 2020. Available online: https://www.kaggle.com/datasets/andrewmvd/mosmed-covid19-ct-scans (accessed on 5 May 2022).
- Yang, X.; Diego, U.S.; Zhao, U.S.D.J.; Zhang, U.S.D.Y.; Zhang, U.S.D.S.; Xie, P. COVID-CT-Dataset: A CT Scan Dataset about COVID-19. arXiv 2020, arXiv:2003.13865. [Google Scholar] [CrossRef]
- Clinically Applicable AI System for Accurate Diagnosis, Quantitative Measurements, and Prognosis of COVID-19 Pneumonia Using Computed Tomography. Cell 2020, 181, 1423–1433. [CrossRef]
- COVID-19—Medical Segmentation. Available online: https://medicalsegmentation.com/covid19/ (accessed on 5 May 2022).
- Jun, M.; Cheng, G.; Yixin, W.; Xingle, A.; Jiantao, G.; Ziqi, Y.; Minqing, Z.; Xin, L.; Xueyuan, D.; Shucheng, C.; et al. COVID-19 CT Lung and Infection Segmentation Dataset; CERN European Organization for Nuclear Research: Geneva, Switzerland, 2020. [Google Scholar] [CrossRef]
- CoronaHack -Chest X-Ray-Dataset|Kaggle. Available online: https://www.kaggle.com/datasets/praveengovi/coronahack-chest-xraydataset (accessed on 5 May 2022).
- Cohen, J.P.; Morrison, P.; Dao, L.; Roth, K.; Duong, T.Q.; Ghassemi, M. COVID-19 Image Data Collection: Prospective Predictions Are the Future. arXiv 2020, arXiv:2006.11988. [Google Scholar]
- Rahman, T.; Khandakar, A.; Qiblawey, Y.; Tahir, A.; Kiranyaz, S.; Kashem, S.B.A.; Islam, M.T.; Maadeed, S.A.; Zughaier, S.M.; Khan, M.S.; et al. Exploring the effect of image enhancement techniques on COVID-19 detection using chest X-ray images. Comput. Biol. Med. 2021, 132, 104319. [Google Scholar] [CrossRef] [PubMed]
- Chowdhury, M.E.; Rahman, T.; Khandakar, A.; Mazhar, R.; Kadir, M.A.; Mahbub, Z.B.; Islam, K.R.; Khan, M.S.; Iqbal, A.; Emadi, N.A.; et al. Can AI Help in Screening Viral and COVID-19 Pneumonia? IEEE Access 2020, 8, 132665–132676. [Google Scholar] [CrossRef]
- Alqudah, A.M.; Qazan, S. Augmented COVID-19 X-ray Images Dataset; Mendeley: London, UK, 2020; Volume 4. [Google Scholar] [CrossRef]
- Soares, E.; Angelov, P.; Biaso, S.; Froes, M.H.; Abe, D.K. SARS-CoV-2 CT-scan dataset: A large dataset of real patients CT scans for SARS-CoV-2 identification. medRxiv 2020. [Google Scholar] [CrossRef]
- Rahimzadeh, M.; Attar, A.; Sakhaei, S.M. A fully automated deep learning-based network for detecting COVID-19 from a new and large lung CT scan dataset. Biomed. Signal Process. Control 2021, 68, 102588. [Google Scholar] [CrossRef]
- Kermany, D.S.; Goldbaum, M.; Cai, W.; Valentim, C.C.; Liang, H.; Baxter, S.L.; McKeown, A.; Yang, G.; Wu, X.; Yan, F.; et al. Identifying Medical Diagnoses and Treatable Diseases by Image-Based Deep Learning. Cell 2018, 172, 1122–1131.e9. [Google Scholar] [CrossRef] [PubMed]
- Al-Waisy, A.S.; Al-Fahdawi, S.; Mohammed, M.A.; Abdulkareem, K.H.; Mostafa, S.A.; Maashi, M.S.; Arif, M.; Garcia-Zapirain, B. COVID-CheXNet: Hybrid deep learning framework for identifying COVID-19 virus in chest X-rays images. Soft Comput. 2020, 1–16. [Google Scholar] [CrossRef] [PubMed]
- Ebadi, A.; Xi, P.; MacLean, A.; Tremblay, S.; Kohli, S.; Wong, A. COVIDx-US – An open-access benchmark dataset of ultrasound imaging data for AI-driven COVID-19 analytics. arXiv 2021, arXiv:2103.10003. [Google Scholar] [CrossRef]
- COVID-19 Patients Lungs X ray Images 10000|Kaggle. Available online: https://www.kaggle.com/datasets/nabeelsajid917/COVID-19-x-ray-10000-images/discussion/138449 (accessed on 5 May 2022).
- COVID-19 & Normal Posteroanterior(PA) X-rays|Kaggle. Available online: https://www.kaggle.com/datasets/tarandeep97/covid19-normal-posteroanteriorpa-xrays (accessed on 5 May 2022).
- COVID-19 Image Dataset|Kaggle. Available online: https://www.kaggle.com/datasets/pranavraikokte/covid19-image-dataset (accessed on 5 May 2022).
- COVID-19 Detection X-ray Dataset|Kaggle. Available online: https://www.kaggle.com/datasets/darshan1504/covid19-detection-xray-dataset (accessed on 5 May 2022).
- Kermany, D.; Zhang, K.; Goldbaum, M. Labeled Optical Coherence Tomography (OCT) and Chest X-ray Images for Classification. Mendeley Data 2018, 2. Available online: https://data.mendeley.com/datasets/rscbjbr9sj/2 (accessed on 5 May 2022). [CrossRef]
- Chest X-ray (COVID-19 & Pneumonia)|Kaggle. Available online: https://www.kaggle.com/datasets/prashant268/chest-xray-covid19-pneumonia (accessed on 5 May 2022).
- Horry, M.J.; Chakraborty, S.; Paul, M.; Ulhaq, A.; Pradhan, B.; Saha, M.; Shukla, N. X-ray Image Based COVID-19 Detection Using Pre-Trained Deep Learning Models. Available online: https://engrxiv.org/preprint/view/937/ (accessed on 5 May 2022). [CrossRef]
- GitHub-Agchung/Actualmed-COVID-Chestxray-Dataset: Actualmed COVID-19 Chest X-ray Dataset Initiative. Available online: https://github.com/agchung/Actualmed-COVID-chestxray-dataset (accessed on 5 May 2022).
- COVID-19 Xray Dataset (Train & Test Sets)|Kaggle. Available online: https://www.kaggle.com/datasets/khoongweihao/covid19-xray-dataset-train-test-sets (accessed on 5 May 2022).
- GitHub-JordanMicahBennett-Smart CT Scan Based COVID-19 Detector: An Image Based Xray Attempt at Coronavirus2019 (covid19) Diagnosis. Available online: https://github.com/JordanMicahBennett/SMART-CT-SCAN_BASED-COVID19_VIRUS_DETECTOR/ (accessed on 5 May 2022).
- Ieracitano, C.; Mammone, N.; Versaci, M.; Varone, G.; Ali, A.R.; Armentano, A.; Calabrese, G.; Ferrarelli, A.; Turano, L.; Tebala, C.; et al. A Fuzzy-enhanced Deep Learning Approach for Early Detection of COVID-19 Pneumonia from Portable Chest X-ray Images. Neurocomputing 2022, 481, 202–215. [Google Scholar] [CrossRef] [PubMed]
- Khan, I.U.; Aslam, N.; Anwar, T.; Alsaif, H.S.; Chrouf, S.M.; Alzahrani, N.A.; Alamoudi, F.A.; Kamaleldin, M.M.A.; Awary, K.B. Using a Deep Learning Model to Explore the Impact of Clinical Data on COVID-19 Diagnosis Using Chest X-ray. Sensors 2022, 22, 669. [Google Scholar] [CrossRef]
- Kumar, A.; Mahapatra, R.P. Detection and diagnosis of COVID-19 infection in lungs images using deep learning techniques. Int. J. Imaging Syst. Technol. 2022, 32, 462–475. [Google Scholar] [CrossRef]
- Dhiman, G.; Chang, V.; Kant Singh, K.; Shankar, A. Adopt: Automatic deep learning and optimization-based approach for detection of novel coronavirus COVID-19 disease using X-ray images. J. Biomol. Struct. Dyn. 2022, 40, 5836–5847. [Google Scholar] [CrossRef]
- Darji, P.A.; Nayak, N.R.; Ganavdiya, S.; Batra, N.; Guhathakurta, R. Feature extraction with capsule network for the COVID-19 disease prediction though X-ray images. Mater. Today Proc. 2022, 56, 3556–3560. [Google Scholar] [CrossRef] [PubMed]
- Kumar, S.; Gaur, A.; Singh, K.; Shastri, S.; Mansotra, V. Deep Cp-Cxr: A Deep Learning Model for Identification of COVID-19 and Pneumonia Disease Using Chest X-ray Images. Available online: https://papers.ssrn.com/sol3/papers.cfm?abstract_id=4010398 (accessed on 5 May 2022).
- Ragab, M.; Alshehri, S.; Alhakamy, N.A.; Mansour, R.F.; Koundal, D. Multiclass Classification of Chest X-Ray Images for the Prediction of COVID-19 Using Capsule Network. Comput. Intell. Neurosci. 2022, 2022, 6185013. [Google Scholar] [CrossRef]
- Sevli, O. A deep learning-based approach for diagnosing COVID-19 on chest X-ray images, and a test study with clinical experts. Comput. Intell. 2022. Early View. [Google Scholar] [CrossRef]
- Nishio, M.; Kobayashi, D.; Nishioka, E.; Matsuo, H.; Urase, Y.; Onoue, K.; Ishikura, R.; Kitamura, Y.; Sakai, E.; Tomita, M.; et al. Deep learning model for the automatic classification of COVID-19 pneumonia, non-COVID-19 pneumonia, and the healthy: A multi-center retrospective study. Sci. Rep. 2022, 12, 8214. [Google Scholar] [CrossRef] [PubMed]
- Yildirim, M.; Eroğlu, O.; Eroğlu, Y.; Çinar, A.; Cengil, E. COVID-19 Detection on Chest X-ray Images with the Proposed Model Using Artificial Intelligence and Classifiers. New Gener. Comput. 2022, 1–15. [Google Scholar] [CrossRef]
- Sharma, A.; Singh, K.; Koundal, D. A novel fusion based convolutional neural network approach for classification of COVID-19 from chest X-ray images. Biomed. Signal Process. Control 2022, 77, 103778. [Google Scholar] [CrossRef] [PubMed]
- Xu, W.; Chen, B.; Shi, H.; Tian, H.; Xu, X. Real-time COVID-19 detection over chest X-ray images in edge computing. Comput. Intell. 2022. Early View. [Google Scholar] [CrossRef]
- Rajawat, N.; Hada, B.S.; Meghawat, M.; Lalwani, S.; Kumar, R. C-COVIDNet: A CNN Model for COVID-19 Detection Using Image Processing. Arab. J. Sci. Eng. 2022, 1–12. [Google Scholar] [CrossRef]
- Musha, A.; Al Mamun, A.; Tahabilder, A.; Hossen, M.; Jahan, B.; Ranjbari, S. A deep learning approach for COVID-19 and pneumonia detection from chest X-ray images. Int. J. Electr. Comput. Eng. 2022, 12, 2088–8708. [Google Scholar] [CrossRef]
- Aftab, M.; Amin, R.; Koundal, D.; Aldabbas, H.; Alouffi, B.; Iqbal, Z. Research Article Classification of COVID-19 and Influenza Patients Using Deep Learning. Contrast Media Mol. Imaging 2022, 2022, 8549707. [Google Scholar] [CrossRef]
- Sajun, A.R.; Zualkernan, I.; Sankalpa, D. Investigating the Performance of FixMatch for COVID-19 Detection in Chest X-rays. Appl. Sci. 2022, 12, 4694. [Google Scholar] [CrossRef]
- Xue, Y.; Onzo, B.M.; Mansour, R.F.; Su, S. Deep Convolutional Neural Network Approach for COVID-19 Detection. Comput. Syst. Sci. Eng. 2022, 42, 201–211. [Google Scholar] [CrossRef]
- Canario, D.A.H.; Fromke, E.; Patetta, M.A.; Eltilib, M.T.; Reyes-Gonzalez, J.P.; Rodriguez, G.C.; Cornejo, V.A.F.; Dunckner, S.; Stewart, J.K. Using artificial intelligence to risk stratify COVID-19 patients based on chest X-ray findings. Intell. Based Med. 2022, 6, 100049. [Google Scholar] [CrossRef]
- Amin, S.; Alouffi, B.; Uddin, M.I.; Alosaimi, W. Optimizing Convolutional Neural Networks with Transfer Learning for Making Classification Report in COVID-19 Chest X-rays Scans. Sci. Program. 2022, 2022, 5145614. [Google Scholar] [CrossRef]
- El-Dahshan, E.S.A.; Bassiouni, M.M.; Hagag, A.; Chakrabortty, R.K.; Loh, H.; Acharya, U.R. RESCOVIDTCNnet: A residual neural network-based framework for COVID-19 detection using TCN and EWT with chest X-ray images. Expert Syst. Appl. 2022, 204, 117410. [Google Scholar] [CrossRef]
- Shah, V.; Keniya, R.; Shridharani, A.; Punjabi, M.; Shah, J.; Mehendale, N. Diagnosis of COVID-19 using CT scan images and deep learning techniques. Emerg. Radiol. 2021, 28, 497–505. [Google Scholar] [CrossRef]
- Loddo, A.; Pili, F.; Di Ruberto, C. Deep Learning for COVID-19 Diagnosis from CT Images. Appl. Sci. 2021, 11, 8227. [Google Scholar] [CrossRef]
- Hussain, E.; Hasan, M.; Rahman, M.A.; Lee, I.; Tamanna, T.; Parvez, M.Z. CoroDet: A deep learning based classification for COVID-19 detection using chest X-ray images. Chaos Solitons Fractals 2021, 142, 110495. [Google Scholar] [CrossRef]
- Chouat, I.; Echtioui, A.; Khemakhem, R.; Zouch, W.; Ghorbel, M.; Hamida, A.B. COVID-19 detection in CT and CXR images using deep learning models. Biogerontology 2022, 23, 65–84. [Google Scholar] [CrossRef] [PubMed]
- Kumar, N.; Hashmi, A.; Gupta, M.; Kundu, A. Automatic Diagnosis of COVID-19 Related Pneumonia from CXR and CT-Scan Images. Eng. Technol. Appl. Sci. Res. 2022, 12, 7993–7997. [Google Scholar] [CrossRef]
- Rehman, A.; Sadad, T.; Saba, T.; Hussain, A.; Tariq, U. Real-time diagnosis system of COVID-19 using X-ray images and deep learning. It Prof. 2021, 23, 57–62. [Google Scholar] [CrossRef] [PubMed]
- Zhao, W.; Jiang, W.; Qiu, X. Deep learning for COVID-19 detection based on CT images. Sci. Rep. 2021, 11, 14353. [Google Scholar] [CrossRef] [PubMed]
- Song, Y.; Zheng, S.; Li, L.; Zhang, X.; Zhang, X.; Huang, Z.; Chen, J.; Wang, R.; Zhao, H.; Chong, Y.; et al. Deep Learning Enables Accurate Diagnosis of Novel Coronavirus (COVID-19) With CT Images. IEEE/ACM Trans. Comput. Biol. Bioinform. 2021, 18, 2775–2780. [Google Scholar] [CrossRef]
- Zhu, Z.; Xingming, Z.; Tao, G.; Dan, T.; Li, J.; Chen, X.; Li, Y.; Zhou, Z.; Zhang, X.; Zhou, J.; et al. Classification of COVID-19 by compressed chest CT image through deep learning on a large patients cohort. Interdiscip. Sci. Comput. Life Sci. 2021, 13, 73–82. [Google Scholar] [CrossRef]
- Ahuja, S.; Panigrahi, B.K.; Dey, N.; Rajinikanth, V.; Gandhi, T.K. Deep transfer learning-based automated detection of COVID-19 from lung CT scan slices. Appl. Intell. 2021, 51, 571–585. [Google Scholar] [CrossRef]
- Wang, S.; Kang, B.; Ma, J.; Zeng, X.; Xiao, M.; Guo, J.; Cai, M.; Yang, J.; Li, Y.; Meng, X.; et al. A deep learning algorithm using CT images to screen for Corona Virus Disease (COVID-19). Eur. Radiol. 2021, 31, 6096–6104. [Google Scholar] [CrossRef]
- Hassan, E.; Shams, M.Y.; Hikal, N.A.; Elmougy, S. Detecting COVID-19 in Chest CT Images Based on Several Pre-Trained Models; Research Square: Durham, NC, USA, 2022. [Google Scholar]
- Singh, V.K.; Kolekar, M.H. Deep learning empowered COVID-19 diagnosis using chest CT scan images for collaborative edge-cloud computing platform. Multimed. Tools Appl. 2022, 81, 3–30. [Google Scholar] [CrossRef]
- Wu, X.; Chen, C.; Zhong, M.; Wang, J.; Shi, J. COVID-AL: The diagnosis of COVID-19 with deep active learning. Med. Image Anal. 2021, 68, 101913. [Google Scholar] [CrossRef]
- Kaur, T.; Gandhi, T.K. Classifier Fusion for Detection of COVID-19 from CT Scans. Circuits Syst. Signal Process. 2022, 41, 3397–3414. [Google Scholar] [CrossRef]
- Velichko, E.; Shariaty, F.; Orooji, M.; Pavlov, V.; Pervunina, T.; Zavjalov, S.; Khazaei, R.; Radmard, A.R. Development of computer-aided model to differentiate COVID-19 from pulmonary edema in lung CT scan: EDECOVID-net. Comput. Biol. Med. 2022, 141, 105172. [Google Scholar] [CrossRef] [PubMed]
- Alajmi, M.; Elshakankiry, O.A.; El-Shafai, W.; El-Sayed, H.S.; Sallam, A.I.; El-Hoseny, H.M.; Faragallah, O.S. Smart and Automated Diagnosis of COVID-19 Using Artificial Intelligence Techniques. Intell. Autom. Soft Comput. 2022, 32, 1403–1413. [Google Scholar] [CrossRef]
- Fazle Rabbi, M.; Mahedy Hasan, S.M.; Champa, A.I.; Rifat Hossain, M.; Asif Zaman, M. A Convolutional Neural Network Model for Screening COVID-19 Patients Based on CT Scan Images. In Proceedings of the International Conference on Big Data, IoT, and Machine Learning; Arefin, M.S., Kaiser, M.S., Bandyopadhyay, A., Ahad, M.A.R., Ray, K., Eds.; Springer: Singapore, 2022; pp. 141–151. [Google Scholar]
- El Idrissi, E.B.Y.; Otman, A. Transfer Learning for Automatic Detection of COVID-19 Disease in Medical Chest X-ray Images. Available online: http://www.iaeng.org/IJCS/issues_v49/issue_2/IJCS_49_2_09.pdf (accessed on 5 May 2022).
- Mannepalli, D.P.; Namdeo, V. An effective detection of COVID-19 using adaptive dual-stage horse herd bidirectional long short-term memory framework. Int. J. Imaging Syst. Technol. 2022, 32, 1049–1067. [Google Scholar] [CrossRef]
- Serte, S.; Dirik, M.A.; Al-Turjman, F. Deep Learning Models for COVID-19 Detection. Sustainability 2022, 14, 5820. [Google Scholar] [CrossRef]
- Mahmoudi, R.; Benameur, N.; Mabrouk, R.; Mohammed, M.A.; Garcia-Zapirain, B.; Bedoui, M.H. A Deep Learning-Based Diagnosis System for COVID-19 Detection and Pneumonia Screening Using CT Imaging. Appl. Sci. 2022, 12, 4825. [Google Scholar] [CrossRef]
- Vijayakumari, B.; Ramya, S. Deep Learning Based COVID-19 Diagnosis Using Lung Images; Research Square: Durham, NC, USA, 2022. [Google Scholar]
- Zhang, H.; Liang, W.; Li, C.; Xiong, Q.; Shi, H.; Hu, L.; Li, G. DCML: Deep Contrastive Mutual Learning for COVID-19 Recognition. Biomed. Signal Process. Control 2022, 77, 103770. [Google Scholar] [CrossRef]
- Owais, M.; Baek, N.R.; Park, K.R. DMDF-Net: Dual Multiscale Dilated Fusion Network for Accurate Segmentation of Lesions Related to COVID-19 in Lung Radiographic Scans. Expert Syst. Appl. 2022, 202, 117360. [Google Scholar] [CrossRef]
- El Biach, F.Z.; Imad, I.; Laanaya, H.; Minaoui, K. CovSeg-Unet: End-to-End Method-based Computer-Aided Decision Support System in Lung COVID-19 Detection on CT Images. Int. J. Adv. Comput. Sci. Appl. 2022, 13. [Google Scholar] [CrossRef]
- Tani, T.B.; Afroz, T.; Khaliluzzaman, M. Deep Learning Based Model for COVID-19 Pneumonia Prediction with Pulmonary CT Images. In Computational Intelligence in Machine Learning; Kumar, A., Zurada, J.M., Gunjan, V.K., Balasubramanian, R., Eds.; Springer: Singapore, 2022; pp. 365–379. [Google Scholar]
- Li, J. CT-Based Quantitative Assessment of Coronavirus Disease 2019 Using a Deep Learning-Based Segmentation System: A Longitudinal Study; Research Square: Durham, NC, USA, 2021. [Google Scholar] [CrossRef]
- Vinod, D.N.; Jeyavadhanam, B.R.; Zungeru, A.M.; Prabaharan, S. Fully automated unified prognosis of COVID-19 chest X-ray/CT scan images using Deep Covix-Net model. Comput. Biol. Med. 2021, 136, 104729. [Google Scholar] [CrossRef]
- Biswas, S.; Chatterjee, S.; Majee, A.; Sen, S.; Schwenker, F.; Sarkar, R. Prediction of COVID-19 from chest ct images using an ensemble of deep learning models. Appl. Sci. 2021, 11, 7004. [Google Scholar] [CrossRef]
- Jangam, E.; Barreto, A.A.D.; Annavarapu, C.S.R. Automatic detection of COVID-19 from chest CT scan and chest X-rays images using deep learning, transfer learning and stacking. Appl. Intell. 2022, 52, 2243–2259. [Google Scholar] [CrossRef] [PubMed]
- Mouhafid, M.; Salah, M.; Yue, C.; Xia, K. Deep Ensemble Learning-Based Models for Diagnosis of COVID-19 from Chest CT Images. Healthcare 2022, 10, 166. [Google Scholar] [CrossRef] [PubMed]
- Ravi, V.; Narasimhan, H.; Chakraborty, C.; Pham, T.D. Deep learning-based meta-classifier approach for COVID-19 classification using CT scan and chest X-ray images. Multimed. Syst. 2021, 1–15. [Google Scholar] [CrossRef]
- de Santana, M.A.; Gomes, J.C.; de Freitas Barbosa, V.A.; de Lima, C.L.; Bandeira, J.; Valença, M.J.S.; de Souza, R.E.; Masood, A.I.; dos Santos, W.P. An Intelligent Tool to Support Diagnosis of COVID-19 by Texture Analysis of Computerized Tomography X-ray Images and Machine Learning. In Assessing COVID-19 and Other Pandemics and Epidemics Using Computational Modelling and Data Analysis; Pani, S.K., Dash, S., dos Santos, W.P., Chan Bukhari, S.A., Flammini, F., Eds.; Springer International Publishing: Cham, Switzerland, 2022; pp. 259–282. [Google Scholar] [CrossRef]
- Ahmad, F.H.; Wady, S.H. COVID-19 Infection Detection from Chest X-Ray Images Using Feature Fusion and Machine Learning. Sci. J. Cihan Univ. Sulaimaniya 2022, 5, 10–30. [Google Scholar] [CrossRef]
- Amini, N.; Shalbaf, A. Automatic classification of severity of COVID-19 patients using texture feature and random forest based on computed tomography images. Int. J. Imaging Syst. Technol. 2022, 32, 102–110. [Google Scholar] [CrossRef] [PubMed]
- Development of a Machine Learning-Assisted Model for the Early Detection of Severe COVID-19 Cases Combining Blood Test and Quantitative Computed Tomography Parameters. J. Med. Imaging Health Inf. 2021, 11, 2747–2753. [CrossRef]
- Al-jumaili, S.; Duru, D.G.; Ucan, B.; Uçan, O.N.; Duru, A.D. Classification of COVID-19 Effected CT Images Using a Hybrid Approach Based on Deep Transfer Learning and Machine Learning; Research Square: Durham, NC, USA, 2022. [Google Scholar]
- Kong, L.; Cheng, J. Classification and detection of COVID-19 X-Ray images based on DenseNet and VGG16 feature fusion. Biomed. Signal Process. Control 2022, 77, 103772. [Google Scholar] [CrossRef]
- Khalaf, Z.A.; Hammadi, S.S.; Mousa, A.K.; Ali, H.M.; Alnajar, H.R.; Mohsin, R.H. Coronavirus disease 2019 detection using deep features learning. Int. J. Electr. Comput. Eng. 2022, 12, 2088–8708. [Google Scholar] [CrossRef]
- Ibrahim, D.A.; Zebari, D.A.; Mohammed, H.J.; Mohammed, M.A. Effective hybrid deep learning model for COVID-19 patterns identification using CT images. Expert Syst. 2022, e13010, Early View. [Google Scholar] [CrossRef]
- Roy, P.K.; Kumar, A. Early prediction of COVID-19 using ensemble of transfer learning. Comput. Electr. Eng. 2022, 101, 108018. [Google Scholar] [CrossRef] [PubMed]
- Butler, L.; Karabayir, I.; Samie Tootooni, M.; Afshar, M.; Goldberg, A.; Akbilgic, O. Image and structured data analysis for prognostication of health outcomes in patients presenting to the ED during the COVID-19 pandemic. Int. J. Med. Inf. 2022, 158, 104662. [Google Scholar] [CrossRef] [PubMed]
- Bhandari, S.; Singh, A.S.; Tak, A.; Patel, B.; Gupta, J.; Gupta, K.; Kakkar, S.; Darshan, K.S.; Arora, A.; Dube, A. Independent role of CT chest scan in COVID-19 prognosis: Evidence from the machine learning classification. Scr. Med. 2021, 52, 273–278. [Google Scholar] [CrossRef]
- Durrani, N.; Vukovic, D.; Antico, M.; Burgt, J.v.d.; van Sloun, R.J.; Demi, L.; Canty, D.; Wang, A.; Royse, A.; Royse, C.; et al. Automatic Deep Learning-Based Consolidation/Collapse Classification in Lung Ultrasound Images for COVID-19 Induced Pneumonia; TechRxiv powered by IEEE; 2022; Available online: https://www.techrxiv.org/articles/preprint/Automatic_Deep_Learning-Based_Consolidation_Collapse_Classification_in_Lung_Ultrasound_Images_for_COVID-19_Induced_Pneumonia/17912387 (accessed on 28 June 2022).
- Krishnaswamy, D.; Ebadi, S.; Seyed Bolouri, S.; Zonoobi, D.; Greiner, R.; Meuser-Herr, N.; Jaremko, J.; Kapur, J.; Noga, M.; Punithakumar, K. A novel machine learning-based video classification approach to detect pneumonia in COVID-19 patients using lung ultrasound. Int. J. Noncommun. Dis. 2021, 6, 69–75. [Google Scholar] [CrossRef]
- Diaz-Escobar, J.; Ordó nez-Guillén, N.E.; Villarreal-Reyes, S.; Galaviz-Mosqueda, A.; Kober, V.; Rivera-Rodriguez, R.; Rizk, J.E.L. Deep-learning based detection of COVID-19 using lung ultrasound imagery. PLoS ONE 2021, 16, e0255886. [Google Scholar] [CrossRef]
- Shan, F.; Gao, Y.; Wang, J.; Shi, W.; Shi, N.; Han, M.; Xue, Z.; Shen, D.; Shi, Y. Abnormal lung quantification in chest CT images of COVID-19 patients with deep learning and its application to severity prediction. Med. Phys. 2021, 48, 1633–1645. [Google Scholar] [CrossRef]
- Lassau, N.; Ammari, S.; Chouzenoux, E.; Gortais, H.; Herent, P.; Devilder, M.; Soliman, S.; Meyrignac, O.; Talabard, M.P.; Lamarque, J.P.; et al. Integrating deep learning CT-scan model, biological and clinical variables to predict severity of COVID-19 patients. Nat. Commun. 2021, 12, 634. [Google Scholar] [CrossRef]
- Wynants, L.; Van Calster, B.; Collins, G.S.; Riley, R.D.; Heinze, G.; Schuit, E.; Bonten, M.M.; Dahly, D.L.; Damen, J.A.; Debray, T.P.; et al. Prediction models for diagnosis and prognosis of COVID-19: Systematic review and critical appraisal. BMJ 2020, 369. [Google Scholar] [CrossRef] [Green Version]
- Schöning, V.; Liakoni, E.; Baumgartner, C.; Exadaktylos, A.K.; Hautz, W.E.; Atkinson, A.; Hammann, F. Development and validation of a prognostic COVID-19 severity assessment (COSA) score and machine learning models for patient triage at a tertiary hospital. J. Transl. Med. 2021, 19, 56. [Google Scholar] [CrossRef]
- Subudhi, S.; Verma, A.; Patel, A.B.; Hardin, C.C.; Khandekar, M.J.; Lee, H.; McEvoy, D.; Stylianopoulos, T.; Munn, L.L.; Dutta, S.; et al. Comparing machine learning algorithms for predicting ICU admission and mortality in COVID-19. NPJ Digit. Med. 2021, 4, 87. [Google Scholar] [CrossRef]
- Fernandes, F.T.; de Oliveira, T.A.; Teixeira, C.E.; de Moraes Batista, A.F.; Dalla Costa, G.; Chiavegatto Filho, A.D.P. A multipurpose machine learning approach to predict COVID-19 negative prognosis in S ao Paulo, Brazil. Sci. Rep. 2021, 11, 3343. [Google Scholar] [CrossRef] [PubMed]
- Shamout, F.E.; Shen, Y.; Wu, N.; Kaku, A.; Park, J.; Makino, T.; Jastrzębski, S.; Witowski, J.; Wang, D.; Zhang, B.; et al. An artificial intelligence system for predicting the deterioration of COVID-19 patients in the emergency department. NPJ Digit. Med. 2021, 4, 80. [Google Scholar] [CrossRef]
- Fang, C.; Bai, S.; Chen, Q.; Zhou, Y.; Xia, L.; Qin, L.; Gong, S.; Xie, X.; Zhou, C.; Tu, D.; et al. Deep learning for predicting COVID-19 malignant progression. Med. Image Anal. 2021, 72, 102096. [Google Scholar] [CrossRef] [PubMed]
- Arvind, V.; Kim, J.S.; Cho, B.H.; Geng, E.; Cho, S.K. Development of a machine learning algorithm to predict intubation among hospitalized patients with COVID-19. J. Crit. Care 2021, 62, 25–30. [Google Scholar] [CrossRef] [PubMed]
- Booth, A.L.; Abels, E.; McCaffrey, P. Development of a prognostic model for mortality in COVID-19 infection using machine learning. Mod. Pathol. 2021, 34, 522–531. [Google Scholar] [CrossRef] [PubMed]
- Navlakha, S.; Morjaria, S.; Perez-Johnston, R.; Zhang, A.; Taur, Y. Projecting COVID-19 disease severity in cancer patients using purposefully-designed machine learning. BMC Infect. Dis. 2021, 21, 391. [Google Scholar] [CrossRef]
- Huang, L.; Han, R.; Ai, T.; Yu, P.; Kang, H.; Tao, Q.; Xia, L. Serial quantitative chest ct assessment of COVID-19: A deep learning approach. Radiol. Cardiothorac. Imaging 2020, 2, e200075. [Google Scholar] [CrossRef] [PubMed] [Green Version]
- Cao, Y.; Xu, Z.; Feng, J.; Jin, C.; Han, X.; Wu, H.; Shi, H. Longitudinal assessment of COVID-19 using a deep learning–based quantitative ct pipeline: Illustration of two cases. Radiol. Cardiothorac. Imaging 2020, 2, e200082. [Google Scholar] [CrossRef] [Green Version]
- Shu, M.; Bowen, R.S.; Herrmann, C.; Qi, G.; Santacatterina, M.; Zabih, R. Deep survival analysis with longitudinal X-rays for COVID-19. In Proceedings of the IEEE/CVF International Conference on Computer Vision, Virtual, 11–17 October 2021; pp. 4046–4055. [Google Scholar]
- Kim, S.T.; Goli, L.; Paschali, M.; Khakzar, A.; Keicher, M.; Czempiel, T.; Burian, E.; Braren, R.; Navab, N.; Wendler, T. Longitudinal Quantitative Assessment of COVID-19 Infection Progression from Chest CTs. In Medical Image Computing and Computer Assisted Intervention–MICCAI 2021; Lecture Notes in Computer Science; Springer: Berlin, Germany, 2021; Volume 12907, pp. 273–282. [Google Scholar] [CrossRef]
- Pan, F.; Li, L.; Liu, B.; Ye, T.; Li, L.; Liu, D.; Ding, Z.; Chen, G.; Liang, B.; Yang, L.; et al. A novel deep learning-based quantification of serial chest computed tomography in Coronavirus Disease 2019 (COVID-19). Sci. Rep. 2021, 11, 417. [Google Scholar] [CrossRef]
- Pu, J.; Leader, J.K.; Bandos, A.; Ke, S.; Wang, J.; Shi, J.; Du, P.; Guo, Y.; Wenzel, S.E.; Fuhrman, C.R.; et al. Automated quantification of COVID-19 severity and progression using chest CT images. Eur. Radiol. 2021, 31, 436–446. [Google Scholar] [CrossRef] [PubMed]
- Foo, M.X.L.; Kim, S.T.; Paschali, M.; Goli, L.; Burian, E.; Makowski, M.; Braren, R.; Navab, N.; Wendler, T. Interactive Segmentation for COVID-19 Infection Quantification on Longitudinal CT scans. arXiv 2021, arXiv:2110.00948. [Google Scholar]
- Tang, L.; Tian, C.; Meng, Y.; Xu, K. Longitudinal evaluation for COVID-19 chest CT disease progression based on Tchebichef moments. Int. J. Imaging Syst. Technol. 2021, 31, 1120–1127. [Google Scholar] [CrossRef] [PubMed]
- Zhou, K.; Sun, Y.; Li, L.; Zang, Z.; Wang, J.; Li, J.; Liang, J.; Zhang, F.; Zhang, Q.; Ge, W.; et al. Eleven routine clinical features predict COVID-19 severity uncovered by machine learning of longitudinal measurements. Comput. Struct. Biotechnol. J. 2021, 19, 3640–3649. [Google Scholar] [CrossRef] [PubMed]
- Czempiel, T.; Rogers, C.; Keicher, M.; Paschali, M.; Braren, R.; Burian, E.; Makowski, M.; Navab, N.; Wendler, T.; Kim, S.T. Longitudinal Self-Supervision for COVID-19 Pathology Quantification. arXiv 2022, arXiv:2203.10804. [Google Scholar] [CrossRef]
- Liu, J.; Wang, Y.; He, G.; Wang, X.; Sun, M. Quantitative CT comparison between COVID-19 and mycoplasma pneumonia suspected as COVID-19: A longitudinal study. BMC Med. Imaging 2022, 22, 21. [Google Scholar] [CrossRef]
- Cheng, J.; Sollee, J.; Hsieh, C.; Yue, H.; Vandal, N.; Shanahan, J.; Choi, J.W.; Tran, T.M.L.; Halsey, K.; Iheanacho, F.; et al. COVID-19 mortality prediction in the intensive care unit with deep learning based on longitudinal chest X-rays and clinical data. Eur. Radiol. 2022, 32, 4446–4456. [Google Scholar] [CrossRef] [PubMed]
- Han, X.; Yu, Z.; Zhuo, Y.; Zhao, B.; Ren, Y.; Lamm, L.; Xue, X.; Feng, J.; Marr, C.; Shan, F.; et al. The value of longitudinal clinical data and paired CT scans in predicting the deterioration of COVID-19 revealed by an artificial intelligence system. iScience 2022, 25, 104227. [Google Scholar] [CrossRef]
- Gong, K.; Wu, D.; Arru, C.D.; Homayounieh, F.; Neumark, N.; Guan, J.; Buch, V.; Kim, K.; Bizzo, B.C.; Ren, H.; et al. A multi-center study of COVID-19 patient prognosis using deep learning-based CT image analysis and electronic health records. Eur. J. Radiol. 2021, 139, 109583. [Google Scholar] [CrossRef]
- Lee, E.H.; Zheng, J.; Colak, E.; Mohammadzadeh, M.; Houshmand, G.; Bevins, N.; Kitamura, F.; Altinmakas, E.; Reis, E.P.; Kim, J.K.; et al. Deep COVID DeteCT: An international experience on COVID-19 lung detection and prognosis using chest CT. Npj Digit. Med. 2021, 4, 11. [Google Scholar] [CrossRef]
- Shiri, I.; Salimi, Y.; Pakbin, M.; Hajianfar, G.; Avval, A.H.; Sanaat, A.; Mostafaei, S.; Akhavanallaf, A.; Saberi, A.; Mansouri, Z.; et al. COVID-19 prognostic modeling using CT radiomic features and machine learning algorithms: Analysis of a multi-institutional dataset of 14,339 patients. Comput. Biol. Med. 2022, 145, 105467. [Google Scholar] [CrossRef] [PubMed]
- Wang, S.; Dong, D.; Li, L.; Li, H.; Bai, Y.; Hu, Y.; Huang, Y.; Yu, X.; Liu, S.; Qiu, X.; et al. A Deep Learning Radiomics Model to Identify Poor Outcome in COVID-19 Patients With Underlying Health Conditions: A Multicenter Study. IEEE J. Biomed. Health Inf. 2021, 25, 2353–2362. [Google Scholar] [CrossRef] [PubMed]
- Karthik, R.; Menaka, R.; Hariharan, M.; Won, D. CT-based severity assessment for COVID-19 using weakly supervised non-local CNN. Appl. Soft Comput. 2022, 121, 108765. [Google Scholar] [CrossRef] [PubMed]
- Rana, A.; Singh, H.; Mavuduru, R.; Pattanaik, S.; Rana, P.S. Quantifying prognosis severity of COVID-19 patients from deep learning based analysis of CT chest images. Multimed. Tools Appl. 2022, 81, 18129–18153. [Google Scholar] [CrossRef] [PubMed]
- Bartoli, A.; Fournel, J.; Maurin, A.; Marchi, B.; Habert, P.; Castelli, M.; Gaubert, J.Y.; Cortaredona, S.; Lagier, J.C.; Million, M.; et al. Value and prognostic impact of a deep learning segmentation model of COVID-19 lung lesions on low-dose chest CT. Res. Diagn. Interv. Imaging 2022, 1, 100003. [Google Scholar] [CrossRef]
- Ortiz, A.; Trivedi, A.; Desbiens, J.; Blazes, M.; Robinson, C.; Gupta, S.; Dodhia, R.; Bhatraju, P.K.; Liles, W.C.; Lee, A.; et al. Effective deep learning approaches for predicting COVID-19 outcomes from chest computed tomography volumes. Sci. Rep. 2022, 12, 1716. [Google Scholar] [CrossRef]
- Balaha, H.M.; El-Gendy, E.M.; Saafan, M.M. A complete framework for accurate recognition and prognosis of COVID-19 patients based on deep transfer learning and feature classification approach. Artif. Intell. Rev. 2022, 55, 5063–5108. [Google Scholar] [CrossRef] [PubMed]
- Vidyaranya Nuthalapati, S.; Vizcaychipi, M.; Shah, P.; Chudzik, P.; Hau Leow, C.; Yousefi, P.; Selim, A.; Tait, K.; Irving, B. Using Deep Learning-based Features Extracted from CT scans to Predict Outcomes in COVID-19 Patients. arXiv 2022, arXiv:2205.05009. [Google Scholar]
- Xiong, Y.; Ma, Y.; Ruan, L.; Li, D.; Lu, C.; Huang, L.; The National Traditional Chinese Medicine Medical Team. Comparing different machine learning techniques for predicting COVID-19 severity. Infect. Dis. Poverty 2022, 11, 19. [Google Scholar] [CrossRef]
- Sinha, A.; Joshi, S.P.; Das, P.S.; Jana, S.; Sarkar, R. An ML prediction model based on clinical parameters and automated CT scan features for COVID-19 patients. Sci. Rep. 2022, 12, 11255. [Google Scholar] [CrossRef]
- Khozeimeh, F.; Sharifrazi, D.; Izadi, N.H.; Joloudari, J.H.; Shoeibi, A.; Alizadehsani, R.; Gorriz, J.M.; Hussain, S.; Sani, Z.A.; Moosaei, H.; et al. Combining a convolutional neural network with autoencoders to predict the survival chance of COVID-19 patients. Sci. Rep. 2021, 11, 15343. [Google Scholar] [CrossRef]
- Swapnarekha, H.; Behera, H.S.; Nayak, J.; Naik, B. Covid CT-net: A deep learning framework for COVID-19 prognosis using CT images. J. Interdiscip. Math. 2021, 24, 327–352. [Google Scholar] [CrossRef]
- Demichev, V.; Tober-Lau, P.; Lemke, O.; Nazarenko, T.; Thibeault, C.; Whitwell, H.; Röhl, A.; Freiwald, A.; Szyrwiel, L.; Ludwig, D.; et al. A time-resolved proteomic and prognostic map of COVID-19. Cell Syst. 2021, 12, 780–794. [Google Scholar] [CrossRef] [PubMed]


| Dataset Name | Modality | Size of Dataset | Link to Dataset | |
|---|---|---|---|---|
| 1a | CT | 120 | [25] | |
| RICORD | 1b | CT | 120 | |
| 1c | CXR | 998 | ||
| COVIDx CT | 2a | CT | 194,922 | [26] |
| 2b | CT | 201,103 | ||
| Extensive COVID-19 chest X-ray and CT chest images dataset | CXR | 9544 | [27] | |
| CT | 8055 | |||
| MosMed | CT | 1000 | [28] | |
| COVID-CT | CT | 812 | [29] | |
| China Consortium of Chest CT Image Investigation (CC-CCII) | CT | 514,103 | [30] | |
| COVID-19 CT segmentation dataset | CT | 929 | [31] | |
| COVID-19 CT lung and infection segmentation dataset | CT | 20 | [32] | |
| CoronaHack chest X-ray dataset | CXR | 5910 | [33,34] | |
| COVIDx CT-2A | CT | 194,922 | [26] | |
| COVID-19 radiography database | CXR | 21,165 | [35,36] | |
| COVID-19 image data collection | CXR | 1000 | [34] | |
| Augmented COVID-19 X-ray images dataset | CXR | 1824 | [37] | |
| SARS-CoV-2 CT scan dataset | CT | 2482 | [38] | |
| COVID-CT set | CT | 63,849 | [39] | |
| Chest X-Ray images (Pneumonia) | CXR | 5863 | [40] | |
| COVID-19-vs-normal dataset | CXR | 800 | [41] | |
| COVIDx-US | LUS | 12,943 + 150 videos | [42] | |
| COVID-19 patients lungs X-ray images 10,000 | CXR | 3428 | [34,40,43] | |
| COVID-19 & normal posteroanterior (PA) X-ray | CXR | 280 | [44] | |
| COVID-19 image dataset | CXR | 317 | [45] | |
| COVID-19 X-ray classifier | CXR | 407 | [34,40] | |
| COVID-19-CT-Seg | CT | 20 | [32] | |
| COVID-19 detection X-ray dataset | CXR | 3071 | [34,46,47] | |
| Chest X-ray (COVID-19 & Pneumonia) | CXR | 6432 | [34,40,48] | |
| SegmentedLungCXRs | CXR | 342 | [49] | |
| Actualmed COVID-19 chest X-ray dataset initiative | CXR | 238 | [50] | |
| COVID-19 X-ray dataset (Train & Test Sets) | CXR | 188 | [34,51,52] | |
| Paper | Year | Model | Goals | Accuracy |
|---|---|---|---|---|
| [53] | 2022 January | CovNNet | Image augmentation generating hybrid deep learning model for classification. | 80.90% |
| [54] | 2022 January | Join-fusion model using EfficientNetB7 | Combine clinical and CXR for binary prediction | 97% |
| [55] | 2022 January | DNN + CNN | Model does binary classification followed by segmentation | 94.60% |
| [56] | 2021 January | Hybrid model developed from 11 different CNN architectures | Binary prediction | 98.54% |
| [57] | 2021 December | XR-CAPS | Feature extraction and segmentation by using foundations of UNet | 93.20% |
| [41] | 2020 November | COVID-CheXNet | Contrast enhancement on the CXR and noise reduction techniques prior to classification | 99.99% |
| [58] | 2022 January | Deep CP-CXR | Binary classification as well as COVID-19, normal, and pneumonia | 98.57% |
| [59] | 2022 May | CapsNet | Lower-level capsules reuse features for image classification. | 89.87% avg. |
| [60] | 2022 May | Model comparison with ResNet18 producing highest accuracy | Classify healthy, COVID-19, or other viral-induced pneumonia | 97% |
| [61] | 2022 May | EfficientNet B5 transfer learning. | COVID-19, pneumonia, or normal classification | 86.67% |
| [62] | 2022 May | Feature maps utilized sequentially with MobileNetV2, EfficientNet0, and DarkNet53. | COVID-19, viral pneumonia, or normal classification | 99.05% |
| [63] | 2022 May | Fusion-based CNN, COVDC-Net | COVID-19, healthy, bacterial pneumonia, and viral pneumonia classification | 96.48% |
| [64] | 2022 April | Lightweight CNN edge computing | Image augmentation using DCGAN increase sample size for classification. | 87% |
| [65] | 2022 April | Lightweight CNN C-COVIDNet | COVID-19, pneumonia, or normal classification using ROI extraction of lungs. | 97.5% |
| [66] | 2022 April | COVID-CXDNetV2 with YOLOv2 and ResNet | Normal, COVID-19, and pneumonia classification | 97.9% |
| [68] | 2022 May | Semi-supervised deep learning. | Normal, bacterial pneumonia, COVID-19, lung opacity, and viral pneumonia classification | 81% |
| [69] | 2021 December | Traditional CNN | Identification of structural abnormalities in CXR | 97.67% |
| [70] | 2022 January | M-qXR commercial model | Risk stratification in COVID-19 diagnosis | 98% |
| [71] | 2022 May | VGG16 | COVID-19 diagnosis by incorporating image augmentations with fast timing. | 99.3% |
| [72] | 2022 April | RESCOVIDTCNnet | Model proposed after comparison with InceptionV3, ResNet50, and ResNet50-TCN | 99% |
| [67] | 2022 February | LSTM | Using LSTM architecture for classification of COVID-19 and Influenza from CXR | 98% |
| Paper | Year | Model | Goals | Accuracy |
|---|---|---|---|---|
| [73] | 2021 February | Multiple model comparison with VGG-19 having best classification accuracy | Classification of covid, normal, and pneumonia across open-source datasets | 94.52% |
| [74] | 2021 September | 98.87% | ||
| [76] | 2022 January | 90.50% | ||
| [75] | 2020 November | CoroDet | Used CT and CXR to perform multiple class-wise predictions | 91.20% |
| [77] | 2022 February | Developed a hybrid 4-layer CNN after testing eight different models | Proposed rapid real time COVID-19 detection using hybrid approach on CXR and CT | 98% |
| [78] | 2021 August | ResNet50 | Application on CXR | 98% |
| [79] | 2021 July | COVID-Net CT-2 and ResNet-v2 models | Research on both CT and CXR using COVIDx-CT dataset | 98.7% |
| [80] | 2021 March | DREnet | Pretrained ResNet 50 model | 79% precision |
| [81] | 2021 February | ResNet50 | Verified that image augmentation not necessary for COVID-19 detection and utilized compressed JPEG files. | 98.8% |
| [82] | 2020 August | ResNet 18,50, and 101 alongside SqueezeNet | Tested model on CT images showed ResNet 18 to have best results. | 99.4% |
| [39] | 2021 March | ResNet50V2 | Image preprocessing and removal of CT slices not relevant to ROI. | 98.49% |
| [83] | 2021 February | Inception-v3 model with patch-based ROI | Tissue delineation using ROI for classification | 89.5% |
| [84] | 2022 January | Model comparison InceptionV3, ResNet50, VGG16, and VGG19 | Best performance using ResNet for CT scan classification. | 98.86% |
| [85] | 2021 June | MobileNet-V2 | Purpose was to demonstrate the feasibility of light weight models in analyzing CT scans. | 85.6% |
| [86] | 2020 November | COVID-AL | Weakly-supervised COVID-19 detection module based on UNet for segmentation. | 96.8% |
| [87] | 2022 January | Pretrained ResNet18, ResNet50, and ResNet101 | Explores the feasibility of pre-trained models without providing labelled training data. | 99.4% F1 |
| [88] | 2021 December | EDECOVID-net | Uses radiomic features to differential between COVID-19 and pulmonary edema | 98% |
| [89] | 2021 December | LSTM | Applies LSTM on both CXR and CT images for classification | 97.3% |
| [90] | 2021 December | CNN-based approach | Performed binary as well as ternary classification, using CT images | 98.79% |
| [91] | 2022 June | DensNet121 (pre-trained) | Transfer-learning deep CNN with image augmentation. | 96.52% |
| [92] | 2022 May | Bidirectional LSTM | Classification using CT for normal, viral pneumonia, lung opacity, or COVID-19 | 99.07% |
| [93] | 2022 May | GAN | Combination of GAN and deep learning increased image data for training | 89% AUC |
| [94] | 2022 May | UNet | Segmentation of lung by utilizing contrast limited adaptive histogram equalization (CLAHE) | 98% |
| [95] | 2022 May | UNet | Edge detection, thresholding, and UNet are compared using IoU metric for segmentation. | 95% |
| [96] | 2022 May | DCML | Multiple preprocessing using Fast AutoAugment, data balancing steps prior to binary classification. | 98.7% |
| [97] | 2022 May | DMDF-Net | CT scan segmentation for COVID-19. Fusion of UNet and MobileNetV2. | 0.75 DICE |
| [98] | 2022 April | UNet with cross-loss function | Segmentation using image preprocessing with random window width and levelling. | 0.83 DICE |
| [100] | 2021 May | VB-Net | automatic segmentation and delineation of affected regions with COVID-19 from CT scans. | - |
| [101] | 2021 July | Deep Covix-net | Image segmentation with texture analysis using GLCM, GLDM, FFT, DWT on CT and CXR. | 97% |
| [99] | 2021 February | VGG style CNN | Evaluation of multiple deep learning model using two public and two private datasets. | 93% |
| Paper | Year | Model | Goals | Accuracy |
|---|---|---|---|---|
| [102] | 2021 July | VGG-16, ResNet50, and Xception | Grouped results for prediction of COVID-19 using CT scans | 98.79% |
| [103] | 2021 June | VGG19, ResNet101, DenseNet169, and WideResNet 50-2 | Looked at CT and CXRs and compared results with existing models on 5 datasets | 99.75% |
| [104] | 2022 January | VGG19, ResNet50, DenseNet201, Random Forest and Extra Trees | Used a Stacking and Weighted Average Ensemble (WAE) approach with these algorithms on two separate datasets | 96.65% F1 |
| [105] | 2021 July | Meta-classifer, Efficient-Net, PCA, SVM and Random Forest | Model tested on 8055 CT images and 9544 CXR for prediction of COVID-19 and normal | 99% precision |
| [106] | 2021 June | Haralick and SVM feature extractor | Binary classification on IKONOS-CT images. | 96.99% |
| [107] | 2022 April | Discriminant Analysis, Ensemble, Random Forest, and SVM | Combined ensemble approach with feature fusion for classification. | 96.18% |
| [108] | 2021 November | Using Random Forest with first and second order texture analysis. | Four levels of severity of COVID-19 | 90.95% |
| [109] | 2021 November | Random Forest | Combination of ML and Neural Network algorithms tested using multiple features along with CT images. | 91.38% |
| [110] | 2022 May | ResNet-50 and SVM. | Binary classification of COVID-19 in a hospital in Brazil. | 98.20% |
| [111] | 2022 May | Feature fusion with DenseNet, ResNet34 and VGG16 | Classification of COVID-19, pneumonia, or normal using a dataset of 6518 CXR images | 97.3% |
| [112] | 2022 April | VGG16 and SVM | Binary classification using Basrah dataset | 99% F1 |
| [113] | 2022 May | CDBN, HRNet and VGGNet feature fusion | Lung segmentation and classification. | 95% |
| [114] | 2022 April | Ensemble approach by fitting multiple deep learning models | Transfer learning to detect COVID-19 in 1000 CXR images | 100% precision |
| [115] | 2021 December | Light Gradient Boosting | Predict COVID-19 ARDS, ICU, mortality risk | 79% AUC |
| [116] | 2021 December | SVM | Feature reduction from clinical factors + CT images using multiple machine learning techniques. | 73.7% |
| [117] | 2022 April | CNN and RSTN | Binary classification of COVID-19 using lung ultrasound | 90.18% |
| [118] | 2021 November | Two-Stream Inflated 3D ConvNet (I3D) | Classify three categories of normal, interstitial abnormalities, and confluent abnormalities using lung ultrasound | 86% F1 |
| [119] | 2021 August | InceptionV3 | Classification of COVID, normal, and pneumonia. | 89.1% |
| [120] | 2020 November | VB-Net | COVID-19 severity detection from CT scan. | 91.6% |
| [121] | 2021 January | Pretrained EfficientNet -B0 & ResNet50 | COVID-19 severity detection based on clinical factors and CT scans | 76% AUC |
| Paper | Year | Model | Goals | Accuracy |
|---|---|---|---|---|
| [122] | 2020 April | Survey on prognostic models which identified 51 relevant studies | ||
| [123] | 2021 February | Development of COVID-19 severity assessment (COSA) score | Clinical variables used to predict several COVID-19 outcomes | 0.96 AUC |
| [124] | 2021 May | Evaluated 18 machine learning algorithms | Negative outcomes prediction of ICU admission and mortality rates. | >0.80 F1 |
| [125] | 2021 February | Random forest, extreme gradient boosting and neural networks | Outcome prediction: Death, ICU admission and ventilation | 0.92 AUC |
| [126] | 2021 May | CNN with CT scans and gradient boosting COVID-GMIC-DRC | Clinical data used to predict the risk of deterioration | 0.786 AUC |
| [127] | 2020 September | 3-D ResNet and LSTM | Used clinical data and clinical data and sequences of CXR scans | 0.92 AUC |
| [128] | 2020 November | Random-forest classifier | Predict future intubation durations of patients | 0.84 AUC |
| [129] | 2021 March | SVM and logistic regression | Identify serum biomarkers that contribute to the greatest risk of mortality. | 0.93 AUC |
| [130] | 2021 May | Random Forest | Predicting outcomes of COVID-19 patients who had cancer-specific risk factors | 0.829 AUC |
| Paper | Year | Model | Goals | Accuracy |
|---|---|---|---|---|
| [131] | 2020 March | QCT-PLO | Used lung opacification-based segmentation for monitor COVID-19 progression. | - |
| [132] | 2020 March | UNet | ||
| [133] | 2021 August | LSTM and RNN-LSTM | Time-to-event analysis using CXR data. | 20% Conc. Error |
| [134] | 2021 September | Hybrid UNet | Used longitudinal segmentation to identify COVID-19 progression from 38 patients CT scans. | 0.837 Dice |
| [135] | 2021 January | COVID-Lesion Net | Serial CT for COVID-19 scoring system to identify disease severity | 0.920 Spearman |
| [136] | 2020 August | UNet | Assessment of serial CT scans for disease progression and pneumonitis region identification | 0.81 Dice |
| [137] | 2021 October | FC-DenseNet56 | Disease progression and interactive segmentation of lungs for COVID-19 | 0.59 Dice |
| [138] | 2021 April | Tchebichef moments (TM) | COVID-19 progression monitoring using CT blur correction with TM | 0.7983 Spearman |
| [139] | 2021 June | SVM | Severity prediction using time-series CT imaging + clinical variables from 841 patients | 0.89 AUC |
| [140] | 2022 March | DenseNet | Applied image augmentation techniques like context disordering for longitudinal classification of CT images | 0.844 AUC |
| [141] | 2022 February | Pneumonia-CT- LKM-PP | Identify number of lobes that had pulmonary lesions from 10 patients | - |
| [142] | 2022 March | LTBN | Longitudinal CXRs used to assess patient mortality from 654 patients | 0.727 AUC |
| [143] | 2022 April | BCL-Net and BC-LSTM Module | Extraction of CT features from longitudinal scans followed by clinical data fusion. | 0.900 AUC |
| [144] | 2021 February | Dense 3D network with GLM + Feature selection | Total opacity ratio (TOR) and consolidation ratio (CR) for CT and HER for ICU admission | 0.93 AUC |
| [145] | 2021 January | Deep COVID DeteCT | 3D deep learning classification across 13 institutions to track disease progression | 97.4% |
| [146] | 2022 March | Deep learning with feature selection and texture analysis | Lung segmentation using 107 intensity and texture features from 14,339 CT patients | 0.83 AUC |
| [121] | 2021 January | Deep learning with clinical feature correlation | Used multiple features with CT for COVID-19 disease progression in two French hospitals | 0.88 AUC |
| [147] | 2021 April | 3D-ResNet10 | Risk stratification for 400 patients in four institutions | 0.876 AUC |
| [148] | 2022 March | Cross-channel attention based deep learning | Diagnosing criticality of patients medical condition from CT scans. CNN has a multi-stage analyzer | 0.84 |
| [149] | 2022 March | Siamese Neural Network (SNN) | Severity scores identified using bounding boxes and used for providing future clinical assistance | 87.6% |
| [150] | 2022 March | UNet | Used LDCT for predicting death, hospitalization, ICU, and oxygen therapy | 0.75 Dice |
| [151] | 2022 February | InceptionResnetV2 + PCA | Prediction of mortality using CT data with clinical variables using CC-CCII dataset | 0.80 AUC |
| [152] | 2022 January | EfcientNetB7 + GAN variants | Early detection and early prognosis using CT and lab data from 15 patients | 98.7% |
| [116] | 2021 December | Decision tree, SVM, KNN and ensemble classifiers | ML models for prognostic study using CT scans and 21 clinical features of 1431 patients | 73.7% |
| [153] | 2022 May | SVM, random forest, and logistic regression | ICU admission and mortality prediction from two datasets and one hospital | 0.77 AUC |
| [154] | 2022 February | SVM | COVID-19 severity prediction from 287 patients | 0.97 AUC |
| [155] | 2022 January | Bi-directional Conv-LSTM UNet, Random forest and XGboost | Estimating the need for mechanical ventilation in COVID-19 patients | 0.91 AUC |
| [156] | 2021 July | CNN-AE | Autoencoders used to address data imbalance and predict patient survival from 320 patients. | 96.05% |
| [157] | 2021 February | Covid CT-net | Used a light weight CNN for COVID-19 prognosis | 95.78% |
| [158] | 2021 June | Linear regression, XGBoost 1.2.0 and MaxLFQ | Predict therapeutic needs, recovery time and risk of deterioration from 86 diagnostic variables. | 0.99 AUC |
Publisher’s Note: MDPI stays neutral with regard to jurisdictional claims in published maps and institutional affiliations. |
© 2022 by the authors. Licensee MDPI, Basel, Switzerland. This article is an open access article distributed under the terms and conditions of the Creative Commons Attribution (CC BY) license (https://creativecommons.org/licenses/by/4.0/).
Share and Cite
Gomes, R.; Kamrowski, C.; Langlois, J.; Rozario, P.; Dircks, I.; Grottodden, K.; Martinez, M.; Tee, W.Z.; Sargeant, K.; LaFleur, C.; et al. A Comprehensive Review of Machine Learning Used to Combat COVID-19. Diagnostics 2022, 12, 1853. https://doi.org/10.3390/diagnostics12081853
Gomes R, Kamrowski C, Langlois J, Rozario P, Dircks I, Grottodden K, Martinez M, Tee WZ, Sargeant K, LaFleur C, et al. A Comprehensive Review of Machine Learning Used to Combat COVID-19. Diagnostics. 2022; 12(8):1853. https://doi.org/10.3390/diagnostics12081853
Chicago/Turabian StyleGomes, Rahul, Connor Kamrowski, Jordan Langlois, Papia Rozario, Ian Dircks, Keegan Grottodden, Matthew Martinez, Wei Zhong Tee, Kyle Sargeant, Corbin LaFleur, and et al. 2022. "A Comprehensive Review of Machine Learning Used to Combat COVID-19" Diagnostics 12, no. 8: 1853. https://doi.org/10.3390/diagnostics12081853
APA StyleGomes, R., Kamrowski, C., Langlois, J., Rozario, P., Dircks, I., Grottodden, K., Martinez, M., Tee, W. Z., Sargeant, K., LaFleur, C., & Haley, M. (2022). A Comprehensive Review of Machine Learning Used to Combat COVID-19. Diagnostics, 12(8), 1853. https://doi.org/10.3390/diagnostics12081853