
Breast Imaging Physics in Mammography (Part I)
 , , ,
, , ,
Abstract
:1. Introduction
2. The Mammograph
- Radiogeni tubes and detectors,
- Compression devices,
- Anti-diffusion grids,
- Automatic exposure meters.
2.1. Cathode and Filament
2.2. Anode
2.3. Heel Effect
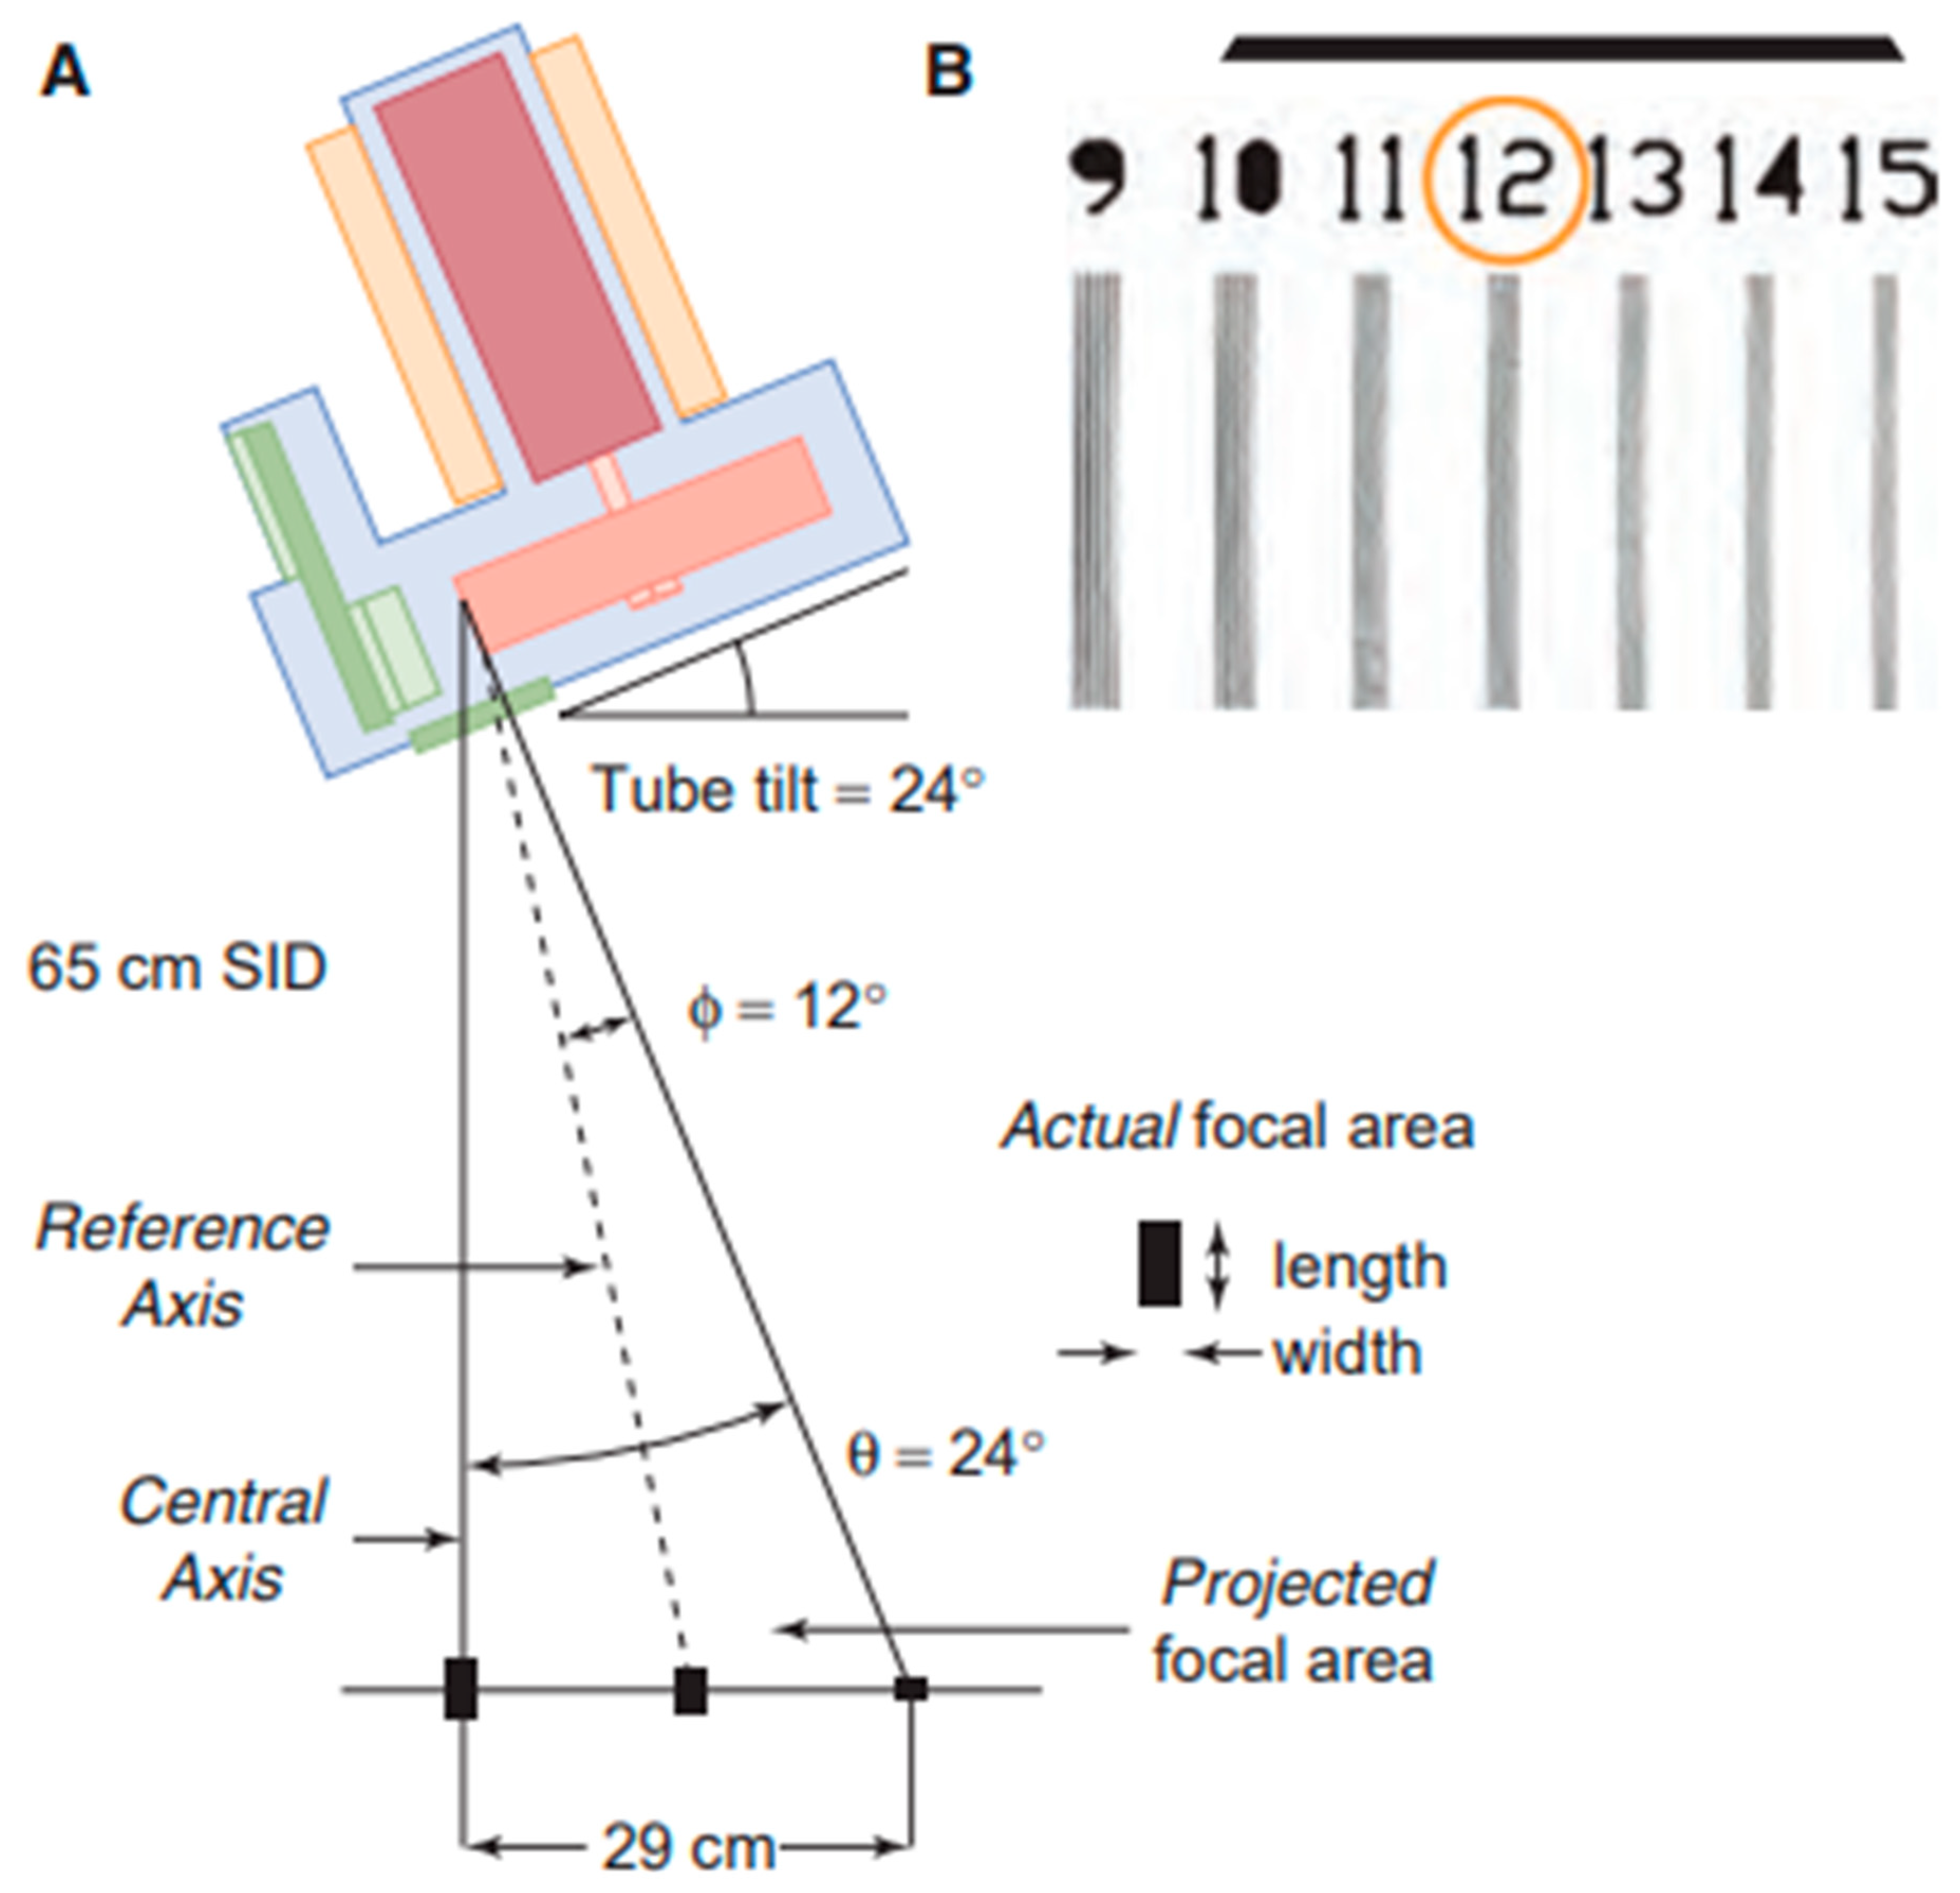
2.4. Focal Spot
3. Radiation Beam: Quality, Filters, Collimation
3.1. Beam Quality and Filtration
3.2. Collimation and Field of View
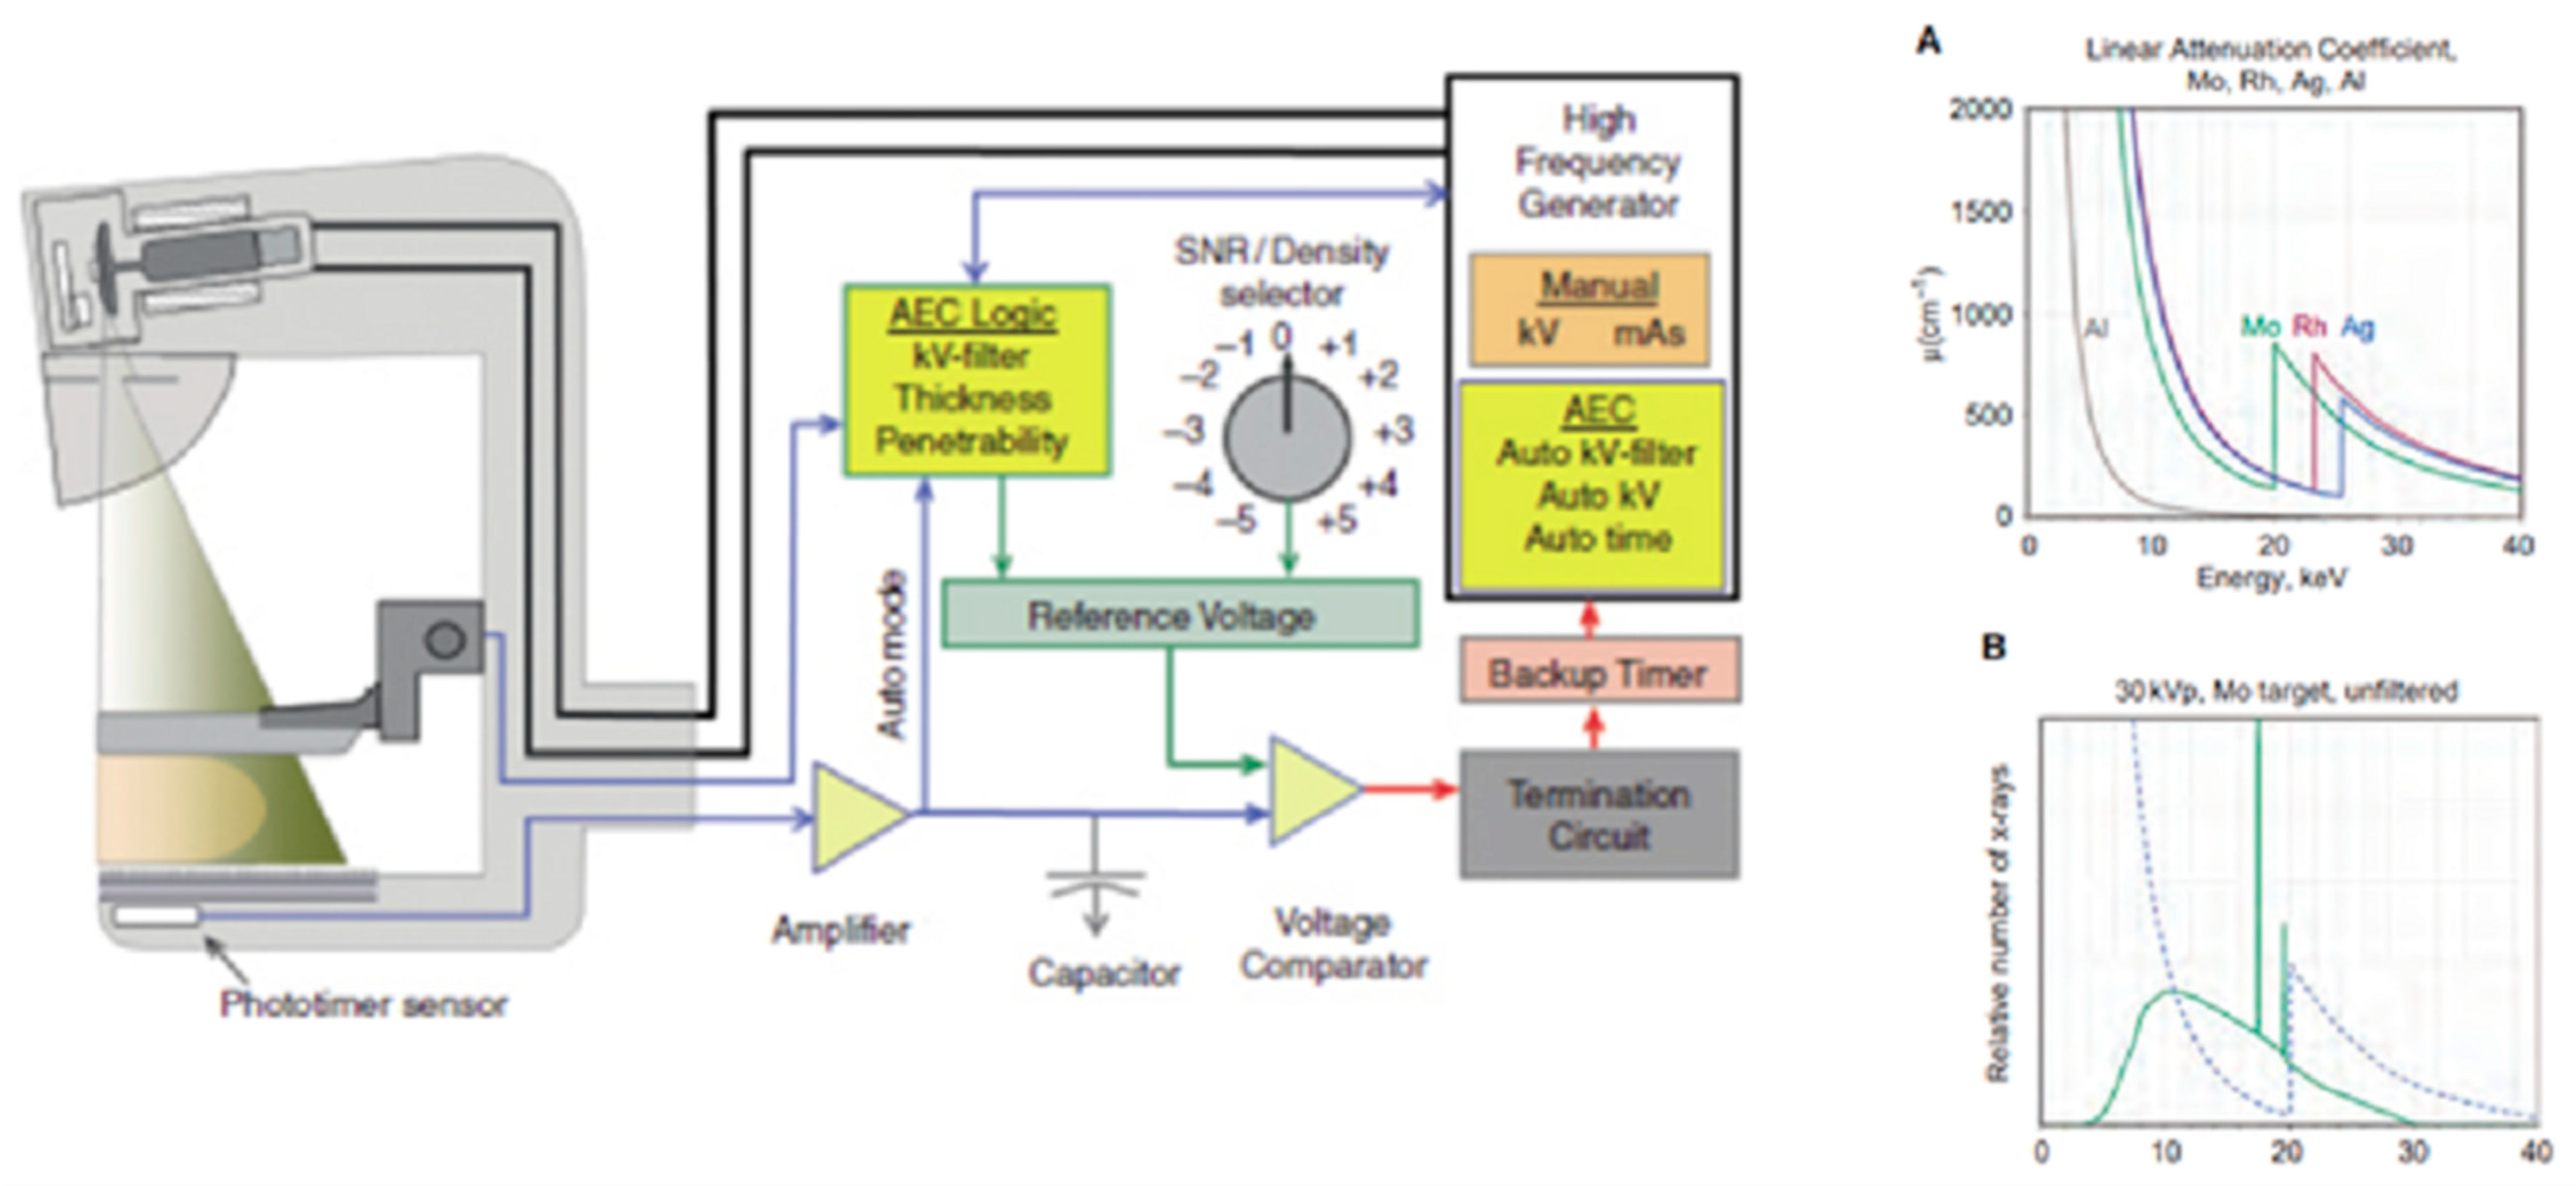
3.3. Generator and Automatic Exposure Control System (AEC)
4. Compression: Contrast and Dose
4.1. Compression
- Less X-ray scattering: they pass through a smaller thickness and due to compression and slippage of the different tissues, there is less overlap of the tissues interacting with matter with a lower probability of Compton events so the tract is in fact shorter, which results in a lower SPR through compression;
- Less image degradation: compression brings the tissue closer to the detector plane by reducing magnification, so details of anatomical structures are more evident and by lowering the quality of the diagnostic information produced, geometric blurring is avoided: f = (M − 1)F;
- Lower absorbed dose: breast tissue absorbs less radiation as the number of photons removed from the beam by absorption of the material depends on the thickness of the material (at the same linear attenuation coefficient), in accordance with the Lambert–Beer law.
4.2. Contrast
- -
- Primary photons: the primary radiation ‘carries’ the diagnostic information regarding the attenuation of the different breast tissues and provides maximum contrast of the subject.
- -
- Scattered photons: scattered radiation is only a part of the total radiation and is an additive contribution that degrades the contrast of the subject.
4.3. Magnification
4.4. Dosimetry in Mammography
4.5. Average Glandular Dose
5. Conclusions
Author Contributions
Funding
Institutional Review Board Statement
Informed Consent Statement
Data Availability Statement
Conflicts of Interest
References
- Arzanova, E.; Mayrovitz, H.N. The Epidemiology of Breast Cancer. In Breast Cancer; Mayrovitz, H.N., Ed.; Exon Publications: Brisbane, Australia, 2022; Chapter 1. [Google Scholar]
- Duffy, S.; Vulkan, D.; Cuckle, H.; Parmar, D.; Sheikh, S.; Smith, R.; Evans, A.; Blyuss, O.; Johns, L.; Ellis, I.; et al. Annual mammographic screening to reduce breast cancer mortality in women from age 40 years: Long-term follow-up of the UK Age RCT. Health Technol. Assess. 2020, 24, 1–24. [Google Scholar] [CrossRef] [PubMed]
- Evans, D.G.; Astley, S.; Stavrinos, P.; Harkness, E.; Donnelly, L.S.; Dawe, S.; Jacob, I.; Harvie, M.; Cuzick, J.; Brentnall, A.; et al. Improvement in risk prediction, early detection and prevention of breast cancer in the NHS Breast Screening Programme and family history clinics: A dual cohort study. Available online: https://europepmc.org/article/NBK/nbk379488 (accessed on 18 September 2023).
- Anderson, B.O.; Lipscomb, J.; Murillo, R.H.; Thomas, D.B. Breast Cancer. In Cancer: Disease Control Priorities, 3rd ed.; Gelband, H., Jha, P., Sankaranarayanan, R., Horton, S., Eds.; The International Bank for Reconstruction and Development/The World Bank: Washington, DC, USA, 2015; Volume 3, Chapter 3. [Google Scholar]
- Lane, D.S.; Smith, R.A. Cancer Screening: Patient and Population Strategies. Med. Clin. N. Am. 2023, 107, 989–999. [Google Scholar] [CrossRef] [PubMed]
- Berry, D.A. Breast cancer screening: Controversy of impact. Breast 2013, 22 (Suppl. S2), S73–S76. [Google Scholar] [CrossRef] [PubMed]
- Edgar, L.; Glackin, M.; Hughes, C.; Rogers, K.M. Factors influencing participation in breast cancer screening. Br. J. Nurs. 2013, 22, 1021–1026. [Google Scholar] [CrossRef] [PubMed]
- Garcia, E.M.; Storm, E.S.; Atkinson, L.; Kenny, E.; Mitchell, L.S. Current breast imaging modalities, advances, and impact on breast care. Obstet. Gynecol. Clin. N. Am. 2013, 40, 429–457. [Google Scholar] [CrossRef]
- Nelson, A.L. Controversies regarding mammography, breast self-examination, and clinical breast examination. Obstet. Gynecol. Clin. N. Am. 2013, 40, 413–427. [Google Scholar] [CrossRef]
- Mahoney, M.C.; Newell, M.S. Breast intervention: How I do it. Radiology 2013, 268, 12–24. [Google Scholar] [CrossRef]
- Gøtzsche, P.C.; Jørgensen, K.J. Screening for breast cancer with mammography. Cochrane Database Syst. Rev. 2013, 2013, CD001877. [Google Scholar] [CrossRef]
- Jochelson, M.; Hayes, D.F.; Ganz, P.A. Surveillance and monitoring in breast cancer survivors: Maximizing benefit and minimizing harm. Am. Soc. Clin. Oncol. Educ. Book. 2013, 33, e13–e18. [Google Scholar] [CrossRef]
- Hulvat, M.C. Cancer Incidence and Trends. Surg. Clin. N. Am. 2020, 100, 469–481. [Google Scholar] [CrossRef]
- Iacoviello, L.; Bonaccio, M.; de Gaetano, G.; Donati, M.B. Epidemiology of breast cancer, a paradigm of the “common soil” hypothesis. Semin. Cancer Biol. 2021, 72, 4–10. [Google Scholar] [CrossRef] [PubMed]
- Chikarmane, S.A.; Offit, L.R.; Giess, C.S. Synthetic Mammography: Benefits, Drawbacks, and Pitfalls. Radiographics 2023, 3, e230018. [Google Scholar] [CrossRef]
- Grigoryants, N.F.; Sass, S.; Alexander, J. Novel Technologies in Breast Imaging: A Scoping Review. Cureus 2023, 15, e44061. [Google Scholar] [CrossRef]
- Kerlikowske, K.; Grady, D.; Rubin, S.M.; Sandrock, C.; Ernster, V.L. Efficacy of Screening Mammography: A Meta-analysis. JAMA 1995, 273, 149. [Google Scholar] [CrossRef] [PubMed]
- Nicosia, L.; Gnocchi, G.; Gorini, I.; Venturini, M.; Fontana, F.; Pesapane, F.; Abiuso, I.; Bozzini, A.C.; Pizzamiglio, M.; Latronico, A.; et al. History of Mammography: Analysis of Breast Imaging Diagnostic Achievements over the Last Century. E. Healthcare 2023, 11, 1596. [Google Scholar] [CrossRef] [PubMed]
- Zackrisson, S.; Andersson, I. The development of breast radiology: The Acta Radiologica perspective. Acta Radiol. 2021, 62, 1473–1480. [Google Scholar] [CrossRef]
- Smith, R.A.; Duffy, S.W.; Tabár, L. Breast cancer screening: The evolving evidence. Oncology 2012, 26, 471–475, 479–481, 485–486. [Google Scholar]
- Jha, A.K.; Mithun, S.; Sherkhane, U.B.; Dwivedi, P.; Puts, S.; Osong, B.; Traverso, A.; Purandare, N.; Wee, L.; Rangarajan, V.; et al. Emerging role of quantitative imaging (radiomics) and artificial intelligence in precision oncology. Explor. Target. Antitumor Ther. 2023, 4, 569–582. [Google Scholar] [CrossRef]
- Najjar, R. Redefining Radiology: A Review of Artificial Intelligence Integration in Medical Imaging. Diagnostics 2023, 13, 2760. [Google Scholar] [CrossRef]
- Kang, W.; Qiu, X.; Luo, Y.; Luo, J.; Liu, Y.; Xi, J.; Li, X.; Yang, Z. Application of radiomics-based multiomics combinations in the tumor microenvironment and cancer prognosis. J. Transl. Med. 2023, 21, 598. [Google Scholar] [CrossRef]
- Wei, L.; Niraula, D.; Gates, E.D.H.; Fu, J.; Luo, Y.; Nyflot, M.J.; Bowen, S.R.; El Naqa, I.M.; Cui, S. Artificial intelligence (AI) and machine learning (ML) in precision oncology: A review on enhancing discoverability through multiomics integration. Br. J. Radiol. 2023, 96, 20230211. [Google Scholar] [CrossRef] [PubMed]
- Hawley, J.R.; Kang-Chapman, J.K.; Bonnet, S.E.; Kerger, A.L.; Taylor, C.R.; Erdal, B.S. Diagnostic Accuracy of Digital Breast Tomosynthesis in the Evaluation of Palpable Breast Abnormalities. Acad. Radiol. 2018, 25, 297–304. [Google Scholar] [CrossRef] [PubMed]
- Dabbous, F.; Dolecek, T.A.; Friedewald, S.M.; Tossas-Milligan, K.Y.; Macarol, T.; Summerfelt, W.T.; Rauscher, G.H. Performance characteristics of digital vs film screen mammography in community practice. Breast J. 2018, 24, 369–372. [Google Scholar] [CrossRef]
- Zhang, M.; Mesurolle, B.; Theriault, M.; Meterissian, S.; Morris, E.A. Imaging of breast cancer-beyond the basics. Curr. Probl. Cancer. 2023, 47, 100967. [Google Scholar] [CrossRef]
- Houssami, N.; Skaane, P. Overview of the evidence on digital breast tomosynthesis in breast cancer detection. Breast 2013, 22, 101–108. [Google Scholar] [CrossRef]
- Mainiero, M.B.; Lourenco, A.; Mahoney, M.C.; Newell, M.S.; Bailey, L.; Barke, L.D.; D’Orsi, C.; Harvey, J.A.; Hayes, M.K.; Huynh, P.T.; et al. ACR Appropriateness Criteria Breast Cancer Screening. J. Am. Coll. Radiol. 2013, 10, 11–14. [Google Scholar] [CrossRef] [PubMed]
- Griffin, J.L.; Pearlman, M.D. Breast cancer screening in women at average risk and high risk. Obstet. Gynecol. 2010, 116, 1410–1421. [Google Scholar] [CrossRef]
- AIOM. Linee Guida Neoplasie della Mammella; AIOM: Milan, Italy, 2018. [Google Scholar]
- Gatta, G.; Pinto, A.; Romano, S.; Scaglione, A.A.M.; Volterrani, L. Clinical, mammographic and ultrasonographic features of blunt breast trauma. Eur. J. Radiol. 2006, 59, 327–333. [Google Scholar] [CrossRef]
- Cuccurullo, V.; Prisco, M.; Di Stasio, G.; Mansi, L. Nuclear Medicine in Patients with NET: Radiolabeled Somatostatin Analogues and their Brothers. Curr. Radiopharm. 2017, 10, 74–84. [Google Scholar] [CrossRef]
- Brink, J.; Arenson, R.; Grist, T.M.; Lewin, J.S.; Enzmann, D. Bits and bytes: The future of radiology lies in informatics and information technology. Eur. Radiol. 2017, 27, 3647–3651. [Google Scholar] [CrossRef]
- Syed, A.; Zoga, A.C. Artificial Intelligence in Radiology: Current Technology and Future Directions. Semin. Musculoskelet. Radiol. 2018, 22, 540. [Google Scholar]
- Kortesniemi, M.; Tsapaki, V.; Trianni, A.; Russo, P.; Maas, A.; Källman, H.; Brambilla, M.; Damilakis, J. The European Federation of Organisations for Medical Physics (EFOMP) White Paper: Big data and deep learning in medical imaging and in relation to medical physics profession. Phys. Medica 2018, 56, 90. [Google Scholar] [CrossRef]
- Dromain, C.; Balleyguier, C.; Adler, G.; Garbay, J.R.; Delaloge, S. Contrast-enhanced digital mammography. Eur. J. Radiol. 2009, 69, 34–42. [Google Scholar] [CrossRef]
- Ding, S.; Fontaine, T.; Serex, M.; Reis, C.S.D. Interventions to improve patient experience in mammography: A scoping review protocol. JBI Evid. Synth. 2022, 20, 2370–2377. [Google Scholar] [CrossRef] [PubMed]
- Heine, J.J.; Behera, M. Effective x-ray attenuation measurements with full field digital mammography. Med. Phys. 2006, 33, 4350–4366. [Google Scholar] [CrossRef]
- Kappadath, S.C.; Shaw, C.C. Quantitative evaluation of dual-energy digital mammography for calcification imaging. Phys. Med. Biol. 2004, 49, 2563–2576. [Google Scholar] [CrossRef] [PubMed]
- Okunade, A.A.; Ademoroti, O.A. Determination of shielding requirements for mammography. Med. Phys. 2004, 31, 1210–1218. [Google Scholar] [CrossRef] [PubMed]
- LaVoy, T.R.; Huda, W.; Ogden, K.M. Radiographic techniques in screen-film mammography. J. Appl. Clin. Med. Phys. 2002, 3, 248–254. [Google Scholar]
- Seibert, J.A.; Boone, J.M., 3rd; Cooper, V.N.; Lindfors, K.K. Cassette-based digital mammography. Technol. Cancer Res. Treat. 2004, 3, 413–427. [Google Scholar] [CrossRef]
- Bushberg, J.; Boone, J. The Essential Physics of Medical Imaging; Online Access: Ovid Technologies LWW Doody’s Core Collection 2019; Wolters Kluwer Health: Philadelphia, PA, USA, 2011; ISBN 9780781780575. [Google Scholar]
- Erickson, B.; Korfiatis, P.; Akkus, Z.; Kline, T. Machine learning for medical imaging. Radiographics 2017, 37, 505–515. [Google Scholar] [CrossRef]
- Calabrese, M.; Montemezzi, S.; Scaperrotta, G.; Iotti, V.; Marino, M.; Di Giulio, G.; Moschetta, M.; Bicchierai, G. Documento SIRM—Approvato dal CD della SIRM in Data 14 Giugno 2022. 2022. Available online: https://sirm.org/wp-content/uploads/2022/06/Mammografia-con-mezzo-di-contrasto-statement-SIRM_cin_rev3.pdf (accessed on 18 September 2023).
- Briganti, V.; Cuccurullo, V.; Di Stasio, G.; Mansi, L. Gamma Emitters in Pancreatic Endocrine Tumors Imaging in the PET Era: Is there a Clinical Space for 99mTc-peptides? Curr. Radiopharm. 2019, 12, 156–170. [Google Scholar] [CrossRef] [PubMed]
- Di Grezia, G.; Prisco, V.; Iannaccone, T.; Grassi, R.; Serra, N.; Gatta, G. Personality disorders and temperamental traits in patients with breast disease: Preliminary results. Minerva Psichiatr. 2016, 57, 85–92. [Google Scholar]
- International Atomic Energy Agency; Dance, D. Diagnostic Radiology Physics: A Handbook for Teachers and Students; STI/PUB; International Atomic Energy Agency: Vienna, Austria, 2014; ISBN 9789201310101. Available online: https://books.google.it/books?id=9iiKmwEACAAJ (accessed on 18 September 2023).
- Yohe, C.W. Mammography technology overview. Radiol. Manage. 2001, 23, 52–54. [Google Scholar] [PubMed]
- Monesi, V. Istologia; Piccin-Nuova Libraria: Padova, Italy, 2018; ISBN 9788829928132. Available online: https://books.google.it/books?id=4PtJtAEACAAJ (accessed on 18 September 2023).
- Perry, N.; Broeders, M.; De Wolf, C.; Tornberg, S.; Holland, R.; Von Karsa, L. European guidelines for quality assurance in breast cancer screening and diagnosis. Fourth edition—Summary document. Ann. Oncol. Off. J. Eur. Soc. Med. Oncol. 2008, 19, 614. [Google Scholar] [CrossRef]
- Di Prete, O.; Lourenco, A.P.; Baird, G.L.; Mainiero, M.B. Screening Digital Mammography Recall Rate: Does It Change with Digital Breast Tomosynthesis Experience? Radiology 2018, 286, 838–844. [Google Scholar] [CrossRef]
- James, J.R.; Pavlicek, W.; Hanson, J.A.; Boltz, T.F.; Patel, B.K. Breast Radiation Dose With CESM Compared With 2D FFDM and 3D Tomosynthesis Mammography. AJR Am. J. Roentgenol. 2017, 208, 362. [Google Scholar] [CrossRef]
- James, J.; Tennant, S.L. Contrast-enhanced spectral mammography (CESM). Clin. Radiol. 2018, 73, 715. Available online: https://www.sciencedirect.com/science/article/pii/S000992601830182X (accessed on 18 September 2023). [CrossRef]
- Ten, J.I.; Vano, E.; Sánchez, R.; Fernandez-Soto, J.M. Automatic patient dose registry and clinical audit on line for mammography. Radiat. Prot. Dosim. 2015, 165, 346–349. [Google Scholar] [CrossRef]
- Zanardo, M.; Cozzi, A.; Trimboli, R.M.; Labaj, O.; Monti, C.B.; Schiaffino, S.; Carbonaro, L.A.; Sardanelli, F. Technique, protocols and adverse reactions for contrast-enhanced spectral mammography (CESM): A systematic review. Insights Into Imaging 2019, 10, 76. [Google Scholar] [CrossRef]
- Gatta, G.; Di Grezia, G.; Ancona, A.; Capodieci, M.; Cappabianca, S.; Grassi, R. Underestimation of atypical lobular hyperplasia and lobular carcinoma in situ at stereotaxic 11-gauge vacuum-assisted breast biopsy. Eur. J. Inflamm. 2013, 11, 825–835. [Google Scholar] [CrossRef]
- Neri, E.; De Souza, N.; Brady, A.; Bayarri, A.A.; Becker, C.D.; Coppola, F.; Visser, J.; European Society of Radiology. What the radiologist should know about artificial intelligence—An ESR white paper. Insights Into Imaging 2019, 10, 44. [Google Scholar]
- Moadel, R.M. Breast cancer imaging devices. Semin. Nucl. Med. 2011, 41, 229–241. [Google Scholar] [CrossRef]
- Samei, E. AAPM/RSNA physics tutorial for residents: Technological and psychophysical considerations for digital mammographic displays. Radiographics 2005, 25, 491–501. [Google Scholar] [CrossRef] [PubMed]
- Pisano, E.D.; Yaffe, M.J. Digital mammography. Radiology 2005, 234, 353–362. [Google Scholar] [CrossRef] [PubMed]
- Cuccurullo, V.; Di Stasio, G.; Cascini, G. PET/CT in thyroid cancer—The importance of BRAF mutations. Nucl. Med. Rev. Cent. East. Eur. 2020, 23, 97–102. [Google Scholar] [CrossRef]
- Cuccurullo, V.; Di Stasio, G.; Mansi, L. Radioguided surgery with radiolabeled somatostatin analogs: Not only in GEP-NETs. Nucl. Med. Rev. Cent. East. Eur. 2017, 20, 49–56. [Google Scholar] [CrossRef]
- Perez-Leon, D.; Posso, M.; Louro, J.; Ejarque, B.; Arranz, M.; Arenas, N.; Maiques, J.; Martínez, J.; Maciá, F.; Román, M.; et al. Does the patient-assisted compression mode affect the mammography quality? A within-woman randomized controlled trial. Eur. Radiol. 2022, 32, 7470–7479. [Google Scholar] [CrossRef]
- Boujemaa, S.; Bosmans, H.; Bentayeb, F. Mammography Dose Survey Using International Quality Standards. J. Med. Imaging Radiat. Sci. 2019, 50, 529–535. [Google Scholar] [CrossRef]
- Den Boer, D.; Dam-Vervloet, L.A.J.; Boomsma, M.F.; de Boer, E.; van Dalen, J.A.; Poot, L. Clinical validation of a pressure-standardized compression mammography system. Eur. J. Radiol. 2018, 105, 251–254. [Google Scholar] [CrossRef]
- Ancona, A.; Capodieci, M.; Galiano, A.; Mangieri, F.; Lorusso, V.; Gatta, G. Vacuum-assisted biopsy diagnosis of atypical ductal hyperplasia and patient management—Diagnosi di iperplasia duttale atipica (ADH) con VAB. Manag. Radiol. Medica 2011, 116, 276–291. [Google Scholar] [CrossRef]
- Yu, Y.; Wang, J. Heel effect adaptive flat field correction of digital x-ray detectors. Med. Phys. 2013, 40, 081913. [Google Scholar] [CrossRef] [PubMed]
- Feig, S.A. Mammography equipment: Principles, features, selection. Radiol. Clin. N. Am. 1987, 25, 897–911. [Google Scholar] [CrossRef] [PubMed]
- Behling, R. On a new multi-source X-ray tube concept for minimizing imaging time in digital breast tomosynthesis. Phys. Med. 2021, 88, 20–22. [Google Scholar] [CrossRef]
- Nazari, S.S.; Mukherjee, P. An overview of mammographic density and its association with breast cancer. Breast Cancer 2018, 25, 259. [Google Scholar] [CrossRef]
- Briganti, V.; Cuccurullo, V.; Berti, V.; Di Stasio, G.; Linguanti, F.; Mungai, F.; Mansi, L. 99mTc-EDDA/HYNIC-TOC is a New Opportunity in Neuroendocrine Tumors of the Lung (and in other Malignant and Benign Pulmonary Diseases). Curr. Radiopharm. 2020, 13, 166–176. [Google Scholar] [CrossRef]
- Redington, R.; Henkes, J.J. Mammographe. FR PATENT DOCUMENT 2319323/A/, 31 July 1975. [Google Scholar]
- Park, W.; Park, J. History and application of artificial neural networks in dentistry. Eur. J. Dent. 2018, 12, 594. [Google Scholar] [CrossRef] [PubMed]
- Bushberg, J.T. The AAPM/RSNA physics tutorial for residents. X-ray interactions. Radiographics 1998, 18, 457. [Google Scholar] [CrossRef]
- Yaffe, M.J.; Rowlands, J.A. X-ray detectors for digital radiography. Phys. Med. Biol. 1997, 42, 1–39. [Google Scholar] [CrossRef]
- Adcock, D.F.; Howe, D.B. Radiation dose and risk in screening mammography. J. Med. Syst. 1994, 18, 173–178. [Google Scholar] [CrossRef]
- Garton, A.J.; Dance, D.R. Estimation of tube potential in mammography from transmission measurements. Phys. Med. Biol. 1994, 39, 1247–1261. [Google Scholar] [CrossRef]
- Cuccurullo, V.; Di Stasio, G.; Prisco, M.; Mansi, L. Is there a clinical usefulness for radiolabeled somatostatin analogues beyond the consolidated role in NETs? Indian J. Radiol. Imaging 2017, 27, 509–516. [Google Scholar] [PubMed]
- Bushberg, J.T. Uses of effective dose: The good, the bad, and the future. Health Phys. 2019, 116, 129. [Google Scholar] [CrossRef] [PubMed]
- Maria, S.D.; Vedantham, S.; Vaz, P. X-ray dosimetry in breast cancer screening: 2D and 3D mammography. Eur. J. Radiol. 2022, 151, 110278. [Google Scholar] [CrossRef] [PubMed]
- Cuccurullo, V.; Di Stasio, G.; Mansi, L. Physiopathological Premises to Nuclear Medicine Imaging of Pancreatic Neuroendocrine Tumours. Curr. Radiopharm. 2019, 12, 98–106. [Google Scholar] [CrossRef]
- Berns, E.A.; Hendrick, R.E.; Cutter, G.R. Performance comparison of full-field digital mammography to screen-film mammography in clinical practice. Med. Phys. 2002, 29, 830–834. [Google Scholar] [CrossRef]
- Young, K.C. Radiation doses in the UK trial of breast screening in women aged 40–48 years. Br. J. Radiol. 2002, 75, 362–370. [Google Scholar] [CrossRef]
- Haus, A.G.; Yaffe, M.J.; Feig, S.A.; Hendrick, R.E.; Butler, P.A.; Wilcox, P.A.; Bansal, S. Relationship between phantom failure rates and radiation dose in mammography accreditation. Med. Phys. 2001, 28, 2297–2301. [Google Scholar] [CrossRef]
- Hammerstein, G.; Miller, D.; White, D.; Masterson, M.; Woodard, H.; Laughlin, J. Absorbed radiation dose in mammography. Radiology 1979, 130, 485–491. [Google Scholar] [CrossRef]
- Robson, K.J. A parametric method for determining mammographic X-ray tube output and half value layer. Br. J. Radiol. 2001, 74, 335–340. [Google Scholar] [CrossRef]
- Mullen, L.A. Editorial Comment: Biopsy Capability for Contrast-Enhanced Mammography Reduces Barriers to Adoption of New Technology. AJR Am. J. Roentgenol. 2023, 220, 523. [Google Scholar] [CrossRef]
- Mahesh, M. The essential physics of medical imaging. Med. Phys. 2013, 40, 077301. [Google Scholar] [CrossRef] [PubMed]
- Sardu, C.; Gatta, G.; Pieretti, G.; Onofrio, N.; Balestrieri, M.L.; Scisciola, L.; Cappabianca, S.; Ferraro, G.; Nicoletti, G.F.; Signoriello, G.; et al. SGLT2 breast expression could affect the cardiovascular performance in pre-menopausal women with fatty vs. non fatty breast via over-inflammation and sirtuins’ down regulation. Eur. J. Intern. Med. 2023, 113, 57–68. [Google Scholar] [CrossRef] [PubMed]
- Gatta, G.; Di Grezia, G.; Cuccurullo, V.; Sardu, C.; Iovino, F.; Comune, R.; Ruggiero, A.; Chirico, M.; La Forgia, D.; Fanizzi, A.; et al. MRI in Pregnancy and Precision Medicine: A Review from Literature. J. Pers. Med. 2021, 12, 9. [Google Scholar] [CrossRef] [PubMed]
- Panico, A.; Gatta, G.; Salvia, A.; Grezia, G.D.; Fico, N.; Cuccurullo, V. Radiomics in Breast Imaging: Future Development. J. Pers. Med. 2023, 13, 862. [Google Scholar] [CrossRef]


| Nominal Focal Spot Size (mm) | Width (mm) | Length (mm) |
|---|---|---|
| 0.10 | 0.15 | 0.15 |
| 0.15 | 0.23 | 0.23 |
| 0.20 | 0.30 | 0.30 |
| 0.30 | 0.45 | 0.65 |
| 0.45 | 0.60 | 0.85 |
| 0.60 | 0.90 | 1.30 |
Disclaimer/Publisher’s Note: The statements, opinions and data contained in all publications are solely those of the individual author(s) and contributor(s) and not of MDPI and/or the editor(s). MDPI and/or the editor(s) disclaim responsibility for any injury to people or property resulting from any ideas, methods, instructions or products referred to in the content. |
© 2023 by the authors. Licensee MDPI, Basel, Switzerland. This article is an open access article distributed under the terms and conditions of the Creative Commons Attribution (CC BY) license (https://creativecommons.org/licenses/by/4.0/).
Share and Cite
Fico, N.; Di Grezia, G.; Cuccurullo, V.; Salvia, A.A.H.; Iacomino, A.; Sciarra, A.; Gatta, G. Breast Imaging Physics in Mammography (Part I). Diagnostics 2023, 13, 3227. https://doi.org/10.3390/diagnostics13203227
Fico N, Di Grezia G, Cuccurullo V, Salvia AAH, Iacomino A, Sciarra A, Gatta G. Breast Imaging Physics in Mammography (Part I). Diagnostics. 2023; 13(20):3227. https://doi.org/10.3390/diagnostics13203227
Chicago/Turabian StyleFico, Noemi, Graziella Di Grezia, Vincenzo Cuccurullo, Antonio Alessandro Helliot Salvia, Aniello Iacomino, Antonella Sciarra, and Gianluca Gatta. 2023. "Breast Imaging Physics in Mammography (Part I)" Diagnostics 13, no. 20: 3227. https://doi.org/10.3390/diagnostics13203227