Abstract
The evaluation of mammographic breast density, a critical indicator of breast cancer risk, is traditionally performed by radiologists via visual inspection of mammography images, utilizing the Breast Imaging-Reporting and Data System (BI-RADS) breast density categories. However, this method is subject to substantial interobserver variability, leading to inconsistencies and potential inaccuracies in density assessment and subsequent risk estimations. To address this, we present a deep learning-based automatic detection algorithm (DLAD) designed for the automated evaluation of breast density. Our multicentric, multi-reader study leverages a diverse dataset of 122 full-field digital mammography studies (488 images in CC and MLO projections) sourced from three institutions. We invited two experienced radiologists to conduct a retrospective analysis, establishing a ground truth for 72 mammography studies (BI-RADS class A: 18, BI-RADS class B: 43, BI-RADS class C: 7, BI-RADS class D: 4). The efficacy of the DLAD was then compared to the performance of five independent radiologists with varying levels of experience. The DLAD showed robust performance, achieving an accuracy of 0.819 (95% CI: 0.736–0.903), along with an F1 score of 0.798 (0.594–0.905), precision of 0.806 (0.596–0.896), recall of 0.830 (0.650–0.946), and a Cohen’s Kappa () of 0.708 (0.562–0.841). The algorithm achieved robust performance that matches and in four cases exceeds that of individual radiologists. The statistical analysis did not reveal a significant difference in accuracy between DLAD and the radiologists, underscoring the model’s competitive diagnostic alignment with professional radiologist assessments. These results demonstrate that the deep learning-based automatic detection algorithm can enhance the accuracy and consistency of breast density assessments, offering a reliable tool for improving breast cancer screening outcomes.
1. Introduction
Population-wide breast cancer screening initiatives have been instrumental in reducing mortality, with high adherence to regular screenings significantly impacting outcomes [1]. Despite significant advancements, breast cancer remains the leading cause of cancer-related deaths among women globally. The effectiveness of current mammography screening protocols has been questioned due to the prevalence of recalls and false positives, which often result in unnecessary biopsy procedures [2]. Breast tissue density is a key determinant in the detection of breast cancer, as it can obscure tumor visibility and is independently linked to a heightened risk of developing breast cancer [3]. To standardize breast density evaluations, the American College of Radiology (ACR) introduced the Breast Imaging-Reporting and Data System (BI-RADS) [4] for breast density assessment (Figure 1). However, the classification system has faced challenges due to the significant interobserver variability among radiologists, leading to inconsistencies and uncertainties in assessments [5,6,7].
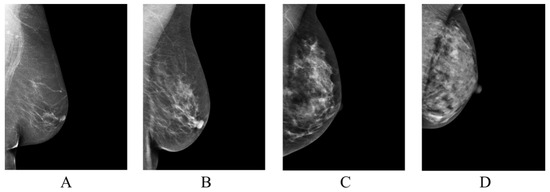
Figure 1.
Classification of breast tissue density according to BI-RADS Atlas Fifth Edition classification [4]. Examples of the breast in left mediolateral (LMLO) projection: Class (A) = the breasts are almost entirely fatty. Class (B) = there are scattered areas of fibroglandular density. Class (C) = the breasts are heterogeneously dense, which may obscure small masses. Class (D) = the breasts are extremely dense, which lowers the sensitivity of digital mammography.
Recent advancements in artificial intelligence (AI) and deep learning (DL) have demonstrated the potential to improve diagnostic accuracy in medical imaging [8,9,10]. This study investigates the efficacy of a deep learning-enhanced computer-aided diagnosis (CAD) system in evaluating breast tissue density according to the BI-RADS density classification. The primary objective is to enhance the consistency of breast tissue density evaluation, thereby facilitating improved risk stratification and patient management.
2. Background
The emergence of deep learning in healthcare has marked a transformative period in medical imaging, introducing an innovative paradigm for the analysis and interpretation of radiological images [11]. As efforts to achieve uniform and consistent evaluations of breast density intensify, several studies have highlighted the limitations of the current BI-RADS classification. These findings underscore the need for enhanced precision in the guidelines and improved training to ensure dependable density categorization worldwide [12].
One of the first applications of deep learning in breast density assessment was pioneered by Kallenberg et al. [13]. Their study leveraged unsupervised convolutional sparse autoencoders (CSAE) for breast density segmentation and mammographic risk scoring, demonstrating a significant potential for these networks in automating the classification of breast tissue density. Mohamed et al. [14] developed a deep learning system using convolutional neural networks (CNNs), designed to classify mammographic breast density as ‘scattered density’ or ‘heterogeneously dense’. The presented system, trained on 22,000 digital mammogram images from 1427 women, showed promising results, achieving an AUC of 0.9421 initially, which increased to 0.9882 after dataset refinement. Becker et al. [15] expanded the scope of deep learning applications in mammography by evaluating the diagnostic accuracy of an AI-based system not only for BI-RADS density classification but also for quantifying absolute dense tissue percentage. Employing an AI model trained on a dual-center dataset of 3228 mammograms, their approach achieved an AUC of 0.82, demonstrating a high correlation with expert radiologists’ assessments, which ranged from AUCs of 0.77 to 0.87. Similarly, Li et al. [16] applied dilated and attention-guided residual learning techniques for multi-view mammographic density classification. Their method, evaluated on both a clinical dataset and the INBreast dataset, achieved an accuracy of 88.7% and 70.0%, respectively. Furthermore, Deng et al. [17] introduced a novel SE-Attention neural network, integrated using the CNN framework, which was trained on a substantial dataset of 18,157 images from 4982 patients. This approach outperformed traditional models, achieving accuracy as high as 92.17% on the Inception-V4-SE architecture. Lastly, Wu et al. [18] explored the application of multi-column deep CNNs in classifying breast density using 201,179 screening mammograms. Their model achieved a top-1 accuracy of 76.7%, a top-2 accuracy of 98.2%, and a macAUC of 0.916, demonstrating the efficacy in handling large-scale, clinically realistic datasets.
Detailed information on the comparable studies, including dataset specifics, methodologies, and performance metrics, are provided in Table A1.
3. Materials and Methods
3.1. Software
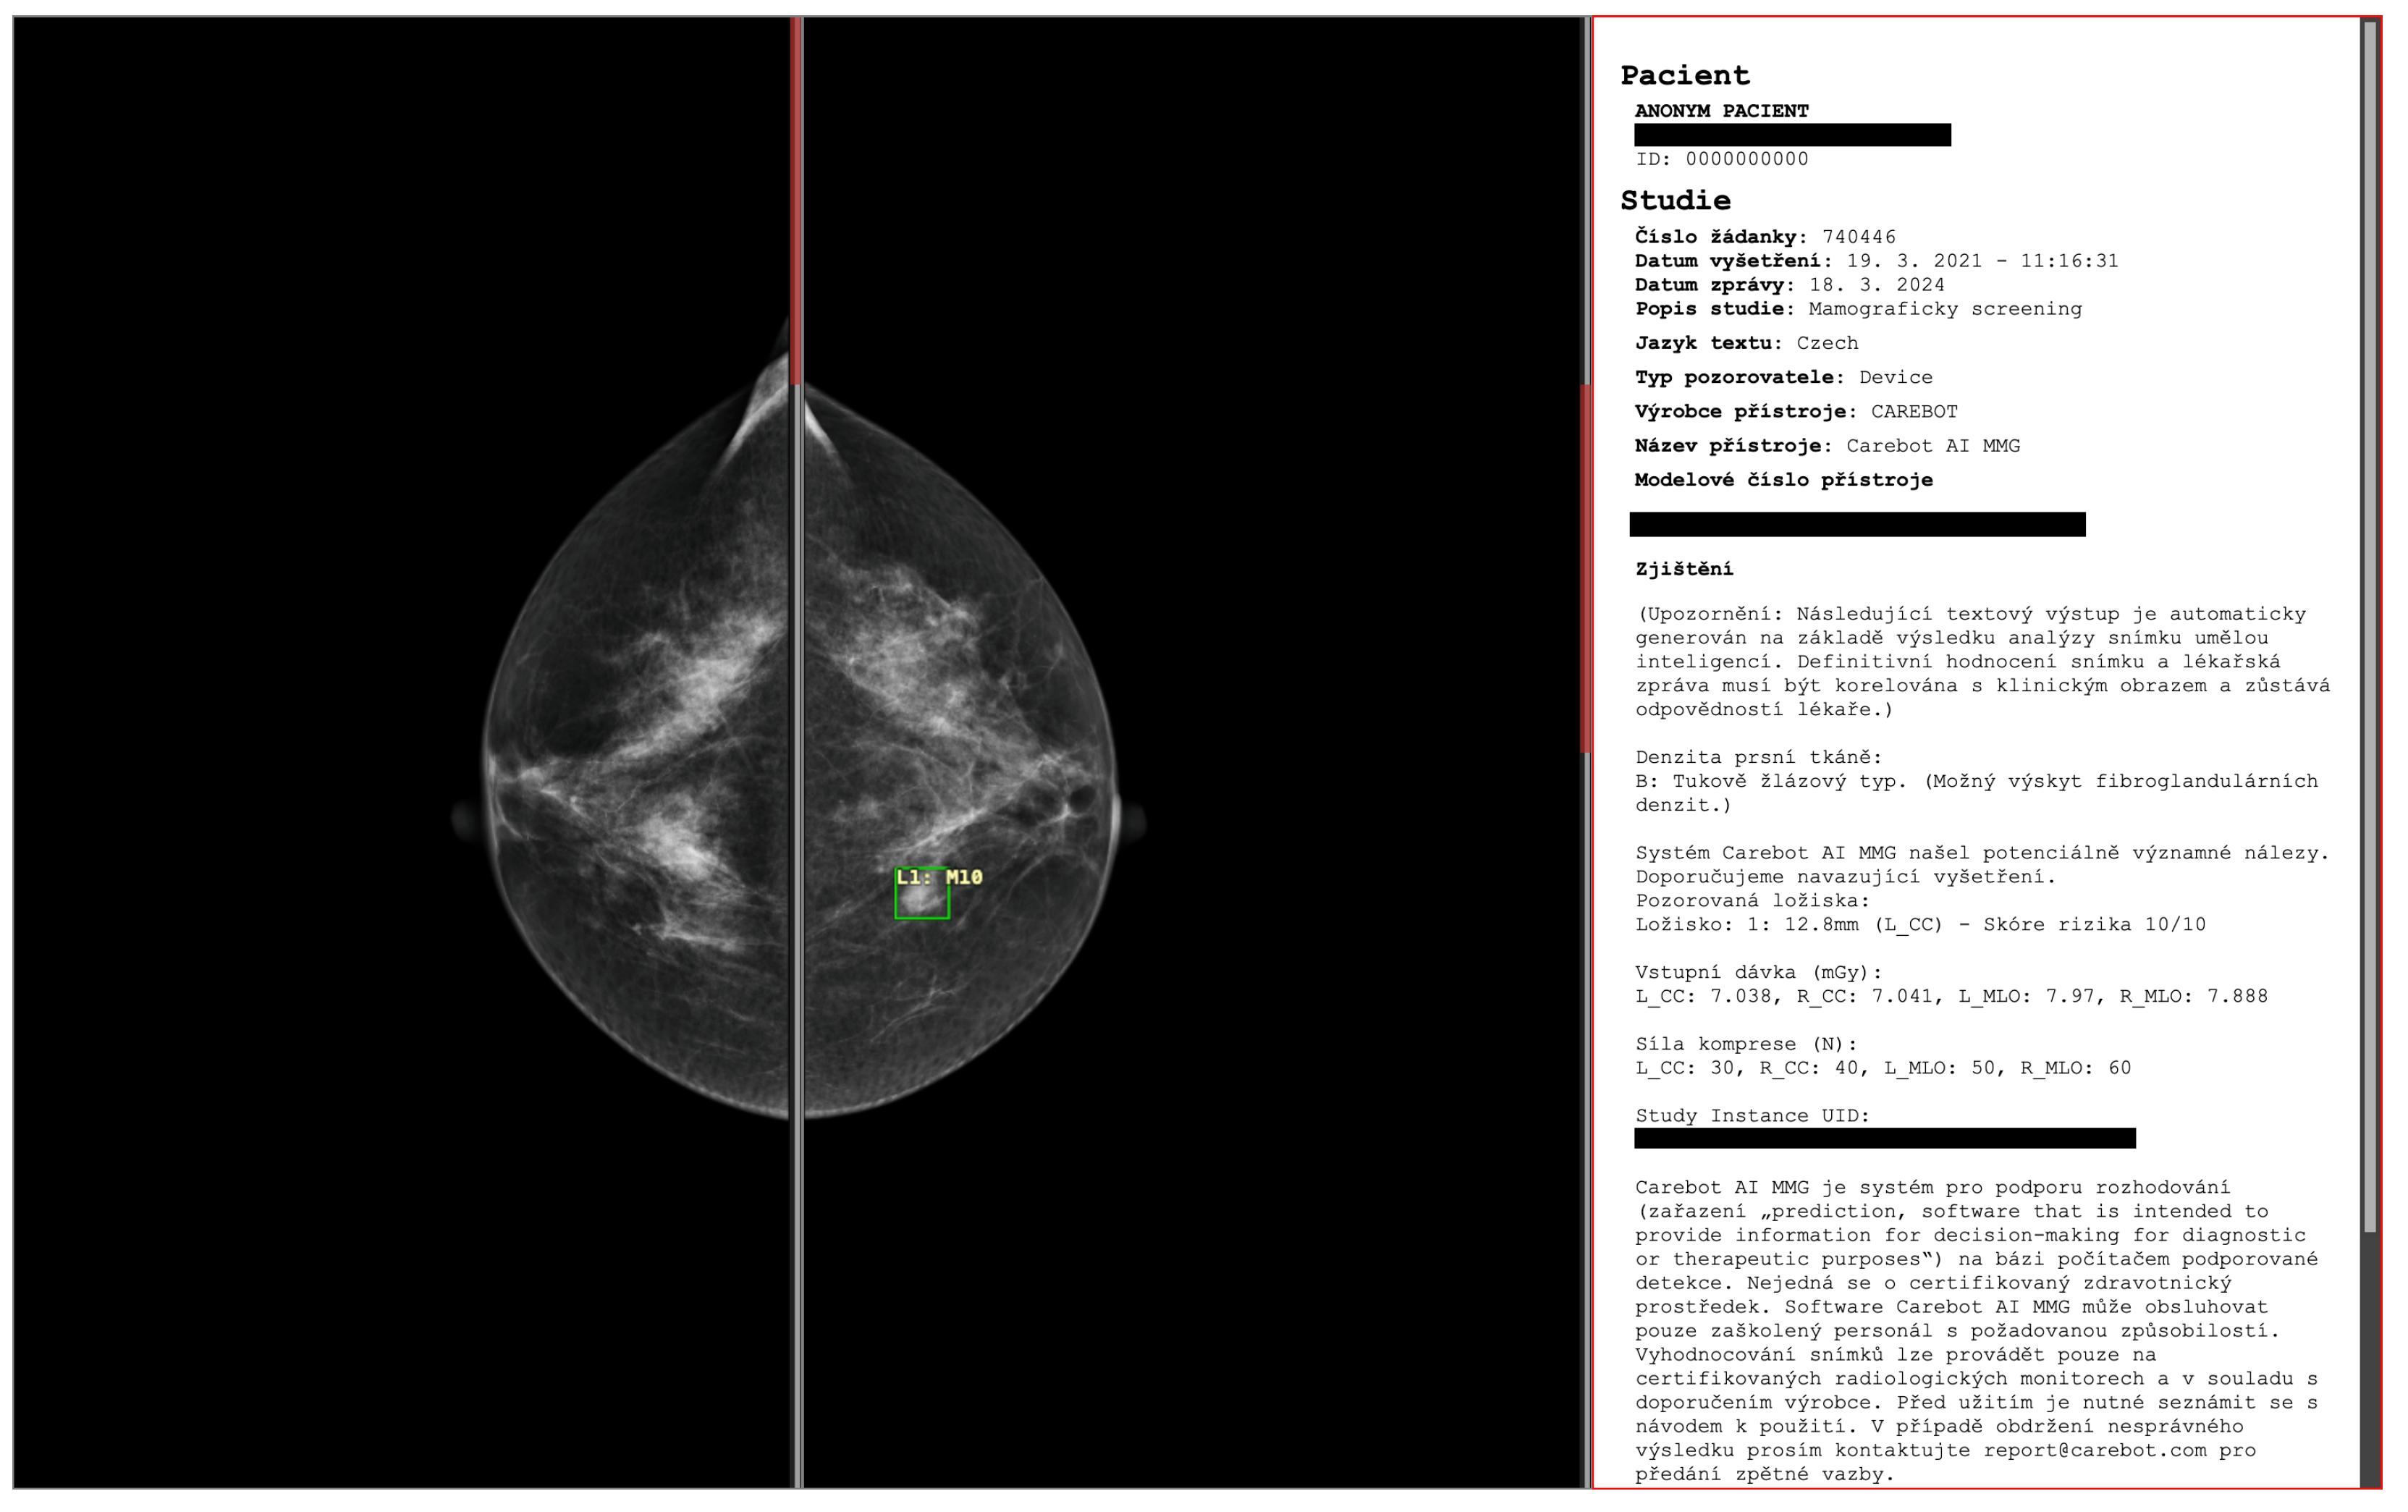
The proposed deep learning-based automatic detection algorithm (DLAD, Carebot AI MMG v2.2; Prague, Czech Republic) analyzes full-field digital mammography (FFDM) studies in the standard left (LCC) and right craniocaudal (RCC), and left (LMLO) and right mediolateral oblique (RMLO) view. The images are initially directed to a preprocessing module, which eliminates extraneous components from the images and implements image filtering techniques. The images are then classified by the DLAD’s multi-class classifier, adhering to the BI-RADS breast density classification standards. Designed to augment the decision-making process in screening clinical practice, the DLAD is designed for seamless integration with picture archiving and communication systems (PACS) and DICOM viewers (Figure 2) using DICOMweb and DIMSE protocols.
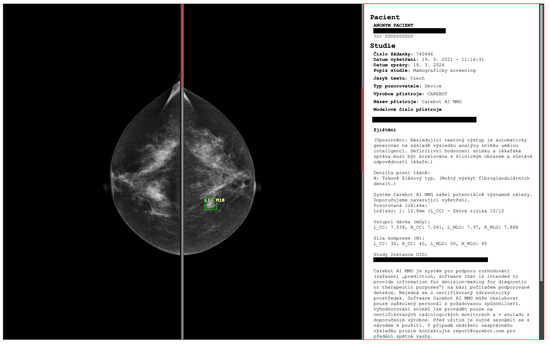
Figure 2.
The proposed deep learning-based automatic detection algorithm (DLAD, Carebot AI MMG v2.2; Prague, Czech Republic), implemented in CloudPACS v2.12.28 (OR-CZ spol. s r.o.; Moravská Třebová, Czech Republic). Digital mammography of a 47-year-old woman with lower-density breasts (BI-RADS B).
3.2. Train Data
To determine the ground truth for our training data, we have established a team of 10 breast radiologists with 2 to 27 years of experience in mammography interpretation, including 7 board-certified radiologists and 3 junior radiologists without board certification. Each of the 8295 mammography studies (33,180 images) was randomly assigned to two radiologists to evaluate the presence of benign or malignant lesions, and suspect microcalcifications, and to determine breast density according to BI-RADS breast density classification. A consensus between the two radiologists was required to establish the ground truth.
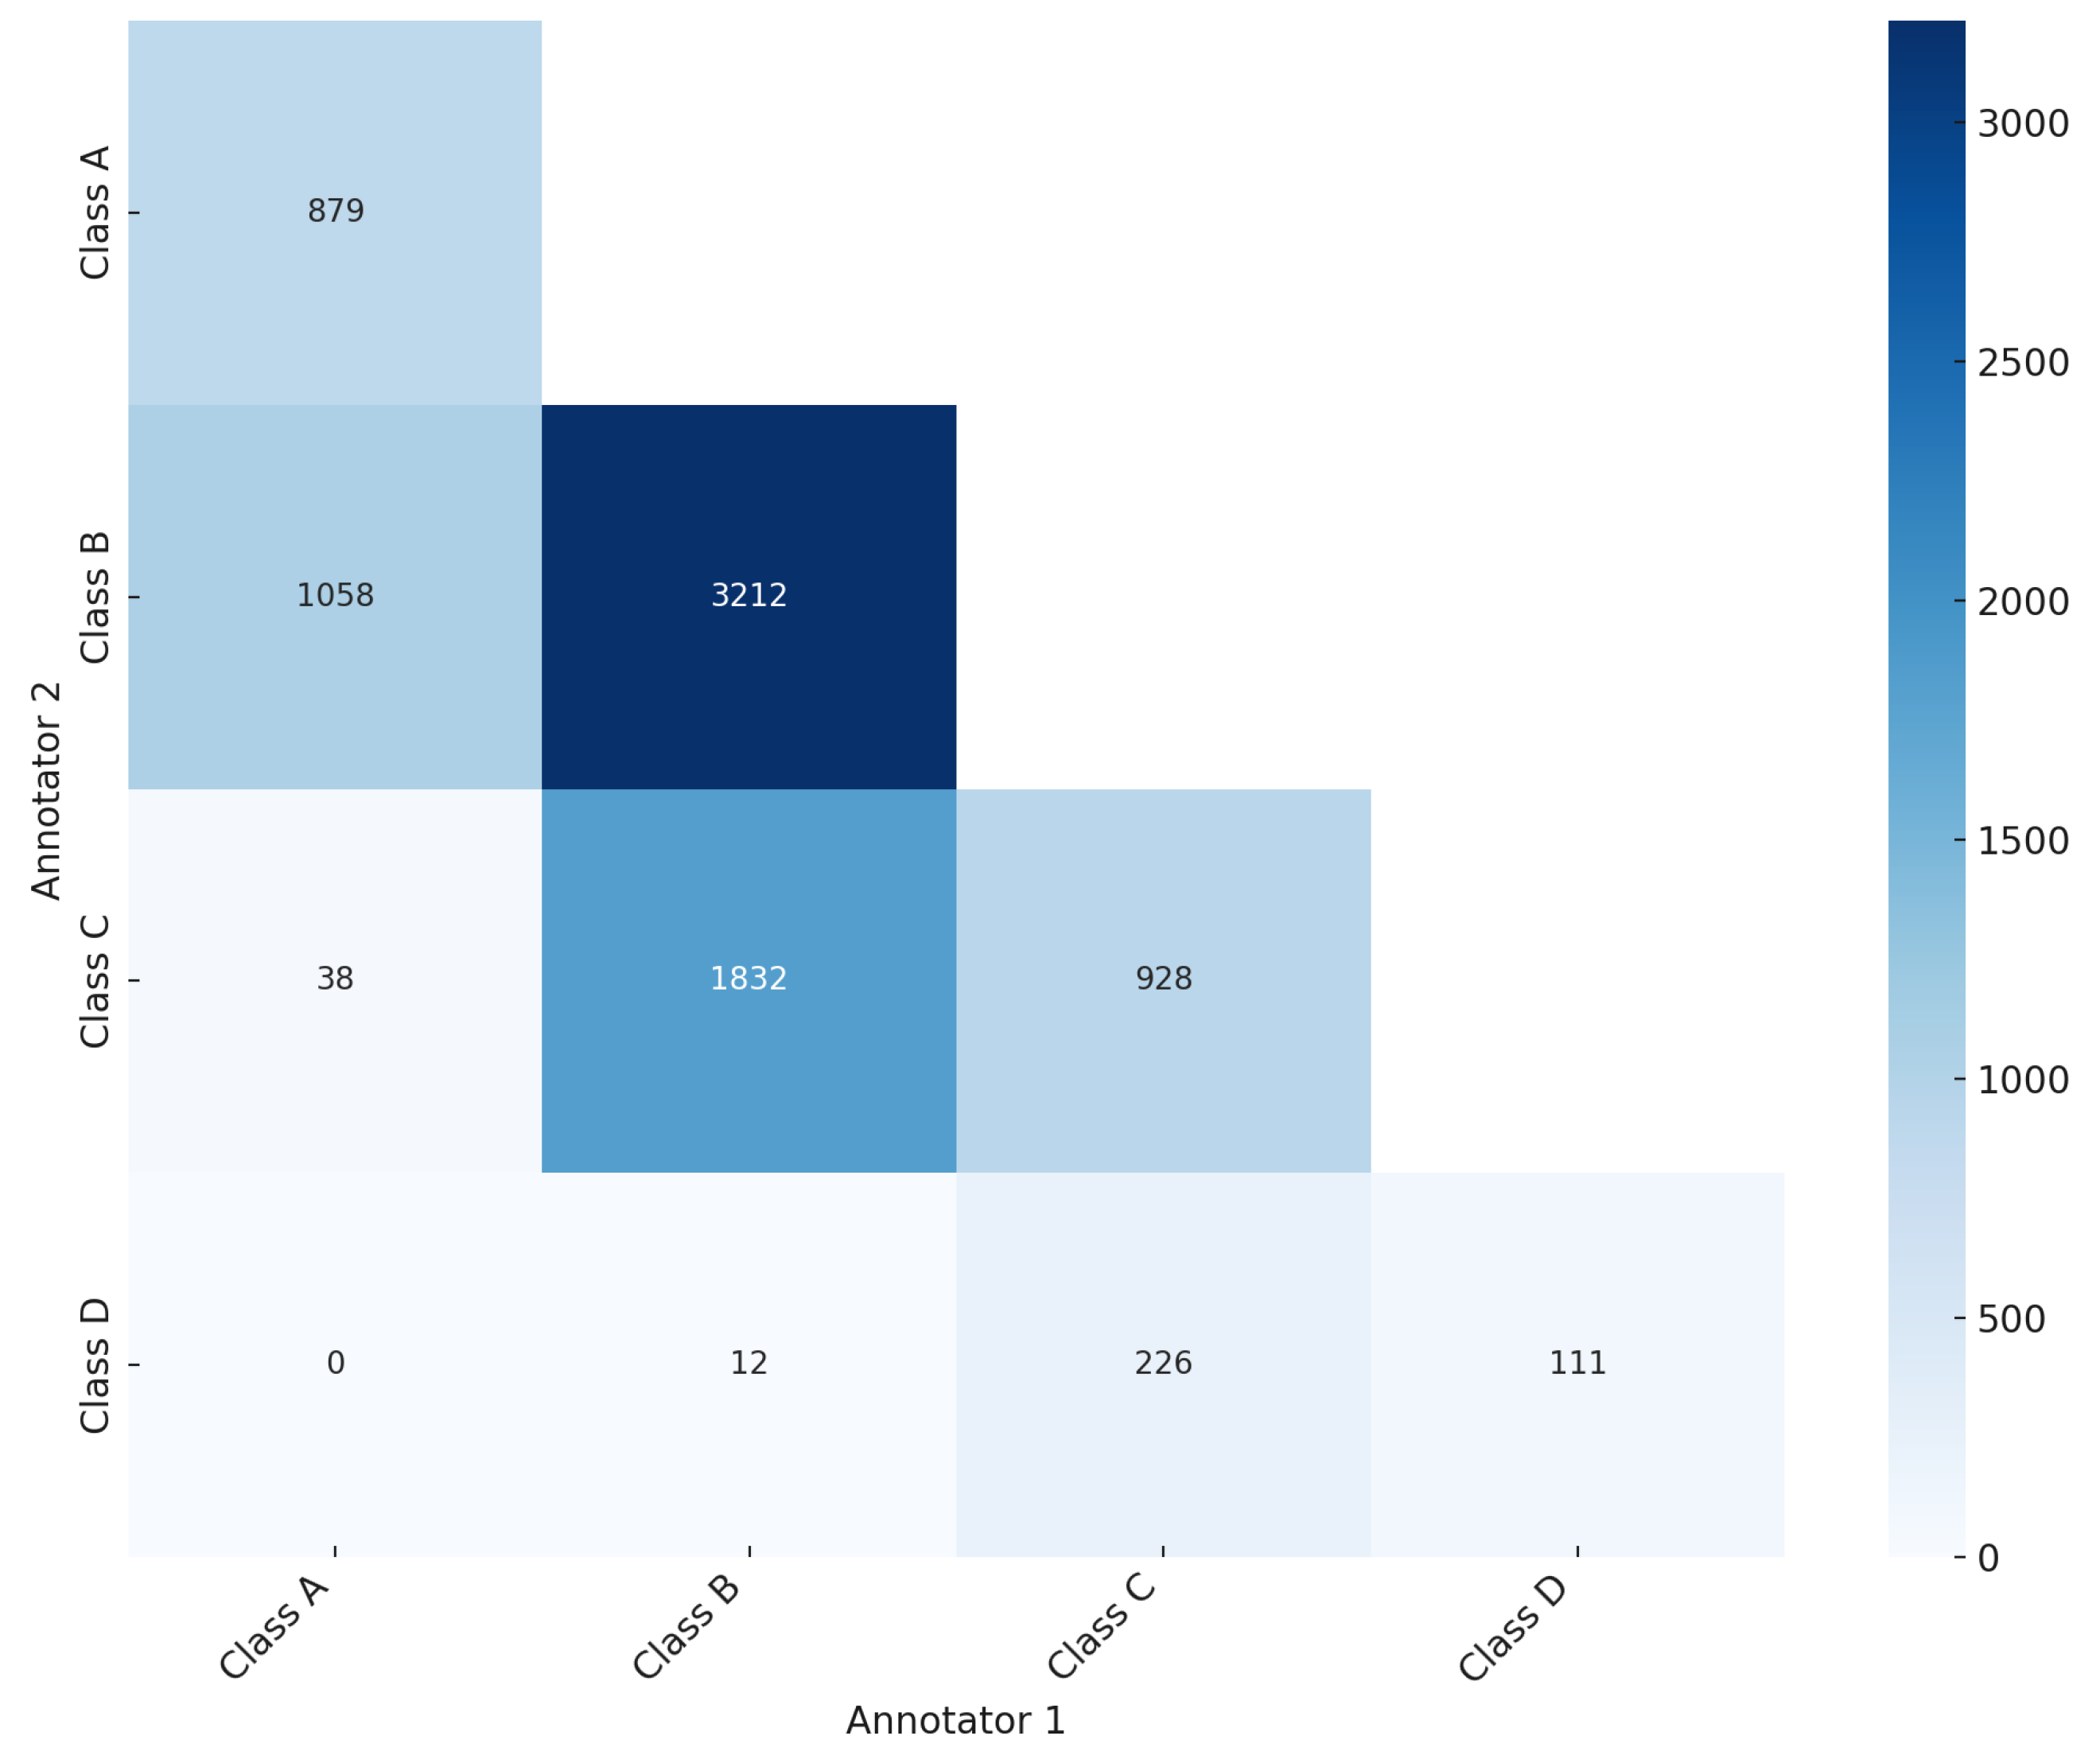
As illustrated in the confusion matrix (Figure 3), the ground truth was established for 5130 mammography studies (20,520 images, 61.84%), while for 3165 studies (12,660 images, 38.16%) the ground truth was not reached. Of the 5130 studies with ground truth, 879 mammography studies (3516 images) were classified as BI-RADS class A, 3212 studies (12,848 images) as BI-RADS class B, 928 studies (3712 images) as BI-RADS class C, and 111 studies (444 images) as BI-RADS class D (Table 1). The significant level of disagreement highlights the challenge of consistent mammographic density interpretation, thereby illustrating the potential value of CAD systems in improving assessment accuracy. This aligns with findings from previous studies [19,20,21], which promote the integration of deep learning models to mitigate variability and enhance evaluation accuracy.

Figure 3.
Confusion matrix showing the agreement and disagreement among annotators in breast density assessment according to BI-RADS breast density classification.

Table 1.
Distribution of the proposed deep learning-based automatic detection algorithm (DLAD, Carebot AI MMG v2.2) training data across BI-RADS breast density categories (A, B, C, D).
3.3. Model Architecture
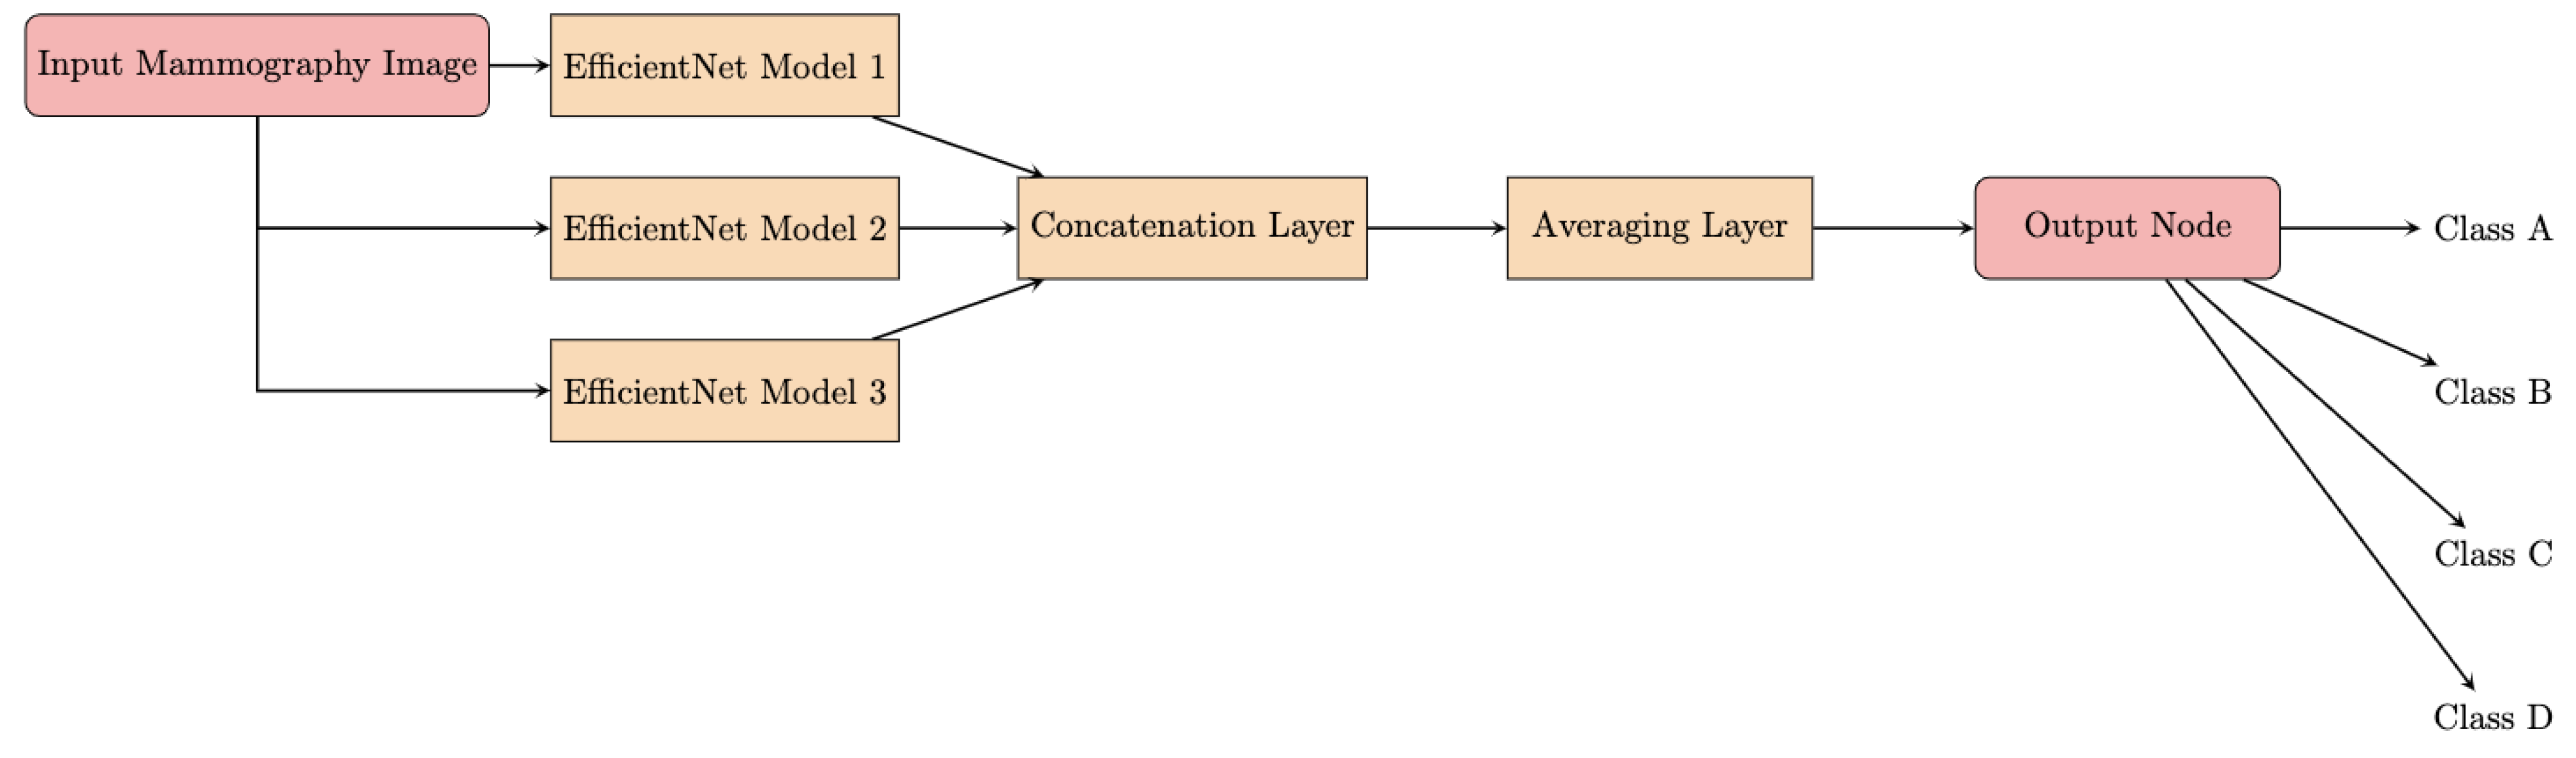
The architecture of the proposed DLAD leverages the model soup approach [22], which involves creating an ensemble model by aggregating weights from multiple independently fine-tuned EfficientNet [23] models. This methodology produces a single model that incorporates the collective attributes of several configurations, each characterized by unique optimizations of the hyperparameters [24]. The foundation of the DLAD architecture is represented by EfficientNet, a scalable convolutional neural network (Figure 4). A major innovation of the network architecture is the methodical scaling of the network’s dimensions—depth, width, and image resolution—to achieve an optimal balance between computational efficiency and model performance. The scalability of EfficientNet enables adaptation to varying dataset characteristics and analytical objectives.

Figure 4.
Flowchart of the model soup architecture.
3.4. Test Data
This multicentric study involves the retrospective evaluation of full-field digital mammography studies from three independent sites: Institution 1 (EUC Mamocentrum Brno) and Institution 2 (Hospital Šumperk), both specializing in screening mammography, and Institution 3 (Masaryk Memorial Cancer Institute), a comprehensive oncology facility offering both screening and diagnostic mammography, including post-surgical mammograms. A total of 122 mammography studies (488 images) were acquired: 60 mammography studies (240 images) were collected from Institution 1 using GE Senographe Essential, 28 studies (112 images) from Institution 2 using GE Senographe Essential, and 34 studies (136 images) from Institution 3 using Hologic Selenia Dimensions and Siemens Healthineers MAMMOMAT Revelation (Table 2).
Table 2.
Distribution of acquired test data by institution and specific mammography X-ray machine type, including the number of mammography studies and images.
All collected images are full-size, with variable dimensions depending on the source institution and mammography machine. All images were exported in the standard Digital Imaging and Communications in Medicine (DICOM) format, modality MG. The images are uncompressed, maintaining the full resolution and quality for accurate analysis. The data were obtained from the referral centers in an anonymized form, preventing any retrospective identification of patients, in compliance with Regulation (EU) 2016/679 of the European Parliament and the Council. Given this, Carebot Ltd. does not have access to any additional clinical information about the patients.
3.5. Ground Truth
The ground truth was established by a consensus of two board-certified radiologists with 13 and 27 years of experience, respectively (Table 3). Consensus was reached in 72 mammography studies (288 images), whereas in 50 studies, there was a disagreement on the BI-RADS breast density category. This resulted in the ground truth not being determined for these studies, and these mammography studies were excluded from the study.
Table 3.
Ground truth annotators and their corresponding experience.
Of the 72 mammography studies (288 images) with ground truth, 33 studies (132 images) were obtained from Institution 1, 15 studies (60 images) from Institution 2, and 24 studies (96 images) from Institution 3 (Table 4).
Table 4.
Refined distribution of test data by institution and mammography X-ray machine type after ground truth assessment, including the number of mammography studies and images.
Regarding the BI-RADS density category, 18 mammography studies (72 images) belonged to BI-RADS class A, 43 studies (172 images) to BI-RADS class B, 7 studies (28 images) to BI-RADS class C, and 4 studies (16 images) to BI-RADS class D (Table 5).
Table 5.
Distribution of test data across BI-RADS breast density categories (A, B, C, D) after ground truth assessment.
3.6. Reader Study
The DLAD analyzes mammography studies in standard projections (CC and MLO) and classifies them according to the ACR BI-RADS Atlas Fifth Edition (class A/B/C/D). The performance of the DLAD evaluated against ground truth is then compared with that of five individual radiologists with varying experience (Table 6).
Table 6.
List of radiologists (RAD 1–RAD 5) participating in the multi-reader study alongside their respective experience levels.
3.7. Statistical Analysis
We conduct a rigorous statistical analysis to evaluate the performance of each method—the proposed DLAD and assessed radiologists in multi-reader study—in classifying BI-RADS breast density. The analysis focuses on key metrics, including accuracy, F1 score (macro-averaged), precision (macro-averaged), recall (macro-averaged), and Cohen’s Kappa () to assess the strength of agreement [25]. As all images were evaluated by all assessed radiologists, we use a bootstrapping method, which involves resampling the test data 1000 times using randomly selected subsets and calculating the metrics for each sample to estimate the 95% confidence intervals (CI) for the statistical metrics.
To evaluate the statistical significance of the differences in accuracy between the DLAD and the assessed radiologists, we calculate p-values using McNemar’s test. The null hypothesis ()—stating that there is no difference in performance between DLAD and the radiologists—is tested against an alternative hypothesis (), which suggests that there is a statistically significant difference in performance (p-value < 0.05) and that the strength of agreement of each method with the ground truth is at least moderate ( > 0.41). Rejection of in favor of would imply both a statistically significant difference and a clinically relevant level of agreement with the ground truth for either method. Alternatively, failing to reject (p-value ≥ 0.05) indicates no statistically significant difference in performance, and a value ≤ 0.41 for each method suggests that the level of agreement with the ground truth is less than moderate.
4. Results
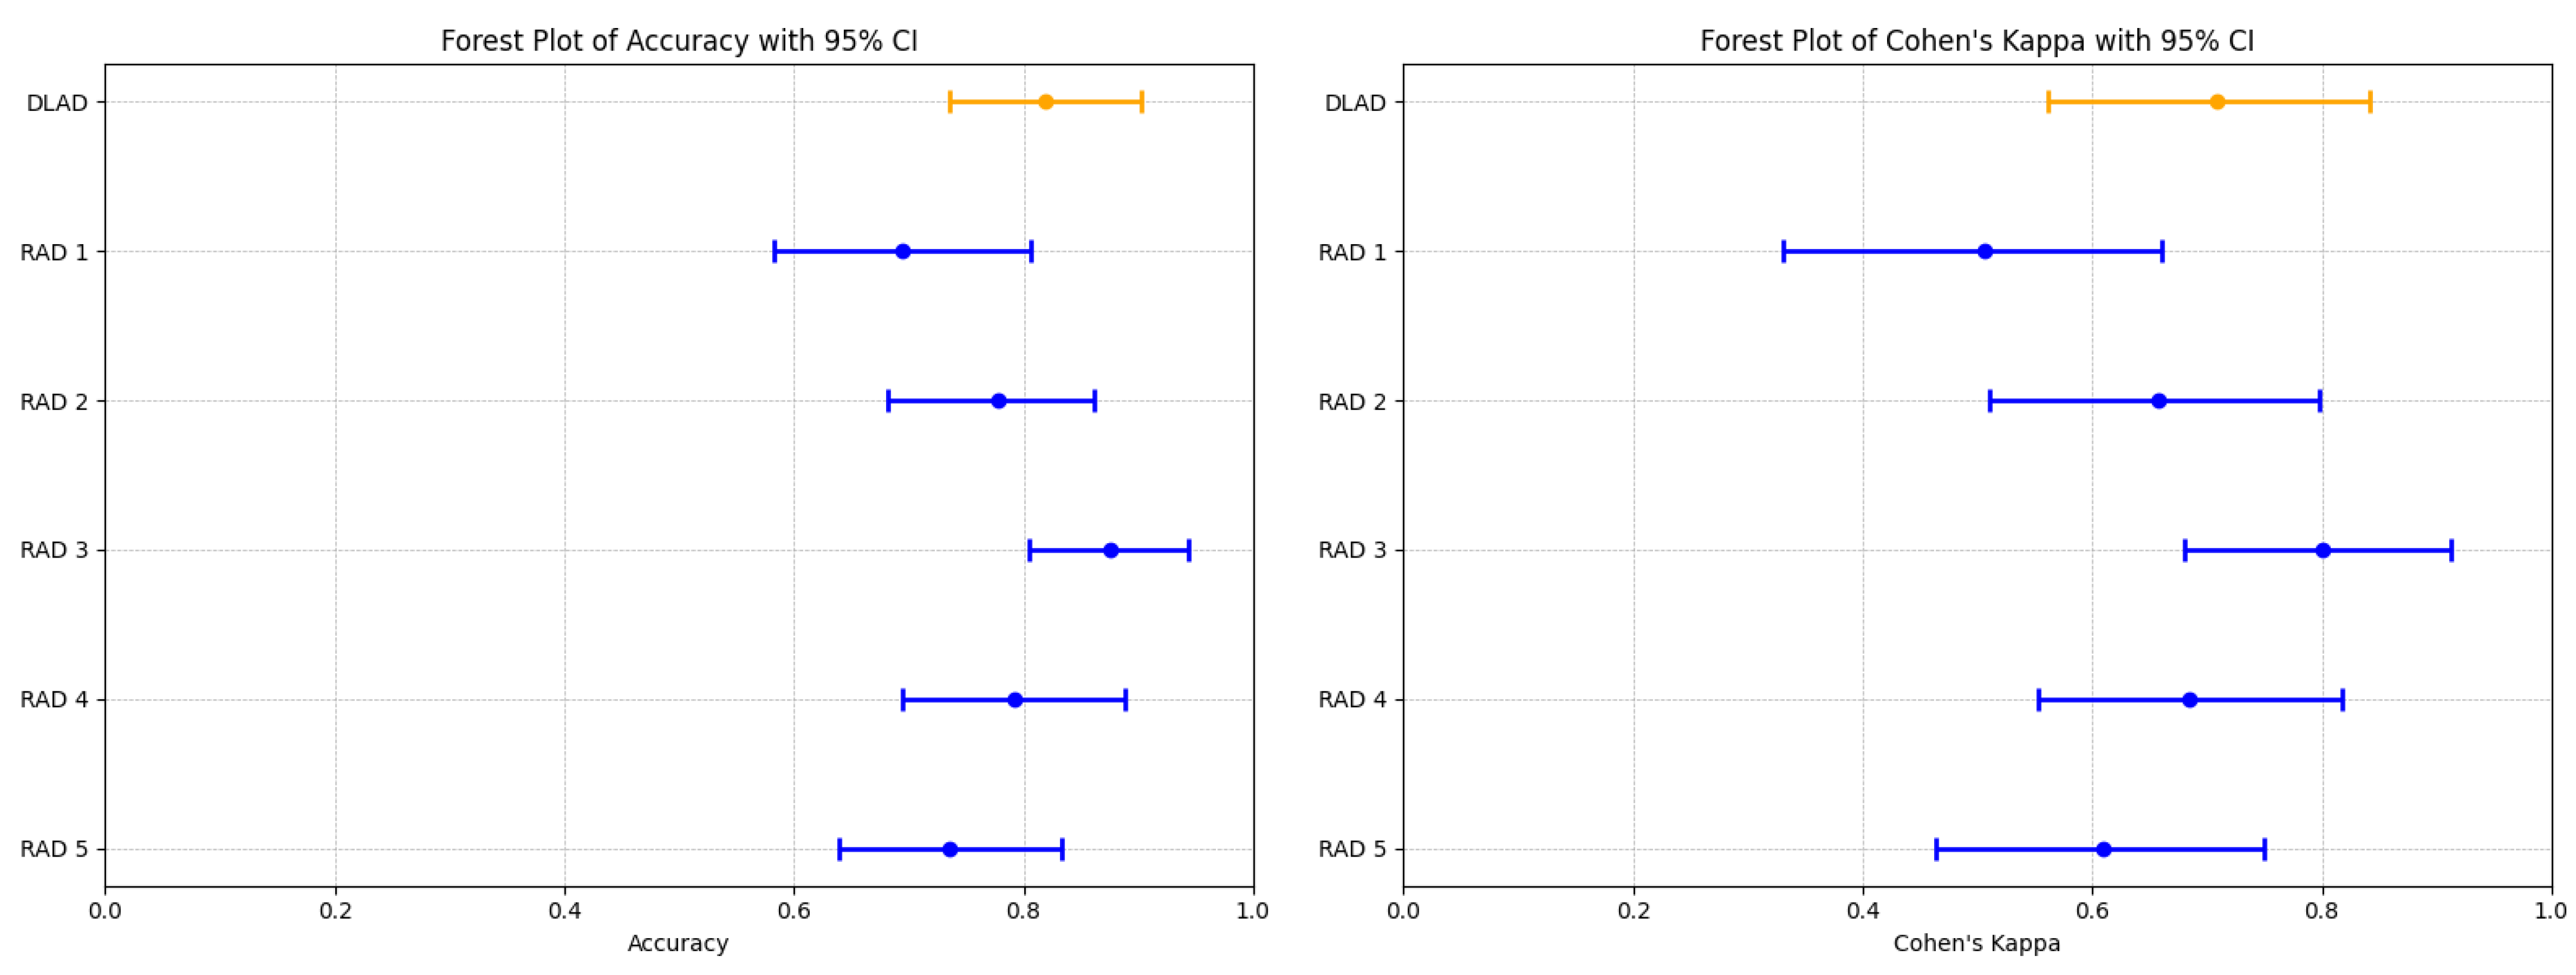
The proposed deep learning-based automatic detection algorithm (DLAD, Carebot AI MMG v2.2) demonstrated notable performance in classifying mammography studies according to BI-RADS categories. Specifically, the DLAD model correctly classified 17 studies as BI-RADS class A, 33 as class B, 6 as class C, and 3 as class D, resulting in an overall accuracy of 0.819 (95% CI: 0.736 to 0.903), and a Cohen’s Kappa () of 0.708 (95% CI: 0.562–0.841), highlighting a substantial agreement with the consensus ground truth (Table 7, Figure 5). The model achieved an F1 score of 0.798 (95% CI: 0.594–0.905), precision of 0.806 (95% CI: 0.596–0.896), and recall of 0.830 (95% CI: 0.650–0.946 (Table 8).
Table 7.
Comparison of Accuracy and Cohen’s Kappa () between DLAD (Carebot AI MMG v2.2) and radiologists (RAD 1–RAD 5).
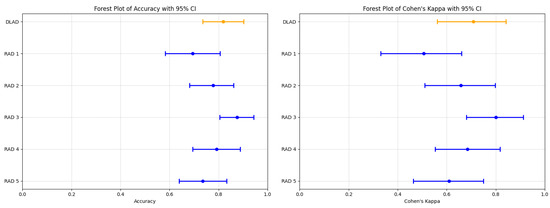
Figure 5.
Forest plots illustrating the performance comparison between the proposed DLAD (Carebot AI MMG v2.2) and assessed radiologists (RAD 1–RAD 5) in terms of Accuracy and Cohen’s Kappa (). Orange lines indicate DLAD, blue lines indicate RAD 1–RAD 5.
Table 8.
Comparison of F1 Score, Precision, and Recall between DLAD (Carebot AI MMG v2.2) and radiologists (RAD 1–RAD 5).
Comparatively, the radiologists’ performance varied (Figure A1), with RAD 3 achieving the highest accuracy of 0.875 (95% CI: 0.805–0.944) and a of 0.800 (95% CI: 0.680–0.912), closely aligning with the DLAD model’s performance metrics. The statistical analysis did not reveal a significant difference in accuracy between the DLAD and the radiologists, as indicated by the p-values (RAD 1: 0.052, RAD 2: 0.606, RAD 3: 0.423, RAD 4: 0.823, RAD 5: 0.327). Additionally, the differences suggest that the level of agreement between the DLAD model and the radiologists is not significantly different, underscoring the model’s competitive diagnostic alignment with professional radiologist assessments.
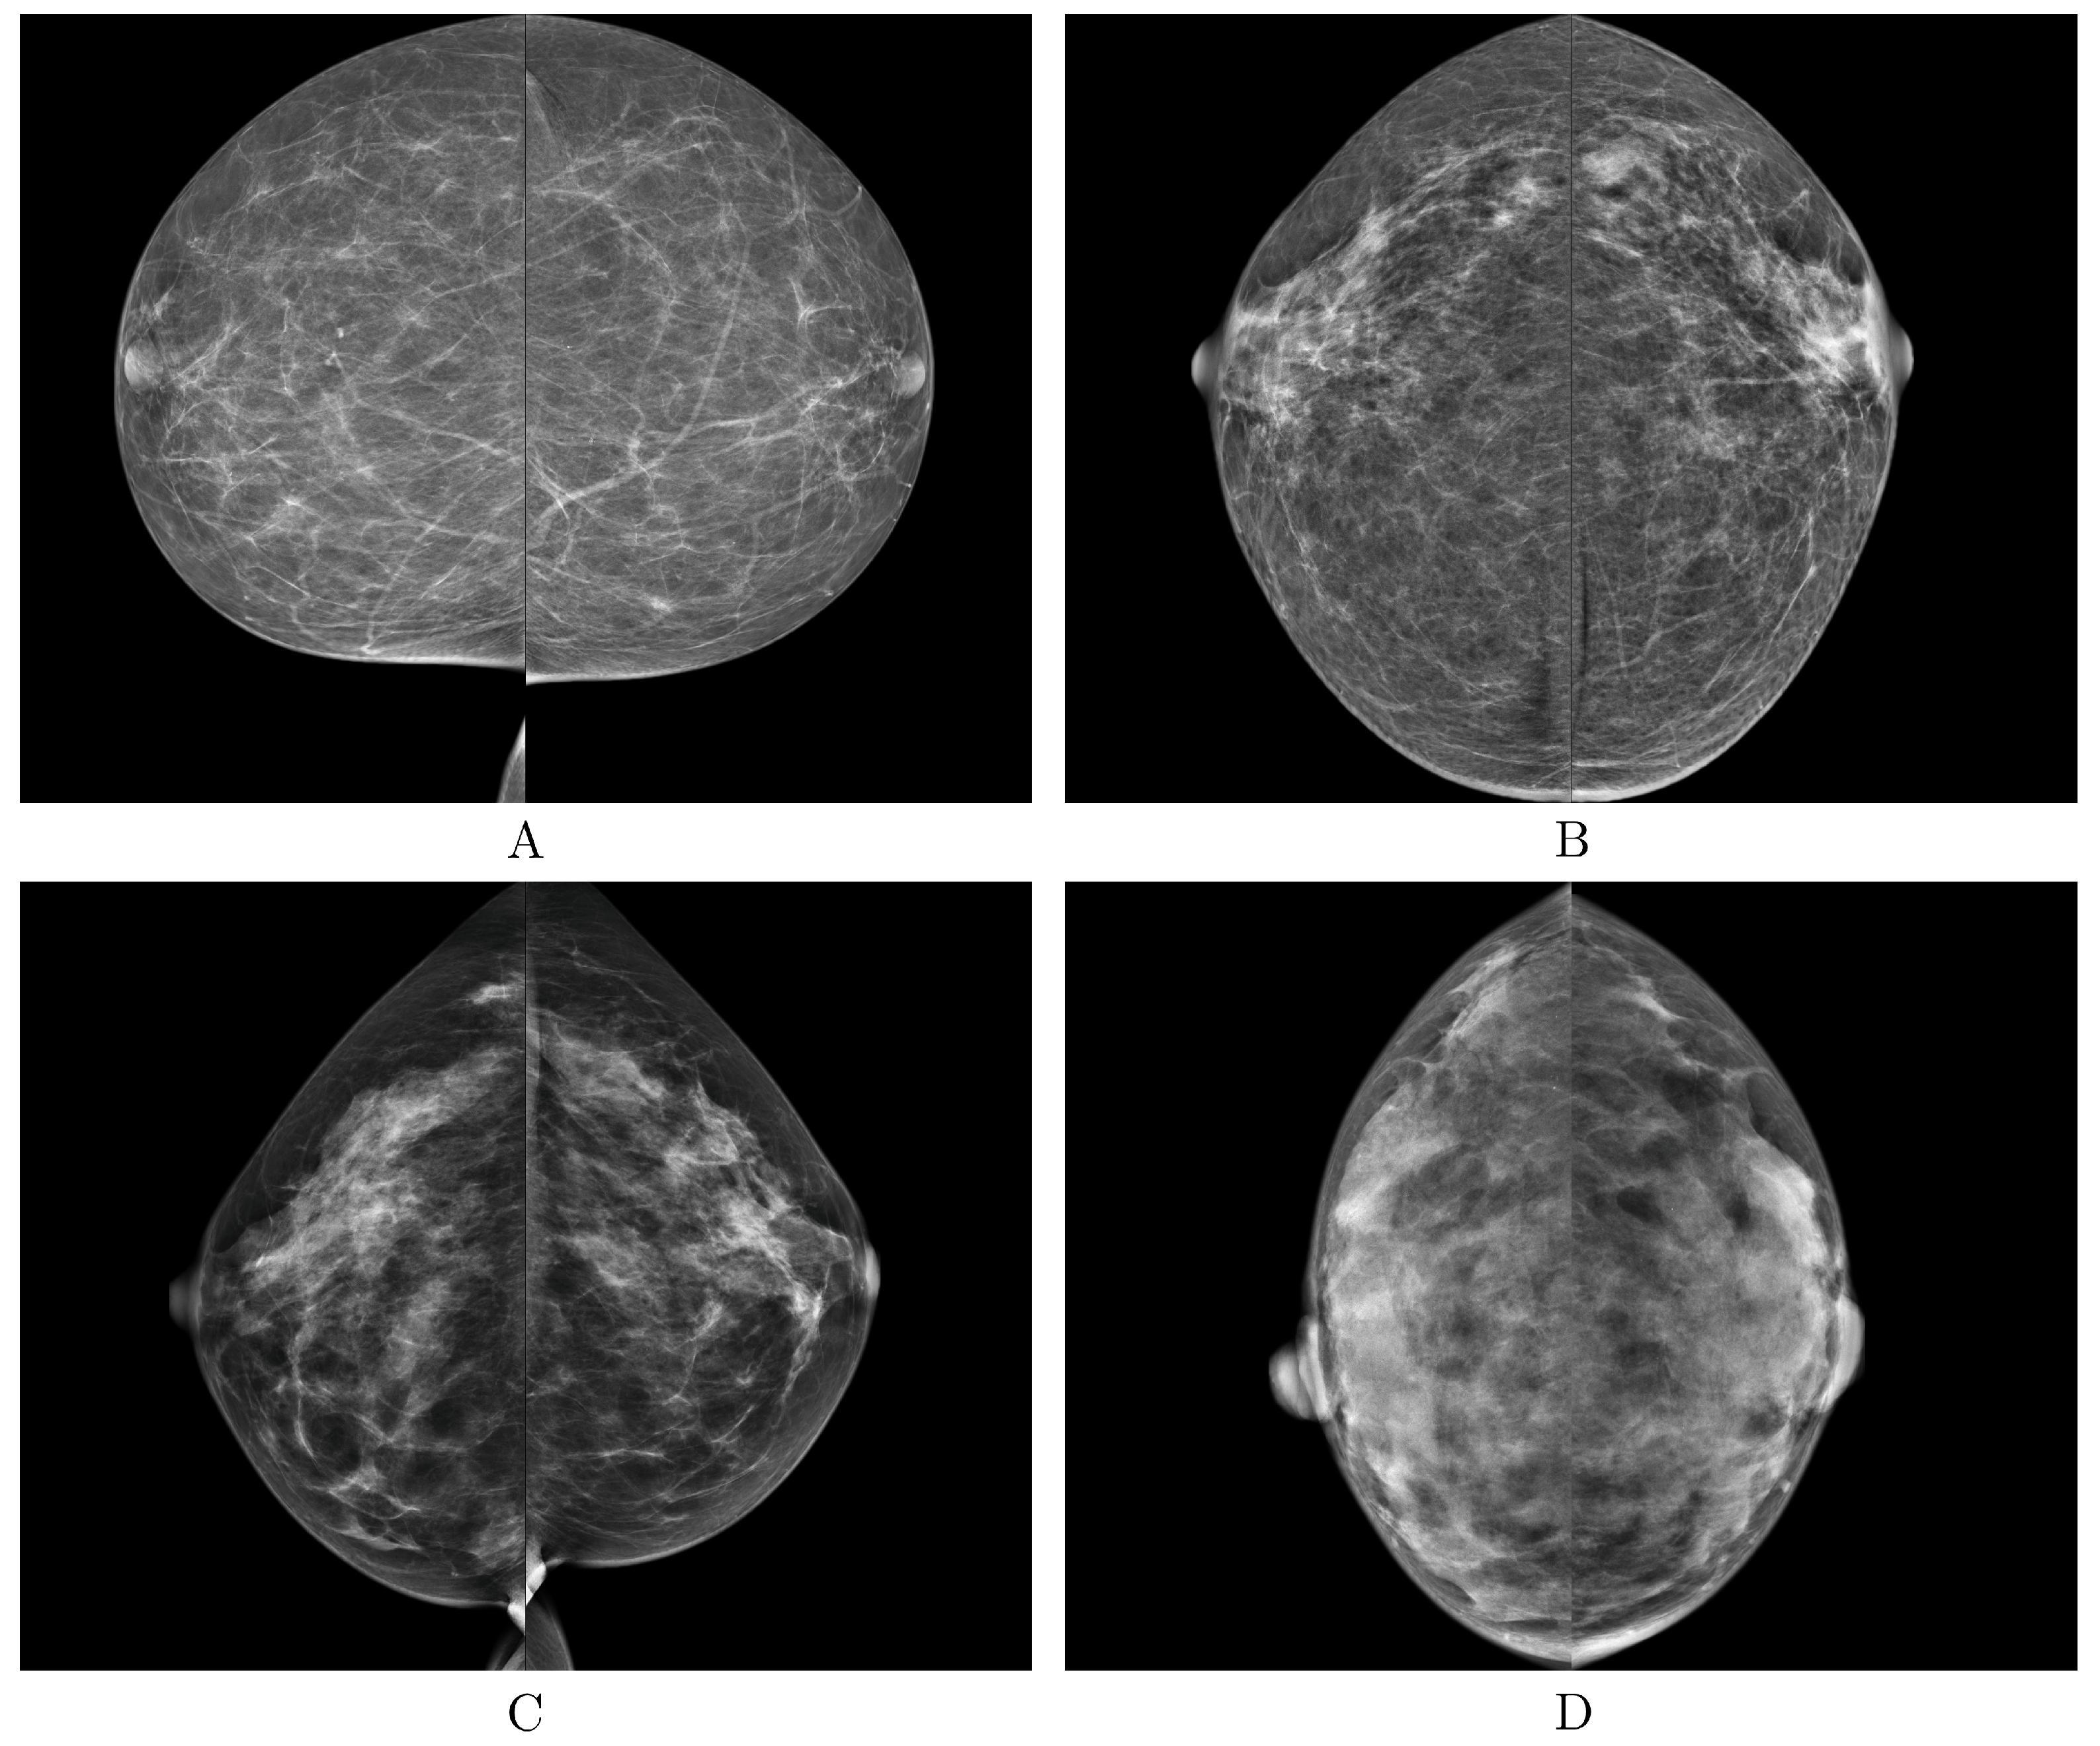
The proposed DLAD achieved robust agreement with the ground truth, as evidenced by its substantial value, and high accuracy in classifying mammography studies according to the BI-RADS scale, also in a multicenter validation involving images representing diverse populations and sourced from three different manufacturers of mammography X-ray machines (GE Senographe Essential, Hologic Selenia Dimensions, and Siemens Healthineers MAMMOMAT Revelation; Figure 6).
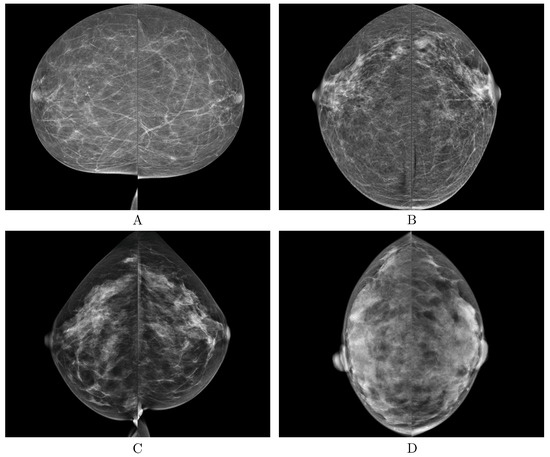
Figure 6.
Examples of the correct predictions made by the deep learning-based automatic detection algorithm (DLAD, Carebot AI MMG v2.2) for each breast density BI-RADS class (A–D).
The most problematic images for classification, i.e., those where the proposed DLAD most frequently misclassified mammography studies according to BI-RADS density categories, involved images from Institution 3. In particular, images containing significant malignant lesions, metal artifacts, clips, and other dimensional factors and objects present in the scans were misclassified (Figure 7).
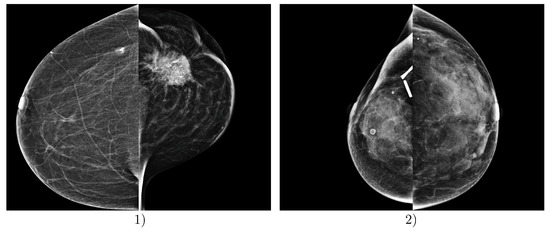
Figure 7.
Examples of incorrect predictions made by the deep learning-based automatic detection algorithm (DLAD, Carebot AI MMG v2.2). Example (1) shows a patient FFDM image with ground truth BI-RADS class A, which was incorrectly assessed by the DLAD as BI-RADS class C, due to the prominent malignant lesion in LCC projection. Example (2) shows a patient FFDM image with ground truth BI-RADS class D, which was incorrectly assessed by the DLAD as BI-RADS class C, due to the post-surgical changes and visible metallic density artifacts in the right breast. Both mammography studies are from Institution 3, e.g., the oncology center.
5. Discussion
In this study, we explored the potential of leveraging a deep learning-based automatic detection algorithm (DLAD) to enhance the consistency and accuracy in determining breast tissue density according to the BI-RADS classification, an endeavor aiming at facilitating more precise risk estimation and augmenting patient care. The DLAD model, based on the model soup architecture, achieved notable accuracy, demonstrating a significant advancement in automated breast density classification. For individual classes, the DLAD achieved robust levels of accuracy and Cohen’s Kappa across BI-RADS breast density categories, correctly classifying 17 studies as BI-RADS class A, 33 as class B, 6 as class C, and 3 as class D. This resulted in an overall accuracy of 0.819 (95% CI: 0.736–0.903) and a Cohen’s Kappa () of 0.708 (95% CI: 0.562–0.841), highlighting a substantial agreement with the consensus ground truth. The proposed DLAD could serve as substantial support in the evaluation process, introducing an additional layer of analysis that would work in tandem with the expertise of radiologists to analyze mammography images. The notable interobserver variability in mammographic density assessments, as evidenced in Section 3.2, highlights the challenge of achieving consistent evaluations and underscores the need for more objective and automated assessment methods, including the determination of ground truth.
The implications of our findings extend to risk-based screening, where accurate density assessments are crucial for determining appropriate follow-up methods. The statistical analysis did not reveal a significant difference in accuracy between DLAD and the radiologists, as indicated by the p-values (RAD 1: 0.052, RAD 2: 0.606, RAD 3: 0.423, RAD 4: 0.823, RAD 5: 0.327), suggesting that the DLAD’s performance is competitively aligned with that of human experts. Furthermore, the differences and the associated strength of agreement underline the DLAD model’s comparable diagnostic agreement with the professional radiological assessments. Overall, the robustness of our findings is supported by the diversity of image sources, i.e., multiple mammography X-ray machines, and patient selection in our study, which included mammography studies from a variety of institutions with different focuses, including screening and diagnostic centers. This diversity ensures that the performance of the DLAD model is validated under a wide range of real-world conditions, confirming its applicability and effectiveness in a variety of clinical settings.
Limitations
Despite the promising results of the proposed DLAD in the evaluation of breast tissue density evaluation, our study faces several limitations that must be acknowledged. Firstly, the distribution of breast densities in our dataset did not reflect the prevalence in the general population [26,27]. This discrepancy could impact the generalizability of our results and indicate a need for more representative and extensive sample selection in future studies. Moreover, while our research aligns with the evolving role of AI in breast cancer risk prediction, the limited number of mammograms evaluated—particularly for the BI-RADS class D—presents significant limitations. These factors restrict the robustness of our conclusions and underscore the necessity for future research to encompass larger, more diverse datasets. This expansion would enable a more comprehensive evaluation of DLAD’s effectiveness across the spectrum of breast densities encountered in broader population samples. Additionally, exploring technical solutions for more objective image analysis remains a critical area for further research, aiming to minimize subjectivity in breast density assessments and enhance the predictive accuracy of risk models. Nonetheless, DLAD’s main challenges were inaccuracies in classifying mammography studies with post-surgical changes or artifacts.
6. Conclusions
This study demonstrated the deep learning-based automatic detection algorithm’s (DLAD) potential to improve the consistency and accuracy of breast tissue density classification per BI-RADS categories, aiming to refine risk stratification and patient care. Achieving notable accuracy, the DLAD model could significantly support radiologists by providing an additional analytical layer for mammography image evaluation. Given the prevalent interobserver variability in density assessments, our findings underscore the urgency for more objective, automated methods to ensure consistent evaluations.
Author Contributions
Conceptualization, M.B. and D.K.; methodology, D.K., J.D. and E.J.; software, M.B., D.K. and R.H.; validation, D.K., J.D. and A.A.; formal analysis, D.K.; investigation, D.K.; resources, D.K.; data curation, J.D.; writing—original draft preparation, D.K.; writing—review and editing, D.K. and M.A.A.-a.; visualization, D.K.; supervision, D.K. and M.B.; project administration, D.K.; funding acquisition, D.K. All authors have read and agreed to the published version of the manuscript.
Funding
This research was funded by Carebot, Ltd.
Institutional Review Board Statement
The acquisition of mammography studies from Institution 1 was enabled by the contract for the transfer of mammography images for medical research purposes (Smlouva o předání mamografických snímků pro účely medicínského výzkumu), signed on 14 January 2022. The acquisition of mammography studies from Institution 2 was enabled by the contract for the transfer of mammography images for medical research purposes (Smlouva o předání mamografických snímků pro účely medicínského výzkumu), signed on 31 January 2023. The acquisition of mammography studies from Institution 3 was enabled by the amendment to the contract for the transfer of X-ray images for medical research purposes (Dodatek ke smlouvě o předání rentgenových snímků), signed on 21 February 2023, which follows the contract for the transfer of X-ray images for medical research purposes (Smlouva o předání rentgenových snímků pro účely medicínského výzkumu), signed on 3 January 2022. Full information can be found on ClinicalTrials.gov under identifier NCT06428799: https://clinicaltrials.gov/study/NCT06428799.
Informed Consent Statement
Patient consent was waived due to Regulation 2016/679 of the European Parliament and of the Council of 27 April 2016 on the protection of natural persons with regard to the processing of personal data and on the free movement of such data, and the repealing of Directive 95/46/EC (General Data Protection Regulation); i.e., the mammography studies were stripped of all direct or indirect identifiers without the possibility of retrospective patient identification.
Data Availability Statement
Data from this study can be provided by Carebot, Ltd., to independent researchers. Please contact the author for more information, if required.
Conflicts of Interest
In relation to this study, we declare the following conflicts of interest: The study was funded by Carebot, Ltd.; M.B., D.K., J.D., R.H. and A.A. are employees of Carebot, Ltd. The authors E.J. and M.A.A. declare no conflicts of interest.
Abbreviations
The following abbreviations are used in this manuscript:
| DLAD | deep learning-based automatic detection algorithm |
| CAD | computer-aided diagnosis |
| CNN | convolutional neural network |
| BI-RADS | Breast Imaging-Reporting and Data System |
| CI | confidence interval |
Appendix A
Table A1.
Summary of key studies on breast density classification using deep learning approaches.
Table A1.
Summary of key studies on breast density classification using deep learning approaches.
| No. | Authors | Key Contribution | Datasets | Methodology | Performance Metrics |
|---|---|---|---|---|---|
| [13] | Kallenberg et al. | Unsupervised deep learning for breast density segmentation and mammographic risk scoring. | Three clinical datasets; details not fully specified. | Convolutional Sparse Autoencoders (CSAE); Unsupervised feature learning. | Pearson correlation for PMD: 0.85 |
| [14] | Mohamed et al. | Classifying mammographic breast density categories between “scattered density” and “heterogeneously dense”. | 22,000 digital mammogram images from 1427 women. | CNN with transfer learning and training from scratch. | AUC: 0.9421 when trained from scratch; AUC increased to 0.9882 after refining the dataset. |
| [15] | Becker et al. | Evaluate diagnostic accuracy of a multipurpose image analysis software. | Dual-center retrospective study of 3228 mammograms; external validation with a publicly available dataset. | Artificial neural network trained on retrospective and prospective cohort data. | AUC: 0.82; comparable to experienced radiologists (AUC: 0.77–0.87). |
| [16] | Li et al. | Multi-view mammographic density classification using dilated and attention-guided residual learning. | Two datasets: a clinical dataset and the INBreast dataset. | Dilated and attention-guided residual learning | Accuracy: 88.7% on the clinical dataset, 70.0% on the INBreast dataset. |
| [17] | Deng et al. | SE-Attention neural networks for breast density classification. | 18,157 images from 4982 patients from Shanxi Medical University. | SE-Attention integrated into a CNN framework. | Enhanced performance over traditional models with accuracies reaching up to 92.17% for Inception-V4-SE. |
| [18] | Wu et al. | Deep learning for automated breast density classification in over 200,000 screening mammograms. | 201,179 exams, containing 19,939 class 0, 85,665 class 1, 83,852 class 2, and 11,723 class 3 exams. | Multi-column deep convolutional neural networks (CNNs). | Top-1 accuracy: 76.7%, Top-2 accuracy: 98.2%, macAUC: 0.916. |
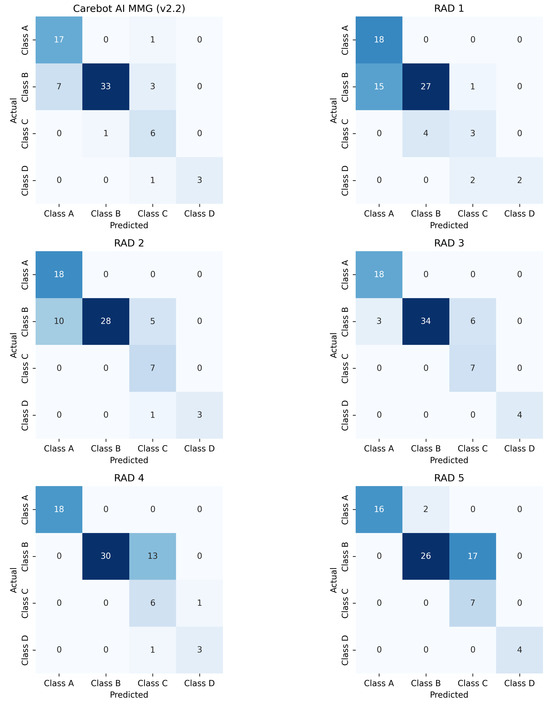
Figure A1.
Confusion matrix for the proposed DLAD (Carebot AI MMG v2.2) and the assessed radiologists.
Figure A1.
Confusion matrix for the proposed DLAD (Carebot AI MMG v2.2) and the assessed radiologists.
References
- Broeders, M.; Moss, S.; Nyström, L.; Njor, S.; Jonsson, H.; Paap, E.; Massat, N.; Duffy, S.; Lynge, E.; Paci, E. The impact of mammographic screening on breast cancer mortality in Europe: A review of observational studies. J. Med. Screen. 2012, 19, 14–25. [Google Scholar] [CrossRef] [PubMed]
- De Gelder, R.; Fracheboud, J.; Heijnsdijk, E.; Heeten, G.; Verbeek, A.; Broeders, M.; Draisma, G.; De Koning, H. Digital mammography screening: Weighing reduced mortality against increased overdiagnosis. Prev. Med. 2011, 53, 134–140. [Google Scholar] [CrossRef]
- Boyd, N.; Guo, H.; Martin, L.; Sun, L.; Stone, J.; Fishell, E.; Jong, R.; Hislop, G.; Chiarelli, A.; Minkin, S. Others Mammographic density and the risk and detection of breast cancer. N. Engl. J. Med. 2007, 356, 227–236. [Google Scholar] [CrossRef] [PubMed]
- Ellenbogen, P. BI-RADS: Revised and replicated. J. Am. Coll. Radiol. 2014, 11, 2. [Google Scholar] [CrossRef] [PubMed]
- Gweon, H.; Youk, J.; Kim, J.; Son, E. Radiologist assessment of breast density by BI-RADS categories versus fully automated volumetric assessment. AJR Am. J. Roentgenol. 2013, 201, 692–697. [Google Scholar] [CrossRef] [PubMed]
- Bernardi, D.; Pellegrini, M.; Michele, S.; Tuttobene, P.; Fantò, C.; Valentini, M.; Gentilini, M.; Ciatto, S. Interobserver agreement in breast radiological density attribution according to BI-RADS quantitative classification. Radiol. Med. 2012, 117, 519–528. [Google Scholar] [CrossRef] [PubMed]
- Portnow, L.; Choridah, L.; Kardinah, K.; Handarini, T.; Pijnappel, R.; Bluekens, A.; Duijm, L.; Schoub, P.; Smilg, P.; Malek, L.; et al. International Interobserver Variability of Breast Density Assessment. J. Am. Coll. Radiol. 2023, 20, 671–684. [Google Scholar] [CrossRef] [PubMed]
- Koch, H.; Larsen, M.; Bartsch, H.; Kurz, K.; Hofvind, S. Artificial intelligence in BreastScreen Norway: A retrospective analysis of a cancer-enriched sample including 1254 breast cancer cases. Eur. Radiol. 2023, 33, 3735–3743. [Google Scholar] [CrossRef] [PubMed]
- Zhu, X.; Wolfgruber, T.; Leong, L.; Jensen, M.; Scott, C.; Winham, S.; Sadowski, P.; Vachon, C.; Kerlikowske, K.; Shepherd, J. Deep learning predicts interval and screening-detected cancer from screening mammograms: A case-case-control study in 6369 women. Radiology 2021, 301, 550–558. [Google Scholar] [CrossRef]
- Gastounioti, A.; Eriksson, M.; Cohen, E.; Mankowski, W.; Pantalone, L.; Ehsan, S.; McCarthy, A.; Kontos, D.; Hall, P.; Conant, E. External Validation of a Mammography-Derived AI-Based Risk Model in a US Breast Cancer Screening Cohort of White and Black Women. Cancers 2022, 14, 4803. [Google Scholar] [CrossRef]
- Leeuwen, K.; Rooij, M.; Schalekamp, S.; Ginneken, B.; Rutten, M. How does artificial intelligence in radiology improve efficiency and health outcomes? Pediatr. Radiol. 2021, 52, 2087–2093. [Google Scholar] [CrossRef] [PubMed]
- Redondo, A.; Comas, M.; Macia, F.; Ferrer, F.; Murta-Nascimento, C.; Maristany, M.; Molins, E.; Sala, M.; Castells, X. Inter-and intraradiologist variability in the BI-RADS assessment and breast density categories for screening mammograms. Br. J. Radiol. 2012, 85, 1465–1470. [Google Scholar] [CrossRef] [PubMed]
- Kallenberg, M.; Petersen, K.; Nielsen, M.; Ng, A.; Diao, P.; Igel, C.; Vachon, C.; Holland, K.; Winkel, R.; Karssemeijer, N. Others Unsupervised deep learning applied to breast density segmentation and mammographic risk scoring. IEEE Trans. Med. Imaging 2016, 35, 1322–1331. [Google Scholar] [CrossRef] [PubMed]
- Mohamed, A.; Berg, W.; Peng, H.; Luo, Y.; Jankowitz, R.; Wu, S. A deep learning method for classifying mammographic breast density categories. Med. Phys. 2018, 45, 314–321. [Google Scholar] [CrossRef] [PubMed]
- Becker, A.; Marcon, M.; Ghafoor, S.; Wurnig, M.; Frauenfelder, T.; Boss, A. Deep learning in mammography: Diagnostic accuracy of a multipurpose image analysis software in the detection of breast cancer. Investig. Radiol. 2017, 52, 434–440. [Google Scholar] [CrossRef] [PubMed]
- Li, C.; Xu, J.; Liu, Q.; Zhou, Y.; Mou, L.; Pu, Z.; Xia, Y.; Zheng, H.; Wang, S. Multi-view mammographic density classification by dilated and attention-guided residual learning. IEEE/ACM Trans. Comput. Biol. Bioinform. 2020, 18, 1003–1013. [Google Scholar] [CrossRef] [PubMed]
- Deng, J.; Ma, Y.; Li, D.; Zhao, J.; Liu, Y.; Zhang, H. Classification of breast density categories based on SE-Attention neural networks. Comput. Methods Programs Biomed. 2020, 193, 105489. [Google Scholar] [CrossRef] [PubMed]
- Wu, N.; Geras, K.; Shen, Y.; Su, J.; Kim, S.; Kim, E.; Wolfson, S.; Moy, L.; Cho, K. Breast density classification with deep convolutional neural networks. In Proceedings of the 2018 IEEE International Conference On Acoustics, Speech And Signal Processing (ICASSP), Calgary, AB, Canada, 15–20 April 2018; pp. 6682–6686. [Google Scholar]
- Sergeant, J.; Walshaw, L.; Wilson, M.; Seed, S.; Barr, N.; Beetles, U.; Boggis, C.; Bundred, S.; Gadde, S.; Lim, Y. Others Same task, same observers, different values: The problem with visual assessment of breast density. In Proceedings of the Medical Imaging 2013: Image Perception, Observer Performance, and Technology Assessment, Lake Buena Vista, FL, USA, 9–14 February 2013; Volume 8673, pp. 197–204. [Google Scholar]
- Alomaim, W.; O’Leary, D.; Ryan, J.; Rainford, L.; Evanoff, M.; Foley, S. Variability of breast density classification between US and UK radiologists. J. Med. Imaging Radiat. Sci. 2019, 50, 53–61. [Google Scholar] [CrossRef] [PubMed]
- Alomaim, W.; O’Leary, D.; Ryan, J.; Rainford, L.; Evanoff, M.; Foley, S. Subjective versus quantitative methods of assessing breast density. Diagnostics 2020, 10, 331. [Google Scholar] [CrossRef]
- Wortsman, M.; Ilharco, G.; Gadre, S.; Roelofs, R.; Gontijo-Lopes, R.; Morcos, A.; Namkoong, H.; Farhadi, A.; Carmon, Y.; Kornblith, S. Others Model soups: Averaging weights of multiple fine-tuned models improves accuracy without increasing inference time. In Proceedings of the International Conference On Machine Learning, Baltimore, MD, USA, 17–23 July 2022; pp. 23965–23998. [Google Scholar]
- Tan, M.; Le, Q. Efficientnet: Rethinking model scaling for convolutional neural networks. In Proceedings of the International Conference On Machine Learning, Long Beach, CA, USA, 10–15 June 2019; pp. 6105–6114. [Google Scholar]
- Dansereau, C.; Sobral, M.; Bhogal, M.; Zalai, M. Model soups to increase inference without increasing compute time. arXiv 2023, arXiv:2301.10092. [Google Scholar]
- McHugh, M. Interrater reliability: The kappa statistic. Biochem. Medica 2012, 22, 276–282. [Google Scholar] [CrossRef]
- Sprague, B.; Gangnon, R.; Burt, V.; Trentham-Dietz, A.; Hampton, J.; Wellman, R.; Kerlikowske, K.; Miglioretti, D. Prevalence of mammographically dense breasts in the United States. J. Natl. Cancer Inst. 2014, 106, dju255. [Google Scholar] [CrossRef] [PubMed]
- Advani, S.; Zhu, W.; Demb, J.; Sprague, B.; Onega, T.; Henderson, L.; Buist, D.; Zhang, D.; Schousboe, J.; Walter, L. Others Association of breast density with breast cancer risk among women aged 65 years or older by age group and body mass index. JAMA Netw. Open 2021, 4, e2122810. [Google Scholar] [CrossRef] [PubMed]


Disclaimer/Publisher’s Note: The statements, opinions and data contained in all publications are solely those of the individual author(s) and contributor(s) and not of MDPI and/or the editor(s). MDPI and/or the editor(s) disclaim responsibility for any injury to people or property resulting from any ideas, methods, instructions or products referred to in the content. |
© 2024 by the authors. Licensee MDPI, Basel, Switzerland. This article is an open access article distributed under the terms and conditions of the Creative Commons Attribution (CC BY) license (https://creativecommons.org/licenses/by/4.0/).