
Development of an Innovative Pupillometer Able to Selectively Stimulate the Eye’s Fundus Photoreceptor Cells


Abstract
:1. Introduction
1.1. Pupillometers—State of the Art
1.2. Silent Substitution Technique
1.3. Pupillometry Combined with Silent Substitution Technique
2. Materials and Methods
2.1. Silenced Pupillometer
2.1.1. Optical Setup
2.1.2. Electronics
2.1.3. Alignment and Pupil Measurements
2.2. Characterization and Calibration Measurements Setup
- Powermeter: The radiant flux of the system at the exit pupil was measured using a Thorlabs (Newton, NJ, USA) PM100D coupled with an S120VC optical head. The instrument is designed to sample radiant flux between 50 nW and 50 mW within the wavelength range of 200 nm to 1100 nm. It has a sensitive area of mm and a typical uncertainty of in the visible range. The sampling time was 50 ms, and readings were taken in Amperes to ensure precision and wavelength independence. The sensitivity of the optical head (A/W) was then used to convert the measurement to radiant intensity.
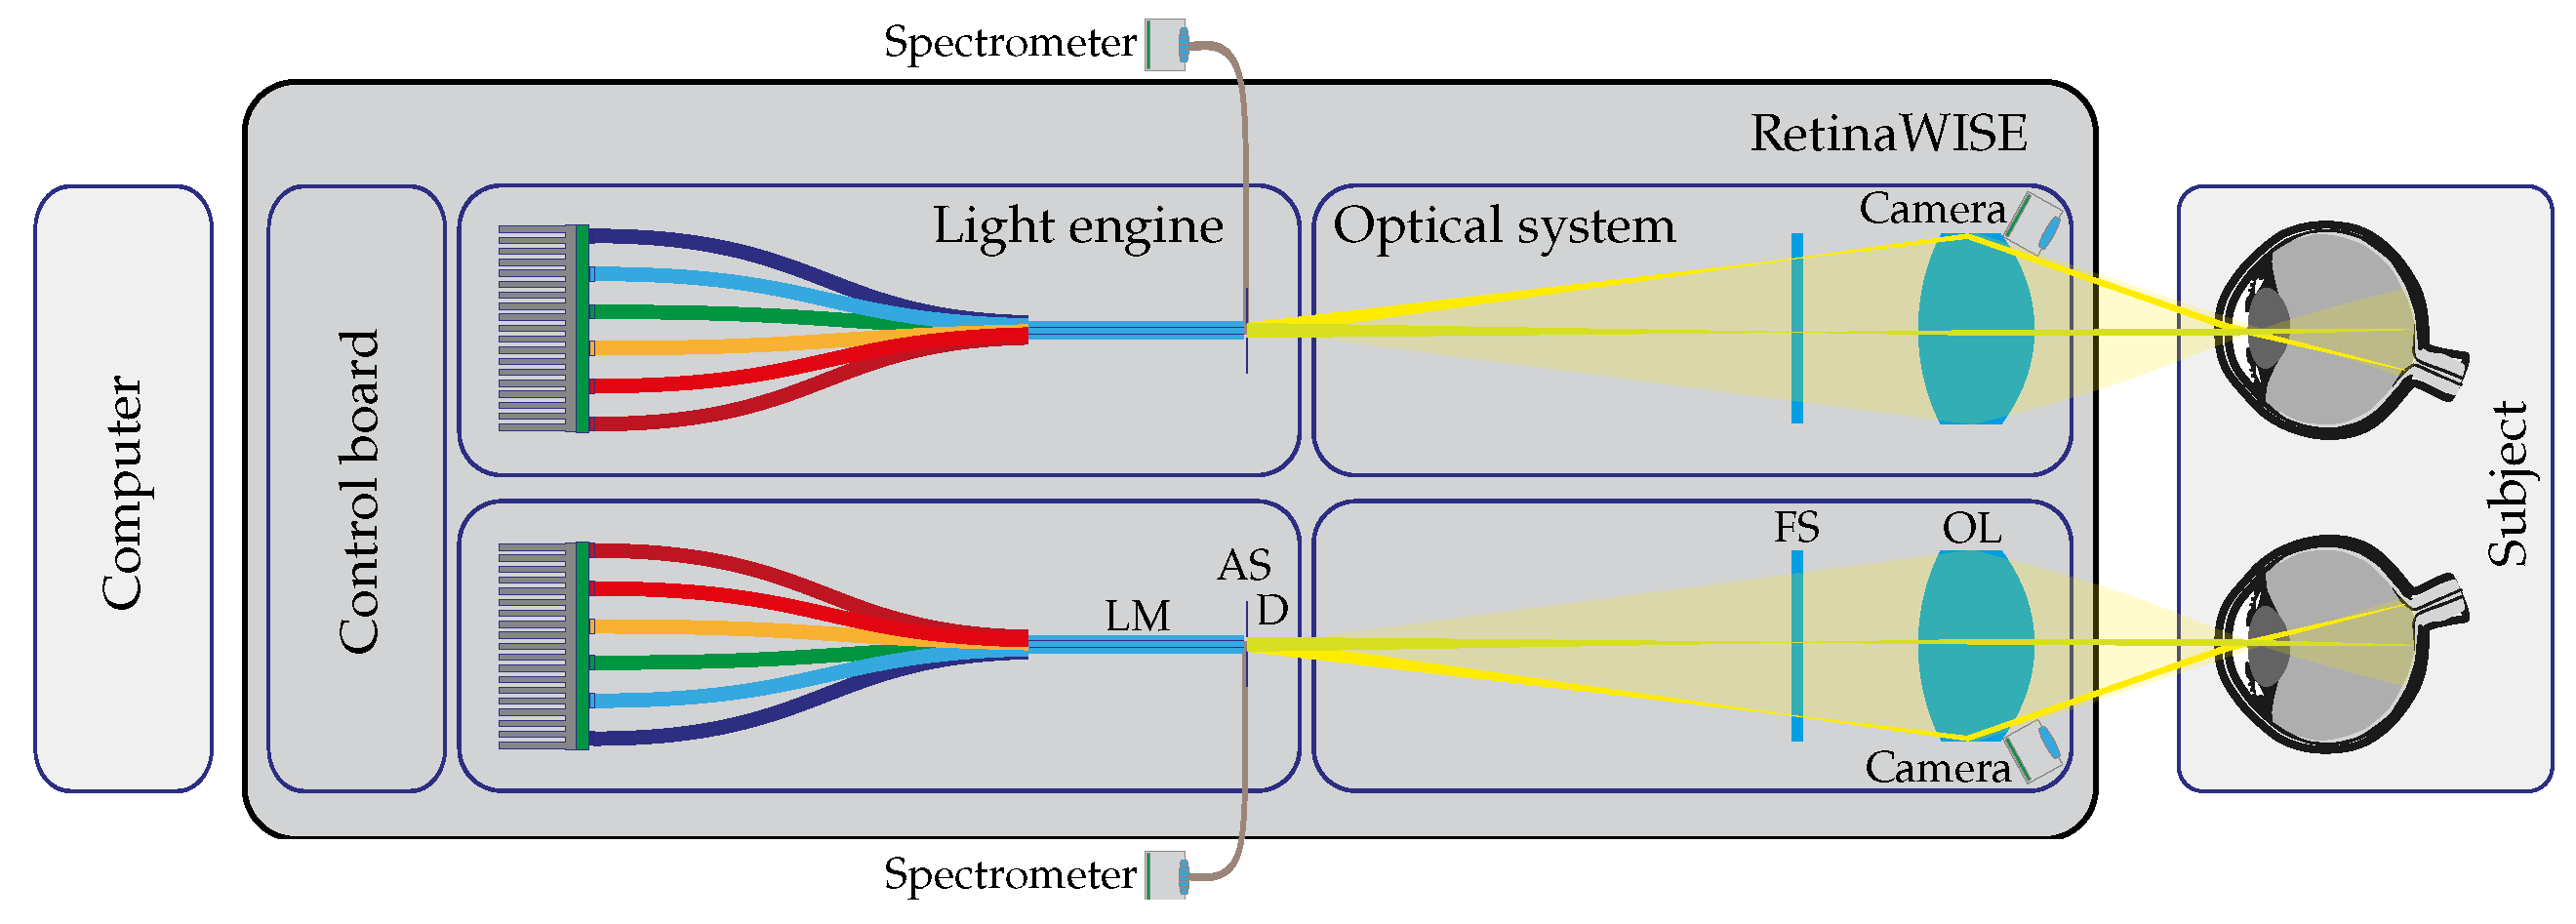
- Fiber-Coupled Mini-Spectrometer: The C10988MA-1 Hamamatsu MS series mini-spectrometer with its evaluation board (C11351, Hamamatsu Photonics, Shizuoka, Japan) was coupled to the integrated collecting fiber of the device, as shown in Figure 2. The sensor head is characterized by a spectral resolution of 14 nm in the range of 340 to 750 nm by using a 256-pixel CMOS linear image sensor. The spectrometer has a fixed configuration and can be controlled with a dedicated calibration software developed in LabView. For all the measurements reported in Section 3.1, the integration time was set to 20 ms, and the gain was fixed to low. Before each measurement, a dark reading averaged 10 readings with all LED lights turned OFF to account for external illumination.
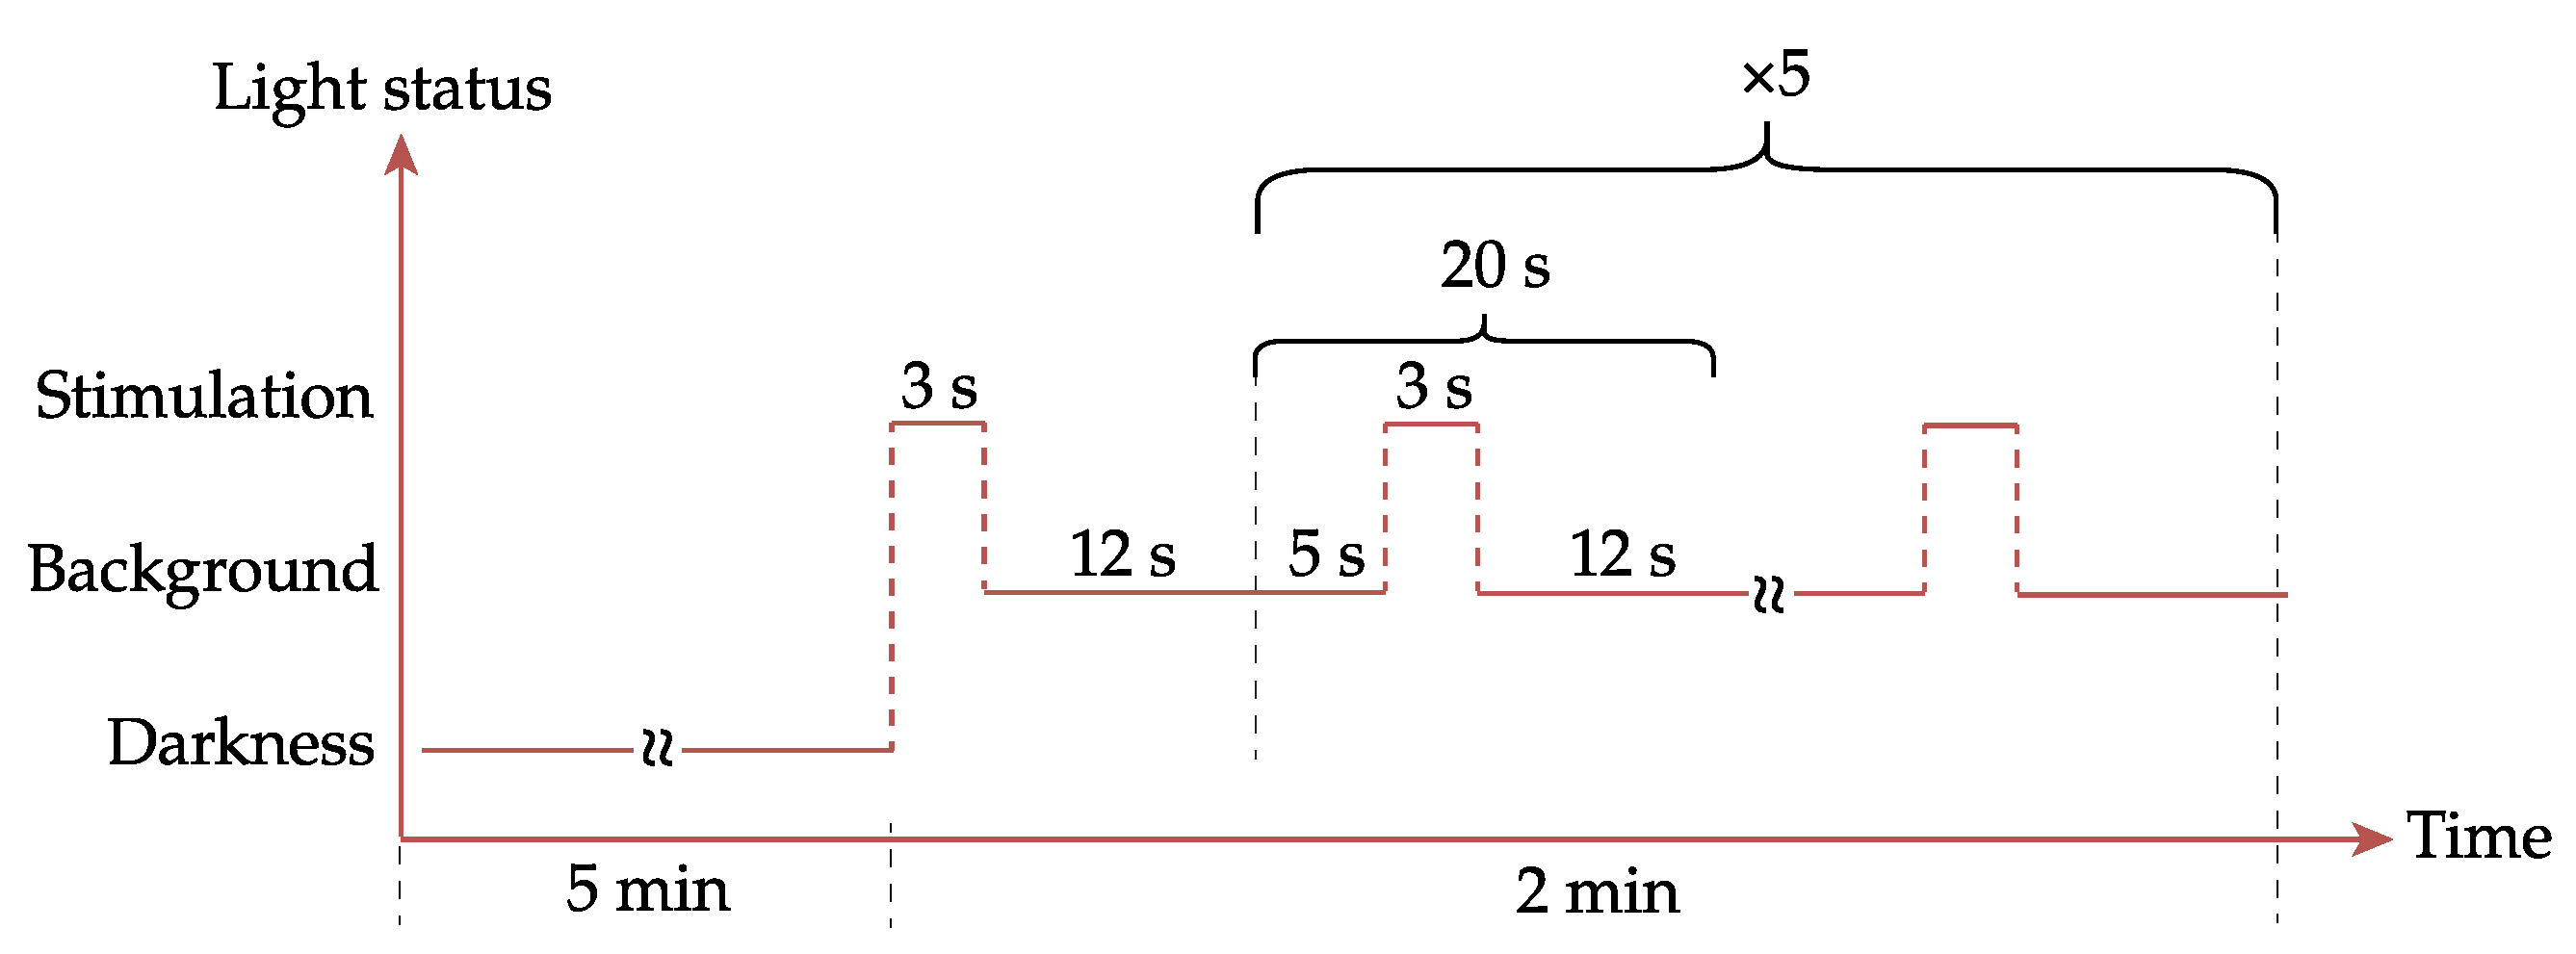
2.3. Preliminary Experiment Setup
3. Results
3.1. Characterization and Calibration Results
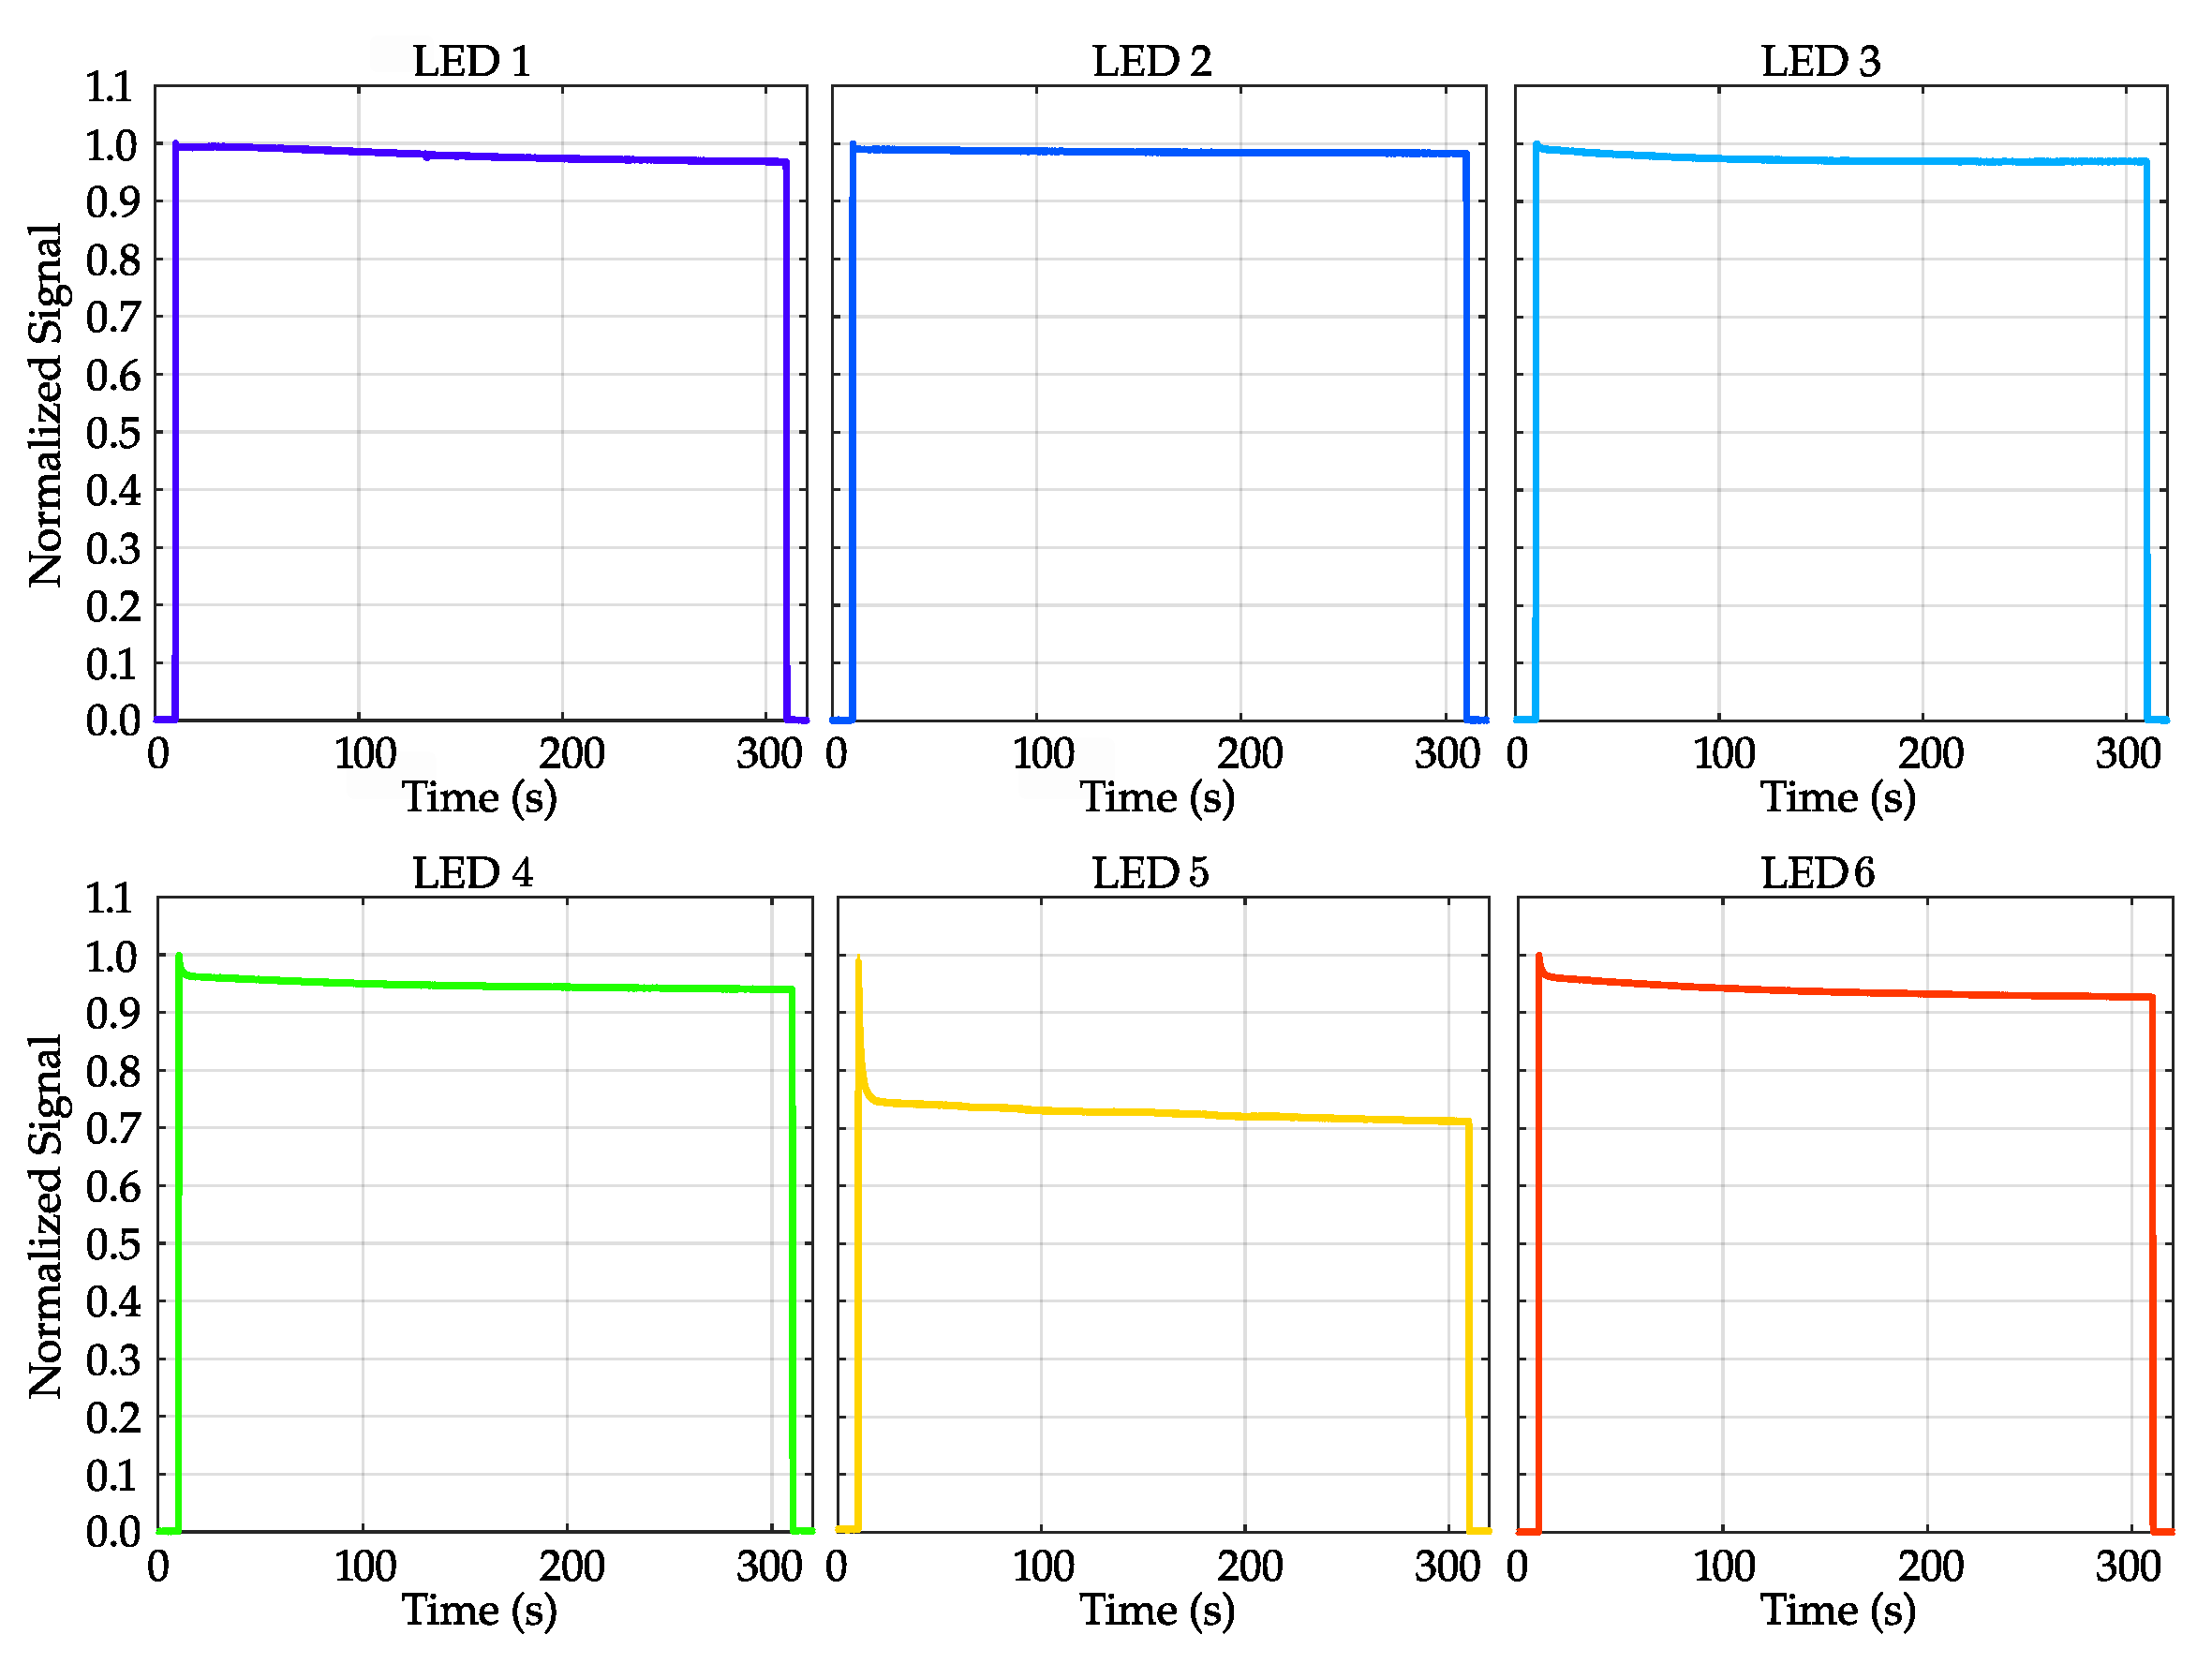
3.1.1. LEDs’ Emission Stability as Function of Time
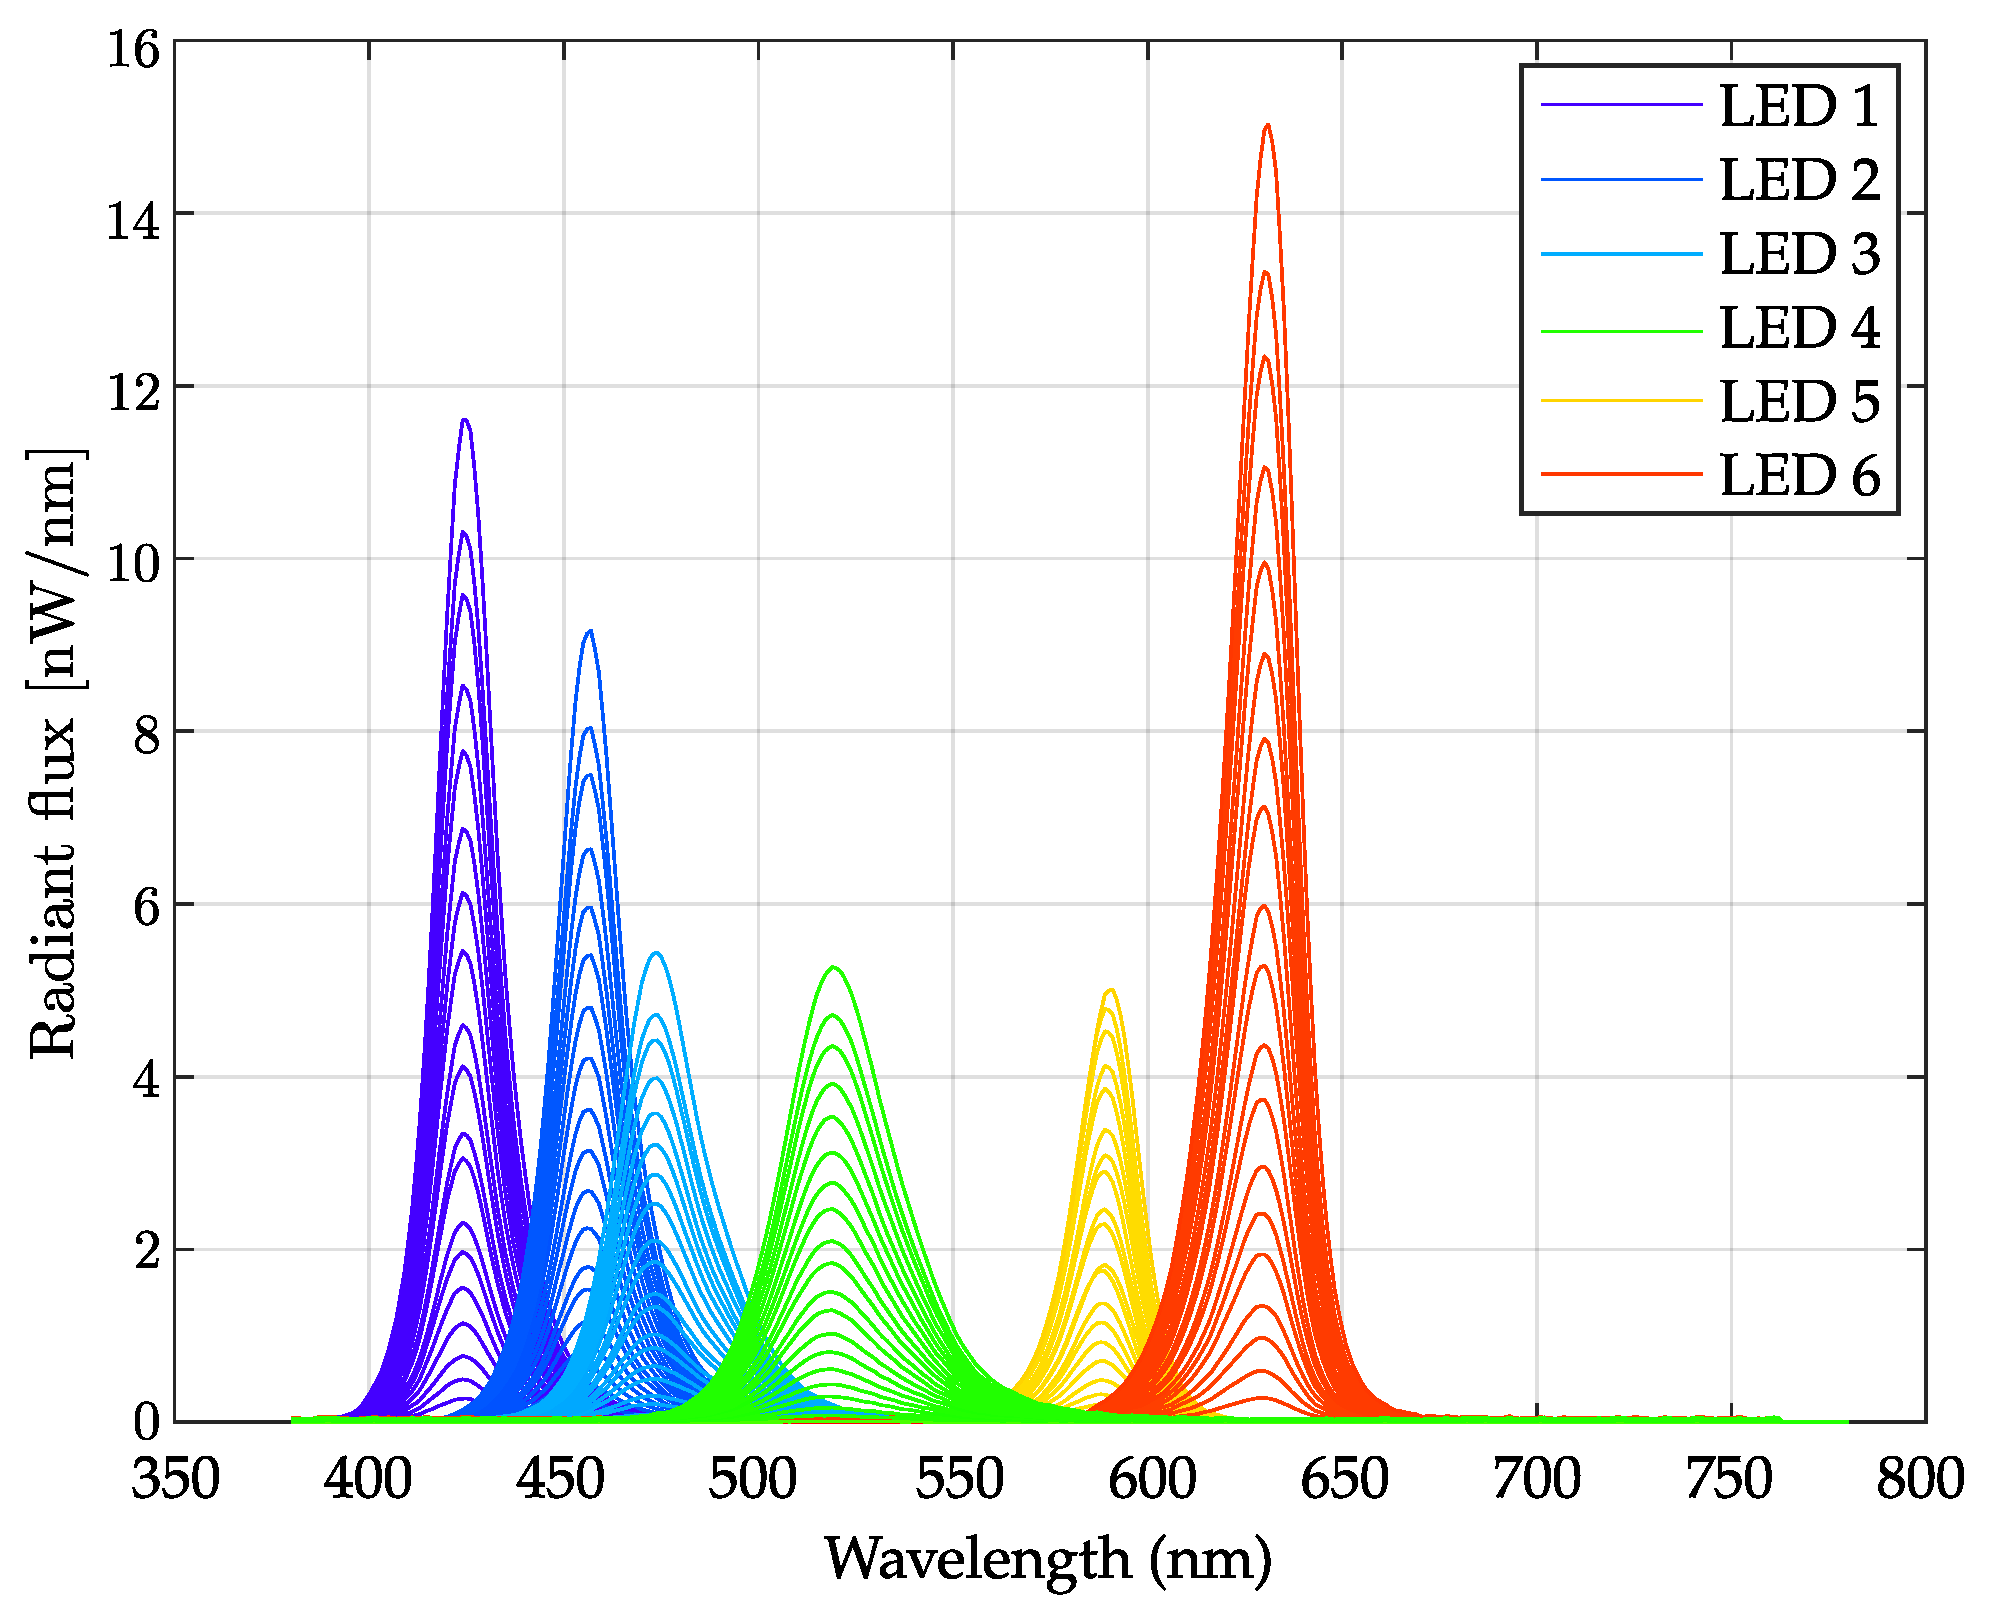
3.1.2. LEDs’ Linearity
3.1.3. Stimulation Beam at Device’s Exit Pupil
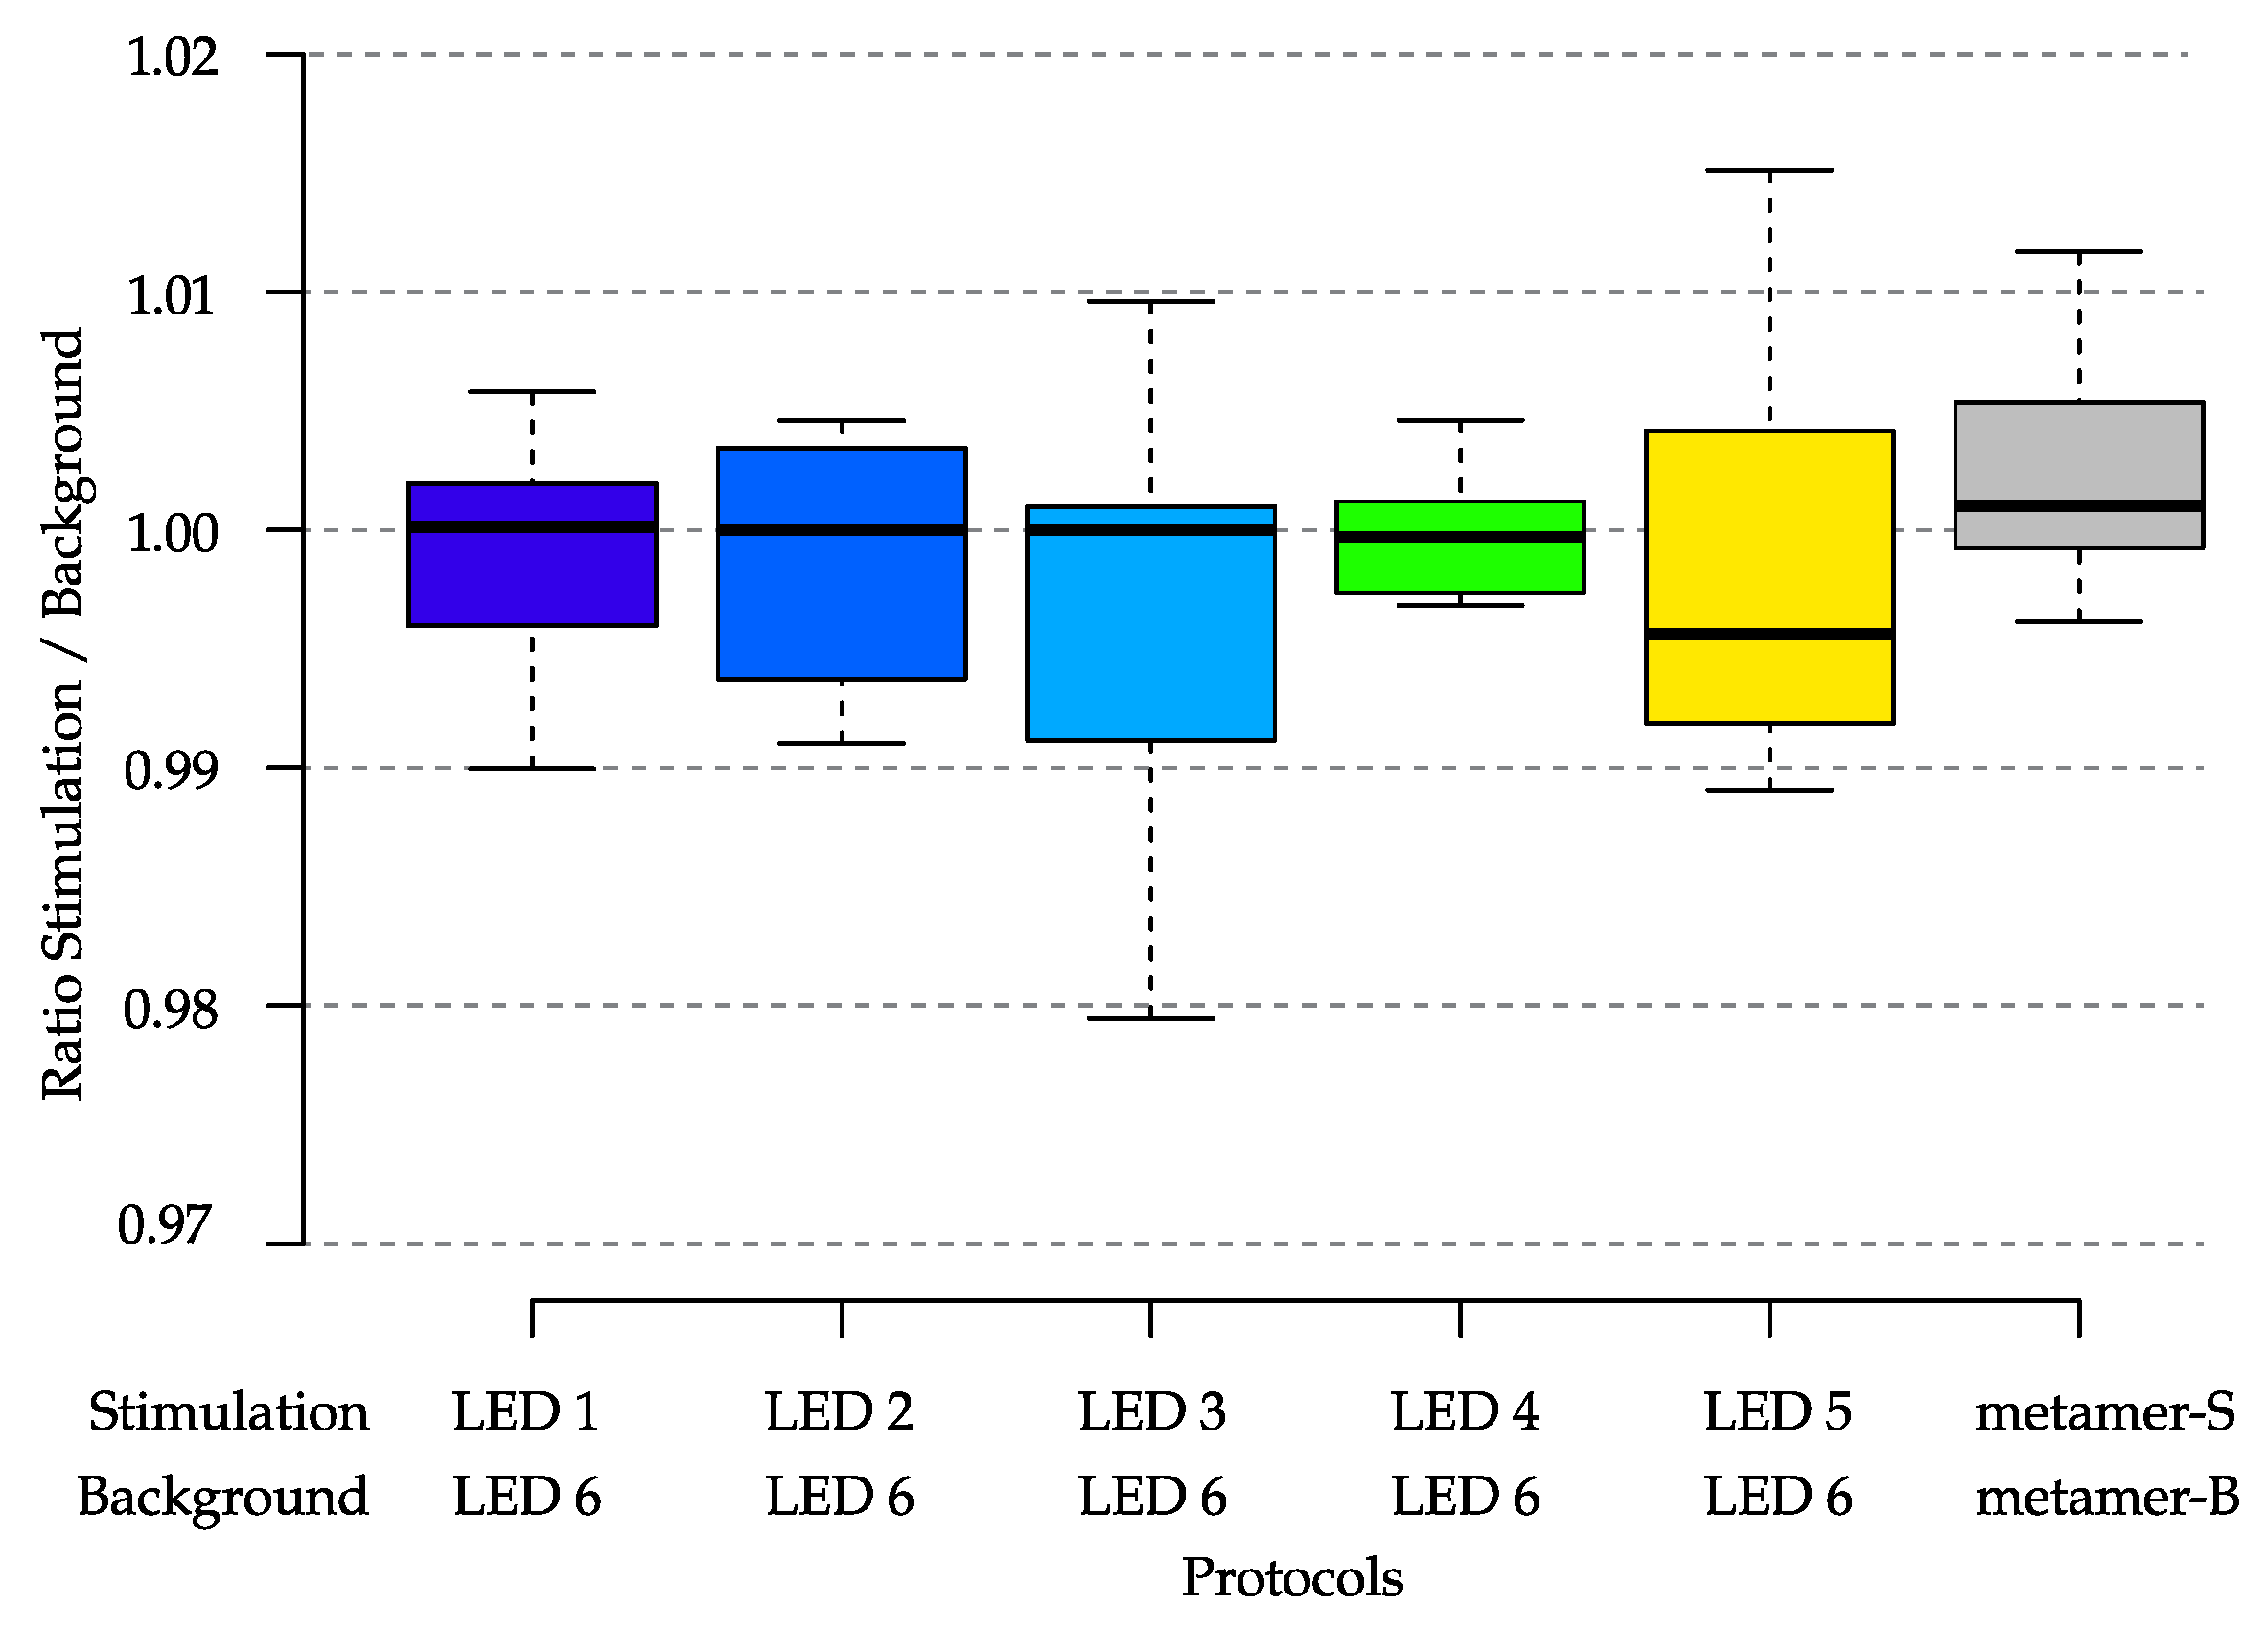
3.1.4. Light Emission Repeatability over Time
3.1.5. Spectral Flux Measurements
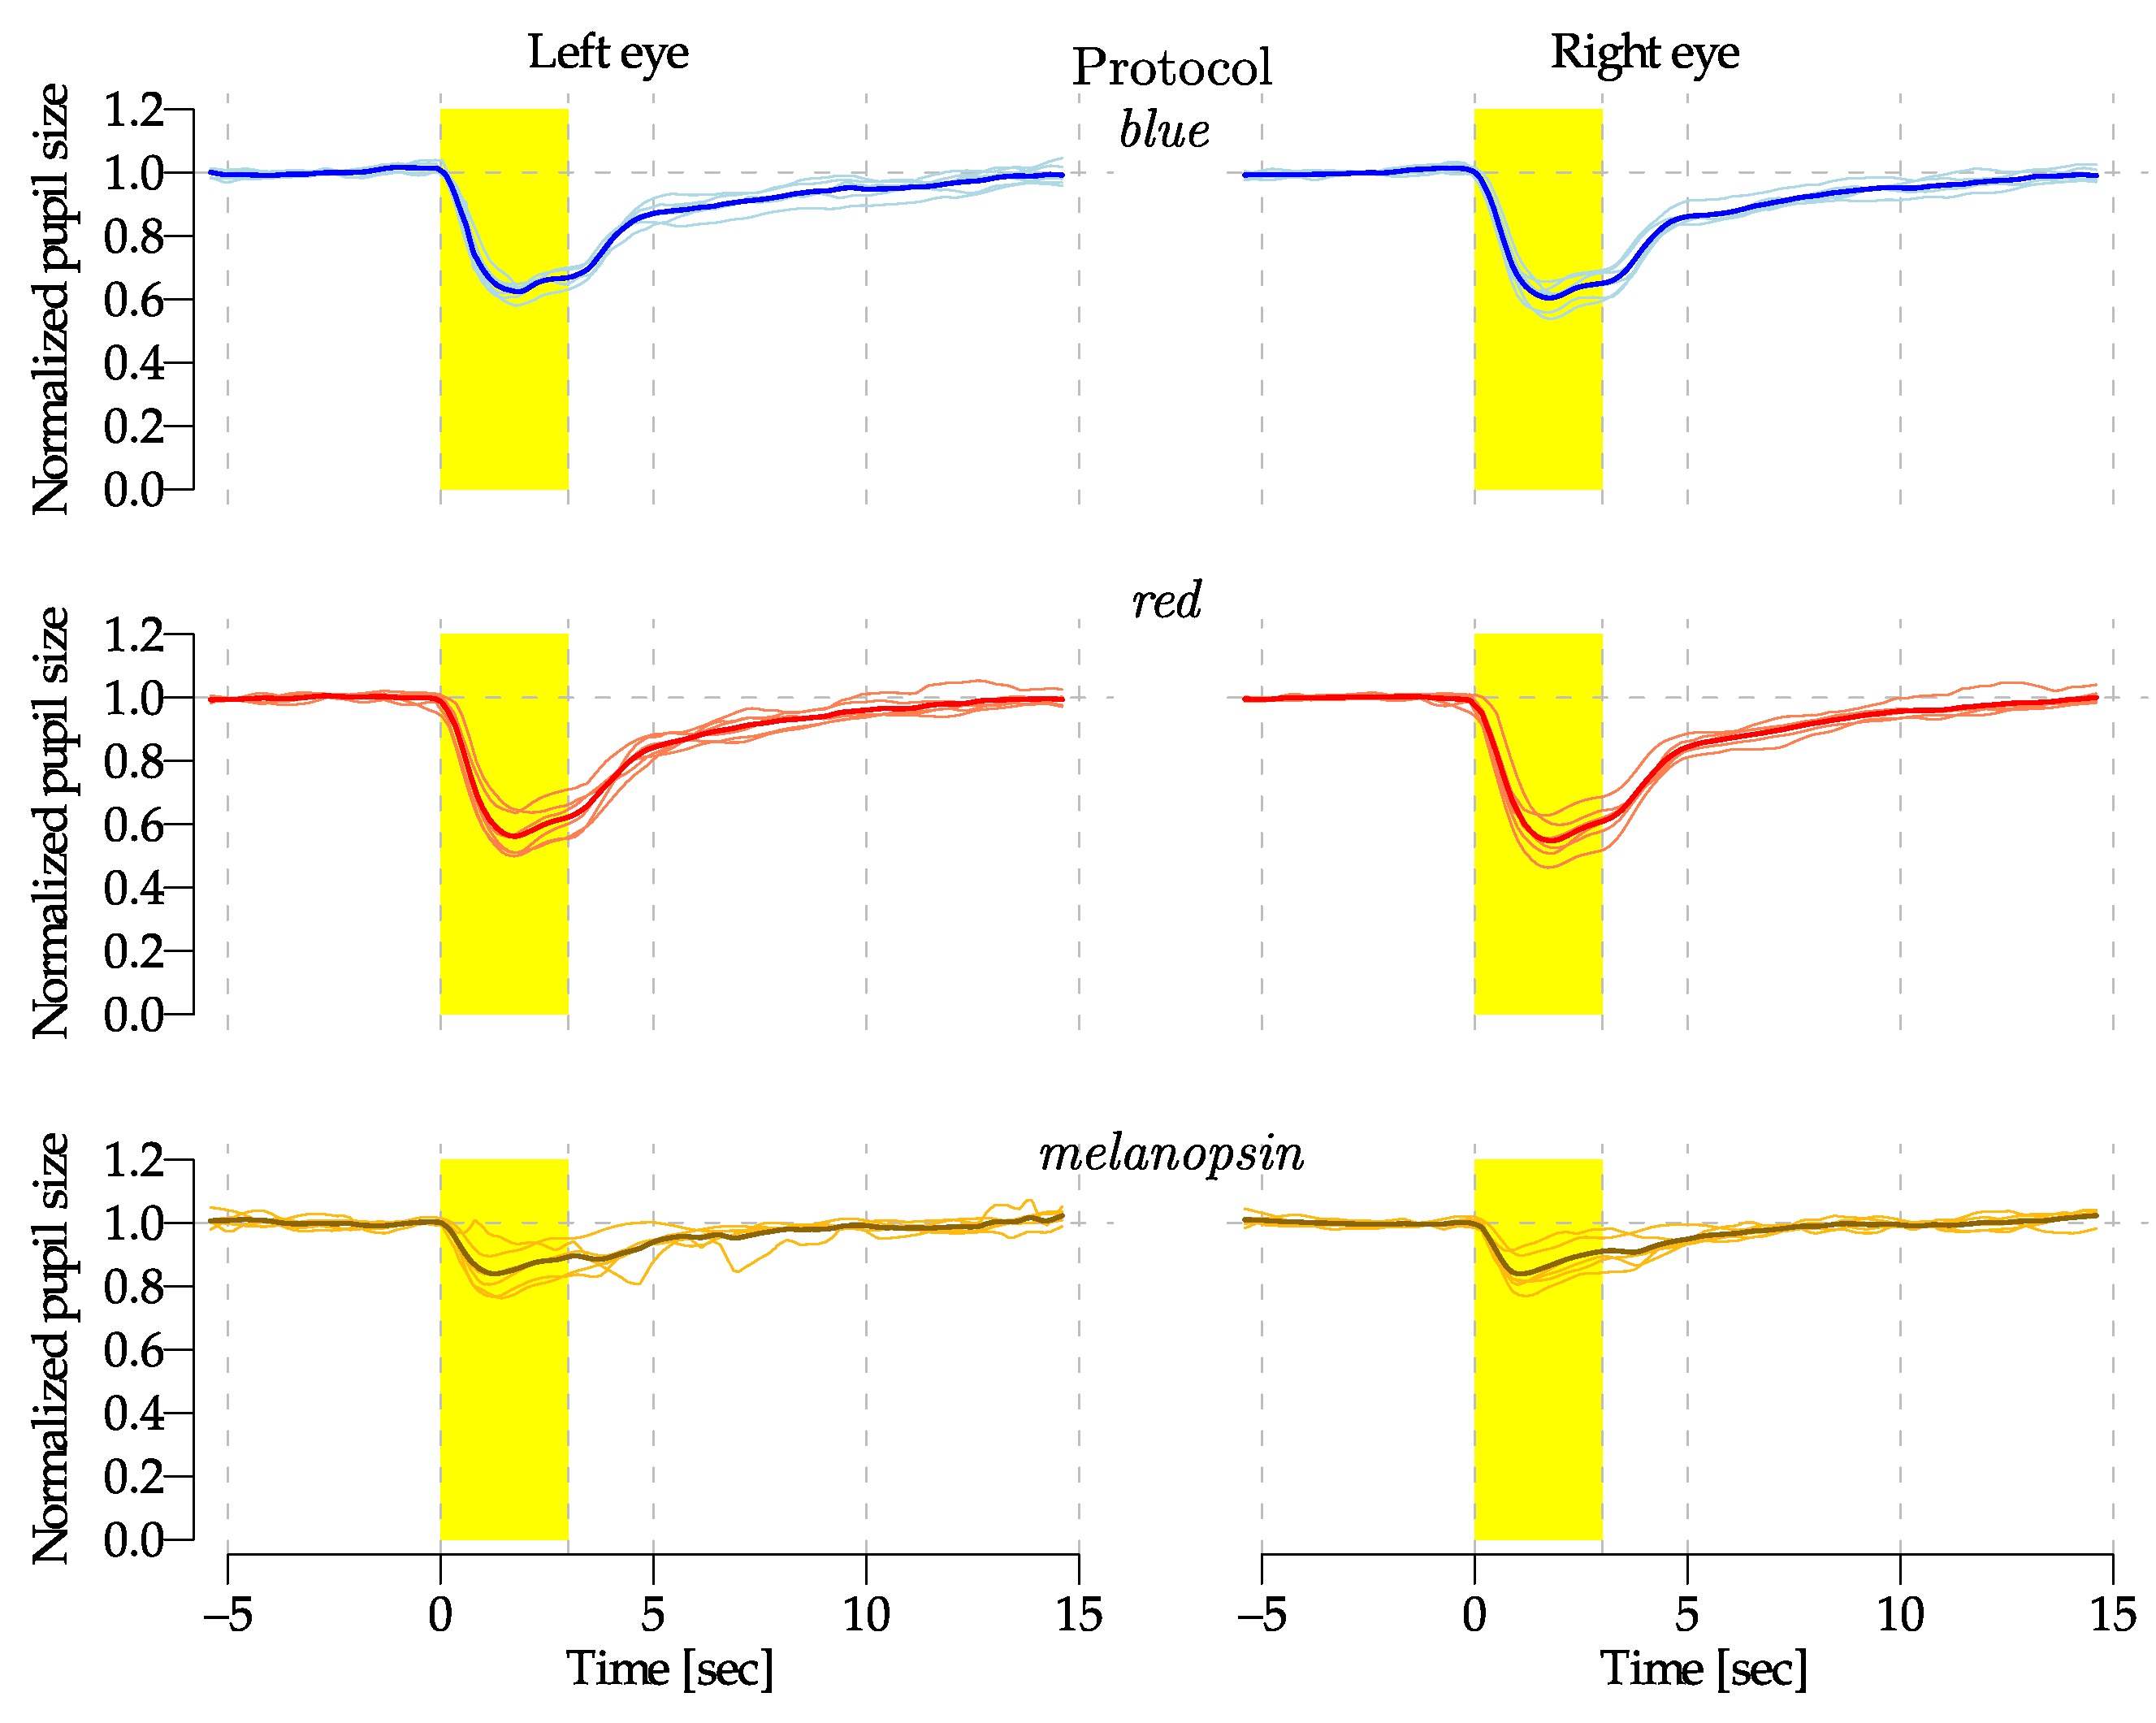
3.2. Preliminary Experimental Results
4. Discussion
5. Conclusions
Author Contributions
Funding
Institutional Review Board Statement
Informed Consent Statement
Data Availability Statement
Acknowledgments
Conflicts of Interest
Abbreviations
| mRGCs | Melanopsin-Containing Retinal Ganglion Cells |
| QPi | Quantitative Pupillometry index |
| NPi | Neurological Pupil index |
| NIR | Near InfraRed |
| ECC | Emergency Cardiovascular Care |
| CPR | Cardiopulmonary Resuscitation |
| ipRGCs | Intrinsically Photosensitive Retinal Ganglion Cells |
| PLR | Pupillary Light Reflex |
| PWM | Pulse Width Modulation |
| FoV | Field of View |
| LR | Light Ratio |
| EDI | Equivalent Daylight Illuminance |
References
- Adhikari, P.; Zele, A.J.; Thomas, R.; Feigl, B. Quadrant Field Pupillometry Detects Melanopsin Dysfunction in Glaucoma Suspects and Early Glaucoma. Sci. Rep. 2016, 6, 33373. [Google Scholar] [CrossRef] [PubMed]
- Chibel, R.; Sher, I.; Ben Ner, D.; Mhajna, M.O.; Achiron, A.; Hajyahia, S.; Skaat, A.; Berchenko, Y.; Oberman, B.; Kalter-Leibovici, O.; et al. Chromatic Multifocal Pupillometer for Objective Perimetry and Diagnosis of Patients with Retinitis Pigmentosa. Ophthalmology 2016, 123, 1898–1911. [Google Scholar] [CrossRef] [PubMed]
- Maynard, M.L.; Zele, A.J.; Feigl, B. Melanopsin-Mediated Post-Illumination Pupil Response in Early Age-Related Macular Degeneration. Investig. Ophthalmol. Vis. Sci. 2015, 56, 6906–6913. [Google Scholar] [CrossRef]
- La Morgia, C.; Mitolo, M.; Romagnoli, M.; Stanzani Maserati, M.; Evangelisti, S.; De Matteis, M.; Capellari, S.; Bianchini, C.; Testa, C.; Vandewalle, G.; et al. Multimodal investigation of melanopsin retinal ganglion cells in Alzheimer’s disease. Ann. Clin. Transl. Neurol. 2023, 10, 918–932. [Google Scholar] [CrossRef]
- Rukmini, A.V.; Milea, D.; Gooley, J.J. Chromatic Pupillometry Methods for Assessing Photoreceptor Health in Retinal and Optic Nerve Diseases. Front. Neurol. 2019, 10, 76. [Google Scholar] [CrossRef] [PubMed]
- Hattar, S.; Liao, H.W.; Takao, M.; Berson, D.M.; Yau, K.W. Melanopsin-containing retinal ganglion cells: Architecture, projections, and intrinsic photosensitivity. Science 2002, 295, 1065–1070. [Google Scholar] [CrossRef] [PubMed]
- Wood, M. Photopic curves—The old and the new. J. Entertain. Technol. Ind. 2014, 21–24. Available online: https://www.mikewoodconsulting.com/articles/Protocol%20Spring%202014%20-%20Photopic%20Curves.pdf (accessed on 29 May 2024).
- Lax, P.; Ortuño-Lizarán, I.; Maneu, V.; Vidal-Sanz, M.; Cuenca, N. Photosensitive Melanopsin-Containing Retinal Ganglion Cells in Health and Disease: Implications for Circadian Rhythms. Int. J. Mol. Sci. 2019, 20, 3164. [Google Scholar] [CrossRef]
- Stockman, A. CIE Physiologically Based Color Matching Functions and Chromaticity Diagrams. In Encyclopedia of Color Science and Technology; Luo, R., Ed.; Springer: Berlin/Heidelberg, Germany, 2014; pp. 1–10. [Google Scholar] [CrossRef]
- Pinheiro, H.M.; Da Costa, R.M. Pupillary light reflex as a diagnostic aid from computational viewpoint: A systematic literature review. J. Biomed. Inform. 2021, 117, 103757. [Google Scholar] [CrossRef]
- Jiménez-Herrera, M.F.; Azeli, Y.; Valero-Mora, E.; Lucas-Guarque, I.; López-Gomariz, A.; Castro-Naval, E.; Axelsson, C. Passive leg raise (PLR) during cardiopulmonary (CPR)—A method article on a randomised study of survival in out-of-hospital cardiac arrest (OHCA). BMC Emerg. Med. 2014, 14, 15. [Google Scholar] [CrossRef]
- Mele, M.L.; Federici, S. Gaze and eye-tracking solutions for psychological research. Cogn. Process. 2012, 13, 261–265. [Google Scholar] [CrossRef] [PubMed]
- Noseda, R.; Bernstein, C.A.; Nir, R.R.; Lee, A.J.; Fulton, A.B.; Bertisch, S.M.; Hovaguimian, A.; Cestari, D.M.; Saavedra-Walker, R.; Borsook, D.; et al. Migraine photophobia originating in cone-driven retinal pathways. Brain 2016, 139, 1971–1986. [Google Scholar] [CrossRef] [PubMed]
- Chen, J.W.; Vakil-Gilani, K.; Williamson, K.L.; Cecil, S. Infrared pupillometry, the Neurological Pupil index and unilateral pupillary dilation after traumatic brain injury: Implications for treatment paradigms. SpringerPlus 2014, 3, 548. [Google Scholar] [CrossRef] [PubMed]
- Romagnosi, F.; Bernini, A.; Bongiovanni, F.; Iaquaniello, C.; Miroz, J.; Citerio, G.; Taccone, F.; Oddo, M. Neurological Pupil Index for the Early Prediction of Outcome in Severe Acute Brain Injury Patients. Brain Sci. 2022, 12, 609. [Google Scholar] [CrossRef]
- Traylor, J.I.; Ahmadieh, T.; Bedros, N.; Adli, N.A.; Stutzman, S.E.; Venkatachalam, A.M.; Pernik, M.; Collum, C.; Douglas, P.M.; Aiyagari, V.; et al. Quantitative pupillometry in patients with traumatic brain injury and loss of consciousness: A prospective pilot study. J. Clin. Neurosci. 2021, 91, 88–92. [Google Scholar] [CrossRef]
- Oddo, M.; Taccone, F.; Galimberti, S.; Rebora, P.; Citerio, G. Outcome Prognostication of Acute Brain Injury using the Neurological Pupil Index (ORANGE) study: Protocol for a prospective, observational, multicentre, international cohort study. BMJ Open 2021, 11, e046948. [Google Scholar] [CrossRef]
- CIE. CIE S 026/E:2018 CIE System for Metrology of Optical Radiation for ipRGC-Influenced Responses to Light; Technical Report; International Commission on Illumination (CIE): Vienna, Austria, 2018. [Google Scholar] [CrossRef]
- Berson, D.M. Strange vision: Ganglion cells as circadian photoreceptors. Trends Neurosci. 2003, 26, 314–320. [Google Scholar] [CrossRef]
- Lucas, R.J.; Peirson, S.N.; Berson, D.M.; Brown, T.M.; Cooper, H.M.; Czeisler, C.A.; Figueiro, M.G.; Gamlin, P.D.; Lockley, S.W.; O’Hagan, J.B.; et al. Measuring and using light in the melanopsin age. Trends Neurosci. 2014, 37, 1–9. [Google Scholar] [CrossRef]
- Spitschan, M.; Woelders, T. The Method of Silent Substitution for Examining Melanopsin Contributions to Pupil Control. Front. Neurol. 2018, 9, 941. [Google Scholar] [CrossRef]
- Nugent, T.W.; Carter, D.D.; Uprety, S.; Adhikari, P.; Feigl, B.; Zele, A.J. Protocol for isolation of melanopsin and rhodopsin in the human eye using silent substitution. STAR Protoc. 2023, 4, 102126. [Google Scholar] [CrossRef]
- Rushton, W.A.H.; Powell, D.S.; White, K.D. Exchange thresholds in dichromats. Vis. Res. 1973, 13, 1993–2002. [Google Scholar] [CrossRef]
- Estévez, O.; Spekreijse, H. The “silent substitution” method in visual research. Vis. Res. 1982, 22, 681–691. [Google Scholar] [CrossRef] [PubMed]
- Evéquoz, G.; Truffer, F.; Geiser, M.H. Maximum possible contrast level for silent substitution: A theoretical model applied to melanopsin stimulation. JOSA A 2021, 38, 1312–1319. [Google Scholar] [CrossRef] [PubMed]
- Cuve, H.C.; Stojanov, J.; Roberts-Gaal, X.; Catmur, C.; Bird, G. Validation of Gazepoint low-cost eye-tracking and psychophysiology bundle. Behav. Res. Methods 2022, 54, 1027–1049. [Google Scholar] [CrossRef]
- Martin, J.T.; Boynton, G.M.; Baker, D.H.; Wade, A.R.; Spitschan, M. PySilSub: An open-source Python toolbox for implementing the method of silent substitution in vision and nonvisual photoreception research. J. Vis. 2023, 23, 10. [Google Scholar] [CrossRef] [PubMed]
- Boulter, J.H.; Shields, M.M.; Meister, M.R.; Murtha, G.; Curry, B.P.; Dengler, B.A. The Expanding Role of Quantitative Pupillometry in the Evaluation and Management of Traumatic Brain Injury. Front. Neurol. 2021, 12, 685313. [Google Scholar] [CrossRef]
- Shah, S.S.; Ranaivo, H.R.; Mets-Halgrimson, R.B.; Rychlik, K.; Kurup, S.P. Establishing a normative database for quantitative pupillometry in the pediatric population. BMC Ophthalmol. 2020, 20, 121. [Google Scholar] [CrossRef]
- P.S. Foundation. Python.org. 2024. Available online: https://www.python.org/ (accessed on 9 July 2024).
- Conus, V.; Geiser, M. A Review of Silent Substitution Devices for Melanopsin Stimulation in Humans. Photonics 2020, 7, 121. [Google Scholar] [CrossRef]
- Gibertoni, G.; Pinto, V.D.; Cattini, S.; Tramarin, F.; Geiser, M.; Rovati, L. A simple Maxwellian optical system to investigate the photoreceptors contribution to pupillary light reflex. In Proceedings of the Ophthalmic Technologies XXXII, SPIE, San Francisco, CA, USA, 4 March 2022; Volume 11941, pp. 52–60. [Google Scholar] [CrossRef]
- Gibertoni, G.; Borghi, G.; Rovati, L. Compact High-Resolution Multi-Wavelength LED Light Source for Eye Stimulation. Electronics 2024, 13, 1127. [Google Scholar] [CrossRef]
- Westheimer, G. The maxwellian view. Vis. Res. 1966, 6, 669–682. [Google Scholar] [CrossRef]
- Faria-Correia, F.; Ambrósio, R., Jr. Clinical applications of the Scheimpflug principle in Ophthalmology. Rev. Bras. Oftalmol. 2016, 75, 160–165. [Google Scholar] [CrossRef]
- Barrionuevo, P.A.; Preciado, O.U.; Sandoval Salinas, M.L.; Issolio, L.A. Chapter 2—Optical stimulation systems for studying human vision. In Progress in Brain Research; Santhi, N., Spitschan, M., Eds.; Circadian and Visual Neuroscience; Elsevier: Amsterdam, The Netherlands, 2022; Volume 273, pp. 13–36. [Google Scholar] [CrossRef]
- Franke, K.; Chagas, A.M.; Zhao, Z.; Zimmermann, M.J.Y.; Bartel, P.; Qiu, Y.; Szatko, K.P.; Baden, T.; Euler, T. An arbitrary-spectrum spatial visual stimulator for vision research. eLife 2019, 8, e48779. [Google Scholar] [CrossRef] [PubMed]
- Nugent, T.W.; Zele, A.J. A five-primary Maxwellian-view display for independent control of melanopsin, rhodopsin, and three-cone opsins on a fine spatial scale. J. Vis. 2022, 22, 20. [Google Scholar] [CrossRef] [PubMed]
- Kaiser, P.K.; Boynton, R.M. Human Color Vision; Optical Society of America: Washington, DC, USA, 1996. [Google Scholar]
- Asano, Y.; Fairchild, M.D.; Blondé, L. Individual Colorimetric Observer Model. PLoS ONE 2016, 11, e0305847. [Google Scholar] [CrossRef]
- Cheong, W.F.; Prahl, S.A.; Welch, A.J. A review of the optical properties of biological tissues. IEEE J. Quantum Electron. 1990, 26, 2166–2185. [Google Scholar] [CrossRef]
- Stockman, A.; Sharpe, L.T.; Fach, C. The spectral sensitivity of the human short-wavelength sensitive cones derived from thresholds and color matches. Vis. Res. 1999, 39, 2901–2927. [Google Scholar] [CrossRef]
- Stockman, A.; Sharpe, L.T. The spectral sensitivities of the middle- and long-wavelength-sensitive cones derived from measurements in observers of known genotype. Vis. Res. 2000, 40, 1711–1737. [Google Scholar] [CrossRef]
- Walker, B.H. Optical Design for Visual Systems; SPIE Press: Bellingham, WA, USA, 2000; Volume 45. [Google Scholar] [CrossRef]
- Jiang, F.; Zhang, J.; Xu, L.; Ding, J.; Wang, G.; Wu, X.; Wang, X.; Mo, C.; Quan, Z.; Guo, X.; et al. Efficient InGaN-based yellow-light-emitting diodes. Photonics Res. 2019, 7, 144–148. [Google Scholar] [CrossRef]
- R Core Team. R: A Language and Environment for Statistical Computing; R Foundation for Statistical Computing: Vienna, Austria, 2023. [Google Scholar]
- Gibertoni, G.; Irungovel, A.B.P.; Viswanathan, S.; Rovati, L. Silent stimulation of cones: A comparison between the ERG and PLR responses. In Proceedings of SPIE—Ophthalmic Technologies XXXIII, San Francisco, CA, USA, 14 March 2023; SPIE: Bellingham, WA, USA, 2023; Volume 12360, pp. 156–166. [Google Scholar] [CrossRef]
- Maguire, J.; Parry, N.R.A.; Kremers, J.; Kommanapalli, D.; Murray, I.J.; McKeefry, D.J. Rod Electroretinograms Elicited by Silent Substitution Stimuli from the Light-Adapted Human Eye. Transl. Vis. Sci. Technol. 2016, 5, 13. [Google Scholar] [CrossRef]
- Curcio, J.A.; Petty, C.C. The near infrared absorption spectrum of liquid water. JOSA 1951, 41, 302–304. [Google Scholar] [CrossRef]
- Szél, Á.; Röhlich, P.; Caffé, A.R.; van Veen, T. Distribution of cone photoreceptors in the mammalian retina. Microsc. Res. Tech. 1996, 35, 445–462. [Google Scholar] [CrossRef]
- Wang, Y.; Alonso, J.M.; Ruan, X. A review of LED drivers and related technologies. IEEE Trans. Ind. Electron. 2017, 64, 5754–5765. [Google Scholar] [CrossRef]
- Winn, B.; Whitaker, D.; Elliott, D.B.; Phillips, N.J. Factors affecting light-adapted pupil size in normal human subjects. Investig. Ophthalmol. Vis. Sci. 1994, 35, 1132–1137. [Google Scholar]
- Baudin, J.; Angueyra, J.M.; Sinha, R.; Rieke, F. S-cone photoreceptors in the primate retina are functionally distinct from L and M cones. eLife 2019, 8, e39166. [Google Scholar] [CrossRef] [PubMed]
- Tsujimura, S.; Wolffsohn, J.; Gilmartin, B. Pupil Response to Color Signals in Cone-Contrast Space. Curr. Eye Res. 2006, 31, 401–408. [Google Scholar] [CrossRef]
- Spitschan, M.; Mead, J.; Roos, C.; Lowis, C.; Griffiths, B.; Mucur, P.; Herf, M.; Nam, S.; Veitch, J.A. luox: Validated reference open-access and open-source web platform for calculating and sharing physiologically relevant quantities for light and lighting. Wellcome Open Res. 2021, 6, 69. [Google Scholar] [CrossRef]
- Hannibal, J.; Christiansen, A.T.; Heegaard, S.; Fahrenkrug, J.; Kiilgaard, J.F. Melanopsin expressing human retinal ganglion cells: Subtypes, distribution, and intraretinal connectivity. J. Comp. Neurol. 2017, 525, 1934–1961. [Google Scholar] [CrossRef]
- Liao, H.W.; Ren, X.; Peterson, B.B.; Marshak, D.W.; Yau, K.W.; Gamlin, P.D.; Dacey, D.M. Melanopsin-expressing ganglion cells on macaque and human retinas form two morphologically distinct populations. J. Comp. Neurol. 2016, 524, 2845–2872. [Google Scholar] [CrossRef] [PubMed]
- Nasir-Ahmad, S.; Lee, S.C.S.; Martin, P.R.; Grünert, U. Melanopsin-expressing ganglion cells in human retina: Morphology, distribution, and synaptic connections. J. Comp. Neurol. 2019, 527, 312–327. [Google Scholar] [CrossRef]
- Iadanza, E.; Goretti, F.; Sorelli, M.; Melillo, P.; Pecchia, L.; Simonelli, F.; Gherardelli, M. Automatic Detection of Genetic Diseases in Pediatric Age Using Pupillometry. IEEE Access 2020, 8, 34949–34961. [Google Scholar] [CrossRef]
- Bremner, F. Pupil evaluation as a test for autonomic disorders. Clin. Auton. Res. 2009, 19, 88–101. [Google Scholar] [CrossRef]
- Hachol, A.; Szczepanowska-Nowak, W.; Kasprzak, H.; Zawojska, I.; Dudzinski, A.; Kinasz, R.; Wygledowska-Promienska, D. Measurement of pupil reactivity using fast pupillometry. Physiol. Meas. 2006, 28, 61. [Google Scholar] [CrossRef]
- Lussier, B.; Olson, D.M.; Aiyagari, V. Automated Pupillometry in Neurocritical Care: Research and Practice. Curr. Neurol. Neurosci. Rep. 2019, 19, 71. [Google Scholar] [CrossRef] [PubMed]
- Lupión Durán, T.; García-Ben, A.; Rodríguez Méndez, V.; Gálvez Alcázar, L.; García-Ben, E.; García-Campos, J.M. Study of visual acuity and contrast sensitivity in diabetic patients with and without non-proliferative diabetic retinopathy. Int. Ophthalmol. 2021, 41, 3587–3592. [Google Scholar] [CrossRef] [PubMed]
- Melillo, P.; Pecchia, L.; Testa, F.; Rossi, S.; Bennett, J.; Simonelli, F. Pupillometric analysis for assessment of gene therapy in Leber Congenital Amaurosis patients. Biomed. Eng. Online 2012, 11, 40. [Google Scholar] [CrossRef] [PubMed]
- Philibert, M.; Milea, D. Basics, Benefits, and Pitfalls of Pupillometers Assessing Visual Function. Eye 2024, 38, 2415–2421. [Google Scholar] [CrossRef]


| Blue | Red | Melanopsin | ||||
|---|---|---|---|---|---|---|
| Parameters | Background | Stimulation | Background | Stimulation | Background | Stimulation |
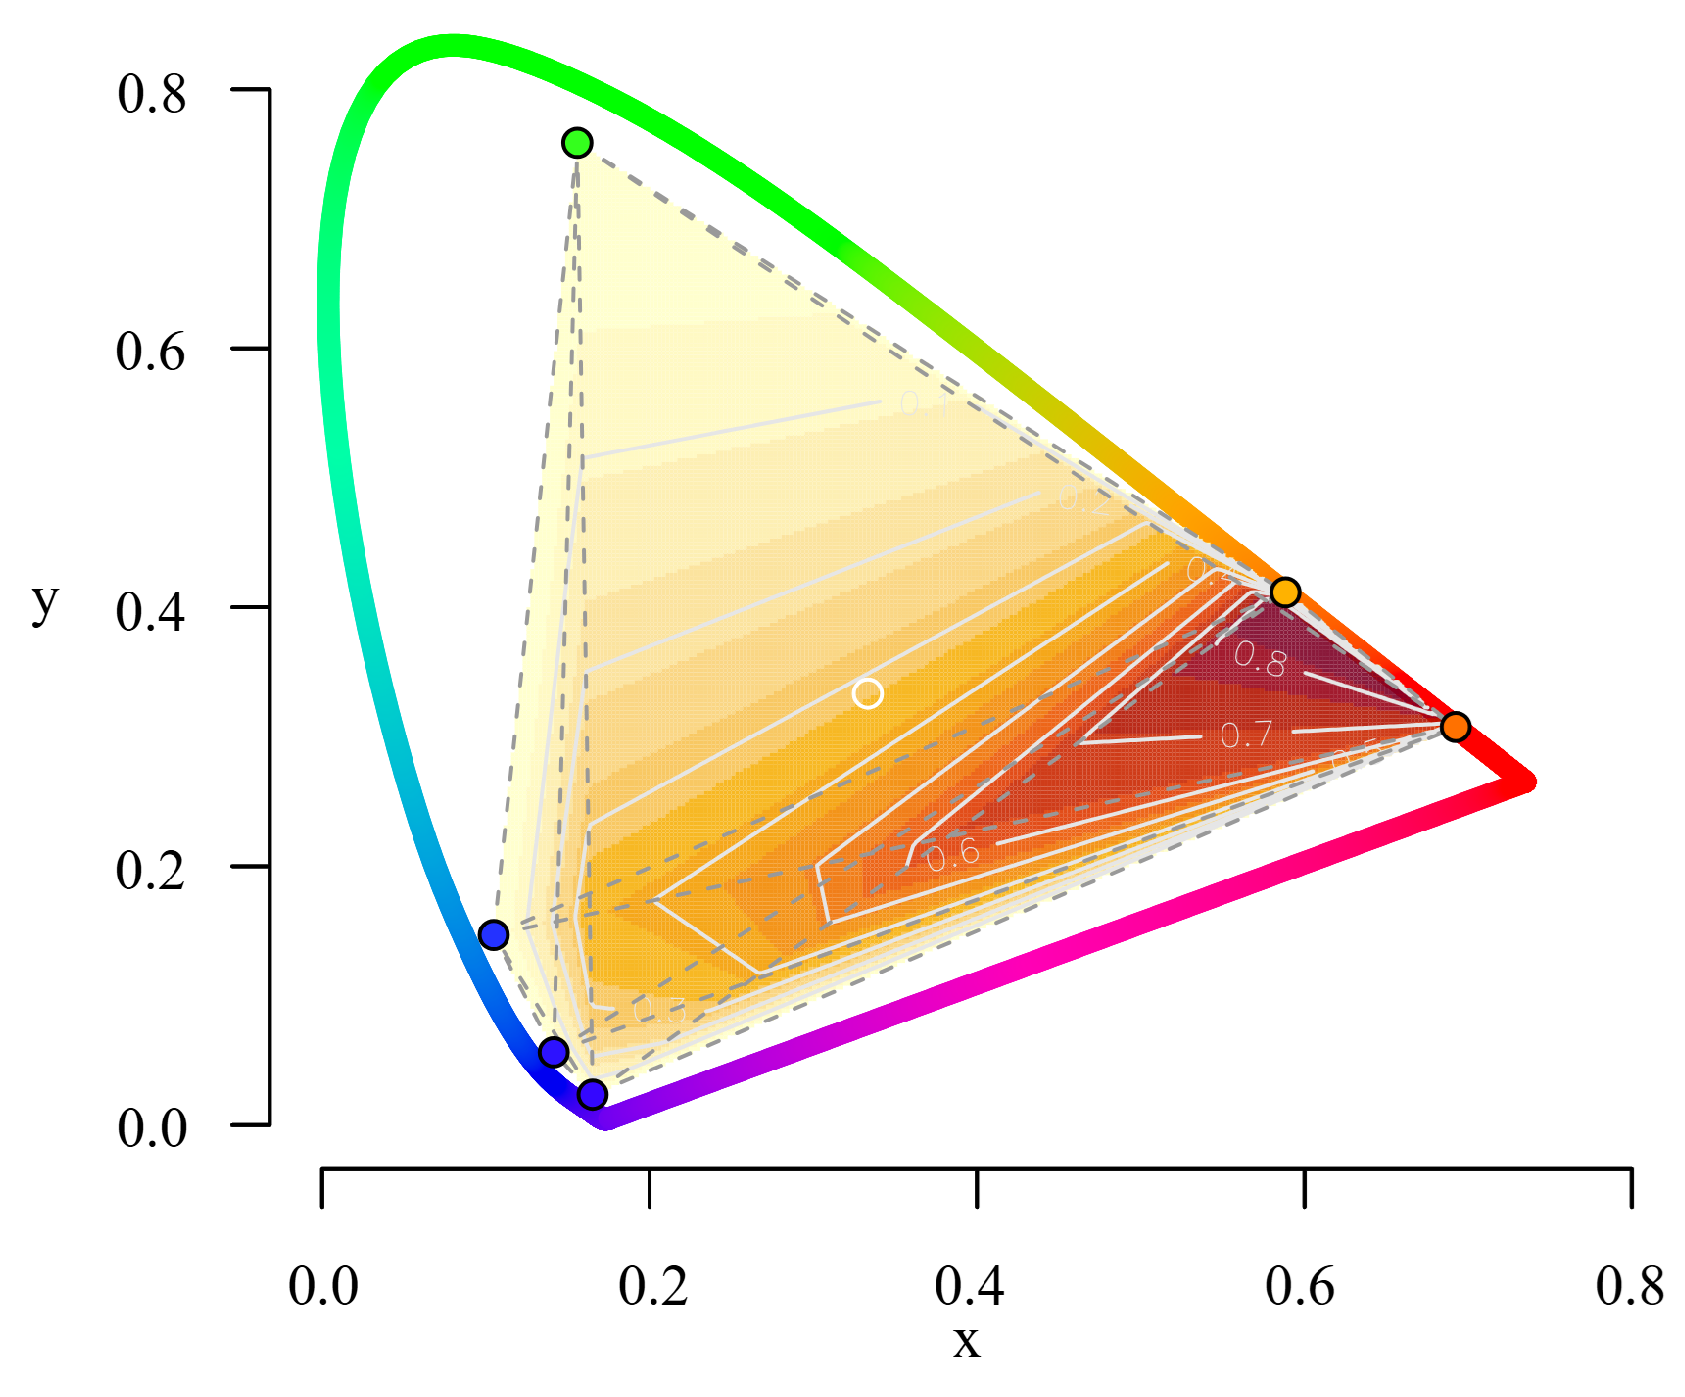
| Chromaticity (x, y) | (0.131, 0.208) | (0.105, 0.197) | (0.658, 0.316) | (0.659, 0.315) | (0.585, 0.379) | (0.589, 0.387) |
| Pupil Radiant Flux () | 0.023 | 0.935 | 0.017 | 2.610 | 4.534 | 5.282 |
| Retinal Illuminance (lm/m2) | 0.184 | 2.034 | 0.235 | 53.084 | 34.772 | 33.424 |
| (log photons/cm2/s) | 11.06 | 12.67 | 11.25 | 13.22 | 13.45 | 13.52 |
| FoV | Area (mm2) | Width (mm) | Height (mm) | Aspect Ratio | Roundness |
|---|---|---|---|---|---|
| FULL (60°) | 0.406 | 0.720 | 0.730 | 1.033 | 0.968 |
| LIMITED (10°) | 0.380 | 0.716 | 0.678 | 1.057 | 0.946 |
| LED1 | LED2 | LED3 | LED4 | LED5 | LED6 | |
|---|---|---|---|---|---|---|
| metamer-B | 0.721 | 0.100 | 0.100 | 0.100 | 0.699 | 0.100 |
| metamer-S | 0.100 | 0.100 | 0.899 | 0.105 | 0.100 | 0.899 |
| Blue | Red | Melanopsin | |
|---|---|---|---|
| Escape velocity (mm/s) | |||
| Time to recover (s) |
Disclaimer/Publisher’s Note: The statements, opinions and data contained in all publications are solely those of the individual author(s) and contributor(s) and not of MDPI and/or the editor(s). MDPI and/or the editor(s) disclaim responsibility for any injury to people or property resulting from any ideas, methods, instructions or products referred to in the content. |
© 2024 by the authors. Licensee MDPI, Basel, Switzerland. This article is an open access article distributed under the terms and conditions of the Creative Commons Attribution (CC BY) license (https://creativecommons.org/licenses/by/4.0/).
Share and Cite
Gibertoni, G.; Hromov, A.; Piffaretti, F.; Geiser, M.H. Development of an Innovative Pupillometer Able to Selectively Stimulate the Eye’s Fundus Photoreceptor Cells. Diagnostics 2024, 14, 1940. https://doi.org/10.3390/diagnostics14171940
Gibertoni G, Hromov A, Piffaretti F, Geiser MH. Development of an Innovative Pupillometer Able to Selectively Stimulate the Eye’s Fundus Photoreceptor Cells. Diagnostics. 2024; 14(17):1940. https://doi.org/10.3390/diagnostics14171940
Chicago/Turabian StyleGibertoni, Giovanni, Anton Hromov, Filippo Piffaretti, and Martial H. Geiser. 2024. "Development of an Innovative Pupillometer Able to Selectively Stimulate the Eye’s Fundus Photoreceptor Cells" Diagnostics 14, no. 17: 1940. https://doi.org/10.3390/diagnostics14171940