
Evaluation of Pulmonary Nodules by Radiologists vs. Radiomics in Stand-Alone and Complementary CT and MRI

 , ,
, ,
Abstract
:1. Introduction
2. Materials and Methods
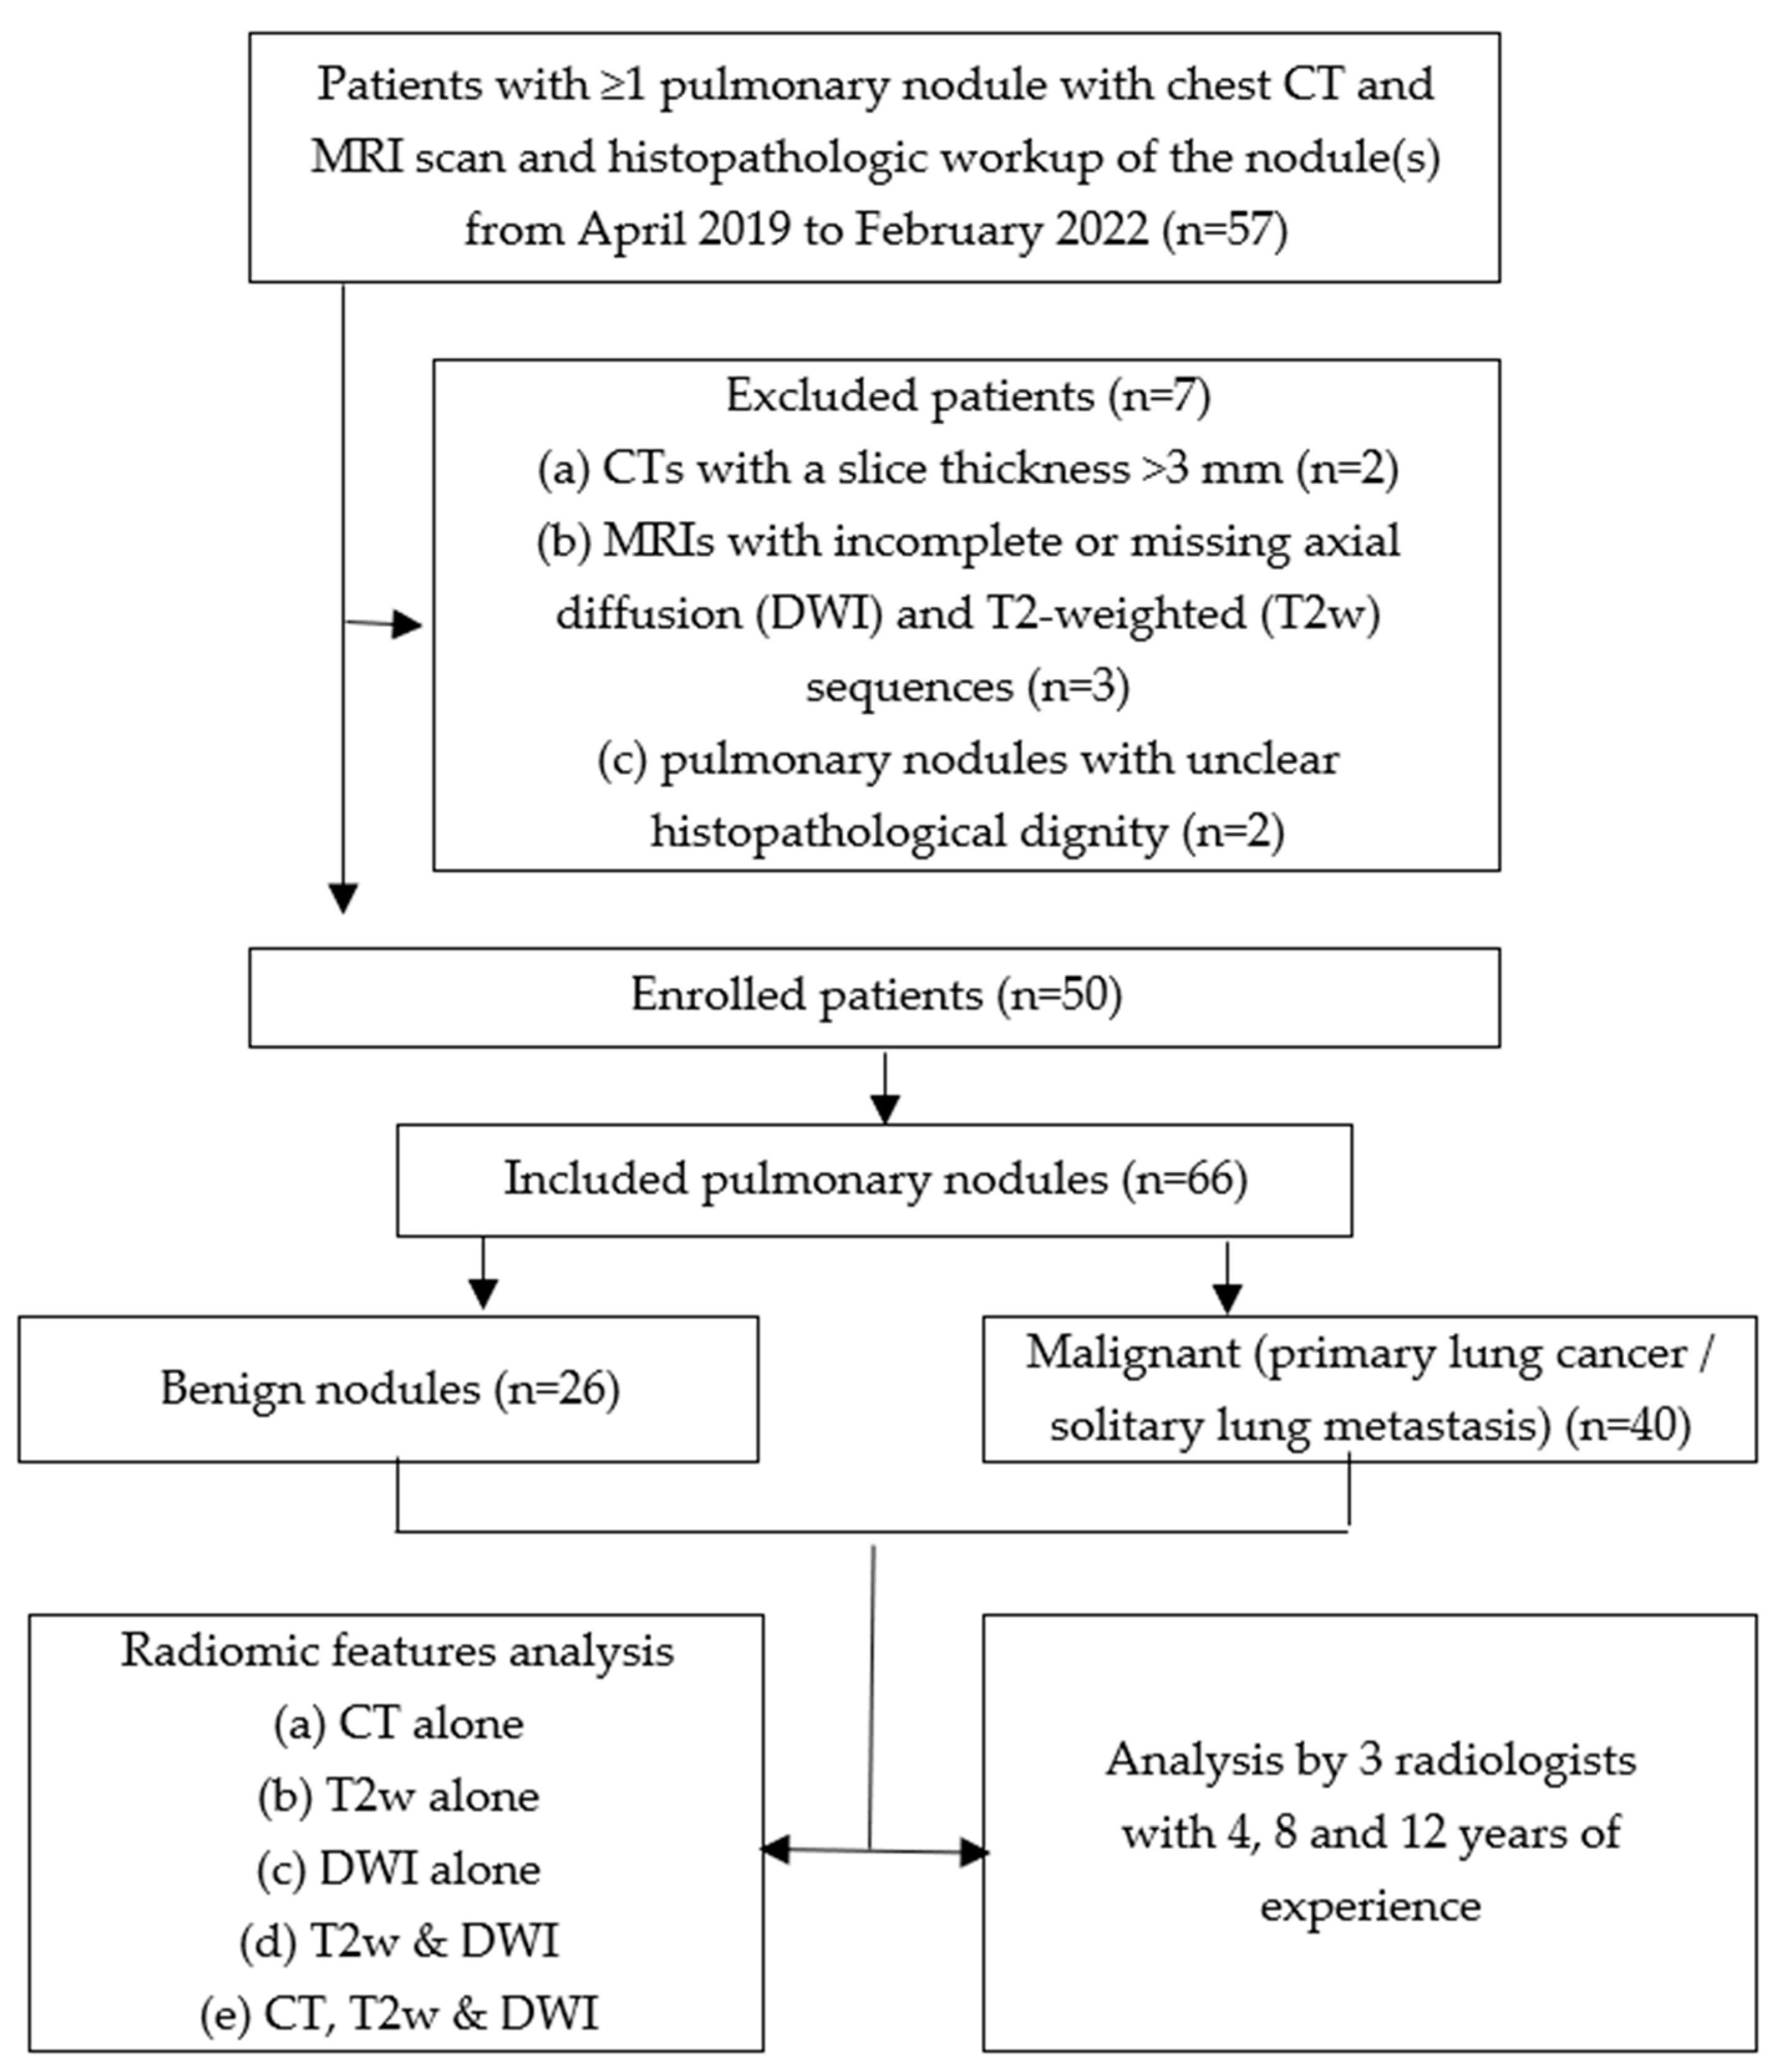
2.1. Study Design and Sample
2.2. CT Parameters
2.3. MRI Parameters
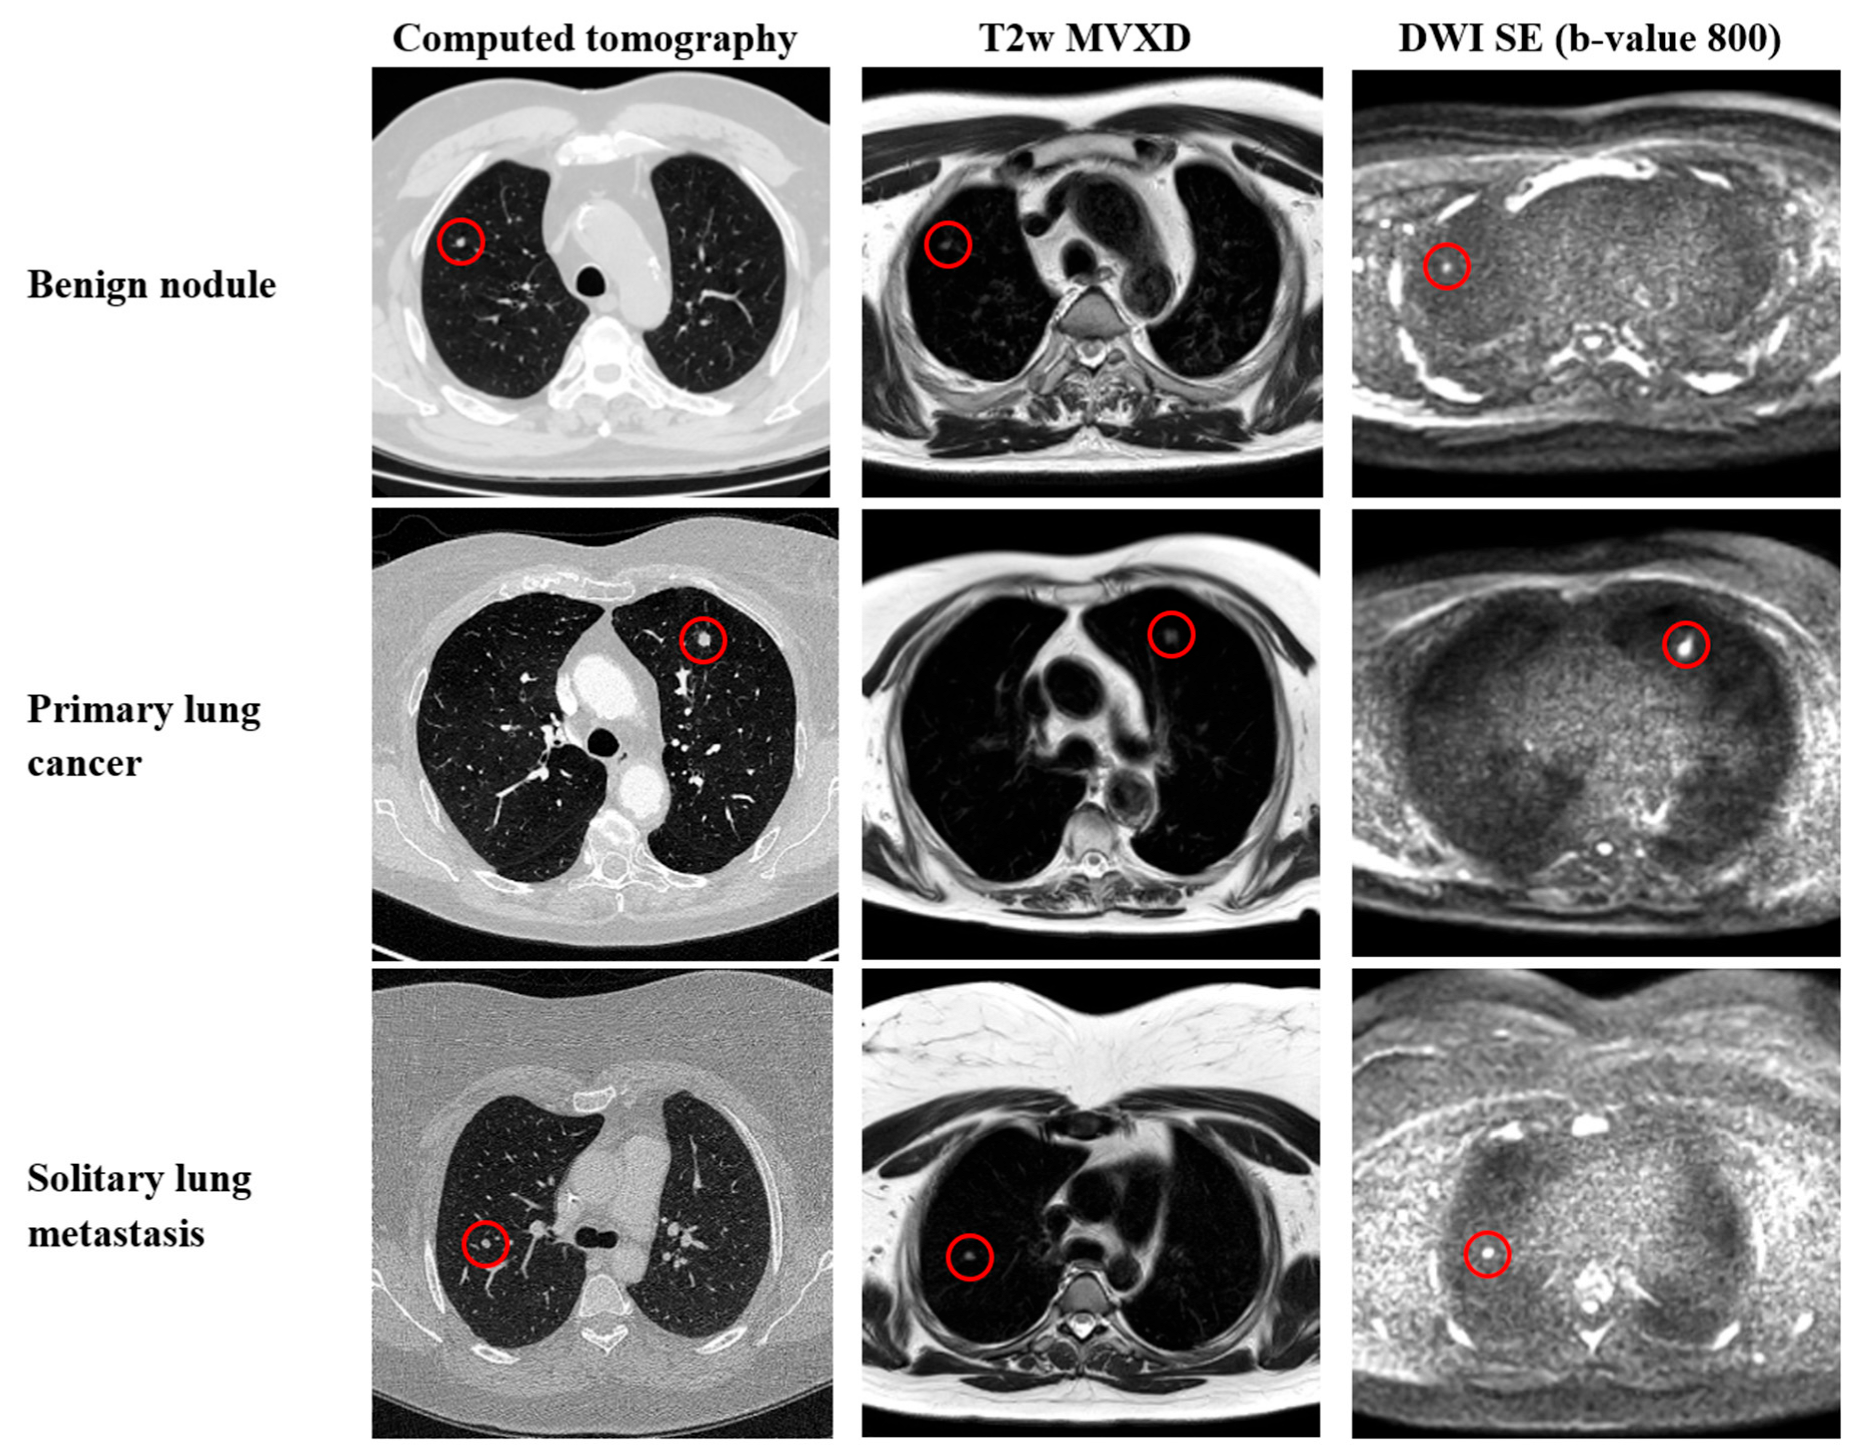
2.4. Image Segmentation
2.5. Radiomic Features
2.6. Development of a Prediction Model
2.7. Human Reader Analysis
2.8. Statistical Analysis
3. Results
4. Discussion
5. Conclusions
Author Contributions
Funding
Institutional Review Board Statement
Informed Consent Statement
Data Availability Statement
Conflicts of Interest
References
- MacMahon, H.; Naidich, D.P.; Goo, J.M.; Lee, K.S.; Leung, A.N.C.; Mayo, J.R.; Mehta, A.C.; Ohno, Y.; Powell, C.A.; Prokop, M.; et al. Guidelines for Management of Incidental Pulmonary Nodules Detected on CT Images: From the Fleischner Society 2017. Radiology 2017, 284, 228–243. [Google Scholar] [CrossRef]
- Ost, D.; Fein, A.M.; Feinsilver, S.H. Clinical practice. The solitary pulmonary nodule. N. Engl. J. Med. 2003, 348, 2535–2542. [Google Scholar] [CrossRef]
- Gould, M.K.; Tang, T.; Liu, I.-L.A.; Lee, J.; Zheng, C.; Danforth, K.N.; Kosco, A.E.; Di Fiore, J.L.; Suh, D.E. Recent Trends in the Identification of Incidental Pulmonary Nodules. Am. J. Respir. Crit. Care Med. 2015, 192, 1208–1214. [Google Scholar] [CrossRef]
- Aberle, D.R.; Adams, A.M.; Berg, C.D.; Black, W.C.; Clapp, J.D.; Fagerstrom, R.M.; Gareen, I.F.; Gatsonis, C.; Marcus, P.M.; Sicks, J.D. Reduced lung-cancer mortality with low-dose computed tomographic screening. N. Engl. J. Med. 2011, 365, 395–409. [Google Scholar] [CrossRef]
- Swensen, S.J.; Jett, J.R.; Hartman, T.E.; Midthun, D.E.; Sloan, J.A.; Sykes, A.-M.; Aughenbaugh, G.L.; Clemens, M.A. Lung cancer screening with CT: Mayo Clinic experience. Radiology 2003, 226, 756–761. [Google Scholar] [CrossRef] [PubMed]
- Bach, P.B.; Mirkin, J.N.; Oliver, T.K.; Azzoli, C.G.; Berry, D.A.; Brawley, O.W.; Byers, T.; Colditz, G.A.; Gould, M.K.; Jett, J.R.; et al. Benefits and harms of CT screening for lung cancer: A systematic review. JAMA 2012, 307, 2418–2429. [Google Scholar] [CrossRef] [PubMed]
- Biederer, J.; Ohno, Y.; Hatabu, H.; Schiebler, M.L.; van Beek, E.J.R.; Vogel-Claussen, J.; Kauczor, H.-U. Screening for lung cancer: Does MRI have a role? Eur. J. Radiol. 2017, 86, 353–360. [Google Scholar] [CrossRef]
- Meier-Schroers, M.; Homsi, R.; Skowasch, D.; Buermann, J.; Zipfel, M.; Schild, H.H.; Thomas, D. Lung cancer screening with MRI: Results of the first screening round. J. Cancer Res. Clin. Oncol. 2018, 144, 117–125. [Google Scholar] [CrossRef] [PubMed]
- Sanchez, F.; Tyrrell, P.N.; Cheung, P.; Heyn, C.; Graham, S.; Poon, I.; Ung, Y.; Louie, A.; Tsao, M.; Oikonomou, A. Detection of solid and subsolid pulmonary nodules with lung MRI: Performance of UTE, T1 gradient-echo, and single-shot T2 fast spin echo. Cancer Imaging 2023, 23, 17. [Google Scholar] [CrossRef] [PubMed]
- Ohno, Y.; Kauczor, H.-U.; Hatabu, H.; Seo, J.B.; van Beek, E.J.R. MRI for solitary pulmonary nodule and mass assessment: Current state of the art. J. Magn. Reson. Imaging 2018, 47, 1437–1458. [Google Scholar] [CrossRef] [PubMed]
- Raptis, C.A.; Ludwig, D.R.; Hammer, M.M.; Luna, A.; Broncano, J.; Henry, T.S.; Bhalla, S.; Ackman, J.B. Building blocks for thoracic MRI: Challenges, sequences, and protocol design. J. Magn. Reson. Imaging 2019, 50, 682–701. [Google Scholar] [CrossRef] [PubMed]
- Koyama, H.; Ohno, Y.; Aoyama, N.; Onishi, Y.; Matsumoto, K.; Nogami, M.; Takenaka, D.; Nishio, W.; Ohbayashi, C.; Sugimura, K. Comparison of STIR turbo SE imaging and diffusion-weighted imaging of the lung: Capability for detection and subtype classification of pulmonary adenocarcinomas. Eur. Radiol. 2010, 20, 790–800. [Google Scholar] [CrossRef] [PubMed]
- Koyama, H.; Ohno, Y.; Kono, A.; Takenaka, D.; Maniwa, Y.; Nishimura, Y.; Ohbayashi, C.; Sugimura, K. Quantitative and qualitative assessment of non-contrast-enhanced pulmonary MR imaging for management of pulmonary nodules in 161 subjects. Eur. Radiol. 2008, 18, 2120–2131. [Google Scholar] [CrossRef] [PubMed]
- Sommer, G.; Tremper, J.; Koenigkam-Santos, M.; Delorme, S.; Becker, N.; Biederer, J.; Kauczor, H.-U.; Heussel, C.P.; Schlemmer, H.-P.; Puderbach, M. Lung nodule detection in a high-risk population: Comparison of magnetic resonance imaging and low-dose computed tomography. Eur. J. Radiol. 2014, 83, 600–605. [Google Scholar] [CrossRef]
- Yang, S.; Shan, F.; Shi, Y.; Liu, T.; Wang, Q.; Zhang, H.; Zhang, X.; Yang, S.; Zhang, Z. Sensitivity and specificity of magnetic resonance imaging in routine diagnosis of pulmonary lesions: A comparison with computed tomography. J. Thorac. Dis. 2022, 14, 3762–3772. [Google Scholar] [CrossRef]
- Lodwick, G.S.; Keats, T.E.; Dorst, J.P. The Coding of Roentgen Images for Computer Analysis as Applied to Lung Cancer. Radiology 1963, 81, 185–200. [Google Scholar] [CrossRef]
- Zheng, X.; He, B.; Hu, Y.; Ren, M.; Chen, Z.; Zhang, Z.; Ma, J.; Ouyang, L.; Chu, H.; Gao, H.; et al. Diagnostic Accuracy of Deep Learning and Radiomics in Lung Cancer Staging: A Systematic Review and Meta-Analysis. Front. Public Health 2022, 10, 938113. [Google Scholar] [CrossRef]
- Lambin, P.; Rios-Velazquez, E.; Leijenaar, R.; Carvalho, S.; van Stiphout, R.G.P.M.; Granton, P.; Zegers, C.M.L.; Gillies, R.; Boellard, R.; Dekker, A.; et al. Radiomics: Extracting more information from medical images using advanced feature analysis. Eur. J. Cancer 2012, 48, 441–446. [Google Scholar] [CrossRef] [PubMed]
- Mitra, S.; Shankar, B.U. Integrating Radio Imaging with Gene Expressions Toward a Personalized Management of Cancer. IEEE Trans. Hum.-Mach. Syst. 2014, 44, 664–677. [Google Scholar] [CrossRef]
- Wilson, R.; Devaraj, A. Radiomics of pulmonary nodules and lung cancer. Transl. Lung Cancer Res. 2017, 6, 86–91. [Google Scholar] [CrossRef] [PubMed]
- Wan, Q.; Deng, Y.-S.; Lei, Q.; Bao, Y.-Y.; Wang, Y.-Z.; Zhou, J.-X.; Zou, Q.; Li, X.-C. Differentiating between malignant and benign solid solitary pulmonary lesions: Are intravoxel incoherent motion and diffusion kurtosis imaging superior to conventional diffusion-weighted imaging? Eur. Radiol. 2019, 29, 1607–1615. [Google Scholar] [CrossRef]
- Yushkevich, P.A.; Piven, J.; Hazlett, H.C.; Smith, R.G.; Ho, S.; Gee, J.C.; Gerig, G. User-guided 3D active contour segmentation of anatomical structures: Significantly improved efficiency and reliability. Neuroimage 2006, 31, 1116–1128. [Google Scholar] [CrossRef] [PubMed]
- van Griethuysen, J.J.M.; Fedorov, A.; Parmar, C.; Hosny, A.; Aucoin, N.; Narayan, V.; Beets-Tan, R.G.H.; Fillion-Robin, J.-C.; Pieper, S.; Aerts, H.J.W.L. Computational Radiomics System to Decode the Radiographic Phenotype. Cancer Res. 2017, 77, e104–e107. [Google Scholar] [CrossRef]
- Zwanenburg, A.; Vallières, M.; Abdalah, M.A.; Aerts, H.J.W.L.; Andrearczyk, V.; Apte, A.; Ashrafinia, S.; Bakas, S.; Beukinga, R.J.; Boellaard, R.; et al. The Image Biomarker Standardization Initiative: Standardized Quantitative Radiomics for High-Throughput Image-based Phenotyping. Radiology 2020, 295, 328–338. [Google Scholar] [CrossRef] [PubMed]
- Virtanen, P.; Gommers, R.; Oliphant, T.E.; Haberland, M.; Reddy, T.; Cournapeau, D.; Burovski, E.; Peterson, P.; Weckesser, W.; Bright, J.; et al. SciPy 1.0: Fundamental algorithms for scientific computing in Python. Nat. Methods 2020, 17, 261–272. [Google Scholar] [CrossRef] [PubMed]
- Harris, C.R.; Millman, K.J.; van der Walt, S.J.; Gommers, R.; Virtanen, P.; Cournapeau, D.; Wieser, E.; Taylor, J.; Berg, S.; Smith, N.J.; et al. Array programming with NumPy. Nature 2020, 585, 357–362. [Google Scholar] [CrossRef]
- Xu, Q.-Q.; Shan, W.-L.; Zhu, Y.; Huang, C.-C.; Bao, S.-Y.; Guo, L.-L. Prediction efficacy of feature classification of solitary pulmonary nodules based on CT radiomics. Eur. J. Radiol. 2021, 139, 109667. [Google Scholar] [CrossRef]
- Liu, A.; Wang, Z.; Yang, Y.; Wang, J.; Dai, X.; Wang, L.; Lu, Y.; Xue, F. Preoperative diagnosis of malignant pulmonary nodules in lung cancer screening with a radiomics nomogram. Cancer Commun. 2020, 40, 16–24. [Google Scholar] [CrossRef]
- Koo, C.W.; Lu, A.; Takahashi, E.A.; Simmons, C.L.; Geske, J.R.; Wigle, D.; Peikert, T. Can MRI contribute to pulmonary nodule analysis? J. Magn. Reson. Imaging 2019, 49, e256–e264. [Google Scholar] [CrossRef]
- Li, B.; Li, Q.; Chen, C.; Guan, Y.; Liu, S. A systematic review and meta-analysis of the accuracy of diffusion-weighted MRI in the detection of malignant pulmonary nodules and masses. Acad. Radiol. 2014, 21, 21–29. [Google Scholar] [CrossRef]
- Koo, C.W.; Kline, T.L.; Yoon, J.H.; Vercnocke, A.J.; Johnson, M.P.; Suman, G.; Lu, A.; Larson, N.B. Magnetic resonance radiomic feature performance in pulmonary nodule classification and impact of segmentation variability on radiomics. Br. J. Radiol. 2022, 95, 20220230. [Google Scholar] [CrossRef] [PubMed]
- Chen, C.-H.; Chang, C.-K.; Tu, C.-Y.; Liao, W.-C.; Wu, B.-R.; Chou, K.-T.; Chiou, Y.-R.; Yang, S.-N.; Zhang, G.; Huang, T.-C. Radiomic features analysis in computed tomography images of lung nodule classification. PLoS ONE 2018, 13, e0192002. [Google Scholar] [CrossRef] [PubMed]
- Xu, Y.; Lu, L.; E, L.-N.; Lian, W.; Yang, H.; Schwartz, L.H.; Yang, Z.-H.; Zhao, B. Application of Radiomics in Predicting the Malignancy of Pulmonary Nodules in Different Sizes. Am. J. Roentgenol. 2019, 213, 1213–1220. [Google Scholar] [CrossRef] [PubMed]

| Type of CT Scanner | Somatom x.Site or Somatom Force, Siemens Medical System, Erlangen, Germany | |
|---|---|---|
| Orientation | axial | |
| Direction | craniocaudal | |
| Section thickness | 1/0.7 mm or 3/2 mm | |
| Tube voltage | 120 kV | |
| Pitch factor | 0.6 | |
| Section collimation | 128 mm | |
| Type of MRI Scanner | 1.5 T Ambition/Ingenia; Philipps Healthcare, Best, The Netherlands | |
| Pulse sequence type | 2D T2w MVXD | 2D DWI SE |
| Orientation | axial | axial |
| Acquisition matrix | 448 × 78 | 160 × 155 |
| Field of view | 360 mm | 380 mm |
| Section thickness | 5 mm | 5 mm |
| TR | 2500 | 2463.1 |
| TE | 110 | 86.7 |
| b-value | 0 | 50, 400, 800 |
| Breath compensation | Respiratory triggering | Respiratory triggering |
| Cohort size, no. | 50 |
| Age (years), mean (SD) | 63 (10) |
| Gender, no. (%) | |
| Male | 32 (64) |
| Female | 18 (36) |
| Pulmonary nodules, no. | 66 |
| Diameter (cm), mean (SD) | 0.9 (0.4) |
| Location, no. (%) | |
| Right upper lobe | 17 (26) |
| Right middle lobe | 7 (11) |
| Right lower lobe | 12 (18) |
| Left upper lobe | 18 (27) |
| Left lower lobe | 12 (18) |
| Histological typing, no. (%) | |
| Benign nodule | 26 (39) |
| Primary lung cancer | 16 (24) |
| Solitary lung metastasis | 24 (36) |
| Computed tomography (CT), no. (%) | 66/66 (100) |
| T2w MVXD (T2W), no. (%) | 61/66 (92.4) |
| Benign nodule | 21/26 (80.8) |
| Malign (primary lung cancer or solitary lung metastasis) | 40/40 (100) |
| DWI SE (b-value 800 s/mm2), no. (%) | 42/66 (63.6) |
| Benign nodule | 7/26 (26.9) |
| Malign (primary lung cancer or solitary lung metastasis) | 35/40 (87.5) |
| CT Alone | T2w Alone | DWI Alone | ||
|---|---|---|---|---|
| CT, T2w & DWI | 1. Difference Variance | 1. 10th percentile | 1. Mean | T2w and DWI |
| 2. Correlation | 2. Skewness | 2. Long Run Low Gray Level Emphasis | ||
| 3. Coarseness | 3. Dependence Entropy | 3. Gray Level Non Uniformity | ||
| 4. Complexity | 4. Total Energy | 4. Small Area Emphasis | ||
| 5. Zone Entropy | 5. Interquartile Range | 5. Dependence Non Uniformity Normalized | ||
| 6. 90th percentile | 6. Dependence Non Uniformity Normalized | 6. Large Dependence High Gray Level Emphasis |
| Difference Variance | First-order feature measuring heterogeneity by placing a higher weight on differing intensity level pairs that deviate more from the mean. |
| Correlation | Gray level co-occurrence matrix (GLCM) feature measuring the linear dependency of gray level values on their respective voxels in the GLCM. |
| Coarseness | Neighboring gray tone difference matrix (NGTDM) feature measuring the average difference between the center voxel and its neighborhood. |
| Complexity | NGTDM feature measuring the number of primitive components in the image. |
| Zone Entropy | GLCM feature measuring the uncertainty/randomness in the distribution of zone sizes and gray levels. |
| 90th percentile | First-order feature measuring the 90th percentile of voxel intensities within the image region. |
| 10th percentile | First-order feature measuring the 10th percentile of voxel intensities within the image region. |
| Skewness | First-order feature measuring the asymmetry of the value distribution about the mean value. |
| Dependence Entropy | Gray level dependence matrix (GLDM) feature measuring the randomness/variability of gray level dependencies in an image. |
| Total Energy | First-order feature measuring the magnitude of voxel values scaled by the volume of the voxel. |
| Interquartile Range | First-order feature measuring the difference between the 75th and 25th percentile of the image array. |
| Dependence Non Uniformity Normalized | GLDM feature measuring the similarity of dependence throughout the image, with a lower value indicating more homogeneity among dependencies in the image. |
| Mean | First-order feature measuring the average gray level intensity within the ROI. |
| Long Run Low Gray Level Emphasis | Gray level run length matrix (GLRLM) feature measuring the joint distribution of long-run lengths with lower gray-level values. |
| Gray Level Non Uniformity | GLRLM feature measuring the similarity of gray-level intensity values in the image. |
| Small Area Emphasis | Gray level size zone matrix (GLSZM) feature measuring the distribution of small size zones, with a greater value indicative of smaller size zones and more fine textures. |
| Large Dependence High Gray Level Emphasis | GLDM feature measuring the joint distribution of large dependencies with higher gray-level values. |
| CT Alone | T2w Alone | DWI Alone | T2w/DWI | CT/T2w/DWI | ||
|---|---|---|---|---|---|---|
| Radiomic analysis | Sensitivity | 0.68 (0.51–0.81) | 0.85 (0.70–0.94) | 0.43 (0.27–0.59) | 0.68 (0.51–0.81) | 0.95 (0.83–0.99) |
| Specificity | 0.69 (0.48–0.86) | 0.35 (0.17–0.56) | 0.89 (0.70–0.98) | 0.81 (0.61–0.94) | 0.65 (0.44–0.83) | |
| Positive Predictive Value | 0.77 (0.60–0.90) | 0.67 (0.52–0.79) | 0.85 (0.62–0.97) | 0.84 (0.67–0.95) | 0.81 (0.67–0.91) | |
| Negative Predictive Value | 0.58 (0.39–0.76) | 0.60 (0.32–0.84) | 0.50 (0.35–0.65) | 0.62 (0.44–0.78) | 0.90 (0.67–0.99) | |
| Accuracy | 0.68 (0.56–0.79) | 0.65 (0.52–0.77) | 0.61 (0.48–0.72) | 0.73 (0.60–0.83) | 0.83 (0.72–0.91) | |
| Radiologists | Sensitivity | 0.75 (0.59–0.87) | 0.70 (0.55–0.83) | 0.73 (0.56–0.85) | 0.83 (0.67–0.93) | 0.80 (0.64–0.91) |
| Specificity | 0.35 (0.17–0.56) | 0.62 (0.41–0.80) | 0.73 (0.52–0.88) | 0.50 (0.30–0.70) | 0.39 (0.20–0.59) | |
| Positive Predictive Value | 0.64 (0.49–0.77) | 0.74 (0.57–0.87) | 0.81 (0.64–0.92) | 0.72 (0.57–0.84) | 0.67 (0.52–0.80) | |
| Negative Predictive Value | 0.47 (0.25–0.71) | 0.57 (0.37–0.76) | 0.63 (0.44–0.80) | 0.65 (0.41–0.85) | 0.56 (0.31–0.79) | |
| Accuracy | 0.59 (0.46–0.71) | 0.68 (0.54–0.78) | 0.73 (0.60–0.83) | 0.70 (0.57–0.80) | 0.64 (0.51–0.75) |
Disclaimer/Publisher’s Note: The statements, opinions and data contained in all publications are solely those of the individual author(s) and contributor(s) and not of MDPI and/or the editor(s). MDPI and/or the editor(s) disclaim responsibility for any injury to people or property resulting from any ideas, methods, instructions or products referred to in the content. |
© 2024 by the authors. Licensee MDPI, Basel, Switzerland. This article is an open access article distributed under the terms and conditions of the Creative Commons Attribution (CC BY) license (https://creativecommons.org/licenses/by/4.0/).
Share and Cite
Tietz, E.; Müller-Franzes, G.; Zimmermann, M.; Kuhl, C.K.; Keil, S.; Nebelung, S.; Truhn, D. Evaluation of Pulmonary Nodules by Radiologists vs. Radiomics in Stand-Alone and Complementary CT and MRI. Diagnostics 2024, 14, 483. https://doi.org/10.3390/diagnostics14050483
Tietz E, Müller-Franzes G, Zimmermann M, Kuhl CK, Keil S, Nebelung S, Truhn D. Evaluation of Pulmonary Nodules by Radiologists vs. Radiomics in Stand-Alone and Complementary CT and MRI. Diagnostics. 2024; 14(5):483. https://doi.org/10.3390/diagnostics14050483
Chicago/Turabian StyleTietz, Eric, Gustav Müller-Franzes, Markus Zimmermann, Christiane Katharina Kuhl, Sebastian Keil, Sven Nebelung, and Daniel Truhn. 2024. "Evaluation of Pulmonary Nodules by Radiologists vs. Radiomics in Stand-Alone and Complementary CT and MRI" Diagnostics 14, no. 5: 483. https://doi.org/10.3390/diagnostics14050483
APA StyleTietz, E., Müller-Franzes, G., Zimmermann, M., Kuhl, C. K., Keil, S., Nebelung, S., & Truhn, D. (2024). Evaluation of Pulmonary Nodules by Radiologists vs. Radiomics in Stand-Alone and Complementary CT and MRI. Diagnostics, 14(5), 483. https://doi.org/10.3390/diagnostics14050483