Article

Evaluation of Lattice Structures for Medical Implants: A Study on the Mechanical Properties of Various Unit Cell Types

1
IDMEC—Institute of Mechanical Engineering, Instituto Superior Técnico, Universidade de Lisboa, 1049-001 Lisboa, Portugal
2
INEGI—Institute of Science and Innovation in Mechanical and Industrial Engineering, Faculdade de Engenharia da Universidade do Porto, 4200-465 Porto, Portugal
3
CeFEMA—Center of Physics and Engineering of Advanced Materials, Instituto Superior Técnico, Universidade de Lisboa, 1049-001 Lisboa, Portugal
*
Author to whom correspondence should be addressed.
Metals 2024, 14(7), 780; https://doi.org/10.3390/met14070780
Submission received: 24 May 2024 / Revised: 21 June 2024 / Accepted: 25 June 2024 / Published: 2 July 2024
(This article belongs to the Special Issue Hybrid Metal Additive Manufacturing)

Abstract

:
Lattice structures are a prime candidate for applications in the medical implant industry due to their versatile mechanical behaviour, which can be tailored to meet specific patient needs and reduce stress shielding, while enabling the natural flow of body fluids. In this work, the mechanical properties of metallic lattices made of five different unit cell types, Cubic (C), Truncated Octahedron (TO), Truncated Cubic (TC), Rhombicuboctahedron (RCO), and Rhombitruncated Cuboctahedron (RTCO), were evaluated under uniaxial compression at three different relative densities, 5%, 15%, and 45%. The evaluation was experimental, and it was compared with previous and new finite element simulations. Specimens for the experimental tests were fabricated in stainless steel 316L by laser powder bed fusion, and stress–strain curves were obtained for the different lattices. The combination of the test results with a critical interpretation of the deformation mechanisms allowed us to confirm that two unit cell types, TO and RTCO, are stable for the whole range of relative densities evaluated. The other three unit cells exhibit more unpredictable behaviour, either due to manufacturing defects or limitations, or because their unstable compression behaviour leads to bucking. For these reasons, TO and RTCO unit cell types are mechanically more adequate for applications in the medical implant industry.

1. Introduction

The design and characterization of lattice structures has gained substantial attention in recent years due to their versatile mechanical properties that are especially appealing to the medical implant industry [1,2]. Lattice structures have the unique capability of being able to be employed in most geometries and then have their mechanical properties, such as strength, stiffness, and energy absorption, tuned by changing only their relative density [3]. The ability to choose different cell types and relative densities makes them a prime candidate for the medical implant industry, facilitating control over the mechanical properties of implants [4] and reducing stress shielding [5,6] whilst maintaining the ability of body fluids to flow through the cavities of their complex geometries [7]. The relative densities of these structures do not need to be changed as a whole and can be altered locally, which is the basic idea of using functionally graded lattice structures, often explored using topology optimization [8,9].
These structures can have base materials that are polymeric, composite, ceramic, or metallic [1]. Common metallic base materials include stainless steel 316L [10,11,12], titanium alloys [13,14], iron [7,15,16,17], and zinc [18], among others. Choosing different metallic base materials makes a significant difference in the biodegradability and biocompatibility of the lattice, as seen in the fact that stainless steel and titanium are used for permanent medical implants while iron and zinc are used for biodegradable temporary implants [1,2]. In this study, the focus is on lattice structures produced using stainless steel 316L. Despite the name, stainless steel 316L is not completely “stain-proof”, especially in highly corrosive media like body fluid, making it undesirable for long-term use in permanent implants [3,19]. Nevertheless, it is very effective for internal or external temporary medical devices and is commonly adopted in these applications [3,19].
The manufacturing of lattice structures poses unique challenges, including inherent defects and geometric inaccuracies arising from laser powder bed fusion (LPBF) processes [20]. Despite efforts to optimize manufacturing parameters, discrepancies between as-designed and as-built geometries persist, impacting mechanical performance [21,22]. Nevertheless, a recent literature review reports that 90% of the metallic lattices are manufactured using a powder bed fusion process [23].
Despite the latest advances in the field, the mechanical properties of lattice structures can be further studied. To this end, computational studies are key to understanding the overall mechanical behaviour of these structures, especially because many combinations of unit cells and relative densities can be evaluated with an almost negligible cost compared with the cost required for the manufacturing of the samples. Computational studies have been used to evaluate these combinations [24,25], expand upon them to improve the design of lattices [26], develop post-yield behaviour models [27], and predict the stress–stain behaviour using multiscale approaches [10]. While a recent literature review suggests that not all authors validate their numerical models experimentally [3], a significant number do [12,25,28]. These authors reinforce the relevance of validation, highlighting the challenge in obtaining defect-free samples and emphasizing its critical role in discerning potential disparities between the numerical model and the real test.
This study focuses on the investigation of lattice structures made from five distinct unit cell types: Cubic (C), Truncated Octahedron (TO), Truncated Cubic (TC), Rhombicuboctahedron (RCO), and Rhombitruncated Cuboctahedron (RTCO). These cell types can be divided into two families according to the classification of M. A. Ashby [29], the first of which comprises RTCO, TO, and RCO unit cells, which are bending-dominated, while the second contains C and TC unit cells, which are stretch-dominated. A total of 19 lattice samples were fabricated in stainless steel 316L by LPBF considering various combinations of these five unit cell types and three relative densities, 5%, 15%, and 45%. The lattice samples were tested under uniaxial compression, and three additional bulk specimens were also manufactured and tested to assess the mechanical properties of the base material. These mechanical properties were used in the seven finite element models that were developed to computationally evaluate the compression properties of the lattices. A comparison between the finite element analyses and the experimental results was carried out to validate the numerical models of this study and complement previous computational studies published by the authors [24,30,31]. The novelty of this work is related to the evaluation of the mechanical properties of lattice structures for medical implants, which is specifically pertinent to aspects such as (a) the consideration of unit cells with complex geometries, (b) the study of a broad range of relative densities, and (c) comprehensive comparisons with numerical models. These factors collectively contribute to a deeper understanding of how such lattice structures perform, providing valuable insights for the development of more effective and reliable medical implants.

2. Materials and Methods

In this section, the materials and methodology used are described in detail, including the design of the specimens, their manufacturing and post-processing, the experimental compression tests, and the numerical simulations.

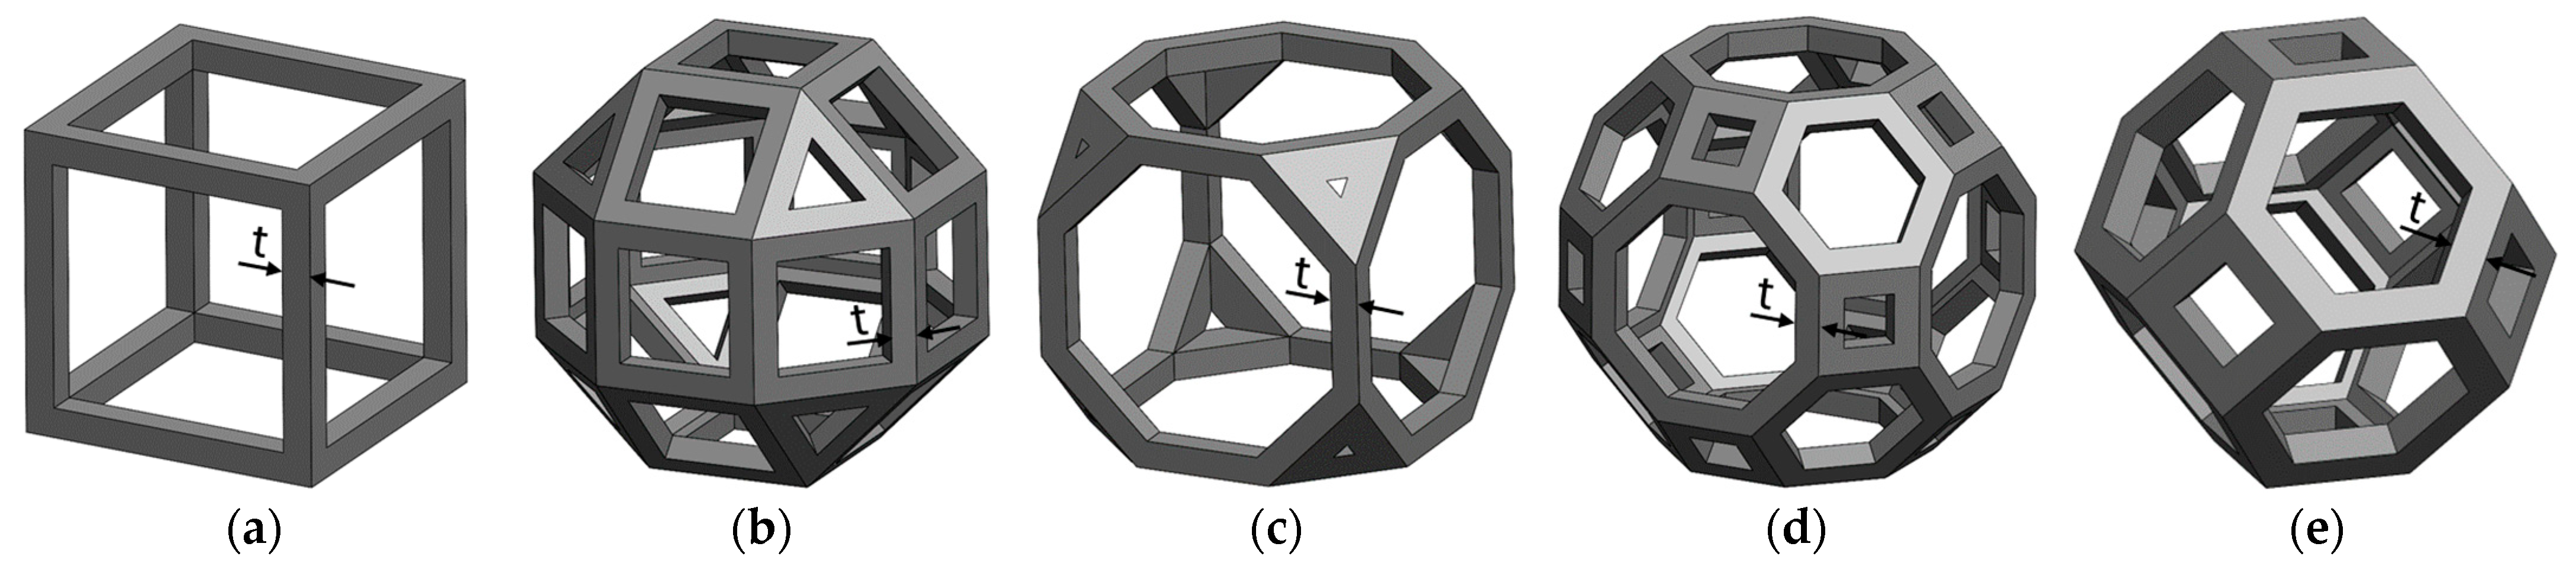
2.1. Design of Specimens

Specimens consist of lattice structures made from five different unit cell types: Cubic (C), Truncated Octahedron (TO), Truncated Cubic (TC), Rhombicuboctahedron (RCO), and Rhombitruncated Cuboctahedron (RTCO). All unit cells have a dimension of 3.5 mm, meaning they fit a cube that is 3.5 mm in length. The different unit cells can be seen in Figure 1.
For each cell type, the relative density ( ρ ¯ ) can be varied by changing the value of t (strut thickness). The relative density is the most important parameter in lattice design and measures the amount of the total volume ( V ) that is occupied by solid material ( V m a t e r i a l ), as shown in Equation (1).
ρ   ¯ % = V m a t e r i a l / V × 100
The specimens are a periodic repetition of unit cells cut into a cylindrical shape with a diameter and height of 10 unit cells that corresponds to 35 mm, based on the recommendations of ISO 13314:2011 [32]. An example of a specimen made of RTCO unit cells with ρ ¯ = 15 % is shown in Figure 2. For each cell type, three relative densities were considered (5%, 15%, and 45%).
In addition to the cellular specimens, a cylindrical bulk specimen with the same dimensions was designed to evaluate the as-printed mechanical properties of the base material of the lattice structures. This means that, in total, 15 different cellular specimens and 1 bulk specimen were designed for production.

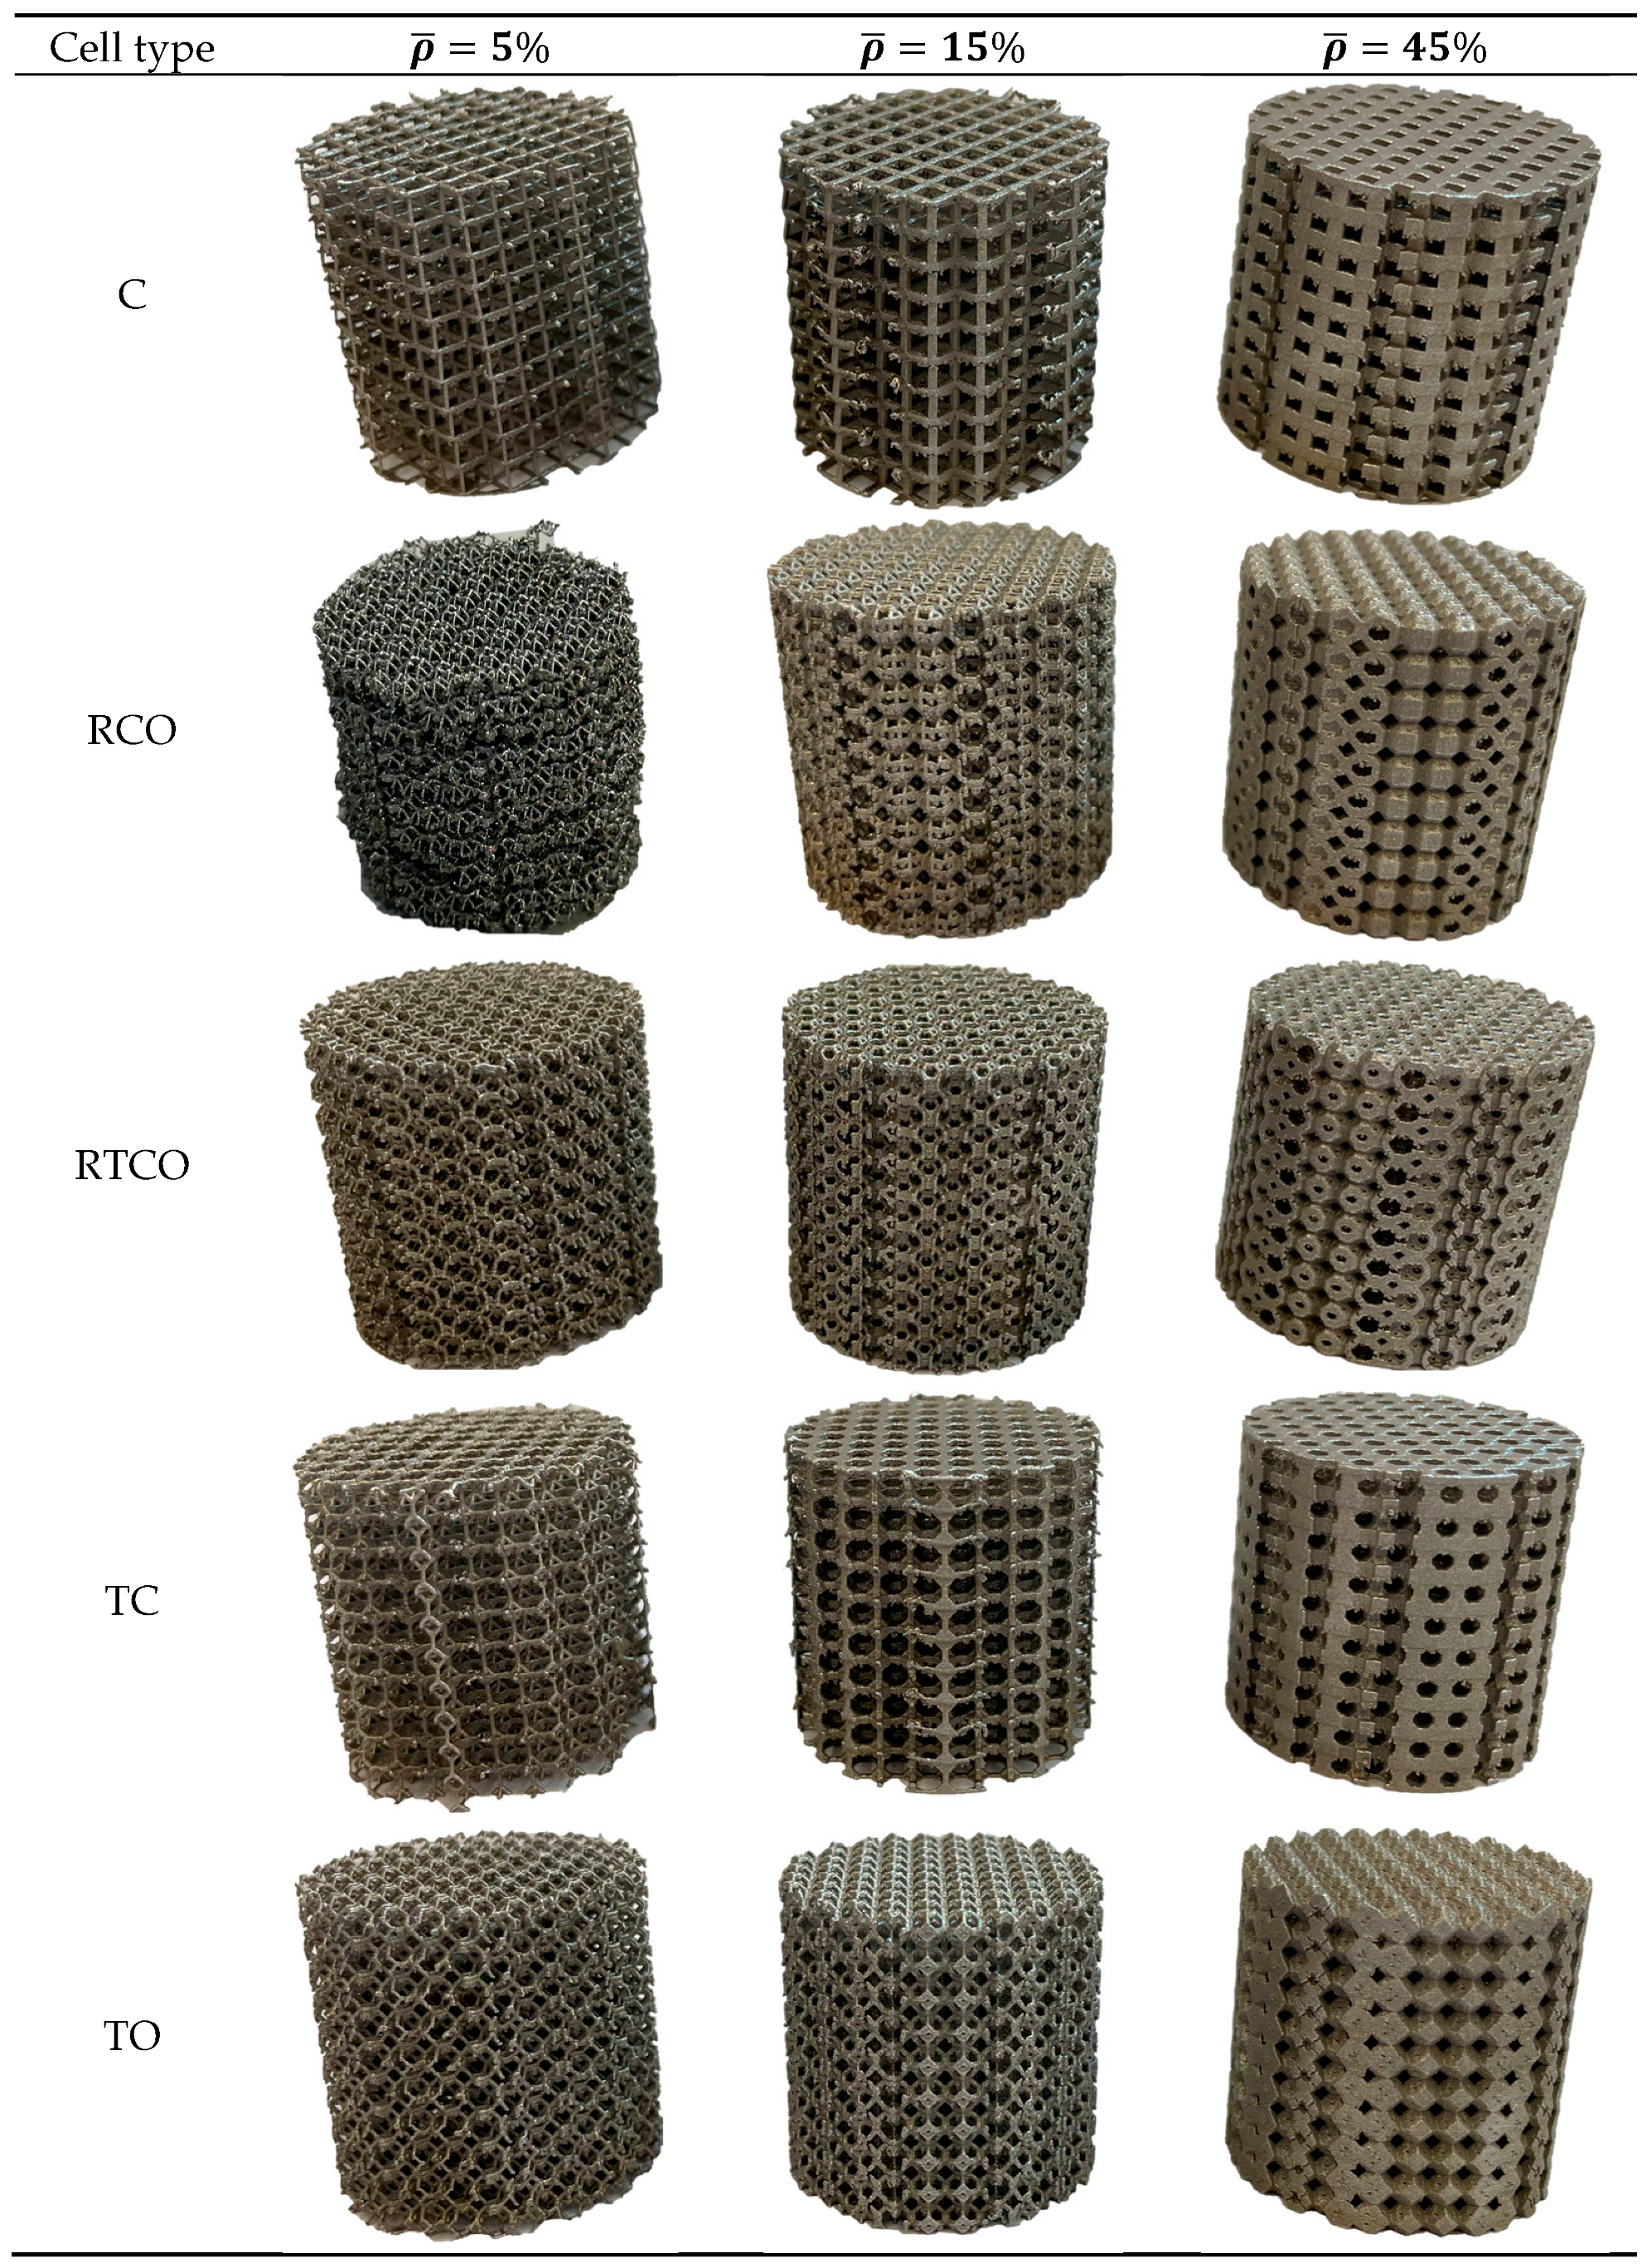
2.2. Specimen Manufacturing

Based on prior computational evaluations [24,30], the RTCO and TO geometries with a relative density of 15% were selected to be fabricated for a closer evaluation. For these two geometries and for the bulk geometry, three specimens each were produced. For the other different specimen designs, only one specimen was manufactured. Additionally, an extra specimen of the geometry made of RTCO cells with a relative density of 45% was made to test the lubrication conditions, and this was specimen RTCO-45%_P2. It is worth mentioning that the RCO geometry with a relative density of 5% was impossible to manufacture, despite repeated efforts. This meant the total number of specimens was 19 lattice specimens and 3 bulk specimens, as shown in Table 1.
A Concept Laser M2 Series 5 3D Printer (GE Additive, New York, NY, USA) was used to manufacture the samples by laser powder bed fusion (LPBF). The specimens were made of stainless steel 316L with particle sizes between 10 µm and 51 µm, an average particle size of 27 µm, and a chemical composition according to ASTM F3184 [33], which was supplied by the machine’s manufacturer (GE Additive, New York, NY, USA). The manufacturing parameters were s follows: a laser power of 300 W, a scan speed of 700 mm/s, a spot size of 130 µm, and a layer thickness of 50 µm.

2.3. Specimen Post-Processing

To manufacture the samples, a bulk building structure was employed. The building structure is essential to ensure the quality of the parts manufactured but needs to be removed prior to testing. Wire cutting using electrical discharge machining (EDM) was used to remove the building structure of all specimens (Robofil 190 Wire EDM Machine, AgieCharmilles, Biel, Switzerland). Being a thermal process, wire cutting can locally change the microstructure of the samples’ material. However, the affected region was relatively small, and no evidence suggesting that this affected the results was found. Once the building structure was removed, the specimens were cleaned with ultrasonic cleaning for 20 min in a solution of 97% ethanol to remove the excess stainless steel powder that was trapped inside the structure due to the manufacturing process.
After cleaning, the relative density of the specimens was measured using the weight method using Equation (2) [16]:
ρ ¯ = M s p e c i m e n / V b u l k ρ b u l k
where M s p e c i m e n is the mass of the specimen; V b u l k is the volume of the cylinder with the outer dimensions of the structure; and ρ b u l k is the density of the stainless steel, which was measured using the bulk specimens. Table 1 presents the designation of each specimen, its theoretical relative density, the real (measured) relative density, and the mass increment. For clarity, all specimen names are distinguished in the text by the signifiers experimental (exp.) and computational (comp.) for the rest of the document. After an initial trial for which three measurements were undertaken for one sample, the authors chose to perform only one test for each sample, because the experimental values exhibited a deviation of less than 1% in relation to the average values.
The mass increment is a measure of how much more mass than designed each specimen had and is calculated by dividing the mass of the real specimen ( M r e a l ) by the theoretical mass of the designed specimen ( M d e s i g n ), as shown in Equation (3).
M a s s   i n c r e m e n t   % = M r e a l / M d e s i g n 1 100 ρ ¯ r e a l / ρ ¯ d e s i g n 1 100
Even for specimens that have the same design, the real relative density varies slightly (Table 1), illustrating the difficulty in consistently obtaining equal parts [21]. The mass increment generally decreases as relative density increases. This is because the deviation in the strut dimensions is fixed, impacting more significantly on the specimens with a lower relative density, as reported by other authors [22,34].

2.4. Compression Tests

The compression tests were conducted using an Instron SATEC 1200 with a 1200 kN load cell and by maintaining a constant speed of 2.5 mm/min. The compression tests on the bulk specimen were conducted according to the standard ASTM-E9 [35]. The dimensions of the bulk specimens were the same as the cellular specimens, being in the admissible range recommended by the same standard, ASTM-E9 [35]. Strain measurements were conducted using a digital image correlation (DIC) system from Dantec Dynamics, model Q-400 3D. The DIC system features two cameras, each with a 6-megapixel resolution and 50.2 mm focal length lenses with an f/11 aperture. Images were captured at a rate of 10 frames per second, and the correlation algorithm was executed using INSTRA 4D V4.10 software. The average results from these tests on the bulk specimens were incorporated into the finite element simulations, in the properties definition.
The compression tests on the cellular specimens were conducted using the same machine at the same constant speed in accordance with the standard ISO 13314 [32]. These tests featured 15 different lattice specimens, as depicted in Table 1. Two lubrification conditions were considered, polytetrafluoroethylene (Teflon) and disulphide molybdenum (MoS2) grease. For most specimens, a 0.2 mm thick layer of Teflon was applied to both the top and bottom surfaces of the specimens to guarantee a low friction coefficient between the specimens and the compression plates. For only one specimen, RTCO–45%_P2 (exp.), a thin layer of disulphide molybdenum (MoS2) grease was applied instead of Teflon. The Young’s modulus was derived from the compression test results.

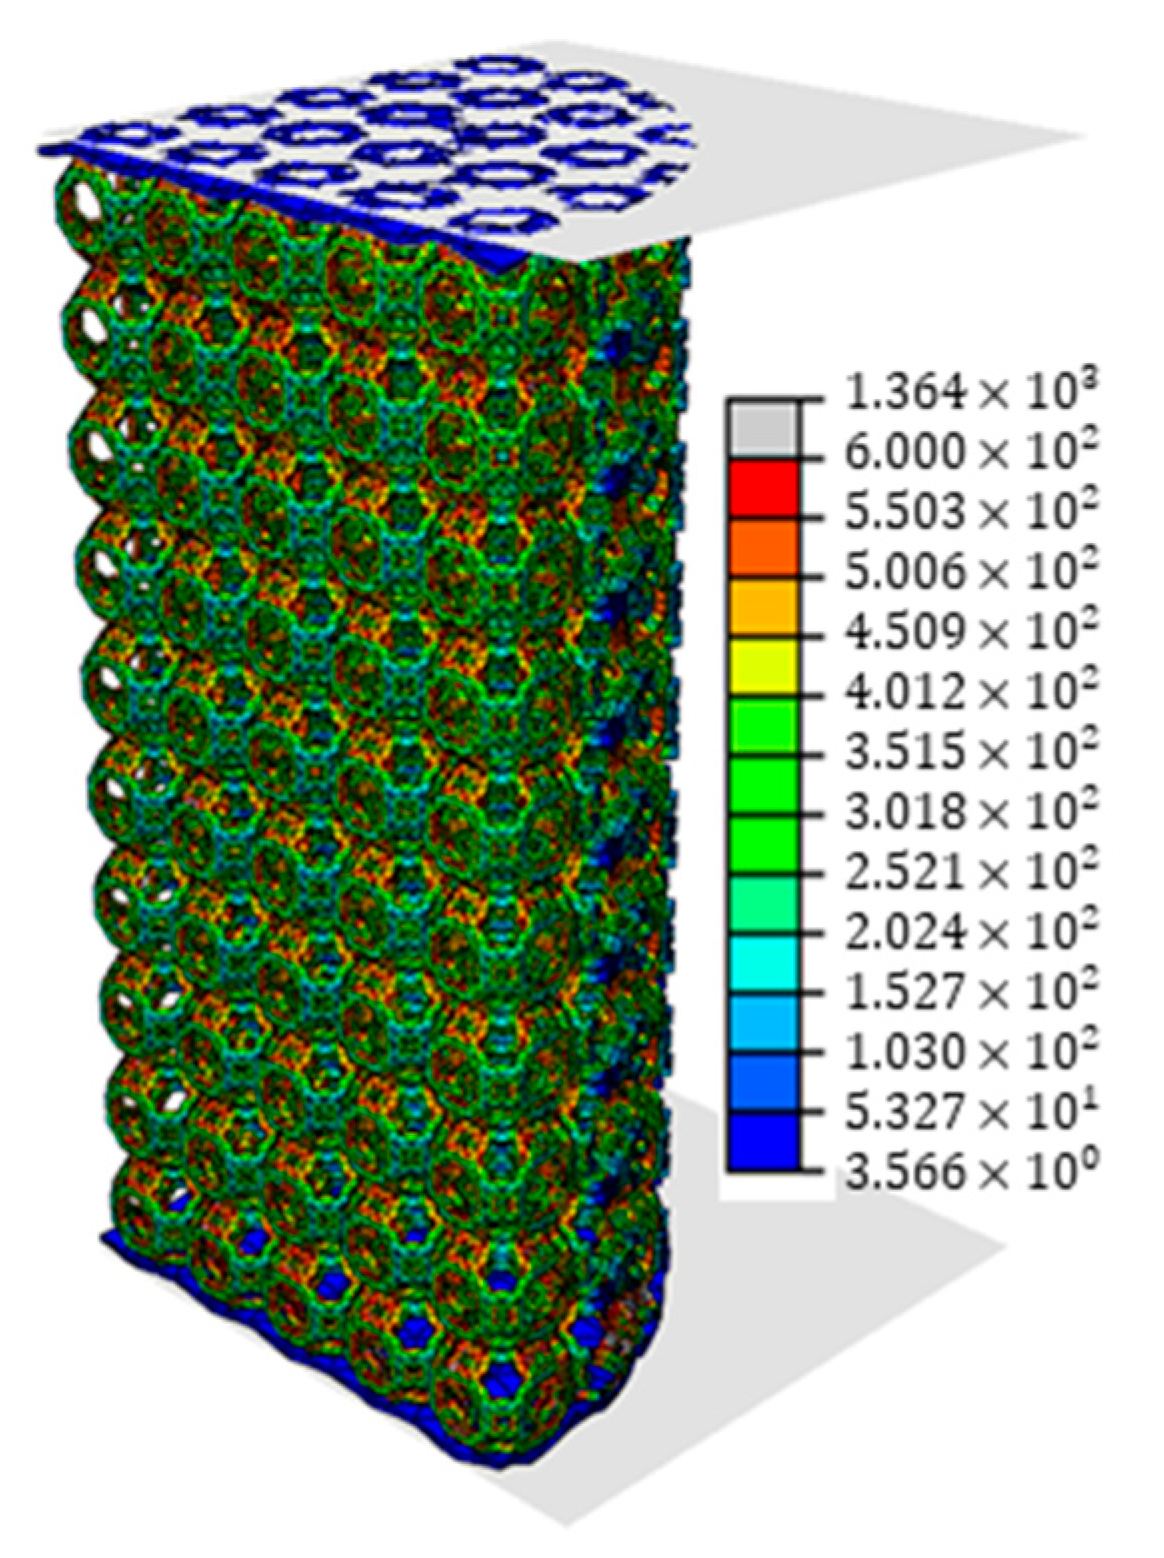
2.5. Finite Element Modelling

A total of seven finite element models were developed for selected geometries in Abaqus 2021 (Dassault Systèmes, Waltham, MA, USA). Four models were made of Cubic unit cells, considering a relative density of 15% and 19.2% and the use of disulphide molybdenum (MoS2) grease or Teflon as the lubricant, hereafter denoted as C-15%-MoS2 (comp.), C-19.2%-MoS2 (comp.), C-15%-Teflon (comp.), and C-19.2%-Teflon (comp.), respectively. The other three models were made of RTCO unit cells and considered a relative density of 15% and 45% and the use of Teflon in the 15% one, hereafter denoted as RTCO-15%-MoS2 (comp.), RTCO-45%-MoS2 (comp.), and RTCO-15%-Teflon (comp.), respectively. The idea behind creating the C models with a relative density of 19.2% was to replicate the actual relative density that was manufactured. In those models, the strut thickness is increased until the sample relative density reaches 19.2% only in the direction where there is a very clear increase due to overhanding. This direction is highlighted in Figure 3 with red arrows and blue boxes that show the thickness differences between the real and designed specimens. The main goal of these finite element analyses was to validate the computational model, providing further confidence in the computational results both of this study and of the studies previously published by the authors [24,30,31].
The numerical analyses were Dynamic Implicit analyses carried out in Abaqus/Standard. The lattices were compressed between two parallel rigid surfaces, the support and the punch. The support was maintained fixed while the punch moved at 2.5 mm/s towards the support, like in the real compression test. The simulations considered arrangements of 10 × 10 × 10 unit cells, as illustrated in Figure 2, but only one quarter of the geometry was used, Figure 4, and symmetry boundary conditions were applied to save computational time. Quadratic tetrahedral elements (C3D10) with a size of 0.25 mm were used for all models based on a mesh sensitivity analysis, where the convergence criterion was defined as less than 2.5% changes in the values of the maximum stress.
Two types of interactions between the lattices and the tools (punch and support) were considered: interaction with a thin layer of Teflon and interaction with disulphide molybdenum (MoS2) grease. In the simulations with MoS2 grease, the lattice directly contacts the surfaces with a Coulomb friction coefficient of 0.05. In the ones with the layer of Teflon, Figure 4, the Teflon lies between the lattice and the machine and is modelled with the same thickness used in the experimental compression tests, 0.2 mm. Both the interaction between the lattice and the Teflon and the Teflon and the machine is modelled with the same Coulomb friction coefficient of 0.05 [36].
The properties of the stainless steel 316L obtained in the bulk compression test were used in the simulations. The elastic regime was modelled with a Young’s modulus of 194.8 G P a and a Poisson’s ratio of 0.3, and the plastic regime was modelled using the average data from the experimental stress–strain curves. Teflon was modelled in the elastic regime with a Young’s modulus of 353 M P a and a Poisson’s coefficient of 0.47 [37] and in the plastic regime based on results available in the literature [37].
The output data from the simulations consisted of the reaction force exerted on the rigid surfaces, which was then divided by the sample’s area to derive stress. Strain was determined by dividing the displacement of the punch by the height of the sample. Stress–strain curves were generated, and the Young’s modulus (E) was calculated by performing a linear regression on the initial points of the curves.

3. Results and Discussion

Several factors are important in the discussion of the results of this study, especially in the comparison between the numerical and experimental results. These factors include the mass increment, the defects of the manufactured specimens, and the lubrication conditions. The LPBF process is controlled by many parameters, such as building atmosphere, laser input power/energy density, laser scanning velocity, hatch spacing, layer thickness, point distance, exposure time, and building orientation, among others [38]. A good balance between the parameters and the laser scanning strategy is essential to minimize defects [39]. Nevertheless, especially for geometries as complex as these, Figure 5, the as-built and as-designed geometries differ [20]. The defects observed in our samples, Figure 6, along with some geometrical inaccuracy, justify the mass increment that was observed. This is evident in Figure 3, where the designed geometry is overlayed on the manufactured geometry for C unit cells. It is possible to see that there are overhanging and balling defects and that the dimension of the struts does not exactly match the design. Other authors also report a systematic deviation of around 100 μ m in the strut dimension [22,34], resulting in higher relative densities than designed [7].

3.1. Specimens and Defects

An image of each sample is shown in Figure 5. All specimens were manufactured with success, except the RCO structure with a relative density of 5%, which was difficult to manufacture and for which some delamination of the layers due to lack of fusion is visible.
The manufacturing of the specimens introduced some defects, particularly overhanging (Figure 6), and the balling effect resulting in an uneven and compromised surface (Figure 6). To overcome these defects in such complex geometries, support structures would be required to build some regions of the unit cells and minimise overhanging. Since the support structures cannot be removed from the inside of the structure, they need to be avoided, inevitably leading to overhanging in some regions, as Figure 6 suggests. In addition to overhanging, some of the features of the specimens that should be vertical have a small tilt angle, mainly noticeable in the C and TC specimens, Figure 6a,b.
The lattice structures consist of a 3D repetition of equal unit cells with a defined geometry. This is a homogeneous structure in the sense that all cells are equal, with an open cell structure. However, due to defects in 3D printing, the struts or beams are not uniform along their length, which leads to differences among simulations and experimental samples. The intrinsic porosity of the struts was not measured.
Figure 1 shows the unit cells for all the cellular structures studied, where the connectivity of each beam is evaluated. In general, in each node, only three beams meet, with the exception of RCO, where four connected nodes are present. It seems that connectivity does not greatly affect the mechanical properties of these structures.

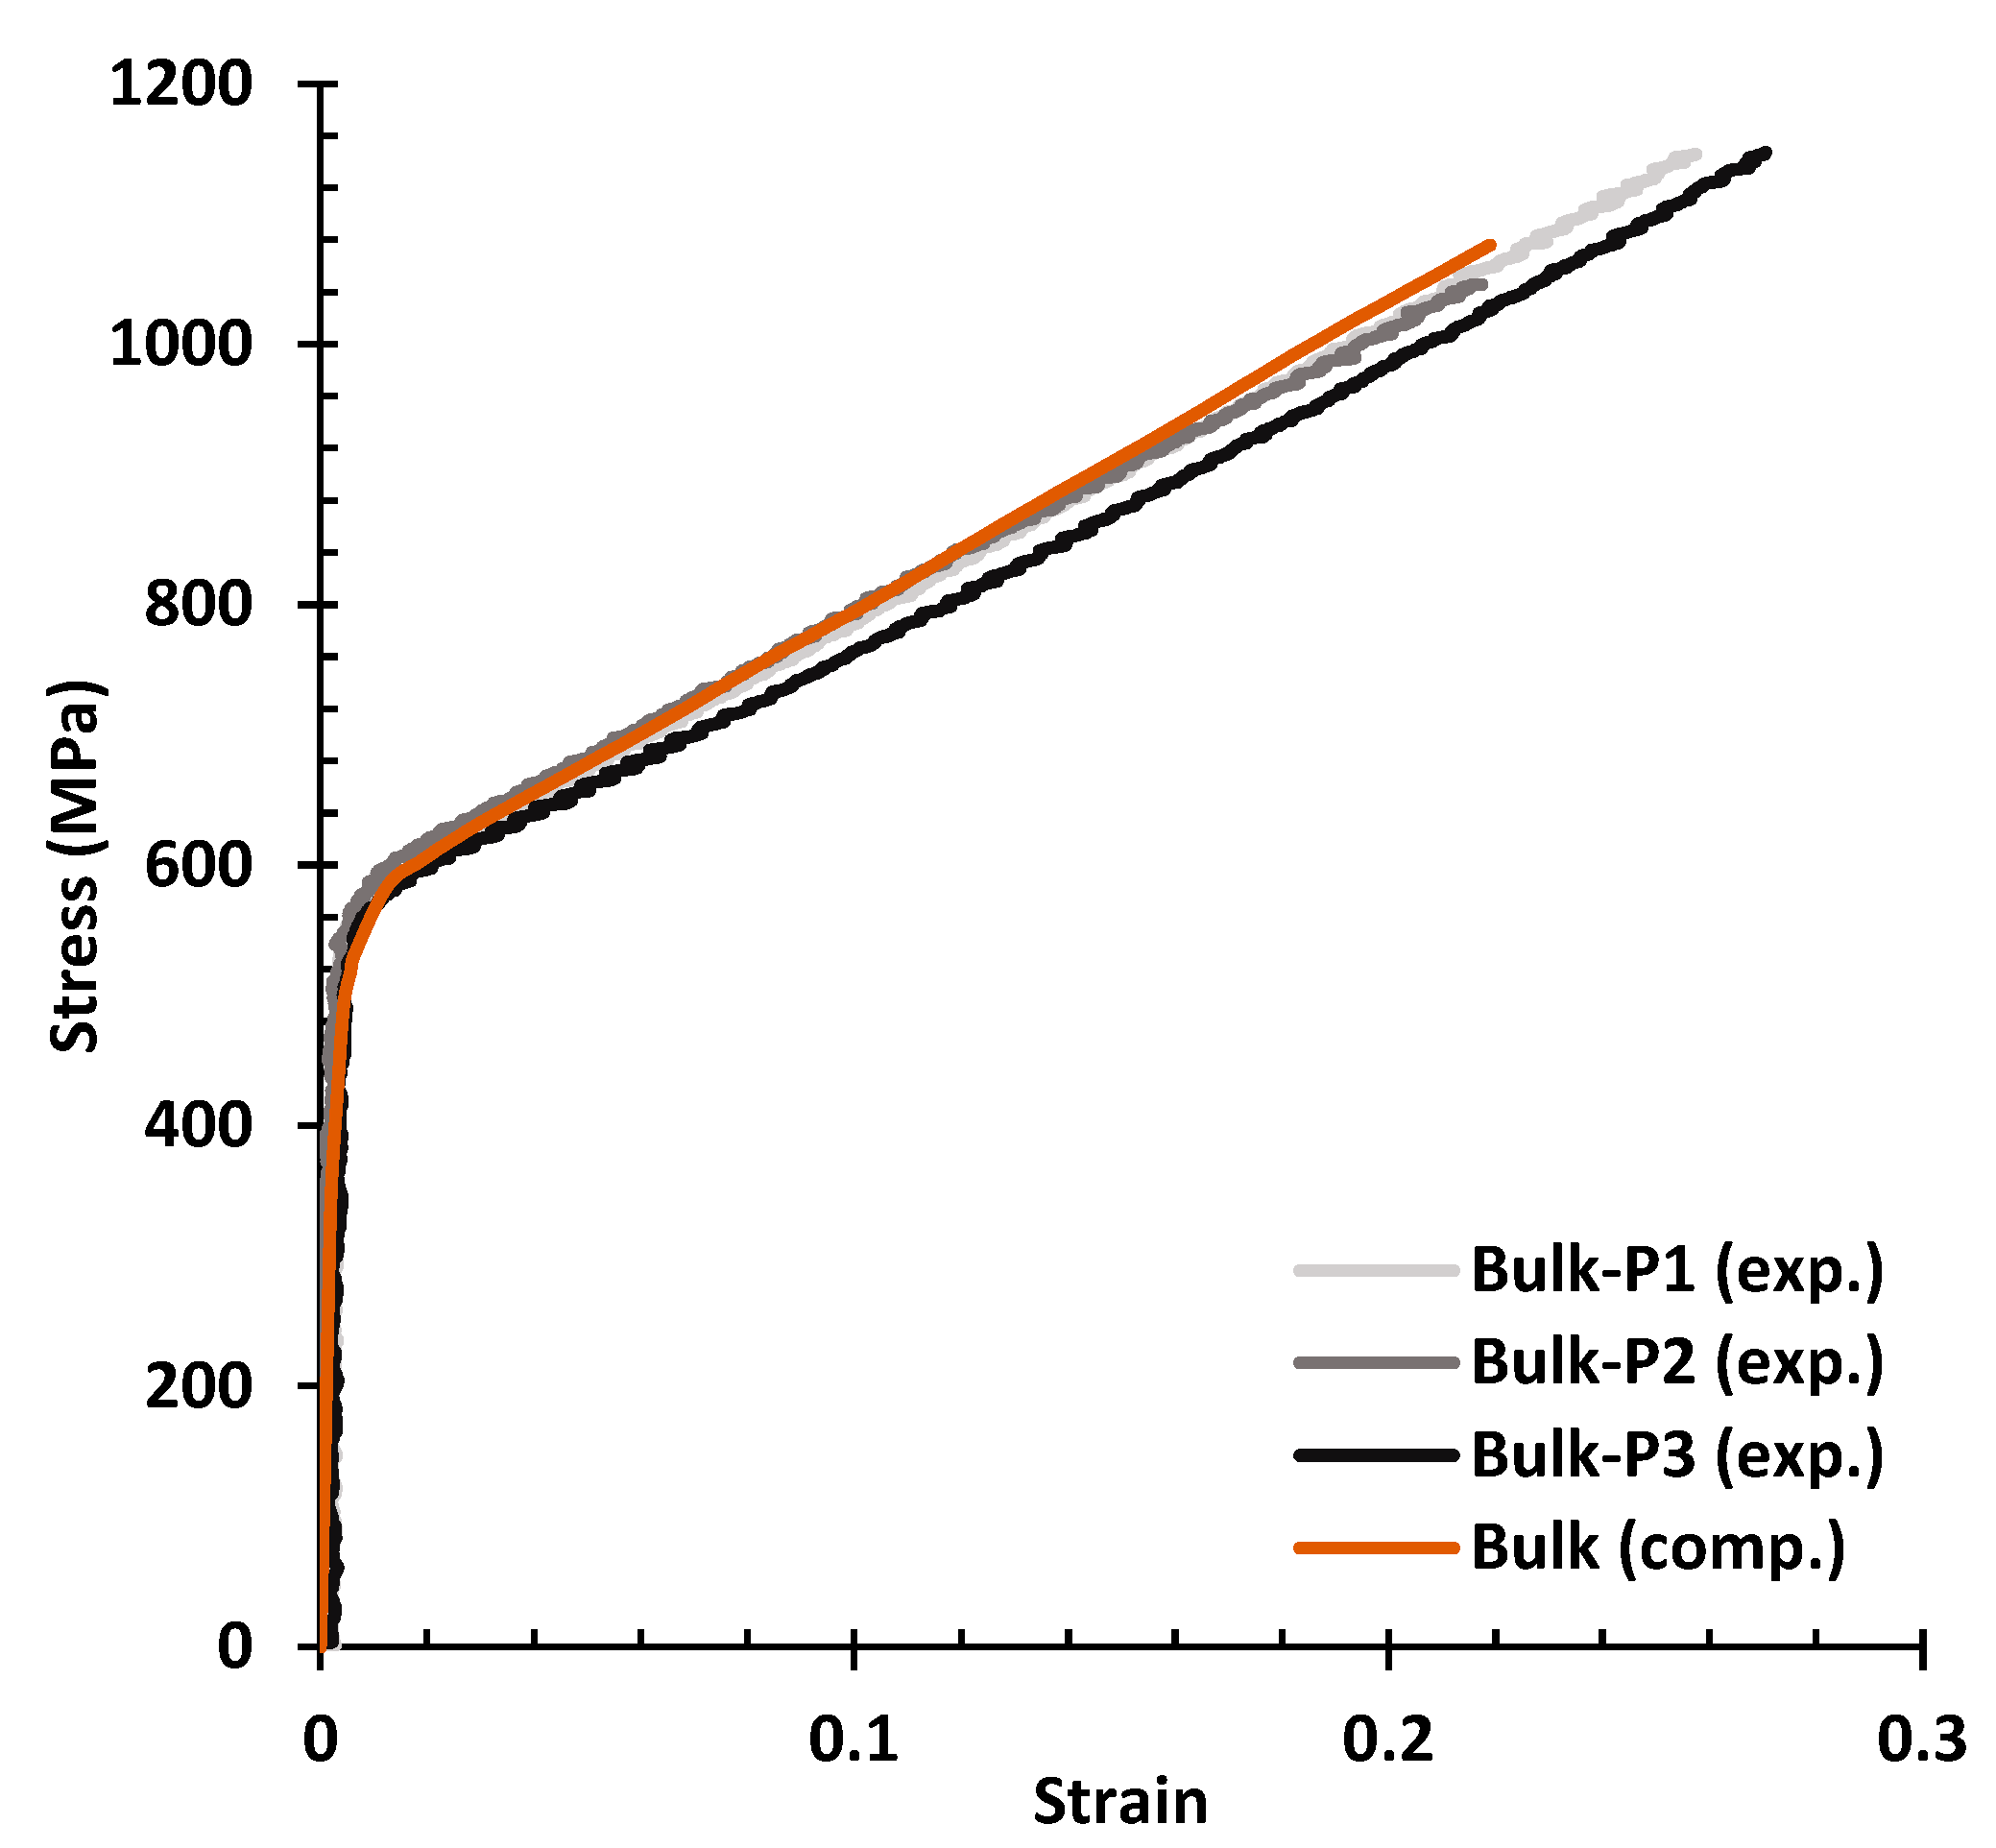
3.2. Finite Element Model Validation

As the C geometry is the simplest of the five, it is a good starting point for a comparison between the finite element analyses and the experimental results. Figure 7a shows four numerical results and the experimental result of specimen C-15% (exp.). As explained previously, the four C numerical results consider two different relative densities (with the designed relative density of 15% and with the real relative density 19.2%) and two different lubrication conditions (Teflon and MoS2). Table 2 shows the Young’s modulus and the 0.2% offset yield stress for every cellular specimen.
It is possible to see from the numerical results that the use of Teflon as the lubricant decreases the evaluated Young’s modulus because Teflon plastically deforms prematurely compared with the lattice due to its low stiffness. Even with only a thin 0.2 mm Teflon layer on the top and bottom of the specimens, its effect is noticeable in the elastic regime. Nevertheless, the Young’s modulus value derived from using Teflon is more similar to the experimental one that was also obtained using Teflon, validating the numerical model (Table 2). It should be noted that the most representative Young’s modulus of the structure itself is the one with MoS2, because it is not affected by the low stiffness of the Teflon layer.
The effect of the mass increment in the C models is negligible in the elastic regime and only becomes important as deformation increases, with both results for the same relative density tending to the same value despite the initial differences. In this case, it could be argued that this result is trivial because of the way that the geometry was constructed, but it is not trivial for more complex structures. What this result shows is that the mass increment can, in fact, be load-bearing, but it may also not be, depending on the geometry.
All four numerical models suggest that the yield stress of the C-15% (exp.) specimen should be higher and closer to 30 M P a (Table 2). The reason why it is not is because of the tilt on the vertical bars of the manufactured specimen (Figure 6a). This structure is prone to buckling for low relative densities, as will be discussed in the next section, and these imperfections in the vertical bars facilitate the early buckling of the structure, significantly reducing the buckling load and, therefore, the yield stress.
Figure 7b shows the results for specimens RTCO-15%_P1 (exp.), RTCO-15%_P2 (exp.), and RTCO-15%_P3 (exp.), with designed relative densities of 15% and real relative densities of around 23%, and two numerical results considering the designed geometry with a relative density of 15% and the two lubrication conditions. The average Young’s modulus of the specimens RTCO-15% (exp.) (P1, P2, and P3) is 1.523 G P a , and that for the specimen RTCO-15-Teflon (comp.) is 1.507 G P a . In this example, the numerical model can again predict the Young’s modulus with accuracy; nevertheless, like in the C example, if MoS2 had been used as the lubricant in the experiments, the value of the Young’s modulus obtained experimentally would be higher and more representative of the Young’s modulus of the structure. Like in the prior example for the C structure, the mass increment does not play a significant role in the elastic regime, with the results of the three specimens showing very similar Young’s modulus values, but it does play a significant role in the plastic regime—as the real relative density increases (Table 1), the plastic stresses also increase (Figure 7b). Because this geometry does not suffer from the tilting problem like the C geometry, Figure 6a, the mass increment is the predominant factor, and therefore, the yield stress tends to be higher than the numerical models predict (Table 2); this is the case for all geometries except the C and TC geometries, which suffer from the same problems due to their geometric similarity.
Finally, Figure 7c shows the results for specimens RTCO-45%_P1 (exp.) and RTCO-45%_P2 (exp.), with designed relative densities of 45% and real relative densities of around 53%, and a numerical result considering the designed geometry with a relative density of 45%. In this case, it is possible to see that the numerical model can also predict, with reasonable accuracy, the mechanical properties when the lubricant used is MoS2. Again, the yield stress of the experimental specimens is slightly higher than the numerical result, but the difference is comparatively smaller than in the case of Figure 7b, because the mass increase is also smaller in percentage (Table 1). This reinforces the point that the mass increment is the predominant factor in the plastic regime. For example, using the 0.2% offset method, the yield stress of specimen RTCO-45%_P2 (exp.) is 119.5 M P a , and that of specimen RTCO-45%-MoS2 (comp.) is 107.8 M P a .
Several authors use finite element analysis to estimate the mechanical properties of cellular structures like the ones of this study [1,3,10,25,26,27]. Liu et al., for example, reported very similar discrepancies to the ones presented in this study between the numerical and experimental results of octet and RCO unit cells [21]. The correlation of the numerical-experimental results is critical to understanding the limitations of the numerical model, which can be significant, as illustrated in this study. Nevertheless, finite element analysis, once validated, can save a lot of time and financial resources that are needed to manufacture samples and can predict the mechanical properties of these structures with accuracy [3].

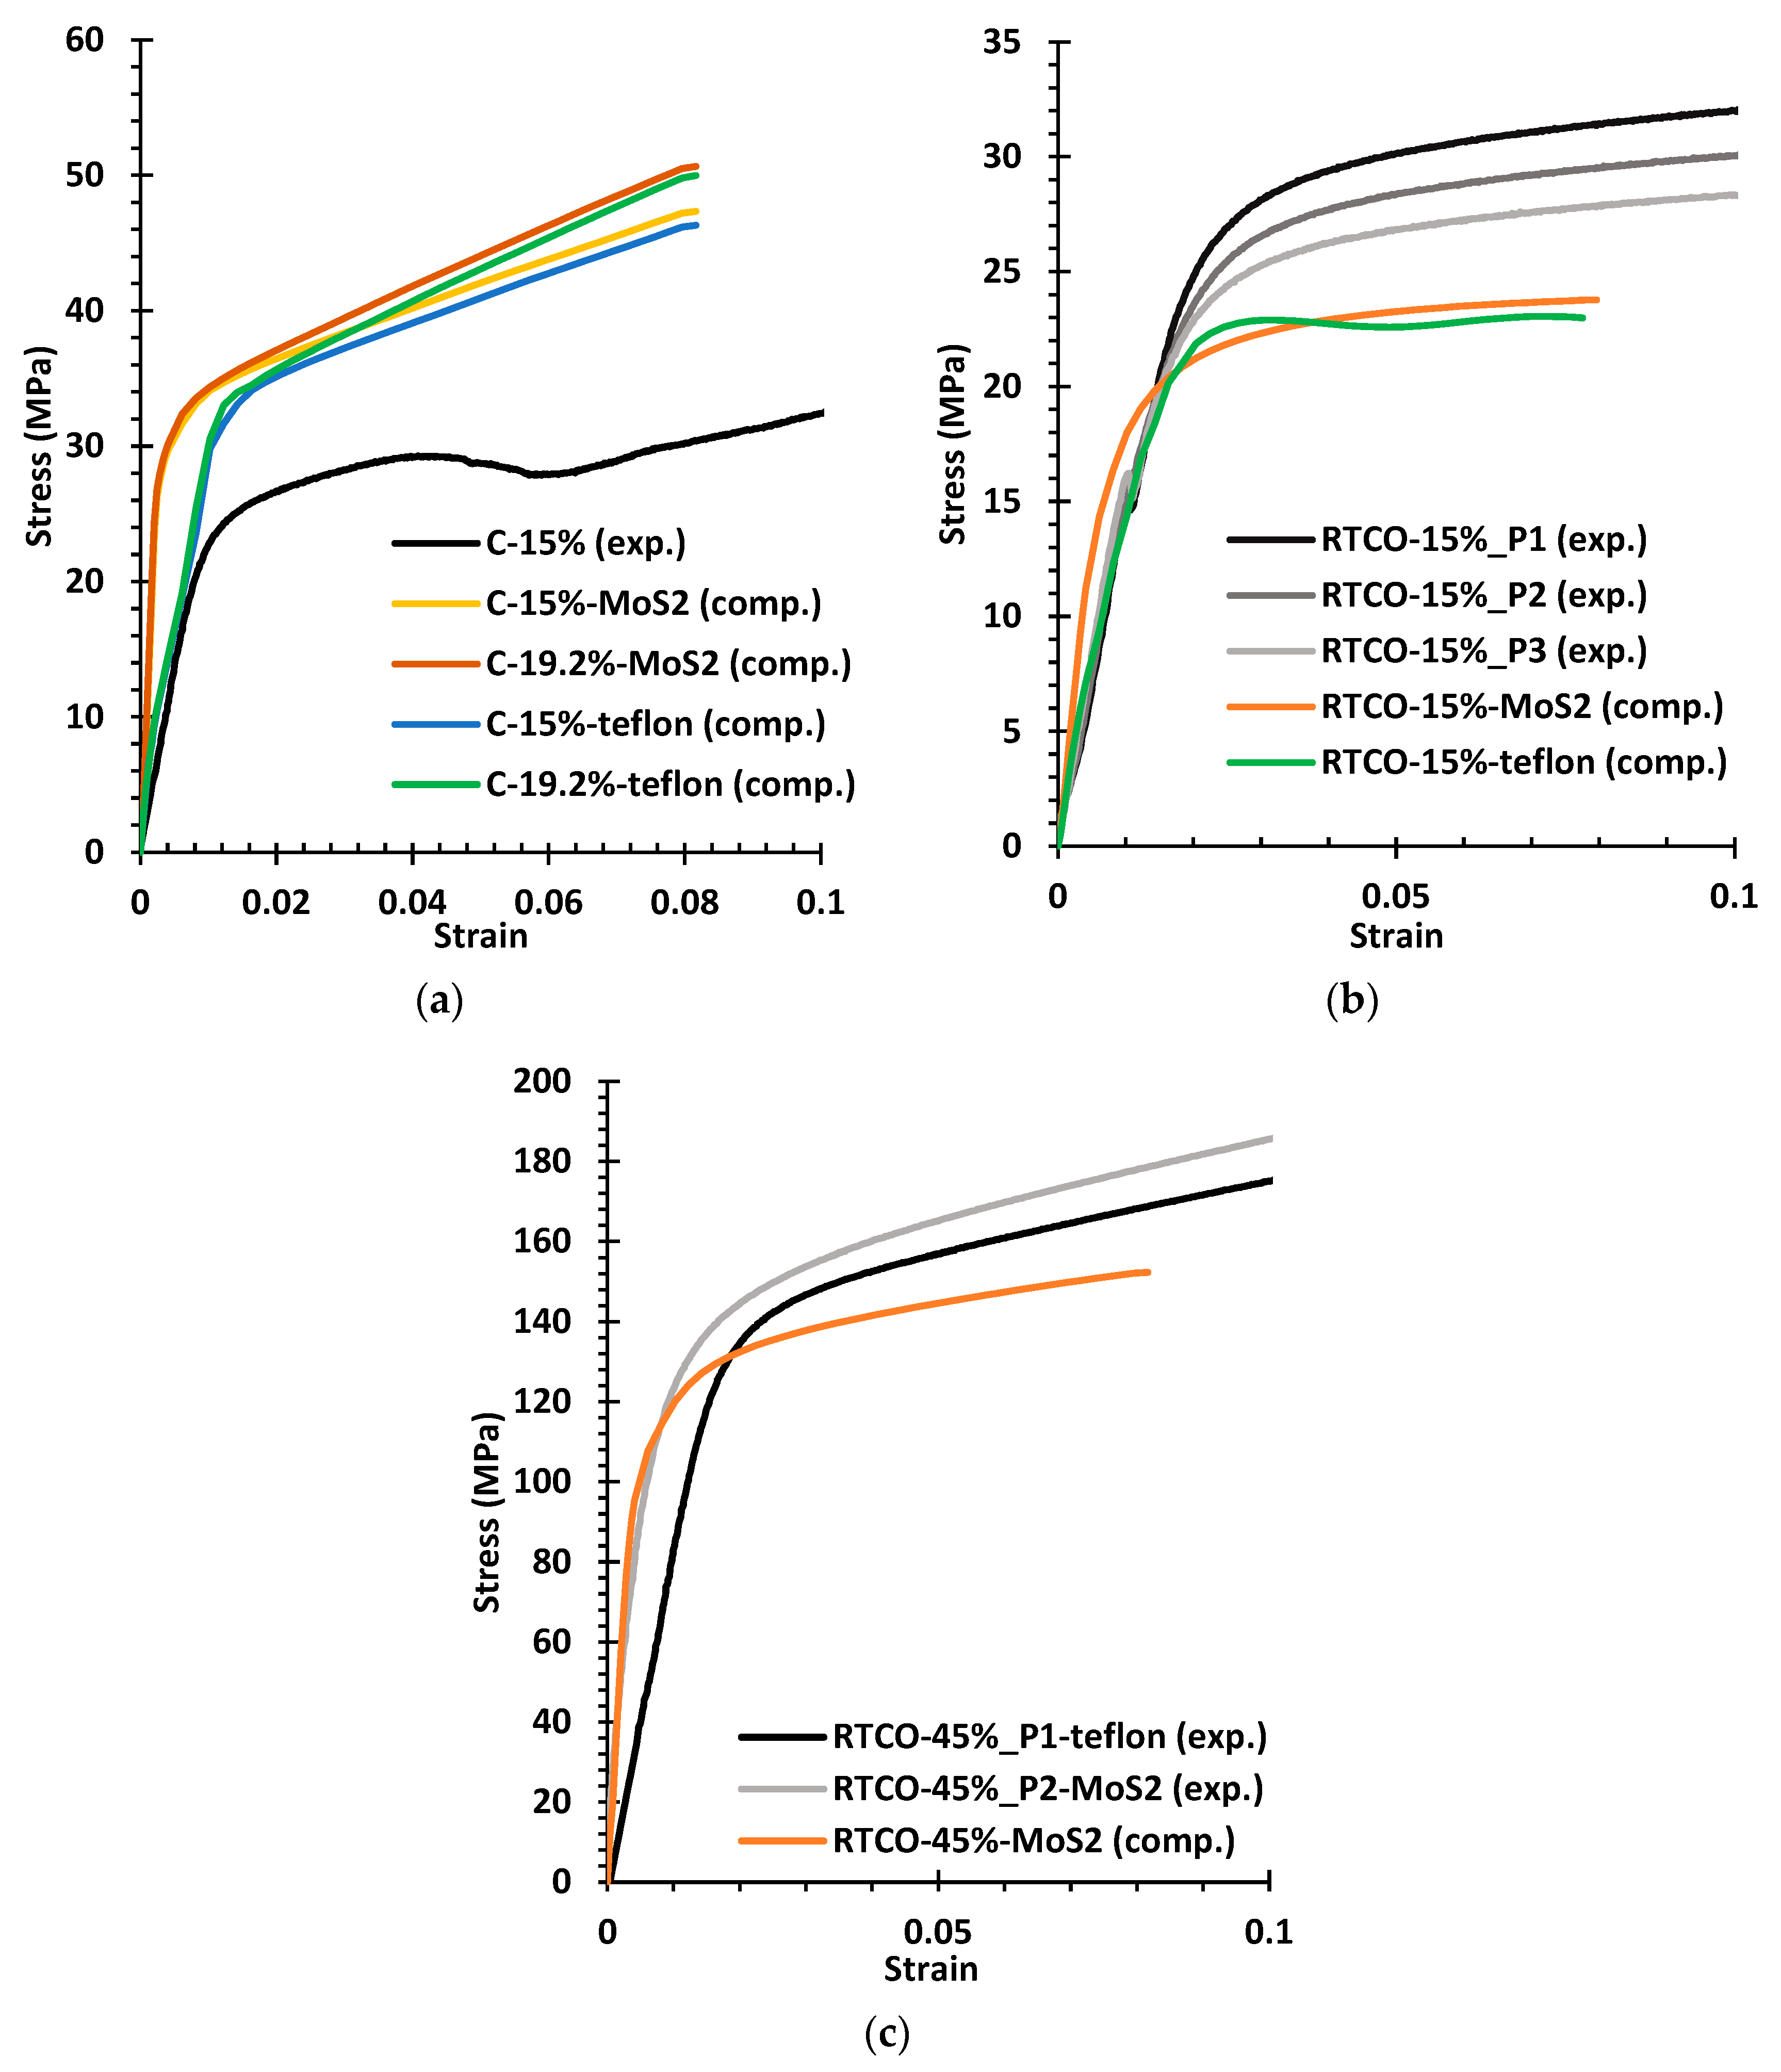
3.3. Experimental Compression Tests

The experimental compression tests on the bulk 316L stainless steel specimens allowed us to obtain an average Young’s modulus of 194.8 G P a and a yield stress of 449 M P a . These values were used in the finite element simulations, along with the plastic data obtained from the average stress–strain curves. The results of the three bulk specimens and a computational equivalent confirming that the properties could be reproduced computationally can be seen in Figure 8.
The stress–strain curves of the experimental tests on the cellular specimens are shown in Figure 9 for specimens with a designed relative density of 5% (Figure 9a,b), 15% (Figure 9c,d), and 45% (Figure 9e,f). The curves on the right (Figure 9b,d,f) are a zoom of the curves on the left (Figure 9a,c,e, respectively), which show deformation only until a strain of 10%. For the RTCO and TO results in Figure 9c,d the average of the three tests is shown, along with a shaded region that represents the minimum and maximum values. When analysing the mechanical properties of lattices, a clear distinction must be made between stretch-dominated structures and bending-dominated structures [29,40,41,42]. RTCO, TO, and RCO unit cells are bending-dominated, meaning that their deformation will mostly occur by the bending of the struts. On the other hand, C and TC unit cells are stretch-dominated, meaning that most of their struts are parallel to the applied load, conferring them a higher stiffness but causing them to suffer from instabilities like buckling, especially at low relative densities.
Figure 9a,b show that for a low relative density of 5%, the C and TC structures suffer from buckling. This is most evident in the C structure, for which the various layers collapse sequentially every time the buckling load is reached as deformation advances (Figure 10a–d). The occurrence of buckling for the C and TC structures with low relative densities was expected, as not only have the authors reported it in prior studies [24], but also other authors, like Ahmadi et al. [4], have reported it too. Because these (C and TC) structures are stretch-dominated, they present the stiffest solution, and for all relative densities their, Young’s modulus is very similar. Unfortunately, the RCO specimen with a relative density of 5% could not be manufactured, as seen in Figure 5. However, two prior studies suggest that this structure is unstable for low relative densities [4,24]. The RTCO and TO structures are the ones that exhibit a smooth deformation behaviour at low densities, as Figure 10e to Figure 10h illustrate for the RTCO specimen with a relative density of 5%. Even knowing that medical implants are designed to work in the elastic regime, because of their stability and smooth deformation behaviour, the RTCO and TO cell types are the most suitable to apply in medical implants, as there is no need to incur an additional risk of unstable collapse, which can occur with C, TC, or RCO unit cells at low relative densities.
Figure 9c,d show that at a designed relative density of 15%, the C and TC geometries are not stable yet, while the RCO, TO, and RTCO are. One interesting result is that the TC geometry exhibits a clear point of maximum force that is higher than what all other cell types can achieve; this happened after it destabilized at a strain of approximately 0.26.
This is particularly impressive considering that except for the C-15% (exp.) specimen, the TC-17% (exp.) specimen is the one in Figure 9c,d that has the lowest real relative density. The RCO-15% (exp.) specimen has a Young’s modulus very similar to the other stable unit cells, and it shows that the RCO unit cell is not only stable at a design relative density of 15% but also the one with the highest yield stress (28.6 M P a ) from both the stable and non-stable unit cells (Table 2).
Figure 9e,f and Table 2 demonstrate that for a design with relative density of 45%, the Young’s modulus values of the different cell types C, TC, TO, RCO, and RTCO are 13.958 G P a , 12.015 G P a , 10.986 G P a , 10.426 G P a , and 8.548 G P a , respectively. It can also be seen that in this case, the stable unit cells (TO, RCO and RTCO) are the ones that have the highest yield stress (up to 130.7 M P a for the TO geometry). This can also be attributed, as discussed previously, to a higher mass increment in these specimens, especially in the RCO-45% (exp.) specimen, for which the real relative density is close to 60%. Nevertheless, in particular, specimens TO-45% (exp.) and RTCO-45%_P1 (exp.) show interesting properties, being able to surpass the yield stress values and almost match the Young’s modulus values of the stretch-dominated unit cells.
For all relative densities analysed, the TO and RTCO geometries maintain a stable deformation behaviour. Even if the mass increment has a direct impact on the rise of the yield stress and on the stresses after yield, the Young’s modulus values of these two unit cells can be predicted with reasonable accuracy by finite element analysis. This means that the stiffness of the implant will be more accurate, which is relevant for stress shielding reduction. Therefore, having a higher yield stress than the one predicted numerically will act as an additional safety factor, making the implant less prone to plastic deformation, or affording it a longer fatigue life than numerically predicted.
The control of the manufacturing process is very important to guarantee that mass increment does not turn to mass reduction, which could result in lower yield stress than expected, endangering the life cycle of the implant.

3.4. Discussion of Application in Medical Implants

Metallic implants have dominated the market for a long time, especially in load-bearing contexts [19,43]. The materials of which the implants are made need to be biocompatible, and recently, a new trend of biodegradable temporary implants and scaffolds is emerging, requiring them to also be biodegradable like iron [2,7,16,44,45,46], magnesium [47], or zinc [18,48]. Lattice structures like the ones of this study are a viable route in this transition, enabling the personalization of the geometry, mechanical performance, and biodegradation performance of this new generation of implants and scaffolds [49]. The results of this study show that lattice structures made of 316L stainless steel can have very versatile properties, being able to mimic the mechanical properties of bone tissue, which can range from a Young’s modulus of 100 to 900 M P a for trabecular bone to from 13 to 35 G P a for cortical bone [50,51,52,53,54]. The validation of the finite element models of this study provides further confidence in the results of the authors’ previous computational studies that evaluated lattices made of iron [24].
Despite being able to mimic the mechanical properties of bone, manufacturing lattices with minimal defects and consistent mechanical properties is still a challenge [20,21,22]. This study’s findings indicate variability in the Young’s modulus, yield stress, and stresses after yield, which can significantly impact the absorbed energy [55]. To successfully integrate these structures into the medical implant industry, it is essential to achieve a precisely predictable mechanical behaviour. This means that more mechanical tests are required to fully characterize the structures, including tensile, bending, and fatigue tests. Additionally, scaling the production of this new generation medical devices to meet industrial demands poses another challenge, as the current manufacturing processes, like LPBF, are considerably slower than conventional methods [56].
When designing implants with lattice structures, functionally graded designs obtained by, for example, topology optimization reveal the possibility of reducing stress shielding locally, minimizing it [8,9]. Graded designs can have sharp changes in relative density [3,7,31], having regions that require unit cells with a very low relative density. For this reason, unstable unit cells should be avoided. If, on top of this, the implant is manufactured in a biodegradable material, the implant degrades in the body, and the thickness of the struts will progressively be reduced. This will reduce the relative density of the unit cells, compromising their stability. Even for stable structures at a higher relative density, a critical level for which they are no longer stable will eventually be reached. This study suggests that out of the five unit cells evaluated, the best ones are TO and RTCO.
Between these two geometries, there is not necessarily one that is better than the other, as it is a matter of compromise. The TO geometry has a mechanical behaviour superior to the RTCO geometry for a given relative density; however, it can only be manufactured by LPBF without an enclosed pore until a relative density of around 45–50%, while the RTCO geometry can reach relative densities of up to 65–70% [24]. Even though a relative density of 65% for the RTCO geometry leads to a Young’s modulus much higher than that of bone, inducing stress shielding, it may be necessary to provide bone with the support it needs to heal. It may also be useful in topology optimization to achieve greater mechanical properties or increased fatigue life only locally and not globally. The RTCO geometry also has a surface area that is about 25% higher than the TO geometry for a relative density of 15%. The surface area relationship changes slightly with the relative density, but in general, the surface area of the RTCO geometry is higher than that of the TO geometry. The relationship between surface area and volume has a strong impact on the osteointegration and biodegradation rate of the implant. A higher surface area-to-volume ratio facilitates bone cell attachment and proliferation, enhancing the osseointegration process, and promotes faster degradation due to increased exposure to body fluids and cellular activity [43]. So, it is a matter of compromise and finding the solution that best fits the patient based on age, weight, and/or other relevant characteristics.

4. Conclusions

Through a comprehensive examination of lattice structures, encompassing the manufacturing of the specimens, experimental testing, and numerical modelling, the present study contributes to a deeper understanding of lattice design and mechanical behaviour. To achieve this, the mechanical properties of lattice structures made of five different unit cell types, Cubic (C), Truncated Octahedron (TO), Truncated Cubic (TC), Rhombicuboctahedron (RCO), and Rhombitruncated Cuboctahedron (RTCO), were evaluated under uniaxial compression through a combination of experiments and numerical simulations. The numerical results were in agreement with the experiments but presented some deviations that can be justified by the differences between the designed geometries and the geometries that were actually manufactured. From a thorough analysis of the manufactured specimens and the respective stress–strain curves, some conclusions can be drawn:
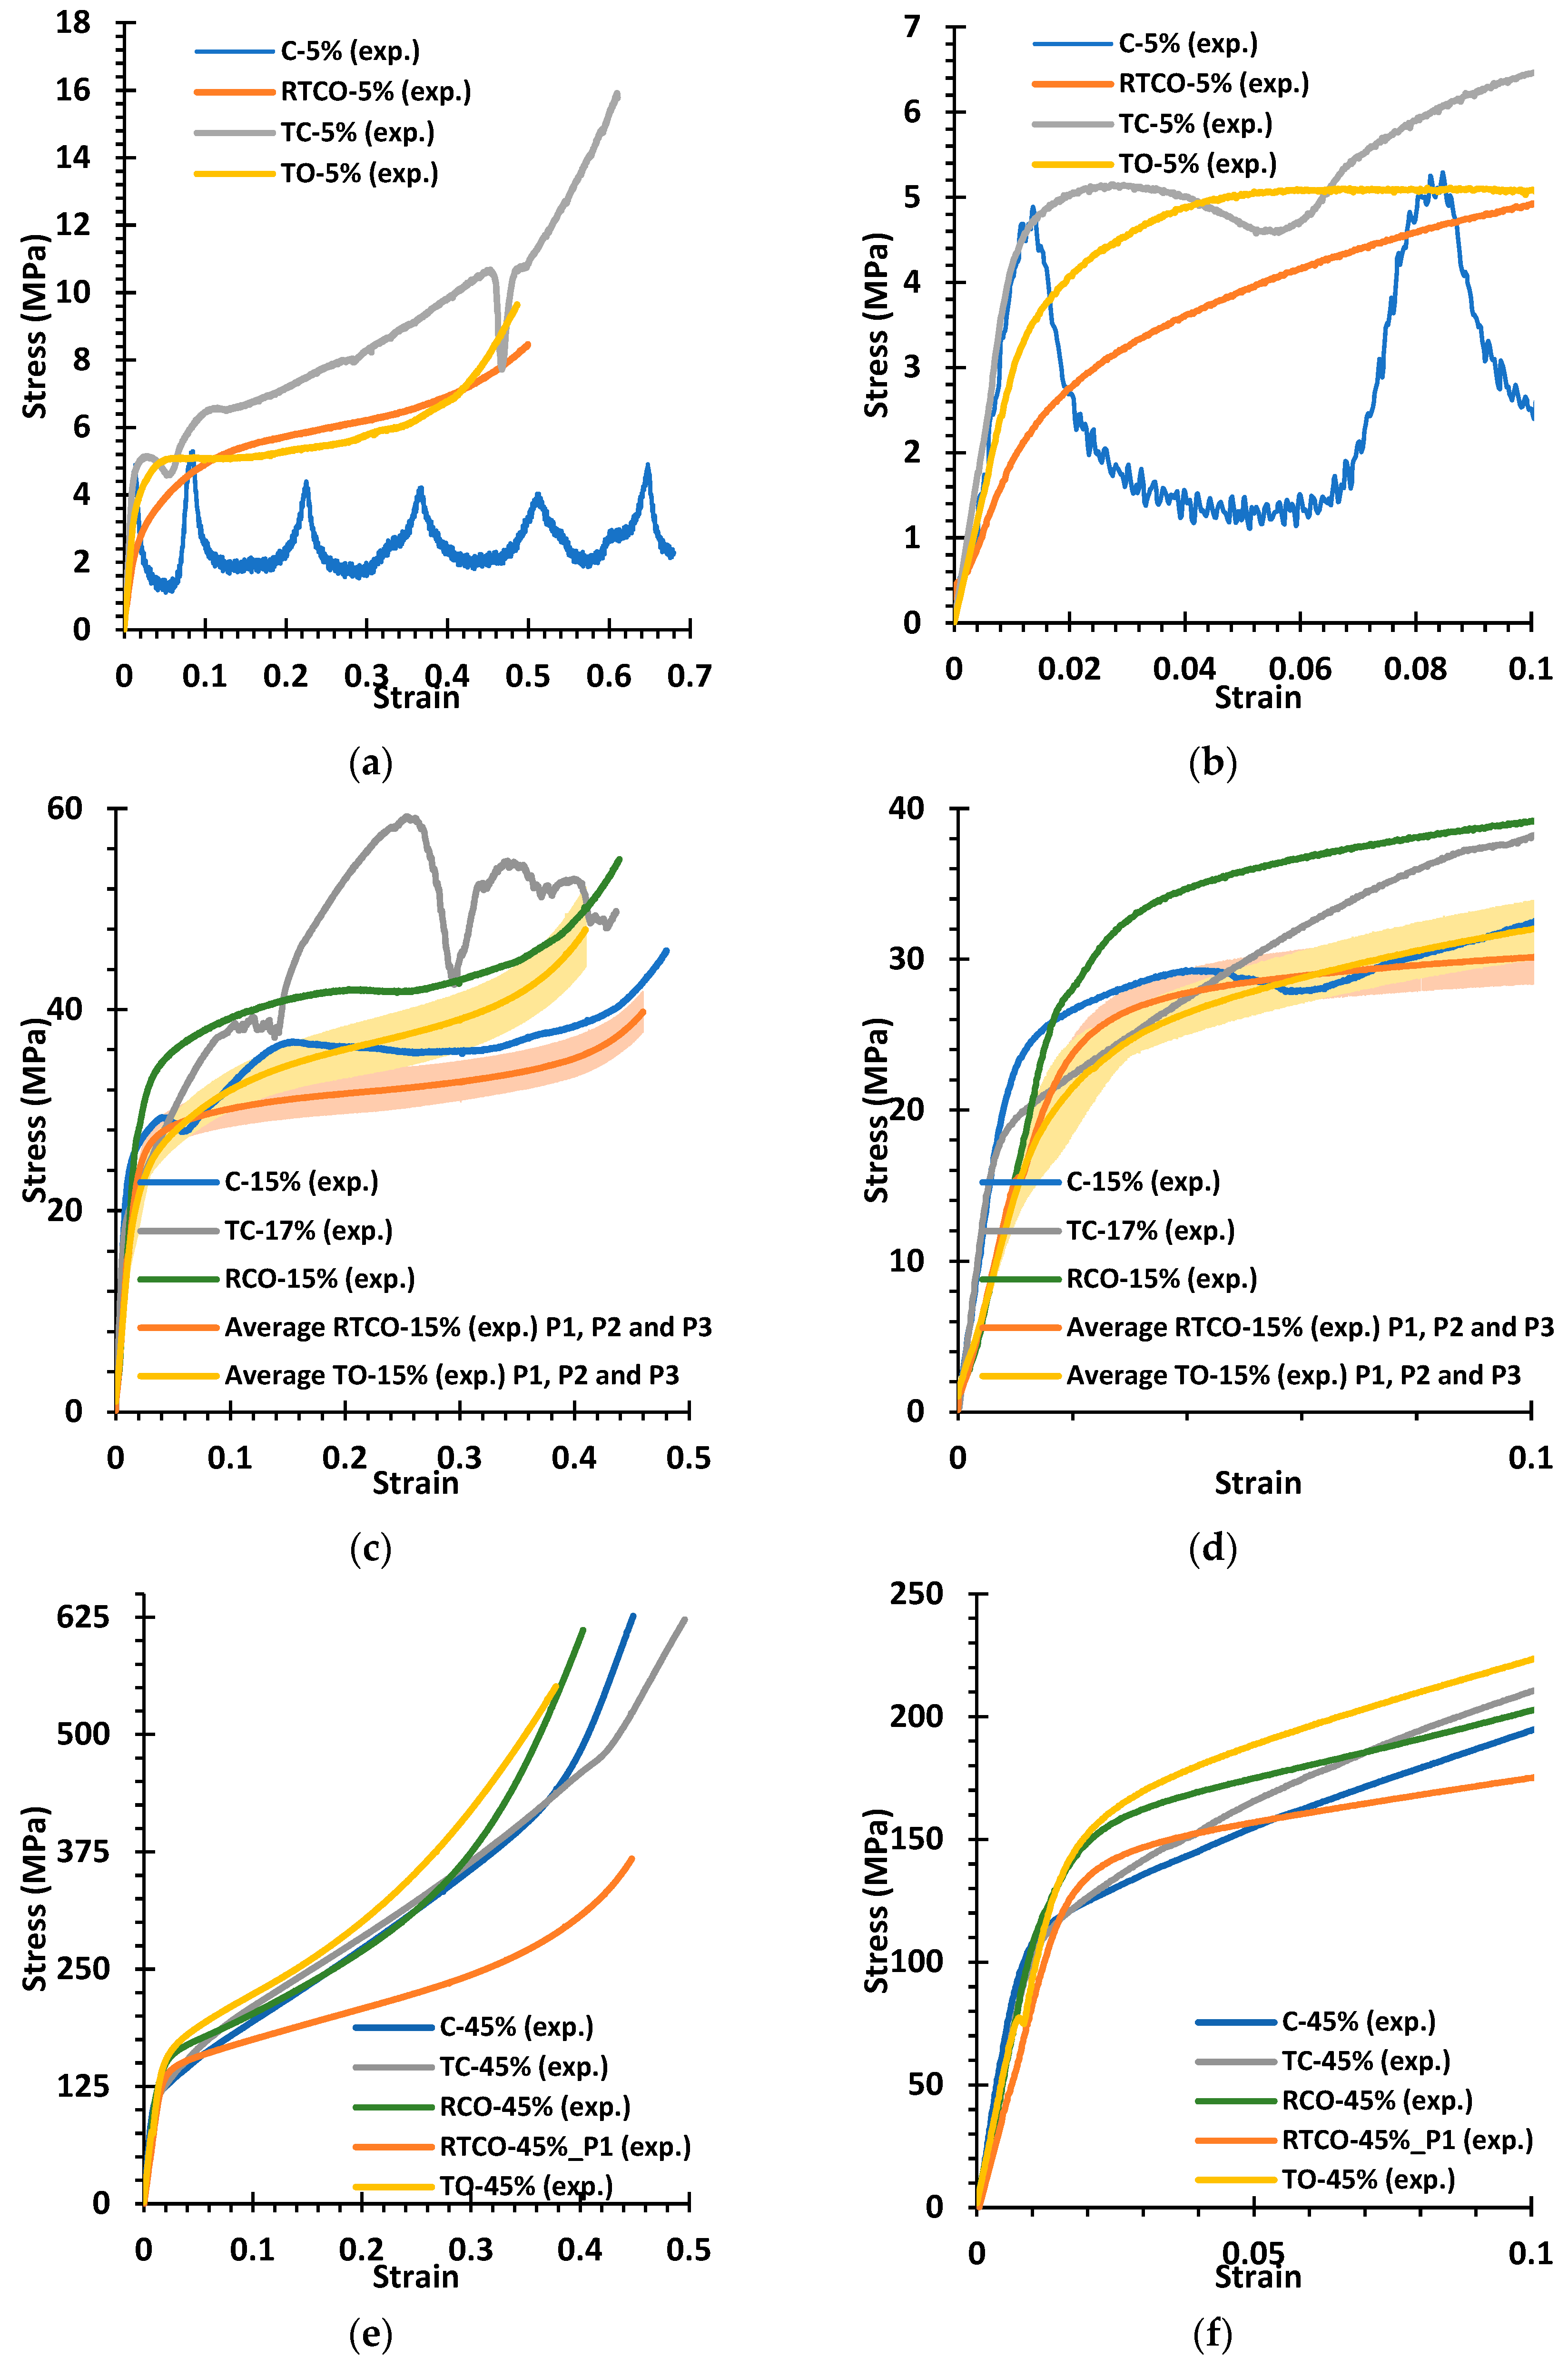
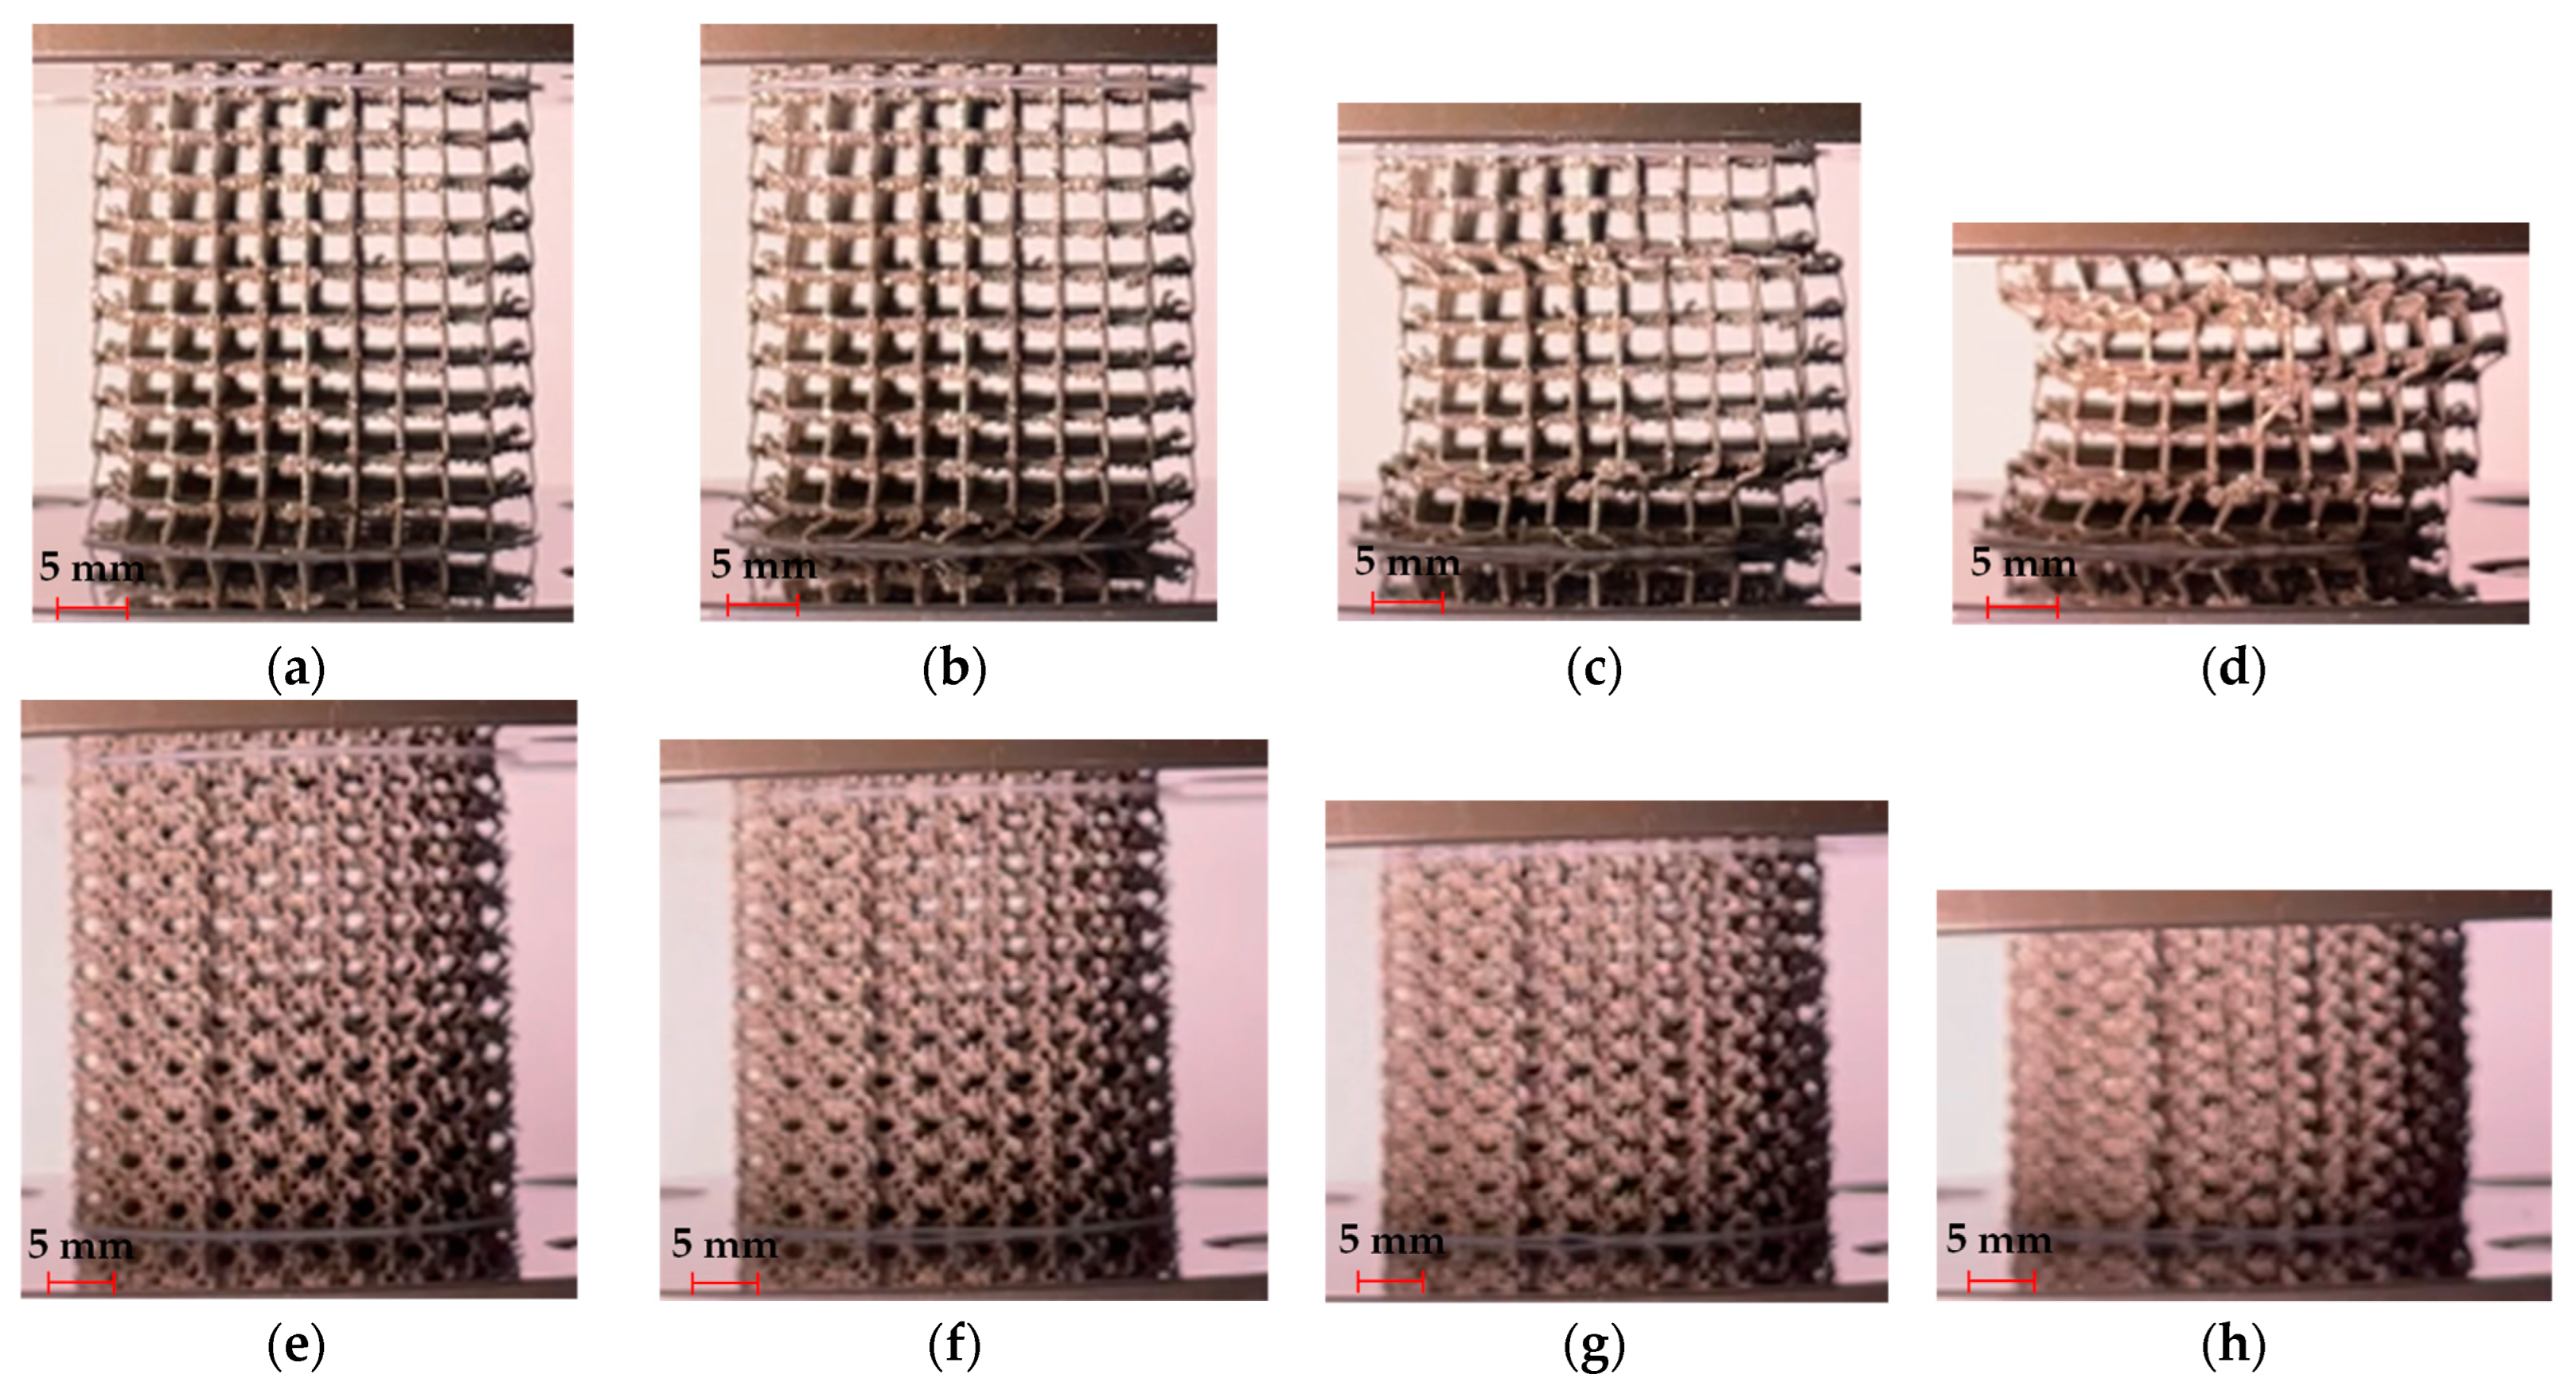
  • The increase in mass from the designed to the real specimen, resulting from manufacturing, significantly raises the yield stress and post-yield stresses but has a minimal effect on the Young’s modulus. Other geometrical imperfections also affect mechanical properties such as the tilt of the vertical bars in the C and TC structures, which promotes early buckling, thereby significantly reducing the yield stress.
  • Using disulphide molybdenum (MoS2) grease as the lubricant enabled a more direct comparison between the experimental and numerical results. Using a thin layer of Teflon as the lubricant for compressive tests is not the best option when a DIC system is not used to evaluate strains, as it can lead to underestimation of the Young’s modulus.
  • The C and TC geometries exhibited instability at design relative densities of 5%, and the RCO geometry could not be fabricated in this case. At a design relative density of 15%, instabilities persisted in the C and TC geometries. Consequently, cell types C, TC, and RCO are unsuitable for medical implant design.
  • The TO and RTCO geometries exhibited consistent and smooth deformation behaviour for all relative densities considered. These unit cells look promising for applications in the implant industry, particularly in functionally graded and/or biodegradable implants, due to their reliable mechanical behaviour.

Author Contributions

Conceptualization, M.F.V.; methodology, P.N., P.L., L.O., A.M.d.D., M.F.V. and M.B.S.; validation, P.N., J.P.G.M., A.M.d.D. and M.F.V.; investigation, P.N., P.L., L.O., J.L.A., J.P.G.M., A.M.d.D., M.F.V. and M.B.S.; writing—original draft preparation, P.N. and M.B.S.; writing—review and editing, P.N., J.P.G.M., A.M.d.D., M.F.V. and M.B.S.; supervision, A.M.d.D., M.F.V. and M.B.S.; funding acquisition, M.F.V. and J.L.A. All authors have read and agreed to the published version of the manuscript.

Funding

The authors acknowledge Fundação para a Ciência e a Tecnologia (FCT) for its financial support via the project PTDC/CTM-CTM/3354/2021 (DOI: 10.54499/PTDC/CTM-CTM/3354/2021), through IDMEC under LAETA Base Funding (DOI: 10.54499/UIDB/50022/2020), LAETA Programatic Funding (DOI: 10.54499/UIDP/50022/2020) and through CeFEMA project No. UIDB/04540/2020.

Data Availability Statement

The raw data supporting the conclusions of this article will be made available by the authors on request.

Conflicts of Interest

The authors declare no conflicts of interest.

References

  1. Benedetti, M.; Plessis, A.D.; Ritchie, R.O.; Dallago, M.; Razavi, S.M.J.; Berto, F. Architected cellular materials: A review on their mechanical properties towards fatigue-tolerant design and fabrication. Mater. Sci. Eng. R Rep. 2021, 144, 100606. [Google Scholar] [CrossRef]
  2. Salama, M.; Vaz, M.F.; Colaço, R.; Santos, C.; Carmezim, M. Biodegradable Iron and Porous Iron: Mechanical Properties, Degradation Behaviour, Manufacturing Routes and Biomedical Applications. J. Funct. Biomater. 2022, 13, 72. [Google Scholar] [CrossRef]
  3. Mahmoud, D.; Elbestawi, M. Lattice Structures and Functionally Graded Materials Applications in Additive Manufacturing of Orthopedic Implants: A Review. J. Manuf. Mater. Process. 2017, 1, 13. [Google Scholar] [CrossRef]
  4. Ahmadi, S.; Yavari, S.; Wauthle, R.; Pouran, B.; Schrooten, J.; Weinans, H.; Zadpoor, A. Additively Manufactured Open-Cell Porous Biomaterials Made from Six Different Space-Filling Unit Cells: The Mechanical and Morphological Properties. Materials 2015, 8, 1871–1896. [Google Scholar] [CrossRef]
  5. Kadkhodapour, J.; Montazerian, H.; Darabi, A.C.; Anaraki, A.P.; Ahmadi, S.M.; Zadpoor, A.A.; Schmauder, S. Failure mechanisms of additively manufactured porous biomaterials: Effects of porosity and type of unit cell. J. Mech. Behav. Biomed. Mater. 2015, 50, 180–191. [Google Scholar] [CrossRef]
  6. Li, G.; Wang, L.; Pan, W.; Yang, F.; Jiang, W.; Wu, X.; Kong, X.; Dai, K.; Hao, Y. In vitro and in vivo study of additive manufactured porous Ti6Al4V scaffolds for repairing bone defects. Sci. Rep. 2016, 6, 34072. [Google Scholar] [CrossRef]
  7. Li, Y.; Jahr, H.; Pavanram, P.; Bobbert, F.S.L.; Puggi, U.; Zhang, X.Y.; Pouran, B.; Leeflang, M.A.; Weinans, H.; Zhou, J.; et al. Additively manufactured functionally graded biodegradable porous iron. Acta Biomater. 2019, 96, 646–661. [Google Scholar] [CrossRef]
  8. Kladovasilakis, N.; Tsongas, K.; Tzetzis, D. Finite Element Analysis of Orthopedic Hip Implant with Functionally Graded Bioinspired Lattice Structures. Biomimetics 2020, 5, 44. [Google Scholar] [CrossRef]
  9. Shi, X.; Liao, W.; Liu, T.; Zhang, C.; Li, D.; Jiang, W.; Wang, C.; Ren, F. Design optimization of multimorphology surface-based lattice structures with density gradients. Int. J. Adv. Manuf. Technol. 2021, 117, 2013–2028. [Google Scholar] [CrossRef]
  10. Magarò, P.; Alaimo, G.; Carraturo, M.; Sgambitterra, E.; Maletta, C. A novel methodology for the prediction of the stress–strain response of laser powder bed fusion lattice structure based on a multi-scale approach. Mater. Sci. Eng. A 2023, 863, 144526. [Google Scholar] [CrossRef]
  11. Płatek, P.; Sienkiewicz, J.; Janiszewski, J.; Jiang, F. Investigations on Mechanical Properties of Lattice Structures with Different Values of Relative Density Made from 316L by Selective Laser Melting (SLM). Materials 2020, 13, 2204. [Google Scholar] [CrossRef] [PubMed]
  12. Cao, X.; Xiao, D.; Li, Y.; Wen, W.; Zhao, T.; Chen, Z.; Jiang, Y.; Fang, D. Dynamic compressive behavior of a modified additively manufactured rhombic dodecahedron 316L stainless steel lattice structure. Thin-Walled Struct. 2020, 148, 106586. [Google Scholar] [CrossRef]
  13. Liu, F.; Zhang, D.; Zhang, P.; Zhao, M.; Jafar, S. Mechanical Properties of Optimized Diamond Lattice Structure for Bone Scaffolds Fabricated via Selective Laser Melting. Materials 2018, 11, 374. [Google Scholar] [CrossRef] [PubMed]
  14. Jin, N.; Yan, Z.; Wang, Y.; Cheng, H.; Zhang, H. Effects of heat treatment on microstructure and mechanical properties of selective laser melted Ti-6Al-4V lattice materials. Int. J. Mech. Sci. 2021, 190, 106042. [Google Scholar] [CrossRef]
  15. Salama, M.C.; Alves, F.P.D.; Reis, L.; Deus, A.M.; Silva, M.B.; Santos, C.; Carmezim, M.J.; Vaz, M.F. Finite element simulations of mechanical behaviour and degradation of iron lattices. Proc. Inst. Mech. Eng. Part L J. Mater. Des. Appl. 2023, 237, 1379–1393. [Google Scholar] [CrossRef]
  16. Li, Y.; Jahr, H.; Lietaert, K.; Pavanram, P.; Yilmaz, A.; Fockaert, L.I.; Leeflang, M.A.; Pouran, B.; Gonzalez-Garcia, Y.; Weinans, H.; et al. Additively manufactured biodegradable porous iron. Acta Biomater. 2018, 77, 380–393. [Google Scholar] [CrossRef] [PubMed]
  17. Sharma, P.; Pandey, P.M. Corrosion behaviour of the porous iron scaffold in simulated body fluid for biodegradable implant application. Mater. Sci. Eng. C 2019, 99, 838–852. [Google Scholar] [CrossRef]
  18. Li, Y.; Pavanram, P.; Zhou, J.; Lietaert, K.; Taheri, P.; Li, W.; San, H.; Leeflang, M.A.; Mol, J.M.C.; Jahr, H.; et al. Additively manufactured biodegradable porous zinc. Acta Biomater. 2020, 101, 609–623. [Google Scholar] [CrossRef]
  19. Chen, Q.; Thouas, G.A. Metallic implant biomaterials. Mater. Sci. Eng. R Rep. 2015, 87, 1–57. [Google Scholar] [CrossRef]
  20. Dallago, M.; Winiarski, B.; Zanini, F.; Carmignato, S.; Benedetti, M. On the effect of geometrical imperfections and defects on the fatigue strength of cellular lattice structures additively manufactured via Selective Laser Melting. Int. J. Fatigue 2019, 124, 348–360. [Google Scholar] [CrossRef]
  21. Liu, L.; Kamm, P.; García-Moreno, F.; Banhart, J.; Pasini, D. Elastic and failure response of imperfect three-dimensional metallic lattices: The role of geometric defects induced by Selective Laser Melting. J. Mech. Phys. Solids 2017, 107, 160–184. [Google Scholar] [CrossRef]
  22. Bartolomeu, F.; Costa, M.M.; Alves, N.; Miranda, G.; Silva, F.S. Selective Laser Melting of Ti6Al4V sub-millimetric cellular structures: Prediction of dimensional deviations and mechanical performance. J. Mech. Behav. Biomed. Mater. 2021, 113, 104123. [Google Scholar] [CrossRef] [PubMed]
  23. Nazir, A.; Abate, K.M.; Kumar, A.; Jeng, J.Y. A state-of-the-art review on types, design, optimization, and additive manufacturing of cellular structures. Int. J. Adv. Manuf. Technol. 2019, 104, 3489–3510. [Google Scholar] [CrossRef]
  24. Nogueira, P.; Magrinho, J.P.G.; Silva, M.B.; de Deus, A.M.; Vaz, M.F. Compression properties of cellular iron lattice structures used to mimic bone characteristics. Proc. Inst. Mech. Eng. Part L J. Mater. Des. Appl. 2024. [Google Scholar] [CrossRef]
  25. Hedayati, R.; Sadighi, M.; Mohammadi-Aghdam, M.; Hosseini-Toudeshky, H. Comparison of elastic properties of open-cell metallic biomaterials with different unit cell types. J. Biomed. Mater. Res. Part B Appl. Biomater. 2018, 106, 386–398. [Google Scholar] [CrossRef] [PubMed]
  26. Bai, L.; Xu, Y.; Chen, X.; Xin, L.; Zhang, J.; Li, K.; Sun, Y. Improved mechanical properties and energy absorption of Ti6Al4V laser powder bed fusion lattice structures using curving lattice struts. Mater. Des. 2021, 211, 110140. [Google Scholar] [CrossRef]
  27. Babamiri, B.B.; Askari, H.; Hazeli, K. Deformation mechanisms and post-yielding behavior of additively manufactured lattice structures. Mater. Des. 2020, 188, 108443. [Google Scholar] [CrossRef]
  28. Liverani, E.; Fortunato, A. Stiffness prediction and deformation analysis of Cobalt-Chromium lattice structures: From periodic to functionally graded structures produced by additive manufacturing. J. Manuf. Process. 2021, 68, 104–114. [Google Scholar] [CrossRef]
  29. Ashby, M. The properties of foams and lattices. Philos. Trans. R. Soc. A Math. Phys. Eng. Sci. 2006, 364, 15–30. [Google Scholar] [CrossRef]
  30. Nogueira, P.; Castresana, K.; Magrinho, J.; Silva, M.B.; de Deus, A.M.; Vaz, M.F. Computational evaluation of the compressive properties of different lattice geometries to be used as temporary implants. Procedia Comput. Sci. 2023, 217, 928–937. [Google Scholar] [CrossRef]
  31. Nogueira, P.; Magrinho, J.P.G.; Silva, M.B.; de Deus, A.M.; Vaz, M.F. Graded Lattice Structures for Biodegradable Temporary Implants: Computational Evaluation with Two Unit Cell Types; Lecture Notes in Networks and Systems; Springer Nature: Cham, Switzerland, 2023; pp. 534–543. [Google Scholar] [CrossRef]
  32. ISO 13314; Mechanical Testing of Metals—Ductility Testing—Compression Test for Porous and Cellular Metals (ISO Standard No. 13314:2011(E)). International Organization for Standardization: Geneva, Switzerland, 2011; pp. 1–7. Available online: www.iso.org (accessed on 20 March 2024).
  33. ASTM F3184-16(2023); Standard Specification for Additive Manufacturing Stainless Steel Alloy (UNS S31603) with Powder Bed Fusion. ASTM: West Conshohocken, PA, USA, 2023. [CrossRef]
  34. Ran, Q.; Yang, W.; Hu, Y.; Shen, X.; Yu, Y.; Xiang, Y.; Cai, K. Osteogenesis of 3D printed porous Ti6Al4V implants with different pore sizes. J. Mech. Behav. Biomed. Mater. 2018, 84, 1–11. [Google Scholar] [CrossRef] [PubMed]
  35. ASTM E9-19; Standard Test Methods of Compression Testing of Metallic Materials at Room Temperature. ASTM: West Conshohocken, PA, USA, 2019. [CrossRef]
  36. Constantinou, M.C.; Caccese, J.; Harris, H.G. Frictional characteristics of Teflon–steel interfaces under dynamic conditions. Earthq. Eng. Struct. Dyn. 1987, 15, 751–759. [Google Scholar] [CrossRef]
  37. Rae, P.J.; Dattelbaum, D.M. The properties of poly(tetrafluoroethylene) (PTFE) in compression. Polymer 2004, 45, 7615–7625. [Google Scholar] [CrossRef]
  38. Vukkum, V.B.; Gupta, R.K. Review on corrosion performance of laser powder-bed fusion printed 316L stainless steel: Effect of processing parameters, manufacturing defects, post-processing, feedstock, and microstructure. Mater. Des. 2022, 221, 110874. [Google Scholar] [CrossRef]
  39. Choo, H.; Sham, K.-L.; Bohling, J.; Ngo, A.; Xiao, X.; Ren, Y.; Depond, P.J.; Matthews, M.J.; Garlea, E. Effect of laser power on defect, texture, and microstructure of a laser powder bed fusion processed 316L stainless steel. Mater. Des. 2019, 164, 107534. [Google Scholar] [CrossRef]
  40. Gibson, L.J.; Ashby, M.F. Cellular Solids: Structure and Properties, 2nd ed.; University of Michigan: Ann Arbor, MI, USA, 1989. [Google Scholar]
  41. Zadpoor, A.A. Additively manufactured porous metallic biomaterials. J. Mater. Chem. B 2019, 7, 4088–4117. [Google Scholar] [CrossRef]
  42. Li, S.J.; Xu, Q.S.; Wang, Z.; Hou, W.T.; Hao, Y.L.; Yang, R.; Murr, L.E. Influence of cell shape on mechanical properties of Ti-6Al-4V meshes fabricated by electron beam melting method. Acta Biomater. 2014, 10, 4537–4547. [Google Scholar] [CrossRef]
  43. Paiva, J.C.C.; Oliveira, L.; Vaz, M.F.; Costa-de-Oliveira, S. Biodegradable Bone Implants as a New Hope to Reduce Device-Associated Infections—A Systematic Review. Bioengineering 2022, 9, 409. [Google Scholar] [CrossRef]
  44. Sharma, P.; Jain, K.G.; Pandey, P.M.; Mohanty, S. In vitro degradation behaviour, cytocompatibility and hemocompatibility of topologically ordered porous iron scaffold prepared using 3D printing and pressureless microwave sintering. Mater. Sci. Eng. C 2020, 106, 110247. [Google Scholar] [CrossRef]
  45. Sharma, P.; Pandey, P.M. A novel manufacturing route for the fabrication of topologically-ordered open-cell porous iron scaffold. Mater. Lett. 2018, 222, 160–163. [Google Scholar] [CrossRef]
  46. Li, Y.; Lietaert, K.; Li, W.; Zhang, X.Y.; Leeflang, M.A.; Zhou, J.; Zadpoor, A.A. Corrosion fatigue behavior of additively manufactured biodegradable porous iron. Corros. Sci. 2019, 156, 106–116. [Google Scholar] [CrossRef]
  47. Putra, R.U.; Basri, H.; Prakoso, A.T.; Chandra, H.; Ammarullah, M.I.; Akbar, I.; Syahrom, A.; Kamarul, T. Level of Activity Changes Increases the Fatigue Life of the Porous Magnesium Scaffold, as Observed in Dynamic Immersion Tests, over Time. Sustainability 2023, 15, 823. [Google Scholar] [CrossRef]
  48. Li, Y.; Jahr, H.; Zhou, J.; Zadpoor, A.A. Additively manufactured biodegradable porous metals. Acta Biomater. 2020, 115, 29–50. [Google Scholar] [CrossRef]
  49. Carluccio, D.; Xu, C.; Venezuela, J.; Cao, Y.; Kent, D.; Bermingham, M.; Demir, A.G.; Previtali, B.; Ye, Q.; Dargusch, M. Additively manufactured iron-manganese for biodegradable porous load-bearing bone scaffold applications. Acta Biomater. 2020, 103, 346–360. [Google Scholar] [CrossRef]
  50. Fatima, M.; Canhao, H.; Eurico, J. Bone: A Composite Natural Material. In Advances in Composite Materials—Analysis of Natural and Man-Made Materials; InTech: London, UK, 2011. [Google Scholar] [CrossRef]
  51. Linde, F.; Gothgen, C.B.; Hvid, I.; Pongsoipetch, B. Mechanical properties of trabecular bone by a non-destructive compression testing approach. Eng. Med. 1988, 17, 23–29. [Google Scholar] [CrossRef]
  52. McCalden, R.W.; McGlough, J.A.; Barker, M.B.; Court-Brown, C.M. Age-related changes in the tensile properties of cortical bone. The relative importance of changes in porosity, mineralization and microstructure. J. Bone Jt. Surg. Ser. A 1993, 75, 1193–1205. [Google Scholar] [CrossRef]
  53. Öhman, C.; Baleani, M.; Pani, C.; Taddei, F.; Alberghini, M.; Viceconti, M.; Manfrini, M. Compressive behaviour of child and adult cortical bone. Bone 2011, 49, 769–776. [Google Scholar] [CrossRef]
  54. Røhl, L.; Larsen, E.; Linde, F.; Odgaard, A.; Jørgensen, J. Tensile and compressive properties of cancellous bone. J. Biomech. 1991, 24, 1143–1149. [Google Scholar] [CrossRef]
  55. Shi, W.; Liu, B.; Li, J.; Han, Y.; Zhang, Y.; Guo, B.; Lin, Y. Mechanical Properties Evaluation Based on the Variable Gradient of Body-Centered-Cubic-Based Lattice Structure Prepared by Laser Powder Bed Fusion. J. Mater. Eng. Perform. 2024. [Google Scholar] [CrossRef]
  56. Saleh, B.; Jiang, J.; Fathi, R.; Al-hababi, T.; Xu, Q.; Wang, L.; Song, D.; Ma, A. 30 Years of functionally graded materials: An overview of manufacturing methods, Applications and Future Challenges. Compos. Part B Eng. 2020, 201, 108376. [Google Scholar] [CrossRef]
Figure 1. Geometry of each cell type: (a) Cubic, (b) Rhombicuboctahedron, (c) Truncated Cubic, (d) Rhombitruncated Cuboctahedron, and (e) Truncated Octahedron. t—strut thickness (indicated with black arrows).
Metals 14 00780 g001
Figure 2. Specimen made of RTCO unit cells with a relative density of 15%. (a) Top view; (b) side view.
Metals 14 00780 g002
Figure 3. Designed geometry overlayed on the manufactured geometry detailing overhanging defects.
Metals 14 00780 g003
Figure 4. Finite element model of RTCO-15%-Teflon: von Mises stress distribution ( M P a ).
Metals 14 00780 g004
Figure 5. Manufactured specimens. The figure shows an example for each cell type and relative density.
Metals 14 00780 g005
Figure 6. Defects in the specimens: (a) C-15% (exp.), (b) TC-17% (exp.), (c) RCO-15% (exp.), (d) RTCO-15%_P1 (exp.), and (e) TO-15%_P2 (exp.). Examples of overhanging are highlighted in red, and examples of tilting are highlighted in blue.
Metals 14 00780 g006
Figure 7. Comparison between finite element analysis and experimental results for: (a) C unit cells, (b) RTCO unit cells with a relative density of 15%, and (c) RTCO unit cells with a relative density of 45%.
Metals 14 00780 g007
Figure 8. Experimental and computational stress–strain curves of the bulk specimen.
Metals 14 00780 g008
Figure 9. Experimental stress–strain curves for specimens with designed relative densities of 5% (a,b), 15% (c,d), and 45% (e,f).
Metals 14 00780 g009
Figure 10. Deformation during uniaxial compression for specimens (ad) C-5% (exp.) and (eh) RTCO-5% (exp.).
Metals 14 00780 g010
Table 1. Theoretical relative density, real (measured) relative density, and mass increment for each experimental specimen. (Experimental values exhibit a deviation less than 1% in relation to average values).
SpecimenTheoretical Strut Thickness (mm)Theoretical Relative Density (%)Real Relative Density (%)Mass Increment (%)
C-5%0.2457.957.8
C-15%0.431519.228.0
C-45%0.824549.49.8
RCO-15%0.281524.362.0
RCO-45%0.644559.532.1
RTCO-5%0.16511.6132.6
RTCO-15%_P10.291523.858.7
RTCO-15%_P20.291523.254.7
RTCO-15%_P30.291522.549.8
RTCO-45%_P10.624553.518.8
RTCO-45%_P20.624552.817.3
TC-5%0.2059.182.0
TC-17%0.351720.218.7
TC-45%0.734548.37.3
TO-5%0.2059.794.6
TO-15%_P10.381522.650.7
TO-15%_P20.381521.543.5
TO-15%_P30.381522.147.6
TO-45%0.914553.418.6
Table 2. Young’s modulus and yield stress for the experimental and computational specimens.
Experimental SpecimenYoung’s Modulus ( G P a ) Yield Stress ( M P a ) Computational ModelYoung’s Modulus ( G P a ) Yield Stress ( M P a )
C-5%0.4034.7C-15%-MoS211.37529.1
C-15%2.64522.9C-19.2%-MoS212.03029.6
C-45%13.958109.1C-15%-Teflon2.92129.8
RCO-15%1.59128.6C-19.2%-Teflon3.11330.5
RCO-45%10.426125.9
RTCO-5%0.1662.5
RTCO-15%_P11.43419.8RTCO-15%-MoS22.77716.4
RTCO-15%_P21.50119.4RTCO-15%-Teflon1.50716.9
RTCO-15%_P31.63421.3
RTCO-45%_P18.548128.5
RTCO-45%_P219.552119.5RTCO-45%-MoS224.634107.8
TC-5%0.4304.7
TC-17%3.02419.0
TC-45%12.015111.3
TO-5%0.2983.6
TO-15%_P11.44223.3
TO-15%_P21.38018.7
TO-15%_P31.16615.2
TO-45%10.986130.7
Disclaimer/Publisher’s Note: The statements, opinions and data contained in all publications are solely those of the individual author(s) and contributor(s) and not of MDPI and/or the editor(s). MDPI and/or the editor(s) disclaim responsibility for any injury to people or property resulting from any ideas, methods, instructions or products referred to in the content.

