Abstract
The competitiveness in the construction industry is leading companies to implement the Lean philosophy to improve project management and prepare to begin the adoption of Construction 4.0. However, this implementation generates several barriers, depending on the type of company and the country where it is implemented. For this reason, the following research aims to identify the barriers generated in implementing the Lean philosophy in Peru and SMEs. The following study began with a literature review, followed by a questionnaire, which six Lean experts evaluated. Then, 127 Peruvian professionals answered the survey, and the data were analyzed with RII and Exploratory Factor Analysis. As a result, the barriers to Lean Construction were grouped into four groups to analyze their impact on the industry: collaboration, education and implementation, organizational vision and system; Lean theory and philosophy; and Lean tools, coordination, and information flow. Barriers were also analyzed by project type, stage, and organization size to conclude that implementation barriers are directly related to company size. Finally, the obtained barriers are discussed, and Construction 4.0 is proposed to reduce their impact on construction projects. These results can be helpful for implementers to plan strategies, improve knowledge about Lean Construction implementation, and adopt new techniques that could help improve the construction industry’s productivity.
1. Introduction
The construction industry has lower productivity than other industries, such as manufacturing [1]. The temporality of projects, uniqueness of production, and the complex communication between the actors do not allow control over production, high rates of variability, unsatisfied customers, and waste of resources (workforce, activities, time, and money), resulting in projects with cost overruns and delays [2]. Lean Construction (LC) started its diffusion as a viable solution to the problems, achieving until today its implementation in building projects, road infrastructure, sanitary, mining, industrial plants, and energy and oil project [3].
Lean Construction applies the principles and tools of the Lean philosophy during the entire project lifecycle, from conception, execution, and commissioning [4]. Lean focuses on people as the main actor to improve the organization’s management [2]. In addition, Lean encourages teamwork, improves communication, helps people focus on the value activities of the external and internal customer, knows the entire production flow, and identifies errors in the early stages [5]. As a result, Lean Construction has shown benefits of improving the project’s overall productivity, reducing accidents, avoiding rework, satisfactory results for the customer, anticipating conflicts between project participants, and achieving project execution at the estimated cost and time [6].
The implementation of LC in projects is not simple. LC is not a set of tools or recipes; on the contrary, it is a construction management approach. LC implementation requires focusing on many factors. In addition, all organizations have multiple subcultures that generate a variety of conflicts of interest [7,8,9]. Moreover, integrating multiple cultures creates impressions among teams of activity overload, psychological fatigue, and increased resources to meet project goals [10]. These factors are known as barriers, resulting in the spread of lean with negative results and increased waste in different project stages [11].
Barriers to LC implementation are related to geographic factors of similar economic and cultural contexts [12,13,14]. These factors are common in most Latin American countries, with the limited implementation of LC in the private sector [15]. The need to implement LC in all sectors, with innovations in design, construction, technology, and materials, could help to efficiently optimize the use of resources (economic, materials, and others) to reduce the infrastructure gaps in about 42 million families [16].
Peru has not had a study identifying the main barriers professionals face. This problem generates concern because of the lack of a priori knowledge of the challenges that will be faced. Therefore, during the implementation, it generates excessive effort in the team, or they desist from using it in the project. Furthermore, Murguia [17] mentions that the company’s size determines Lean implementation because it influences communication, complexity, maturity, and coordination effort. Therefore, this study aims to identify the main barriers to Lean implementation perceived by LC practitioners in Peru and to group them by company size. It performs a relationship and correlation analysis to find the most relevant factors for implementation.
SMEs are the companies that predominate in quantity and are the backbone of economic agility and job creation in any country [18]. SMEs are motivated by the positive benefits achieved by large organizations and adopt the lean philosophy [19,20,21]. In addition, SMEs are directly related to each other; e.g., small companies are active participants as subcontractors of medium and large companies [22]. However, the low Lean competence of small companies does not allow them to collaborate with large companies to transfer value directly to the customer (due to their agility in decision-making and direct dealings with the customer). Moreover, small companies can maintain competitiveness and adapt quickly to the strategies of large organizations [20,23]. For example, the investment of resources in implementation is a determining factor for decision-making in small companies and, to a lesser degree, in medium and large companies [11]. In addition, the maturity of LC implementation is different by the size of the organization; medium and large companies have more significant benefits in the long term by attracting talent, capabilities to negotiate with multiple suppliers, subcontractors, and rethinking strategies [24]. For the adoption of Lean in SMEs to be successful, it is necessary to manage implementation barriers, develop strategies to reduce their impact, and anticipate problems [11,25].
2. Literature Review
Increasing productivity in products or services through investment focused on technology has given good results in manufacturing, which is why gradually, it has been seeking to implement technology in the construction sector through the implementation of Construction 4.0 [26,27] and Lean Construction 4.0 [28]. However, the construction industry has temporary projects that do not justify personnel training and research in the long term [29]. Therefore, organizations have started to use Lean tools in specific projects [30]; some are successful, others do not obtain the expected results, and they return to traditional management systems [30]. Ballard et al. [31] suggest starting implementation by motivating project leaders, training all project members, implementing tools to form habits, forming a culture over time, and moving on to using the Lean philosophy for continuous improvement. Salvatierra et al. [32] suggested that it is necessary to maintain a balance between tools, culture, and philosophy, to maintain good Lean practices in the long term.
Organizations that implement Lean in their projects have challenges in adopting the philosophy of their workers, processes, and management. For example, in the United States, there are challenges with low commitment from top management, low awareness of Lean practices, and poor communication between teams to share information [12]. On the other hand, the United Kingdom has the barriers of lack of knowledge of Lean by professionals, resistance to change, and difficulty in adopting the Lean culture [33]. In Colombia, there are barriers such as the perception of uncertainty to obtain positive results, the transparency of information between teams, and state laws that do not allow flexibility for Lean projects [34,35]. Finally, in Chile, the challenge is distributing information at all levels and implementing the project in the long term [36].
2.1. Global Barriers to LC Implementation
Lean Construction has been implemented in more than 48 countries for more than 20 years, and its evolution has been recorded in more than 1382 research papers [37]. Moreover, most publications are reported from the United States and Europe; however, the Lean system has spread and has a growing adoption in countries such as Brazil, Chile, and Peru. However, many organizations report that they cannot achieve the maximum benefit from the Lean philosophy due to multiple factors [30]. Globally, among the countries that have implemented Lean in construction, 110 barriers were identified, which are grouped into three categories: people (29%), including education, management, operation, and culture; production process (20%) focused on customer identification, management, planning and control; production management and logistics processes (51%) involving governance, long-term business philosophy, processes and system [13]. In the USA, it was identified that the main barrier is in people, especially in their educational and leadership training [12], as well as the scarce standardization of knowledge and Lean concepts, which do not agree among experts, creating learning complexity in beginner practitioners. Colombia has barriers such as resistance to change, high implementation costs, and information transparency manipulation [35,36]. Chile showed that the lack of support from top management and vertical information, which does not reach all levels of the organization, delays decision-making in implementation [38].
Moreover, short-term thinking does not allow solving problems entirely, creating vicious circles that repeat the same [32]. In Peru, the most relevant barriers are the lack of State policies to involve its institutions in Lean projects, the low collaboration between academia and industry, and a perceived high cost of implementation [39]. In addition, resistance to change [40] and problems in the construction stage are carried over from the design stage, making little or no improvement in the construction stage, affecting the degree of customer satisfaction, cost overruns, rework, and project stoppages [41].
2.2. Local Implementation Barriers
Barriers to Lean implementation have varied according to each country’s socio-cultural conditions and technical capabilities [30]. Therefore, it was necessary to align the barriers from the literature and add the barriers perceived by the experts throughout their implementation experiences and to have a complete information base of the study phenomenon. The diversity of the experts in building projects (educational institutions, shopping malls, multi-family buildings, among others), infrastructure (road works, sanitation, railroads), energy, oil, industrial plants, and mining allowed adjusting the questionnaire to meet the objectives.
Most of the researchers and implementers evidenced that the main barrier to Lean is short-term thinking, so the good practices developed in the project are not managed to improve the next project [42]. The study focused on an exploratory study using Exploratory Factor Analysis, and to cover the study phenomenon; it was chosen to group the barriers in the sustainability model of Lean practices of the GEPUC triangle [32]. The GEPUC triangle is composed of culture, tools, and philosophy; the weakness of any of them leads to the implementation not obtaining the maximum benefit or falling over time. The expert interview and literature review could help adapt the barriers to the study phenomenon and achieve the study’s objectives. In addition, the grouping in the GEPUC triangle could help to organize and maintain the balance between the barriers.
3. Research Methodology
The methodology of the study is shown in Figure 1. It includes the three stages, the tools used, and the activities of each process to achieve the study’s objectives. The present study starts with a literature review followed by a valid survey design through semi-structured interviews with six Peruvian experts. The survey was designed with closed and semi-open questions, using the mixed method to understand the study phenomenon better. The figure below shows the process followed in the research.
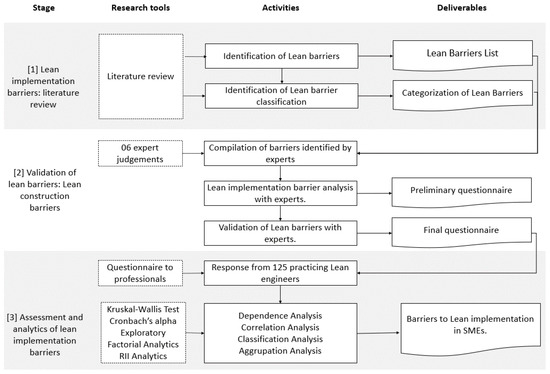
Figure 1.
Research Methodology.
Through a literature review, the first stage identified the main barriers to implementation that the professionals have evidenced and obtained a list. Then, the best way to classify the barriers was reviewed, concluding by grouping them into three groups philosophy, tools, and Lean culture. On the other hand, implementation models were reviewed to be able to relate the barriers to the steps or raise barriers. Finally, libraries of Scopus, Web of Science, Google Scholar, International Group for Lean Construction (IGLC), ASCE, Lean Construction Journal, and the central repository of theses of Peru were consulted; comprised between the years 2000 to 2020, with keywords such as “Lean Implementation”, “Lean challenges”, “Lean barriers”, and “Lean Construction”.
In the second stage, researchers selected six experts from ten candidates with the following characteristics: (a) more than 12 years of experience as a Lean implementation leader and (b) experience in project diversity, university teaching, research, and Lean consultants. The general information of the experts is shown in Table 1. The general information of the experts is shown in Table 1.

Table 1.
Information from lean experts.
The questionnaire was evaluated and guaranteed with the opinion of six experts, who, based on their experience, suggested adding the barriers of: “Low capacity of people to identify waste” and “Lack of leadership and empowerment of people”, which were searched in the literature, finding similarities in manufacturing. The questionnaire underwent three reviews by six experts, all with clear objectives and aligned to the study.
3.1. Research Design and Data Collection
The mixed method was used to take a holistic “snapshot” of the study phenomenon [43], simultaneously integrating qualitative and quantitative questions. The mixed method allows obtaining a wider range of perspectives of the problem in terms of frequency, generality, complexity, magnitude, and understanding. Quantitative to identify the company’s size, years of experience, and frequency of use of good practices. Qualitative to describe their experiences, personal difficulties, or particular experiences. Integrating both methods allowed the questionnaire to be improved by the experts. After the pilot plan, new questions were identified and readjusted thanks to the corroboration of qualitative and quantitative data.
The survey followed a cross-sectional process to obtain the most significant amount of data and ease of remote response. The questionnaire had 40 open-ended and closed-ended questions. The barriers were evaluated with a Likert scale from 1 to 5 points, asking the respondents to assess which variables they most frequently experienced in their project and were evaluated as “Never = 1, Rarely = 2, Occasionally = 3, Frequently = 4, and very frequently = 5”.
In addition, the questions of the questionnaire were changed to positive or neutral syntax, with the objective of not influencing the answers or sympathizing [44], avoiding having answers directed to the aim of the study. For example: what is the frequency you experience your team’s reflections of the activities performed and suggestions for good practices? The respondent can choose to rate on a scale of 1 to 5. Therefore, the higher frequency of use is a common practice among professionals, and the lower use of practices causes barriers that prevent the development of the implementation.
The questionnaire was disseminated in Spanish through emails, social networks, and professional networks. Peruvian lean dissemination organizations and LC practitioner companies were invited to participate in the study. The survey was distributed virtually through Microsoft Forms. The evaluation survey can be found in supplemental material.
3.2. Population and Sample
The Last Planner System (LPS) is the commitment and variability control system for excellence [45]. Starting the implementation with LPS allows the control of setbacks and uncertainties, self-criticizing and enabling team members to identify problems and propose improvements [46,47]. Based on the premise, the study population was limited to all Peruvian professionals with more than two years of experience implementing LPS or participating in projects managed with LPS. The Peruvian Chapter of Lean Construction (LCI Peru) registers as of January 2021, a number of 1360 professionals registered and certified in its Lean Construction training program, which is composed of one year of theoretical training and requires the application of LPS for at least one project, which supports the certification and the ability to implement Lean Construction in more than 2 years.
In addition, the study used non-probabilistic and snowball sampling [48] to obtain as much data as possible under the conditions of the objectives of the study. The survey was disseminated from 18 february 2021 to 24 april 2021. A total of 127 professionals responded to the survey, and data from 125 professionals were used for the statistical analysis of the study. Unfortunately, one was discarded for not completing the questionnaire and the other for presenting strange variations in the correlation. The general data are shown in Table 2.
Table 2.
Demographic profile of the interviewed.
3.3. Validity Test and Data Analysis
The reliability of the data was determined by Cronbach’s coefficient (α), whose values higher than 0.7 represent data with homogeneous distribution; therefore, they are reliable and solid data for the research [48].
The Exploratory Factor Analysis is composed of three main stages: (a) Assessment of the suitability of data for use in the EFA, the Kaiser–Maier–Olkin (KMO) measure, and Bartlett’s test of sphericity were used to check the adequacy of the sample and the correlation between variables to test the adequacy of the sample and the correlation between variables. KMO values greater than 0.5 were accepted to perform EFA with data between 100 and 200. In order to reject the null hypothesis of Bartlett’s test and show that the data are highly correlated, the matrix determinant is required to be less than 0.001 and have a significance of less than 0.05 [49,50,51]. (b) For extraction of factors or grouping of variables, Principal Component Analysis (PCA) generates a common grouping of data “commonality”, whose commonality is accepted as EFA factors to maintain the greatest amount of information according to the objectives of the study, as well as to reduce the components as necessary [49,50,52]. (c) For rotation and interpretation of the grouping of variables, the orthogonal rotation Vari-max was used, which allows for a better and simple interpretation of the data; in addition, it allows to reduce the number of variables that have a high weight load in the factors, a recommended load is of 0.4 [52,53].
The data analysis was conducted with the statistical package for social sciences (SPSS) v25.0, reliability analysis, descriptive statistics, and Kruskal–Wallis tests (H) to differentiate the barriers by study groups. The Kruskal–Wallis test is a rank-based test for non-parametric variables, i.e., to compare more than two independent samples. The analysis starts with the hypothesis that the variables come from the same sample. If the Kruskal–Wallis statistic is significant (p ≤ 0.05), the non-parametric multiple comparison tests indicate that the initial hypothesis is accepted; otherwise, it is assumed that the variables have independent provenances [54].
In addition, Microsoft Excel was used for the Relative Importance Index (RII) analysis to discuss priority barriers according to the segmented groups. RII allows the analysis to distribute the variance explained among multiple predictors to better understand the role played by each of them in a regression equation [55].
where w is the frequency given to each factor by respondents (1 to 5); A is the highest frequency of each factor, 5 in this example; and N is the total number of respondents, 125 in this example.
4. Results
The literature review resulted in a list of lean implementation barriers, as shown in Table 3.
Table 3.
List of lean implementation barriers.
Table 4 shows the most relevant data from the semi-structured interviews with the experts. The interviews were semi-structured, opting for open and semi-open questions to obtain qualitative data and the most significant amount of information. In addition, the study phenomenon is relatively new in the country, so it is required to have a complete picture of the phenomenon [44].
Table 4.
Results of interviews with experts.
4.1. Descriptive Analysis of the Barriers in SMEs
The reliability of the data is α = 0.924, which allowed the following analyses to be performed. Table 5 shows the barriers to implementation in SMEs and is ranked according to the results of the RII. The CEI1 barrier “lack of collaborative work between academia and industry” has a more significant impact on SMEs compared to large companies; SMEs do not create links with academia; the reason is that they are focused on their processes and perceive these relationships as over costs. In addition, the projects they present are very temporary and have low investment, so they require high agility without losing resources [20].
Table 5.
Barrier impact by project stage, type of project, and company size. Data sorted by RII.
The TFL1 barrier, “low knowledge in professionals”, has a significant impact on SMEs, i.e., the academy does not meet the competencies required by the companies to implement LC in their projects, and therefore, they have a long learning process in the members of their projects [78]. The large company has developed academies in its organization with customized knowledge, reducing the impact of this barrier [79].
From the table above, we can indicate that SMEs have three high-impact barriers, such as “Lack of collaborative work between academia and the construction industry” (CEI1), “Low knowledge in Lean in professionals graduated from the university” (TLF1), and “Lack of commitment of top management with the implementation” (CEI3) and are forcing the slow progress of Lean implementation in organizations.
4.2. Difference in the Evaluation of the Barriers
The Kruskal–Wallis test analysis was performed on the barriers to lean implementation grouped into (a) project stages (design, construction, and operation), (b) project types (buildings, infrastructure, energy, and mining), and (c) by company size.
The results and analysis of the Kruskal–Wallis tests determine that the barriers to implementation in the stages and types of projects are similar; therefore, their study is not significant. On the other hand, the result of the Kruskal–Wallis test of the SME groups and large companies had 76% of different barriers, with independent impacts and difficulties. Therefore, the study focuses on the barriers to lean implementation by company size, similar to other studies [18,22,80].
For the exploratory factor analysis (EFA), the KMO was greater than 0.5, and Bartlett’s sphericity or correlation matrix was not an identity matrix (approx. Chi-square = 2755.743, p-value = 0.000). Therefore, the researchers can say that factor analysis is useful with these data, and the sample is adequate for analysis and representation. By using a loading of 0.4 and a Varimax rotation, the results of the EFA analysis showed that the barriers could be classified into four factors, as shown in Table 6.
Table 6.
Exploratory factor analysis-rotated factor matrix for SMEs lean implementation barriers.
5. Discussion
The group of barriers “collaboration, education, and implementation” is perceived with more impact in large companies; respondents argue that it is because of the large number of people to train, adapting the areas of logistics, administration, resources, and others. In addition, the excessive effort to control many processes and people; in addition, it requires investment for massive training and multiple professionals with knowledge in Lean. On the other hand, the SMEs can start the implementation by hiring people with expertise in Lean and perform other functions simultaneously, which does not take them many resources. They have the facility to manage small groups of people. Similar results were obtained in [81] From the point of view of Construction 4.0, the use of BIM and Artificial Intelligence [82] and Cloud Computing [83] can help us to improve the identification of waste and mitigate the barrier CEI10. Moreover, to promote greater collaboration and communication among project stakeholders, Construction 4.0 components such as BIM [82,84] and social media [85,86] reduce the impact of the barrier CEI9. In addition, the use of IoT (Internet of Things) [87], artificial intelligence [88], and data analysis [89,90] help us to improve lean planning in construction projects and hence mitigate the impact of the barrier CEI5.
The group of barriers to “organizational vision and system” is closely related to the lack of knowledge on the part of the clients, the permanence of the people during the implementation, and the company’s offer. SMEs compete for the new market, reach directly to the customer and try to offer Lean-based services. However, customers are unaware of the lean philosophy and subcontractors and suppliers. SMEs significantly impact their barrier due to the high level of informality in their projects [91] and the hiring of professionals with low knowledge of Lean. As a result, they perceive the industry as non-productive [92,93]. In addition, large companies work with large investment projects; these projects are awarded in most cases by the government. However, the government has institutions that do not require the use of Lean. Likewise, when large companies use Lean, they cannot integrate state agencies due to their low knowledge, little knowledge of the project’s value, and a low response to the acceptance of decisions [65]. Regarding this group of barriers, Construction 4.0 proposed the use of BIM [84] and augmented reality [94] to improve scope definition, customer value, and information sharing, thereby reducing the presence of VOS 1 and VOS 3 barriers. In addition, elements such as ECD (Common Data Environment) [84,95,96,97], cloud [83,84,98], data sharing [84,99], and social media [84,86,100] will help us to improve information sharing between teams, suppliers, and subcontractors, decrease fragmentation in the construction industry, helping the organization to combat the barrier VOS 3.
The group of barriers “Lean theory and philosophy” refers to the learning process of Lean, which should be formed from the university stage [101] and requires that leaders support the implementation by motivating the team, sustaining the practices, and supporting their learning [102]. It seems contradictory that SMEs have a more significant impact on these barriers concerning large companies, despite having few workers, and it should be easy to train, monitor performance, progress the team, and implement. However, the cause is that SMEs execute short-duration small projects with very temporary workers. Construction 4.0 can help us reduce this group’s barriers by transferring knowledge using cloud computing [97].
The group of barriers “Lean tools, coordination, and information flow”, SMEs tend to hide information to evade taxes and not abide by labor laws; this is a factor that overflows and affects professionals, obtaining a work culture of distrust between themselves and the other actors of the project. In addition, if the work team does not record data of problems and the best solution, they do not take advantage of solutions to similar problems and therefore do not have data support to select the right tool [103]. Likewise, the SME’S projects that are in progress do not have time to plan, coordinate and train the work teams; therefore, it requires quick actions of key tools of simple understanding for people. However, the teams are more focused on putting out fires, and the implementer has a false perception of low experience and knowledge.
6. Conclusions
The barriers of “lack of collaborative work between academia and the construction industry”, “high cost of implementation”, and “contracts do not require the use of Lean” are of direct impact on the implementation of Lean. Moreover, actions are required with solutions to improve the productivity of construction in general according to the size of the companies. Most studies explored barriers to LC implementation in large organizations. However, small and medium-sized companies are part of the world’s economic engine, and their distinctive characteristics cause different impacts on LC implementation barriers.
Before the study, there was only evidence of barriers focused on Lean tools and no analysis of the type of companies. However, the study showed that the impact of Lean barriers in Peru is focused on the size of organizations. Moreover, this may help educators, implementers, and researchers to focus on adapting Lean thinking to the size of their organization, leaving aside the type of project (buildings, infrastructure, etc.) and the stages of the project (design, construction, operation, etc.). In addition, it is recommended that educators link curricula to the demands of companies and that companies invest in funded research to address the problems in their projects. Moreover, many professionals select incorrect tools when faced with a problem or otherwise work with Lean tools but are unaware of the theoretical underpinnings and are unable to obtain the full potential of Lean.
Finally, the study is biased toward the snowball sampling model, where the sample was selected conveniently to obtain results related to the study’s objectives. Reducing the impact of barriers on LC implementers can help facilitators take precautions and rethink their implementation strategies. Moreover, for future research, consider strategies to reduce the impact of lean barriers, and create a roadmap. The roadmap must incorporate the lean principles, implementation barriers, construction 4.0, and lean maturity models; verify the implementation barriers through a lean maturity assessment in the organizations to corroborate the responses of the interviewees; and finally, perform a validation of the grouping of barriers through lean principles.
Supplementary Materials
The following supporting information can be downloaded at: https://www.mdpi.com/article/10.3390/buildings12101637/s1, Evaluation Survey.
Author Contributions
Conceptualization, C.H.-O. and A.A.E.-R.; Formal analysis, C.H.-O.; Methodology, A.A.E.-R. and R.F.H.; Supervision, R.F.H.; Writing—original draft, C.H.-O. and A.A.E.-R.; Writing—review & editing, R.F.H.. All authors have read and agreed to the published version of the manuscript.
Funding
This research received no external funding.
Institutional Review Board Statement
Not applicable.
Informed Consent Statement
Informed consent was obtained from all subjects involved in the study.
Data Availability Statement
The data presented in this study are available on request from the corresponding author. The data are not publicly available due to privacy.
Conflicts of Interest
The authors declare no conflict of interest.
References
- Woetzel, J.; Mischke, J.; Barbosa, F.; Sridhar, M.; Ribeirinho, M.J.; Parsons, M.; Bertram, N.; Brown, S. Reinventing Construction: A Route to Higher Productivity; McKinsey Global Institute: London, UK, 2017. [Google Scholar]
- Seed, W. Transforming Design and Construction: A Framework for Change, 1st ed.; Lean Construction Institute, Ed.; Lean Construction Institute: Arlington, VA, USA, 2017. [Google Scholar]
- Erazo-Rondinel, A.A.; Huaman-Orosco, C. Exploratory Study of the Main Lean Tools in Construction Proojects in Peru. In Proceedings of the 29th Annual Conference of the International Group for Lean Construction (IGLC), Lima, Peru, 14–17 July 2021. [Google Scholar]
- Koskela, L. Application of the New Production Philosophy to Construction; Stanford University: Stanford, CA, USA, 1992; Volume 72. [Google Scholar]
- Modig, N.; Ahlstrom, P. This Is Lean; Morrison, J., Ed.; Rheologica Publishing: Bach, Switzerland, 2013; Volume 1. [Google Scholar]
- McGraw Hill Construction Research y Analytics. Lean Construction Leveraging Collaboration and Advanced Practices to Increase Project Efficiency; Hill, M., Ed.; Dassault Systèmes: Vélizy-Villacoublay, France, 2013; Volume 3. [Google Scholar]
- Salonitis, K.; Tsinopoulos, C. Drivers and Barriers of Lean Implementation in the Greek Manufacturing Sector. Procedia CIRP 2016, 57, 189–194. [Google Scholar] [CrossRef]
- Liker, J. The Toyota Way:14 Management Principles from the World’s Greatest Manufacturer; McGraw Hill: New York, NY, USA, 2004; Volume 1, ISBN 0070587477. [Google Scholar]
- Kumar, A.R.; Subramanian, A.; Ware, B.F.; Fernandez, J.E. Lean Tools and Their Applications in an HPI Endeavor. In Proceedings of the 1st Annual World Conference of the Society for Industrial and Systems Engineering, Washington, DC, USA, 16–18 September 2012. [Google Scholar]
- Rane, A.B.; Sunnapwar, V.K.; Rane, S. Strategies to Overcome the HR Barriers in Successful Lean Implementation. Int. J. Procure. Manag. 2016, 9, 223. [Google Scholar] [CrossRef]
- Bhasin, S. Prominent Obstacles to Lean. Int. J. Product. Perform. Manag. 2012, 61, 403–425. [Google Scholar] [CrossRef]
- Demirkesen, S.; Wachter, N.; Oprach, S.; Haghsheno, S. Identifying Barriers in Lean Implementation in the Construction Industry. In Proceedings of the 27th Annual Conference of the International Group for Lean Construction (IGLC), Dublin, Ireland, 3–5 July 2019; Volume 3. [Google Scholar]
- Cano, S.; Delgado, J.; Botero, L.; Rubiano, O. Barriers and Success Factors in Lean Construction Implementation Survey in Pilot Contex. In Proceedings of the 23rd Annual Conference of the International Group for Lean Construction (IGLC), Perth, Australia, 29–31 July 2015. [Google Scholar]
- Li, S.; Wu, X.; Zhou, Y.; Liu, X. A Study on the Evaluation of Implementation Level of Lean Construction in Two Chinese Firms. Renew. Sustain. Energy Rev. 2017, 71, 846–851. [Google Scholar] [CrossRef]
- Martinez, E.; Reid, C.K.; Tommelein, I.D. Lean Construction for Affordable Housing: A Case Study in Latin America. Constr. Innov. 2019, 19, 570–593. [Google Scholar] [CrossRef]
- Bouillon, C.P. Room for Development; Bouillon, C.P., Ed.; Palgrave Macmillan US: New York, NY, USA, 2012; ISBN 978-1-137-00563-2. [Google Scholar]
- Murguia, D. Factors Influencing the Use of Last Planner System Methods: An Empirical Study in Peru. In Proceedings of the 27th Annual Conference of the International Group for Lean Construction (IGLC), Dublin, Ireland, 27 July 2019. [Google Scholar]
- Singh, R.K. Developing the Framework for Coordination in Supply Chain of SMEs. Bus. Process Manag. J. 2011, 17, 619–638. [Google Scholar] [CrossRef]
- Alaskari, O.; Ahmad, M.M.; Pinedo-Cuenca, R. Development of a Methodology to Assist Manufacturing SMEs in the Selection of Appropriate Lean Tools. Int. J. Lean Six Sigma 2016, 7, 62–84. [Google Scholar] [CrossRef]
- Yadav, V.; Khandelwal, G.; Jain, R.; Mittal, M.L. Development of Leanness Index for SMEs. Int. J. Lean Six Sigma 2019, 10, 397–410. [Google Scholar] [CrossRef]
- Yadav, V.; Jain, R.; Mittal, M.L.; Panwar, A.; Sharma, M.K. An Appraisal on Barriers to Implement Lean in SMEs. J. Manuf. Technol. Manag. 2018, 30, 195–212. [Google Scholar] [CrossRef]
- Darcy, C.; Hill, J.; McCabe, T.; McGovern, P. A Consideration of Organisational Sustainability in the SME Context. Eur. J. Train. Dev. 2014, 38, 398–414. [Google Scholar] [CrossRef]
- Dandage, R.V.; Mantha, S.S.; Rane, S.B.; Bhoola, V.; Ahmed, S.; Sobuz, M.H.R.; Dandage, R.V.; Mantha, S.S.; Rane, S.B.; Bhoola, V. Analysis of Interactions among Barriers in Project Risk Management. J. Ind. Eng. Int. 2018, 14, 153–169. [Google Scholar] [CrossRef]
- Jones, D.T.; Womack, J.P. Lean Thinking, 1st ed.; Free Press: New York, NY, USA, 2003; ISBN 9788498751994. [Google Scholar]
- Dora, M.; Kumar, M.; Gellynck, X. Determinants and Barriers to Lean Implementation in Food-Processing SMEs—A Multiple Case Analysis. Prod. Plan. Control 2016, 27, 1–23. [Google Scholar] [CrossRef]
- Forcael, E.; Ferrari, I.; Opazo-Vega, A.; Pulido-Arcas, J.A. Construction 4.0: A Literature Review. Sustainability 2020, 12, 9755. [Google Scholar] [CrossRef]
- Schönbeck, P.; Löfsjögård, M.; Ansell, A. Quantitative Review of Construction 4.0 Technology Presence in Construction Project Research. Buildings 2020, 10, 173. [Google Scholar] [CrossRef]
- Hamzeh, F.; González, V.A.; Alarcon, L.F.; Khalife, S. Lean Construction 4.0: Exploring the Challenges of Development in the Aec Industry. In Proceedings of the 29th Annual Conference of the International Group for Lean Construction (IGLC), Lima, Peru, 14–17 July 2021; Alarcon, L.F., González, V.A., Eds.; pp. 248–283. [Google Scholar]
- Salem, O.; Solomon, J.; Genaidy, A.; Minkarah, I. Lean Construction: From Theory to Implementation. J. Manag. Eng. 2006, 22, 168–175. [Google Scholar] [CrossRef]
- Okere, G. Barriers and Enablers of Effective Knowledge Management: A Case in the Construction Sector. Electron. J. Knowl. Manag. 2017, 15, 85–97. [Google Scholar]
- Ballard, G.; Kim, Y.W.; Jang, J.W.; Liu, M. Roadmap for Lean Implementation at the Project Level University; The Construction Industry Institute: Austin, TX, USA, 2007. [Google Scholar]
- Salvatierra, J.L.; López, A.; Alarcon, L.F.; Velásquez, X. Lean Diagnosis for Chilean Construction Industry: Towards More Sustainable Lean Practices and Tools. In Proceedings of the 23rd Annual Conference of the Internatioanl Group for Lean Construction, Perth, Australia, 29–31 July 2015. [Google Scholar]
- Sarhan, S.; Fox, A. Trends and Challenges to the Development of a Lean Culture Among UK Construction Organisations. In Proceedings of the 20th Annual Conference of the International Group for Lean Construction (IGLC), San Diego, CA, USA, 18–20 July 2012. [Google Scholar]
- Forero, S.; Cardenas, S.; Vargas, H.; Garcia, C. A Deeper Look into the Perception and Disposition to Integrated Project Delivery (IPD) in Colombia. In Proceedings of the 23rd Annual Conference of the International Group for Lean Construction (IGLC), Perth, Australia, 29–31 July 2015; Volume 2015. [Google Scholar]
- Castiblanco, F.M.; Castiblanco, I.A.; Cruz, J.P. Qualitative Analysis of Lean Tools in the Construction Sector in Colombia. In Proceedings of the 27th Annual Conference of the International Group for Lean Construction (IGLC), Dublin, Ireland, 27 July 2019; Volume 57. [Google Scholar]
- Alarcón, L.F.; Diethelm, S.; Rojo, Ó. Collaborative Implementation of Lean Planning Systems in Chilean Construction Companies. In Proceedings of the 10th Annual Conference of the International Group for Lean Construction (IGLC), Gramado, Brazil, 10 August 2002. [Google Scholar]
- Engebø, A.; Drevland, F.; Lohne, J.; Shkmot, N.; Lædre, O. Geographical Distribution of Interest and Publications on Lean Construction. In Proceedings of the 25th Annual Conference of the International Group for Lean Construction (IGLC), Heraklion, Greece, 8 July 2017. [Google Scholar]
- Alarcón, L.F.; Diethelm, S. Organizing to Introduce Lean Practices in Construction Companies. In Proceedings of the 9th International Workshop on Lean Construction, Singapore, 6–8 August 2001; Volume 17. [Google Scholar]
- Huaman-Orosco, C.; Erazo-Rondinel, A.A. An Exploratory Study of the Main Barriers to Lean Construction Implementation in Peru. In Proceedings of the 29th Annual Conference of the International Group for Lean Construction (IGLC), Lima, Peru, 14–17 July 2021. [Google Scholar]
- Medina, A. Learning Through Failure: The Challenge of Lean Project Delivery from the Contractor’s Perspective in Perú. In Proceedings of the 22nd Annual Conference of the International Group for Lean Construction (IGLC), Oslo, Norway, 25 June 2014. [Google Scholar]
- Gutiérrez, F.M. Influence of Integrated Teams and Co-Location to Achieve the Target Cost in Building Projects. In Proceedings of the 28th Annual Conference of the International Group for Lean Construction (IGLC), Berkeley, CA, USA, 6–12 July 2020. [Google Scholar]
- Lagos, C.I.; Herrera, R.F.; Alarcón, L.F. Contributions of Information Technologies to Last Planner System Implementation. In Proceedings of the 25th Annual Conference of the International Group for Lean Construction (IGLC), Heraklion, Greece, 10–12 July 2017; Volume 2, pp. 87–94. [Google Scholar]
- Creswell, J.W. Research Design: Qualitative, Quantitative and Mixed Methods Approaches; Knight, V., Ed.; SAGE: Thousand Oaks, CA, USA, 2014; ISBN 9781452226095. [Google Scholar]
- Meuser, M.; Nagel, U. Research Methods Series, 1st ed.; European Consortium for Political Research: Colchester, UK, 2014. [Google Scholar]
- Ballard, G.; Tommelein, I.D. 2020 Current Process Benchmark for the Last Planner ® System of Project Planning and Control; Berkeley university of California: Berkeley, CA, USA, 2021. [Google Scholar]
- Cerveró-Romero, F.; Napolitano, P.; Reyes, E.; Teran, L. Last Planner System® and Lean Approach Process®: Experiences from Implementation in Mexico. In Proceedings of the 21st Annual Conference of the International Group for Lean Construction (IGLC), Fortaleza, Brazil, 21 July 2013; pp. 645–654. [Google Scholar]
- Silvério, L.; Trabasso, L.G.; Pereira Pessôa, M.V. A Roadmap for a Leanness Company to Emerge as a True Lean Organization. Concurr. Eng. Res. Appl. 2020, 28, 3–19. [Google Scholar] [CrossRef]
- Hogg, R.V.; Tanis, E.; Zimmerman, D. Probability and Statistical Inference Ninth Edition, 9th ed.; Deirdre Lynch, Ed.; Pearson: London, UK, 2015; ISBN 9780321923271. [Google Scholar]
- Gaskin, C.J.; Happell, B. On Exploratory Factor Analysis: A Review of Recent Evidence, an Assessment of Current Practice, and Recommendations for Future Use. Int. J. Nurs. Stud. 2014, 51, 511–521. [Google Scholar] [CrossRef]
- Watkins, M.W. Exploratory Factor Analysis: A Guide to Best Practice. J. Black Psychol. 2018, 44, 219–246. [Google Scholar] [CrossRef]
- Shrestha, N. Factor Analysis as a Tool for Survey Analysis. Am. J. Appl. Math. Stat. 2021, 9, 4–11. [Google Scholar] [CrossRef]
- Fabrigar, L.R.; Wegener, D.T.; MacCallum, R.C.; Strahan, E.J. Evaluating the Use of Exploratory Factor Analysis in Psychological Research. Psychol. Methods 1999, 4, 272–299. [Google Scholar] [CrossRef]
- Kaiser, H.F. The Varimax Criterion for Analytic Rotation in Factor Analysis. Psychometrika 1958, 23, 187–200. [Google Scholar] [CrossRef]
- Ostertagová, E.; Ostertag, O.; Kováč, J. Methodology and Application of the Kruskal-Wallis Test. Appl. Mech. Mater. 2014, 611, 115–120. [Google Scholar] [CrossRef]
- Tonidandel, S.; LeBreton, J.M. Relative Importance Analysis: A Useful Supplement to Regression Analysis. J. Bus. Psychol. 2011, 26, 1–9. [Google Scholar] [CrossRef]
- Alves, A.C.; Flumerfelt, S.; Kahlen, F.J. Lean Education: An Overview of Current Issues; Springer: Berlin/Heidelberg, Germany, 2016; pp. 1–179. [Google Scholar] [CrossRef]
- Ahmed, S.; Hossain, M.M.; Haq, I. Implementation of Lean Construction in the Construction Industry in Bangladesh: Awareness, Benefits and Challenges. Int. J. Build. Pathol. Adapt. 2020, 39, 368–406. [Google Scholar] [CrossRef]
- AlManei, M.; Salonitis, K.; Xu, Y. Lean Implementation Frameworks: The Challenges for SMEs. In Proceedings of the the 50th CIRP Conference on Manufacturing Systems Lean, Taichung City, Taiwan, 3–5 May 2017; Volume 63, pp. 750–755. [Google Scholar]
- Koohestani, K.; Poshdar, M.; Gonzalez, V.A. Finding the Way to Success in Implementing Lean Construction in an Unfavourable Context. In Proceedings of the 28th Annual Conference of the International Group for Lean Construction (IGLC), Berkeley, CA, USA, 6–10 July 2020; pp. 373–384. [Google Scholar]
- Torp, O.; Knudsen, J.B.; Rønneberg, I. Factors Affecting Implementation of Lean Construction. In Proceedings of the 26th Annual Conference of the International Group for Lean Construction (IGLC), Chennai, India, 18 July 2018; Volume 2, pp. 1261–1271. [Google Scholar]
- Loosemore, M. Improving Construction Productivity: A Subcontractor’s Perspective. Eng. Constr. Archit. Manag. 2014, 21, 245–260. [Google Scholar] [CrossRef]
- Rahimian, F.P.; Goulding, J.; Akintoye, A.; Kolo, S. Review of Motivations, Success Factors, and Barriers to the Adoption of Offsite Manufacturing in Nigeria. Procedia Eng. 2017, 196, 512–519. [Google Scholar] [CrossRef]
- Walter, R.; Weinmann, M.; Baier, C.; Oprach, S.; Haghsheno, S. A Requirement Model for Lean Leadership in Construction Projects. In Proceedings of the 28th Annual Conference of the International Group for Lean Construction (IGLC), Berkeley, CA, USA, 6–10 July 2020. [Google Scholar]
- Aslam, M.; Gao, Z.; Smith, G. Exploring Factors for Implementing Lean Construction for Rapid Initial Successes in Construction. J. Clean Prod. 2020, 277, 123295. [Google Scholar] [CrossRef]
- Gomez, S.; Ballard, G.; Naderpajouh, N.; Ruiz, S. Integrated Project Delivery for Infraestructure Projects in Perú. In Proceedings of the 26th Annual Conference of the International Group for Lean Construction (IGLC), Chennai, India, 18 July 2018. [Google Scholar]
- Bashir, A.; Suresh, S.; Oloke, D.; Proverbs, D.; Gameson, R. Overcoming the Challenges Facing Lean Construction Practice in the UK Contracting Organizations. Int. J. Archit. Eng. Constr. 2015, 4, 10–18. [Google Scholar] [CrossRef]
- Thomas, A.J.; Antony, J.; Francis, M.; Fisher, R. A Comparative Study of Lean Implementation in Higher and Further Education Institutions in the UK. Int. J. Qual. Reliab. Manag. 2015, 32, 982–996. [Google Scholar] [CrossRef]
- Soren, W. Lean Construction with or Without Lean Challenges of Implementing. In Proceedings of the 22nd Annual Conference of the International Group for Lean Construction (IGLC), Oslo, Norway, 22 June 2014. [Google Scholar]
- Kawish, S.E. Identifying and Prioritizing Barriers and Overcoming Strategies in Implementing Lean Construction Principles and Methods Whitin Transportation Projects. Master’s Thesis, Michigan State University, East Lansing, MI, USA, 2017. [Google Scholar]
- Nwaki, W.; Eze, E.; Awodele, I. Major Barriers Assessment of Lean Construction Application in Construction Projects Delivery. CSID J. Infrastruct. Dev. 2021, 4, 63. [Google Scholar] [CrossRef]
- Shang, G.; Sui Pheng, L. Barriers to Lean Implementation in the Construction Industry in China. J. Technol. Manag. China 2014, 9, 155–173. [Google Scholar] [CrossRef]
- Mejía-Plata, C.; Guevara-Ramirez, J.S.; Moncaleano-Novoa, D.F.; Londoño-Acevedo, M.C.; Rojas-Quintero, J.S.; Ponz-Tienda, J.L. A Route Map for Implementing Last Planner® System in Bogotá, Colombia. In Proceedings of the 24th Annual Conference of the International Group for Lean Construction (IGLC), Boston, MA, USA, 24 July 2016. [Google Scholar]
- Albliwi, S.; Antony, J.; Lim, S.A.H.; van der Wiele, T. Critical Failure Factors of Lean Six Sigma: A Systematic Literature Review. Int. J. Qual. Reliab. Manag. 2014, 31, 1012–1030. [Google Scholar] [CrossRef]
- Alarcón, L.F.; Diethelm, S.; Rojo, O.; Calderon, R.; Calderón, R. Assessing the Impacts of Implementing Lean Construction. In Proceedings of the 13th Annual Conference of the International Group for Lean Construction (IGLC), Sydney, Australia, 13 July 2008; Volume 23, pp. 26–33. [Google Scholar]
- Liu, C.; González, V.A.; Liu, J.; Rybkowski, Z.; Schöttle, A.; Mourgues Álvarez, C.; Pavez, I. Accelerating the Last Planner System® (LPS) Uptake Using Virtual Reality and Serious Games: A Sociotechnical Conceptual Framework. In Proceedings of the 28th Annual Conference of the International Group for Lean Construction (IGLC), Berkeley, CA, USA, 6–12 July 2020. [Google Scholar]
- Ivina, D.; Olsson, N. Lean Construction Principles and Railway Maintenance Planning. In Proceedings of the 28th Annual Conference of the International Group for Lean Construction (IGLC), Berkeley, CA, USA, 6–12 July 2020. [Google Scholar]
- Abolhassani, A.; Layfield, K.; Gopalakrishnan, B. Lean and US Manufacturing Industry: Popularity of Practices and Implementation Barriers. Int. J. Product. Perform. Manag. 2016, 65, 875–897. [Google Scholar] [CrossRef]
- Mossman, A. Why Isn’t the UK Construction Industry Going Lean With Gusto? Lean Constr. J. 2009, 5, 24–36. [Google Scholar]
- Izquierdo, J.L.; Cerf, M.; Gómez, S.A. Lean Construction Education: Basic Management Functions Workshop. In Proceedings of the 19th Annual Conference of the International Group for Lean Construction (IGLC), Lima, Peru, 13–15 July 2011. [Google Scholar]
- Poshdar, M.; Gonzalez, V.A.; Antunes, R.; Ghodrati, N.; Katebi, M.; Valasiuk, S.; Alqudah, H.; Talebi, S. Diffusion of Lean Construction in Small to Medium-Sized Enterprises of Housing Sector. In Proceedings of the 27th Annual Conference of the International Group for Lean Construction (IGLC), Dublin, Ireland, 3 July 2019; pp. 383–392. [Google Scholar]
- Khaleel, T.; Nassar, Y. Identification and Analysis of Factors Affecting Labour Productivity in Iraq. In MATEC Web of Conferences; EDP Sciences: Les Ulis, France, 2018; Volume 162, p. 02032. [Google Scholar] [CrossRef]
- Akinade, O.O. Bim-Based Software for Construction Waste Analytics Using Artificial Intelligence Hybrid Models. Ph.D. Thesis, University of The West of England, Bristol, UK, 2017. [Google Scholar]
- Bello, S.A.; Oyedele, L.O.; Akinade, O.O.; Bilal, M.; Davila Delgado, J.M.; Akanbi, L.A.; Ajayi, A.O.; Owolabi, H.A. Cloud Computing in Construction Industry: Use Cases, Benefits and Challenges. Autom. Constr. 2021, 122, 103441. [Google Scholar] [CrossRef]
- Muñoz-La Rivera, F.; Mora-Serrano, J.; Valero, I.; Oñate, E. Methodological-Technological Framework for Construction 4.0. Arch. Comput. Methods Eng. 2021, 28, 689–711. [Google Scholar] [CrossRef]
- Sarhan, J.G.; Xia, B.; Fawzia, S.; Karim, A.; Olanipekun, A.O.; Coffey, V. Framework for the Implementation of Lean Construction Strategies Using the Interpretive Structural Modelling (ISM) Technique. Eng. Constr. Archit. Manag. 2019, 27, 1–23. [Google Scholar] [CrossRef]
- Ghani, N.A.; Hamid, S.; Targio Hashem, I.A.; Ahmed, E. Social Media Big Data Analytics: A Survey. Comput. Hum. Behav. 2019, 101, 417–428. [Google Scholar] [CrossRef]
- Dave, B.; Kubler, S.; Främling, K.; Koskela, L. Opportunities for Enhanced Lean Construction Management Using Internet of Things Standards. Autom. Constr. 2016, 61, 86–97. [Google Scholar] [CrossRef]
- Soman, R.K.; Molina-Solana, M. Automating Look-Ahead Schedule Generation for Construction Using Linked-Data Based Constraint Checking and Reinforcement Learning. Autom. Constr. 2022, 134, 104069. [Google Scholar] [CrossRef]
- Lagos, C.I.; Alarcón, L.F. Assessing the Relationship between Constraint Management and Schedule Performance in Chilean and Colombian Construction Projects. J. Manag. Eng. 2021, 37, 04021046. [Google Scholar] [CrossRef]
- Pérez, D.; Lagos, C.; Fernando Alarcón, L. Key Last Planner System Metrics to Assess Project Performance in High-Rise Building and Industrial Construction Projects. J. Constr. Eng. Manag. 2022, 148, 04021179. [Google Scholar] [CrossRef]
- Cámara de Comercio de Lima. El Impacto de la Informalidad; Cámara de Comercio de Lima: Lima, Peru, 2017; p. 44. [Google Scholar]
- Radhika, R.; Sukumar, S. An Overview of the Concept of Lean Construction and the Barriers in ITS Implementation. Int. J. Eng. Technol. Manag. Res. 2017, 4, 13–26. [Google Scholar] [CrossRef]
- Oladiran Olatunji, J. An Investigation into the Usage of Lean Construction Techniques in Nigeria. J. Constr. Proj. Manag. Innov. 2017, 7, 1712–1725. [Google Scholar] [CrossRef]
- Sacks, R.; Girolami, M.; Brilakis, I. Building Information Modelling, Artificial Intelligence and Construction Tech. Dev. Built Environ. 2020, 4, 100011. [Google Scholar] [CrossRef]
- Radl, J.; Kaiser, J. Benefits of Implementation of Common Data Environment (CDE) into Construction Projects. In IOP Conference Series: Materials Science and Engineering; IOP Publishing: Bristol, UK, 2019; Volume 471, p. 022021. [Google Scholar] [CrossRef]
- Parn, E.A.; Edwards, D. Cyber Threats Confronting the Digital Built Environment. Eng. Constr. Archit. Manag. 2019, 26, 245–266. [Google Scholar] [CrossRef]
- Sik, D.; Csorba, K.; Ekler, P. Implementation of a Geographic Information System with Big Data Environment on Common Data Model. In Proceedings of the 8th IEEE International Conference on Cognitive Infocommunications, CogInfoCom, Debrecen, Hungary, 11–14 September 2017; Volume 2018. [Google Scholar]
- Vilutiene, T.; Hosseini, M.R.; Pellicer, E.; Zavadskas, E.K. Advanced BIM Applications in the Construction Industry. Adv. Civil. Eng. 2019, 2019, 6356107. [Google Scholar] [CrossRef]
- Karaguzel, O.T.; Elshambakey, M.; Zhu, Y.; Hong, T.; Tolone, W.J.; das Bhattacharjee, S.; Cho, I.; Dou, W.; Wang, H.; Lu, S.; et al. Open Computing Infrastructure for Sharing Data Analytics to Support Building Energy Simulations. J. Comput. Civ. Eng. 2019, 33, 04019037. [Google Scholar] [CrossRef]
- Mohamed, A.H. Collaboration and Integration in Construction, Engineering, Management and Technology; Springer: Berlin/Heidelberg, Germany, 2021; pp. 15–19. [Google Scholar] [CrossRef]
- Shuman, L.J.; Besterfield-Sacre, M.; McGourty, J. The ABET “Professional Skills”—Can They Be Taught? Can They Be Assessed? J. Eng. Educ. 2005, 94, 41–55. [Google Scholar] [CrossRef]
- Macomber, H.; Davey, C. The Pocket Sensei, 1st ed.; CreateSpace Independent Publishing, Ed.; Pemi River MEdia: Campton, UK, 2017. [Google Scholar]
- González, V.A.; Senior, B.; Orozco, F.; Alarcon, L.F.; Ingle, J.; Best, A. Simulating Lean Production Principles in Construction: A Last Planner-Driven Game. In Proceedings of the 22nd Annual Conference of the International Group for Lean Construction (IGLC), Oslo, Norway, 22 June 2014; pp. 1221–1232. [Google Scholar]

Publisher’s Note: MDPI stays neutral with regard to jurisdictional claims in published maps and institutional affiliations. |
© 2022 by the authors. Licensee MDPI, Basel, Switzerland. This article is an open access article distributed under the terms and conditions of the Creative Commons Attribution (CC BY) license (https://creativecommons.org/licenses/by/4.0/).