Abstract
Recently, Phase Change Materials (PCM) have become more prevalent in improving buildings’ thermal management. The relative location of the PCM layer is a valuable measure for assessing the thermal performance of building envelopes, in addition to meteorological circumstances and PCM qualities. The optimum air layers between the PCM layer and roof may significantly reduce energy consumption in buildings. In this regard, the influence of air gap layer thickness on the thermal performance of a PCM (HS 29) integrated roof of the test room is investigated experimentally. Experiments are carried out for an unconditioned test room located on the terrace of a laboratory in Surat, India, considering various air layer thickness values (0, 2, 4, and 6 cm) and a fixed PCM layer thickness. Different configurations within the research, including no- PCM and PCM with 0, 2, 4, and 6 cm air layer thickness, are investigated for the effects of diurnal change in room temperature. Results are evaluated based on the peak value, valley value temperatures of different roof layers, and an index (MKR, Measure of Key Response). It is observed that the maximum temperature difference between the PCM-integrated test room and the non-PCM test room is 4 °C to 7 °C. Results showed that, with a higher MKR index of 8.83, a PCM-integrated roof with a 2 cm air layer thickness could reduce the diurnal room temperature variations compared with the non-PCM test room. This conclusion from the current research demonstrates the significance of an air layer provided between the PCM layer and the roof of the building.
1. Introduction
Many countries have proposed numerous measures to reduce greenhouse gas emissions as a global initiative [1]. These initiatives include developing renewable energy systems and energy conservation measures for buildings [2], which account for 30–40% of global primary energy demand [3]. Most of the energy use in buildings is due to space cooling applications. The cooling and heating energy consumption in buildings is significantly influenced by their enclosure design. The energy consumption in the buildings can be reduced by enhancing the thermal performance (TP) of building envelopes [4] and enhancing the comfort of the built environment [5]. Using envelope elements such as roofs, walls, windows, etc., with this aim, higher thermal resistance is the most common practice. Thermal resistance may be enhanced by adding thermal mass or insulation. Increasing envelope element size to increase thermal mass may not be viable for structural and economic reasons. The installation of thermal insulation in the building envelope is also limited due to the low heat storage capacity of insulating materials. However, many researchers emphasize the relevance of the air layer while investigating TP enhancement in building envelopes employing conventional thermal insulators.
Sanea et al. [6] investigated air spaces together with insulation layers for different thicknesses in buildings for the climatic conditions of the city of Riyadh and showed that the air gap has a dominant role when the insulation layer is lower than 7.5 cm. Jamal et al. [7] carried out a numerical investigation on double solid layer walls separated by an air gap layer. They noted that an optimum air gap thickness of 5 cm along with low emissivity surface material of the wall results in reduced energy consumption of the building envelope. Mahlia and Iqbal [8] studied air layer thickness and optimum insulation thickness to analyze the potential reduction in energy consumption and emissions in building walls. The results have shown that air layers of 2–6 cm in a wall and an optimum insulation thickness can reduce energy consumption and emissions by 65–77% compared to a wall without an air layer. Mavromatidis et al. [9] evaluated the effect of air layer thickness on temperature distribution in multilayer insulation walls using a numerical study. It was found that maximum thermal resistance can be achieved with a 3 cm air layer thickness. Kurt [10] studied the effect of the air layer on the insulation thickness and energy cost savings for a composite wall building in Turkey and reported that an optimum insulation thickness along with the air layer reduces the heat loss through the composite walls.
An alternative practice for improving the TP of the enclosure is to boost its heat storage capacity. In this regard, using Phase Change Materials (PCMs) with high latent heat is becoming increasingly common for augmenting the TP of building envelopes [11]. PCMs can store/retrieve a great deal of heat in the latent form in a constant or narrow temperature range during the melting/freezing process [12]. Thus, with the application of PCM in the building envelopes, maximum heat with a minimum temperature variation can be stored. PCM can be incorporated into various building envelope elements. However, for effective heat transfer and ease of installation, PCM is typically integrated into floors, walls, and roofs [13]. The TP of such a building envelope depends mainly on climatic conditions, material properties [14], and relative positioning of the layer of PCM [15]. Although climatic conditions and properties of PCM are crucial parameters, with ease in installation and prior design considerations, the relative positioning of the PCM layer is also an effective parameter for the TP assessment of building envelopes. The relative positioning includes layering (i.e., single or multi-layer) as well as the thickness and location of the PCM layer. Numerous researchers have noted the relative positioning PCMs to achieve a higher TP and reduce energy usage in building applications (Table 1). As seen from Table 1, studies related to the TP evaluation of building envelopes using the PCM layer mainly focused either on the thickness or location of the PCM layer. Few authors also studied the multiple layers of PCM in building envelopes.

Table 1.
Literature summary.
According to the research shown above, including PCM and the air layer in the design of a building is one way to reduce that building’s overall demand for energy significantly. On the other hand, the research on the influence of the air layer that was given between the PCM layer, and the wall or roof of the building has not yet been documented. As a result, the usage of an air layer between the PCM layer and the top of a building is investigated in the current research. The novelty of the work is reflected in the findings of this research since a previous study of this kind has not yet been published. Thus, this research aims to explore the influence of optimal air layer thickness on the diurnal changes in indoor temperature and the decrease of heat gain. An experimental investigation is carried out to evaluate the impact of the air layer on the thermal performance of a roof integrating PCM for a prototypic test room located in Surat, India. A square metal enclosure filled with commercial PCM (HS 29) is used to incorporate the PCM layer into the roof of a test room. The air layer thickness varied between 0 to 6 cm, and a fixed PCM layer thickness are considered.
2. Experimental Setup
This section consists of details regarding the experimental setup, material and measurement methods, and methodology for data reduction to investigate the thermal performance of the PCM-integrated roof and the air layer.
2.1. Materials and Testing
It is to be noted that the experiment aims only to determine how effectively PCM and an air layer can minimize the heat load from the roof. Thus, a laboratory-scale test room is developed. However, the dimensions of the experimental room were selected to replicate the study reported by Velraj et al. [25]. Further, it is noted that the thickness of the concrete roof is considered similar to that used in real building conditions. Since all other walls of the model building are kept insulated, the only way for heat entrainment into the room in our experiments is through the roof. With this, considering dominant heat transfer in the vertical direction compared to the lateral direction, the thickness of the roof and PCM layer almost corresponds to real-life scenarios.
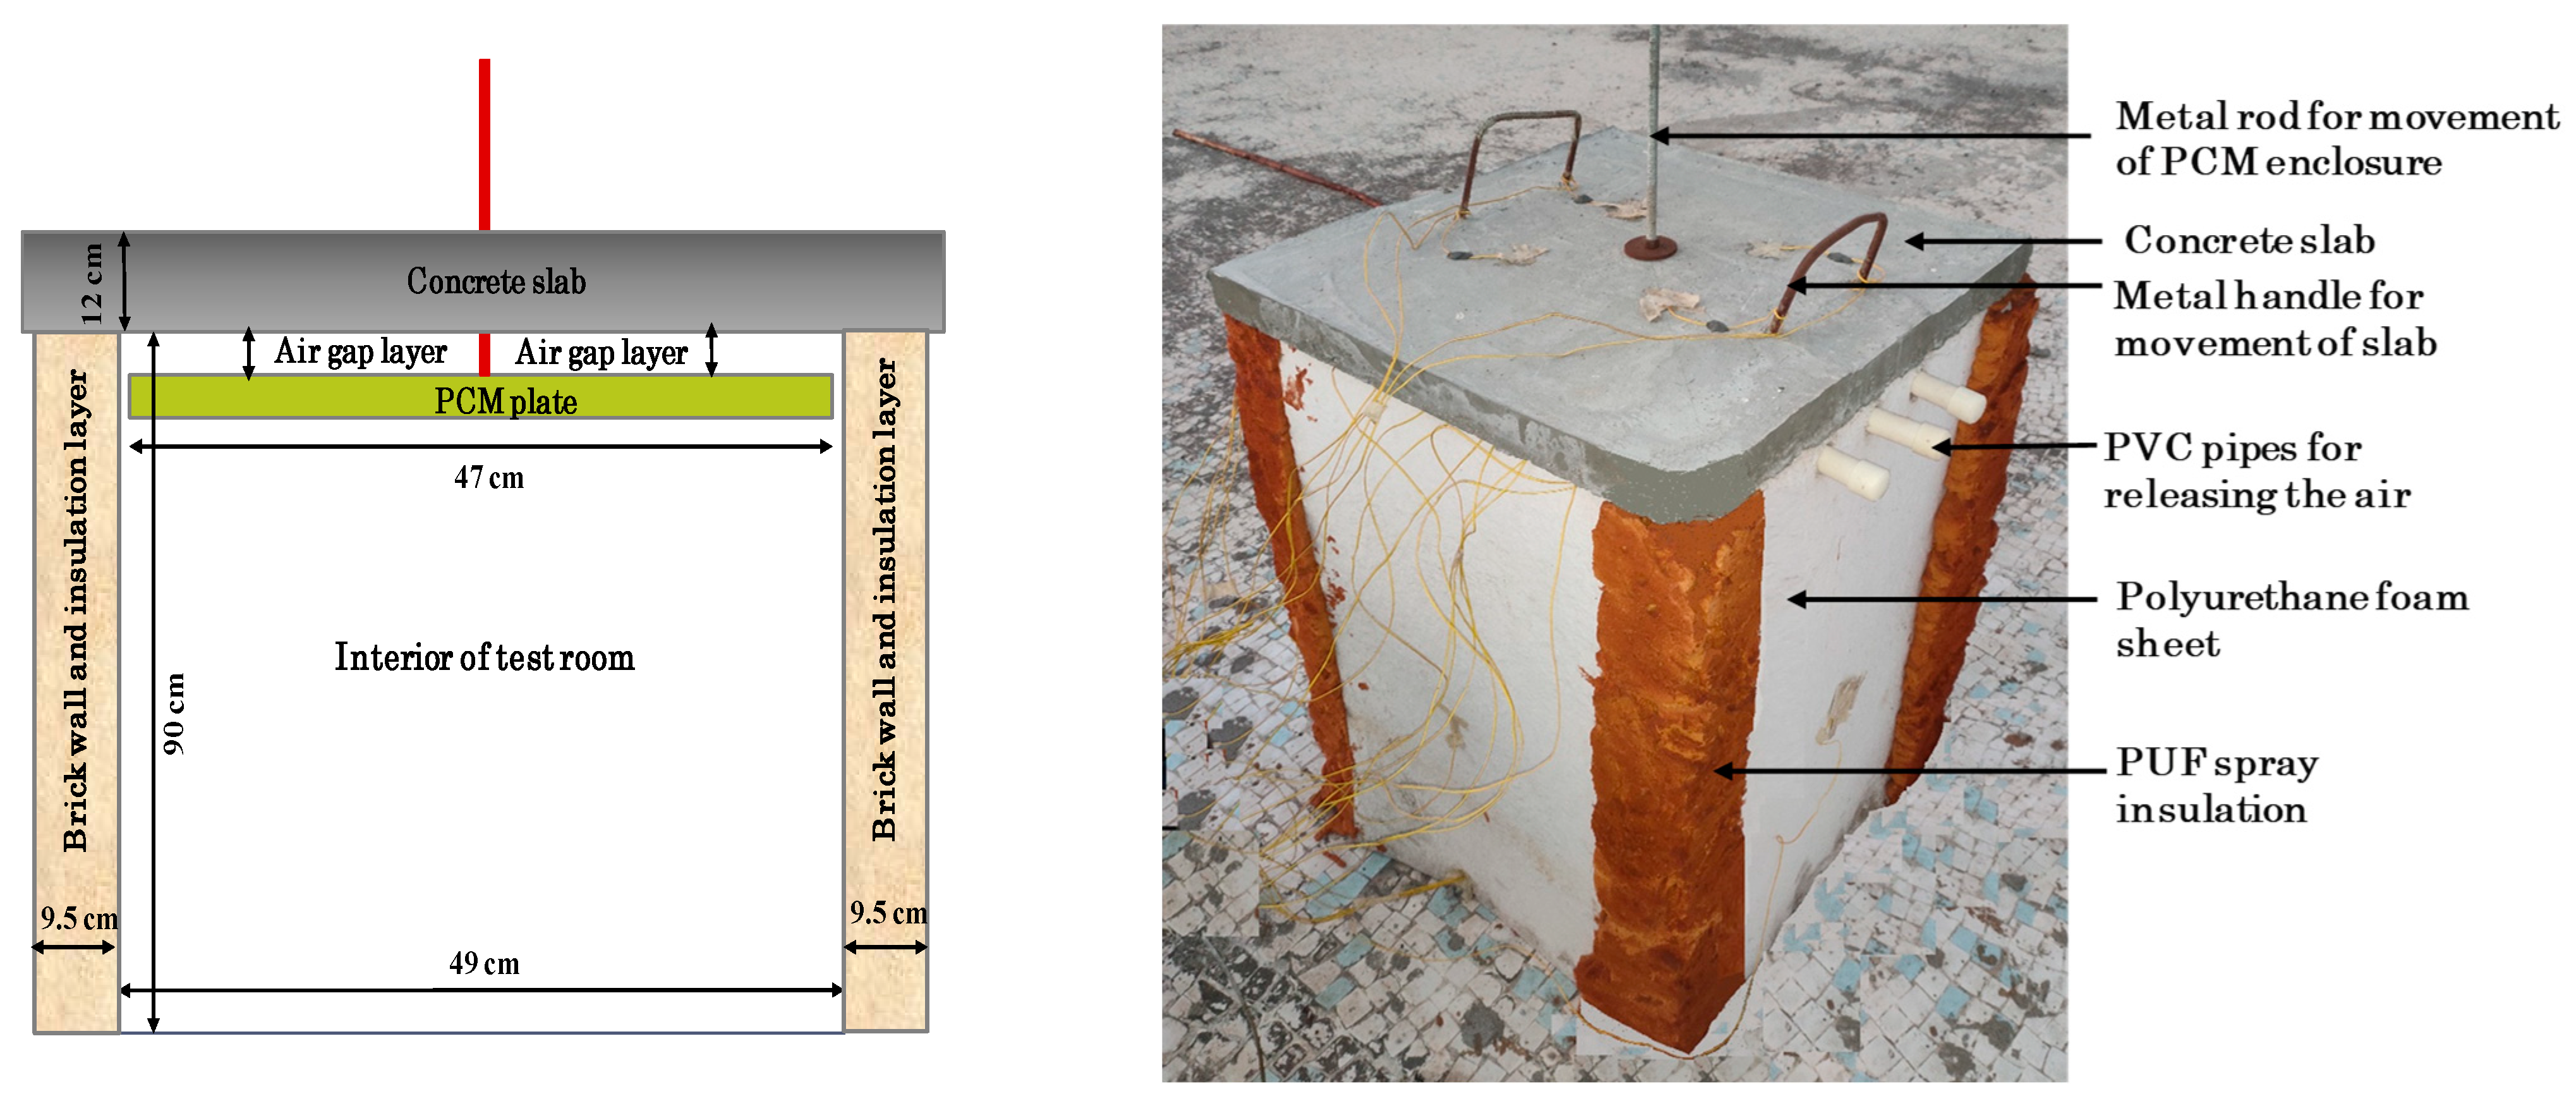
The field test was carried out during March and April 2020 using unconditioned single-room test buildings (68 cm × 68 cm × 102 cm) located on the terrace. The test room building is shown in Figure 1. The lightweight fly ash bricks (24 cm × 11 cm × 7 cm) are used to build the test room walls while the conventional concrete slab with a thickness of 12 cm is used as a roof of a building. The outer walls, except for the roof of the room, are insulated by a polyurethane foam (PUF) sheet of a thickness of 3 cm and PUF insulation spray on all the corners of the walls to ensure perfect insulation condition for studying the effect of heat transfer through the roof.
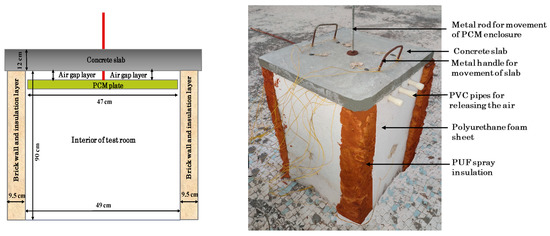
Figure 1.
Details of PCM enclosure in the test room.
The PCM is encapsulated in a square metal enclosure having dimensions of 47 cm × 47 cm × 2.8 cm. The enclosure is made of MS steel (0.15 cm thickness). PCM selection was based on the melting temperature and climatic characteristics of the city of Surat, from the study by Bhamare et al. [28], which recommended using a PCM with a melting temperature of 29 °C for hot and humid climatic zones. Hence, the PCM used in this study is the commercially available salt hydrate, HS 29, provided by PLUSS Co Ltd. (Delhi, India). The melting point and latent heat of fusion obtained via a Differential Scanning Calorimeter (DSC) are shown in Appendix A as Figure A1. The observed melting point, latent heat, and specific heat are 29 °C, 217.4 kJ/kg, and 2000 J/kg K, respectively. The density and thermal conductivity of the PCM is taken as 1830 kg/m3 [25] and 0.478 W/m K [29].
2.2. Instrumentation and Measurement
The temperature of the interior, walls, and PCM enclosure of the test room is measured using K-type thermocouples (total 32 with ±0.1 °C accuracy). Four thermocouples are placed at each (interior and exterior) surface of the concrete slab to measure temperature distribution and heat gain by the concrete slab. Four thermocouples are thus placed on the top side of a concrete slab and four on the bottom side, for a total of eight thermocouples. The heat gain by the concrete slab is calculated based on surface and room temperature. In the same way, eight thermocouples are also embedded in the PCM enclosure. To obtain the temperature gradient at the insulated walls of the test room, another eight thermocouples are used. Thermocouples are positioned at the center of each wall’s exterior and interior surfaces. Five thermocouples are placed vertically along the metal rod located at the center of the test room to measure temperature distribution in the interior of the test room. The position of the thermocouples is depicted in Figure A2 of Appendix A. The distance between each thermocouple along the height of a centrally placed rod is 17 cm. To record temperature, a data acquisition system is used, which consists of an RS485 scanner embedded with an intelligent microprocessor. A pyranometer SR2238 (measurement accuracy: ±3% for hourly sums) located outside at a 1.50 m height to reduce the effect of shadows is utilized to collect the solar irradiance. The wind speed is also measured via a weather station installed at the top of the building.
2.3. Climatic Data Deduction
The thermal performance of the test room is established for the reference case (non-PCM) and with PCM having an air layer gap (thickness of 0, 2, 4, and 6 cm). Before conducting the experimentation from 18–19 March 2020, the experiment is set to idle for two days to reach the periodic conditions. The variations in temperature and radiation intensity for different days are shown in Figure 2. It shows hourly averaged values of radiation intensity and ambient temperature on different days. To ease the performance comparison of the configurations with different ambient temperatures and radiation intensity, there is a need for a common climatic parameter by which radiation intensity and ambient temperature can be combined into a single parameter. With this aim, the current study uses the solar air temperature method as a common climatic parameter for combining radiation intensity and ambient temperature. The solar air temperature is the hypothetical outside air temperature that would result in the same temperature distribution and rate of heat transfer through a wall as is seen owing to the influences of the ambient temperature and the incoming solar radiation. In brief, the combined effect of the actual ambient temperature and the incoming solar radiation yields a common characteristic, namely solar air temperature, which can be used to compare various cases. Solar air temperature is calculated based on average roof temperature (Troof), radiation intensity (Id), ambient temperature (To), and wind velocity (Vwind) measured during the experimentation [30].
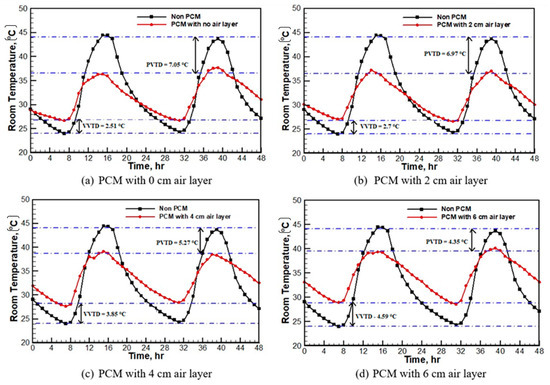
Figure 2.
Average room temperature variation in the test room.
Solar air temperature is calculated as [31]
where α, ε, and σ are the absorptivity of the surface, the emissivity of the rooftop and Stefan Boltzmann constant, respectively, hcombined is the combined radiative and convective heat transfer coefficient, ho is the ambient heat transfer coefficient, and Fsky is shape factor for rooftop slab and sky which is considered as 1.
The convective heat transfer coefficient is calculated as follows [31]
where Vwind is wind velocity.
The sky temperature is estimated by [31]
The average solar air temperature is calculated for different configurations using the above formulations and hourly variation of environmental conditions. The obtained average solar air temperatures for non-PCM, PCM with 0 cm, 2 cm, 4 cm, and 6 cm air layers are 31.80 °C, 31.90 °C, 34.65 °C, 32.11 °C, and 34.25 °C respectively. The average solar air temperature represents the extent of climatic conditions experienced by the test room during a particular day of experimentation. The higher average solar air temperature values during the day indicate warm weather conditions, while the lower values correspond to comparatively less warm weather conditions. Thus, an average solar air temperature can be used for comparing the climatic conditions for different days of experimentation. From the average solar air temperatures, one can notice that the highest average solar air temperature is found during the testing of the PCM layer with a 2 cm air layer, whereas the lowest average solar air temperature is shown by non-PCM room testing days.
Further, an index called MKR (Measure of Key Response) [32] is used for the comparative evaluation of the thermal performance of all configurations of PCM. This index, defined in Equation (5), combines crucial TP indicators and allows comparing TP enhancement of roofs incorporating PCM, taking the non-PCM roof as the reference. A high value of this index shows increasing time lag and decreasing solar heat gain and decrement factor, thus improved TP, whereas the lower value implies higher solar heat gain causing an increment in cooling energy consumption and hence poor TP of buildings.
In the above equation, f’, ϕ’, and Q’ respectively represent the time lag, decrement factor, and solar heat gain, all non-dimensional. The value of computational constant c is 0.5. These parameters and their non-dimensional forms are calculated as [32]
In Equation (6), tTmax Ceiling and tTmax Roof represent the time required for diurnal temperature waves to reach at ceiling and rooftop slab, respectively.
For the non-PCM room, Tceiling is the concrete bottom surface temperature, whereas, for the PCM room, it is the PCM bottom surface temperature. The heat transfer coefficient on the roof’s inner side is considered 8.7 W/m2 K [33]. The total heat gain by the test room for two days is evaluated by summing the hourly heat flux through the ceiling as given by Equation (11),
where qceiling is the heat flux added from the ceiling surface or released from the room. The values of performance indicators, i.e., , , and are calculated by the temperature distribution across the roof for all configurations of PCM.
To assess the effectiveness of PCM integrated roof compared with the non-PCM room, the envelope solar heat gain reduction rate can also be calculated as:
3. Results and Discussion
The impact of diurnal variation in room temperature for different configurations within the study, namely no- PCM and PCM with 0, 2, 4, and 6 cm air layer thickness, is investigated.
Effect on Room Temperature Variation
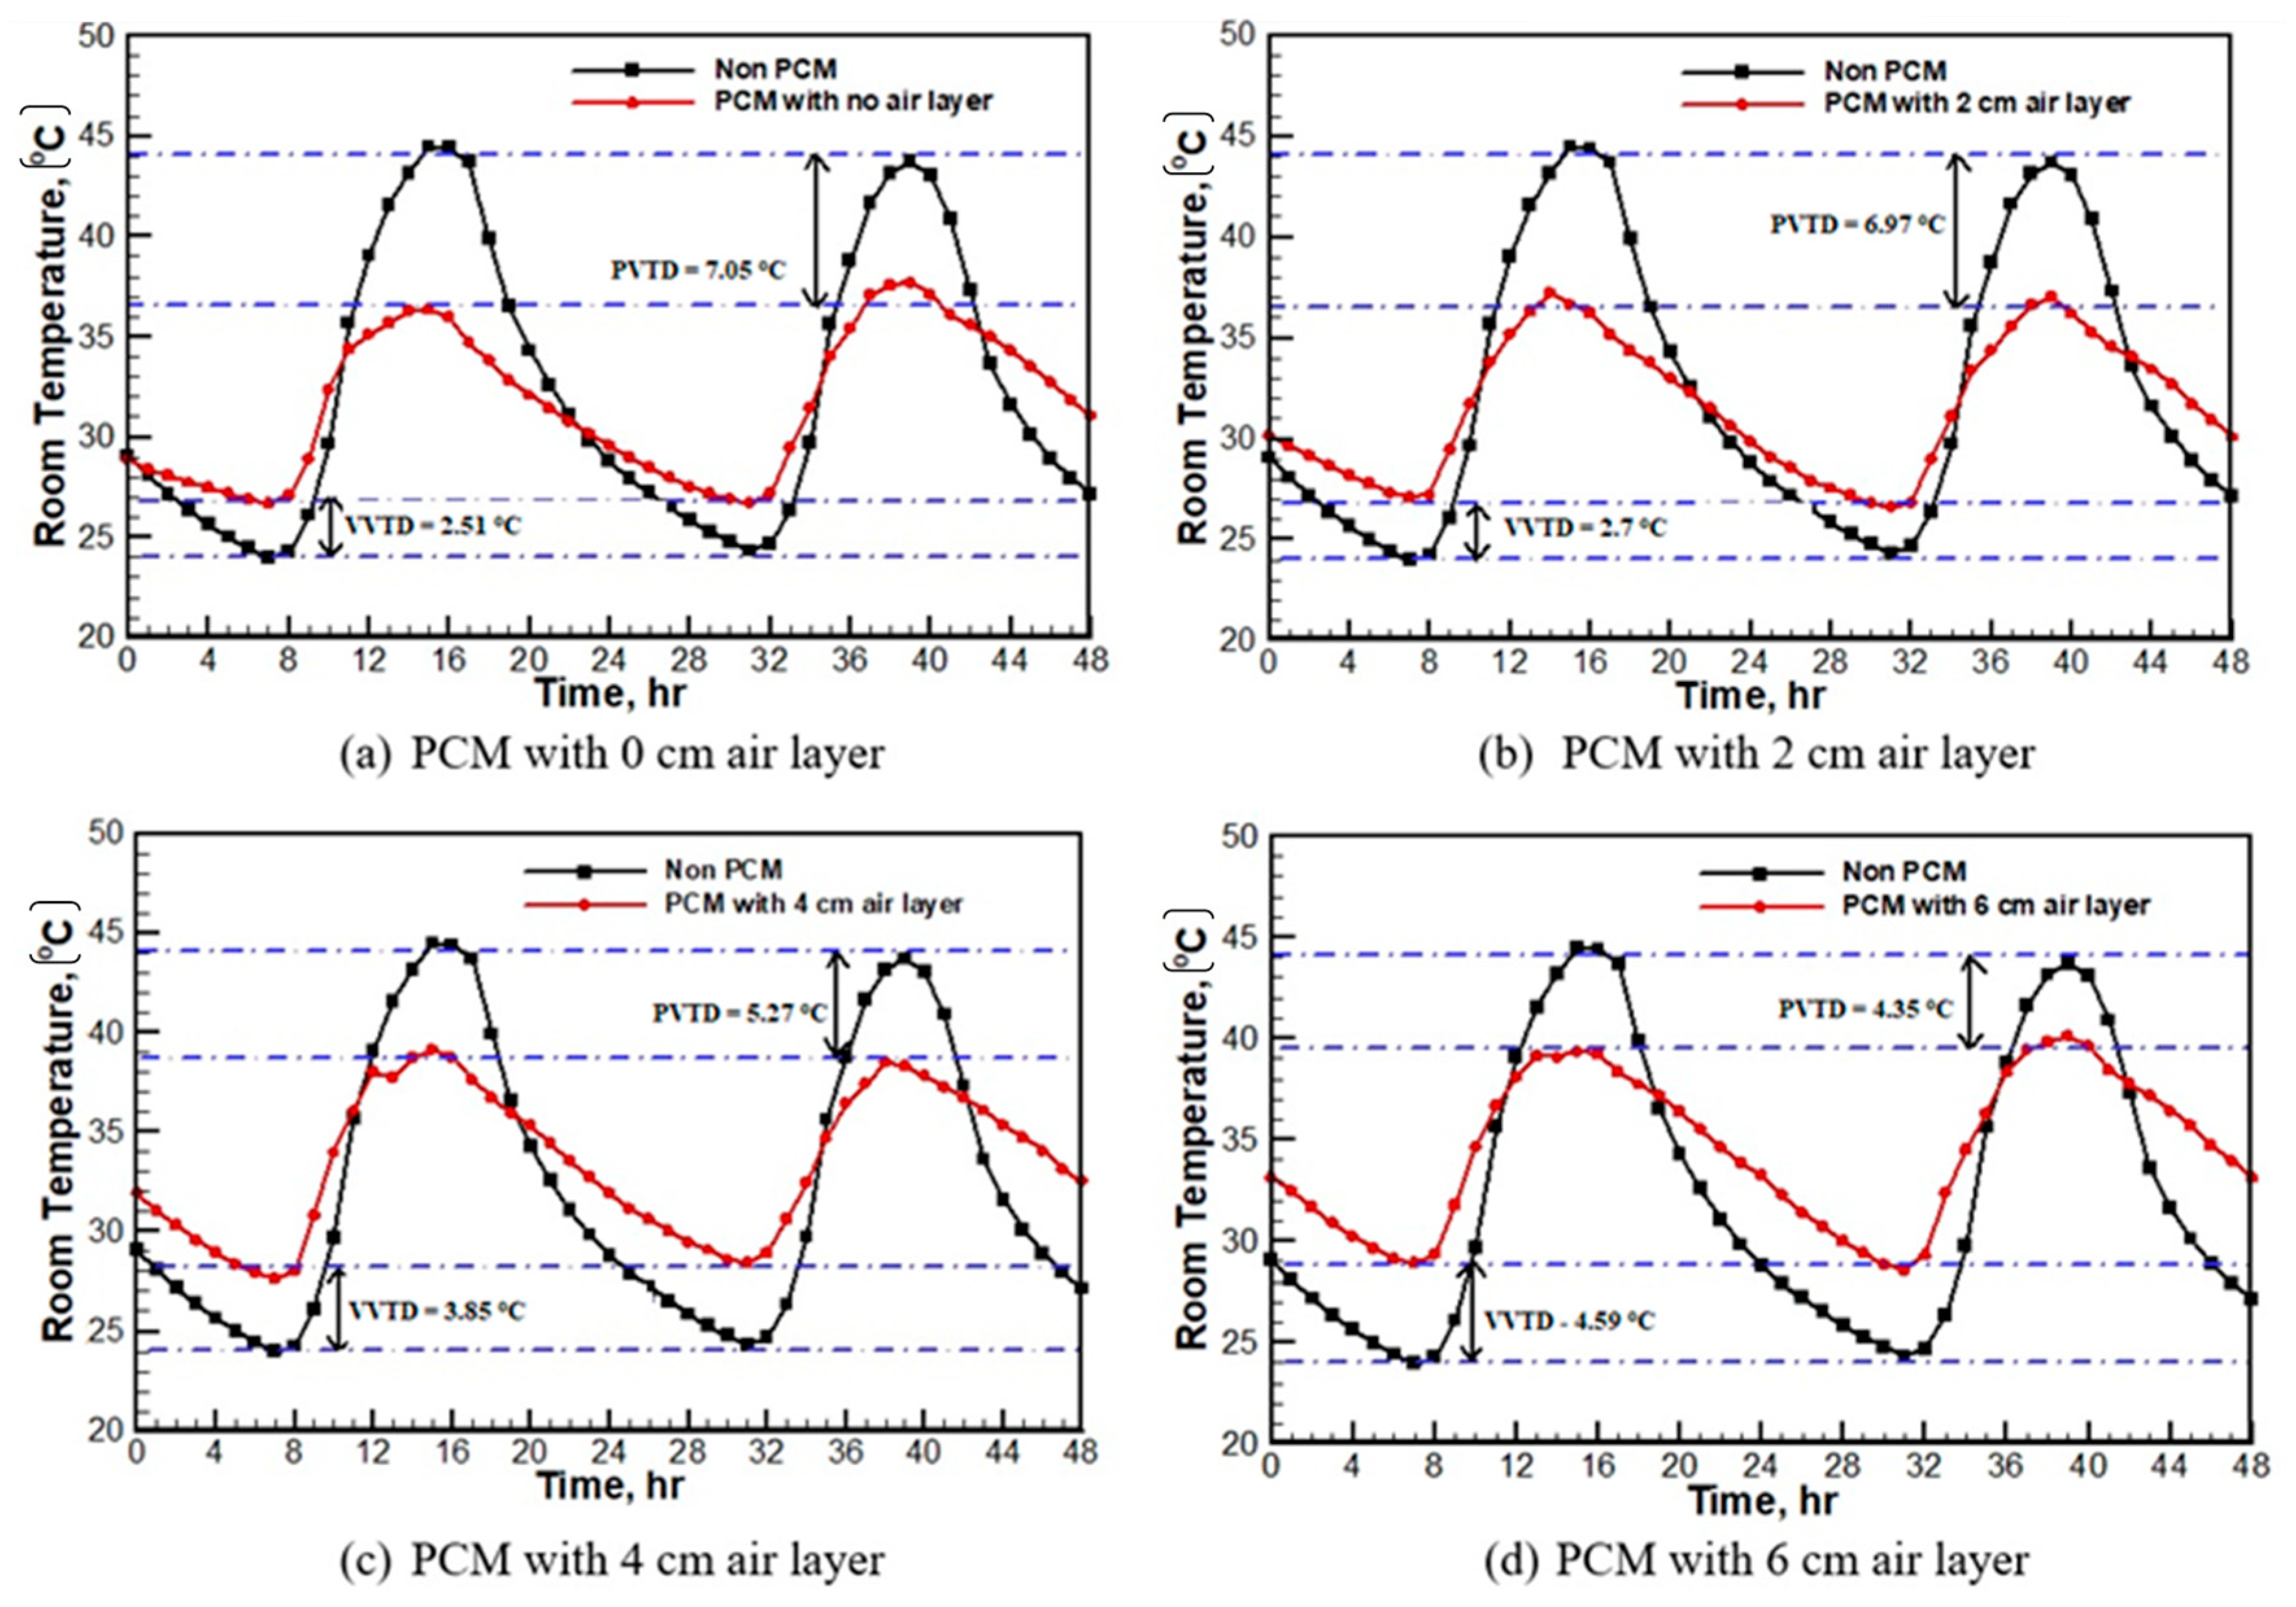
The average room temperature variation for different configurations is established during two consecutive days, as shown in Figure 2. From the figure, a diurnal variation in the room temperature on both days for the non-PCM test room is noticed. The room temperature drops to an average minimum of 24.2 °C in the morning, while it increases to an average height of 44.06 °C during the evening. Thus, non-PCM produces conditions that are excessively cooled in the morning i.e., from 1.00 hr to 6.00 hr, and overheated temperatures in the evening from 13.00 hr to 18.00 hr. The application of PCM efficiently eliminates this difference in room temperature. In the case of the PCM integrated test room, the room temperature curve shows minimum variation during morning hours and reaches minimum temperature in the range of 28–29 °C for both testing days. During the two days of room temperature monitoring, the difference between the room temperature for the PCM and the reference room (i.e., the room without PCM) during the morning and the evening is considered respectively, as the average valley and the peak value differences. A high-temperature difference in the valley value indicates that PCM can add more heat during the morning hours, which prevents excessively cooled conditions. In contrast, a high difference in peak temperature value suggests that more incoming heat is absorbed via PCM during the daytime and reduces the increase in the room temperature compared with the non-PCM test room. Hence, the peak value difference is more significant for passive cooling of the test room as it limits the room temperature elevation during the daytime.
The configurations like PCM with 0 cm and 2 cm air layer thickness show peak value temperature difference (PVTD) of 7.05 °C and 6.97 °C, whereas the valley value temperature difference (VVTD) of 2.51 °C and 2.7 °C, respectively. The PVTD of 5.27 °C and 4.35 °C is seen in the case of the PCM layer with 4 cm and 6 cm air layer thickness, respectively. These configurations show VVTD of 3.85 °C and 4.59 °C, respectively. Thus, PCM with 0 cm and 2 cm air layer thickness effectively regulates the diurnal variation in room temperature compared to PCM with 4 cm and 6 cm air layer thickness. Out of these two configurations, PCM with 2 cm air layer thickness is exposed to the highest average solar air temperature, i.e., 34.65 °C, while PCM with no air layer is subjected to the average solar air temperature of 31.90 °C. It indicates that PCM with 2 cm air layer thickness is subjected to more harsh climatic conditions regarding radiation intensity, ambient temperature, and wind velocity compared to the configuration PCM at the bottom. Hence based on maximum peak temperature difference and climatic conditions, PCM with 2 cm air layer thickness is considered the optimum configuration for minimizing the diurnal temperature variation in a test room. The reasons for such results can be stated as follows.
The application of PCM increases the thermal inertia of the roof. Further, effective utilization of the PCM’s latent heat also helps reduce the heat load from the roof. This phenomenon is reflected in the comparison of non-PCM and PCM-integrated roofs. The air layer between the roof and the PCM layer acts as insulation. In this way, raising the air layer aids in reducing heat load and so lowering the indoor temperature. However, as air layer thickness increases, PCM may not get enough heat to melt, making it challenging to use latent heat effectively. Thus, there must be an appropriate air layer thickness, which helps reduce heat load through the roof.
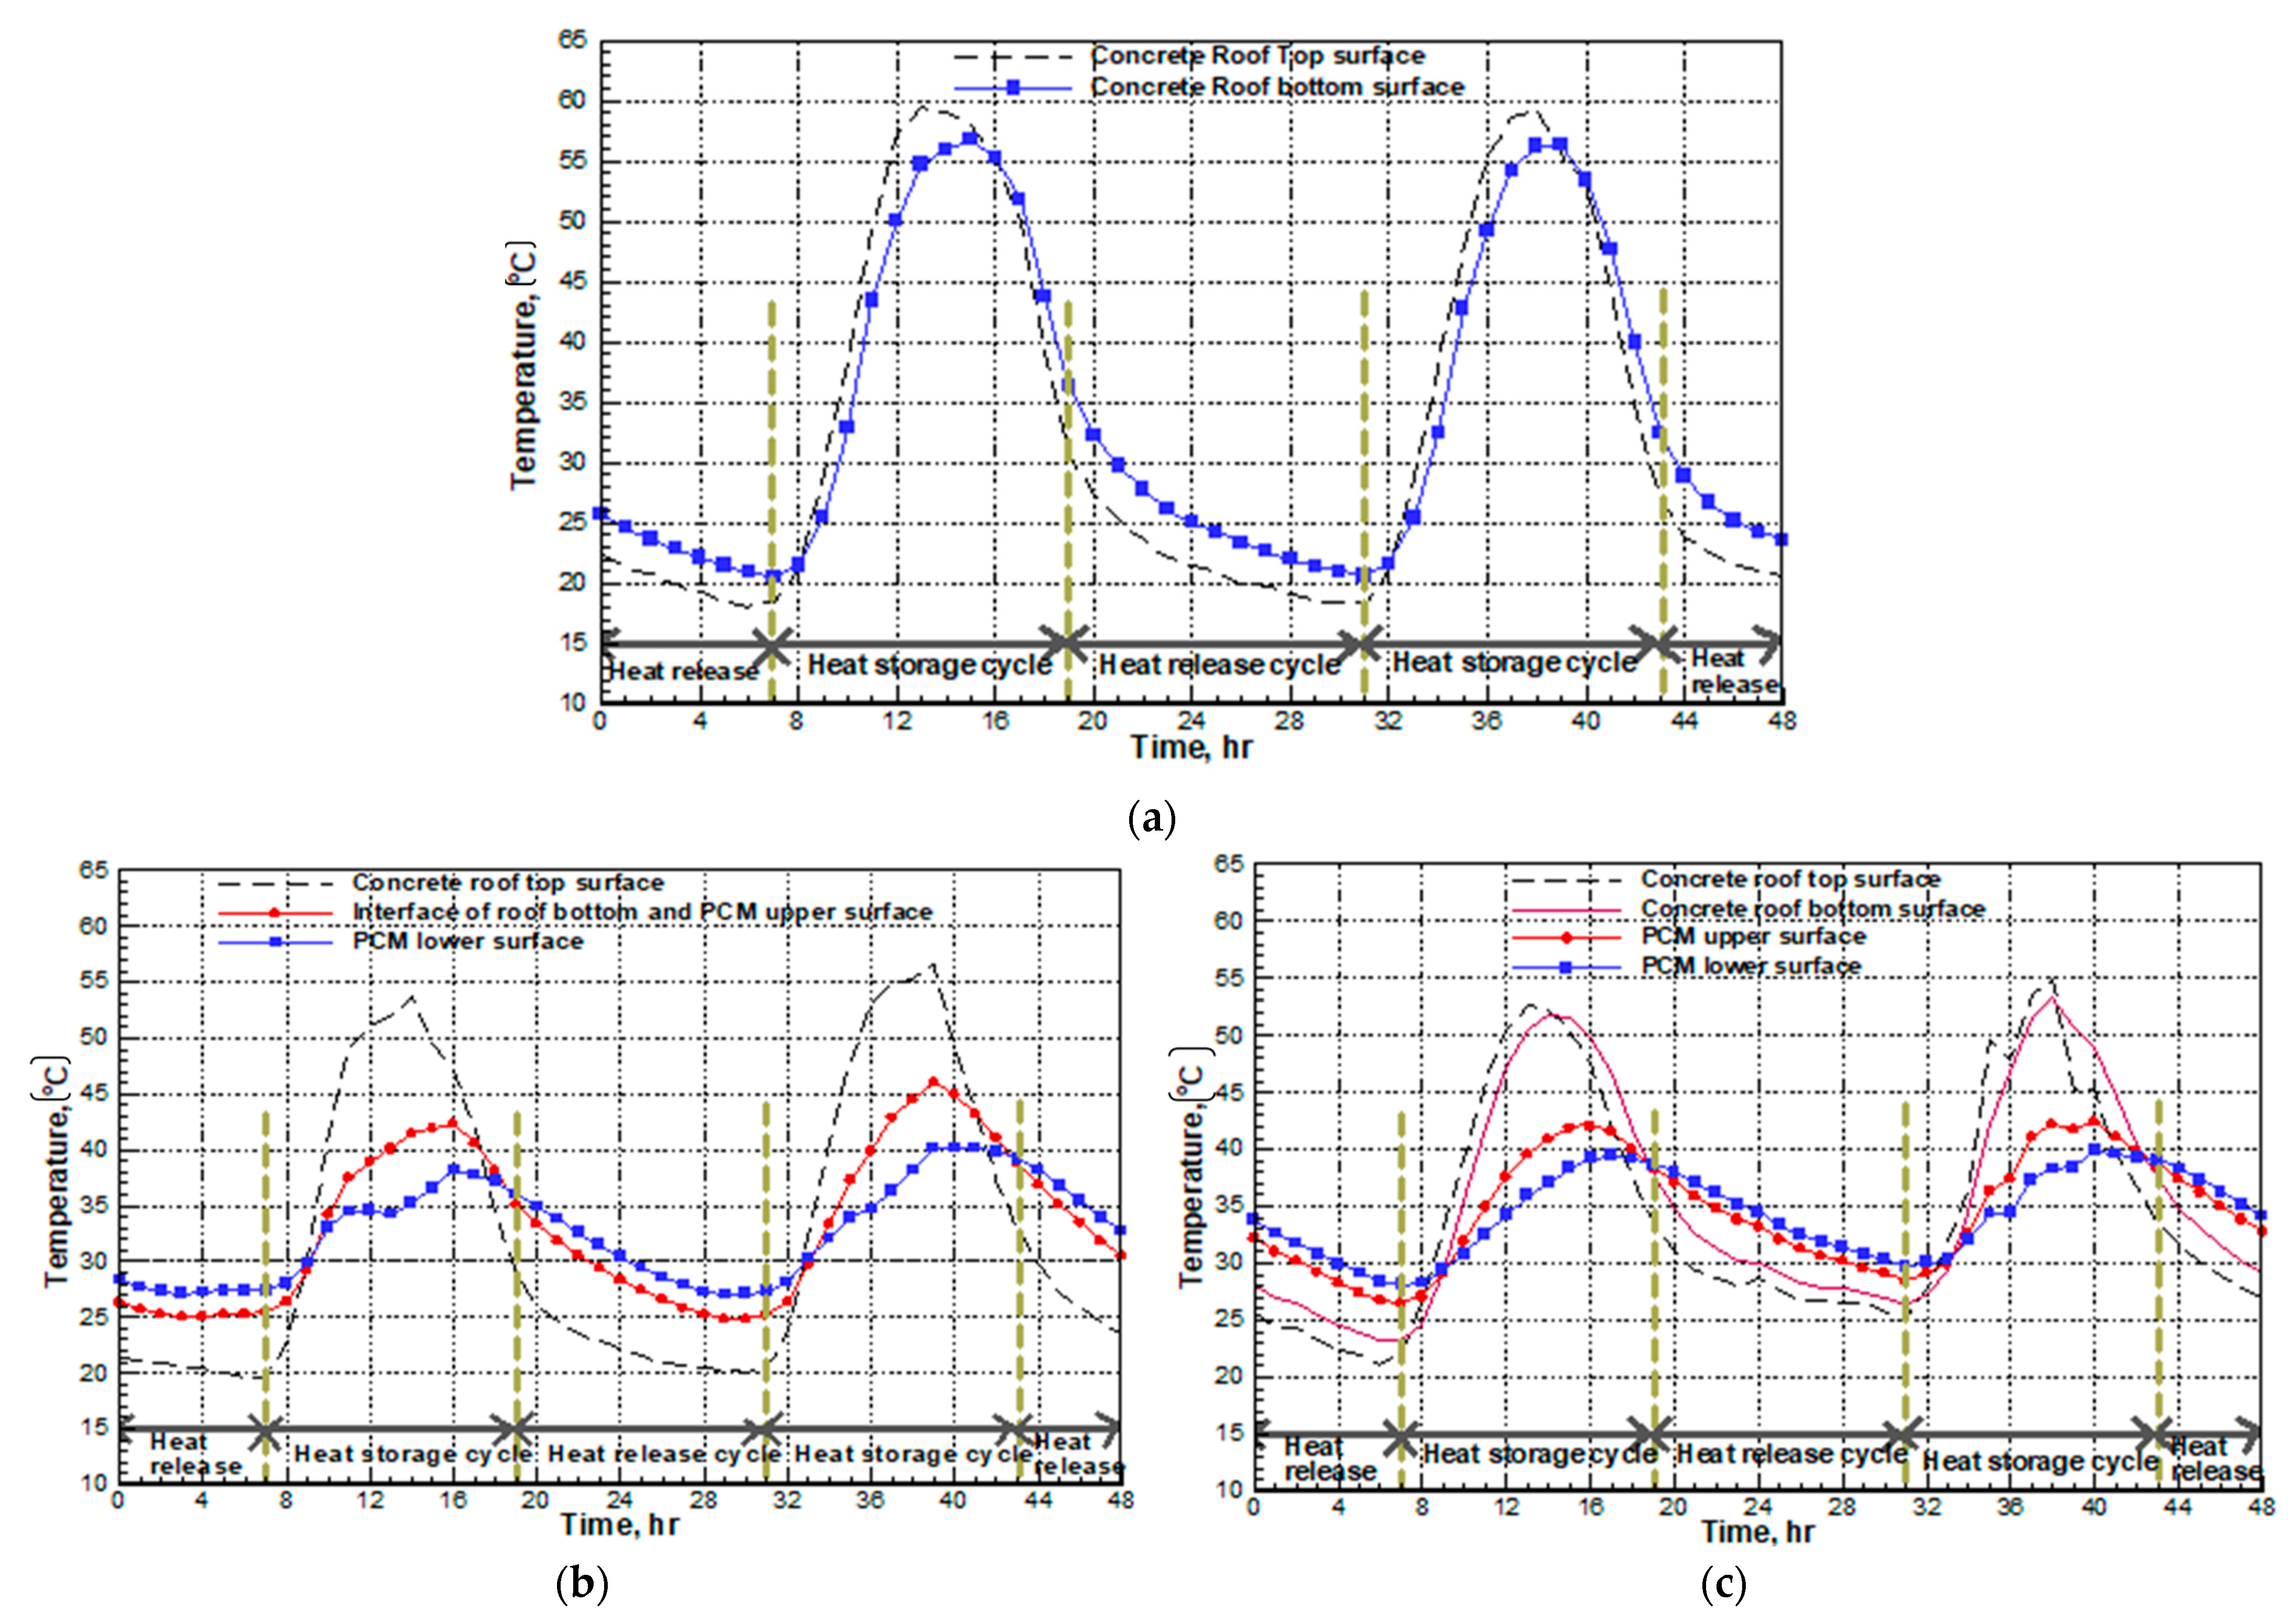
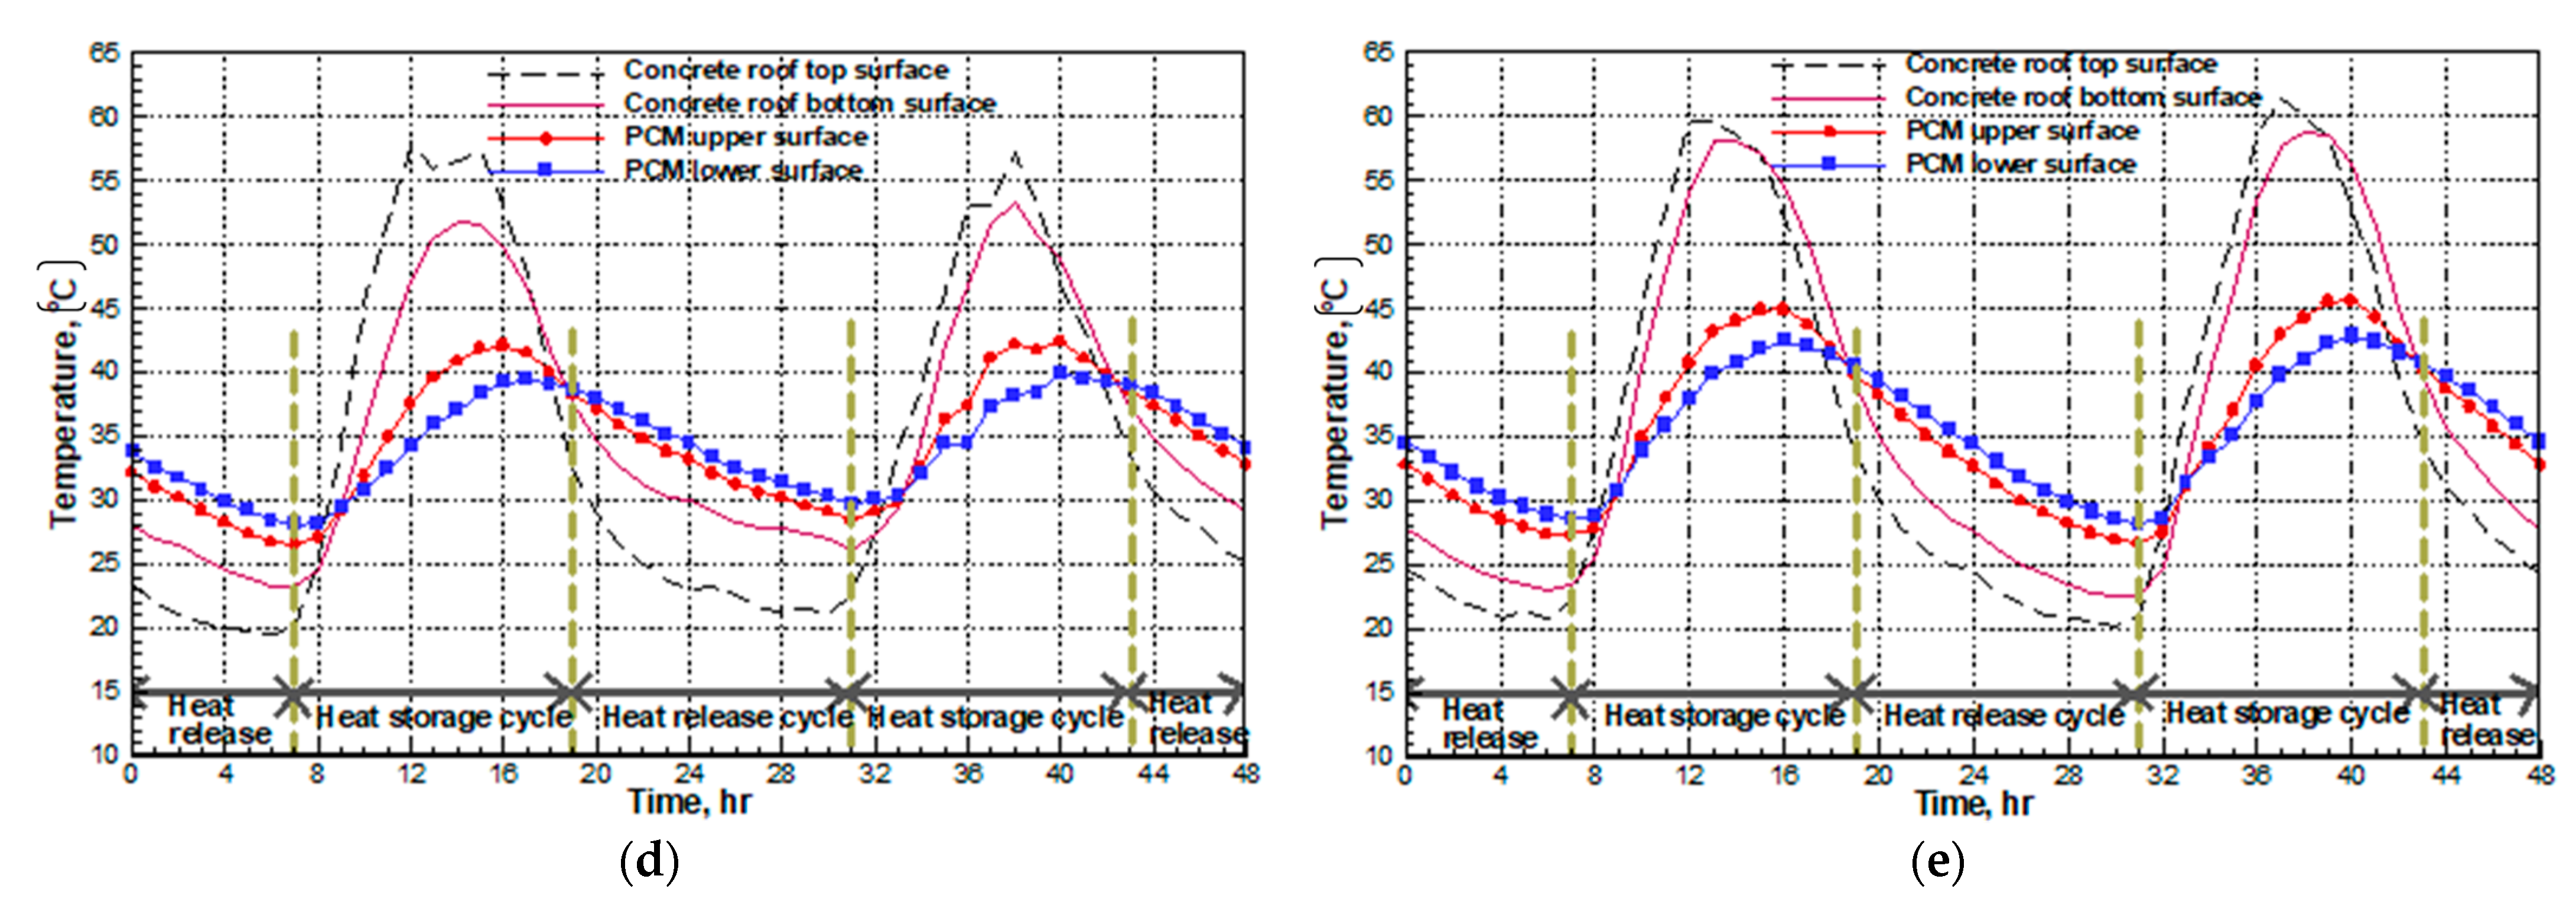
The temperature distribution is studied based on temperatures of different surfaces like rooftop surface, roof bottom surface, PCM upper surface, and PCM lower surface. In Figure 3a–e, the heat storage cycle is established for the diurnal period (7.00 hr in the morning to 20.00 hr in the evening). The heat release cycle is established, on the other hand, during the night hours, i.e., from 19.00 to 24.00 hr and 1.00 to 7.00 hr. During the heat storage cycle, for the two days test cycle, the PCM configuration with no air layer, rooftop surface, interface surface, and PCM lower surface acquires the average maximum temperature of 54.89, 44.03, and 38.88 °C, respectively. In contrast, the average minimum temperature attained during the heat release cycle is 19.88, 25.14, and 27.25 °C, respectively. For other configurations, i.e., PCM with 2, 4, and 6 cm air layer, average maximum and minimum temperatures attained by different surfaces during the heat storage and heat release cycle can be obtained from Figure 3. The time lag, decrement factor, and heat gain are obtained from roof temperature distribution based on the hourly variation in surface temperature and its hourly span. The MKR index is obtained using Equation (5) for different configurations and is tabulated in Table 2.
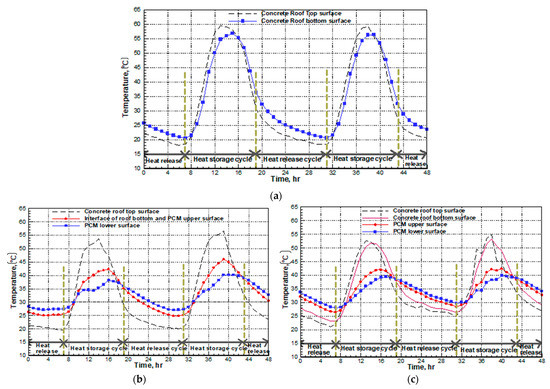
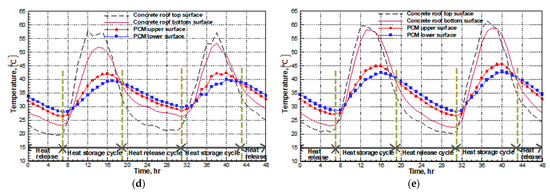
Figure 3.
Temperature distribution across the roof slab. (a) Non-PCM; (b) PCM with 0 cm air layer; (c) PCM with 2 cm air layer; (d) PCM with 4 cm air layer; (e) PCM with 6 cm air layer.
Table 2.
MKR index for all configurations of PCM.
As seen in Table 2, the lowest time lag is registered in the case of a non-PCM room, whereas the maximum time lag is attained in the case of PCM with a 2 cm air layer thickness. Similarly, the lowest decrement factor is seen in the case of PCM with 2 cm air layer thickness, and it is maximum in the case of the room without PCM. In the case of PCM configurations, PCM with 4 cm and 6 cm air layer thickness, there is more diurnal variation in room temperature, which increases the heat gain by these configurations. The heat gain is minimal in PCM with a 2 cm air layer and in PCM with no air layer. Thus, with a lower decrement factor, heat gain, and higher time lag, PCM with 2 cm air layer thickness provides the highest MKR index value compared to other PCM configurations.
Furthermore, in each case, the impact on solar heat gain is assessed for a building with a roof integrated with the PCM. The percentage by which solar heat gain through the envelope is reduced as a result of the presence of the PCM layer is referred to as the envelope solar heat gain reduction rate calculated using Equations (11)–(13).
Table 3 shows the envelope solar heat gain and reduction rate for different configurations.
Table 3.
Solar heat gain and reduction rate for all configurations of PCM.
According to Table 3, it can be shown that the solar heat gain reduction rate for PCM falls somewhere in the range of 72–75%. PCM with a 2 cm air layer shows the highest solar heat gain reduction rate of 75% and hence can be treated as optimum air layer thickness for the application of PCM integrated roof.
4. Conclusions
In the present study, field experiments are conducted to analyze air gap thickness’s effect on the thermal performance of PCM-integrated test rooms. The investigation is carried out for a non-PCM test room, PCM, with an air layer thickness of 0 cm, 2 cm, 4 cm, and 6 cm for the fixed thickness of the PCM layer. The commercially available material HS 29 is used as PCM. The climatic data during different field tests are used to calculate solar air temperature. The results show that the peak value of room temperature difference between the PCM integrated test room and non-PCM test room is between 4 °C to 7 °C. Thus, it is concluded that the PCM integrated test room reduces the diurnal variations in room temperature when compared with the non-PCM test room.
The effect of the air layer between PCM and the roof is also established with the MKR index. However, the PCM thickness is kept constant and the effect of PCM thickness here is not studied. The PCM with 2 cm air layer thickness shows a lower decrement factor, heat gain, and higher time lag. This reflects the highest MKR index, i.e., 8.83, compared to other configurations. Further, solar heat gain reduction rate is also obtained for all configurations. PCM with an air layer has been demonstrated to have a solar heat gain reduction rate between 72% and 75%. The most effective solar heat gain reduction (75%) is shown with a PCM with an air layer of 2 cm. Hence based on maximum peak temperature difference, MKR index, and climatic conditions, PCM with 2 cm air layer thickness is considered the optimum configuration for adjusting diurnal temperature variation in a test room. Therefore, it is concluded that air layer thickness in the PCM-integrated roof can reduce diurnal temperature swings and readily apply to PCM-integrated passive cooling strategies for buildings.
Author Contributions
Conceptualization, D.K.B. and M.K.R.; methodology, D.K.B.; formal analysis, D.K.B.; writing—original draft preparation, D.K.B.; writing—review and editing, M.K.R., J.B. and M.A.; supervision, J.B. and M.A. All authors have read and agreed to the published version of the manuscript.
Funding
This research received no external funding.
Data Availability Statement
No new data were created, or where data is unavailable due to privacy or ethical restrictions.
Conflicts of Interest
The authors declare no conflict of interest.
Nomenclature
| f | Time lag (hr) |
| Dimensionless time lag | |
| Fsky | Shape factor for horizontal surface (=1 for the rooftop slab and sky) |
| h | Heat transfer coefficient, (W/m2 K) |
| I | Solar radiation, (W/m2) |
| PCM | Phase Change Materials |
| q | Heat flux, (W/m2) |
| Q | Solar heat gain, (W/m2) |
| T | Temperature, (K) |
| V | Velocity, (m/s) |
| Vo | Volume, (m3) |
| Greek Letters | |
| α | |
| ε | Emissivity of rooftop slab |
| ϕ | Decrement factor |
| Dimensionless decrement factor | |
| σ | Stefan Boltzmann constant, (W/m2 K4) |
| Subscript | |
| B | Brick |
| C | Concrete |
| combined | Combined radiative and convective conditions |
| ceiling | Ceiling conditions |
| d | Direct solar radiation |
| i | Indoor conditions |
| o | Ambient or outdoor conditions |
| P | PCM |
| roof | Roof conditions |
| sky | Clear sky conditions |
| sol-air | Solar air |
Appendix A
To measure the melting point, latent heat of fusion, and specific heat of HS29, DSC analysis is carried out. The graph obtained through the DSC is shown in Figure A1.
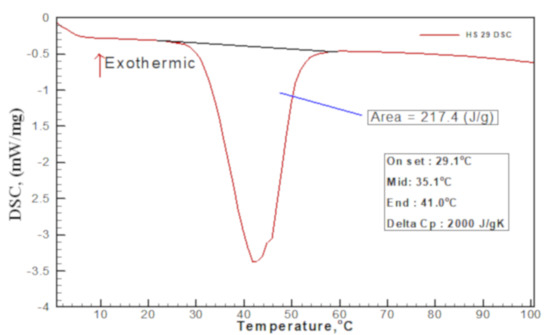
Figure A1.
DSC measurement for HS 29.
Figure A1.
DSC measurement for HS 29.
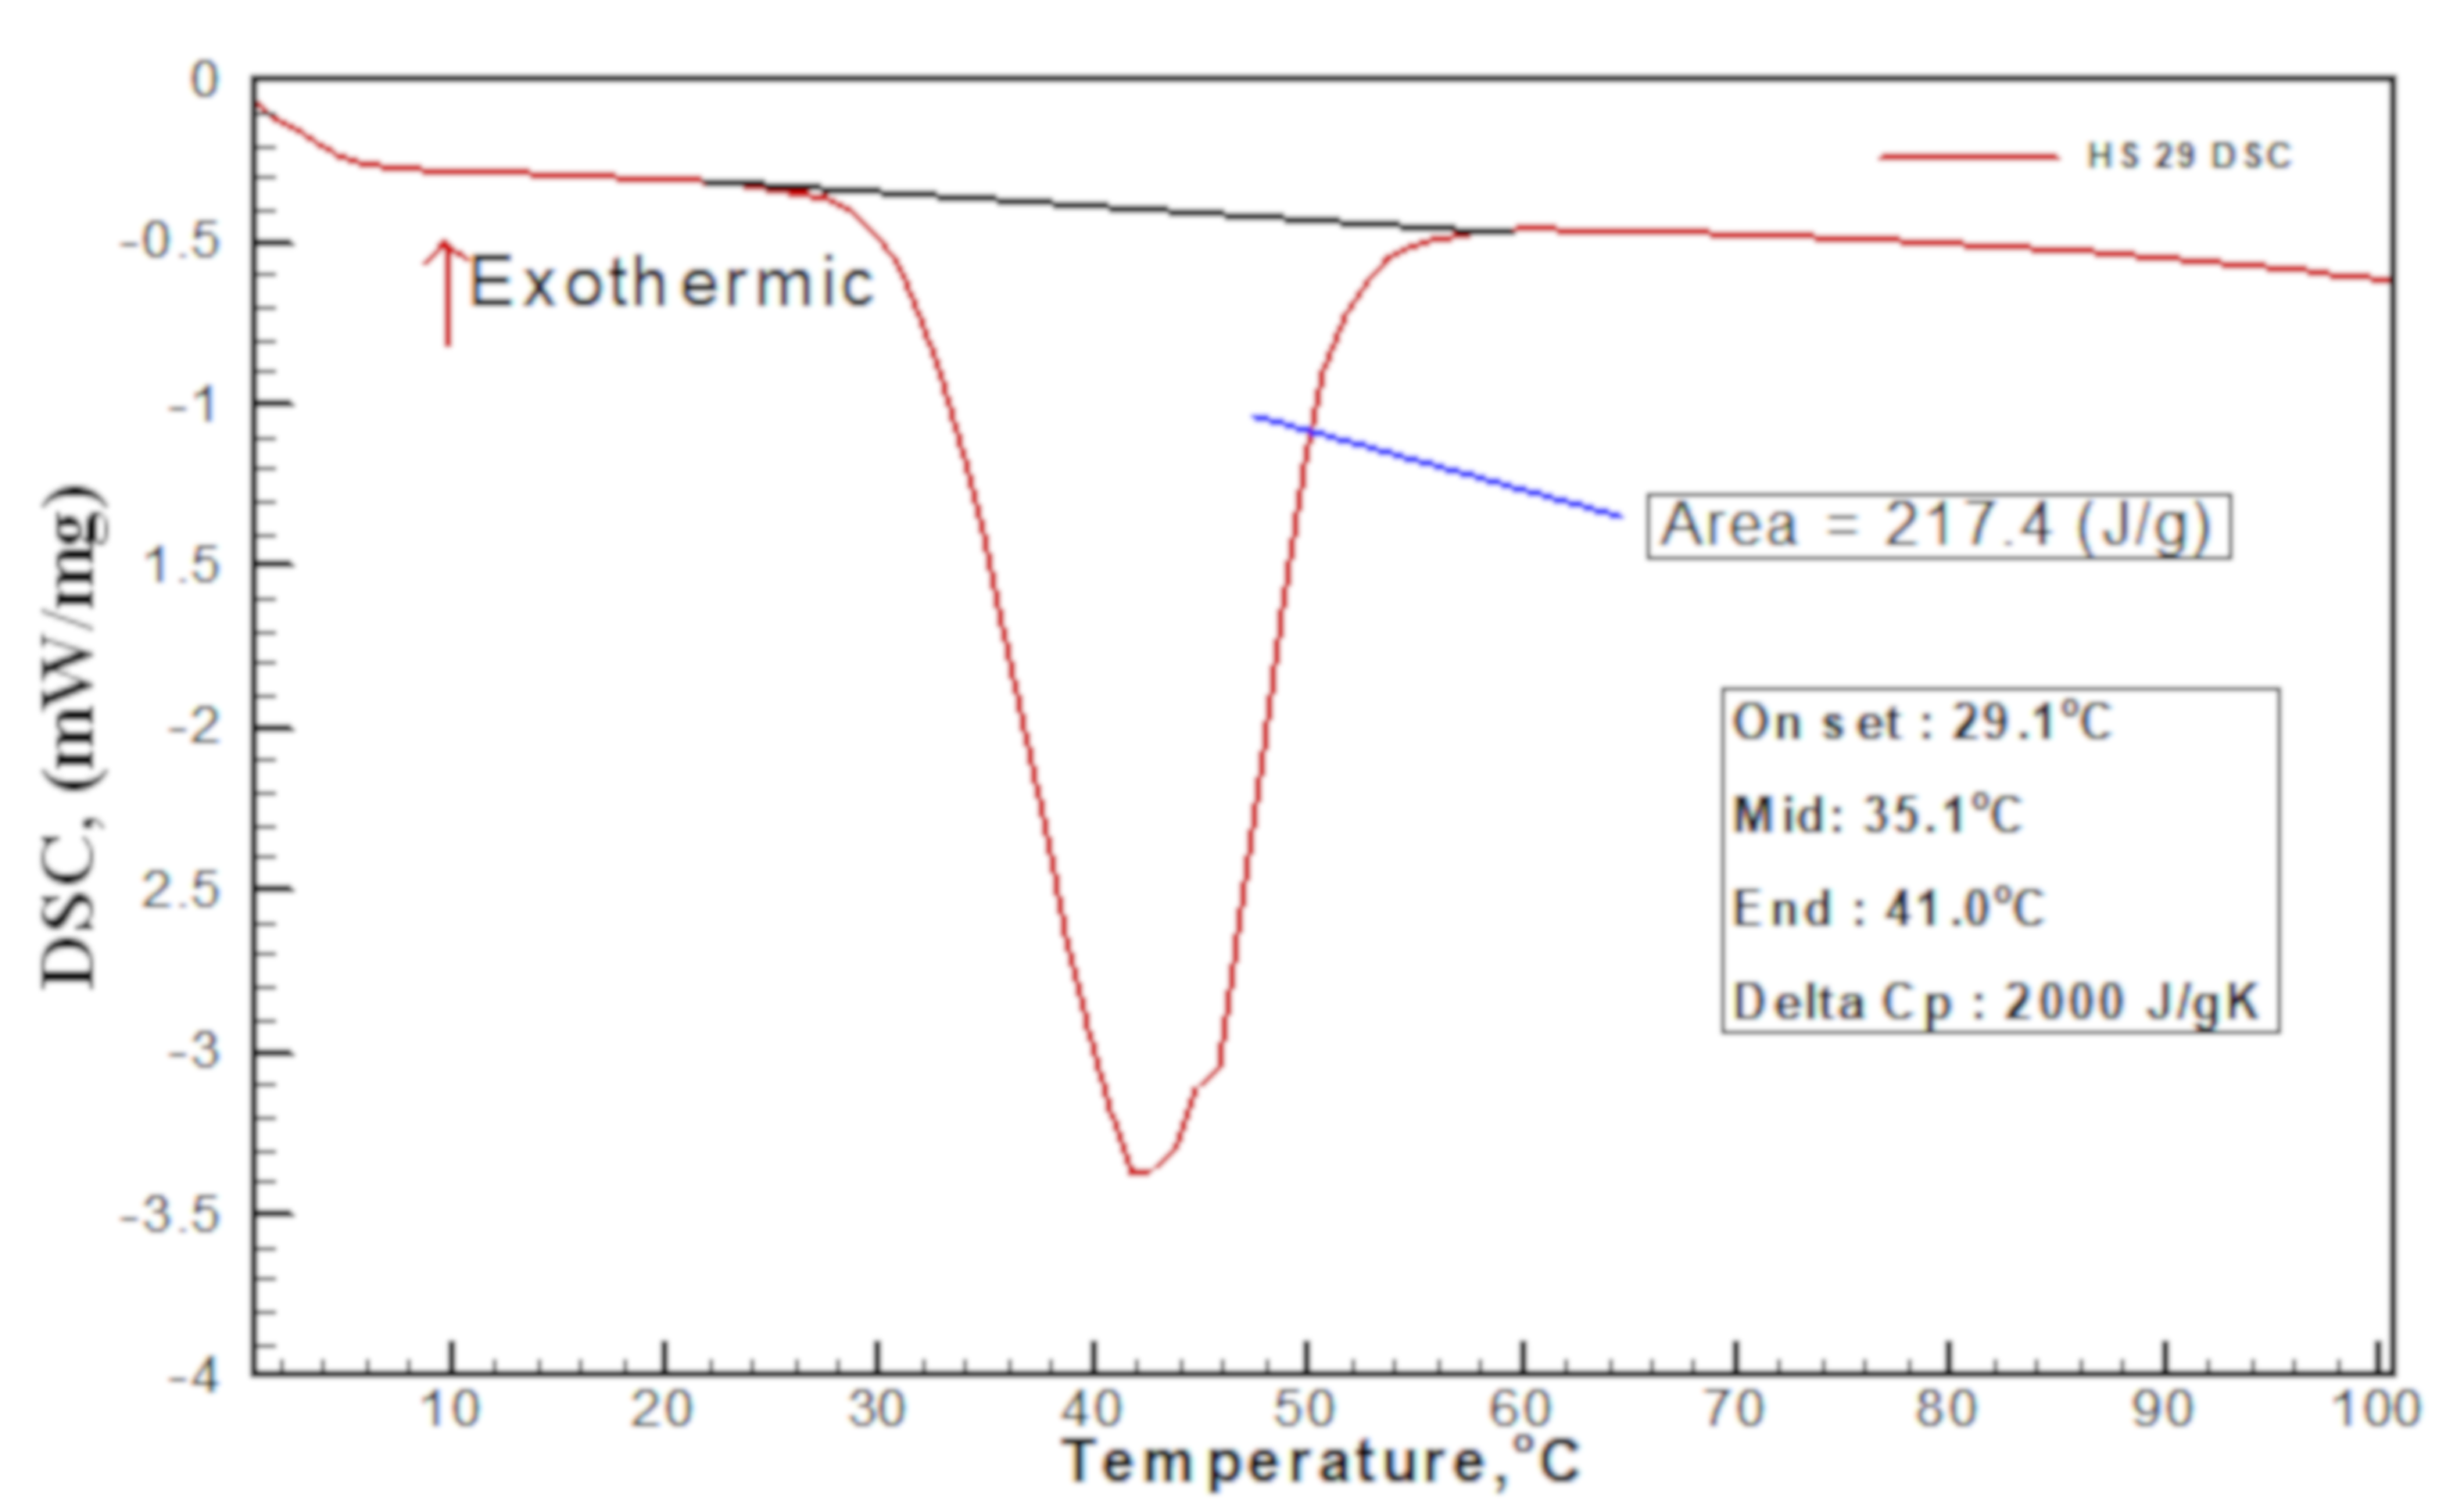
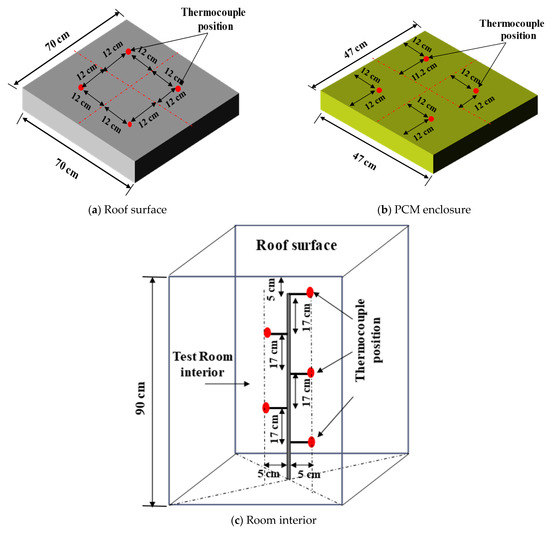
Figure A2.
Position of thermocouples.
Figure A2.
Position of thermocouples.

References
- International Energy Agency. CO2 Emissions From Fuel Combustion: Highlights; IEA Publication: Paris, France, 2012. [Google Scholar]
- 2013 April. Annual Energy Outlook 2013 with Projections to 2040; Energy Information Administration: Washington, DC, USA, 2013.
- Lei, J.; Yang, J.; Yang, E.-H. Energy performance of building envelopes integrated with phase change materials for cooling load reduction in tropical Singapore. Appl. Energy 2016, 162, 207–217. [Google Scholar] [CrossRef]
- Dehkordi, B.S.; Afrand, M. Energy-saving owing to using PCM into buildings: Considering of hot and cold climate region. Sustain. Energy Technol. Assess. 2022, 52, 102112. [Google Scholar]
- BBland, A.; Khzouz, M.; Statheros, T.; Gkanas, E.I. PCMs for Residential Building Applications: A Short Review Focused on Disadvantages and Proposals for Future Development. Buildings 2017, 7, 78. [Google Scholar] [CrossRef]
- Al-Sanea, S.A.; Zedan, M.; Al-Ajlan, S.A.; Hadi, A.S.A. Heat Transfer Characteristics and Optimum Insulation Thickness for Cavity Walls. J. Therm. Envel. Build. Sci. 2003, 26, 285–307. [Google Scholar] [CrossRef]
- Jamal, B.; Boukendil, M.; Abdelbaki, A.; Zrikem, Z. Numerical simulation of coupled heat transfer through double solid walls separated by an air layer. Int. J. Therm. Sci. 2020, 156, 106461. [Google Scholar] [CrossRef]
- Mahlia, T.; Iqbal, A. Cost benefits analysis and emission reductions of optimum thickness and air gaps for selected insulation materials for building walls in Maldives. Energy 2010, 35, 2242–2250. [Google Scholar] [CrossRef]
- Mavromatidis, L.E.; Bykalyuk, A.; El Mankibi, M.; Michel, P.; Santamouris, M. Numerical estimation of air gaps’ influence on the insulating performance of multilayer thermal insulation. Build. Environ. 2012, 49, 227–237. [Google Scholar] [CrossRef]
- Kurt, H. The usage of air gap in the composite wall for energy saving and air pollution. Environ. Prog. Sustain. Energy 2010, 30, 450–458. [Google Scholar] [CrossRef]
- Bhamare, D.K.; Rathod, M.K.; Banerjee, J. Passive cooling techniques for building and their applicability in different climatic zones—The state of art. Energy Build. 2019, 198, 467–490. [Google Scholar] [CrossRef]
- Rathod, M.K.; Banerjee, J. Thermal stability of phase change materials used in latent heat energy storage systems: A review. Renew. Sustain. Energy Rev. 2013, 18, 246–258. [Google Scholar] [CrossRef]
- Saffari, M.; Roe, C.; Finn, D.P. Improving the building energy flexibility using PCM-enhanced envelopes. Appl. Therm. Eng. 2022, 217, 119092. [Google Scholar] [CrossRef]
- Ascione, F.; Bianco, N.; De Masi, R.F.; de’ Rossi, F.; Vanoli, G.P. Energy refurbishment of existing buildings through the use of phase change materials: Energy savings and indoor comfort in the cooling season. Appl. Energy 2014, 113, 990–1007. [Google Scholar] [CrossRef]
- Alshuraiaan, B. Efficient utilization of PCM in building envelope in a hot environment condition. Int. J. Thermofluids 2022, 16, 100205. [Google Scholar] [CrossRef]
- Li, D.; Zheng, Y.; Liu, C.; Wu, G. Numerical analysis on thermal performance of roof contained PCM of a single residential building. Energy Convers. Manag. 2015, 100, 147–156. [Google Scholar] [CrossRef]
- Tokuç, A.; Başaran, T.; Yesügey, S.C. An experimental and numerical investigation on the use of phase change materials in building elements: The case of a flat roof in Istanbul. Energy Build. 2015, 102, 91–104. [Google Scholar] [CrossRef]
- Saffari, M.; de Gracia, A.; Ushak, S.; Cabeza, L.F. Economic impact of integrating PCM as passive system in buildings using Finger comfort model. Energy Build. 2016, 112, 159–172. [Google Scholar] [CrossRef]
- Singh, S.; Bhat, V. Performance evaluation of dual phase change material gypsum board for the reduction of temperature swings in a building prototype in composite climate. Energy Build. 2018, 159, 191–200. [Google Scholar] [CrossRef]
- Arıcı, M.; Bilgin, F.; Nižetić, S.; Karabay, H. PCM integrated to external building walls: An optimization study on maximum activation of latent heat. Appl. Therm. Eng. 2019, 165, 114560. [Google Scholar] [CrossRef]
- Jin, X.; Medina, M.; Zhang, X. On the importance of the location of PCMs in building walls for enhanced thermal performance. Appl. Energy 2013, 106, 72–78. [Google Scholar] [CrossRef]
- Khedher, B. Numerical Study of the Thermal Behavior of a Composite Phase Change Material (PCM) Room. Eng. Technol. Appl. Sci. Res. 2018, 8, 2663–2667. [Google Scholar] [CrossRef]
- Lee, K.O.; Medina, M.A.; Raith, E.; Sun, X. Assessing the integration of a thin phase change material (PCM) layer in a residential building wall for heat transfer reduction and management. Appl. Energy 2015, 137, 699–706. [Google Scholar] [CrossRef]
- Lagou, A.; Kylili, A.; Šadauskienė, J.; Fokaides, P.A. Numerical investigation of phase change materials (PCM) optimal melting properties and position in building elements under diverse conditions. Constr. Build. Mater. 2019, 225, 452–464. [Google Scholar] [CrossRef]
- Pasupathy, A.; Velraj, R. Effect of double layer phase change material in building roof for year round thermal management. Energy Build. 2007, 40, 193–203. [Google Scholar] [CrossRef]
- Jin, X.; Zhang, X. Thermal analysis of a double layer phase change material floor. Appl. Therm. Eng. 2011, 31, 1576–1581. [Google Scholar] [CrossRef]
- Bhamare, D.K.; Rathod, M.K.; Banerjee, J. Numerical model for evaluating thermal performance of residential building roof integrated with inclined phase change material (PCM) layer. J. Build. Eng. 2019, 28, 101018. [Google Scholar] [CrossRef]
- Bhamare, D.K.; Rathod, M.K.; Banerjee, J. Proposal of a unique index for selection of optimum phase change material for effective thermal performance of a building envelope. Sol. Energy 2021, 218, 129–141. [Google Scholar] [CrossRef]
- Available online: https://www.pluss.co.in/technical-datasheets/Doc304-TDS-HS-29.pdf (accessed on 7 February 2023).
- Tchinda, R. Thermal behaviour of solar air heater with compound parabolic concentrator. Energy Convers. Manag. 2008, 49, 529–540. [Google Scholar] [CrossRef]
- EnergyPlus, Engineering References. 2013. Available online: http://apps1.eere.energy.gov/buildings/energyplus/energyplus_documentation.cfm (accessed on 7 February 2023).
- Bhamare, D.K.; Rathod, M.K.; Banerjee, J. Selection of phase change material and establishment of thermophysical properties of phase change material integrated with roof of a building using Measure of Key Response index: Proposal of a new parameter. J. Energy Storage 2020, 32, 101812. [Google Scholar] [CrossRef]
- Kong, X.; Lu, S.; Li, Y.; Huang, J.; Liu, S. Numerical study on the thermal performance of building wall and roof incorporating phase change material panel for passive cooling application. Energy Build. 2014, 81, 404–415. [Google Scholar] [CrossRef]
Disclaimer/Publisher’s Note: The statements, opinions and data contained in all publications are solely those of the individual author(s) and contributor(s) and not of MDPI and/or the editor(s). MDPI and/or the editor(s) disclaim responsibility for any injury to people or property resulting from any ideas, methods, instructions or products referred to in the content. |
© 2023 by the authors. Licensee MDPI, Basel, Switzerland. This article is an open access article distributed under the terms and conditions of the Creative Commons Attribution (CC BY) license (https://creativecommons.org/licenses/by/4.0/).