
Damage Identification in Reinforced Concrete Beams Using Wavelet Transform of Modal Excitation Responses
 , , , and
Abstract
:1. Introduction
2. Research Significance
3. Selected Wavelet Families
4. Assessing the Location and Severities of Damage Scenarios
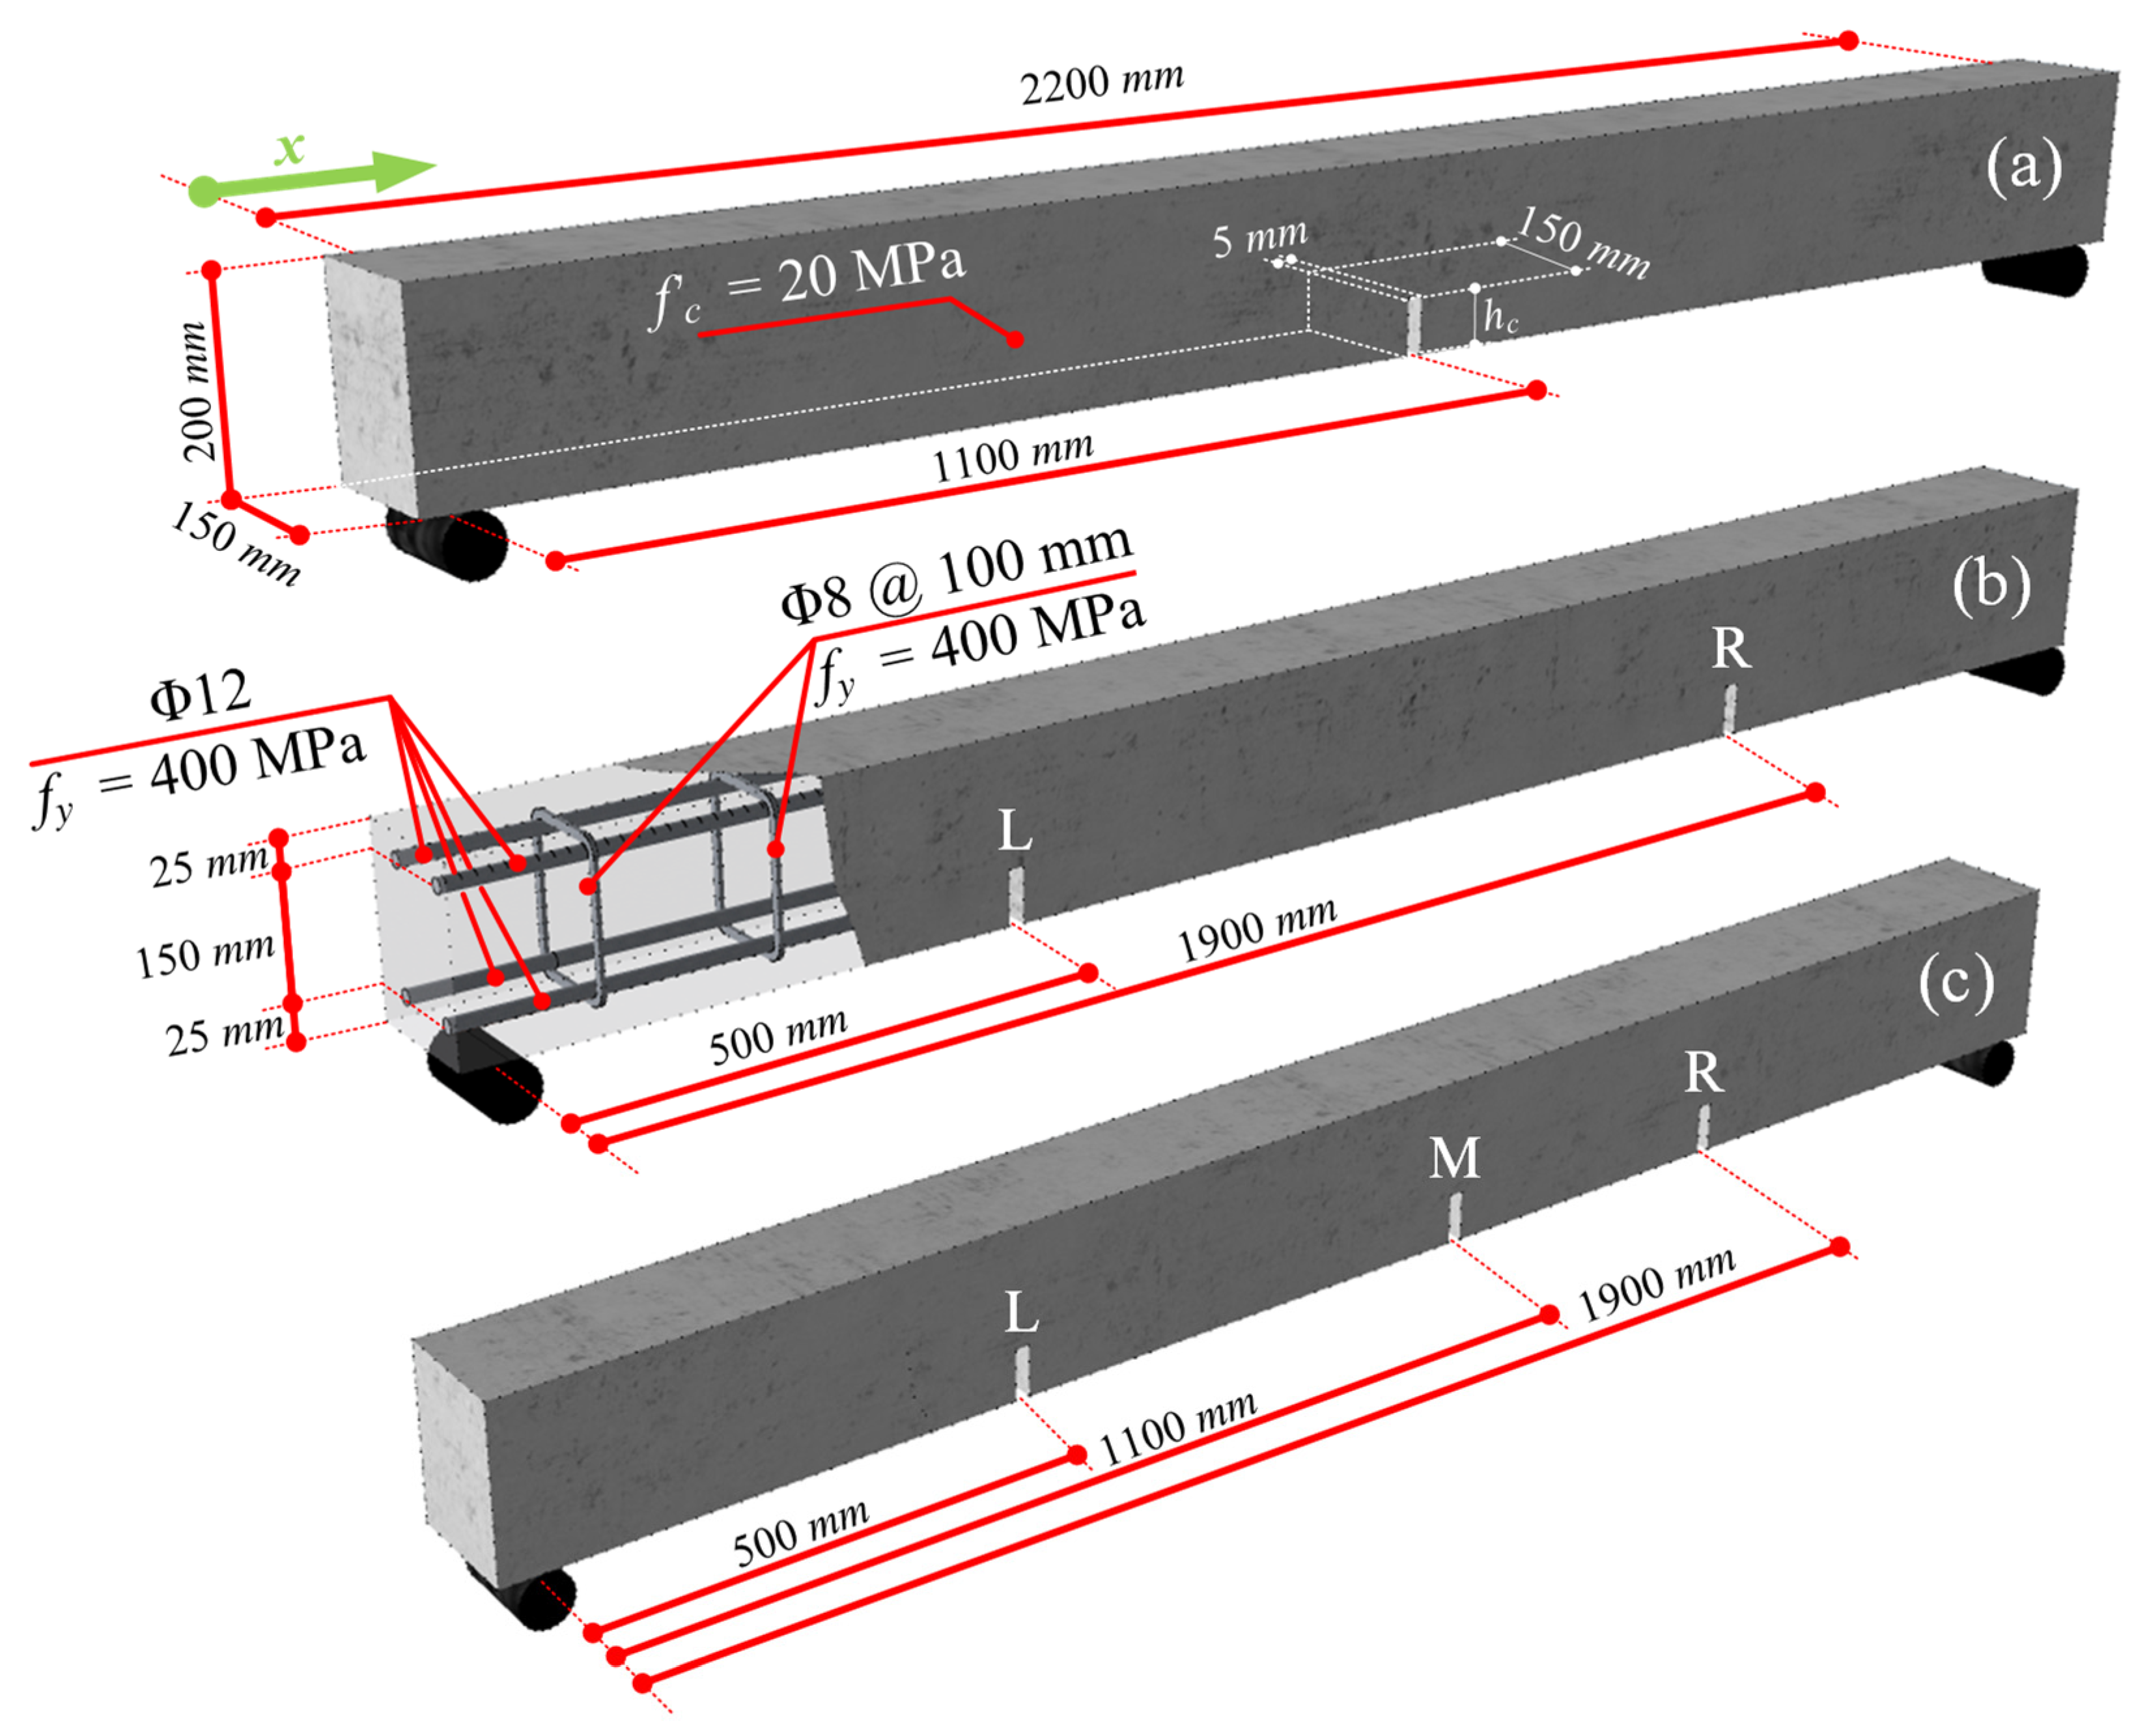
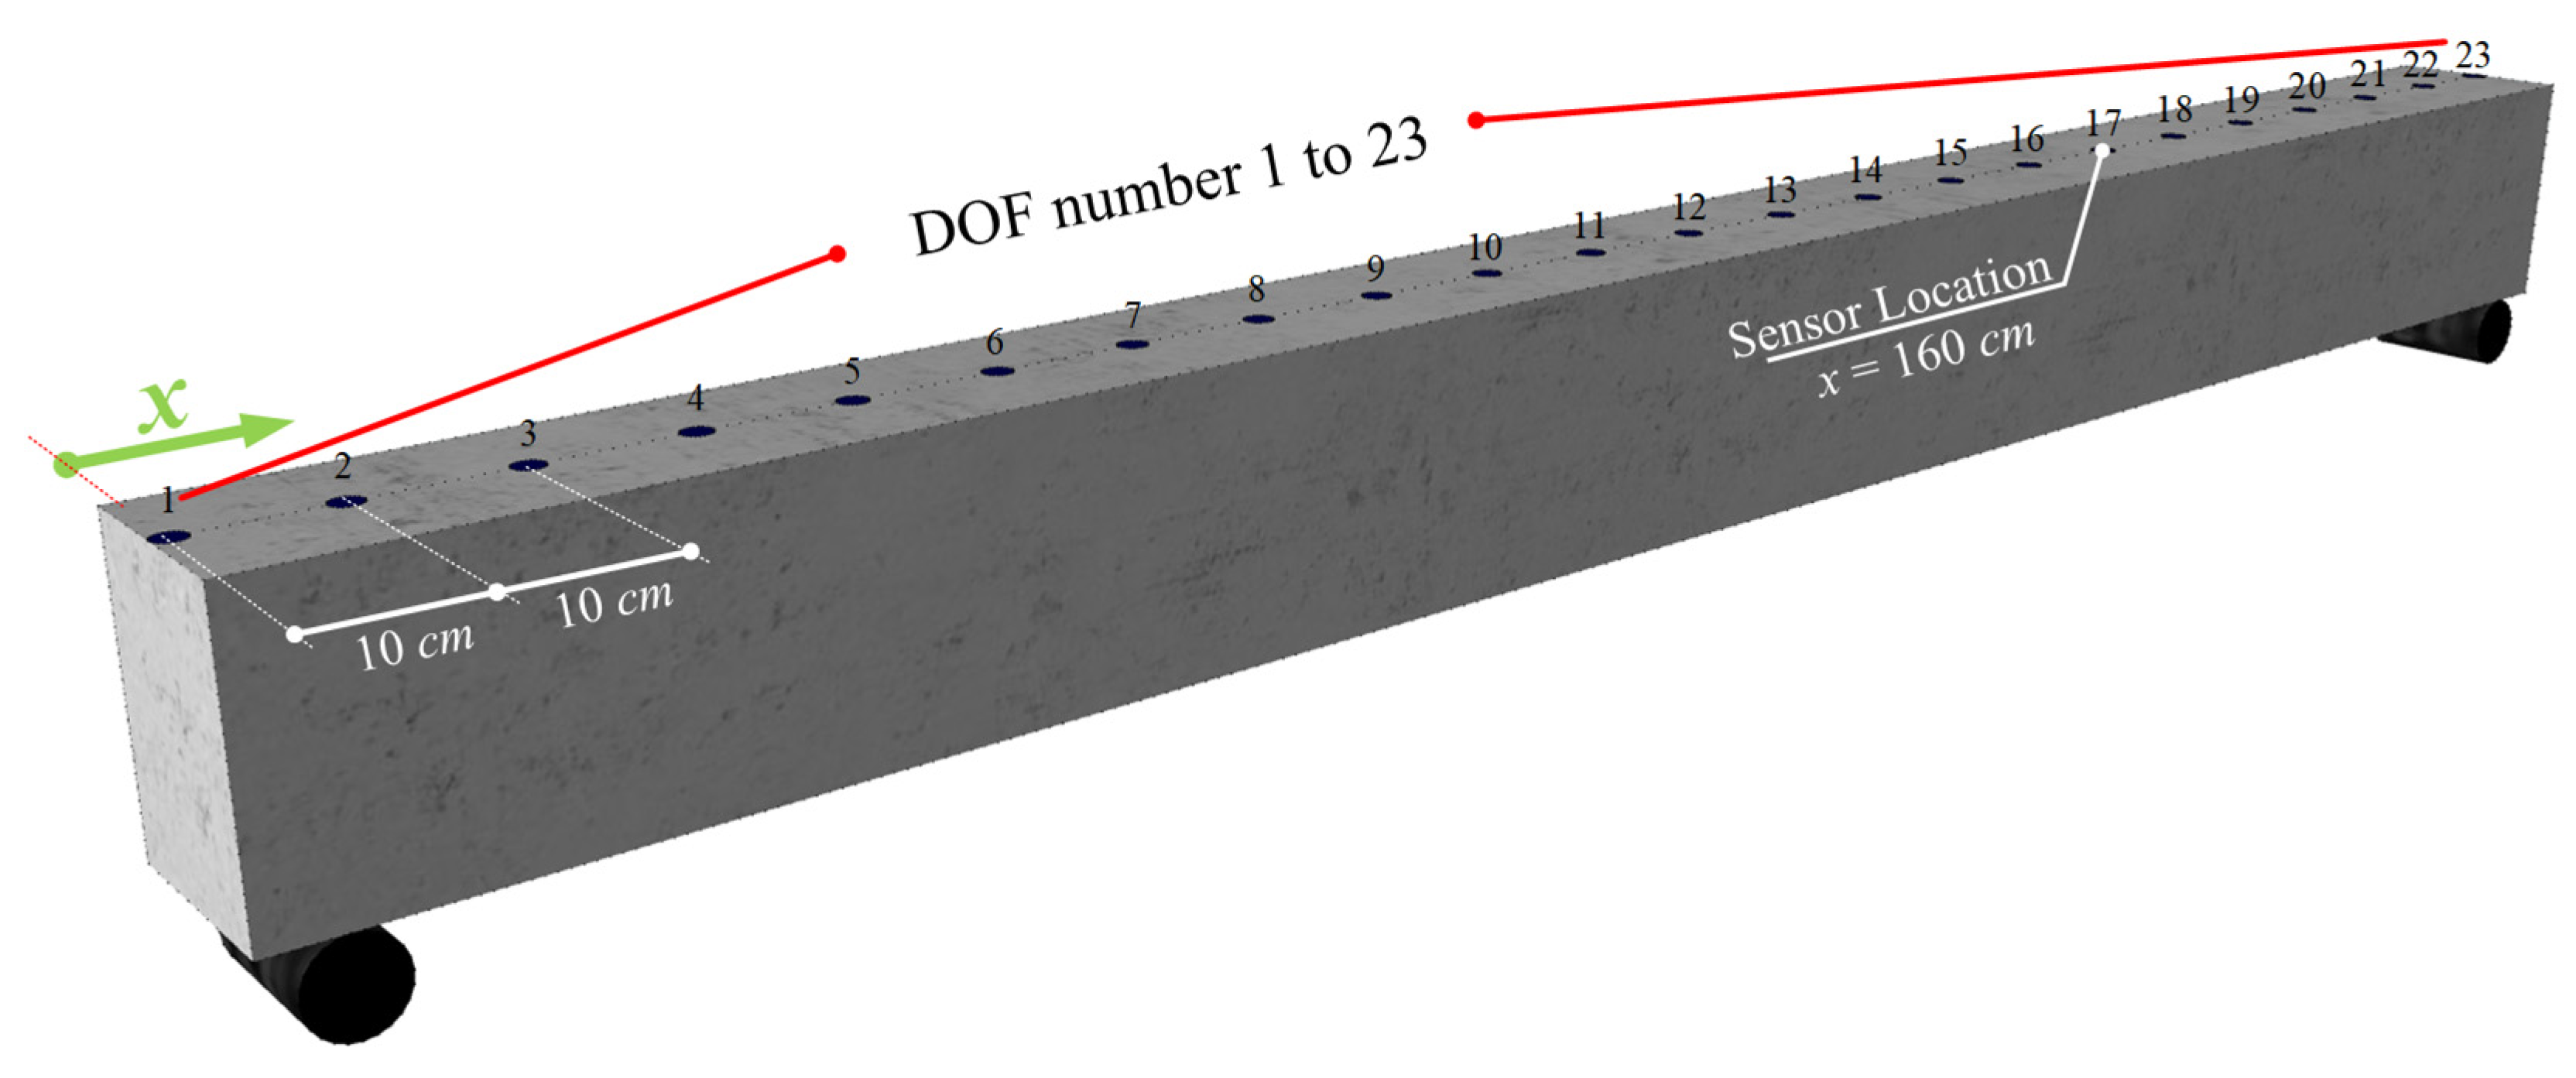
4.1. Experimental-Based Numerical Models
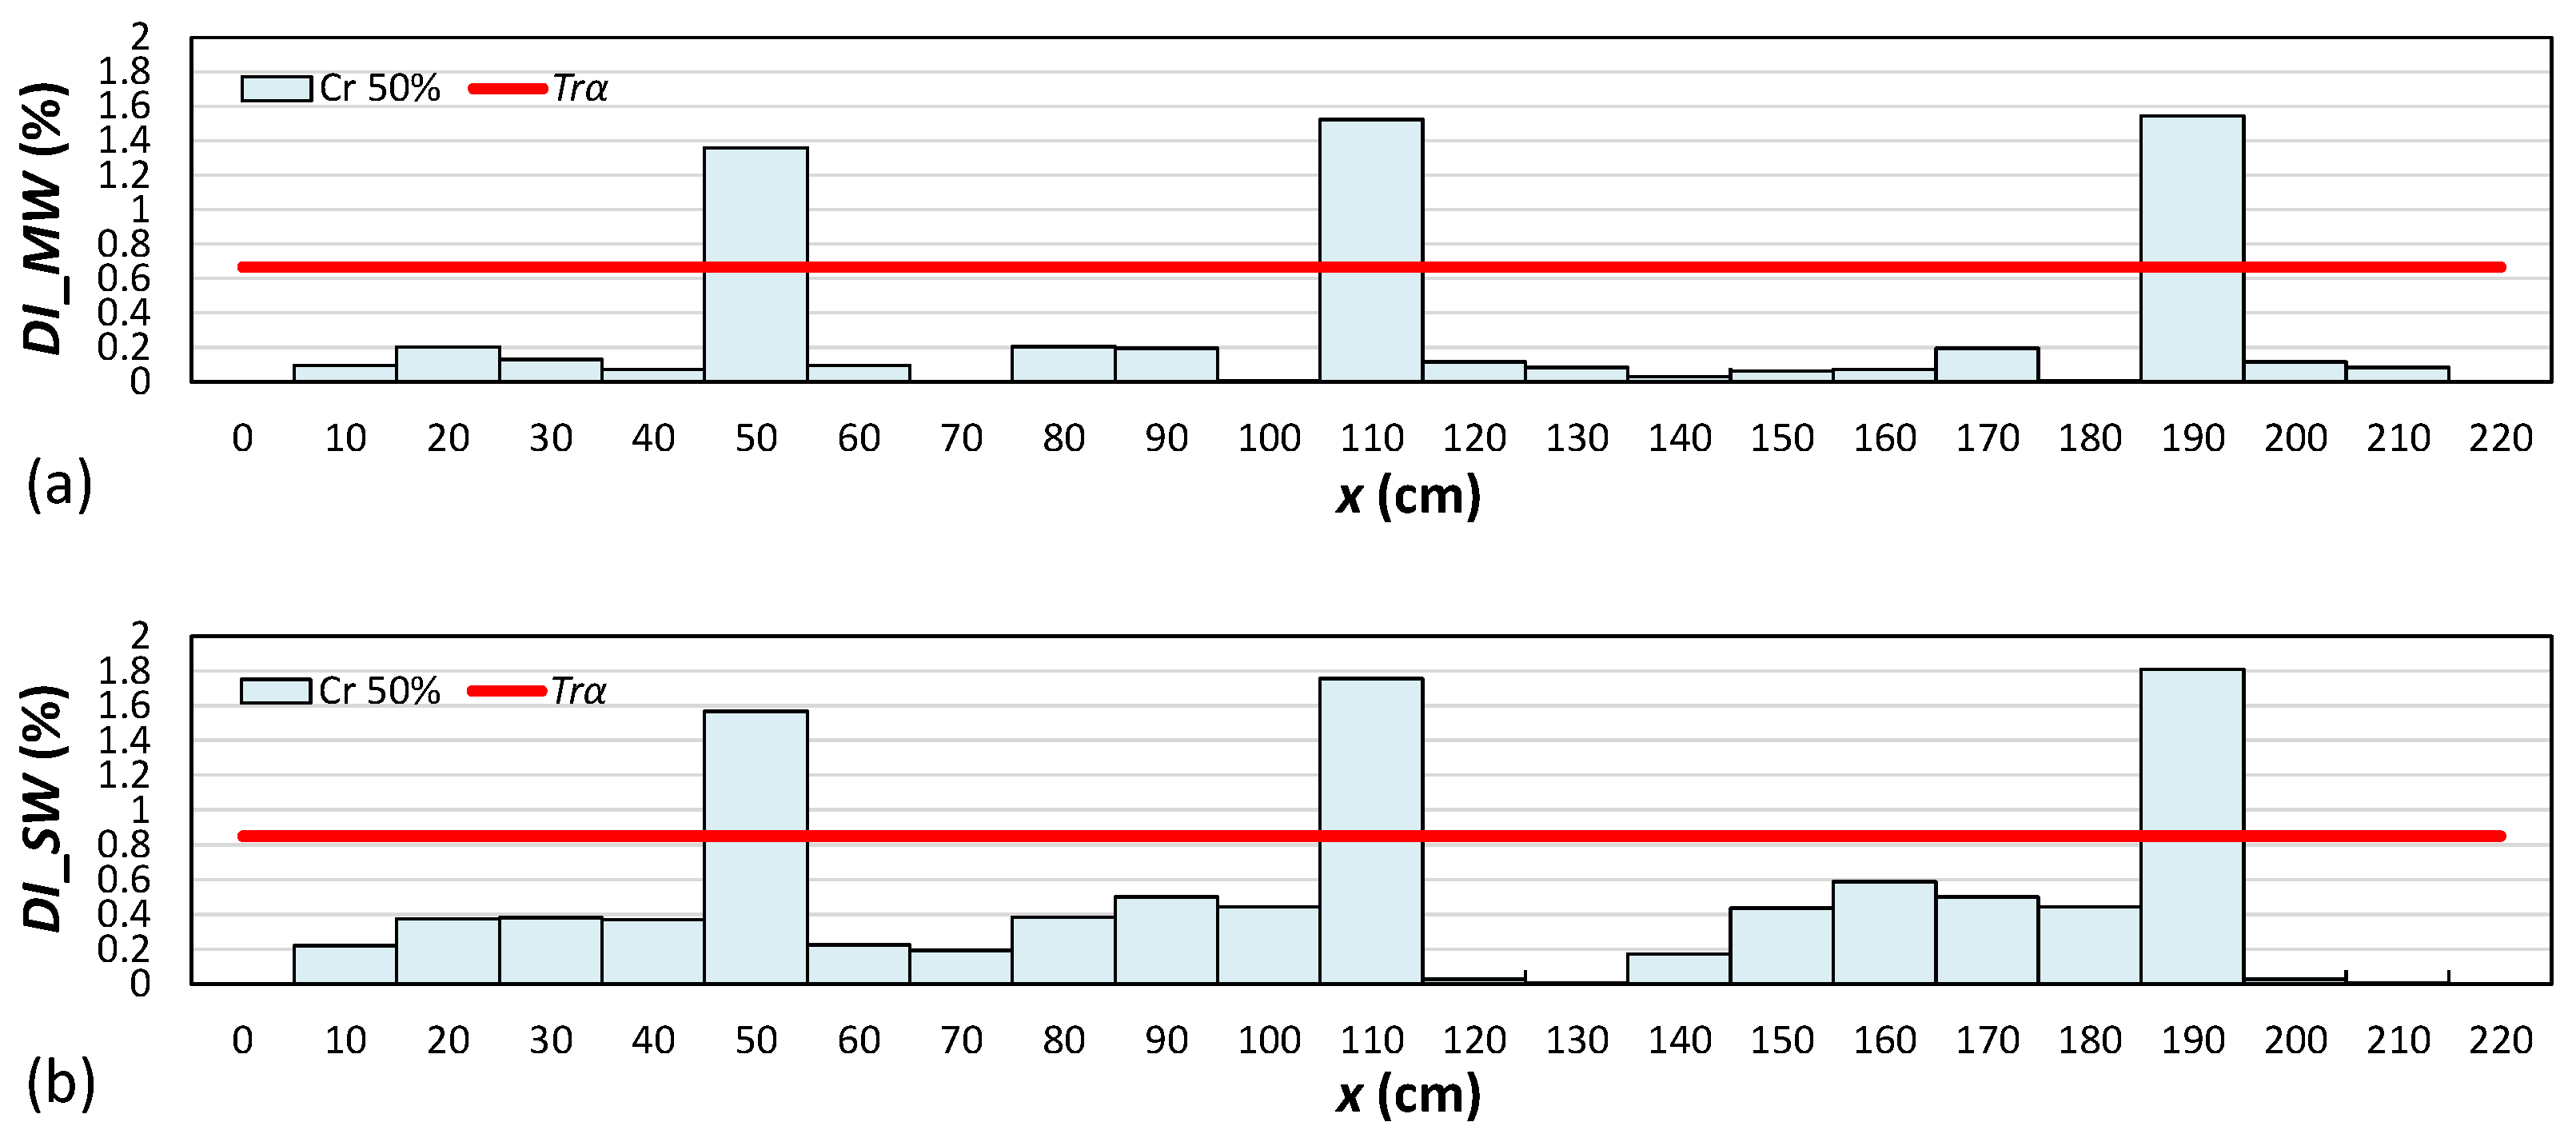
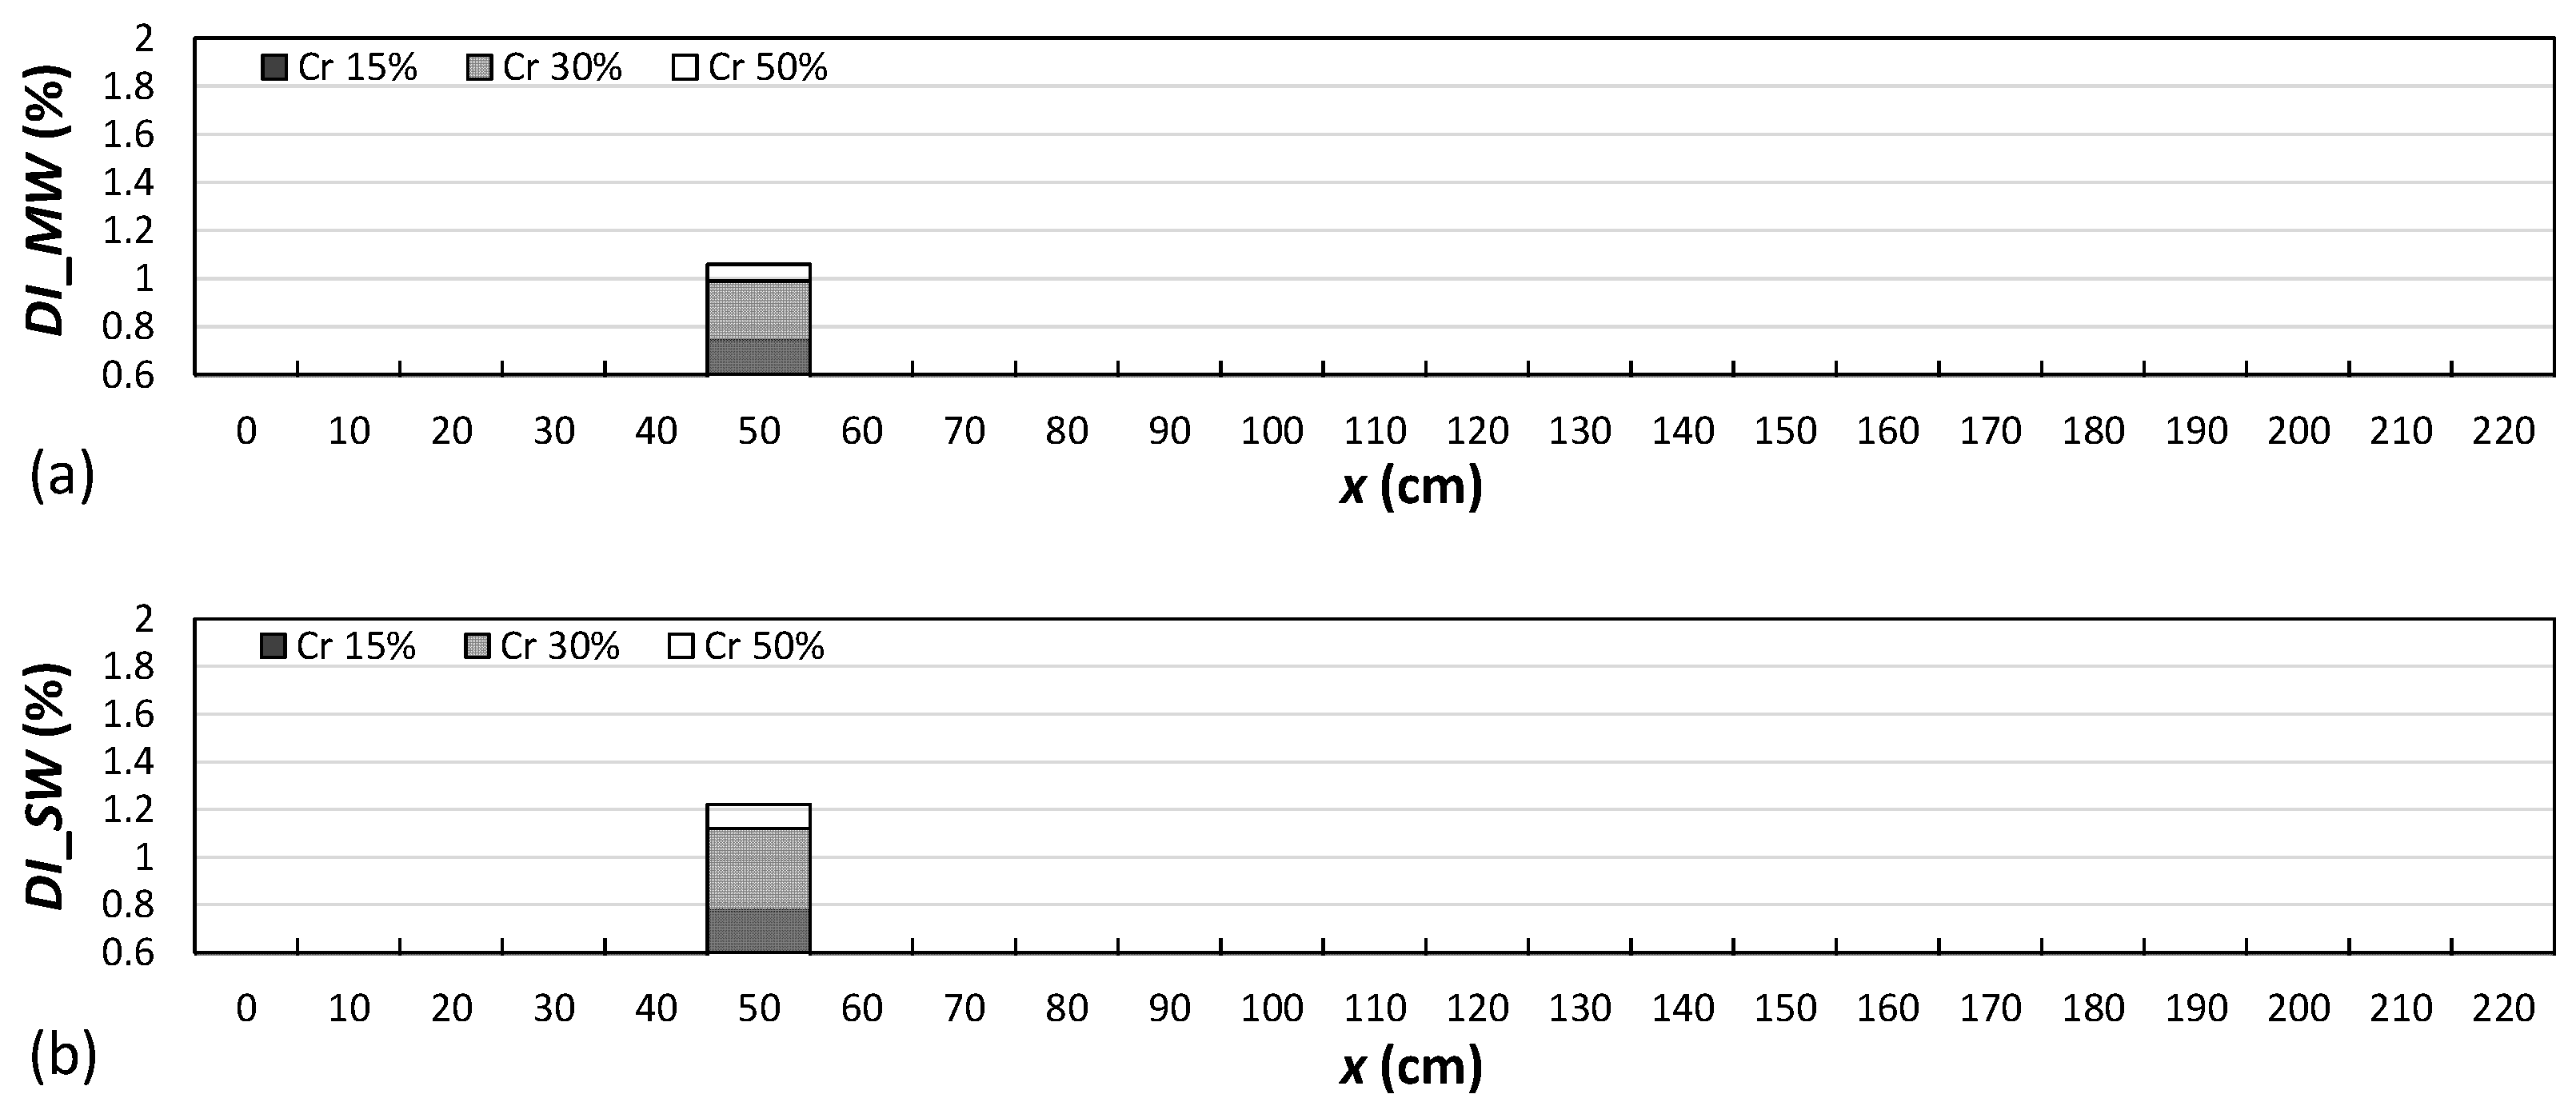
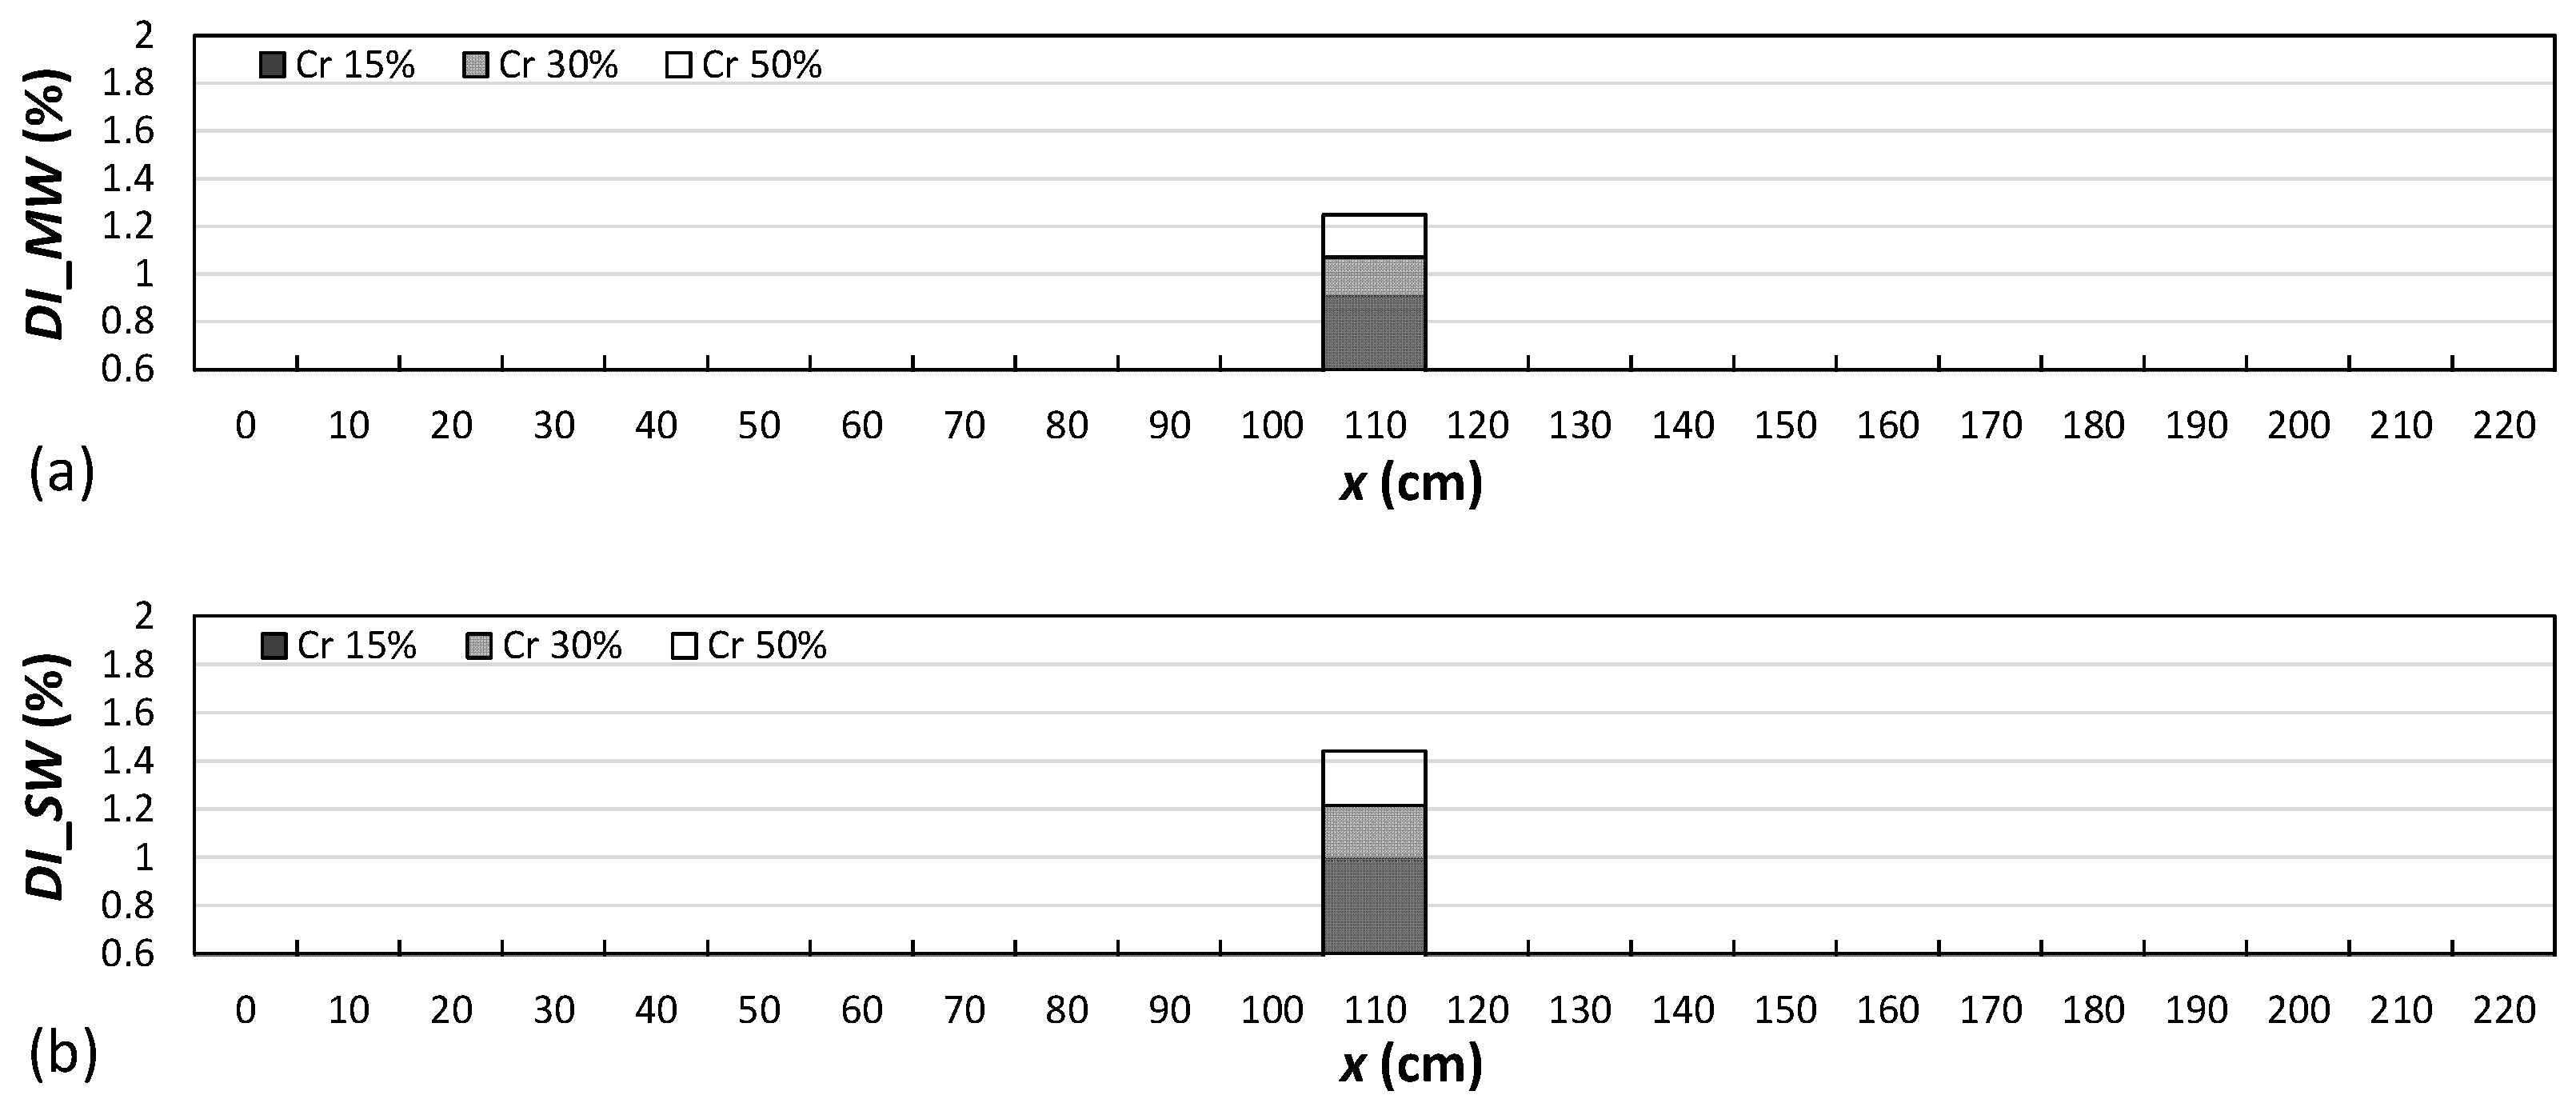
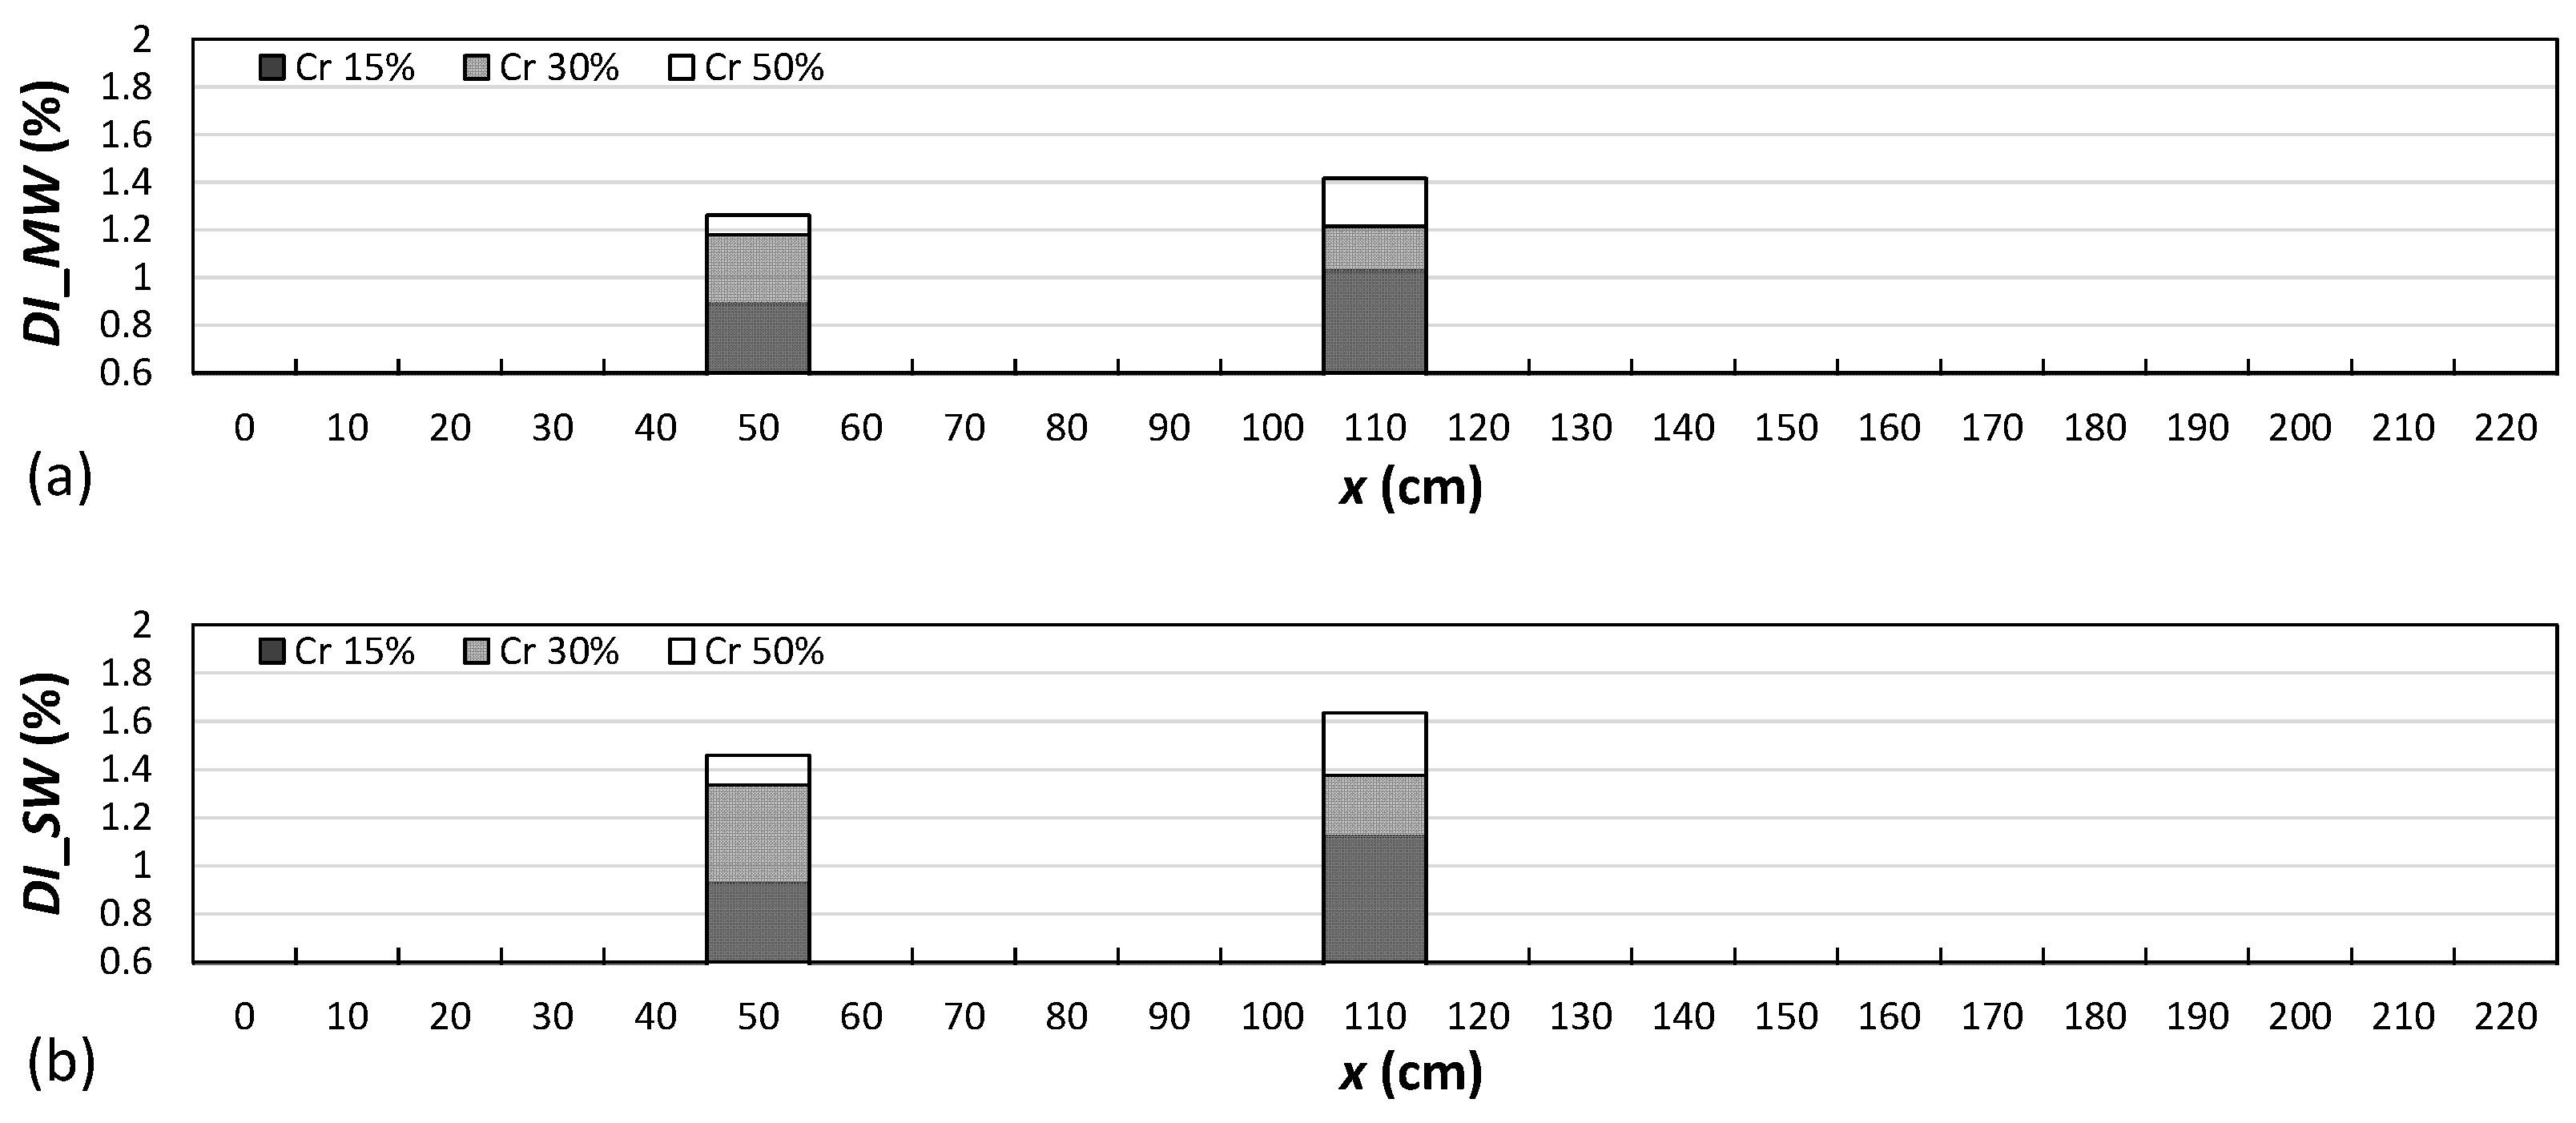
4.2. Damage Localization
5. Conclusions
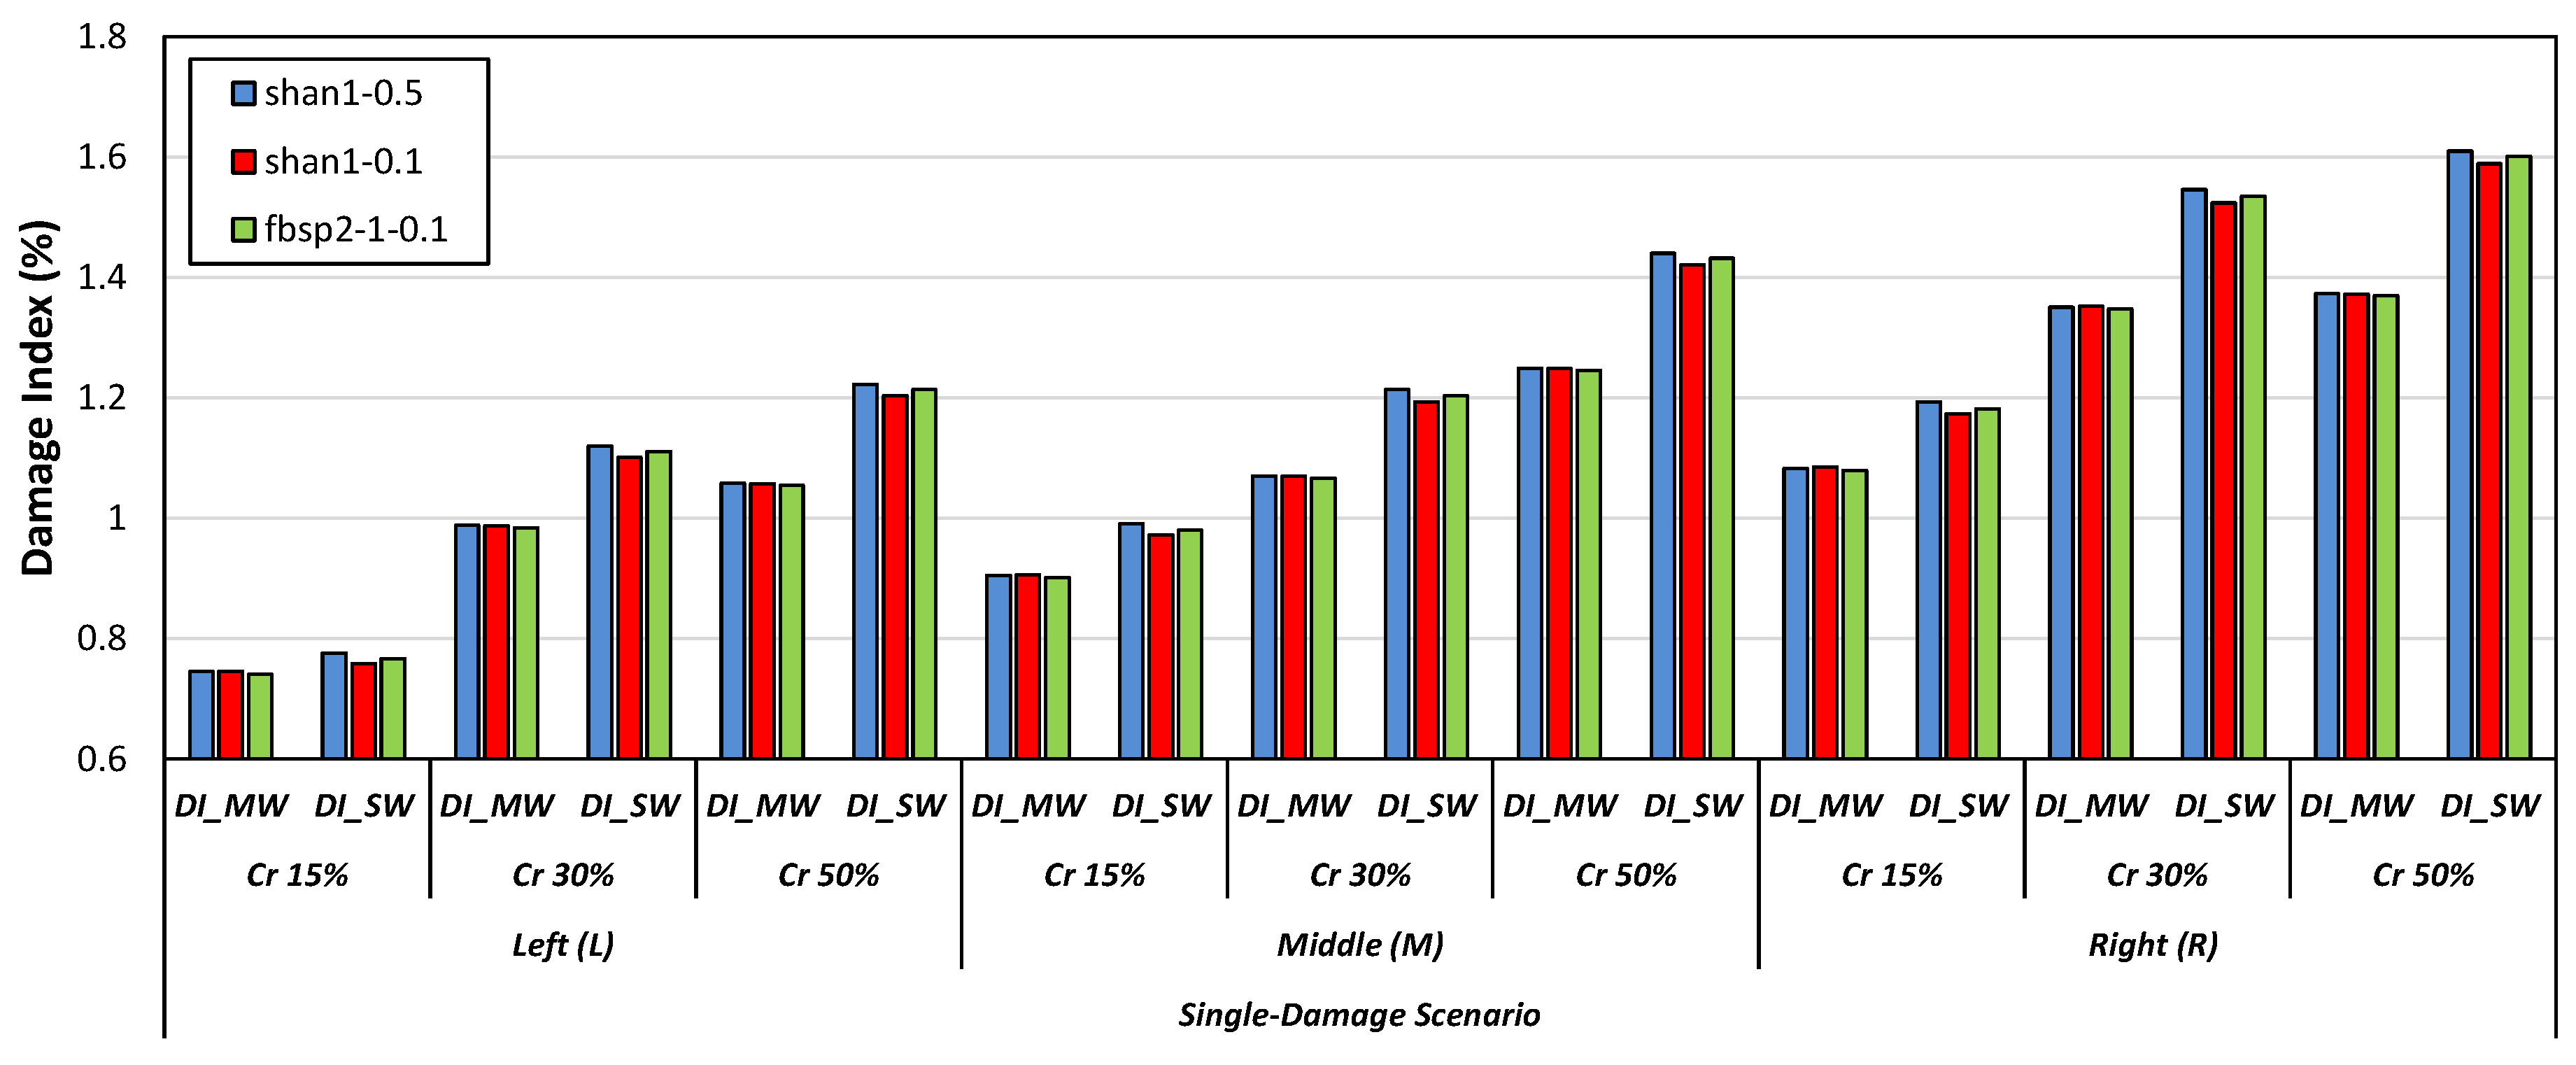
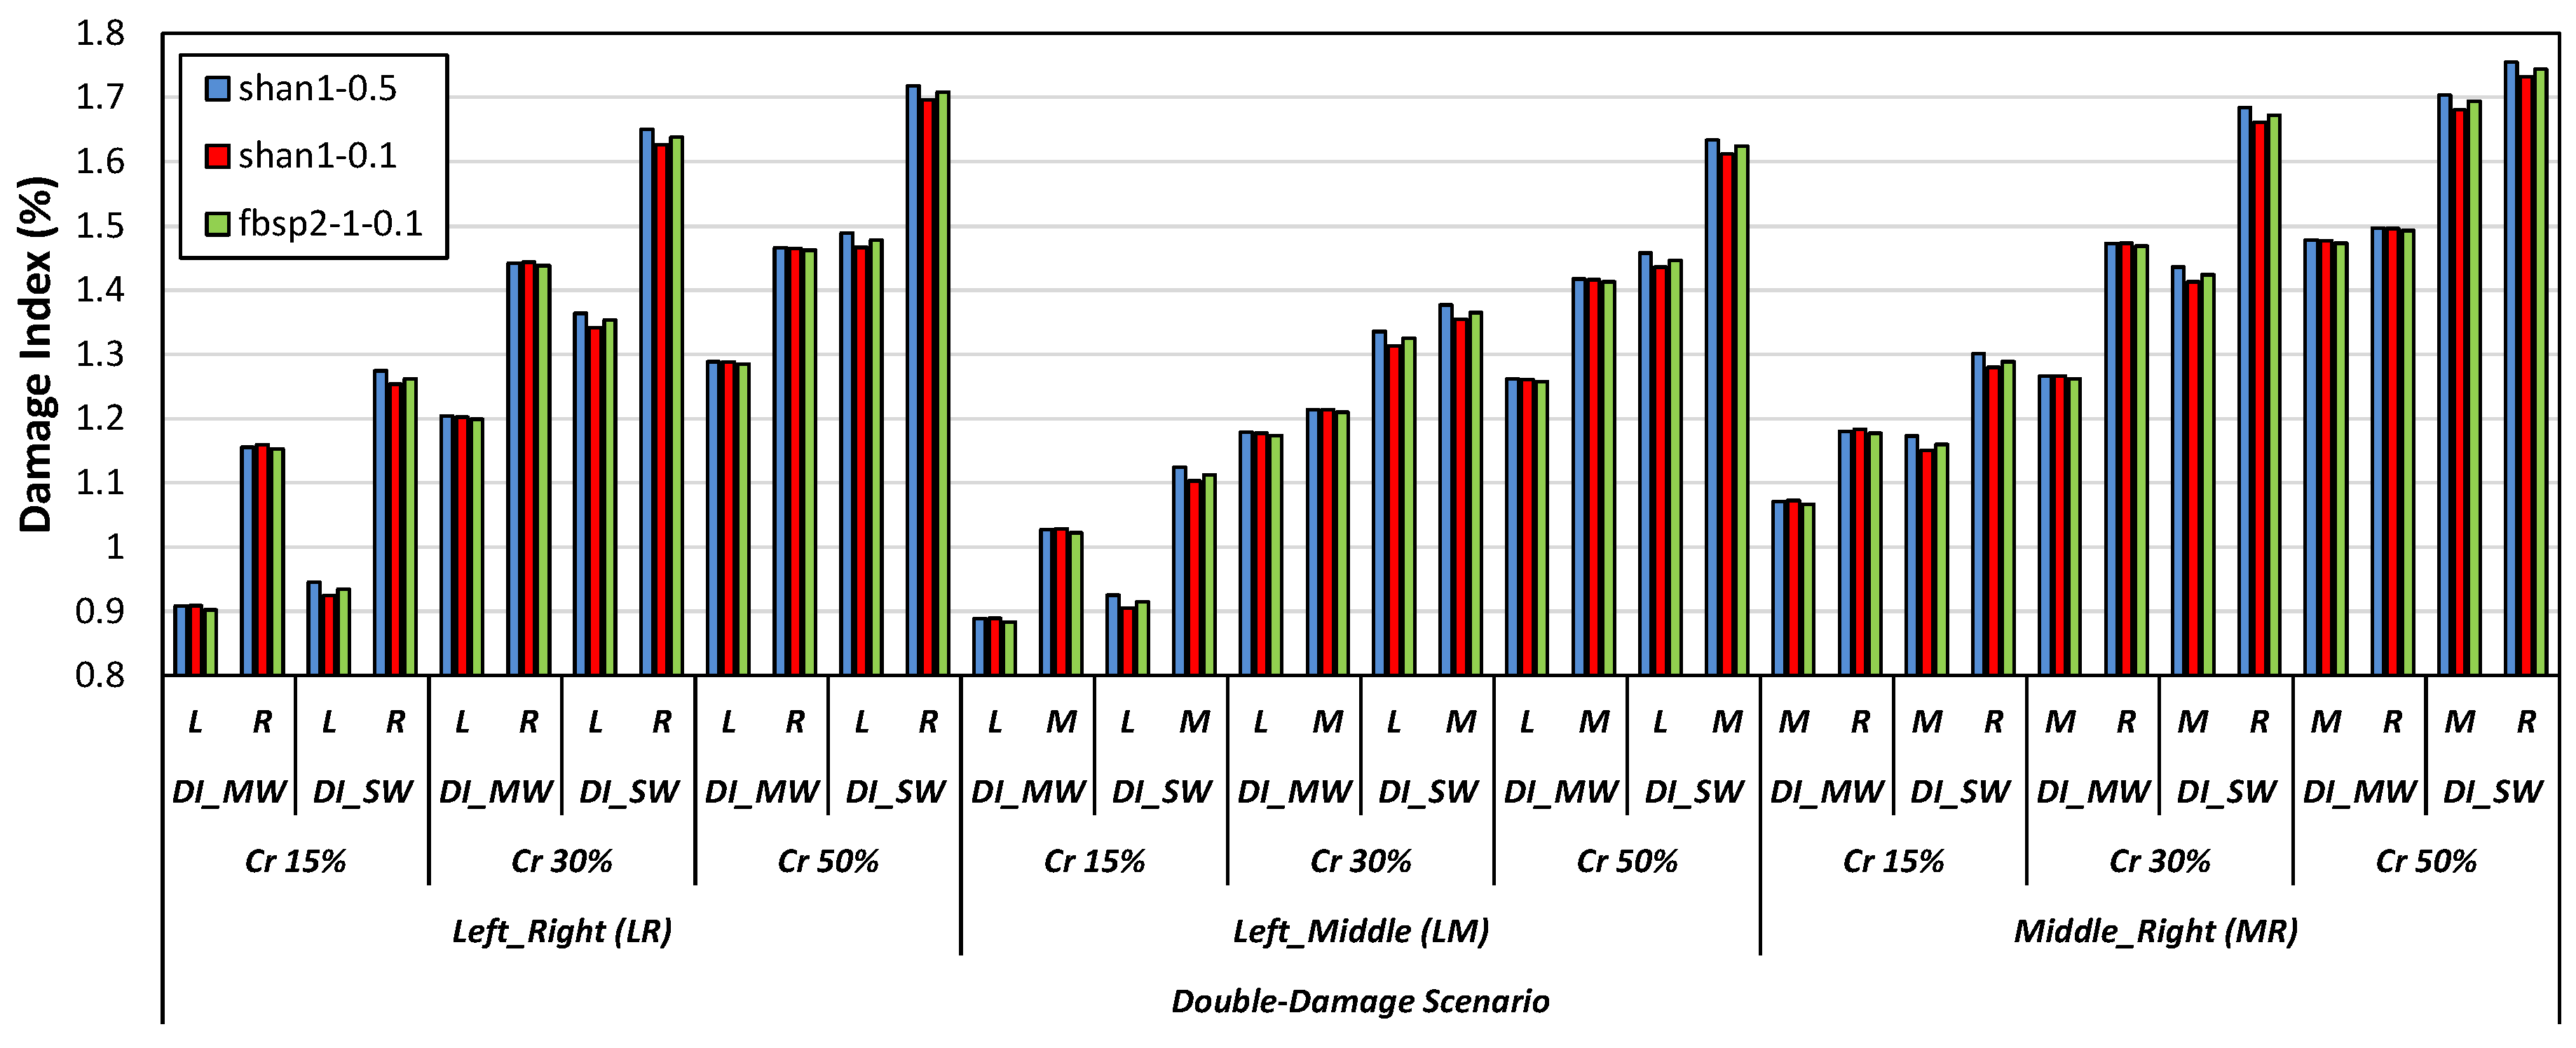
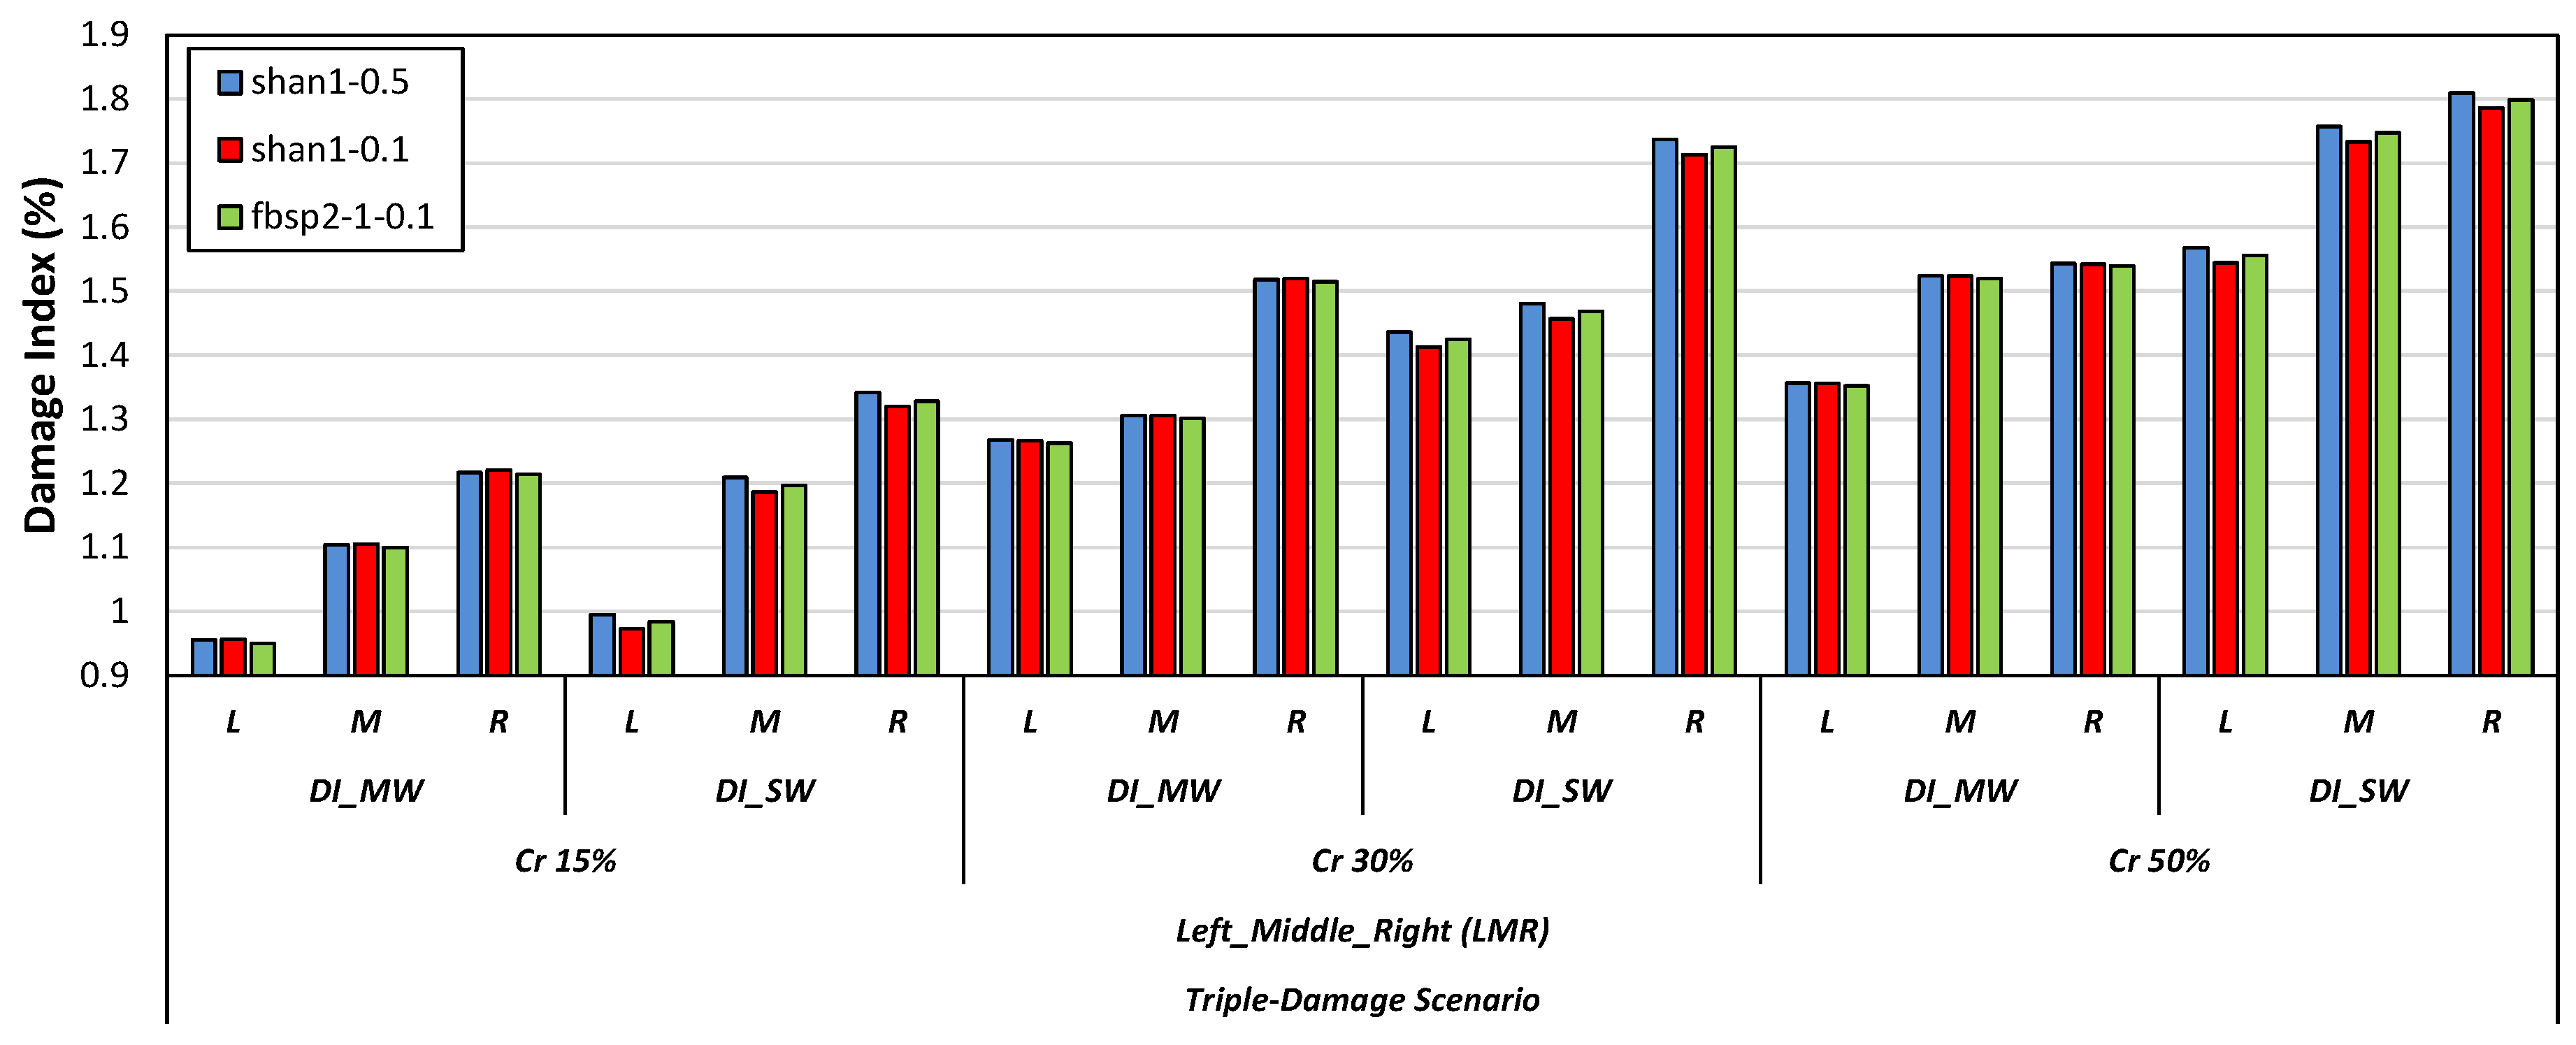
- The study’s results implied that the use of DI_SW showed superior effectiveness in detecting damage across different numerical models compared to DI_MW.
- Specific types of mother wavelets, including db2, db6, and db9 from the Daubechies wavelet family, sym2 and sym7 from the Symlets wavelet family, as well as bior2.8 and bior3.1 from the Biorthogonal wavelet family, were found efficient in detecting damage scenarios via the DI_SW damage index. Furthermore, it was observed that db10 and fbsp1-1-0.5 were adequate for DI_MW to identify the damage scenarios. Some of the mother wavelets from the Shannon and Frequency B-Spline wavelet families, including shan1-0.5, shan1-0.1, and fbsp2-1-0.1, were also effective in both the DI_MW and DI_SW damage indices.
- Among all the tested mother wavelets, the shan1-0.5 wavelet was found to be particularly effective in detecting damage scenarios using the DI_SW damage index.
- As the attached sensor location to the RC beam was near the considered locations of the right-side cracks in comparison to the locations of the left-side and middle-side cracks, the values of the proposed damage indices for the right-side cracks were greater than the corresponding values for the middle and left-side cracks.
- The results showed that both damage indices can detect the location of the left, middle, and right cracks for the single-, double-, and triple-damage scenarios. It was also observed that as the crack depth ratios increased, the damage indices values increased, suggesting that the proposed damage indices could effectively ascertain the severities of cracks in all damage scenarios.
Author Contributions
Funding
Data Availability Statement
Conflicts of Interest
Appendix A

| Family | Mother Wavelet | General Characteristics | Order N | Orthogonal | Biorthogonal | Compact Support | DWT | CWT | Support Width | Effective Support | Filters Length | Regularity | Symmetry | Number of Vanishing Moments | Number of Vanishing Moments | |
|---|---|---|---|---|---|---|---|---|---|---|---|---|---|---|---|---|
| Nr | Nd | |||||||||||||||
| Daubechies [52] | db1 = haar | Compactly supported wavelets with extremal phase and the highest number of vanishing moments for a given support width. Associated scaling filters are minimum-phase filters. | N strictly positive integer | ✓ | ✓ | ✓ | ✓ | ✓ | 2N−1 | — | 2N | About 0.2N for large N | far from | N | — | |
| db2 | ||||||||||||||||
| db3 | ||||||||||||||||
| db4 | ||||||||||||||||
| db5 | ||||||||||||||||
| db6 | ||||||||||||||||
| db7 | ||||||||||||||||
| db8 | ||||||||||||||||
| db9 | ||||||||||||||||
| db10 | ||||||||||||||||
| Symlets [52] | sym2 | Compactly supported wavelets with the least asymmetry and highest number of vanishing moments for a given support width. Associated scaling filters are near linear-phase filters. | N = 2, 3, … | ✓ | ✓ | ✓ | ✓ | ✓ | 2N−1 | — | 2N | — | near from | N | — | |
| sym3 | ||||||||||||||||
| sym4 | ||||||||||||||||
| sym5 | ||||||||||||||||
| sym6 | ||||||||||||||||
| sym7 | ||||||||||||||||
| sym8 | ||||||||||||||||
| Coiflets [52] | coif1 | Compactly supported wavelets with the highest number of vanishing moments for both phi and psi for a given support width. | N = 1, 2, …, 5 | ✓ | ✓ | ✓ | ✓ | ✓ | 6N−1 | — | 6N | — | near from | 2N | 2N−1 | |
| coif2 | ||||||||||||||||
| coif3 | ||||||||||||||||
| coif4 | ||||||||||||||||
| coif5 | ||||||||||||||||
| Biorthogonal [52] | bior1.1 | Compactly supported biorthogonal spline wavelets for which symmetry and exact reconstruction are possible with finite impulse response (FIR) filters (in orthogonal case it is impossible except for Haar). | 1 | 1, 3, 5 | x | ✓ | ✓ | ✓ | ✓ | 2Nr+1 for reconstruction? 2Nd+1 for decomposition | — | max(2Nr,2Nd)+2 | Nr−1 and Nr−2 at the knots | ✓ | Nr | — |
| bior1.3 | ||||||||||||||||
| bior1.5 | ||||||||||||||||
| bior2.2 | 2 | 2, 4, 6, 8 | ||||||||||||||
| bior2.4 | ||||||||||||||||
| bior2.6 | ||||||||||||||||
| bior2.8 | 3 | 1, 3, 5, 7, 9 | ||||||||||||||
| bior3.1 | ||||||||||||||||
| bior3.3 | ||||||||||||||||
| bior3.5 | 4 | 4 | ||||||||||||||
| bior3.7 | ||||||||||||||||
| bior3.9 | 5 | 5 | ||||||||||||||
| bior4.4 | ||||||||||||||||
| bior5.5 | 6 | 8 | ||||||||||||||
| bior6.8 | ||||||||||||||||
| Reverse Biorthogonal [48] | rbio1.1 | Compactly supported biorthogonal spline wavelets for which symmetry and exact reconstruction are possible with finite impulse response (FIR) filters (in orthogonal case it is impossible except for Haar). | 1 | 1, 3, 5 | x | ✓ | ✓ | ✓ | ✓ | 2Nd+1 for reconstruction? 2Nr+1 for decomposition? | — | max(2Nd,2Nr)+2 | N−1 and Nd−2 at the knots | ✓ | Nd | — |
| rbio1.3 | ||||||||||||||||
| rbio1.5 | ||||||||||||||||
| rbio2.2 | 2 | 2, 4, 6, 8 | ||||||||||||||
| rbio2.4 | ||||||||||||||||
| rbio2.6 | ||||||||||||||||
| rbio2.8 | 3 | 1, 3, 5, 7, 9 | ||||||||||||||
| rbio3.1 | ||||||||||||||||
| rbio3.3 | ||||||||||||||||
| rbio3.5 | 4 | 4 | ||||||||||||||
| rbio3.7 | ||||||||||||||||
| rbio3.9 | 5 | 5 | ||||||||||||||
| rbio4.4 | ||||||||||||||||
| rbio5.5 | 6 | 8 | ||||||||||||||
| rbio6.8 | ||||||||||||||||
| Meyer [52] | meyr | Infinitely regular orthogonal wavelet. | — | — | ✓ | ✓ | x | Possible but without FWT | ✓ | Infinite | [−8, 8] | — | Indefinitely derivable | ✓ | — | — |
| Disc.Meyer [52] | dmey | Finite impulse response (FIR)-based approximation of the Meyer wavelet. | — | — | ✓ | ✓ | ✓ | ✓ | ✓ | — | — | — | — | — | — | — |
| Gaussian [52] | gaus1 | Derivatives of the Gaussian probability density function where Cn is a constant. | — | — | x | x | x | x | ✓ | Infinite | [−5, 5] | — | — | n even = symmetry | — | — |
| gaus2 | ||||||||||||||||
| gaus3 | ||||||||||||||||
| gaus4 | ||||||||||||||||
| gaus5 | n odd = anti-symmetry | |||||||||||||||
| gaus6 | ||||||||||||||||
| gaus7 | ||||||||||||||||
| gaus8 | ||||||||||||||||
| Mexican hat [52] | mexh | The second derivative of the Gaussian probability density function | — | — | x | x | x | x | ✓ | Infinite | [−5, 5] | — | — | ✓ | — | — |
| Morlet [53] | morl | — | — | x | x | x | x | ✓ | Infinite | [−4, 4] | — | — | ✓ | — | — | |
| Complex Gaussian | cgau1 | Derivatives of the complex Gaussian function: where Cn is a constant. | — | — | x | x | x | x | ✓ | Infinite | — | — | — | n even = symmetry | — | — |
| cgau2 | ||||||||||||||||
| cgau3 | ||||||||||||||||
| cgau4 | n odd = anti-symmetry | |||||||||||||||
| cgau5 | ||||||||||||||||
| Shannon [49] | shan1-1.5 | where fb is a bandwidth parameter and fc is a wavelet center frequency. | — | — | x | x | x | x | ✓ | Infinite | — | — | — | — | — | — |
| shan1-1 | ||||||||||||||||
| shan1-0.5 | ||||||||||||||||
| shan1-0.1 | ||||||||||||||||
| shan2-3 | ||||||||||||||||
| Frequency B-Spline [53] | fbsp1-1-1.5 | where M is an integer-order parameter (>=1), fb is a bandwidth parameter, and fc is a wavelet center frequency. | — | — | x | x | x | x | ✓ | Infinite | — | — | — | — | — | — |
| fbsp1-1-1 | ||||||||||||||||
| fbsp1-1-0.5 | ||||||||||||||||
| fbsp2-1-1 | ||||||||||||||||
| fbsp2-1-0.5 | ||||||||||||||||
| fbsp2-1-0.1 | ||||||||||||||||
| Complex Morlet [54] | cmor1-1.5 | where fb is a bandwidth parameter and fc is a wavelet center frequency. | — | — | x | x | x | x | ✓ | Infinite | — | — | — | — | — | — |
| cmor1-1 | ||||||||||||||||
| cmor1-0.5 | ||||||||||||||||
| cmor1-0.1 | ||||||||||||||||
| Single-Damage Scenario | |||||||||||||||||||
|---|---|---|---|---|---|---|---|---|---|---|---|---|---|---|---|---|---|---|---|
| Left (S_L) | Middle (S_M) | Right (S_R) | |||||||||||||||||
| Cr 15% | Cr 30% | Cr 50% | Cr 15% | Cr 30% | Cr 50% | Cr 15% | Cr 30% | Cr 50% | |||||||||||
| Wavelet Families | DI_MW | DI_SW | DI_MW | DI_SW | DI_MW | DI_SW | DI_MW | DI_SW | DI_MW | DI_SW | DI_MW | DI_SW | DI_MW | DI_SW | DI_MW | DI_SW | DI_MW | DI_SW | |
| db | db1 = haar | 1.082 | 1.208 | 0.995 | 1.204 | 1.406 | 1.247 | 1.553 | 1.6 | ||||||||||
| db2 | 1.02 | 1.139 | 1.227 | 1.17 | 1.272 | 1.378 | 1.428 | 1.563 | 1.548 | ||||||||||
| db3 | |||||||||||||||||||
| db4 | 0.859 | 0.959 | 0.818 | 0.965 | 1.11 | 1.033 | 1.242 | 1.265 | |||||||||||
| db5 | 1.047 | 1.158 | 0.952 | 1.153 | 1.357 | 1.172 | 1.479 | 1.528 | |||||||||||
| db6 | 0.799 | 0.961 | 1.035 | 0.958 | 1.06 | 1.183 | 0.6565 | 1.158 | 1.317 | 1.326 | |||||||||
| db7 | |||||||||||||||||||
| db8 | 0.639 | 0.6486 | 0.731 | 0.742 | |||||||||||||||
| db9 | 0.798 | 1.066 | 1.158 | 0.996 | 1.169 | 1.348 | 1.213 | 1.477 | 1.505 | ||||||||||
| db10 | 0.91769 | 0.7017 | 0.861 | 0.7096 | 0.951 | 0.9385 | 0.752 | 0.8117 | 0.938 | 0.7593 | 1.133 | 1.1666 | 0.918 | 0.9462 | 1.221 | 0.7939 | 1.274 | ||
| sym | sym2 | 0.868 | 0.969 | 1.044 | 0.995 | 1.083 | 1.172 | 1.215 | 1.33 | 1.318 | |||||||||
| sym3 | |||||||||||||||||||
| sym4 | 0.599 | 0.633 | 0.697 | 0.69 | |||||||||||||||
| sym5 | 0.874 | 0.944 | 0.813 | 0.947 | 1.091 | 0.985 | 1.211 | 1.246 | |||||||||||
| sym6 | 0.5307 | ||||||||||||||||||
| sym7 | 0.86 | 1.034 | 1.101 | 1.028 | 1.135 | 1.259 | 0.5798 | 1.192 | 0.5456 | 1.387 | 1.405 | ||||||||
| sym8 | 0.49848 | 0.6389 | |||||||||||||||||
| coif | coif1 | 0.51153 | 0.5297 | 0.523 | 0.517 | 0.516 | 0.7088 | 0.688 | 0.647 | 0.596 | |||||||||
| coif2 | 0.5888 | ||||||||||||||||||
| coif3 | 0.6148 | ||||||||||||||||||
| coif4 | |||||||||||||||||||
| coif5 | |||||||||||||||||||
| bior | bior1.1 | ||||||||||||||||||
| bior1.3 | 0.54322 | 0.547 | 0.734 | ||||||||||||||||
| bior1.5 | 0.54456 | 0.5528 | 0.7438 | ||||||||||||||||
| bior2.2 | 0.503 | ||||||||||||||||||
| bior2.4 | 0.512 | 0.625 | 0.629 | 0.582 | |||||||||||||||
| bior2.6 | 0.532 | 0.572 | 0.573 | 0.586 | 0.693 | 0.7 | 0.656 | ||||||||||||
| bior2.8 | 0.539 | 0.549 | 0.585 | 0.628 | 0.629 | 0.66 | 0.719 | 0.755 | 0.707 | ||||||||||
| bior3.1 | 0.916 | 1.225 | 1.328 | 0.5548 | 1.142 | 0.5681 | 1.34 | 0.6021 | 1.539 | 0.7837 | 1.373 | 0.7563 | 1.686 | 0.7096 | 1.722 | ||||
| bior3.3 | 0.5611 | 0.5663 | 0.5835 | 0.563 | 0.6206 | 0.65 | 0.7973 | 0.572 | 0.776 | 0.708 | 0.7307 | 0.727 | |||||||
| bior3.5 | 0.5739 | 0.5765 | 0.5963 | 0.6355 | 0.8094 | 0.7922 | 0.577 | 0.7474 | 0.592 | ||||||||||
| bior3.7 | 0.5856 | 0.5869 | 0.6083 | 0.649 | 0.8215 | 0.807 | 0.536 | 0.7624 | 0.55 | ||||||||||
| bior3.9 | 0.5969 | 0.5977 | 0.6202 | 0.6618 | 0.834 | 0.8212 | 0.7763 | 0.531 | |||||||||||
| bior4.4 | 0.6316 | ||||||||||||||||||
| bior5.5 | 0.5574 | ||||||||||||||||||
| bior6.8 | |||||||||||||||||||
| rbio | rbio1.1 | ||||||||||||||||||
| rbio1.3 | 0.5589 | 0.5721 | 0.6063 | 0.7887 | 0.7611 | 0.714 | |||||||||||||
| rbio1.5 | 0.7377 | 0.6792 | 0.6242 | ||||||||||||||||
| rbio2.2 | |||||||||||||||||||
| rbio2.4 | 0.5104 | ||||||||||||||||||
| rbio2.6 | |||||||||||||||||||
| rbio2.8 | 0.4922 | ||||||||||||||||||
| rbio3.1 | 0.7185 | 0.8785 | 0.8755 | 0.562 | 0.8373 | 0.574 | |||||||||||||
| rbio3.3 | |||||||||||||||||||
| rbio3.5 | 0.7114 | 0.7127 | 0.8014 | 0.8944 | 0.9814 | 0.9683 | |||||||||||||
| rbio3.7 | 0.7741 | 0.7179 | 0.6628 | ||||||||||||||||
| rbio3.9 | 0.7303 | 0.631 | 0.5623 | ||||||||||||||||
| rbio4.4 | 0.5717 | ||||||||||||||||||
| rbio5.5 | |||||||||||||||||||
| rbio6.8 | |||||||||||||||||||
| meyr | meyr | ||||||||||||||||||
| dmey | dmey | ||||||||||||||||||
| gaus | gaus1 | 0.885 | 0.972 | 0.803 | 0.97 | 1.137 | 0.981 | 1.237 | 1.277 | ||||||||||
| gaus2 | |||||||||||||||||||
| gaus3 | |||||||||||||||||||
| gaus4 | |||||||||||||||||||
| gaus5 | |||||||||||||||||||
| gaus6 | 0.5374 | ||||||||||||||||||
| gaus7 | |||||||||||||||||||
| gaus8 | |||||||||||||||||||
| mexh | mexh | 0.517 | 0.522 | 0.608 | 0.567 | 0.678 | 0.683 | ||||||||||||
| morl | morl | ||||||||||||||||||
| cgau | cgau1 | 0.8087 | 0.7862 | 0.7959 | 0.633 | 0.562 | 0.694 | 0.714 | |||||||||||
| cgau2 | |||||||||||||||||||
| cgau3 | |||||||||||||||||||
| cgau4 | 0.53962 | 0.5468 | 0.7328 | ||||||||||||||||
| cgau5 | |||||||||||||||||||
| shan | shan1-1.5 | ||||||||||||||||||
| shan1-1 | |||||||||||||||||||
| shan1-0.5 | 0.7452 | 0.776 | 0.9887 | 1.12 | 1.0583 | 1.223 | 0.9053 | 0.991 | 1.0705 | 1.214 | 1.2497 | 1.441 | 1.0826 | 1.194 | 1.3511 | 1.546 | 1.3734 | 1.61 | |
| shan1-0.1 | 0.74581 | 0.759 | 0.9874 | 1.102 | 1.0574 | 1.204 | 0.9064 | 0.973 | 1.0705 | 1.194 | 1.249 | 1.421 | 1.0859 | 1.174 | 1.3522 | 1.524 | 1.3724 | 1.59 | |
| shan2-3 | |||||||||||||||||||
| fbsp | fbsp1-1-1.5 | ||||||||||||||||||
| fbsp1-1-1 | |||||||||||||||||||
| fbsp1-1-0.5 | 0.7452 | 0.9887 | 1.0583 | 0.586 | 0.9053 | 1.0705 | 0.582 | 1.2497 | 0.691 | 1.0826 | 0.573 | 1.3511 | 0.741 | 1.3734 | 0.772 | ||||
| fbsp2-1-1 | |||||||||||||||||||
| fbsp2-1-0.5 | |||||||||||||||||||
| fbsp2-1-0.1 | 0.74073 | 0.767 | 0.9844 | 1.111 | 1.0548 | 1.214 | 0.9016 | 0.981 | 1.0667 | 1.204 | 1.2459 | 1.432 | 1.0801 | 1.182 | 1.3478 | 1.535 | 1.3699 | 1.601 | |
| cmor | cmor1-1.5 | ||||||||||||||||||
| cmor1-1 | 0.5409 | ||||||||||||||||||
| cmor1-0.5 | 0.806 | 0.9174 | 0.8849 | 1.1165 | 0.8344 | 1.1819 | 1.2502 | ||||||||||||
| cmor1-0.1 | 0.9941 | 1.1065 | 0.725 | 0.8188 | 1.0732 | 0.715 | 1.3302 | 0.866 | 0.991 | 1.3994 | 0.904 | 1.4888 | 0.954 | ||||||
| Double-Damage Scenario | |||||||||||||||||||||||||||||||||||||
|---|---|---|---|---|---|---|---|---|---|---|---|---|---|---|---|---|---|---|---|---|---|---|---|---|---|---|---|---|---|---|---|---|---|---|---|---|---|
| Left_Right (D_LR) | Left_Middle (D_LM) | Middle_Right (D_MR) | |||||||||||||||||||||||||||||||||||
| Cr 15% | Cr 30% | Cr 50% | Cr 15% | Cr 30% | Cr 50% | Cr 15% | Cr 30% | Cr 50% | |||||||||||||||||||||||||||||
| Wavelet Families | DI_MW | DI_SW | DI_MW | DI_SW | DI_MW | DI_SW | DI_MW | DI_SW | DI_MW | DI_SW | DI_MW | DI_SW | DI_MW | DI_SW | DI_MW | DI_SW | DI_MW | DI_SW | |||||||||||||||||||
| L | R | L | R | L | R | L | R | L | R | L | R | L | M | L | M | L | M | L | M | L | M | L | M | M | R | M | R | M | R | M | R | M | R | M | R | ||
| db | db1 = haar | 0.91 | 1.331 | 1.318 | 1.658 | 1.471 | 1.708 | 0.89 | 1.129 | 1.29 | 1.365 | 1.44 | 1.595 | 1.177 | 1.359 | 1.424 | 1.693 | 1.664 | 1.744 | ||||||||||||||||||
| db2 | 1.243 | 1.525 | 1.388 | 1.668 | 1.495 | 1.653 | 1.217 | 1.327 | 1.358 | 1.443 | 1.463 | 1.562 | 1.384 | 1.557 | 1.505 | 1.703 | 1.63 | 1.688 | |||||||||||||||||||
| db3 | |||||||||||||||||||||||||||||||||||||
| db4 | 0.755 | 1.103 | 1.046 | 1.326 | 1.169 | 1.35 | 0.74 | 0.928 | 1.024 | 1.094 | 1.144 | 1.259 | 0.967 | 1.126 | 1.141 | 1.354 | 1.313 | 1.379 | |||||||||||||||||||
| db5 | 0.896 | 1.251 | 1.276 | 1.578 | 1.411 | 1.631 | 0.877 | 1.079 | 1.249 | 1.308 | 1.381 | 1.539 | 1.126 | 1.277 | 1.364 | 1.611 | 1.605 | 1.665 | |||||||||||||||||||
| db6 | 0.974 | 1.237 | 1.171 | 1.406 | 1.261 | 1.415 | 0.953 | 1.086 | 1.146 | 1.202 | 1.234 | 1.341 | 1.133 | 1.263 | 1.254 | 1.436 | 1.399 | 1.445 | |||||||||||||||||||
| db7 | |||||||||||||||||||||||||||||||||||||
| db8 | 0.5674 | 0.6923 | 0.67 | 0.792 | 0.5554 | 0.5553 | 0.655 | 0.725 | 0.5792 | 0.7069 | 0.658 | 0.797 | 0.756 | 0.809 | |||||||||||||||||||||||
| db9 | 0.972 | 1.294 | 1.298 | 1.577 | 1.41 | 1.607 | 0.952 | 1.13 | 1.27 | 1.325 | 1.38 | 1.529 | 1.178 | 1.322 | 1.382 | 1.61 | 1.594 | 1.641 | |||||||||||||||||||
| db10 | 1.1177 | 1.2452 | 0.8547 | 1.01 | 1.049 | 1.303 | 0.8642 | 0.8474 | 1.158 | 1.36 | 1.0942 | 1.0644 | 0.8367 | 0.9206 | 1.027 | 1.063 | 0.846 | 0.8612 | 1.133 | 1.285 | 1.1102 | 1.2714 | 0.889 | 1.001 | 0.9602 | 1.0312 | 1.109 | 1.33 | 0.8982 | 0.8652 | 1.34 | 1.389 | |||||
| sym | sym2 | 1.058 | 1.297 | 1.181 | 1.42 | 1.272 | 1.406 | 1.035 | 1.129 | 1.156 | 1.228 | 1.245 | 1.33 | 1.177 | 1.325 | 1.281 | 1.45 | 1.387 | 1.436 | ||||||||||||||||||
| sym3 | |||||||||||||||||||||||||||||||||||||
| sym4 | 0.651 | 0.737 | 0.637 | 0.68 | 0.65 | 0.76 | 0.709 | 0.752 | |||||||||||||||||||||||||||||
| sym5 | 0.812 | 1.051 | 1.065 | 1.293 | 1.15 | 1.33 | 0.795 | 0.922 | 1.042 | 1.074 | 1.125 | 1.237 | 0.962 | 1.073 | 1.121 | 1.32 | 1.29 | 1.358 | |||||||||||||||||||
| sym6 | |||||||||||||||||||||||||||||||||||||
| sym7 | 1.047 | 1.272 | 1.26 | 1.481 | 1.341 | 1.5 | 1.025 | 1.166 | 1.233 | 1.288 | 1.313 | 1.428 | 1.216 | 1.299 | 1.343 | 1.512 | 1.49 | 1.531 | |||||||||||||||||||
| sym8 | 0.6071 | 0.6819 | 0.5943 | 0.5559 | 0.5798 | 0.6963 | |||||||||||||||||||||||||||||||
| coif | coif1 | 0.623 | 0.7566 | 0.583 | 0.636 | 0.6099 | 0.6007 | 0.571 | 0.586 | 0.6266 | 0.7725 | 0.619 | 0.75 | 0.612 | 0.705 | 0.611 | 0.649 | ||||||||||||||||||||
| coif2 | 0.5484 | 0.6285 | 0.5238 | 0.6418 | |||||||||||||||||||||||||||||||||
| coif3 | 0.5888 | 0.6563 | 0.5764 | 0.5332 | 0.5561 | 0.6701 | |||||||||||||||||||||||||||||||
| coif4 | |||||||||||||||||||||||||||||||||||||
| coif5 | |||||||||||||||||||||||||||||||||||||
| bior | bior1.1 | ||||||||||||||||||||||||||||||||||||
| bior1.3 | 0.6616 | 0.7835 | 0.6477 | 0.6203 | 0.647 | 0.8 | |||||||||||||||||||||||||||||||
| bior1.5 | 0.6632 | 0.7939 | 0.6493 | 0.627 | 0.654 | 0.8106 | |||||||||||||||||||||||||||||||
| bior2.2 | 0.53 | 0.521 | |||||||||||||||||||||||||||||||||||
| bior2.4 | 0.567 | 0.621 | 0.555 | 0.581 | 0.592 | 0.681 | 0.593 | 0.685 | 0.606 | 0.635 | |||||||||||||||||||||||||||
| bior2.6 | 0.58 | 0.74 | 0.592 | 0.747 | 0.648 | 0.7 | 0.568 | 0.648 | 0.579 | 0.65 | 0.635 | 0.665 | 0.676 | 0.756 | 0.677 | 0.763 | 0.694 | 0.714 | |||||||||||||||||||
| bior2.8 | 0.656 | 0.767 | 0.668 | 0.806 | 0.712 | 0.755 | 0.642 | 0.712 | 0.654 | 0.714 | 0.697 | 0.748 | 0.742 | 0.783 | 0.745 | 0.823 | 0.78 | 0.771 | |||||||||||||||||||
| bior3.1 | 1.116 | 1.465 | 1.492 | 1.8 | 0.6642 | 0.7575 | 1.618 | 1.838 | 1.093 | 1.295 | 1.461 | 1.52 | 0.6502 | 0.6829 | 1.584 | 1.746 | 0.6563 | 0.8542 | 1.351 | 1.496 | 0.672 | 0.8243 | 1.585 | 1.838 | 0.7123 | 0.7734 | 1.821 | 1.876 | |||||||||
| bior3.3 | 0.631 | 0.756 | 0.6833 | 0.7799 | 0.68 | 0.776 | 0.618 | 0.638 | 0.669 | 0.7039 | 0.666 | 0.737 | 0.6699 | 0.8689 | 0.6902 | 0.8458 | 0.666 | 0.772 | 0.7341 | 0.7963 | 0.769 | 0.792 | |||||||||||||||
| bior3.5 | 0.699 | 0.7978 | 0.6842 | 0.7207 | 0.682 | 0.8822 | 0.7054 | 0.8634 | 0.7517 | 0.8146 | 0.626 | 0.645 | |||||||||||||||||||||||||
| bior3.7 | 0.5956 | 0.8614 | 0.7133 | 0.8138 | 0.5831 | 0.6899 | 0.6983 | 0.736 | 0.6942 | 0.8954 | 0.7196 | 0.8795 | 0.7677 | 0.8309 | 0.582 | 0.6 | |||||||||||||||||||||
| bior3.9 | 0.609 | 0.8766 | 0.727 | 0.8287 | 0.5962 | 0.7034 | 0.7117 | 0.7506 | 0.707 | 0.9089 | 0.7336 | 0.895 | 0.7829 | 0.8461 | 0.562 | 0.579 | |||||||||||||||||||||
| bior4.4 | 0.5912 | 0.6741 | 0.5787 | 0.5401 | 0.5633 | 0.6883 | |||||||||||||||||||||||||||||||
| bior5.5 | 0.5442 | 0.595 | |||||||||||||||||||||||||||||||||||
| bior6.8 | |||||||||||||||||||||||||||||||||||||
| rbio | rbio1.1 | ||||||||||||||||||||||||||||||||||||
| rbio1.3 | 0.6687 | 0.7621 | 0.6546 | 0.6876 | 0.6612 | 0.8596 | 0.6767 | 0.8295 | 0.7172 | 0.7782 | |||||||||||||||||||||||||||
| rbio1.5 | 0.5886 | 0.6662 | 0.5762 | 0.5991 | 0.6098 | 0.804 | 0.6021 | 0.7403 | 0.6249 | 0.6803 | |||||||||||||||||||||||||||
| rbio2.2 | |||||||||||||||||||||||||||||||||||||
| rbio2.4 | |||||||||||||||||||||||||||||||||||||
| rbio2.6 | |||||||||||||||||||||||||||||||||||||
| rbio2.8 | 0.5165 | 0.5254 | |||||||||||||||||||||||||||||||||||
| rbio3.1 | 0.784 | 0.8937 | 0.7675 | 0.8149 | 0.7525 | 0.9574 | 0.785 | 0.9542 | 0.85 | 0.9125 | 0.607 | 0.625 | |||||||||||||||||||||||||
| rbio3.3 | |||||||||||||||||||||||||||||||||||||
| rbio3.5 | 0.6904 | 1.0475 | 0.8665 | 1.0336 | 0.6759 | 0.8083 | 0.8482 | 0.9089 | 0.7306 | 0.9748 | 0.843 | 1.0696 | 0.948 | 1.0553 | |||||||||||||||||||||||
| rbio3.7 | 0.6142 | 0.7074 | 0.6012 | 0.6218 | 0.621 | 0.8437 | 0.6232 | 0.7825 | 0.6485 | 0.7223 | |||||||||||||||||||||||||||
| rbio3.9 | 0.5926 | 0.7959 | 0.5576 | 0.6877 | 0.558 | 0.6128 | |||||||||||||||||||||||||||||||
| rbio4.4 | 0.5416 | 0.6103 | |||||||||||||||||||||||||||||||||||
| rbio5.5 | |||||||||||||||||||||||||||||||||||||
| rbio6.8 | |||||||||||||||||||||||||||||||||||||
| meyr | meyr | ||||||||||||||||||||||||||||||||||||
| dmey | dmey | ||||||||||||||||||||||||||||||||||||
| gaus | gaus1 | 0.761 | 1.047 | 1.078 | 1.32 | 1.184 | 1.363 | 0.745 | 0.911 | 1.056 | 1.1 | 1.159 | 1.289 | 0.95 | 1.069 | 1.147 | 1.348 | 1.344 | 1.392 | ||||||||||||||||||
| gaus2 | |||||||||||||||||||||||||||||||||||||
| gaus3 | |||||||||||||||||||||||||||||||||||||
| gaus4 | |||||||||||||||||||||||||||||||||||||
| gaus5 | |||||||||||||||||||||||||||||||||||||
| gaus6 | |||||||||||||||||||||||||||||||||||||
| gaus7 | |||||||||||||||||||||||||||||||||||||
| gaus8 | |||||||||||||||||||||||||||||||||||||
| mexh | mexh | 0.567 | 0.724 | 0.629 | 0.729 | 0.555 | 0.592 | 0.616 | 0.69 | 0.618 | 0.739 | 0.719 | 0.745 | ||||||||||||||||||||||||
| morl | morl | ||||||||||||||||||||||||||||||||||||
| cgau | cgau1 | 0.605 | 0.741 | 0.664 | 0.763 | 0.592 | 0.619 | 0.65 | 0.718 | 0.646 | 0.756 | 0.748 | 0.779 | ||||||||||||||||||||||||
| cgau2 | |||||||||||||||||||||||||||||||||||||
| cgau3 | |||||||||||||||||||||||||||||||||||||
| cgau4 | 0.6572 | 0.7822 | 0.6434 | 0.6201 | 0.6468 | 0.7987 | |||||||||||||||||||||||||||||||
| cgau5 | |||||||||||||||||||||||||||||||||||||
| shan | shan1-1.5 | ||||||||||||||||||||||||||||||||||||
| shan1-1 | |||||||||||||||||||||||||||||||||||||
| shan1-0.5 | 0.9076 | 1.1556 | 0.945 | 1.275 | 1.2042 | 1.4421 | 1.364 | 1.65 | 1.289 | 1.466 | 1.489 | 1.719 | 0.8885 | 1.0267 | 0.925 | 1.124 | 1.1789 | 1.2141 | 1.336 | 1.377 | 1.2618 | 1.4174 | 1.458 | 1.634 | 1.0709 | 1.1799 | 1.173 | 1.302 | 1.2663 | 1.4725 | 1.436 | 1.685 | 1.4784 | 1.4969 | 1.704 | 1.755 | |
| shan1-0.1 | 0.9084 | 1.1591 | 0.924 | 1.254 | 1.2026 | 1.4434 | 1.342 | 1.627 | 1.2879 | 1.4649 | 1.467 | 1.697 | 0.8892 | 1.028 | 0.905 | 1.103 | 1.1772 | 1.2141 | 1.314 | 1.355 | 1.2608 | 1.4165 | 1.436 | 1.612 | 1.0722 | 1.1835 | 1.151 | 1.28 | 1.2663 | 1.4738 | 1.413 | 1.661 | 1.4774 | 1.4957 | 1.681 | 1.732 | |
| shan2-3 | |||||||||||||||||||||||||||||||||||||
| fbsp | fbsp1-1-1.5 | ||||||||||||||||||||||||||||||||||||
| fbsp1-1-1 | |||||||||||||||||||||||||||||||||||||
| fbsp1-1-0.5 | 0.9076 | 1.1556 | 1.2042 | 1.4421 | 0.654 | 0.791 | 1.289 | 1.466 | 0.714 | 0.824 | 0.8885 | 1.0267 | 1.1789 | 1.2141 | 0.641 | 0.66 | 1.2618 | 1.4174 | 0.699 | 0.784 | 1.0709 | 1.1799 | 1.2663 | 1.4725 | 0.689 | 0.808 | 1.4784 | 1.4969 | 0.817 | 0.842 | |||||||
| fbsp2-1-1 | |||||||||||||||||||||||||||||||||||||
| fbsp2-1-0.5 | |||||||||||||||||||||||||||||||||||||
| fbsp2-1-0.1 | 0.9022 | 1.1529 | 0.934 | 1.262 | 1.1989 | 1.4387 | 1.354 | 1.638 | 1.2846 | 1.4623 | 1.478 | 1.709 | 0.8832 | 1.0226 | 0.914 | 1.112 | 1.1737 | 1.2098 | 1.325 | 1.365 | 1.2576 | 1.413 | 1.447 | 1.625 | 1.0666 | 1.1772 | 1.16 | 1.289 | 1.2619 | 1.469 | 1.424 | 1.673 | 1.4738 | 1.4931 | 1.695 | 1.745 | |
| cmor | cmor1-1.5 | ||||||||||||||||||||||||||||||||||||
| cmor1-1 | |||||||||||||||||||||||||||||||||||||
| cmor1-0.5 | 0.9817 | 1.2616 | 1.1173 | 1.3344 | 0.961 | 1.0036 | 1.0938 | 1.2663 | 0.7888 | 0.9094 | 1.0468 | 1.2882 | 1.3208 | 1.3625 | |||||||||||||||||||||||
| cmor1-0.1 | 1.2108 | 1.4937 | 0.822 | 0.965 | 1.3476 | 1.5891 | 0.882 | 1.019 | 1.1853 | 1.2172 | 0.805 | 0.811 | 1.3193 | 1.5087 | 0.864 | 0.982 | 0.9686 | 1.0801 | 1.2696 | 1.5252 | 0.846 | 0.986 | 1.5736 | 1.6226 | 1.024 | 1.04 | |||||||||||
| Triple-Damage Scenario | |||||||||||||||||||
|---|---|---|---|---|---|---|---|---|---|---|---|---|---|---|---|---|---|---|---|
| Left_Middle_Right (T_LMR) | |||||||||||||||||||
| Cr 15% | Cr 30% | Cr 50% | |||||||||||||||||
| Wavelet Families | DI_MW | DI_SW | DI_MW | DI_SW | DI_MW | DI_SW | |||||||||||||
| L | M | R | L | M | R | L | M | R | L | M | R | L | M | R | L | M | R | ||
| db | db1 = haar | 0.957 | 1.214 | 1.401 | 1.387 | 1.468 | 1.745 | 1.549 | 1.715 | 1.798 | |||||||||
| db2 | 1.308 | 1.426 | 1.605 | 1.461 | 1.552 | 1.756 | 1.574 | 1.68 | 1.74 | ||||||||||
| db3 | |||||||||||||||||||
| db4 | 0.795 | 0.997 | 1.161 | 1.101 | 1.176 | 1.396 | 1.23 | 1.354 | 1.421 | ||||||||||
| db5 | 0.943 | 1.161 | 1.317 | 1.343 | 1.406 | 1.661 | 1.485 | 1.654 | 1.717 | ||||||||||
| db6 | 1.025 | 1.168 | 1.302 | 1.232 | 1.293 | 1.48 | 1.327 | 1.442 | 1.49 | ||||||||||
| db7 | |||||||||||||||||||
| db8 | 0.5973 | 0.5971 | 0.7288 | 0.705 | 0.779 | 0.834 | |||||||||||||
| db9 | 1.023 | 1.215 | 1.362 | 1.366 | 1.425 | 1.66 | 1.484 | 1.644 | 1.692 | ||||||||||
| db10 | 1.1765 | 1.1445 | 1.3107 | 0.8996 | 0.9899 | 1.0631 | 1.104 | 1.143 | 1.371 | 0.9097 | 0.926 | 0.892 | 1.219 | 1.382 | 1.432 | ||||
| sym | sym2 | 1.113 | 1.214 | 1.366 | 1.243 | 1.32 | 1.494 | 1.339 | 1.43 | 1.48 | |||||||||
| sym3 | |||||||||||||||||||
| sym4 | 0.615 | 0.671 | 0.784 | 0.685 | 0.731 | 0.775 | |||||||||||||
| sym5 | 0.855 | 0.991 | 1.106 | 1.121 | 1.155 | 1.361 | 1.21 | 1.33 | 1.4 | ||||||||||
| sym6 | |||||||||||||||||||
| sym7 | 1.102 | 1.254 | 1.339 | 1.326 | 1.385 | 1.559 | 1.411 | 1.536 | 1.579 | ||||||||||
| sym8 | 0.6391 | 0.5977 | 0.7178 | ||||||||||||||||
| coif | coif1 | 0.6558 | 0.6459 | 0.7964 | 0.614 | 0.63 | 0.669 | ||||||||||||
| coif2 | 0.5773 | 0.54 | 0.6616 | ||||||||||||||||
| coif3 | 0.6198 | 0.5733 | 0.6908 | ||||||||||||||||
| coif4 | |||||||||||||||||||
| coif5 | |||||||||||||||||||
| bior | bior1.1 | ||||||||||||||||||
| bior1.3 | 0.6964 | 0.667 | 0.8248 | ||||||||||||||||
| bior1.5 | 0.6982 | 0.6742 | 0.8357 | ||||||||||||||||
| bior2.2 | |||||||||||||||||||
| bior2.4 | 0.597 | 0.625 | 0.654 | ||||||||||||||||
| bior2.6 | 0.611 | 0.697 | 0.779 | 0.623 | 0.698 | 0.786 | 0.682 | 0.715 | 0.737 | ||||||||||
| bior2.8 | 0.691 | 0.765 | 0.807 | 0.704 | 0.768 | 0.848 | 0.75 | 0.804 | 0.794 | ||||||||||
| bior3.1 | 1.175 | 1.393 | 1.542 | 1.571 | 1.635 | 1.895 | 0.6992 | 0.7343 | 0.7973 | 1.703 | 1.877 | 1.934 | |||||||
| bior3.3 | 0.664 | 0.686 | 0.796 | 0.7193 | 0.7568 | 0.821 | 0.716 | 0.793 | 0.817 | ||||||||||
| bior3.5 | 0.6127 | 0.7272 | 0.8901 | 0.7357 | 0.775 | 0.8398 | 0.583 | 0.646 | 0.665 | ||||||||||
| bior3.7 | 0.627 | 0.7419 | 0.9067 | 0.7508 | 0.7914 | 0.8566 | |||||||||||||
| bior3.9 | 0.6411 | 0.7563 | 0.9227 | 0.7653 | 0.8071 | 0.8723 | |||||||||||||
| bior4.4 | 0.6223 | 0.5807 | 0.7096 | ||||||||||||||||
| bior5.5 | |||||||||||||||||||
| bior6.8 | |||||||||||||||||||
| rbio | rbio1.1 | ||||||||||||||||||
| rbio1.3 | 0.7039 | 0.7393 | 0.8022 | ||||||||||||||||
| rbio1.5 | 0.6195 | 0.6442 | 0.7013 | ||||||||||||||||
| rbio2.2 | |||||||||||||||||||
| rbio2.4 | |||||||||||||||||||
| rbio2.6 | |||||||||||||||||||
| rbio2.8 | |||||||||||||||||||
| rbio3.1 | 0.8252 | 0.8763 | 0.9408 | ||||||||||||||||
| rbio3.3 | |||||||||||||||||||
| rbio3.5 | 0.7267 | 0.8691 | 1.1027 | 0.9121 | 0.9773 | 1.088 | |||||||||||||
| rbio3.7 | 0.6465 | 0.6686 | 0.7447 | ||||||||||||||||
| rbio3.9 | |||||||||||||||||||
| rbio4.4 | |||||||||||||||||||
| rbio5.5 | |||||||||||||||||||
| rbio6.8 | |||||||||||||||||||
| meyr | meyr | ||||||||||||||||||
| dmey | dmey | ||||||||||||||||||
| gaus | gaus1 | 0.801 | 0.979 | 1.102 | 1.135 | 1.183 | 1.389 | 1.247 | 1.386 | 1.435 | |||||||||
| gaus2 | |||||||||||||||||||
| gaus3 | |||||||||||||||||||
| gaus4 | |||||||||||||||||||
| gaus5 | |||||||||||||||||||
| gaus6 | |||||||||||||||||||
| gaus7 | |||||||||||||||||||
| gaus8 | |||||||||||||||||||
| mexh | mexh | 0.596 | 0.637 | 0.762 | 0.662 | 0.742 | 0.768 | ||||||||||||
| morl | morl | ||||||||||||||||||
| cgau | cgau1 | 0.636 | 0.666 | 0.78 | 0.699 | 0.772 | 0.803 | ||||||||||||
| cgau2 | |||||||||||||||||||
| cgau3 | |||||||||||||||||||
| cgau4 | 0.6918 | 0.6668 | 0.8234 | ||||||||||||||||
| cgau5 | |||||||||||||||||||
| shan | shan1-1.5 | ||||||||||||||||||
| shan1-1 | |||||||||||||||||||
| shan1-0.5 | 0.9554 | 1.104 | 1.2164 | 0.995 | 1.209 | 1.342 | 1.2676 | 1.3055 | 1.518 | 1.436 | 1.48 | 1.737 | 1.3568 | 1.5241 | 1.5432 | 1.567 | 1.757 | 1.809 | |
| shan1-0.1 | 0.9562 | 1.1054 | 1.2201 | 0.973 | 1.186 | 1.32 | 1.2659 | 1.3055 | 1.5193 | 1.413 | 1.457 | 1.712 | 1.3557 | 1.5231 | 1.542 | 1.544 | 1.733 | 1.786 | |
| shan2-3 | |||||||||||||||||||
| fbsp | fbsp1-1-1.5 | ||||||||||||||||||
| fbsp1-1-1 | |||||||||||||||||||
| fbsp1-1-0.5 | 0.9554 | 1.104 | 1.2164 | 1.2676 | 1.3055 | 1.518 | 0.689 | 0.71 | 0.833 | 1.3568 | 1.5241 | 1.5432 | 0.752 | 0.843 | 0.868 | ||||
| fbsp2-1-1 | |||||||||||||||||||
| fbsp2-1-0.5 | |||||||||||||||||||
| fbsp2-1-0.1 | 0.9497 | 1.0996 | 1.2136 | 0.983 | 1.196 | 1.328 | 1.262 | 1.3009 | 1.5144 | 1.425 | 1.468 | 1.725 | 1.3523 | 1.5193 | 1.5392 | 1.556 | 1.747 | 1.799 | |
| cmor | cmor1-1.5 | ||||||||||||||||||
| cmor1-1 | |||||||||||||||||||
| cmor1-0.5 | 1.0334 | 1.0792 | 1.328 | 1.1762 | 1.3616 | 1.4047 | |||||||||||||
| cmor1-0.1 | 1.2745 | 1.3088 | 1.5724 | 0.865 | 0.872 | 1.016 | 1.4186 | 1.6222 | 1.6728 | 0.929 | 1.056 | 1.072 | |||||||
References
- Sarmadi, H.; Entezami, A.; De Michele, C. Probabilistic Data Self-Clustering Based on Semi-Parametric Extreme Value Theory for Structural Health Monitoring. Mech. Syst. Signal Process. 2023, 187, 109976. [Google Scholar] [CrossRef]
- Coraça, E.M.; Ferreira, J.V.; Nóbrega, E.G.O. An Unsupervised Structural Health Monitoring Framework Based on Variational Autoencoders and Hidden Markov Models. Reliab. Eng. Syst. Saf. 2023, 231, 109025. [Google Scholar] [CrossRef]
- Farrar, C.R.; Worden, K. Structural Health Monitoring: A Machine Learning Perspective; John Wiley & Sons: Hoboken, NJ, USA, 2012; ISBN 9781119994336. [Google Scholar]
- Kamariotis, A.; Chatzi, E.; Straub, D. A Framework for Quantifying the Value of Vibration-Based Structural Health Monitoring. Mech. Syst. Signal Process. 2023, 184, 109708. [Google Scholar] [CrossRef]
- Peng, X.; Yang, Q. Damage Detection in Beam-like Structures Using Static Shear Energy Redistribution. Front. Struct. Civ. Eng. 2023, 16, 1552–1564. [Google Scholar] [CrossRef]
- Rytter, A. Vibration Based Inspection of Civil Engineering Structures. Ph.D. Thesis, Department of Building Technology and Structural Engineering, Aalborg University, Aalborg, Denmark, 1993. [Google Scholar]
- Comanducci, G.; Magalhães, F.; Ubertini, F.; Cunha, Á. On Vibration-Based Damage Detection by Multivariate Statistical Techniques: Application to a Long-Span Arch Bridge. Struct. Health Monit. 2016, 15, 505–524. [Google Scholar] [CrossRef]
- Lucà, F.; Manzoni, S.; Cigada, A.; Frate, L. A Vibration-Based Approach for Health Monitoring of Tie-Rods under Uncertain Environmental Conditions. Mech. Syst. Signal Process. 2022, 167, 108547. [Google Scholar] [CrossRef]
- Le-Ngoc, V.; Vuong-Cong, L.; Pham-Bao, T.; Ngo-Kieu, N. Damage Detection of the Beam Under Moving Load by Using a Variation of Power Spectrum Density. In Lecture Notes in Mechanical Engineering; Springer: Berlin/Heidelberg, Germany, 2023; pp. 207–219. ISBN 9789811948343. [Google Scholar]
- Hanumanthappa, S. A New Structural Damage Detection Method for Cantilever Beam Using Generalized Flexibility Quotient Difference Method. J. Vib. Eng. Technol. 2022, 11, 1525–1533. [Google Scholar] [CrossRef]
- Nguyen, T.Q. Damage Detection in Beam Structures Using Bayesian Deep Learning and Balancing Composite Motion Optimization. Structures 2022, 39, 98–114. [Google Scholar] [CrossRef]
- Huang, J.; Deng, T.; Cao, M.; Qian, X.; Bayat, M. A Feature of Mechanics-Driven Statistical Moments of Wavelet Transform-Processed Dynamic Responses for Damage Detection in Beam-Type Structures. Appl. Sci. 2022, 12, 11561. [Google Scholar] [CrossRef]
- Pooya, S.M.H.; Massumi, A. A Novel Damage Detection Method in Beam-like Structures Based on the Relation between Modal Kinetic Energy and Modal Strain Energy and Using Only Damaged Structure Data. J. Sound Vib. 2022, 530, 116943. [Google Scholar] [CrossRef]
- Worden, K.; Farrar, C.R.; Haywood, J.; Todd, M. A Review of Nonlinear Dynamics Applications to Structural Health Monitoring. Struct. Control. Health Monit. 2008, 15, 540–567. [Google Scholar] [CrossRef]
- Zou, Y.; Tong, L.; Steven, G.P. Vibration-Based Model-Dependent Damage (Delamination) Identification and Health Monitoring for Composite Structures—A Review. J. Sound Vib. 2000, 230, 357–378. [Google Scholar] [CrossRef]
- García, D.; Trendafilova, I. A Multivariate Data Analysis Approach towards Vibration Analysis and Vibration-Based Damage Assessment: Application for Delamination Detection in a Composite Beam. J. Sound Vib. 2014, 333, 7036–7050. [Google Scholar] [CrossRef]
- Jahangiri, M.; Hadianfard, M.A. Vibration-Based Structural Health Monitoring Using Symbiotic Organism Search Based on an Improved Objective Function. J. Civ. Struct. Health Monit. 2019, 9, 741–755. [Google Scholar] [CrossRef]
- Larsen, G.C.; Berring, P.; Tcherniak, D.; Nielsen, P.H.; Branner, K. Effect of a Damage to Modal Parameters of a Wind Turbine Blade. In Proceedings of the 7th European Workshop on Structural Health Monitoring, EWSHM 2014—2nd European Conference of the Prognostics and Health Management (PHM) Society, Nantes, Frances, 8–11 July 2014; pp. 261–269. [Google Scholar]
- Pardoen, G.C. Effect of Delamination on the Natural Frequencies of Composite Laminates. J. Compos. Mater. 1989, 23, 1200–1215. [Google Scholar] [CrossRef]
- Kessler, S.S.; Spearing, S.M.; Atalla, M.J.; Cesnik, C.E.S.; Soutis, C. Damage Detection in Composite Materials Using Frequency Response Methods. Compos. Part B Eng. 2002, 33, 87–95. [Google Scholar] [CrossRef]
- Carden, E.P.; Fanning, P. Vibration Based Condition Monitoring: A Review. Struct. Health Monit. 2004, 3, 355–377. [Google Scholar] [CrossRef]
- Garcia, D.; Palazzetti, R.; Trendafilova, I.; Fiorini, C.; Zucchelli, A. Vibration-Based Delamination Diagnosis and Modelling for Composite Laminate Plates. Compos. Struct. 2015, 130, 155–162. [Google Scholar] [CrossRef]
- Ooijevaar, T.H.; Loendersloot, R.; Warnet, L.L.; de Boer, A.; Akkerman, R. Vibration Based Structural Health Monitoring of a Composite T-Beam. Compos. Struct. 2010, 92, 2007–2015. [Google Scholar] [CrossRef]
- Loendersloot, R.; Ooijevaar, T.H.; Warnet, L.; de Boer, A.; Akkerman, R. Vibration Based Structural Health Monitoring and the Modal Strain Energy Damage Index Algorithm Applied to a Composite T-Beam. In Vibration and Structural Acoustics Analysis; Springer: Dordrecht, The Netherlands, 2011; pp. 121–150. [Google Scholar]
- Jyrki, K.; Kari, S.; Anthony, E. Vibration-Based Structural Health Monitoring of a Simulated Beam with a Breathing Crack. Key Eng. Mater. 2013, 569–570, 1093–1100. [Google Scholar] [CrossRef]
- Ho, D.-D.; Thanh-Cao, L. Structural Health Monitoring of Prestressed Concrete Beams by Vibration- and Impedance-Based Smart Technologies. In Proceedings of the IOP Conference Series: Materials Science and Engineering, Chennai, India, 16–17 September 2020; Volume 849, p. 012086. [Google Scholar]
- Huang, Y.; Meyer, D.; Nemat-Nasser, S. Damage Detection with Spatially Distributed 2D Continuous Wavelet Transform. Mech. Mater. 2009, 41, 1096–1107. [Google Scholar] [CrossRef]
- Newland, D.E. An Introduction to Random Vibrations, Spectral & Wavelet Analysis; Courier Corporation: New York, NY, USA, 1993; ISBN 0486136965. [Google Scholar]
- Wang, W.J.; McFadden, P.D. Application of Orthogonal Wavelets to Early Gear Damage Detection. Mech. Syst. Signal Process. 1995, 9, 497–507. [Google Scholar] [CrossRef]
- Surace, C.; Ruotolo, R. Crack Detection of a Beam Using the Wavelet Transform. In Proceedings of the 12th International Modal Analysis Conference; Spie International Society for Optical, Honolulu, HI, USA, 32 January–3 February 1994; Volume 1141, pp. 1141–1167. [Google Scholar]
- Salehian, A. Identifying the Location of a Sudden Damage in Composite Laminates Using Wavelet Approach. In Proceedings of the Submitted to 16th ASCE Conference, Baltimore, Maryland, 13–16 July 2003; University of Washington: Seattle, WA, USA, 2003; p. 79. [Google Scholar]
- Yan, Y.J.; Yam, L.H. Detection of Delamination Damage in Composite Plates Using Energy Spectrum of Structural Dynamic Responses Decomposed by Wavelet Analysis. Comput. Struct. 2004, 82, 347–358. [Google Scholar] [CrossRef]
- Shi, A.; Yu, X.H. Structural Damage Detection Using Artificial Neural Networks and Wavelet Transform. In Proceedings of the CIMSA 2012—2012 IEEE International Conference on Computational Intelligence for Measurement Systems and Applications, Tianjin, China, 2–4 July 2012; pp. 7–11. [Google Scholar]
- Fallahian, M.; Ahmadi, E.; Khoshnoudian, F. A Structural Damage Detection Algorithm Based on Discrete Wavelet Transform and Ensemble Pattern Recognition Models. J. Civ. Struct. Health Monit. 2022, 12, 323–338. [Google Scholar] [CrossRef]
- Kaur, K.; Alamdari, M.M.; Chang, K.C.; Kim, C.W.; Atroshchenko, E. Damage Detection and Localization for Indirect Bridge Monitoring Exploiting Adversarial Autoencoder and Wavelet Transform. In Lecture Notes in Civil Engineering; Springer International Publishing: Cham, Switzerland, 2023; Volume 253, pp. 657–667. ISBN 9783031072536. [Google Scholar]
- Pradeep, P.A.; Thankachan, P.; Pillai, T.M.M. Vibration-Based Damage Detection on Plate Structure Using Wavelet Transform Method. In Structural Integrity; Springer International Publishing: Cham, Switzerland, 2023; Volume 26, pp. 477–487. [Google Scholar]
- Ruan, Z.G.; Ying, Z.G. Comparative Study of Structural Anomaly Diagnosis Based on ANN Model Using Random Displacement and Acceleration Responses with Incomplete Measurements. Sensors 2022, 22, 4128. [Google Scholar] [CrossRef]
- Mallat, S. A Wavelet Tour of Signal Processing; Academic Press: London, UK, 1999. [Google Scholar]
- Ovanesova, A.V.; Suárez, L.E. Applications of Wavelet Transforms to Damage Detection in Frame Structures. Eng. Struct. 2004, 26, 39–49. [Google Scholar] [CrossRef]
- Jahangir, H.; Esfahani, M.R. Structural Damage Identification Based on Modal Data and Wavelet Analysis. In Proceedings of the 3rd National Conference on Earthquake & Structure, Kerman, Iran, 17–18 October 2012. [Google Scholar]
- Gao, R.X.; Yan, R. Wavelets: Theory and Applications for Manufacturing; Springer: Boston, MA, USA, 2011; ISBN 978-1-4419-1544-3. [Google Scholar]
- Baghiee, N.; Reza Esfahani, M.; Moslem, K. Studies on Damage and FRP Strengthening of Reinforced Concrete Beams by Vibration Monitoring. Eng. Struct. 2009, 31, 875–893. [Google Scholar] [CrossRef]
- Jahangir, H.; Hasani, H.; Esfahani, M.R. Wavelet-Based Damage Localization and Severity Estimation of Experimental RC Beams Subjected to Gradual Static Bending Tests. Structures 2021, 34, 3055–3069. [Google Scholar] [CrossRef]
- Smith, M. ABAQUS/Standard User’s Manual, Version 6.9; Simulia: Providence, RI, USA, 2009. [Google Scholar]
- Pappalardo, C.M.; Guida, D. System identification and experimental modal analysis of a frame structure. Eng. Lett. 2018, 26, 1–13. [Google Scholar]
- Sohn, H.; Czarnecki, J.A.; Farrar, C.R. Structural Health Monitoring Using Statistical Process Control. J. Struct. Eng. 2000, 126, 1356–1363. [Google Scholar] [CrossRef]
- Sadeghi, F.; Mousavi, M.; Zhu, X.; Rashidi, M.; Samali, B.; Gandomi, A.H. Damage Detection of Composite Beams via Variational Mode Decomposition of Shear-Slip Data. J. Struct. Eng. 2023, 149, 04022226. [Google Scholar] [CrossRef]
- Khan, S.M.; Hanif, M.U.; Khan, A.; Hassan, M.U.; Javanmardi, A.; Ahmad, A. Damage Assessment of Reinforced Concrete Beams Using Cost-Effective MEMS Accelerometers. Structures 2022, 41, 602–618. [Google Scholar] [CrossRef]
- Sun, Z.; Chang, C.C. Statistical Wavelet-Based Method for Structural Health Monitoring. J. Struct. Eng. 2004, 130, 1055–1062. [Google Scholar] [CrossRef]
- Hanif, M.U.; Ibrahim, Z.; Ghaedi, K.; Hashim, H.; Javanmardi, A. Damage Assessment of Reinforced Concrete Structures Using a Model-Based Nonlinear Approach—A Comprehensive Review. Constr. Build. Mater. 2018, 192, 846–865. [Google Scholar] [CrossRef]
- Han, J.-G.; Ren, W.-X.; Sun, Z.-S. Wavelet Packet Based Damage Identification of Beam Structures. Int. J. Solids Struct. 2005, 42, 6610–6627. [Google Scholar] [CrossRef]
- Daubechies, I. Ten Lectures on Wavelets; SIAM: Philadelphia, PA, USA, 1992. [Google Scholar]
- Abry, P. Ondelettes et Turbulence. Multirésolutions, Algorithmes de Décomposition, Invariance d’échelles; Nouveaux essais; Diderot multimédia: Paris, France, 1997; ISBN 2-84134-064-3. [Google Scholar]
- Teolis, A. Computational Signal Processing with Wavelets; Birkhäuser Boston: Boston, MA, USA, 1998. [Google Scholar]


| Wavelet Families | Nomenclature | Mother Wavelets |
|---|---|---|
| Daubechies | db | db1 = haar, db2, db3, db4, db5, db6, db7, db8, db9, db10 |
| Symlets | sym | sym2, sym3, sym4, sym5, sym6, sym7, sym8 |
| Coiflets | coif | coif1, coif2, coif3, coif4, coif5 |
| BiorSplines | bior | bior1.1, bior1.3, bior1.5, bior2.2, bior2.4, bior2.6, bior2.8, bior3.1, bior3.3, bior3.5, bior3.7, bior3.9, bior4.4, bior5.5, bior6.8 |
| ReverseBior | rbio | rbio1.1, rbio1.3, rbio1.5, rbio2.2, rbio2.4, rbio2.6, rbio2.8, rbio3.1, rbio3.3, rbio3.5, rbio3.7, rbio3.9, rbio4.4, rbio5.5, rbio6.8 |
| Meyer | meyr | meyr |
| Dmeyer | dmey | dmey |
| Gaussian | gaus | gaus1, gaus2, gaus3, gaus4, gaus5, gaus6, gaus7, gaus8 |
| Mexican_hat | mexh | mexh |
| Morlet | morl | morl |
| Complex Gaussian | cgau | cgau1, cgau2, cgau3, cgau4, cgau5 |
| Shannon | shan | shan1-1.5, shan1-1, shan1-0.5, shan1-0.1, shan2-3 |
| Frequency B-Spline | fbsp | fbsp1-1-1.5, fbsp1-1-1, fbsp1-1-0.5, fbsp2-1-1, fbsp2-1-0.5, fbsp2-1-0.1 |
| Complex Morlet | cmor | cmor1-1.5, cmor1-1, cmor1-0.5, cmor1-0.1 |
| Damage Scenario | Crack (Slot) Location | x (mm) | Abbreviations |
|---|---|---|---|
| Single | Left | 500 | S_L |
| Middle | 1100 | S_M | |
| Right | 1900 | S_R | |
| Double | Left and Right | 500 and 1900 | D_LR |
| Left and Middle | 500 and 1100 | D_LM | |
| Middle and Right | 1100 and 1900 | D_MR | |
| Triple | Left, Middle, and Right | 500, 1100 and 1900 | T_LMR |
| Damage Index | Proper Mother Wavelets |
|---|---|
| DI_MW | db10, fbsp1-1-0.5 |
| DI_SW | db2, db6, db9, sym2, sym7, bior2.8, bior3.1 |
| DI_MW and DI_SW | shan1-0.5, shan1-0.1, fbsp2-1-0.1 |
Disclaimer/Publisher’s Note: The statements, opinions and data contained in all publications are solely those of the individual author(s) and contributor(s) and not of MDPI and/or the editor(s). MDPI and/or the editor(s) disclaim responsibility for any injury to people or property resulting from any ideas, methods, instructions or products referred to in the content. |
© 2023 by the authors. Licensee MDPI, Basel, Switzerland. This article is an open access article distributed under the terms and conditions of the Creative Commons Attribution (CC BY) license (https://creativecommons.org/licenses/by/4.0/).
Share and Cite
Soleymani, A.; Jahangir, H.; Rashidi, M.; Mojtahedi, F.F.; Bahrami, M.; Javanmardi, A. Damage Identification in Reinforced Concrete Beams Using Wavelet Transform of Modal Excitation Responses. Buildings 2023, 13, 1955. https://doi.org/10.3390/buildings13081955
Soleymani A, Jahangir H, Rashidi M, Mojtahedi FF, Bahrami M, Javanmardi A. Damage Identification in Reinforced Concrete Beams Using Wavelet Transform of Modal Excitation Responses. Buildings. 2023; 13(8):1955. https://doi.org/10.3390/buildings13081955
Chicago/Turabian StyleSoleymani, Atefeh, Hashem Jahangir, Maria Rashidi, Farid Fazel Mojtahedi, Michael Bahrami, and Ahad Javanmardi. 2023. "Damage Identification in Reinforced Concrete Beams Using Wavelet Transform of Modal Excitation Responses" Buildings 13, no. 8: 1955. https://doi.org/10.3390/buildings13081955