Abstract
Most of the existing engineering structures were built in the last century and have been in service for decades. However, environmental degradation may lead to a reduction in structural performance and service life. The mechanical property data of full-scale structures, such as bridges, are essential for structural health monitoring. For this purpose, five (half) reinforced concrete (RC) T-beams were removed from a retired 31-year-old bridge and subjected to destructive testing. Two loading points were employed, and the flexural and shear capacities of the retired T-beams were studied. The results showed that all the retired beams held high load capacities (exceeding 1400 kN). The two flexural test beams exhibited a high ductility, and the three shear test beams all failed. In addition, the existing cracks in the flexural test beams reopened when the load exceeded 200 kN, while it was 300 kN for the shear test beams. The load-carrying capacity experimental values of the test beams were compared with the ones calculated according to Chinese code JTG-3362-2018; it was shown that the retired T-beams still maintained a high degree of safety margins despite initial defects. The experimental results are expected to provide a reference for the assessment of in-service RC bridges.
1. Introduction
Reinforced concrete structures are one of the most widely used forms of building structures, but most structures suffer from environmental corrosion [1,2,3], natural hazards (floor and wind loads, fires, earthquakes, etc.) [3,4,5,6,7], impacts [8,9], and increasing vehicle loads [6,10]. The structural damage caused by extreme loads has already caught the attention of scholars, driving the development of structural health monitoring (SHM), which is assisted by sensors and advanced algorithms [7,11,12,13]. In order to determine structural behavior under failure and to provide sufficient data for the SHM, destructive tests on structures, especially bridges, are essential. Understanding the potential load-bearing capacity of existing bridges can enable more effective allocation of highway maintenance funds [14]. However, due to the high cost and test configuration size, it is not easy, in comparison with the laboratory-scale tests, to investigate the load-bearing capacity of full-scale aged beams [15,16]. A full-scale load-carrying capacity test is an effective way to explore the actual load capacity of the aged concrete beams, but the reports in the literature are limited.
Song et al. [17] conducted destructive tests on two full-scale decommissioned RC T-girder bridges by applying cyclic loads; the tests revealed that the dismantled beams continued to hold a significant load-bearing capacity. Li et al. [18] conducted destructive tests on an RC T-beam bridge built in 1982, with a span of 20 m. The test results showed that although the operating vehicle load on the bridge was heavier than the design vehicle load and caused structural damage, the actual flexural capacity could still meet the demand of the design loads. A destructive test of the dismantled component of the existing hollow slab bridge indicated that the actual flexural capacity of the hollow slab beam determined by the failure test was 1.52 times that of the normally calculated bearing capacity [19]. Additionally, some scholars have investigated the mechanical properties of prestressed concrete (PC) girders. Fu and Wu [20] found that the load capacity of the precast 25 m PC box girder could reach 2.2 times that of the design load, but the measured effective prestress was relatively low. Another test of the flexural behavior of a 30 m precast PC box girder showed that the concrete in the upper flange was not fully utilized [21]. Research on damaged PC box girders showed that defects reduced the stiffness and load-bearing capacity, but transverse tie rods kept the system from failing due to partial damage [22,23]. The testing of two 50-year-old PC I-girders found that despite the adhesion of a part of the deck slab to the top portion, the test capacity of the specimens was still sufficient to carry the expected loads in both the service and ultimate limit states [24]. Destructive testing of PC girders with corroded pre-tensioned reinforcement proved that corrosion increased the prestress loss in the strand/wire and caused degradation of the load-bearing capacity of the buildings [25,26,27,28,29]. A shear test of 20-year-old PC hollow beams demonstrated that the structure still performed well and had good ductility, while the safety margin was only 6% [30]. In addition, plenty of full-scale shear tests were conducted in the Netherlands and Denmark. Shear experiments on PC bridges showed that the shear span-depth ratio should be considered once it exceeds 2.5 [31]. The cast-in-between slab was considered to be the highest unity check part in the PC bridge deck [31], while the fatigue tests on prestressed concrete bridge decks showed that the compressive membrane action enhances the punching capacity of the deck [32,33]. To save significant rehabilitation costs, Schmidt et al. proposed a novel aggressive alkali silica reaction (ASR) test method that can be used to perform shear testing locally on concrete bridges [34]. Taffe et al., employed the non-destructive testing in civil engineering (NDT-CE) method for the investigation of beams where the cause or extent of damage was unclear [35]. Furthermore, Lombardi Engineering and Politecnico di Milano and Politecnico di Torino embarked on the BRIDGE|50 project in 2018. A set of 29 beams (25 I-beams and 4 box beams) and two piers caps with a lifetime of about 50 years were used in a plan to investigate the mechanical and chemical properties of the material in a project which was expected to contribute a modern approach to the life-cycle design of bridges and to improve safety, maintenance, and the management of existing infrastructure systems [36,37].
The concrete properties of in-service buildings are also important to SHM, as they are the key to determining the structural bearing capacity and change over time. One of the common problems concerning the concrete properties is the SRA mentioned above [34], which can lead to extensive cracking of the structure and further affect the load-bearing capacity. To address the issue, some concrete material samples from existing concrete structures were tested. Some studies suggested that the compressive strength of concrete sample cores of decommissioned PC beams in different operating environments could easily exceed the expected values [38,39,40,41]. A method was developed by Nilimaa and Nilforoush for testing the concrete direct tensile strength of existing structures with a nearly 25% reduction in measured tensile strengths [42]. Additionally, the fracture energy of concrete is also essential [43].
Based on the detection and monitoring data, the strengthening of the defective bridges to satisfy the requirements is of great concern. The current effective rehabilitation methods for bridges include the steel plate rehabilitation method [44], the FRP reinforcement method [45,46], and the new-field concrete material (ECC, UHPC, etc.) rehabilitation method [44,47,48]. Due to defects like cracks, the test beams mentioned in this study were strengthened with steel plates during service time.
A full-scale test of aged concrete T-beams provides first-hand information for the evaluation and repair of existing bridges. Consequently, as a method for understanding the deformation performance and load-carrying capacity of existing bridges, it is irreplaceable. This article conducts experimental research on the 16 m retired RC T-beams that have been in operation for nearly 31 years in Shawan Bridge in Guangzhou City. The study investigates the load-carrying capacity and failure modes of the T-beams under flexural and shear loads, with the aim of providing reliable scientific evidence for the design, maintenance, and dismantling decisions of similar bridges.
2. Experimental Program
2.1. Engineering Background
Shawan Bridge in Guangzhou, China was built and began its service in December 1992. It is located on County Road X270 in the Panyu District of Guangzhou City. The design loads of Shawan Bridge are illustrated in Table 1. The superstructure of the approach bridge consists of 16 m RC beams. The sub-structure of the approach bridge is a pile-column type pier with a drilled pile foundation. Due to the reconstruction of the route, some of the RC T-beams needed to be dismantled.

Table 1.
Design loads of Shawan Bridge.
According to the inspection report on the bridge, the conditions of the concrete are as follows: the concrete strength for the RC T-beam component is 50.5 MPa, which is higher than the design value (40 MPa). There are about 5 to 10 cracks in each RC T-beam, with the crack lengths ranging from L = 30 to 1280 cm and a crack width of δ ≤ 0.13 mm. The measured value of the thickness of the reinforcement protective layer is 27.9 mm, which is less than the design value of 30 mm and has a slight impact on the durability of the steel rebars. Based on the “Technical Condition Evaluation Standard for Highway Bridges” (JTG/TH21-2011) [49], the rating of the RC T-beam component of the bridge is 73.13, and the technical condition evaluation level is third-class, which indicates comparable deterioration and durability deficiencies.
2.2. Details of the Tested Beams
Five retired T-beams were selected for load-bearing research. The beams were rehabilitated with steel plates. Due to the limitations of the transportation and laboratory conditions, the original beams were cut. The cutting method, geometric size, reinforcement details, and section reinforcement of the test beam are shown in Table 2 and Figure 1.
Table 2.
Details of tested beams.
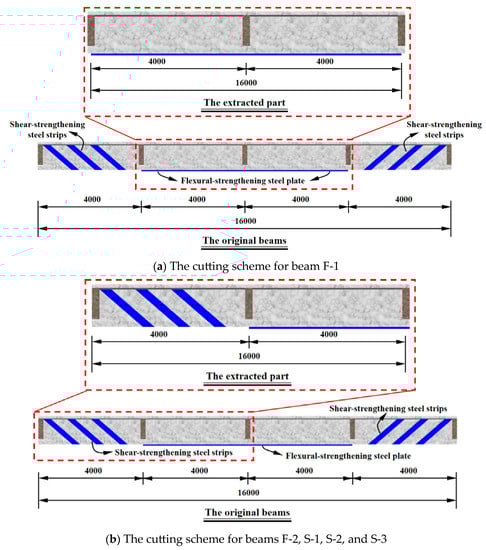
Figure 1.
Schematic diagram of the test beams.
The original reinforcement arrangement is illustrated in Figure 2. The experimental setup of the retired beams is shown in Figure 3.
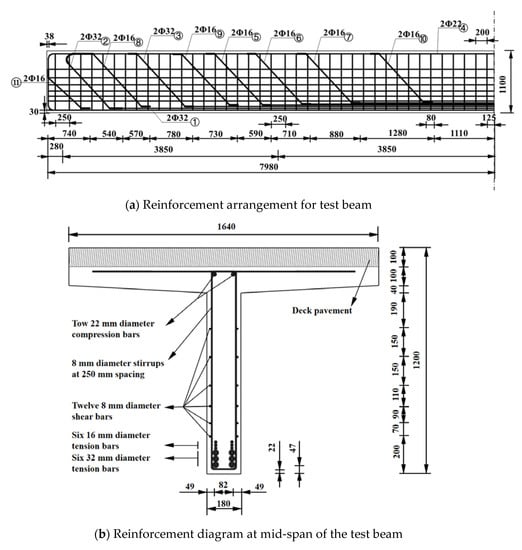
Figure 2.
Reinforcement diagram of section.
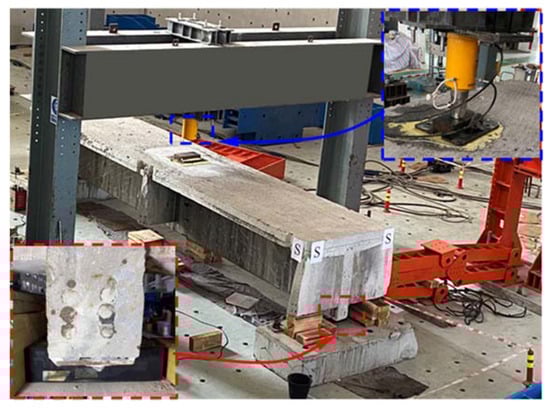
Figure 3.
The retired RC T-beam.
In order to investigate the flexural and shear performance of the retired RC T-beams, F-1 and F-2 were selected for the flexural test, and S-1, S-2, and S-3 were selected for the shear test. The span of all specimens was 8000 mm.
The F-1 beam was strengthened with a steel plate at the bottom of the web, while the other beams were shear-rehabilitated by steel strips on one side of the web and a bending-rehabilitated steel plate on the other side. In order to investigate the differences in the ultimate bearing capacities of the retired beams with differently treated rehabilitating steel plates, the rehabilitated steel plate of flexural beam F-1 was reserved, and the bending-rehabilitated steel plate of beam F-2 was cut every 300 mm to make it ineffective. The bending-rehabilitated plates of all the shear test beams were also reserved, and the shear- rehabilitated steel plate of beam S-1 was also reserved. The shear-rehabilitated steel plates between the implanted bolts of S-2 were cut 5 times to form a partial strengthening effect. The shear-rehabilitated steel plates of S-3 were removed, but the epoxy resin used for bonding the steel plates and concrete remained on the surface of the web.
3. Full-Scale Test
3.1. Loading Test Setup
A 2000 kN manual hydraulic jack was used for loading, and a 200-ton load cell was employed during the loading process. A 700 mm × 1000 mm × 30 mm steel plate was placed under the jack to avoid concrete crushing at the loading point during the experiment. Two rubber bearings with a size of 100 mm × 250 mm × 80 mm were placed on each side of the test beam. For the flexural test beam, the loading point was located at the mid-span; for the shear test beam, the loading point was located at a distance of 2000 mm from the edge of the beam on the shear-strengthening side. To collect the deflections of the test beam during loading, LVDTs with a range of 200 mm were placed under the beam at the mid-span and quarter-point positions. In addition, due to the limitation of the support’s position, two LVDTs were placed at a distance of 400 mm from the edge of the beam to collect the displacement response near the beam end. Strain gauges were arranged according to the diagrams in Figure 4 to measure the strain changes on the surface of the concrete during the loading process. The strain of the steel bars in this study was not recorded because it was hard to place the strain gauges on the reinforcement inside the dismantled beam.
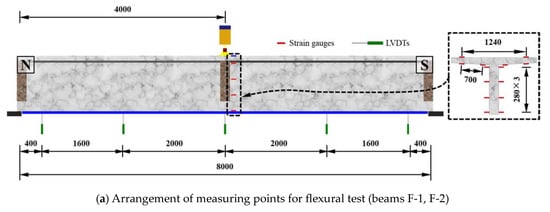
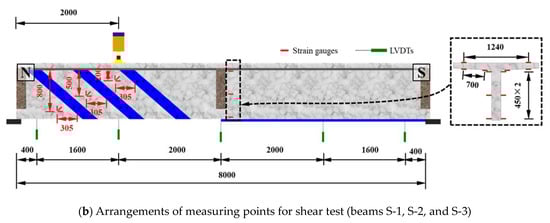
Figure 4.
Sketch of loading positions and measuring point arrangements.
3.2. Loading Program
The same loading procedure was used for both the flexural and the shear tests. Before the formal loading, a 50 kN load was applied to the test beam to check whether the instruments worked normally. The load was then released to zero, and the formal loading began. The formal loading was divided into three stages. Firstly, the load was increased to a speed of 25 kN per step, and cracks were observed every four steps (every 100 kN). When cracks appeared in the test beam, the cracking load was recorded. The loading speed was changed to 10 kN per step once cracks appeared. At this stage, cracks were observed every five steps (every 50 kN). When the load reached 1200 kN, the loading speed was transformed to 0.1 mm/min. For safety considerations, the test ended once the tested beam showed obvious failure modes. A data acquisition system with a frequency of 3 Hz was used to collect data from the load sensors, LVDTs, and strain gauges during the loading process. Details about the data acquisition system can be found in our previous research [50].
4. Results and Discussion
4.1. Test Results
4.1.1. Flexural Test
In consideration of the safety factors, the loading process was stopped when there were obvious signs or characteristics of failure. The failure modes of each test beam are shown in Figure 5. As the test objects were retired beams with local damage, the existing cracks at the S-end (non-shear-strengthening end) of test beams F-1 and F-2 began to extend upwards when the load exceeded 250 kN. Diagonal cracks developed in both beams as the load increased. When the load on test beam F-1 reached 1570.40 kN, the flexural rehabilitated steel plate at the mid-span broke at the weld; hence, the test was stopped. The test of beam F-2 was stopped due to a sudden widening of the diagonal crack at the end of the S-side, which led to a decrease in the load-carrying capacity. The crack distribution on the web and the typical failure characteristics of the flexural test beams are shown in Figure 5.
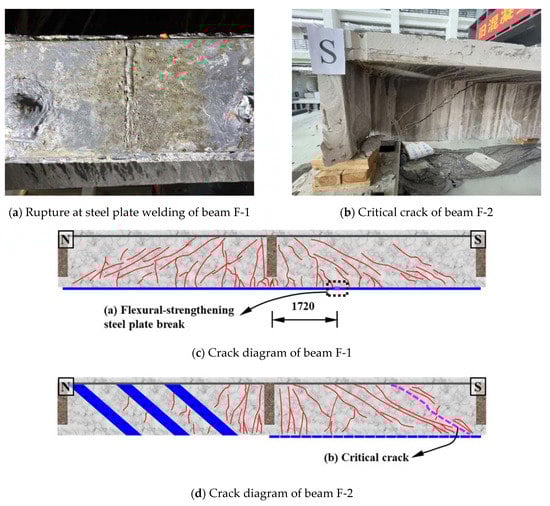
Figure 5.
Damage characteristics and crack diagram of flexural test beam.
4.1.2. Shear Test
For the shear test beams, new cracks began to appear when the load reached 300 kN. The existing cracks did not propagate until the load reached 300 kN as the old cracks did not exist in the shear reinforcement section. Moreover, the reinforcing steel plate and the epoxy resin on the surface contributed to the inhibition of crack development in the early stage. For safety reasons, the loading on the tested beam S-1 was stopped when an apparent separation occurred in the shear-strengthened steel plate. The loading process of test beams S-2 and S-3 was stopped due to the sudden sound along with a rapid increase in concrete surface strain. When loaded to peak load, a larger separation between the bottom of the rehabilitated steel strips and the concrete of beam F-1 was found. Diagonal cracks developed under the loading points of beams F-2 and F-3, and beam F-3 exhibited numerous and dense spiderweb-like cracks. In addition, the cracks produced by the tested beams S-2 and S-3 after the test were much more significant than those of test beam S-1. The reason was that the strengthening steel plate of test beam S-3 was removed, and the strengthening steel plate of test beam S-2 was cut to a fixed length to weaken its reinforcement performance, while the strengthening steel plate of S-1 remained unchanged. The crack distribution on the web and the typical failure characteristics of the flexural test beams are shown in Figure 6.
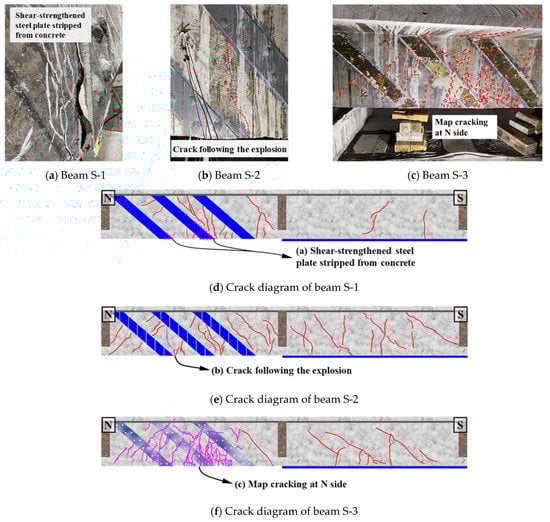
Figure 6.
Damage characteristics and crack diagram of shear test beam.
4.2. Deflection Responses
The load–deflection curves (Figure 7) in the mid-spans of beams F-1 and F-2 in the flexural test can be divided into four stages: (1) The linear stage (curve OA1 or OA2): here, the strain and deflection of the tested beam increased linearly with the applied load. (2) The cracking stage (curve A1B1 or A2B2): here, new cracks appeared continuously with the increasing load; the slopes of the curves were slightly smaller than in the previous phase; beam F-1 developed more diagonal cracks while beam F-2 had fewer but wider diagonal cracks. (3) The nonlinear stage (curve B1C1 or B2C2): when the load reached about 1200 kN, the curves of the test beam started to exhibit a significant deflection, indicating that the tension reinforcement steel yielded, and the curves showed a turning point after which fewer new cracks were observed; the width and length of the existing cracks continued to develop. (4) The load-carrying capacity reduction stage (curve C1D1 or C2D2): when reaching the peak load (1564.38 kN for beam F-1 with the bottom rehabilitated steel plate fractured, and 1460.39 kN for beam F-2 with the shear failure of the concrete at the end of the S-side), the load–deflection curves showed a second turning point; then, the load–carrying capacity began to decrease.
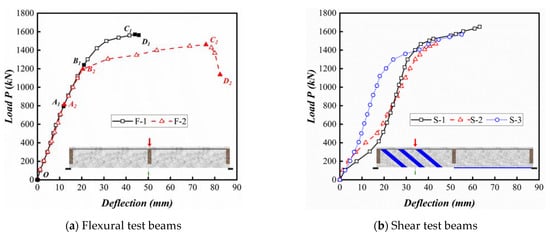
Figure 7.
Load deflection curve of the test beam at the loading point.
The shear bearing capacity test was stopped for safety reasons due to the relatively high load and dangerous characteristics of the shear failure, which was sudden and brittle with little ductility [51]. The maximum load collected after the occurrence of a significant failure signal was taken as the ultimate load of the beam. Thus, the curves of beams S-1, S-2, and S-3 did not exhibit a load-carrying reduction stage.
4.3. Concrete Strain
4.3.1. Load–Strain Curves on the Top Flange and Web Bottom
Figure 8 shows the load–strain curves on the top flange and the web bottom of the tested beam; these are derived from the average of the values of the two strain gauges (Figure 4). The data acquisition channels of the instrument failed to collect data for beam F-1 during the loading process; so, the load–strain curve for the F-1 test beam was not provided. As for the strain on the top flange in Figure 8a, F-2 eventually underwent shear failure; its strain on the top flange exceeded 2500 με upon failure. For the shear test beams, the strains on the top flange did not reach the ultimate compressive strain of concrete when the load reached a peak value. Regarding the web bottom strain, it can be seen from Figure 8b that, with the exception of beam S-2, the other test beams had strain gauges destroyed in sequence after the load exceeded 600 kN due to the development of existing cracks or the appearance of new cracks. The maximum strain collected did not exceed 1000 με. In addition, for the test beams F-2, S-1, S-2, and S-3, the load–strain curves on the top flanges exhibited linear changes before the load exceeded 1200 kN; then, a turning point appeared, after which the curves began to show non-linear behavior.
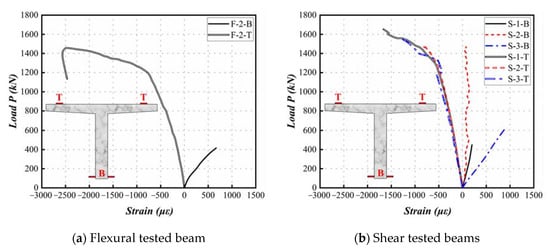
Figure 8.
Load–strain curves of the tested beams.
4.3.2. Strain Distribution at the Mid-Span Section of Flexural Test Beams
Figure 9 shows the strain distributions through the depth of the mid-span section of beam F-2.
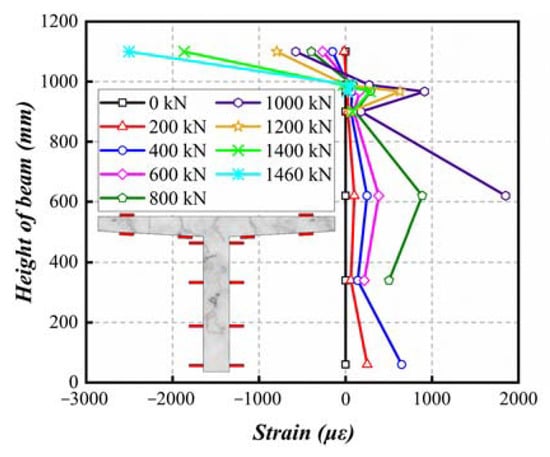
Figure 9.
Strain distributions through the depth of beam F-2.
When the load reached 400 kN, the response of beam F-2 was still in the linear elastic stage. Once the test load exceeded 400 kN, the cracks started to develop, and the strain gauges on the web started to show non-linearity, while those on the bottom of the beam became invalid due to the cracking through the measuring points. These phenomena may be caused by the reopening of old cracks or the initiation of new cracks during loading. From the strain distributions of beam F-2, it can be seen that before the test load reached 800 kN, the section generally conformed to the assumption of a plane section [51,52], with the neutral axis of the section at around 1000 mm from the beam bottom.
4.3.3. Principal Tensile Strain at Shear Span of the Shear Test Beam
The rosette strain gauges X-1, X2, and X3 were arranged on the surface of the concrete of the web of the shear test beam to analyze the variations of the concrete strains. The arrangements are shown in Figure 4b,d.
Figure 10a–c show the principal strain variations of the concrete with different load levels in the shear span of the retired beams. The positive values represent principal tensile strain, and the negative ones represent principal compressive strain. All the rosette strain gauges of beam S-1 suddenly failed when the load exceeded 1500 kN. The strain rate of the principal tensile strain increased, while the load–strain curves of the compressive strain rosettes X1, X2, and X3 remained linear until failure. The principal strain development trends of beam S-2 were similar to those of S-1. However, compared to the sudden failure of the rosette strain gauges of beam S-1, rosette strain gauge X1 of beam S-2 increased linearly and slowly to about 4000 με. At this point, the concrete in this area had already failed due to cracking, and its maximum effective load capacity should have been 400 kN. This phenomenon may also relate to the reopening of the closed old cracks during loading. The curve of beam S-3 showed no significant turning point in the principal tensile or compressive strains of X1 and X3, and they failed at the load levels of 600 kN and 1000 kN, respectively. As shown in Figure 6f, due to the absence of cracks in the location where the rosette strain gauge X2 was located, the strain value at this site remained low (not exceeding 1000 με) until the end of the loading process.
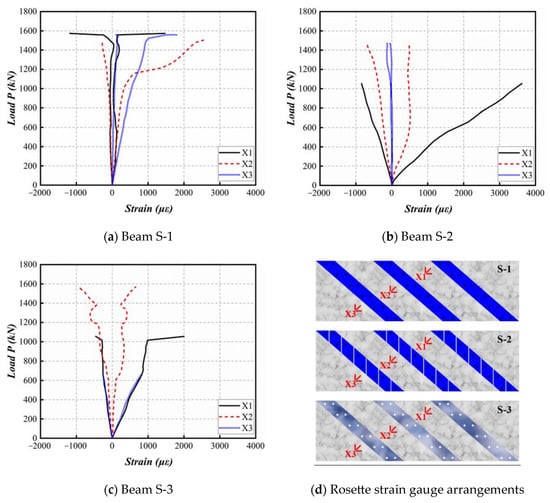
Figure 10.
Load–principal strain of shear test beam.
From Figure 10, it can be seen that the principal strains of the three test beams were linearly proportional to the load before cracking, indicating that the beams exhibited a linear elastic stage. During the loading process, the principal tensile strain increased rapidly while the principal compressive strain increased less. Most of the measured principal compressive and tensile strains of the three test beams were between −1000 με and 1000 με. Beam S-1 showed the highest cracking load at around 1000 kN, while beam S-3 showed the lowest cracking load at around 400 kN. Therefore, it can be concluded that the addition of strengthening steel plates can increase the cracking load of the tested beams.
4.4. Flexural and Shear Capacity of Retired Beams Calculated by Chinese Code
The calculation of the flexural capacity of the test beam conforms with the “Code for Design of Highway Reinforced Concrete and Prestressed Concrete Bridges and Culverts” (JTG-3362-2018) [53].
where fc is the axial compressive strength of concrete, taken as 20.1 MPa according to the “Code for Design of Concrete Structures” (GB 50010-2010) [54]. fs is the tensile strength of longitudinal steel. h’f is the flange thickness of the T-shaped section. b’f is the effective width of the compressed flange of the T-shaped section. h0 is the effective height of the section. The values of the above symbols are shown in Table 3.
Table 3.
Symbol values of Equations (1)–(3).
The calculation of the shear bearing capacity of the test beam can be expressed as follows, based on formulas 5.2.9-1, 5.2.9-2, and 5.2.9-3 of the code JTG-3362-2018 [54]:
Vcs is the shear bearing capacity of the concrete and stirrups in the oblique section, and Vsb is the shear bearing capacity of the bent-up steel bars intersecting with the oblique section. α1 is the coefficient for the effect of bending with opposite signs. α2 is the coefficient for prestress enhancement. α3 is the coefficient for the effect of the compressed flange. fcu,k is the standard compressive strength of a 150 × 150 × 150 mm3 cube. fsv is the design tensile strength of the stirrups. θs is the angle between the bent-up steel bars and the horizontal plane. h0 is the effective height of the section, and P is the reinforcement percentage of the longitudinal tension steel bars in the oblique section, P = 100ρ, where ρ = As/bh0; As is the cross-sectional area of the bent-up bars in the same bending plane of the oblique section, and Vsv is the reinforcement ratio of the stirrups in the oblique section. b is the width of the T-shaped section web. The values of the mentioned symbols in Equations (4)–(6) are shown in the Table 4.
Table 4.
Symbol values of Equations (4)–(6).
The measured loads, measured shear forces in support, calculated shear strengths, measured flexural strengths, calculated flexural strengths, and deflections are listed in Table 5. The ratios of the measured shear forces to calculated shear strengths and the ratios of the measured flexural capacities to calculated flexural strengths are also illustrated in the table.
Table 5.
Summary table of test beam loads.
The maximum load value Pe in the table is the maximum value collected during the test; Vc is the calculated value of the shear capacity at the oblique section of the loading point; Ve is the maximum reaction force at the support by experiment; for beams F-1 and F-2, these are 0.5(Pe + FG), and for beam S-x, these are 0.75Pe + 0.5FG; FG is the weight of the beam, FG = γGAl; γG is the unit weight of the beam, taken as 25 kN/m3; A is the total cross-sectional area, taken as 354,200 mm2; l is the beam length, taken as 8 m; Mc is the calculated value of the bending capacity at the positive section of the loading point; Me is the bending moment at the loading point, where MeF = 0.25Pel + 0.125γGAl2 and MeF = 3Pel/16 + 3γGAl2/32. MeF is the bending moment at the loading point of beams F-1 and F-2, and MeF is the bending moment at the loading point of the beam S-x.
From the comparison between the bending capacity calculation results and the test values in Table 5, it can be seen that the test values of the bending capacity of the section are all higher than the calculated values. The test moment values of beams F-1 and F-2 are 37% and 45% higher than the calculated values, respectively. The test moment values of beams S-1, S-2, and S-3 are 95%, 73%, and 83% higher than the calculated values. For the shear force, the calculated shear forces of the flexural test beam were close to those of the experimental data, while the test shear forces of the shear test beam were about 1.5 times those of the calculated ones. As a result, it can be concluded that the actual bending capacity and shear bearing capacity of the test beams have a sufficient safety margin. Due to the fact that reliability indices are commonly generated from a series of structural designs with prospective partial safety factors and are used for comparison with the prescribed target reliability index [55,56], the above results can potentially provide a reference for the calibration and updating of a prescribed target reliability index for similar RC bridges in limit state design.
5. Conclusions
After conducting full-scale tests on five 16 m RC T-beams that have been in service for nearly 31 years, including two flexural and three shear test beams, the following conclusions can be drawn:
- (1)
- In the flexural test, when the loading exceeded 250 kN, existing cracks on one side of the test beams began to reopen and extend upwards. Beam F-1 had a flexural strengthening steel plate fracture at the bottom of the mid-span when loaded to 1564.4 kN, and the loading began to decrease afterwards. Beam F-2 experienced a sudden increase in the width of a diagonal crack at one side; hence, the load-carrying capacity decreased. At the end of the test, a major diagonal crack that developed from the shear-bending diagonal crack appeared in beam F-2.
- (2)
- In the shear test, new cracks appeared in all the test beams when the applied load exceeded 300 kN. The loading of beam S-1 was stopped due to the apparent separation between the shear-strengthening steel plate and the beam. The testing of beams S-2 and S-3 ended with an abrupt explosion of sound. There were fewer cracks in beams S-2 and S-3 than in beam S-1. None of the three shear test beams developed a major crack by the end of the test.
- (3)
- The ultimate load of each test beam exceeded 1400 kN, and the deflection at the loading point was more than 40 mm; this revealed that the retired full-scale beams exhibited high load-carrying capacity and ductile damage characteristics after long-term service.
- (4)
- Comparing the test values with the calculation results of JTG-3362-2018, the retired beams have adequate safety margins. The value of Me/Mc of the flexural test beam is about 1.4, and the value of Ve/Vc of the shear test beam is about 1.5.
Author Contributions
Conceptualization, H.J. and Z.F.; methodology, H.J. and Z.F.; validation, F.M. and Z.C.; formal analysis, H.J., J.W. and H.F.; investigation, J.W. and H.F.; resources, H.J., S.Z. and Z.X.; data curation, J.W. and H.F.; writing—original draft preparation, Z.C., J.W. and H.F.; writing—review and editing, H.J., H.F. and Z.F.; supervision, H.J., H.F. and Z.F.; project administration, H.J., S.Z. and Z.X.; funding acquisition, H.J. All authors have read and agreed to the published version of the manuscript.
Funding
The research presented was funded by the National Natural Science Foundation of China (grant number 52208156), the China Postdoctoral Science Foundation (grant number 2022M720874), the Basic and Applied Basic Research Foundation of Guangdong Province (grant number 2022A1515110394), and the National Natural Science Foundation of China (grant number 51778150).
Data Availability Statement
Not applicable.
Acknowledgments
The authors gratefully acknowledge the financial support of this work by the National Natural Science Foundation of China (grant number 52208156), the China Postdoctoral Science Foundation (grant number 2022M720874), the Basic and Applied Basic Research Foundation of Guangdong Province (grant number 2022A1515110394) National Natural Science Foundation of China (grant number 51778150).
Conflicts of Interest
The authors declare no conflict of interest.
References
- Wang, B.; Wang, K.; Liu, X.; Xu, Y. Residual Flexural Capacity of Composite Beams with Corroded Studs after Fatigue. J. Bridge Eng. 2023, 28, 04023026. [Google Scholar] [CrossRef]
- Fang, S.; Li, L.; Luo, Z.; Fang, Z.; Huang, D.; Liu, F.; Wang, H.; Xiong, Z. Novel FRP interlocking multi-spiral reinforced-seawater sea-sand concrete square columns with longitudinal hybrid FRP-steel bars: Monotonic and cyclic axial compressive behaviours. Compos. Struct. 2023, 305, 116487. [Google Scholar] [CrossRef]
- Gopu, G.; Sofi, A. The influence of fiber RC beams under flexure on the chloride-induced corrosion. Case Stud. Constr. Mater. 2022, 17, e01566. [Google Scholar] [CrossRef]
- Budak, E.; Sucuoğlu, H.; Celik, O. Response parameters that control the service, safety and collapse performances of a 253 m tall concrete core wall building in Istanbul. Bull. Earthq. Eng. 2023, 21, 375–395. [Google Scholar] [CrossRef]
- Liu, C.; Wang, P.; Lu, X.; Miao, J.; Wang, X. Residual flexural behaviour comparison between composite and monolithic beams after fire exposure. J. Build. Eng. 2023, 64, 105584. [Google Scholar] [CrossRef]
- Liu, L.; Yang, X.; Yan, B.; Miao, S. Dynamic responses of RC girder bridge under heavy truck and seismic loads combined. Sustainability 2022, 14, 9263. [Google Scholar] [CrossRef]
- Gong, F.; Wang, Z.; Xia, J.; Maekawa, K. Coupled thermo-hydro-mechanical analysis of reinforced concrete beams under the effect of frost damage and sustained load. Struct. Concr. 2021, 22, 3430–3445. [Google Scholar] [CrossRef]
- Jiang, H.; Huang, C.; Mei, G.; Gao, X.; Tian, Y.; Sun, X. Experimental and numerical investigations on direct shear performance of UHPC dry joints. Eng. Struct. 2023, 283, 115872. [Google Scholar] [CrossRef]
- Fang, S.; Zhang, S.; Cao, Z.; Zhao, G.; Fang, Z.; Ma, Y.; Jiang, H. Effects of stud aspect ratio and cover thickness on push-out performance of thin full-depth precast UHPC slabs with grouped short studs: Experimental evaluation and design considerations. J. Build. Eng. 2023, 67, 105910. [Google Scholar] [CrossRef]
- Ji, X.; Zhu, L.; Su, R.; Wang, G. Lateral overturning process and failure mechanism of curved steel-concrete composite box-girder bridges under specific overloading vehicles. Structures 2022, 35, 638–649. [Google Scholar] [CrossRef]
- Fiandaca, D.; Matteo, A.; Patella, B.; Moukri, N.; Inguanta, R.; Llort, D.; Mulone, A.; Mulone, A.; Alsamahi, A.; Pirrotta, A. An integrated approach for structural health monitoring and damage detection of bridges: An experimental assessment. Appl. Sci. 2022, 12, 13018. [Google Scholar] [CrossRef]
- Ogunniyi, E.; Vareen, A.; Downey, A.; Laflamme, S.; Li, J.; Bennett, C.; Collins, w.; Jo, H.; Henderson, A.; Ziehl, P. Investigation of electrically isolated capacitive sensing skins on concrete to reduce structure/sensor capacitive coupling. Meas. Sci. Technol. 2023, 34, 055113. [Google Scholar] [CrossRef]
- Shevtsov, D.; Cao, N.; Nguyen, V.; Nong, Q.; Le, H.; Nguyen, D.; Zartsyn, I.; Kozaderov, O. Progress in Sensors for Monitoring Reinforcement Corrosion in Reinforced Concrete Structures—A Review. Sensors 2022, 22, 3421. [Google Scholar] [CrossRef] [PubMed]
- Aktan, A.E.; Zwick, M.; Miller, R.; Shahrooz, B. Nondestructive and Destructive Testing of Decommissioned Reinforced Concrete Slab Highway Bridge and Associated Analytica Studies; Transportation Research Board: Washington, DC, USA, 1992. [Google Scholar]
- Wardach, M.; Krentowski, J.; Knyziak, P. Degradation Analyses of Systemic Large-Panel Buildings Using Comparative Testing during Demolition. Materials 2022, 15, 3770. [Google Scholar] [CrossRef] [PubMed]
- Miller, R.; Aktan, A.; Shahrooz, B. Destructive testing of decommissioned concrete slab bridge. J. Struct. Eng. 1994, 120, 2176–2198. [Google Scholar] [CrossRef]
- Song, H.; You, D.; Byun, K.; Maekawa, K. Finite element failure analysis of reinforced concrete T-girder bridges. Eng. Struct. 2002, 24, 151–162. [Google Scholar] [CrossRef]
- Qu, G.; Zhou, G.; Huang, P.; Han, W.; Gong, W.; Yuan, Y. In-house destructive test of dismantled component of existing hollow slab bridge. J. Chang. Univ. (Nat. Sci. Ed.) 2019, 39, 57–66. (In Chinese) [Google Scholar]
- Li, Y.; Zhang, J.; Yu, B. Study on Ultimate Bearing Capacity of an Existing RC T-girder Bridge. J. Highw. Transp. Res. Dev. 2017, 34, 66–71. (In Chinese) [Google Scholar]
- Fu, X.; Wu, R. Experimental Research on Carrying Capacity of Prestressed Concrete Small Box Girder Based on Failure Test. Technol. Highw. Transp. 2020, 36, 54–66. (In Chinese) [Google Scholar]
- Wang, J.; Tang, S.; Zheng, H.; Zhou, C.; Zhu, M. Flexural behavior of a 30-meter full-scale simply supported prestressed concrete box girder. Appl. Sci. 2020, 10, 3076. [Google Scholar] [CrossRef]
- Huffman, J.M. Destructive Testing of a Full-Scale 43 Year Old Adjacent Prestressed Concrete Box Beam Bridge: Middle and West Spans; Ohio University: Athens, OH, USA, 2012. [Google Scholar]
- Wang, C.; Wang, S.; Wang, Q.; Shen, J.; Duan, L. Experimental Study on Bearing Capacity of Dangerous and/or Old Pre-stressed Concrete Box Girders. Eng. Mech. 2019, 36, 171–181. (In Chinese) [Google Scholar]
- Eder, R.; Miller, R.; Baseheart, T.; Swanson, J. Testing of two 50-year-old precast post-tensioned concrete bridge girders. PCI J. 2005, 50, 90–95. [Google Scholar] [CrossRef]
- Pape, T.; Melchers, R. The effects of corrosion on 45-year-old pre-stressed concrete bridge beams. Struct. Infrastruct. Eng. 2011, 7, 101–108. [Google Scholar] [CrossRef]
- Dasar, A.; Irmawaty, R.; Hamada, H.; Sagawa, Y.; Yamamoto, D. Prestress Loss and Bending Capacity of Pre-cracked 40 Year-Old PC Beams Exposed to Marine Environment. In Proceedings of the 3rd International Conference on Civil and Environmental Engineering for Sustainability (IConCEES 2015), Melaka, Malaysia, 1–2 December 2015. [Google Scholar]
- Recupero, A.; Spinella, N. Experimental tests on corroded prestressed concrete beams subjected to transverse load. Struct. Concr. 2019, 20, 2220–2229. [Google Scholar] [CrossRef]
- Rogers, R.; Wotherspoon, L.; Scott, A.N.; Ingham, J. Residual strength assessment and destructive testing of decommissioned concrete bridge beams with corroded pretensioned reinforcement. PCI J. 2012, 57, 100–118. [Google Scholar] [CrossRef]
- Lundqvist, P.; Riihimäki, J. Testing of five 30-year-old prestressed concrete beams. PCI J. 2010, 55, 50–58. [Google Scholar] [CrossRef]
- Du, M.; Zong, Z.; Liao, Y.; Li, M. Shear bearing capacity of existing prestressed concrete hollow slab girder. J. Southeast Univ. (Nat. Sci. Ed.) 2021, 51, 384–390. (In Chinese) [Google Scholar]
- Lantsoght, E.O.L.; Zarate, G.; Zhang, F.; Park, M.K.; Yang, Y.; Sliedrecht, H. Shear experiments of prestressed concrete bridge girders. ACI Struct. J. 2021, 118, 117–130. [Google Scholar]
- Lantsoght, E.O.; Van der Veen, C.; Koekkoek, R.; Sliedrecht, H. Punching capacity of prestressed concrete bridge decks under fatigue. ACI Struct. J. 2019, 116, 209–218. [Google Scholar] [CrossRef]
- Lantsoght, E.O.; Van der Veen, C.; Koekkoek, R.; Sliedrecht, H. Fatigue testing of transversely prestressed concrete decks. ACI Struct. J. 2019, 116, 143–153. [Google Scholar] [CrossRef]
- Schmidt, J.W.; Hansen, S.G.; Barbosa, R.A.; Henriksen, A. Novel shear capacity testing of ASR damaged full scale concrete bridge. Eng. Struct. 2014, 79, 365–374. [Google Scholar] [CrossRef]
- Taffe, A.; Hillemeier, B.; Walther, A. Condition Assessment of a 45-year-old prestressed concrete bridge using NDT and verification of the results. Struct. Mater. Technol. 2010. [Google Scholar] [CrossRef]
- Savino, P.; Tondolo, F.; Sabia, D.; Quattrone, A.; Biondini, F.; Rosati, G.; Anghileri, M.; Chiaia, B. Large-Scale Experimental Static Testing on 50-Year-Old Prestressed Concrete Bridge Girders. Appl. Sci. 2023, 13, 834. [Google Scholar] [CrossRef]
- Anghileri, M.; Biondini, F.; Rosati, G.; Savino, P.; Tondolo, F.; Sabia, D.; Manto, S.; Nivriera, M.; Trincianti, C.; Ventura, D.; et al. Deconstruction of the Corso Grosseto viaduct and setup of a testing site for full scale load tests. In Bridge Maintenance, Safety, Management, Life-Cycle Sustainability and Innovations; CRC Press: Boca Raton, FL, USA, 2021; pp. 3365–3370. [Google Scholar]
- Shu, J.; Bagge, N.; Nilimaa, J. Field destructive testing of a reinforced concrete bridge deck slab. J. Bridge Eng. 2020, 25, 04020067. [Google Scholar] [CrossRef]
- Jeon, C.; Sim, C.; Shim, C. The effect of wire rupture on flexural behavior of 45-year-old post-tensioned concrete bridge girders. Eng. Struct. 2021, 245, 112842. [Google Scholar] [CrossRef]
- Liu, J.; Jia, Y. Destructive testing of twenty-year-old prestressed concrete bridge beams in freezing-thawing region. Civ. Eng. J. 2019, 28, 344–356. [Google Scholar] [CrossRef]
- Kramer, W.; Martin, W.; Viljoen, H. Demolition of Old Oak Bridge B4113: Condition of a 54-year old prestressed concrete bridge. In Proceedings of the International Conference on Concrete Repair, Rehabilitation and Retrofitting (ICCRRR 2018), Cape Town, South Africa, 19–21 November 2018. [Google Scholar]
- Nilimaa, J.; Nilforoush, R. A Direct Tensile Strength Testing Method for Concrete from Existing Structures. CivilEng 2023, 4, 333–344. [Google Scholar] [CrossRef]
- Khalilpour, S.; BaniAsad, E.; Dehestani, M. A review on concrete fracture energy and effective parameters. Cem. Concr. Res. 2019, 120, 294–321. [Google Scholar] [CrossRef]
- Liu, L.; Yu, S.; Ma, X. Flexural capacity of RC beams reinforced with ECC layer and steel plate. J. Build. Eng. 2023, 65, 105781. [Google Scholar] [CrossRef]
- Abdel-Jaber, M.T. Influence of Externally Bonded CFRP on the Shear Behavior of Strengthened and Rehabilitated Reinforced Concrete T-Beams Containing Shear Stirrups. Fibers 2021, 9, 87. [Google Scholar] [CrossRef]
- Abdel-Jaber, M.E.; Abdel-Jaber, M.T.; Katkhuda, H.; Shatarat, N.; Sulaiman, A.; El-Nimri, R. Influence of stirrup spacing on the strengthening and rehabilitating of RC T-beams using near-surface mounted carbon-fiber-reinforced polymer strips. Fibers 2021, 10, 103. [Google Scholar] [CrossRef]
- Fang, H.; Gu, M.; Zhang, S.; Jiang, H.; Fang, Z.; Hu, J. Effects of Steel Fiber and Specimen Geometric Dimensions on the Mechanical Properties of Ultra-High-Performance Concrete. Materials 2022, 15, 3027. [Google Scholar] [CrossRef]
- Said, A.; Elsayed, M.; Abd El-Azim, A.; Althoey, F.; Tayeh, B.A. Using ultra-high performance fiber reinforced concrete in improvement shear strength of reinforced concrete beams. Case Stud. Constr. Mater. 2022, 16, e01009. [Google Scholar] [CrossRef]
- JTG/T H21-2011; Standards for Technical Condition Evaluation of Highway Bridges. Ministry of Transport of the People’s Republic of China: Beijing, China, 2011. (In Chinese)
- Feng, J.; Li, P.; Wu, J.; Jiang, H.; Tian, Y.; Sun, X. Shear behavior of externally prestressed UHPC beams without stirrups. Case Stud. Constr. Mater. 2023, 18, e01766. [Google Scholar] [CrossRef]
- Wu, Y. Analytical Approaches for Reinforced Concrete; Woodhead Publishing: Cambridge, UK, 2022. [Google Scholar]
- Fang, Z.; Fang, H.; Li, P.; Jiang, H.; Chen, G. Interfacial shear and flexural performances of steel–precast UHPC composite beams: Full-depth slabs with studs vs. demountable slabs with bolts. Eng. Struct. 2022, 260, 114230. [Google Scholar] [CrossRef]
- JTG 3362—2018; Specifications for Design of Highway Reinforced Concrete and Prestressed Concrete Bridges and Culverts. China Communications Press: Beijing, China, 2018. (In Chinese)
- GB 50010-2010; Code for Design of Concrete Structures. Ministry of Transport of the People’s Republic of China: Beijing, China, 2010. (In Chinese)
- Melhem, M.M.; Caprani, C.C.; Stewart, M.G. Reliability updating of partial factors for empirical codes: Application to Super-T PSC girders designs at the ultimate limit state in bending. Structures 2022, 35, 233–242. [Google Scholar] [CrossRef]
- Fang, Z.; Hu, L.; Jiang, H.; Fang, S.; Zhao, G.; Ma, Y. Shear performance of high-strength friction-grip bolted shear connector in prefabricated steel–UHPC composite beams: Finite element modelling and parametric study. Case Stud. Constr. Mater. 2023, 18, e01860. [Google Scholar] [CrossRef]


Disclaimer/Publisher’s Note: The statements, opinions and data contained in all publications are solely those of the individual author(s) and contributor(s) and not of MDPI and/or the editor(s). MDPI and/or the editor(s) disclaim responsibility for any injury to people or property resulting from any ideas, methods, instructions or products referred to in the content. |
© 2023 by the authors. Licensee MDPI, Basel, Switzerland. This article is an open access article distributed under the terms and conditions of the Creative Commons Attribution (CC BY) license (https://creativecommons.org/licenses/by/4.0/).