Article

Effects of Anisotropic Mechanical Behavior on Nominal Moment Capability of 3D Printed Concrete Beam with Reinforcement

1
Department of Civil and Environmental Engineering, The Georgia Institute of Technology, 4132 Mason Building, Atlanta, GA 30332, USA
2
Department of Architectural Engineering, The Pennsylvania State University, 222 Sackett Building, University Park, PA 16802, USA
3
Department of Civil and Environmental Engineering, The Pennsylvania State University, 231D Sackett Building, University Park, PA 16802, USA
4
Department of Civil, Construction and Environmental Engineering, The University of New Mexico, 3052 Centennial Engineering Center, Albuquerque, NM 87131, USA
5
Department of Architecture and Landscape Architecture, The Pennsylvania State University, 150 Stuckeman, University Park, PA 16802, USA
6
College of Architecture, Planning, and Public Affairs, University of Texas at Arlington, Arlington, TX 76019, USA
*
Author to whom correspondence should be addressed.
Buildings 2024, 14(10), 3175; https://doi.org/10.3390/buildings14103175 (registering DOI)
Submission received: 11 July 2024 / Revised: 1 October 2024 / Accepted: 3 October 2024 / Published: 5 October 2024
(This article belongs to the Collection Advanced Concrete Structures in Civil Engineering)

Abstract

:
In this study, 3D-printed reinforced concrete beams were tested for flexural performance and compared with the analytical model based on the material test results. Two cementitious mixes (PSU and GCT) were designed for concrete printing and were mechanically tested and compared. Anisotropies in the compressive strength and modulus of elasticity of printed concrete were observed, applied to the analytical prediction of flexural bending behavior, and validated by actual test results. Significant differences between analytical predictions and experimental tests of the bending behaviors of the printed concrete beams were observed. Furthermore, higher compressive strengths and moduli of elasticity were observed when the loading direction was perpendicular to the printed layers or with the PSU mix. The effect of anisotropic mechanical properties on a reinforced beam was compared to the flexural bending tests for both mixes. The analytical model based on the material test results was compared to the flexural bending test results. The significant errors in the prediction of printed concrete’s structural performance, from 10% to 50%, suggest that factors other than reduced compressive strengths may influence the structural behaviors of printed concrete beams.

1. Introduction

Additive Manufacturing (AM) is broadly defined as “a process of joining materials to create parts from 3D model data, typically layer by layer, in contrast to subtractive or formative manufacturing techniques” [1,2]. A key feature of AM is its ability to create geometries by layering sliced sections, allowing for the realization of intricate forms that were previously unattainable through conventional subtractive methods. Cementitious materials are particularly well-suited for AM applications in construction. The construction industry is increasingly adopting AM, mirroring a trend seen across various engineering fields. Early research by Pegna explored the integration of AM into construction processes [3], while Khoshnevis’s pioneering “Contour Crafting” concept adapted rapid prototyping to large-scale manufacturing [4,5]. His work on the rapid fabrication of large-scale objects using various materials, including concrete, also examined reinforcement strategies for 3D-printed concrete, though experimental efforts were limited.
AM of Concrete (AMoC), or 3D Concrete Printing (3DCP), has extended AM into construction due to concrete’s suitability as an AM material [6]. 3DCP offers significant advantages by improving efficiency, reducing material waste, and eliminating the need for molds or formwork typically required in concrete casting. Additionally, 3DCP’s ability to produce complex designs enables cost-effective construction of concrete structures. With the increasing interest in using AM as a sustainable construction practice and the increasing research efforts to move toward the digitalization of processes in the construction industry [7,8,9,10], there is a significant need to understand and predict the material properties of 3D-printed components. As AM is an almost new practice in the construction industry, there has been limited research and experience in support of utilizing this innovative technique in real-world construction. One area of significance is related to the quality of the interlayer bond strength at the interface of successive layers.
AMoC involves extruding cementitious materials layer by layer in the form of filaments from a nozzle mounted on a robotic control system, following a digitally designed path. The interface between consecutively deposited layers is a critical weak point, often referred to as the cold joint, which induces anisotropy. This anisotropy can negatively impact the mechanical performance and durability of 3D-printed concrete structures, posing significant challenges that must be addressed before large-scale implementation [11,12,13,14,15].
Due to the absence of vibrators for further densification or compaction in 3D-printed components, small linear voids often form between extruded filaments during the layer-by-layer extrusion process, leading to anisotropic behavior [16,17,18,19]. These voids, considered defects in printed structures, negatively impact the hardened properties of 3D-printed cementitious materials. However, the pump pressure during extrusion can reduce intra-filament voids, improving the microstructure of the printed materials [18,19]. The combined effect of inter- and intra-filament voids, influenced by print quality and pump pressure, governs the hardened performance of freeform components produced using this technology. The need to study these material properties is evident in recent advances in numerical models to capture the anisotropic behavior of 3D-printed concrete components [13,14,15,20,21]. Malik et al. [12] introduced a novel method using machine learning techniques like GPR, XGBoost, and SVM to predict compressive strength and slump flow based on twenty-one mix features and four output properties. GPR achieved the best performance, with an R² value of 0.9069 for cast strength and over 0.91 for printed strengths in all three directions, along with low RMSE values. Liu et al. [22] conducted nondestructive ultrasonic pulse velocity tests alongside destructive mechanical tests, which revealed the anisotropic behavior of 3D-printed PVA fiber-reinforced concrete (PFRC). Their results led to the development of conversion criteria that correlate ultrasonic signals with mechanical properties, demonstrating effective applicability for 3D-printed fiber concrete. Furthermore, Liu et al. [11] examined its anisotropic behaviors under dynamic and static loads. Results revealed that the static compressive strength of 3D-printed concrete was 15% higher than that of the cast specimens. Notably, dynamic compressive strength was significantly greater in the longitudinal direction than in other 3D-printed and cast specimens. Despite these advancements, challenges persist, particularly in addressing anisotropic mechanical properties, and further research is critical to advancing the application of 3D concrete printing in structural engineering.
This study builds on prior research [8,23,24,25,26,27] initiated at Pennsylvania State University, USA, focused on designing 3D-printable materials and systems for the construction industry. Extensive investigations have been conducted on material selection and reinforcement strategies. To complement those efforts, this study explores the influence of the anisotropic mechanical properties of 3D-printed concrete on its flexural bending behavior. The compressive strength and modulus of elasticity (MOE) of the 3D-printed concrete elements, measured in various directions, are utilized to predict the flexural failure mode and capacity of a printed concrete beam.

2. Materials and Methods

Reduced mechanical properties of printed concrete are intuitively predictable as the interlocking force between printed layers may be weaker than cast concrete due to the fast curing of printed filaments, which can lead to cold joints during the printing process. Of course, this will depend on the quality of the mixture design (use of additives) and the printing speed, among others. Nonetheless, it is reasonable to assume that a printed concrete beam would have lower flexural strength than a cast concrete beam due to the reduced compressive strength.
A lab-scale experimental study of 3D printed reinforced concrete beam is reported here to evaluate whether or not the reduced compressive strength of 3D printed concrete would deteriorate the flexural strength of a 3D printed concrete beam with reinforcement. The measured compressive strength is applied to an analytical model predicting the flexural strength of a 3D-printed concrete beam with and without a reinforcement bar. A flexural testing program resulted in the validation of the analytical moment strength.

2.1. Printable Material

In this study, two dry mixtures were utilized: a non-proprietary mixture (referred to as PSU) and a proprietary mixture (referred to as GCT). The PSU mixture was developed at Pennsylvania State University, USA, through a process of mixture design optimization and printing quality assessment, as detailed in [23,25,28]. This mixture features a quaternary cementitious binder system composed of 67.5% Type I Portland cement (ASTM C150), 20% ground granulated blast furnace slag (BFS, Sika Co., Lyndhurst, NJ, USA), 10% silica fume (SF, Sika Co. , Lyndhurst, NJ, USA), and 2.5% sodium metasilicate (SS, PQ Co., Malvern, PA, USA). Nanoclay (NC, Active Minerals International, LLC, Sparks, MD, USA) was incorporated as a thixotropic agent with an NC/binder ratio of 0.3 to enhance rheological properties. The chemical compositions of these components, obtained by X-ray fluorescence (XRF), are listed in Table 1. Manufactured basalt sand (supplied by Har Tur) with a nominal maximum aggregate size of 1.18 mm was used as the fine aggregate. The fine aggregate-to-binder and water-to-binder ratios were 100% and 45%, respectively.
In addition to the PSU mixture, a dry mixture was provided by Gulf Concrete Technology (GCT), LLC (Long Beach, MS, USA) [24,28], and employed in this study. This commercially available mixture is a blend of ordinary Portland cement (<50%), calcium sulfoaluminate cement (<5–12%), lime (<30%), masonry sand, fibers, and other admixtures. It has a range of particle size from 0.46 μm to 27.4 μm, with D10 = 0.93 μm, D50 = 3.07 μm, and D90 = 8.35 μm (D10, D50, and D90 are the diameters that are larger than 10, 50 and 90% of the particles, respectively). The detailed composition and physical properties of the GCT material can be found elsewhere [24,29].
The GCT dry mixture was characterized by material tests on the cast samples, including compressive strength (ASTM C109) [30], setting time (ASTM C191) [31], and flowability (ASTM C1437) [32]. All the samples were made with a mass ratio of water to the GCT dry material of 0.23, which is consistent with the water flow rate used during 3D printing. Three 50-mm cubic samples of each age were prepared for the compressive strength tests, and two replicates were measured for the setting time and flowability tests. Table 2 summarizes the material testing results of both the PSU and GCT mixture [29].

2.2. 3D Printing System

The manufacturing process of 3D printed specimens adopted in this study involved three phases: design, processing, and printing phases (see Figure 1). 3D models of target specimens were built using Rhino and sliced into layers with Cura. The layer information was then translated into G-code as the output from Cura and later converted to machine-readable commands (RAPID code) in Robot Studio. In the processing phase, the dry GCT material was fed from a storage container and mixed with water in the M-tec Duomix 2000 (Neuenburg am Rhein, Germany) wet mixer and pump system [33]. The well-mixed concrete material was then pumped through a pumping hose and extruded from a printing nozzle. An industrial 6-axis robotic arm (ABB IRB 6640) with a 2.8-m reach [34] was used to print the delivered material into the target geometry specified by the RAPID code. The freedom of printing offered by the 6-axis robotic arm allows the automatic construction of large-scale concrete structures with higher geometric complexity.
Printing parameters, including pumping rate (3.16 lit/min), water flow rate (800 kg/h), robot speed (170 mm/s), nozzle size (25.4 mm), and nozzle distance to bed (15 mm), were selected to ensure a desirable printing performance for the printable material. Prior to Printing, WD-40 lubricant was sprayed on the printing board surface to help separate printed concrete specimens from the board after printing and curing. All the printed specimens were cured by covering them with polyethylene plastic sheets until subsequent mechanical tests. Table 3 summarizes the different printing parameters used in this work. The water flow rate was adjusted based on the mass ratio of water to dry mixture.

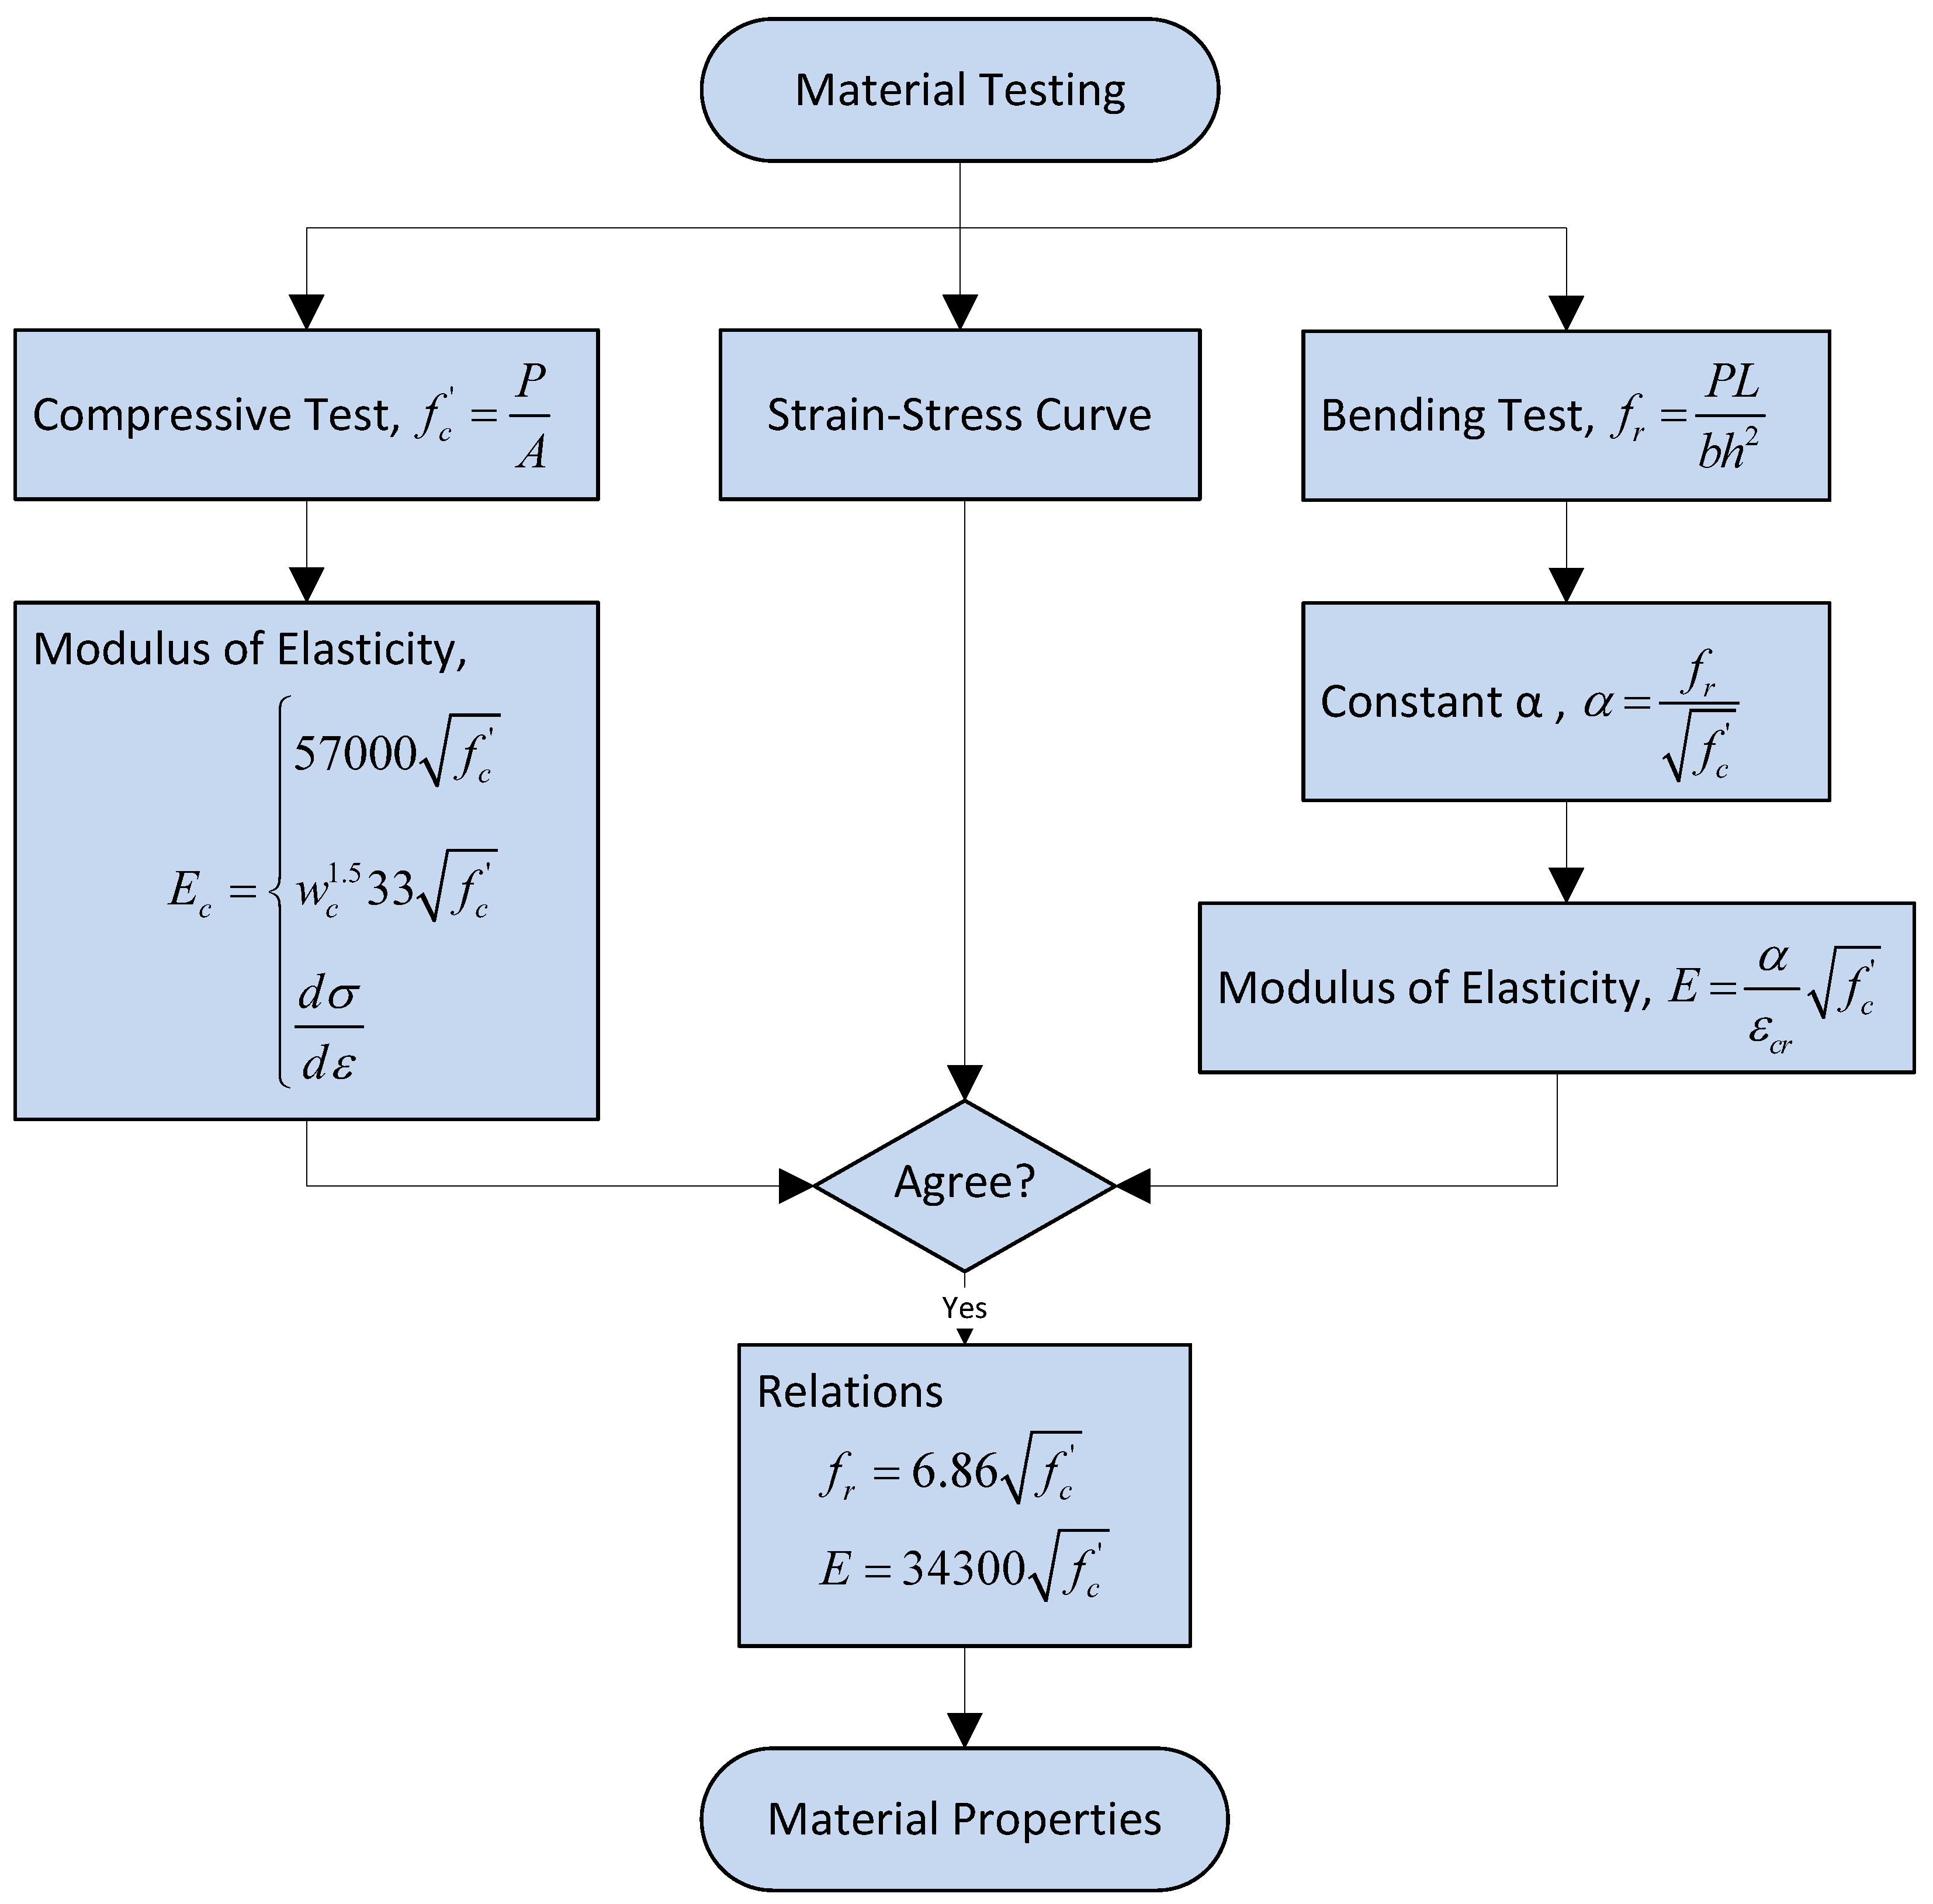
2.3. Mechanical Performance Comparison of Printable Concretes

Material testing of prism-shaped samples determined a printed part’s compressive strength and modulus of elasticity. Furthermore, the beam bending test provides the modulus of rupture based on the flexural bending behavior. The samples reached the 2-day compressive strength of the prism and 2-day flexural strength of the beam samples.

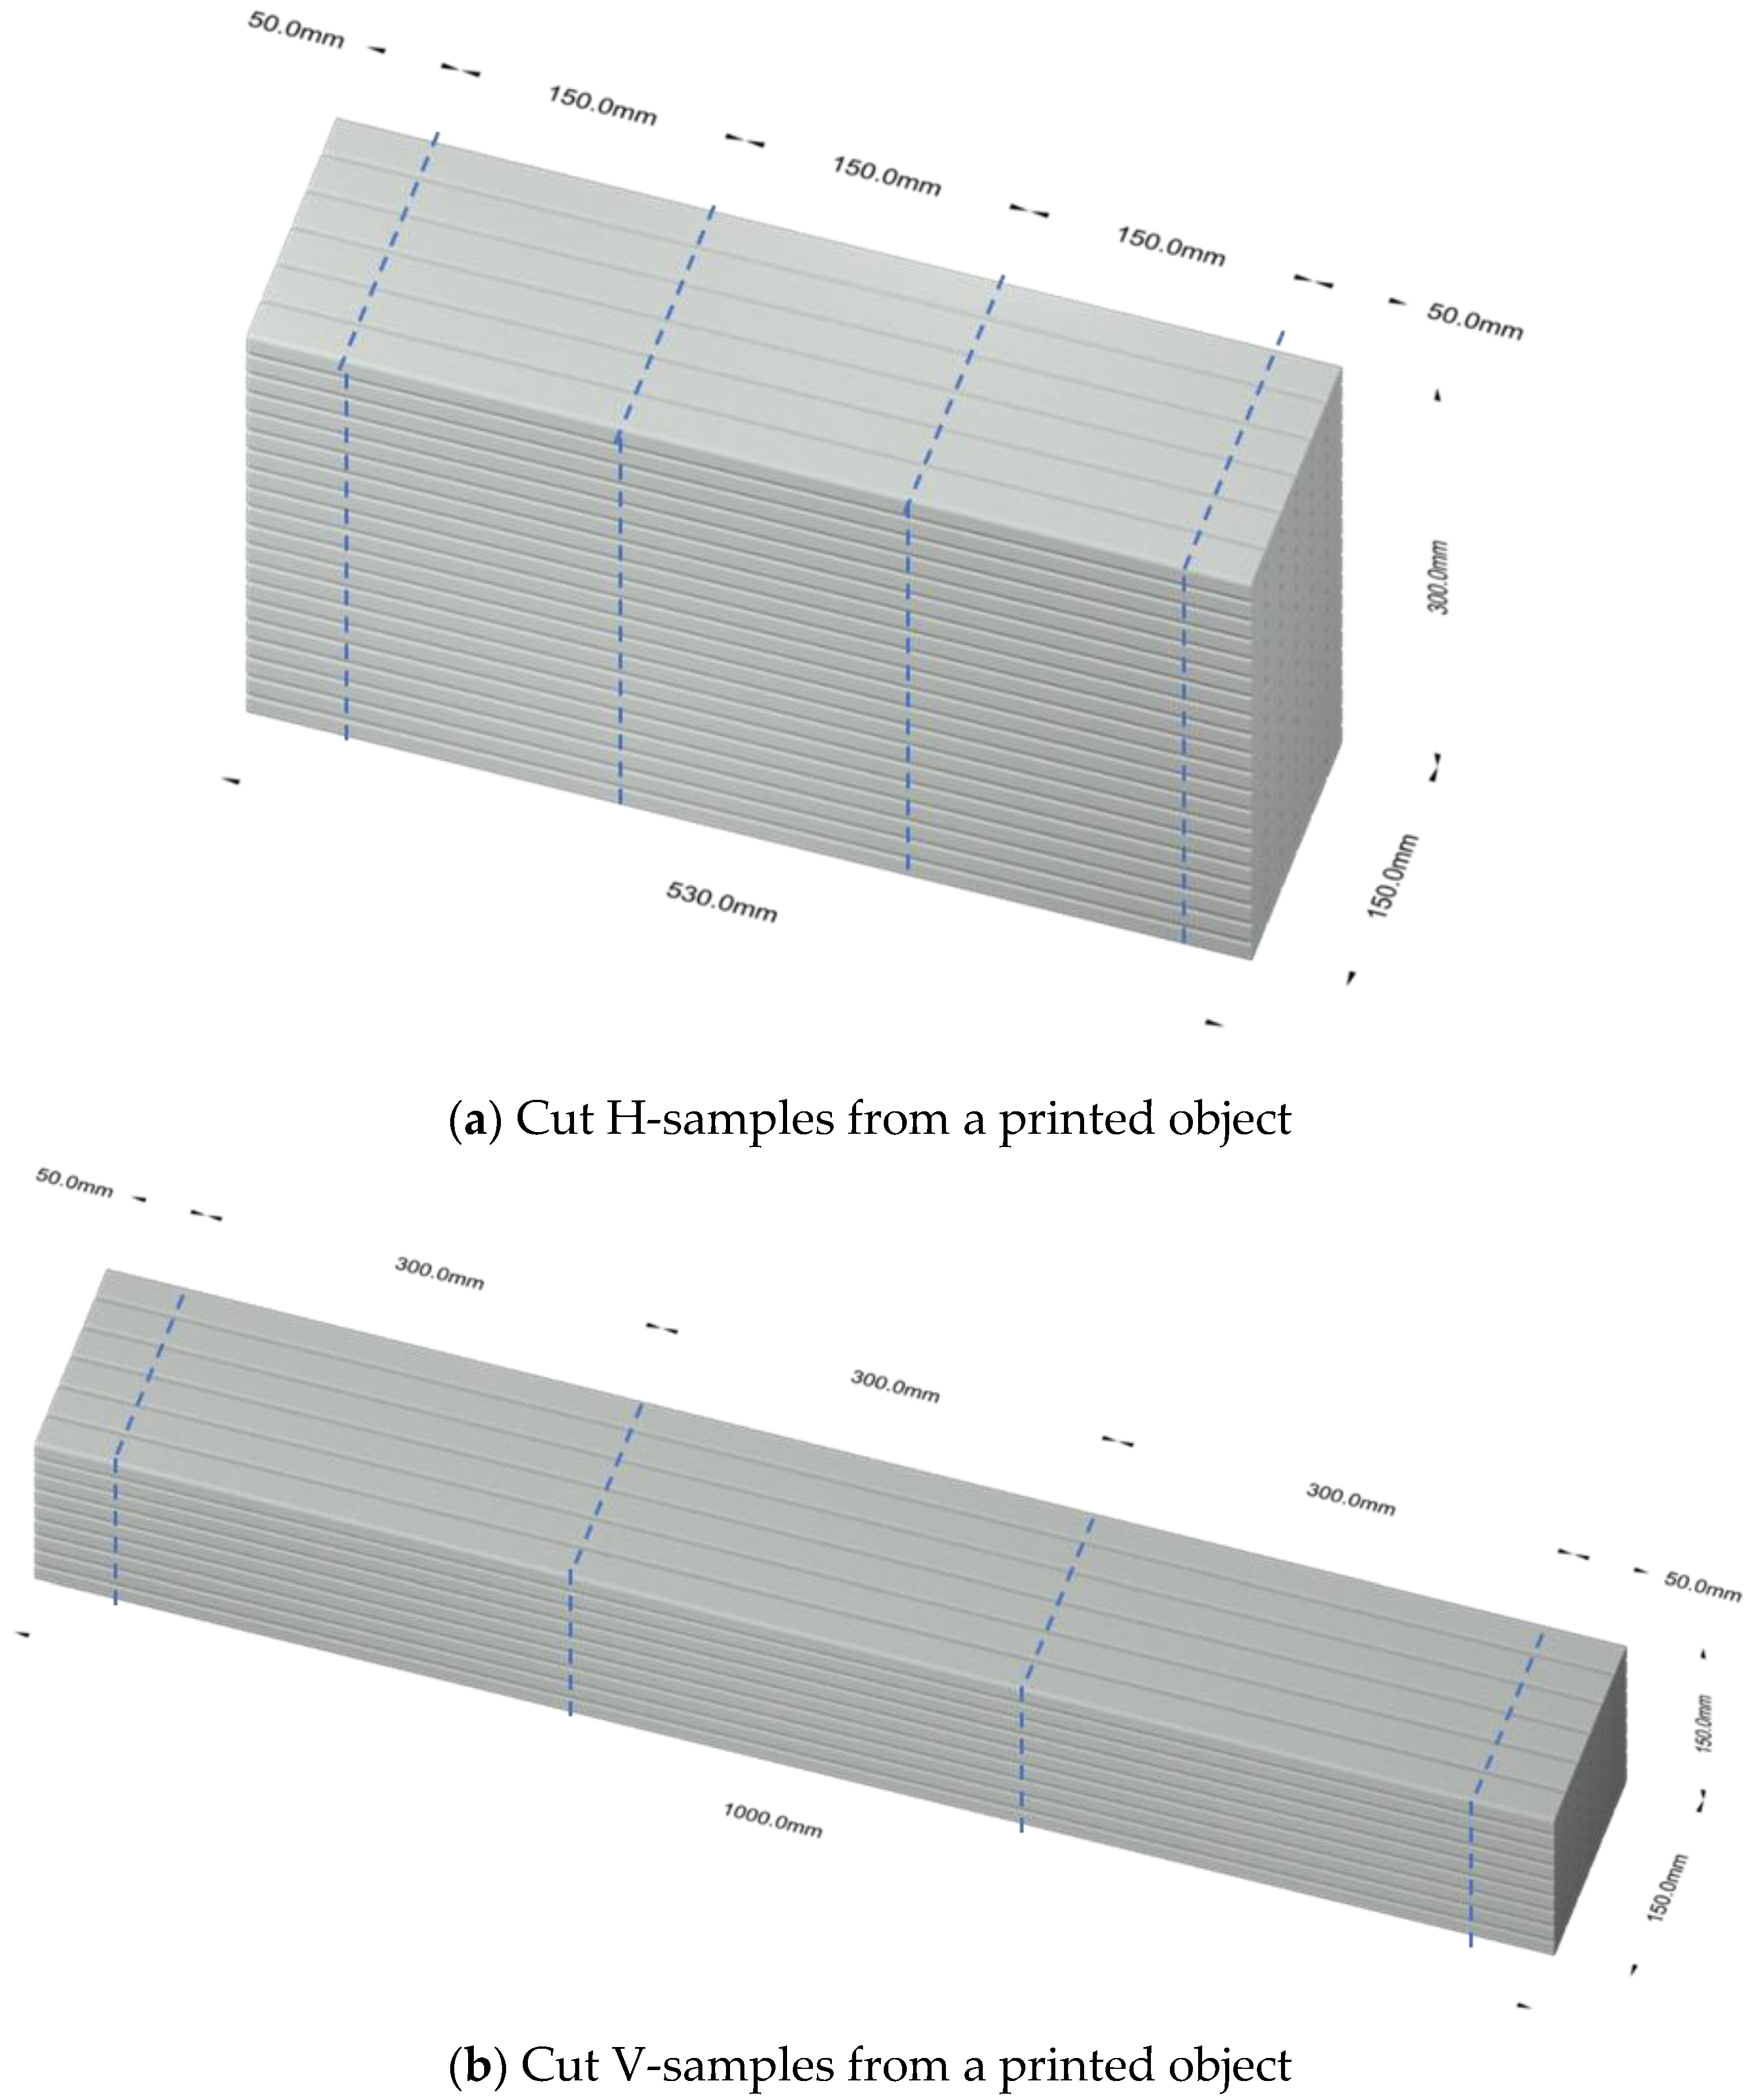
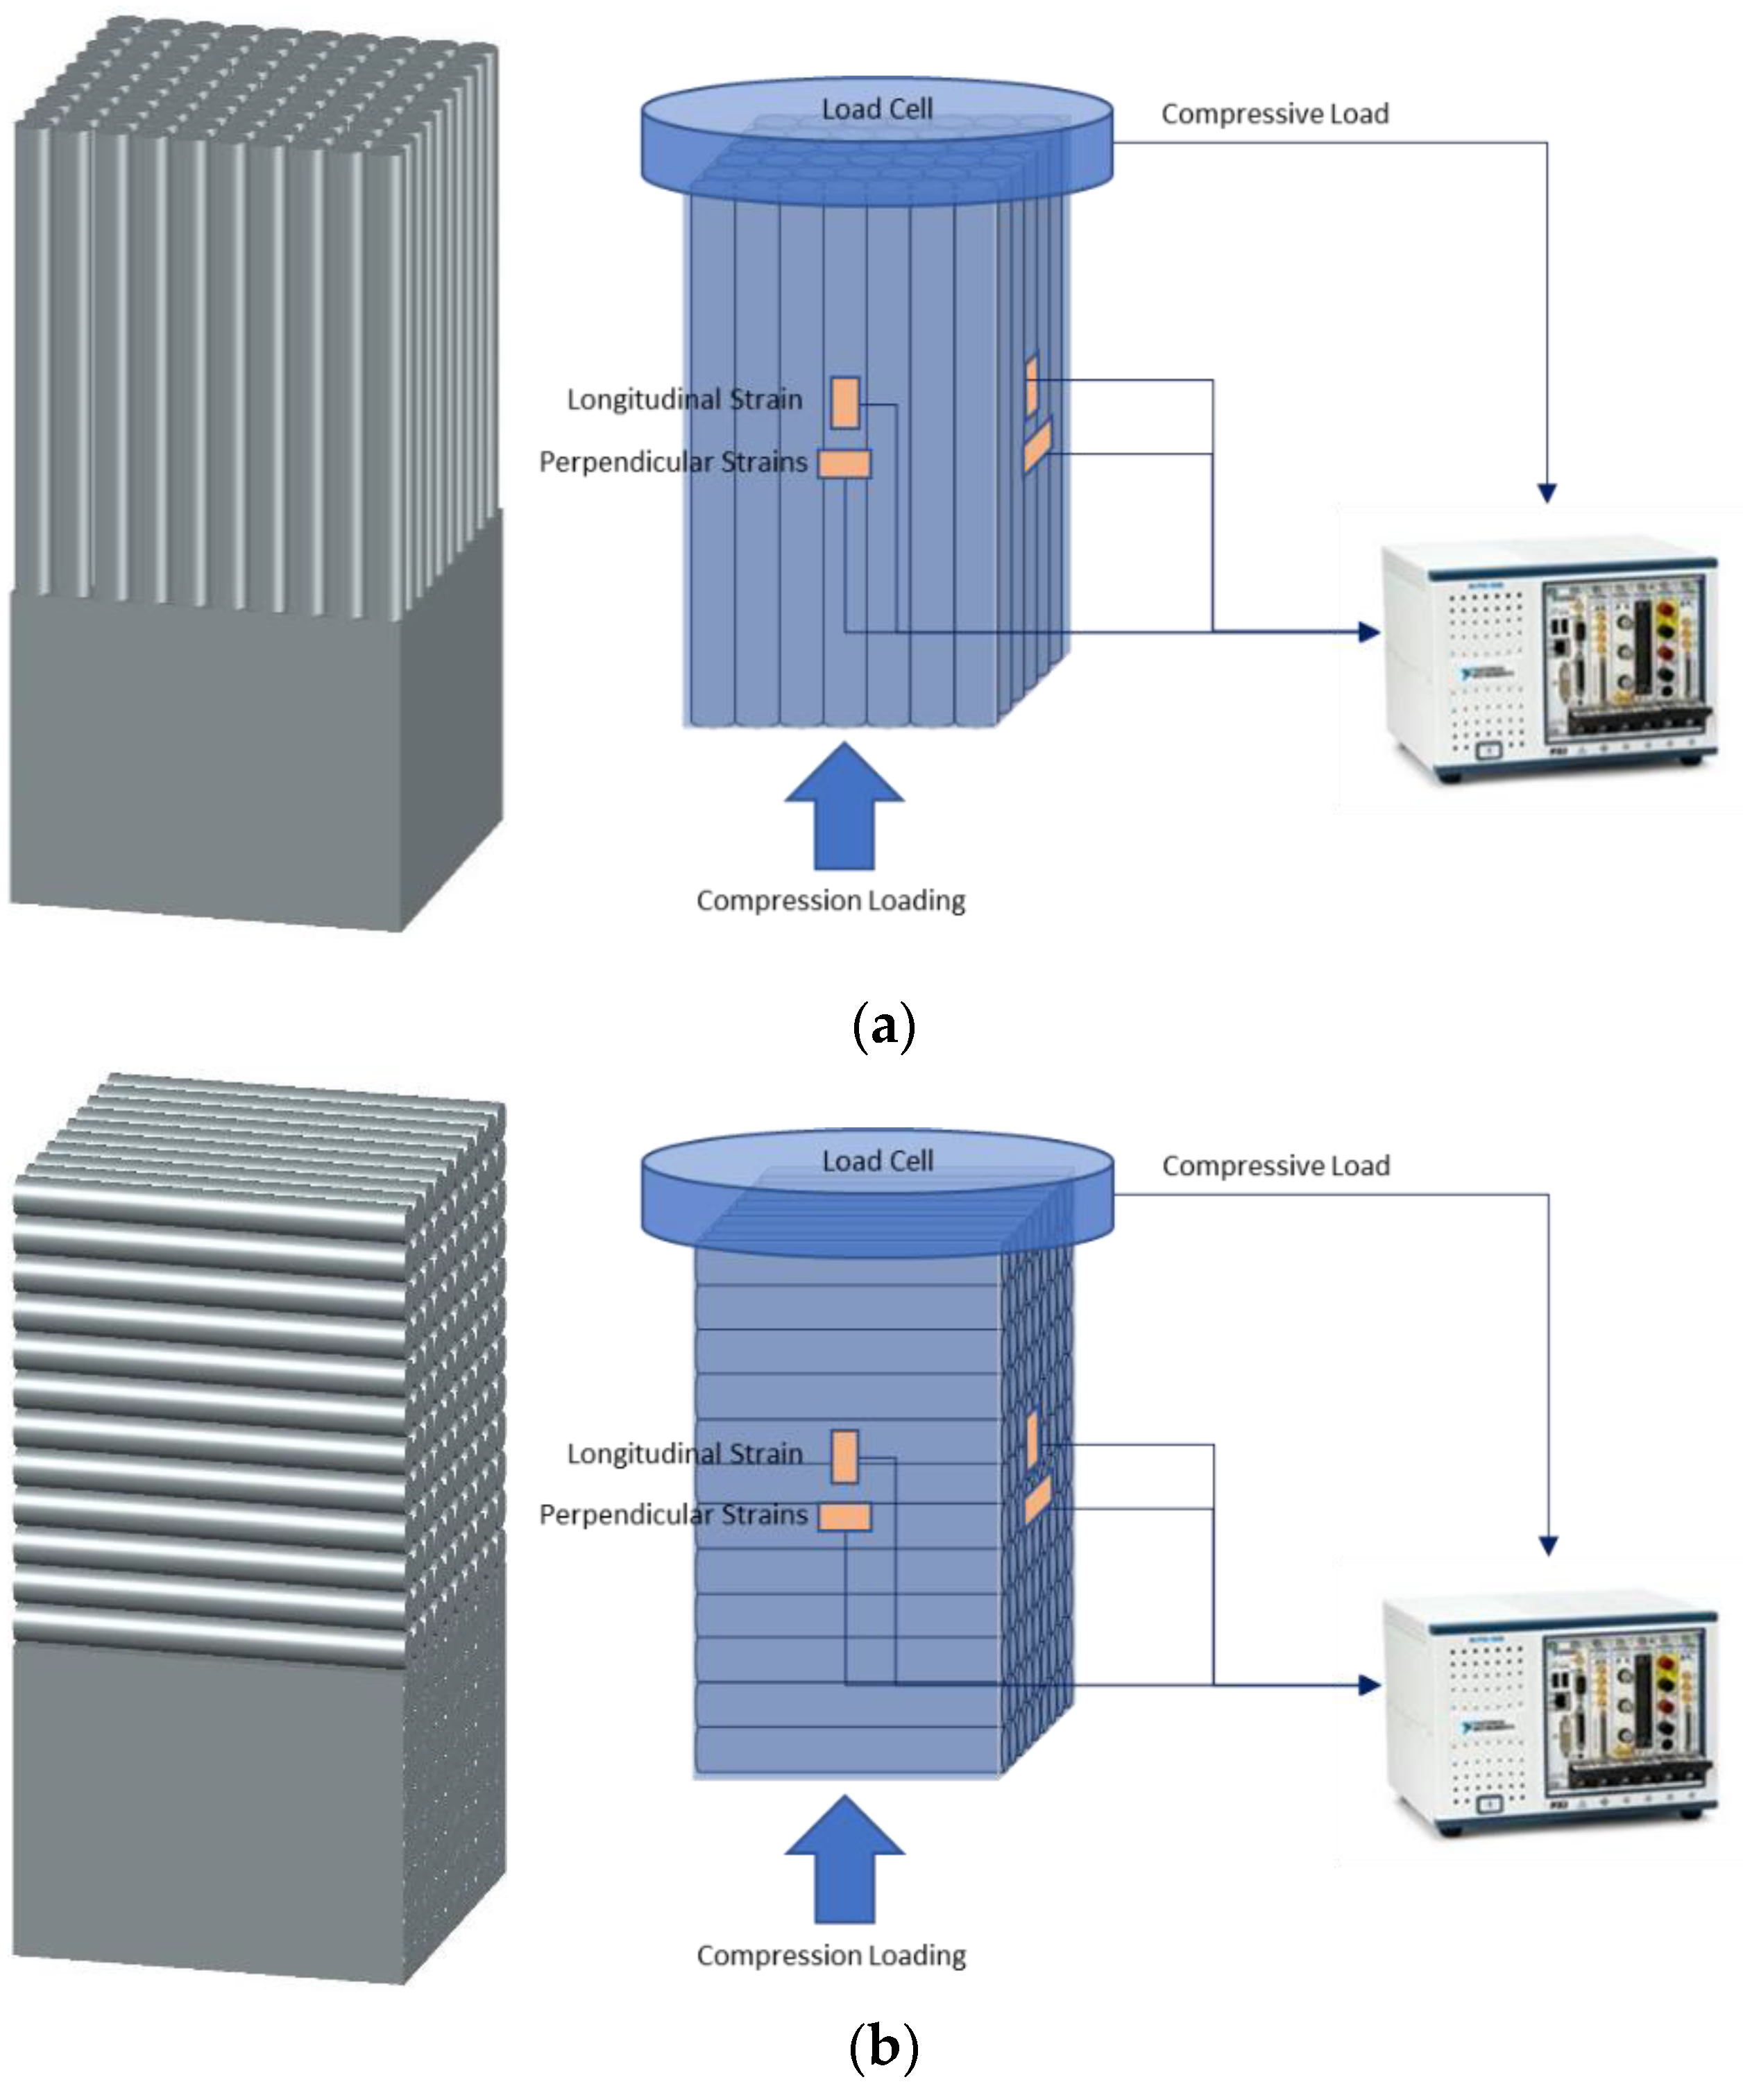
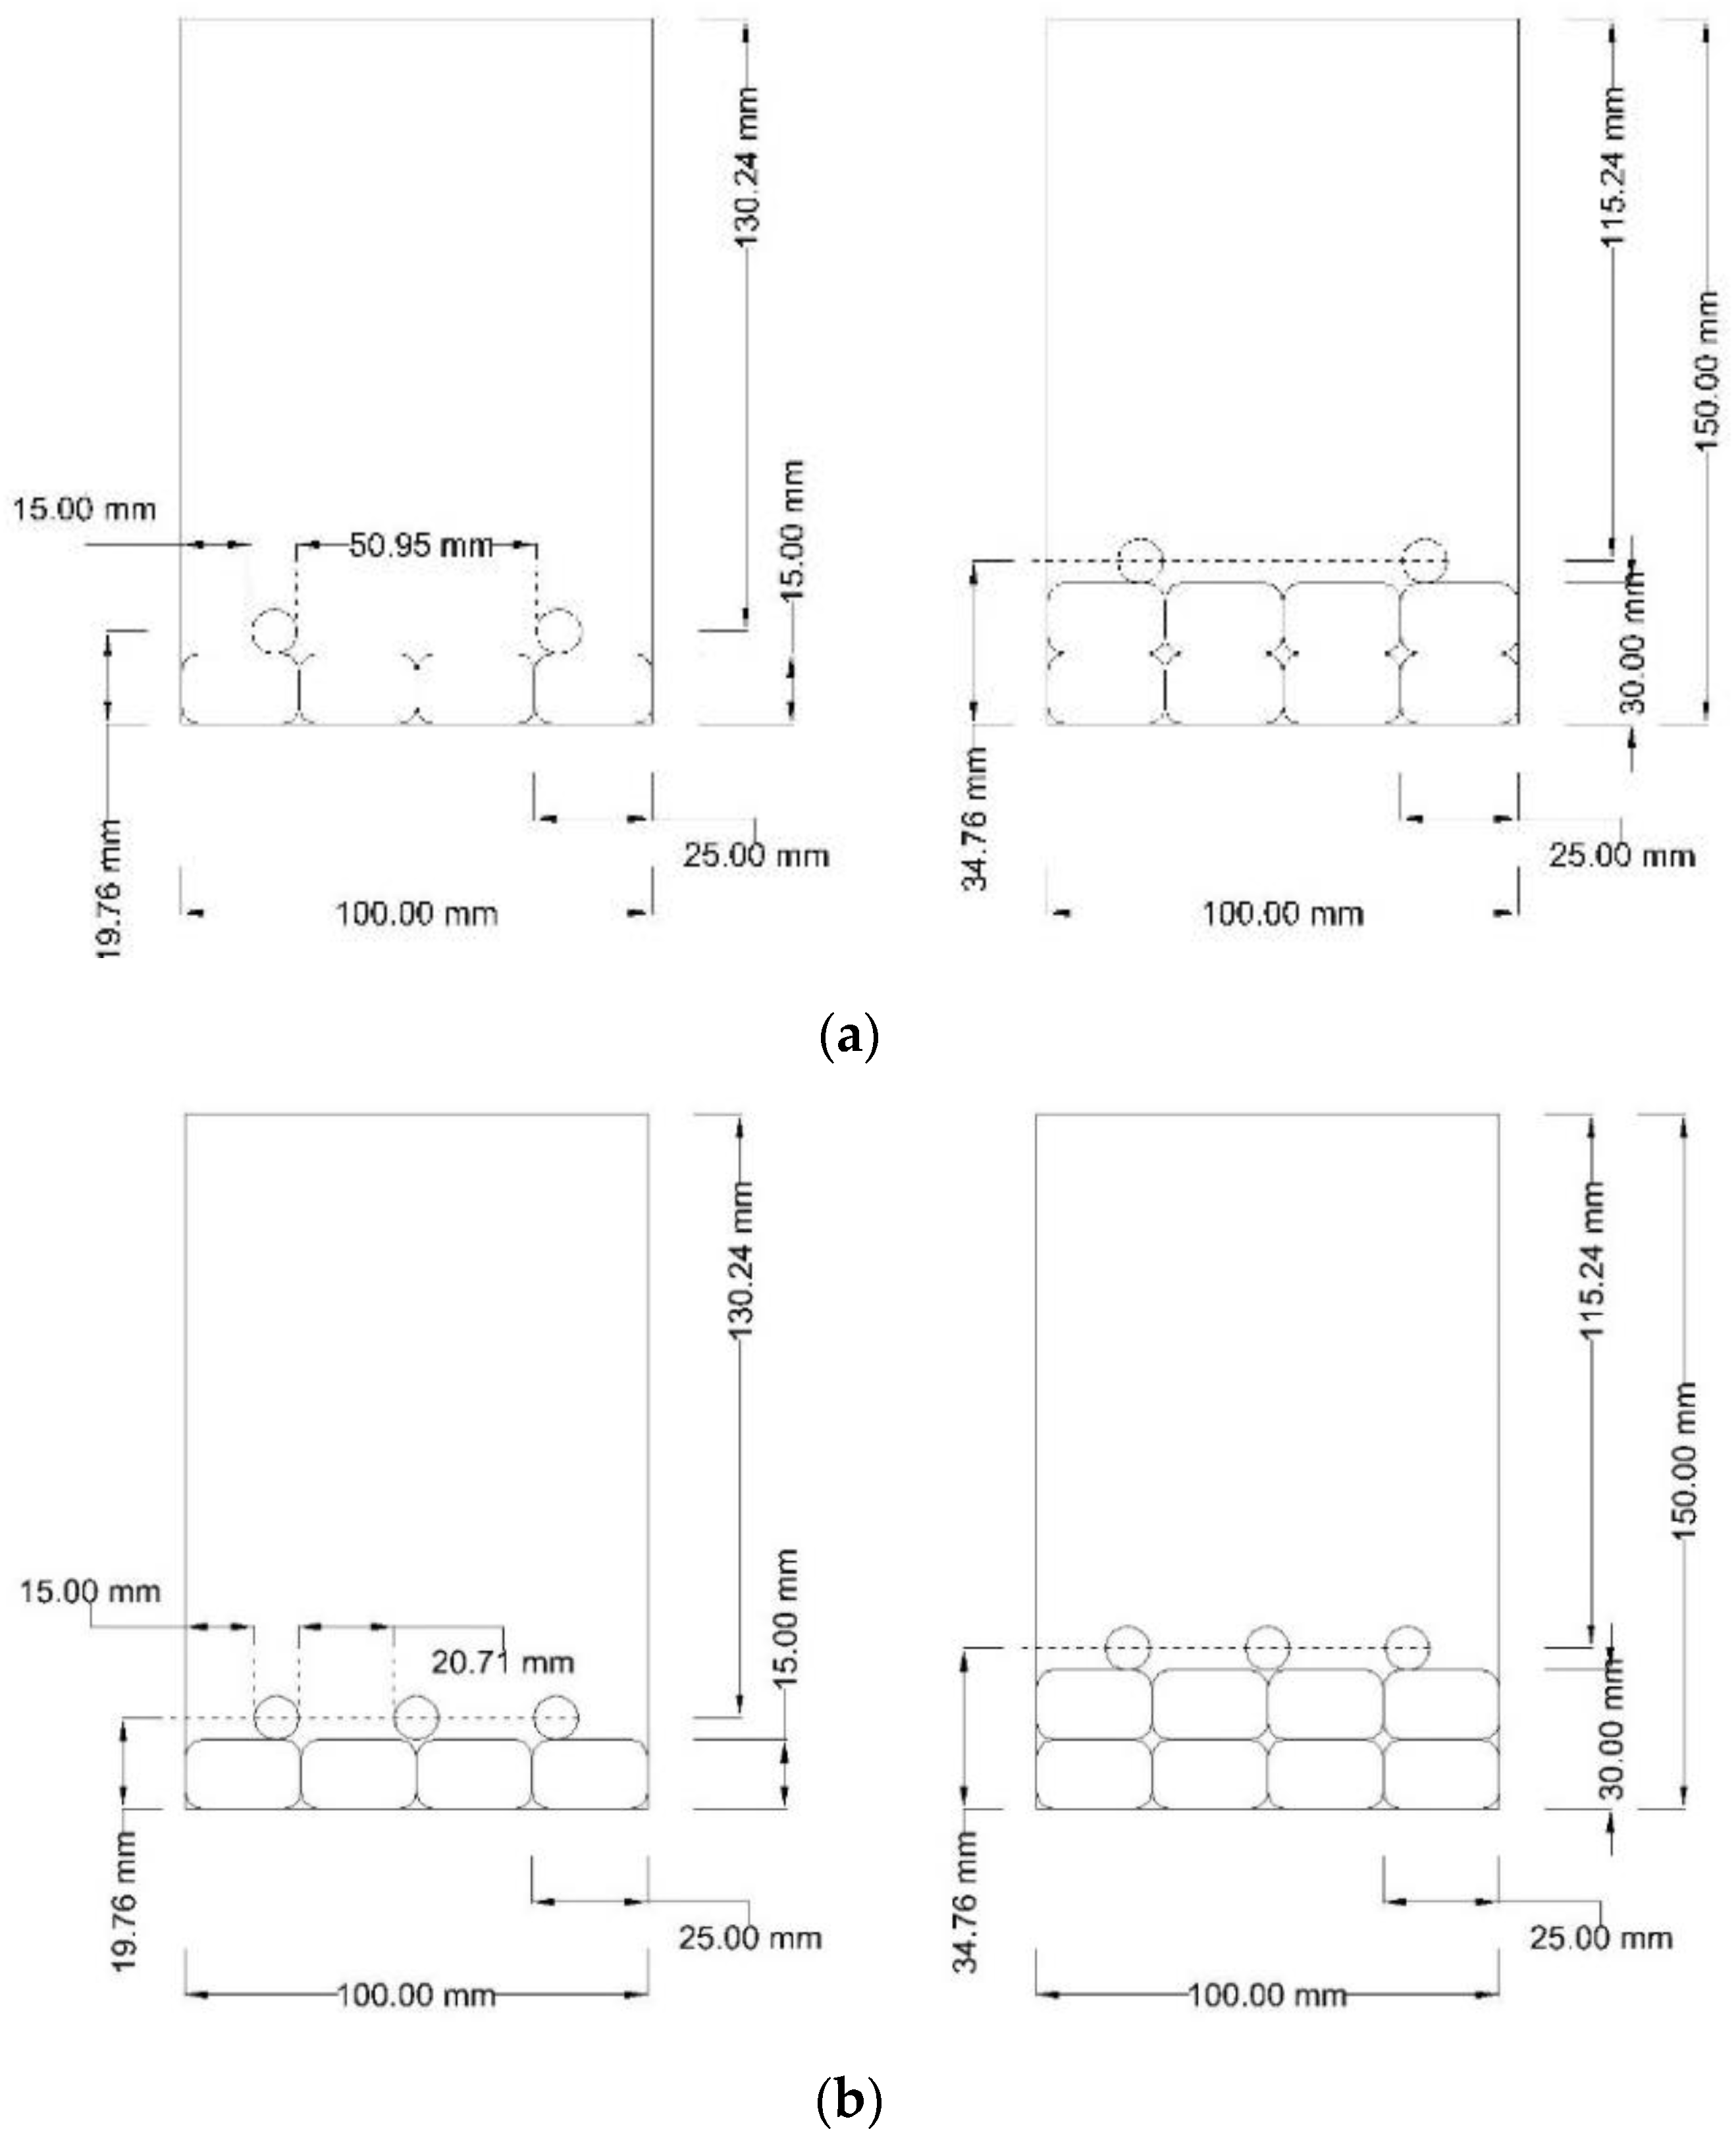
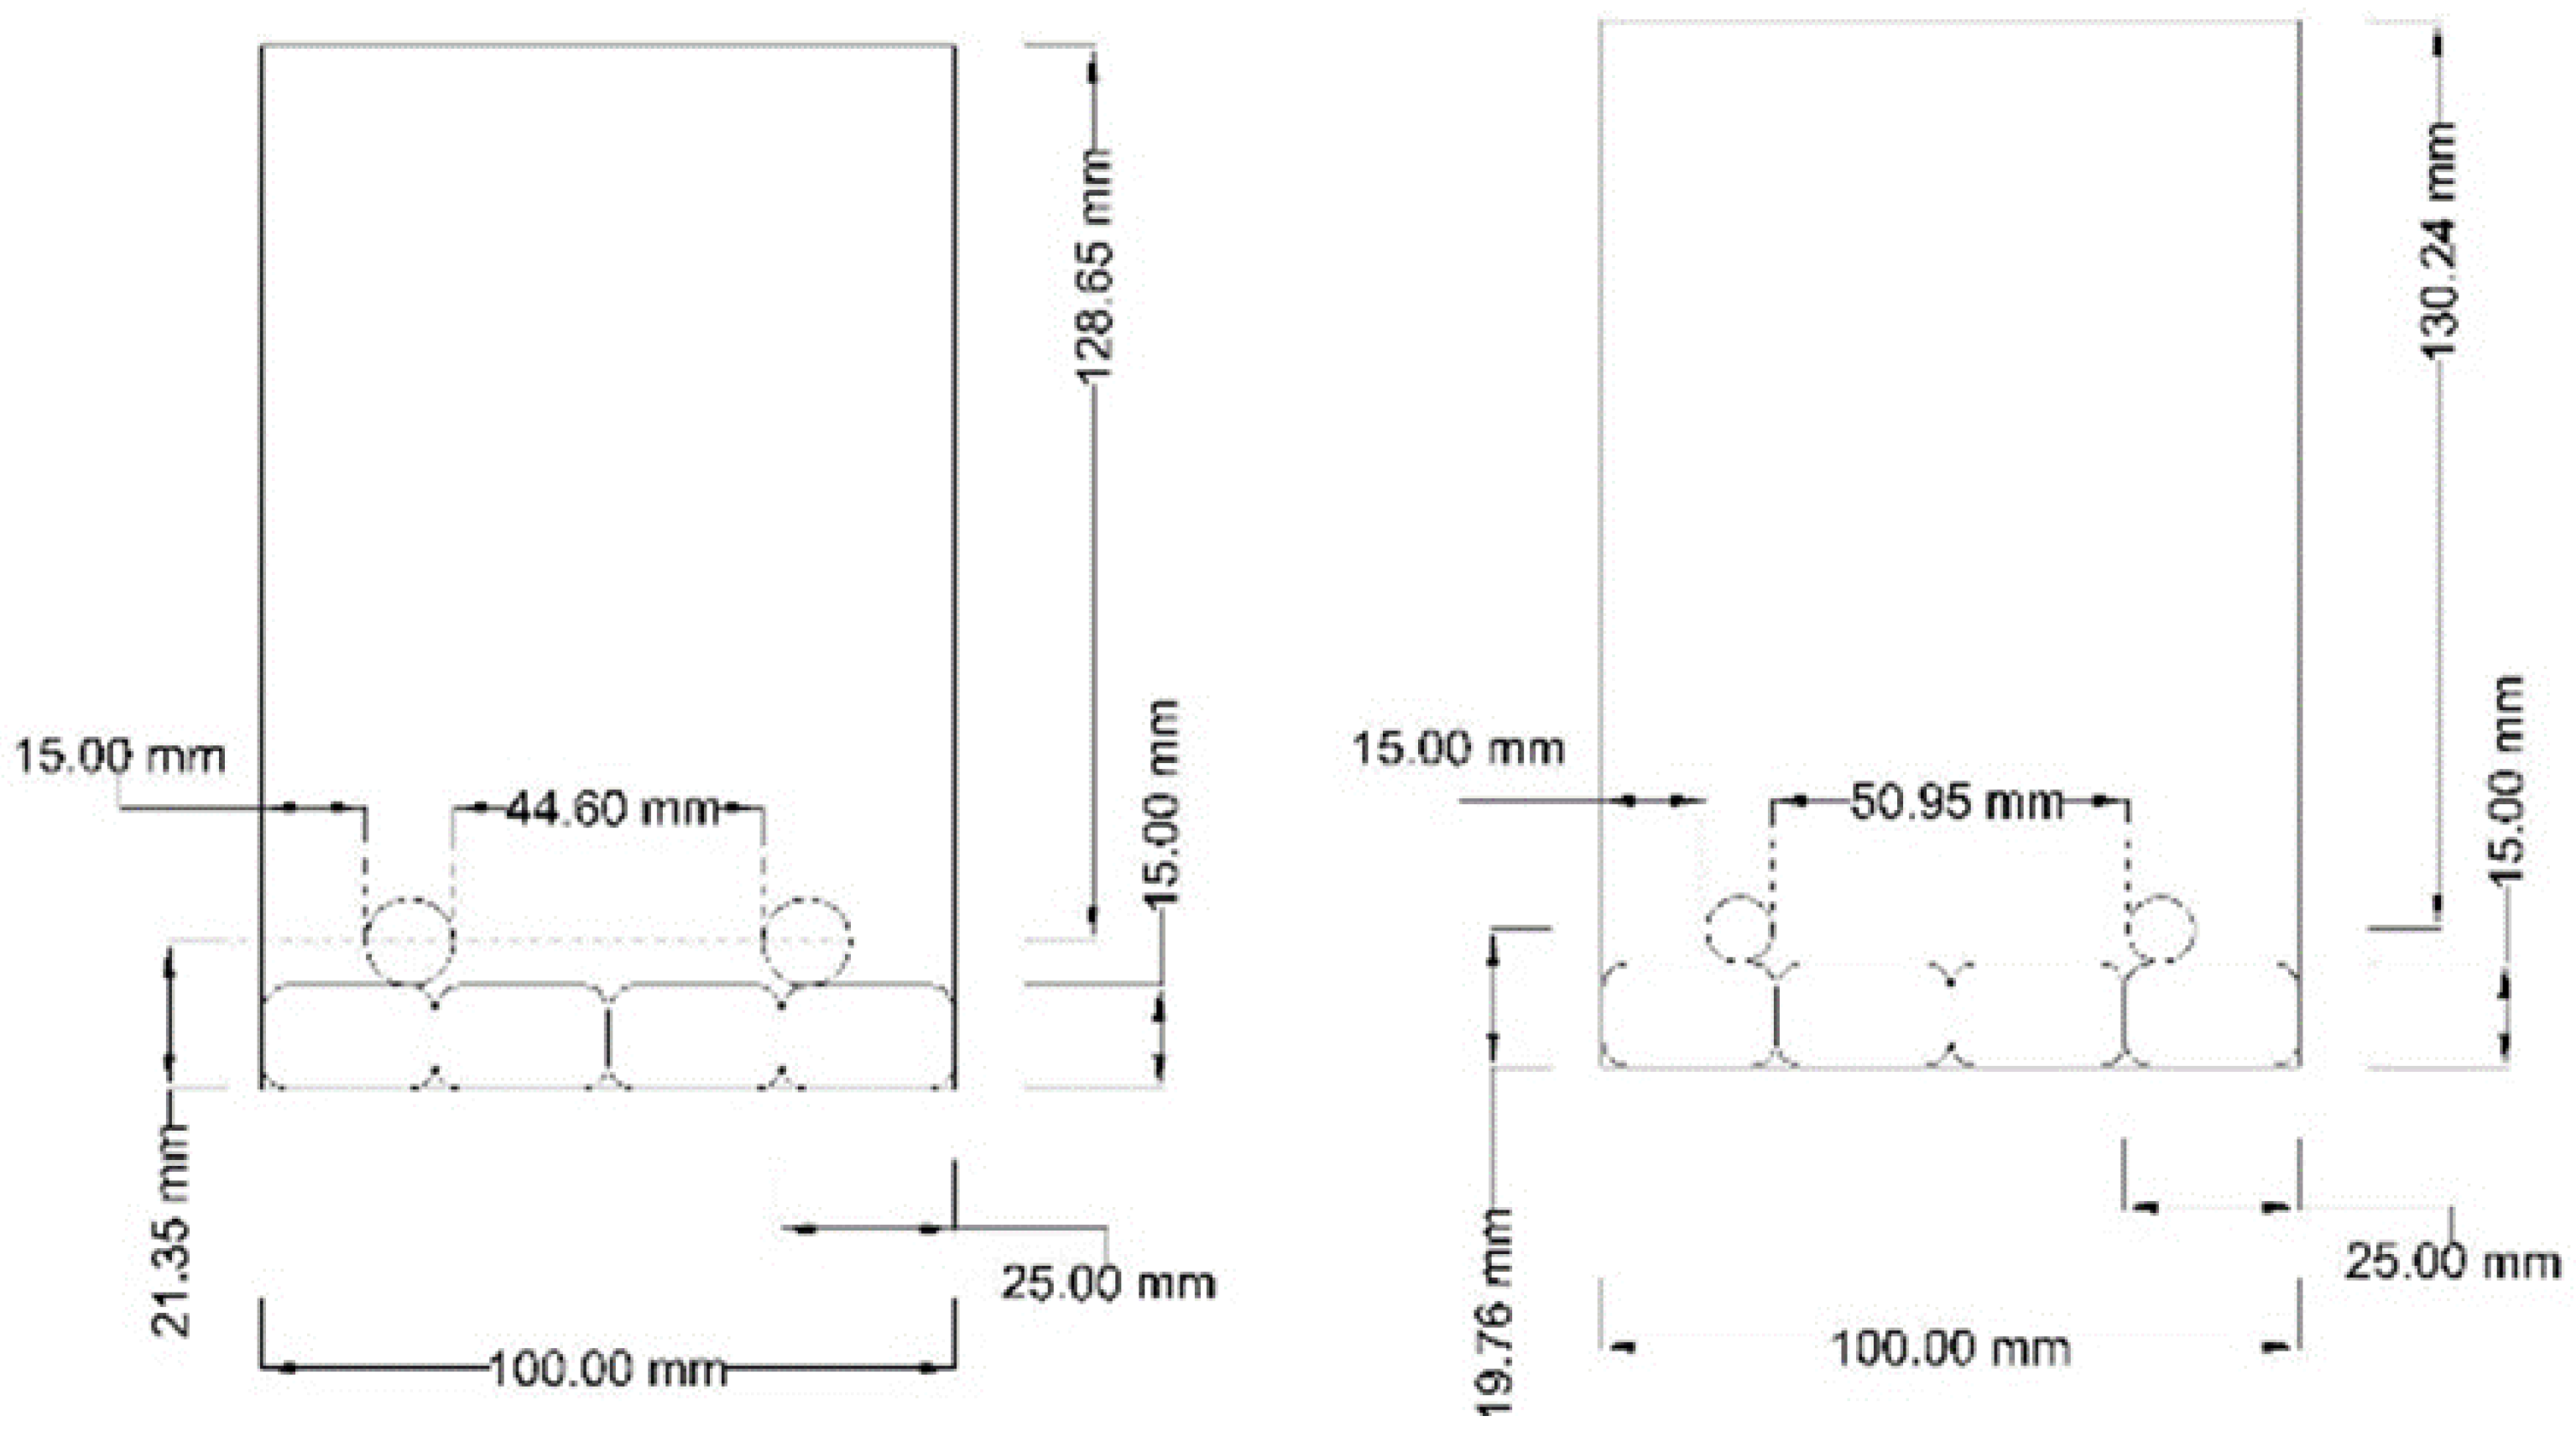
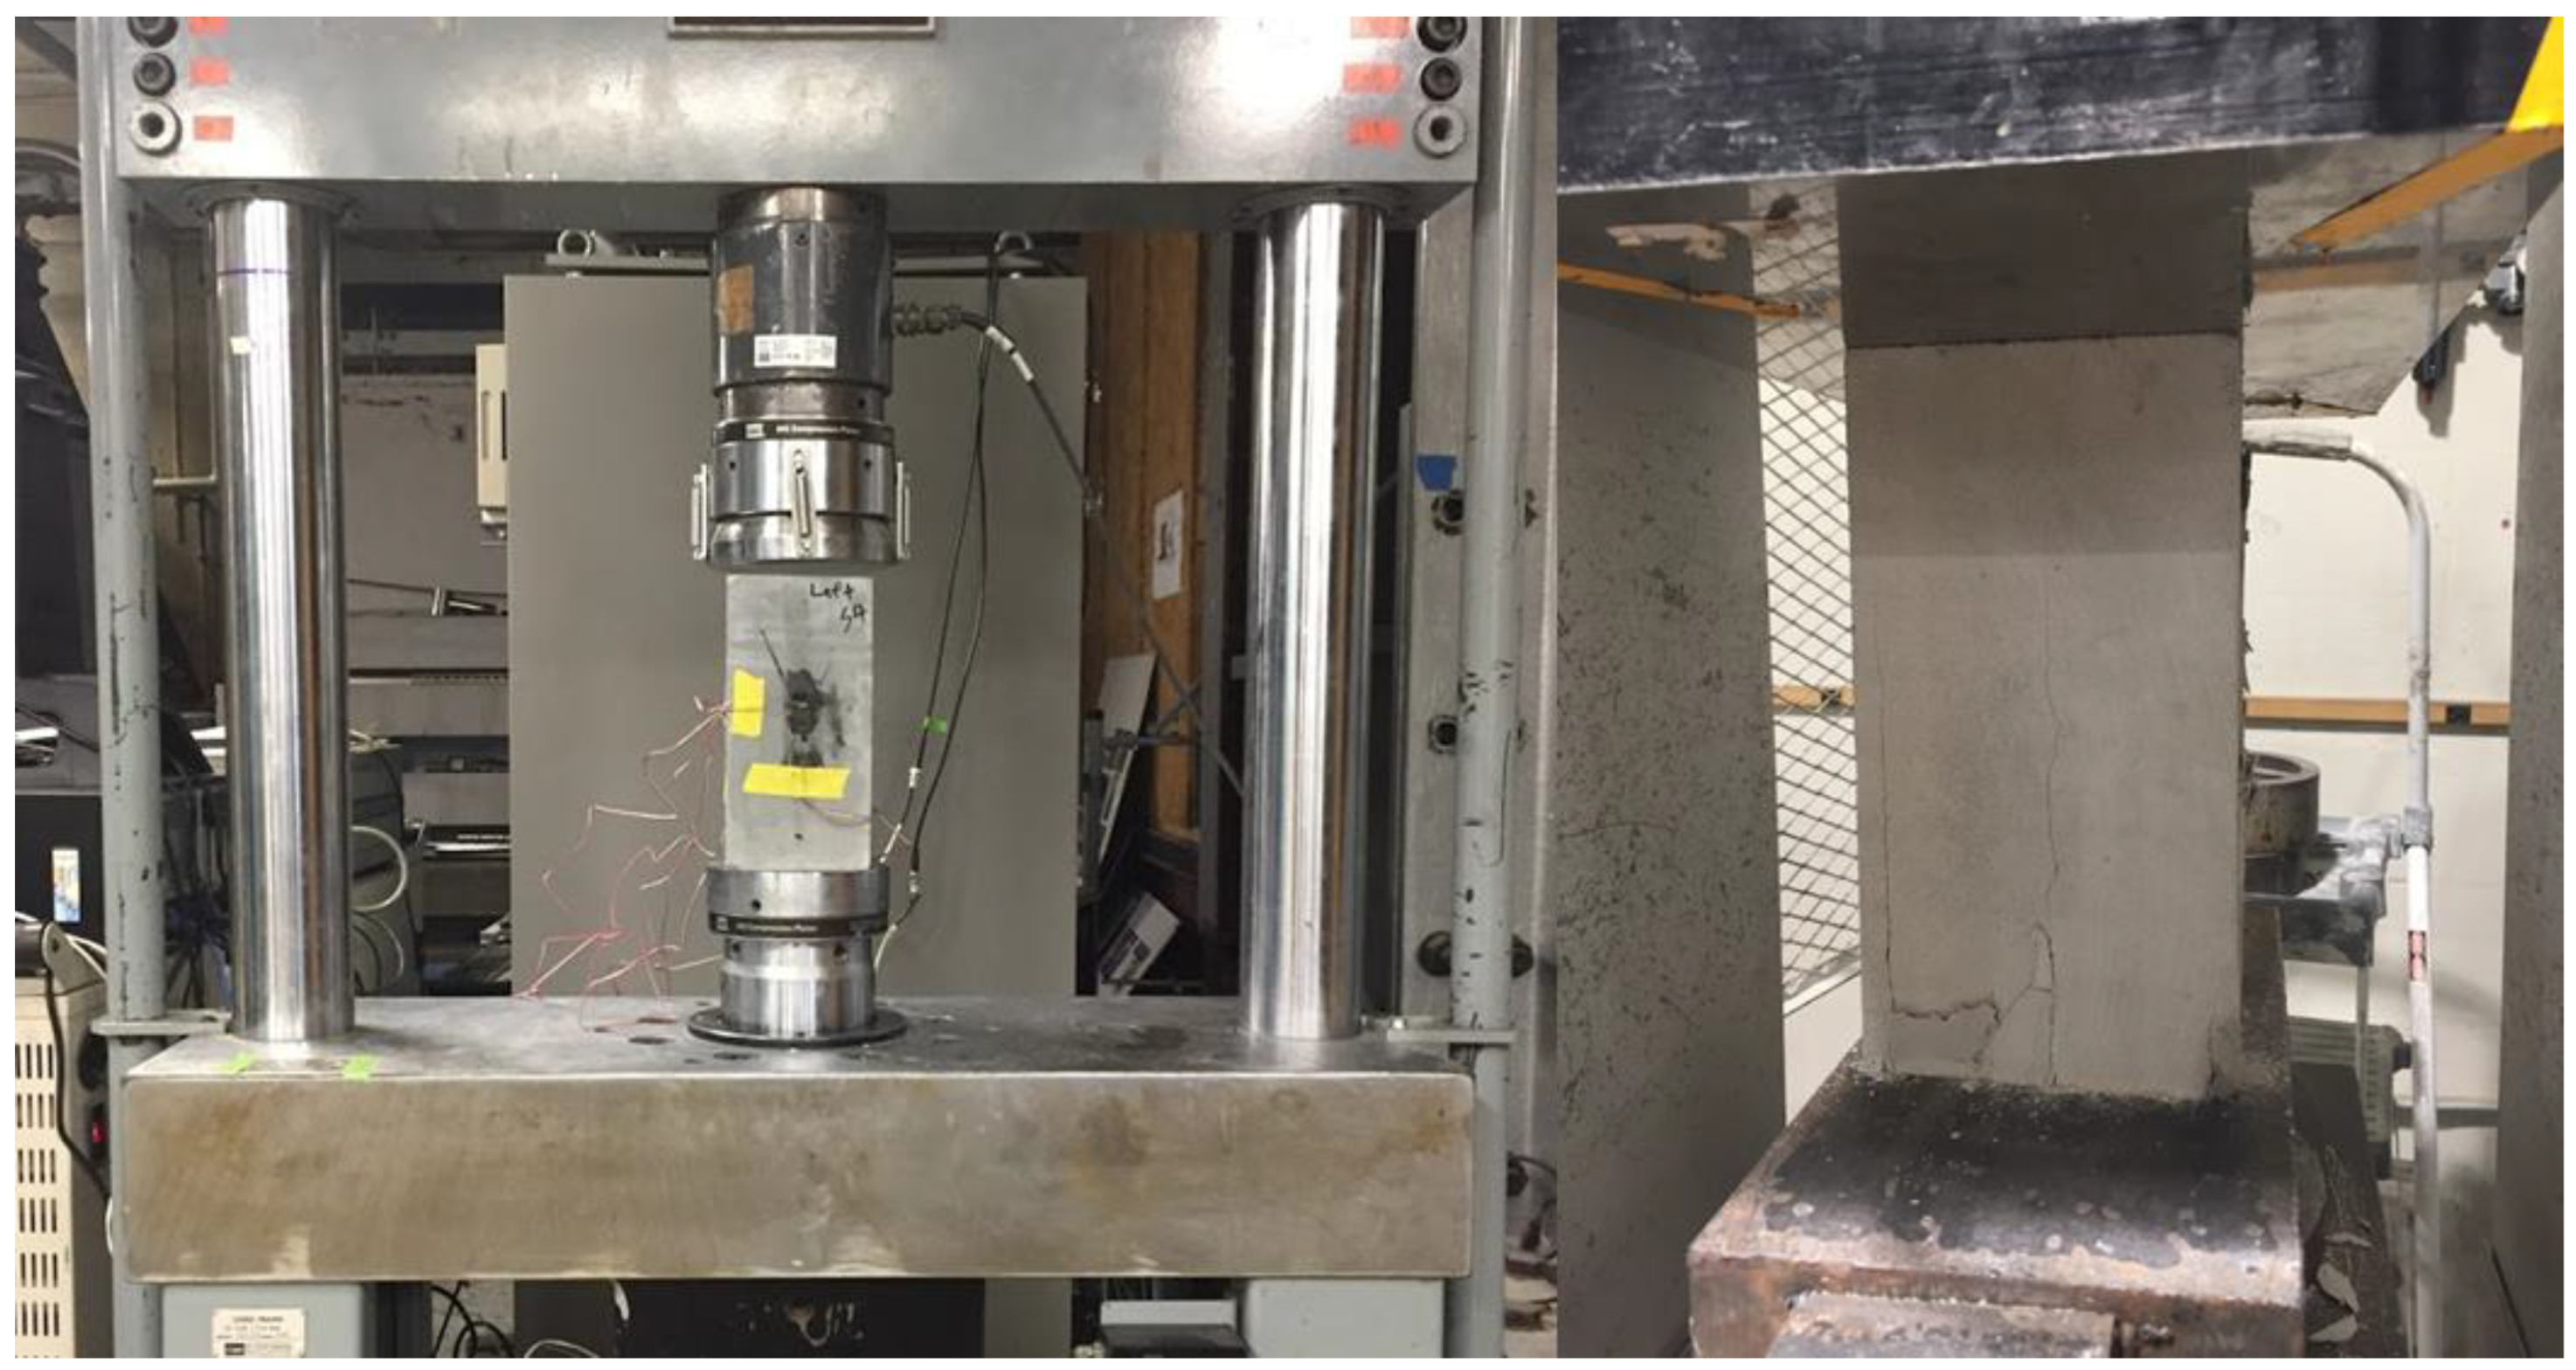
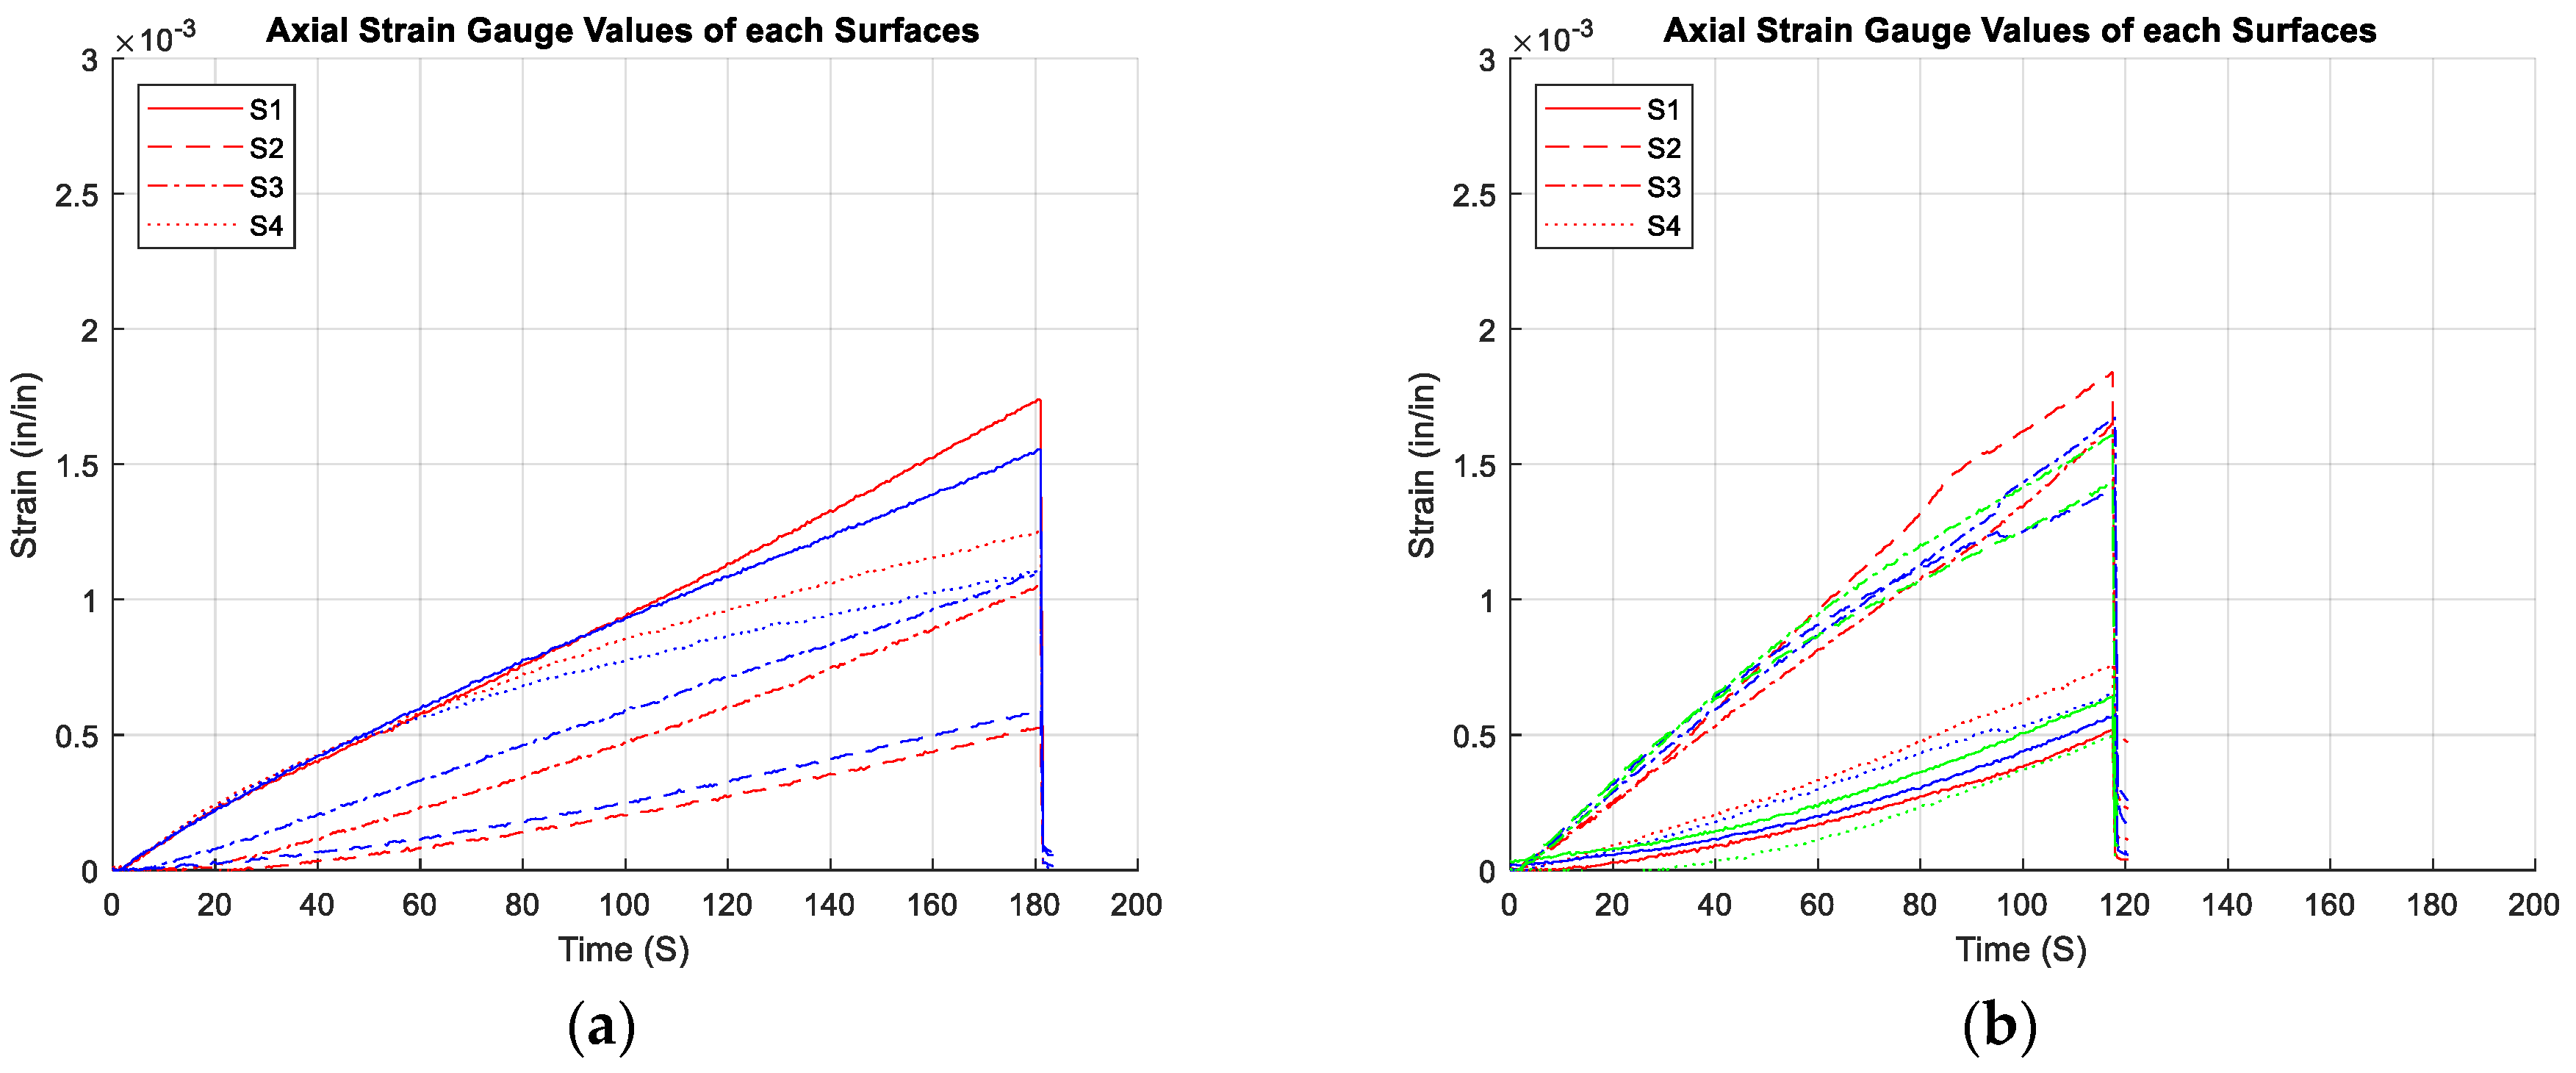
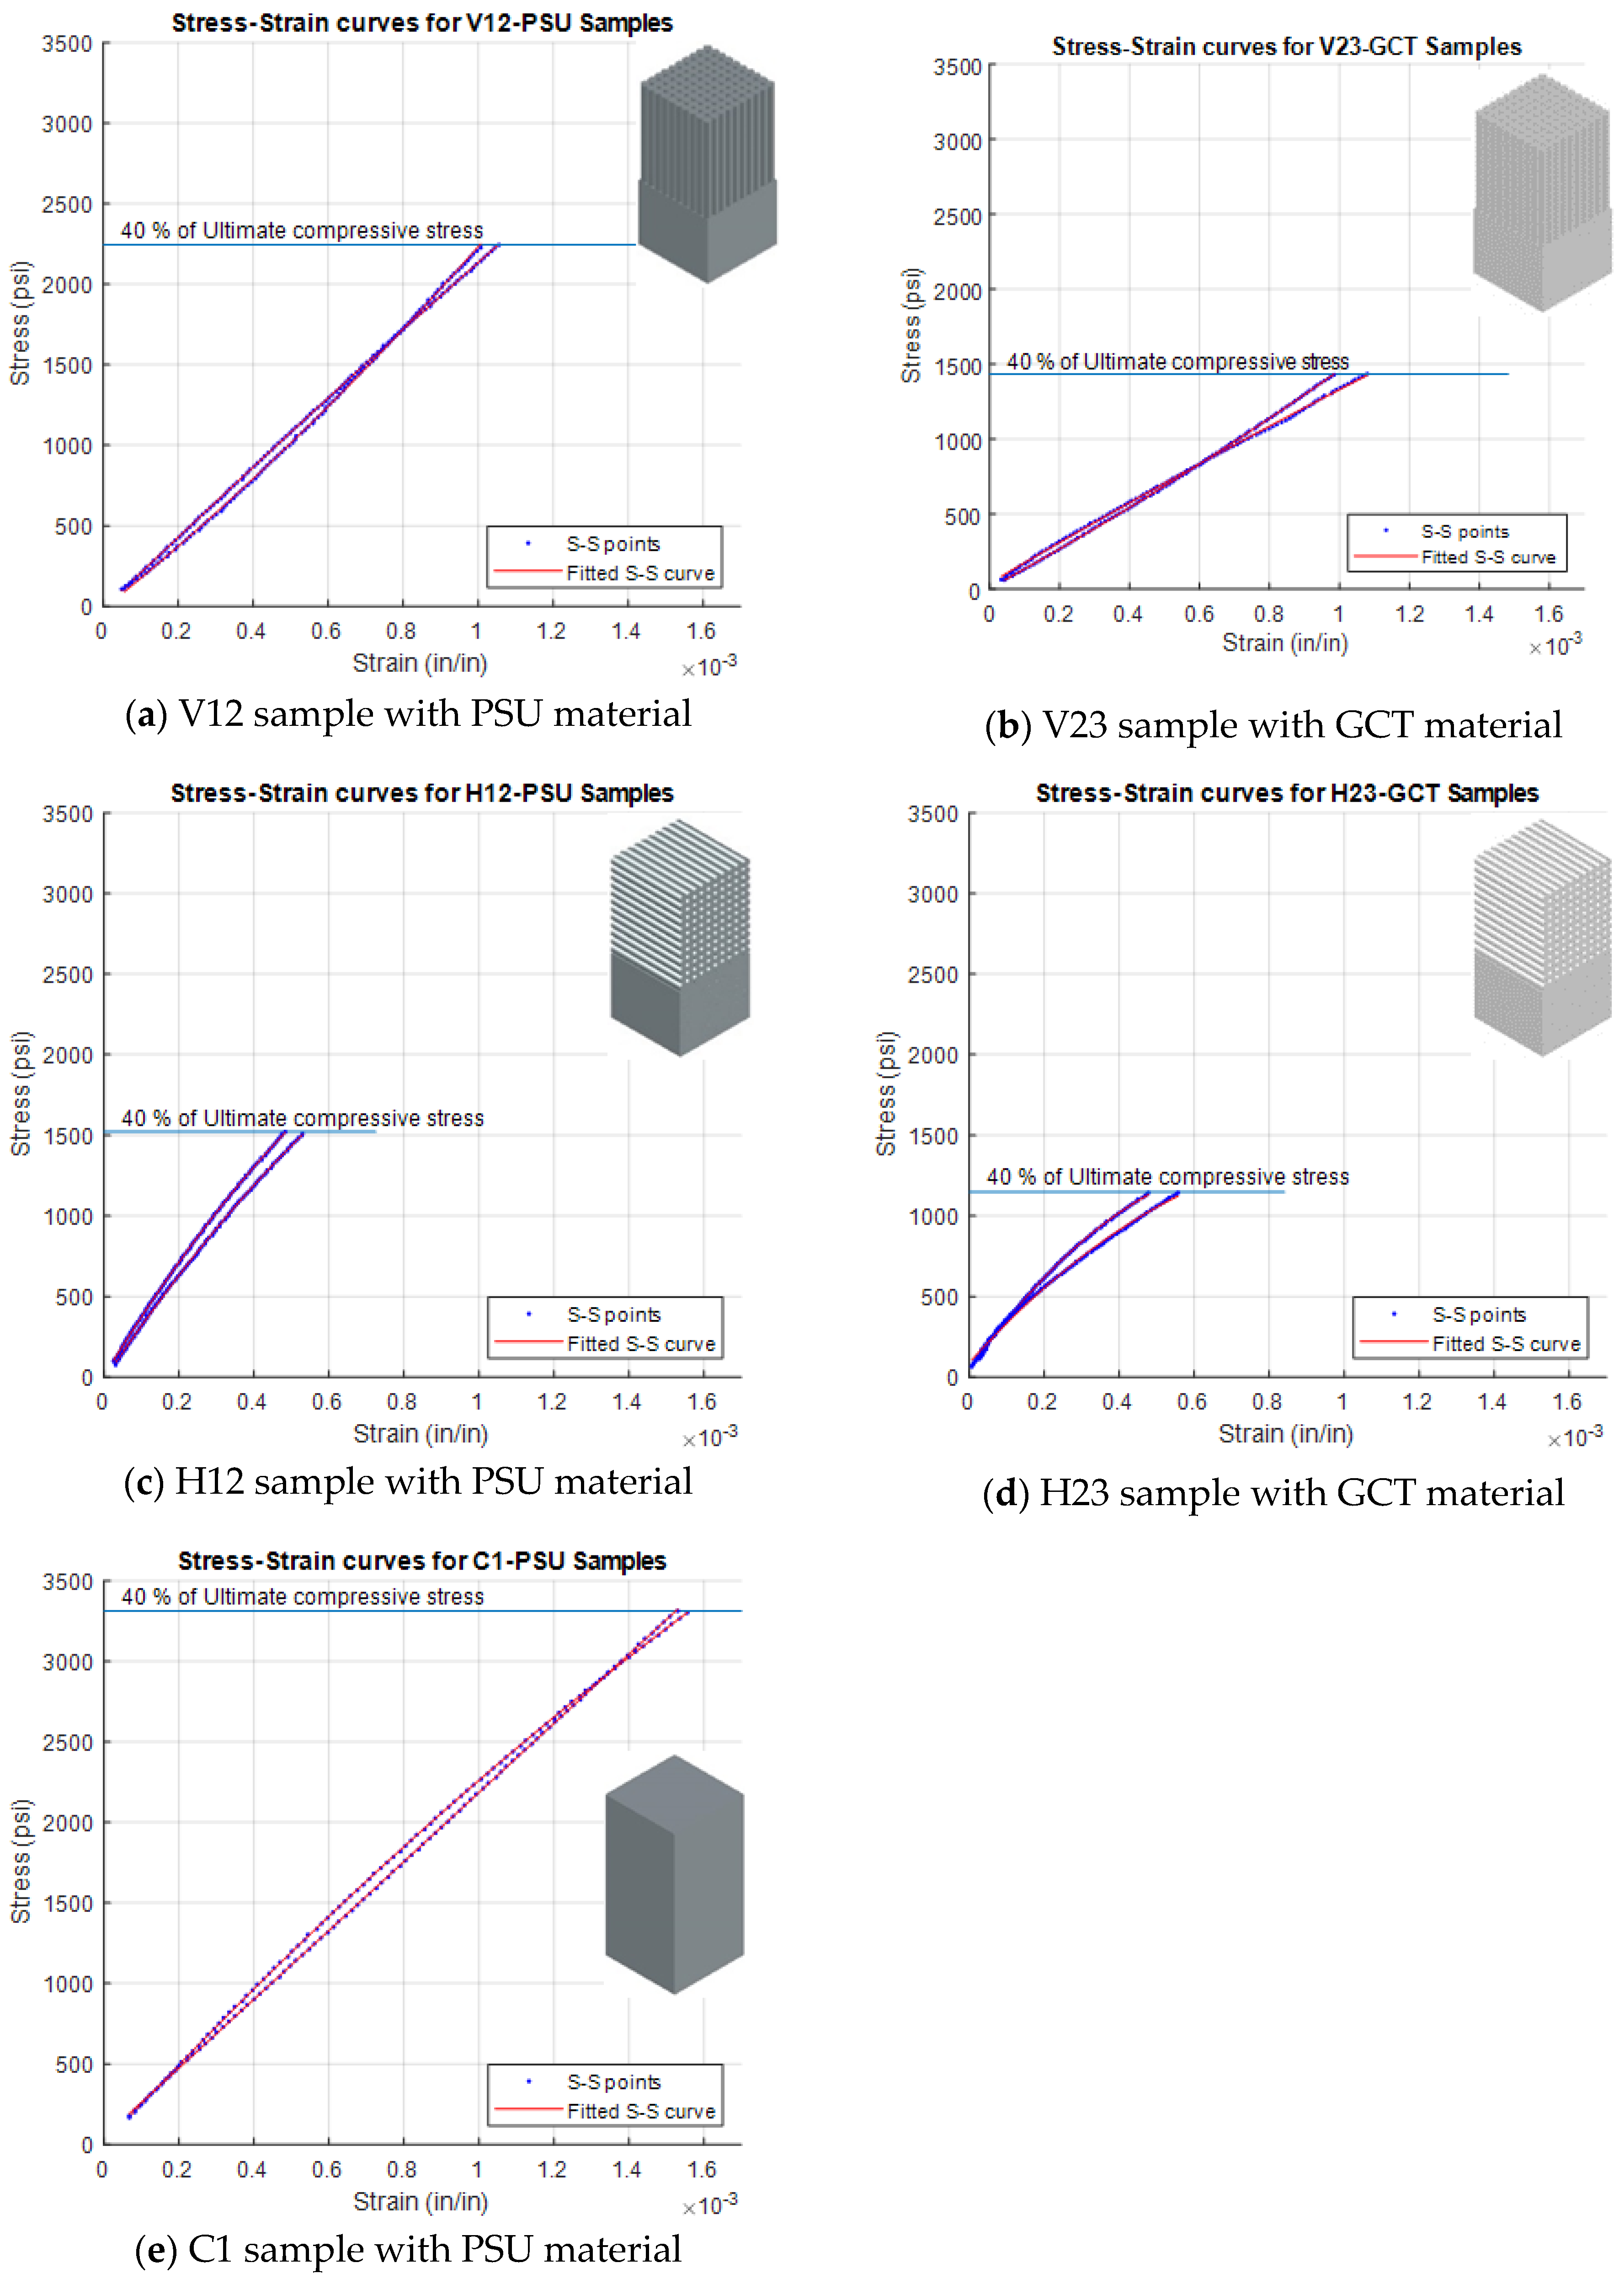
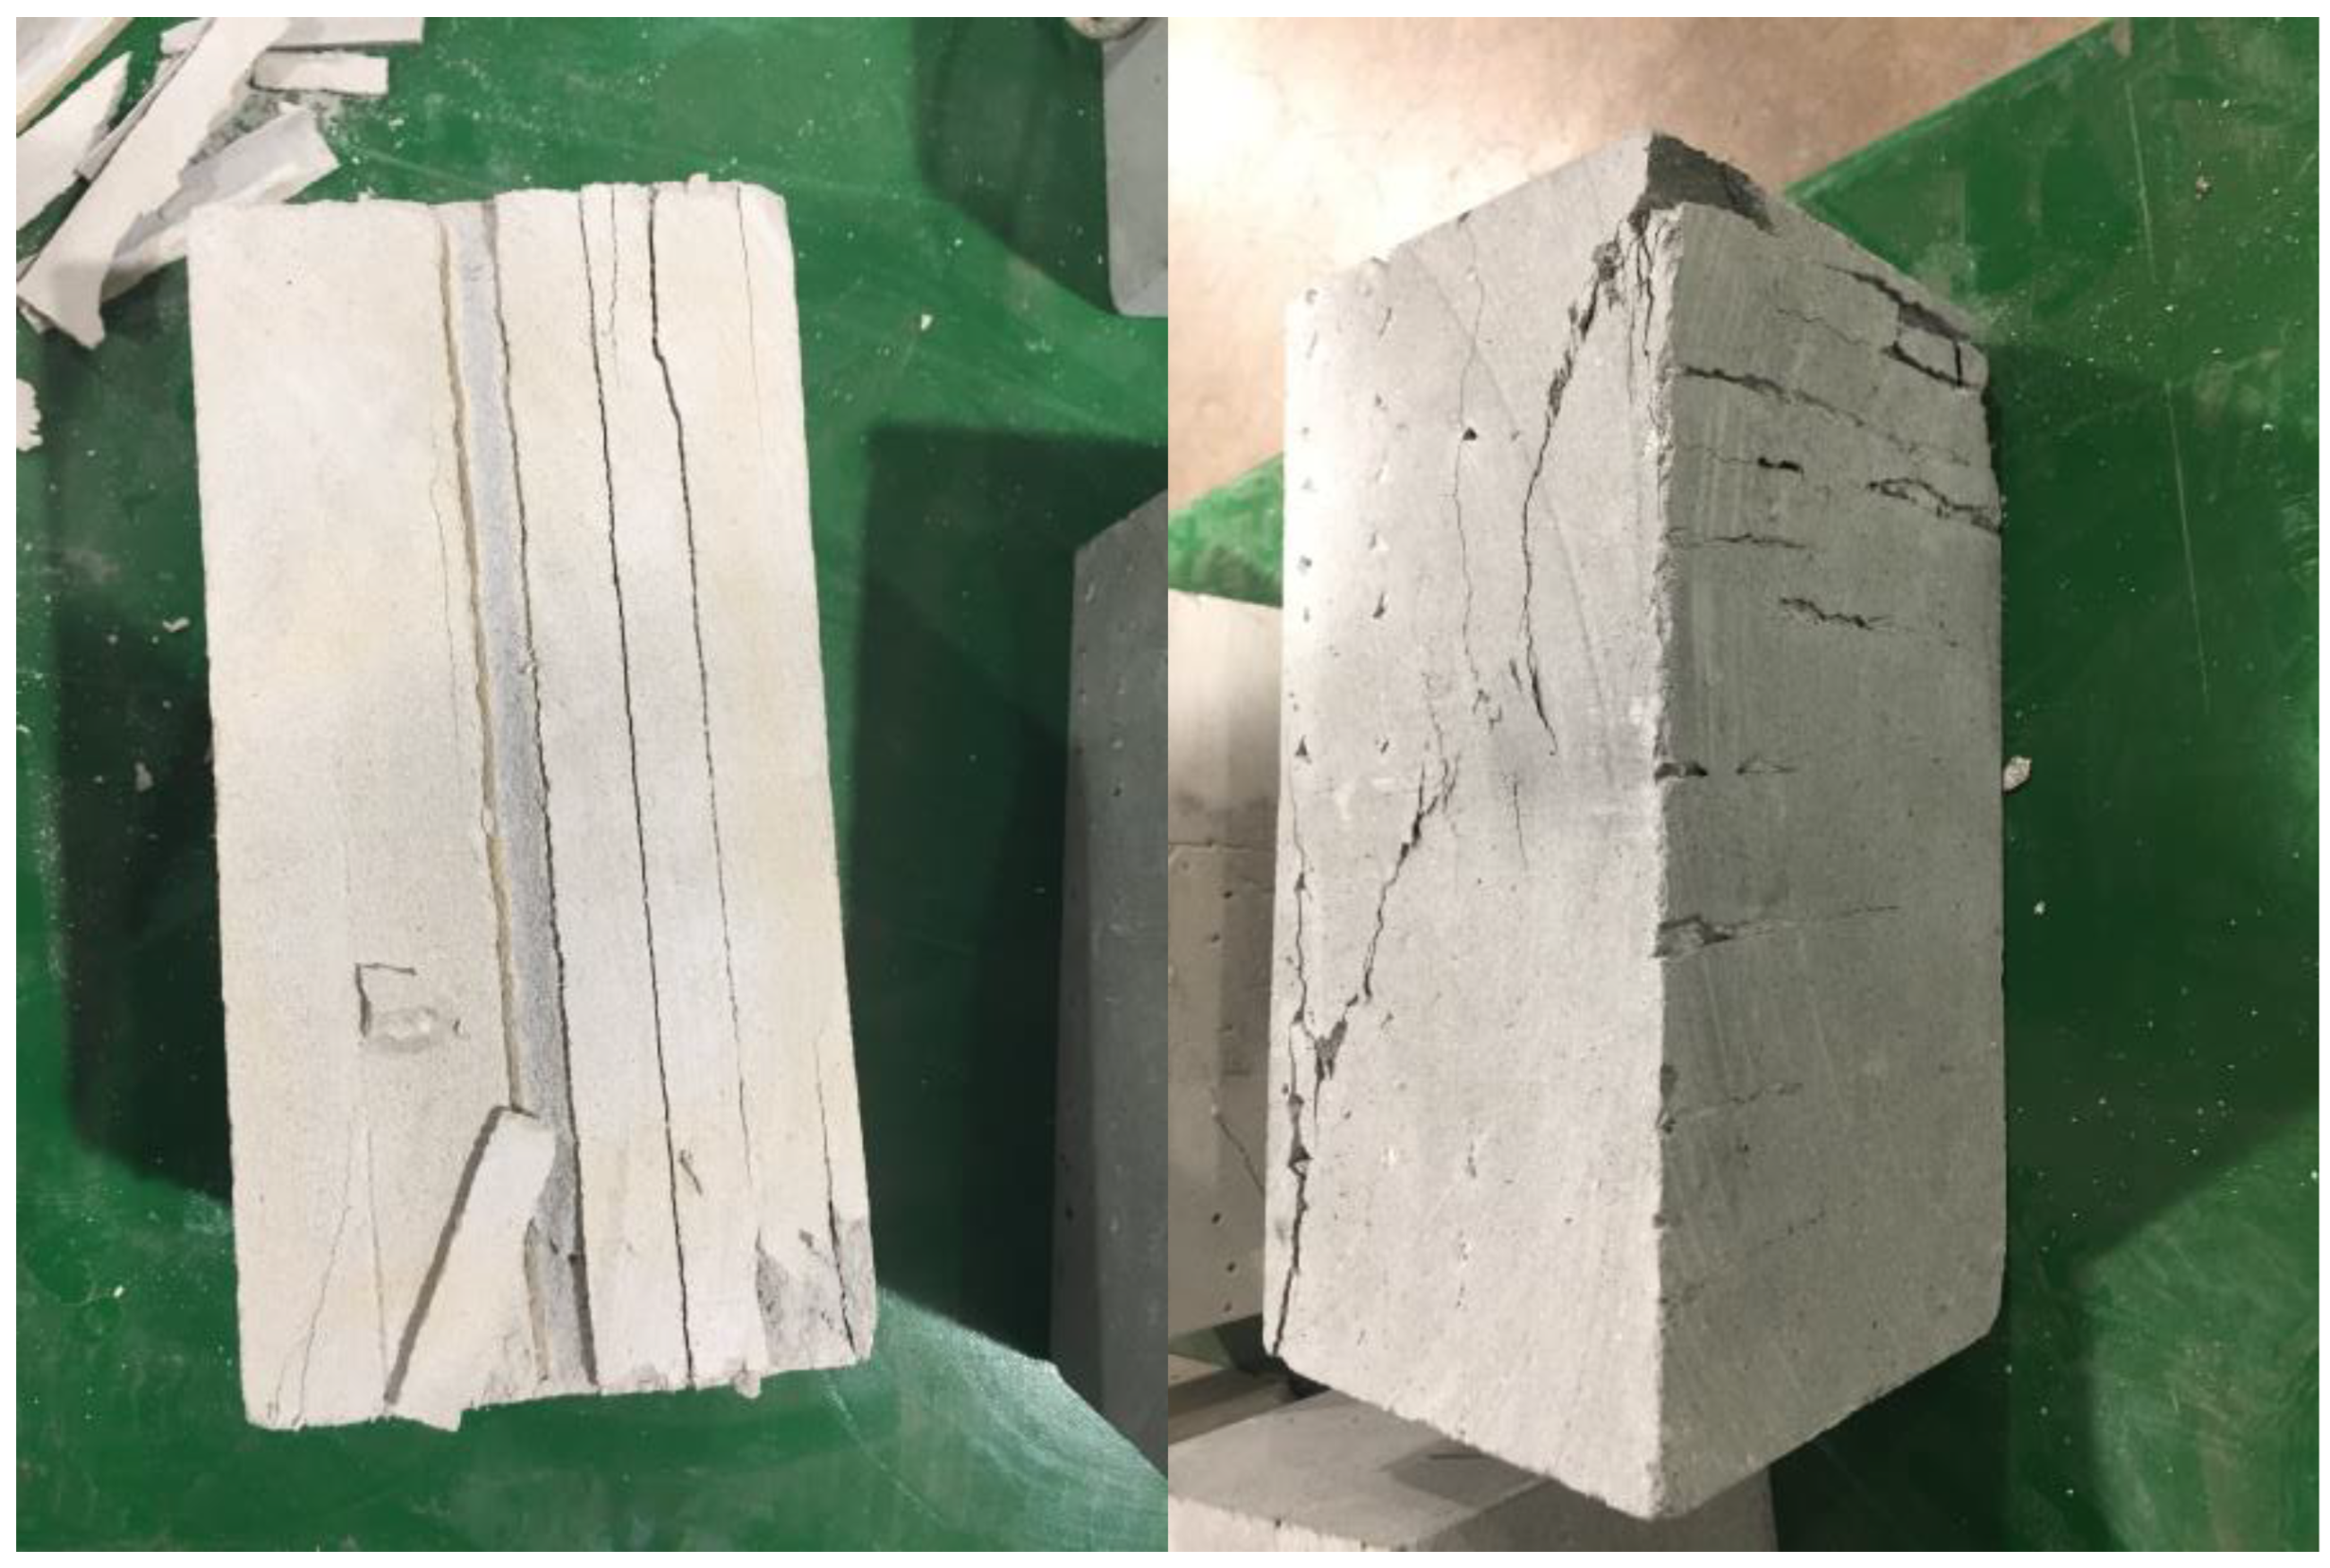
2.3.1. Compressive Strength Considering Anisotropy

The inherent anisotropic mechanical behavior of a 3D-printed concrete part has been pointed out on the basis of the layer-wise and filament-wire printing processes [35,36,37]. In addition, the changed cement mixture ingredient and water-cement ratio can also be expected to affect the concrete’s strength. Thus, the GCT concrete’s mechanical properties had to be tested due to the uncertainties of its peculiarity, even though it has ordinary Portland cement as its main ingredient. The GCT concrete has a distinctive curing pace since it is tuned as a printable concrete mixture with various supplementary materials. Hence, a set of material tests was performed to determine the deterioration in the compressive strength of the GCT concrete, in addition to the anisotropic mechanical characteristic.
The measured compressive strength purports to estimate the flexural moment strength of a 3D-printed concrete beam with reinforcement. The compressive strength of the flexural bending moment’s analytical model is assumed to be in the direction parallel to the printed beads because the printing toolpath at the critical section is aligned to the longitudinal direction of the beam. At the same time, the compressive strength in the orthogonal direction is measured to understand the effect of the varying orientation of the bead towards normal stress.
The prism specimens for the compressive strength measurement test had the dimensions of 120 × 120 × 240 mm for the printed samples with GCT concrete, while the cast samples had the dimensions of 90 × 90 × 180 mm. The orientation of the toolpath inside the sample had two cases: (a) printing layers perpendicular to the sample’s longitudinal direction and (b) printing layers parallel to the sample’s longitudinal direction, as shown in Figure 2. Three samples for each case were cut from the printed beam (each case in a different direction).
The compressive force was applied to the samples in both parallel and perpendicular directions relative to the orientation of the printing layers’ direction, as shown in Figure 3. “H” represents the samples where the printing layers were positioned horizontally during the testing, which is perpendicular to the compressive load and aligned with the sample’s direction, the same as the longitudinal direction of the sample axis. Conversely, “V” in the sample case name indicates that the layers were oriented vertically during the testing, making them so that the layers would be parallel to both the compressive load direction as the same as the longitudinal direction of the sample.
The cut parts were processed by grinding so that the part had all perimeter surfaces remained perpendicular to one another. Two strain gauges were applied at the center of the sample’s perimeter surfaces.
The ultimate compressive strength test was performed using the testing machine shown in Figure 4, where a sample is pressed until it reaches the crushing failure, yielding the ultimate compressive strength of the material. Based on ASTM C469 [38], the material’s elastic range should be determined as 40% of the ultimate compressive strength, which can be determined using prism or cylinder compressive testing. The calculated elastic range effectively excludes the specimen’s plastic behavior prior to failure.

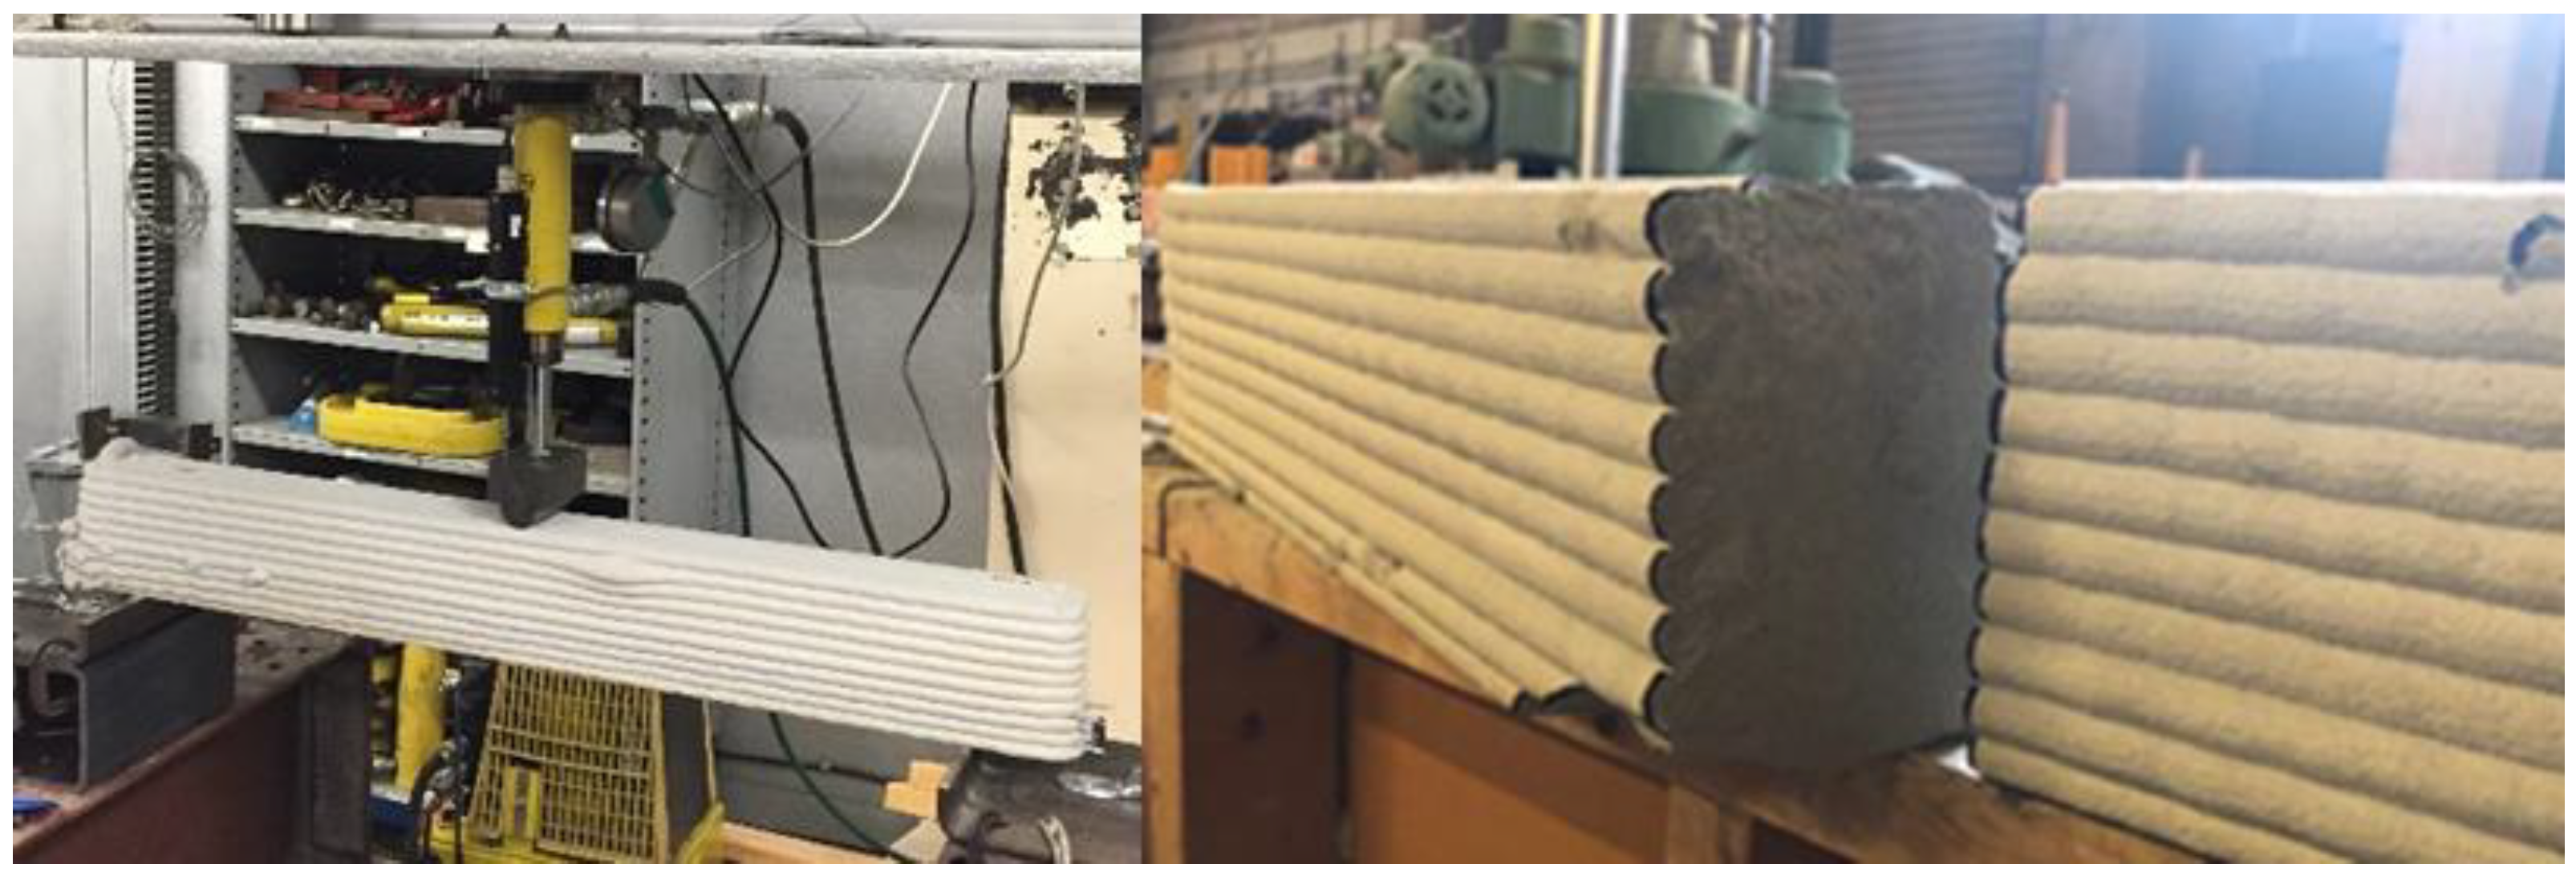
2.3.2. Modulus of Rupture from Bending Test

Beam specimens were printed with the dimensions of 150 mm in height, 100 mm in width, and 1000 mm in length. The beams were tested based on a three-point bending test setup, as shown in Figure 5.
The modulus of rupture is derived at the location where the test beam will have the maximum moment, i.e., the midspan. The beam is assumed to have enough longitudinal length to avoid considerable shear deformation in its cross-section. The stresses in the beam’s cross-section are expected to maintain the linear distribution since there is no reinforcement. The relationship between the modulus of rupture and bending moment is derived from the linear elastic model. The beam specimen with the GCT concrete showed an average maximum pin load of 4110 lbs (18.28 kN), while the corresponding value of the modulus of rupture for the GCT concrete was determined to be 1767.45 psi (12.19 MPa) from the modulus of rupture reflected in Equation (1):
f r = 3 P L 2 b h 2
where P is the applied pin load, L is the length of the beam, and b and h are the width and depth of the beam’s cross-section. It is assumed that the beam was under linear deformation, so it remained at its cross-section as a plane until the moment of failure.

2.3.3. Moment Capacity of Reinforced Printed Beam

Reinforcing a concrete beam with rebar is the conventional method to improve the structural capability of a concrete beam, especially the moment resistance and ductility, where concrete tensile stresses are limited, and flexural strength will depend on the presence of tensile reinforcement. Likewise, a printed concrete beam can take advantage of using the same kind of rebar. Reinforcement for printed beams can be designed considering the total reinforcing bar area not to exceed 2% of the effective area for all considered rebar configurations, as shown in Figure 6.
The ratio of the rebar area to the effective concrete area is defined as the reinforcement ratio, as shown by Equation (2), neglecting possible voids in the cross-section:
ρ = n A r e b a r A e
where n is the number of rebars, Arebar is the area of the reinforcing bar, and Ae is the effective area of concrete based on the effective depth d. The strength reduction factor determining the nominal bending strength of the beam depends on the failure modes, which can be compression-controlled, transition, or tension-controlled failure. Moreover, a beam’s failure mode also dictates how the moment capacity should be calculated below:
ϕ M n = ϕ A r e b a r f y , r e b a r d a 2
where fy,rebar is the tensile strength of the rebar, and a is the depth of the equivalent compressive stress block of the concrete section. Regarding steel rebar cases, transition- and compression-controlled failure modes can be considered when determining moment capacity. For the transition failure mode, when it is expected that the extreme top fiber of the beam cross-section will have a strength value in the range between the yield strength and ultimate strength, the strength reduction factor would need to be linearly interpolated in the range from 0.65 to 0.9 corresponding to the strain at the extreme fiber.
σ t , r e b a r = ϵ c d c c E r e b a r f y
The depth of the equivalent stress block is determined by the tensile stress fs, which can be linearly interpolated based on the neutral axis derived from the depth of the stress block.
a = A s f s 0.85 f c b   where   f s = ϵ c d β 1 c β 1 c E y
Under the assumption that the depth of the neutral axis on the beam’s cross-section is proportional to the depth of the equivalent stress block, a quadratic equation for the stress block is derived.
0.85 f c b A s E x ϵ c   a 2 + a d = 0
The moment capacity of the beam section is then determined by solving the quadratic equation for the depth of the equivalent stress block.
ϕ M n = ϕ 0.85 f c a b d a 2
The moment capacity from the numerical strain compatibility method can be compared to the value from the analytical solution for validation as follows:
Minimize   E r r ϵ s = T C = f y ϵ s 1 ϵ y + ϵ s 2 ϵ y f c ϵ c
where ϵ s 1 and ϵ s 2 are the strains of the first layer rebar, which determine the tensile stress in the rebar, and ϵ c is the critical compressive strain of the concrete. The initially assumed strains ϵ s 1 and ϵ s 2 will then be updated during the iteration to minimize the error in the equilibrium of forces on the cross-section plane. After the strains ϵ s 1 and ϵ s 2 are confirmed, the moment capacity can then be determined from the following equation:
ϕ M n = ϕ 0.85 f c a b c a 2 + f y ϵ s 1 ϵ y d 1 c + f y ϵ s 2 ϵ y d 2 c
The rebar configuration is only allowed when it meets the minimum clear spacing limitation and the maximum rebar area ratio. Table A1 summarizes all moment capacity calculations based on the testing beam with the steel rebar configurations. The mechanical properties of steel are assumed to be based on normal steel with 58 ksi (400 MPa) yield strength and 29,000 ksi (200,000 MPa) modulus of elasticity.
Table A2 shows all moment capacity calculations for the beam testing with the considered FRP rebar configurations. The mechanical properties of FRP are assumed based on the normal steel with 85.6 ksi (590 MPa) yield strength and 7252 ksi (50,000 MPa) modulus of elasticity. Unlike steel rebars, it is assumed that FRP rebars have no ductility. Thus, the printed beam with FRP rebar has no tension-controlled failure mode.
Among the cases in Table A1 and Table A2, the two reinforcement configurations shown in Figure 7 are selected for the steel and FRP rebar beams, as summarized in Table 4.
The calculated moment capacity of a beam is compared to the results obtained for the pin load testing.

3. Results and Discussion

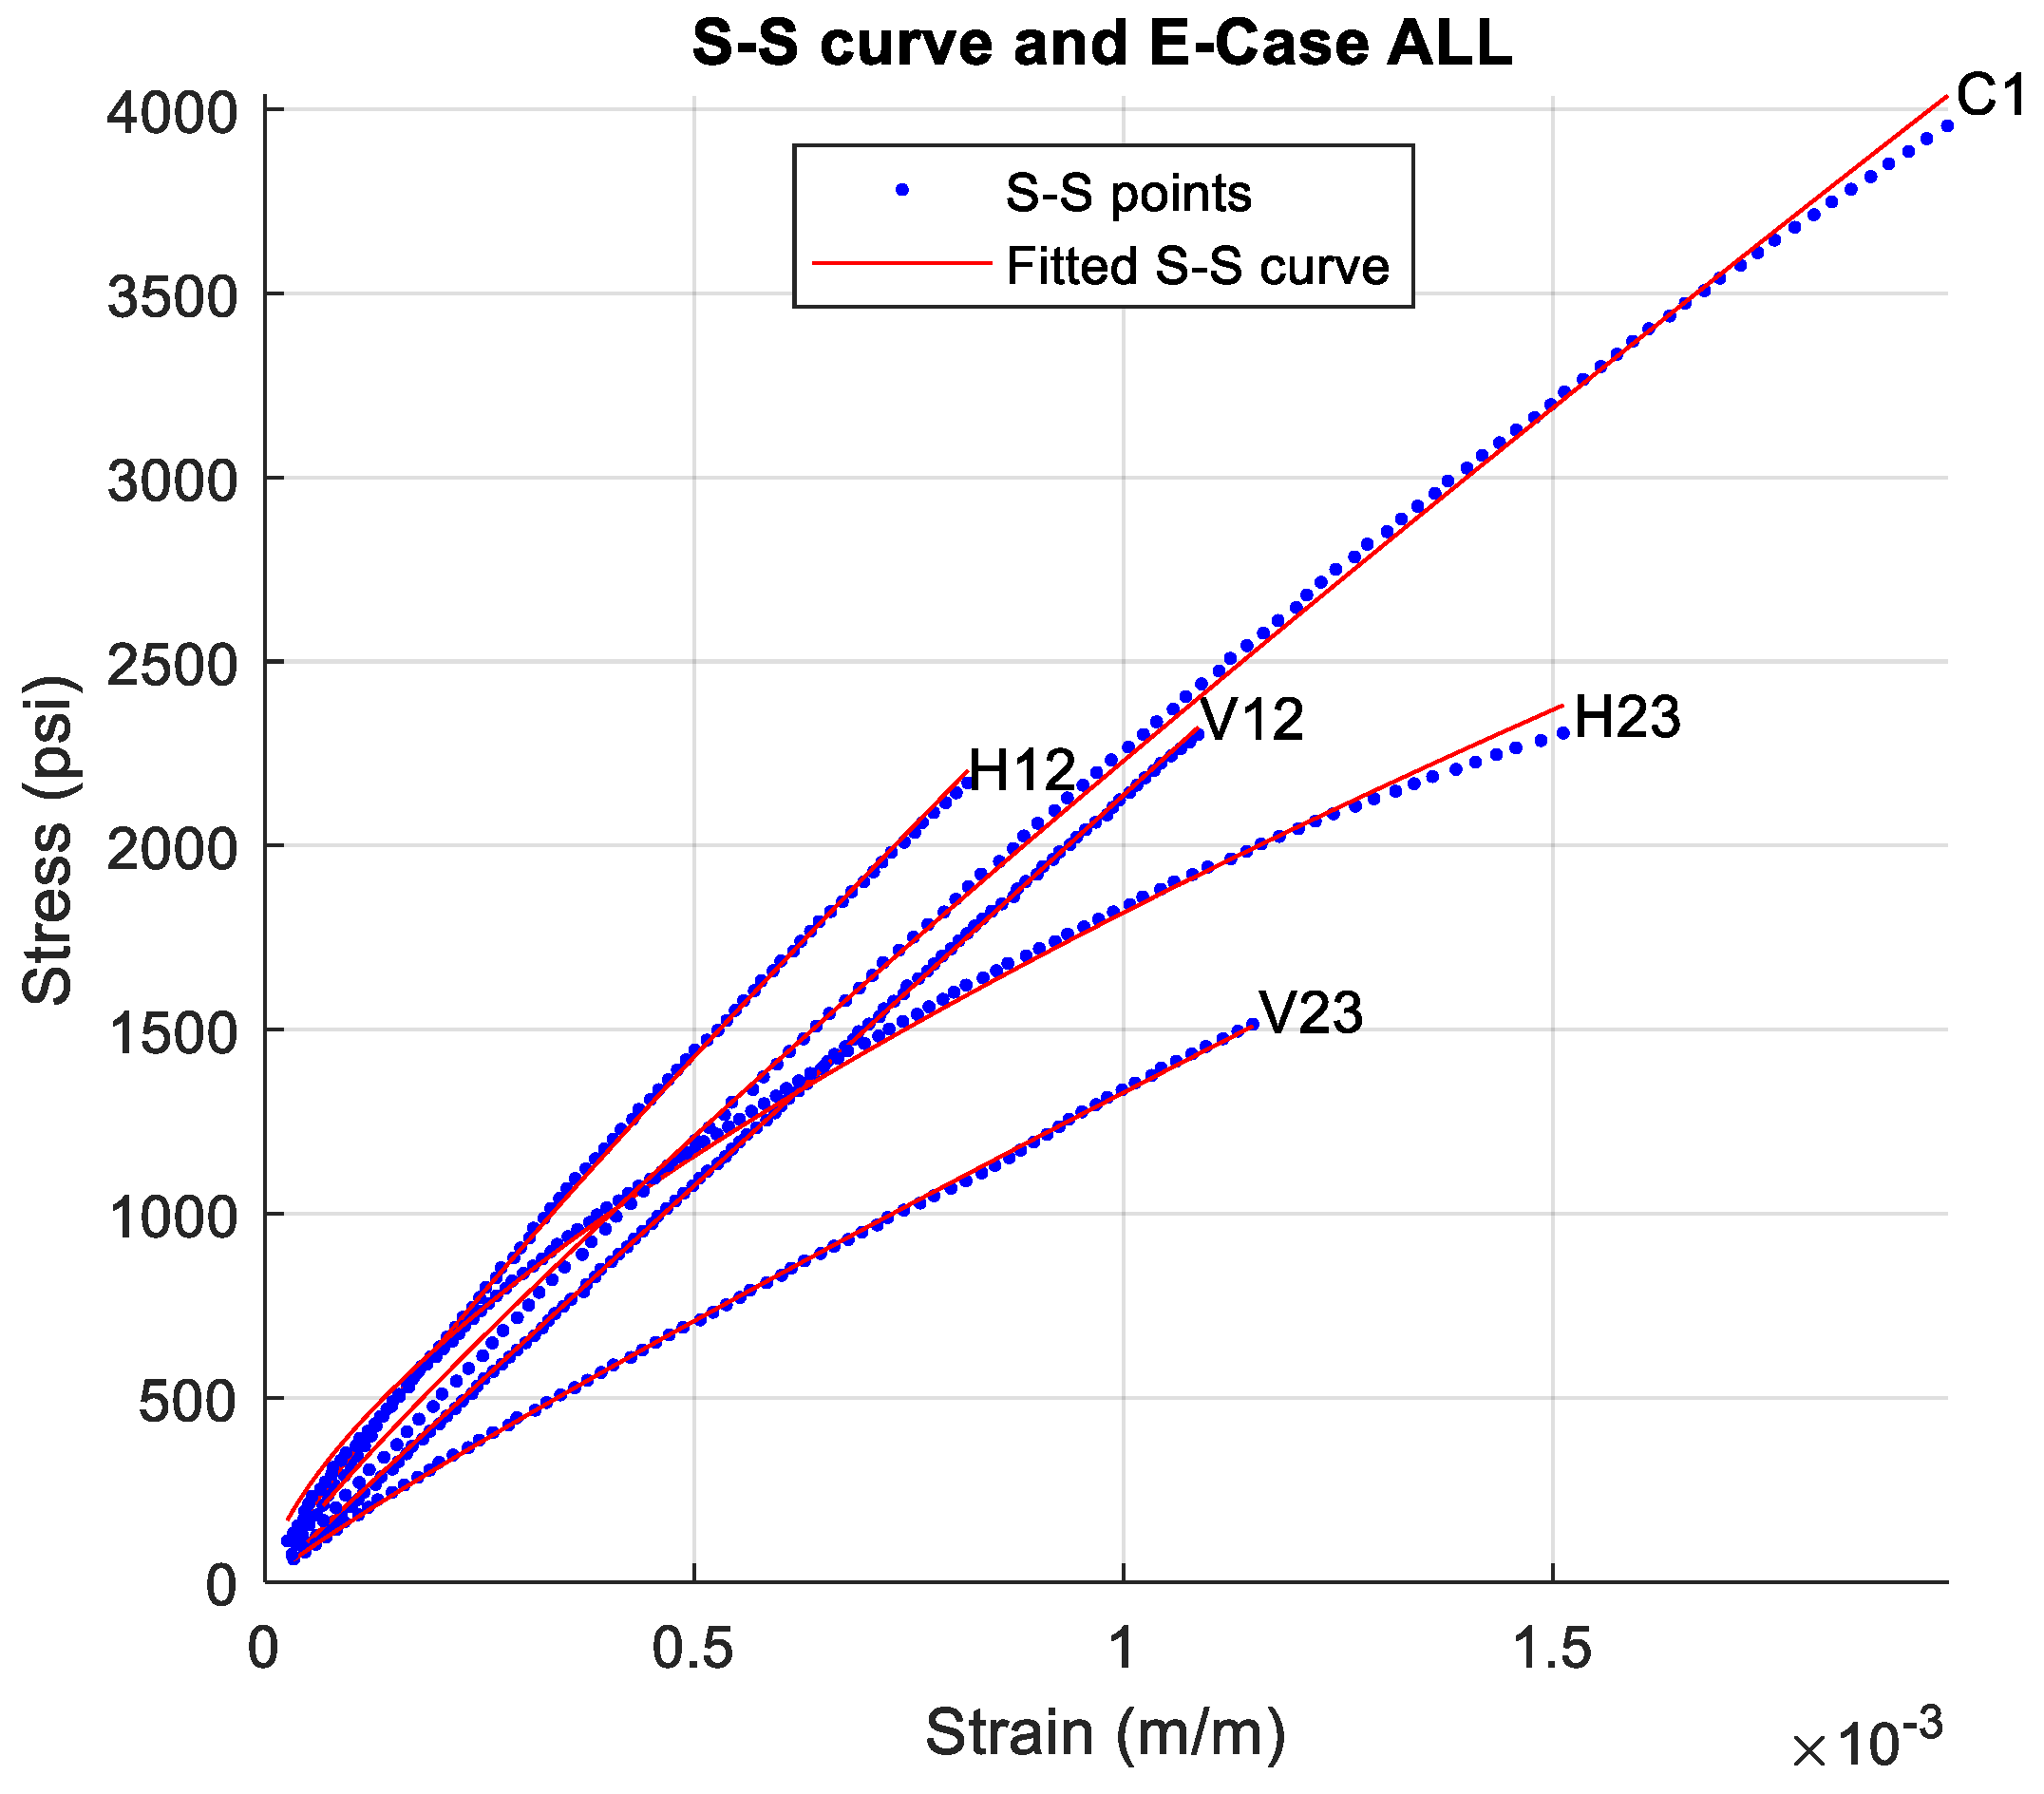
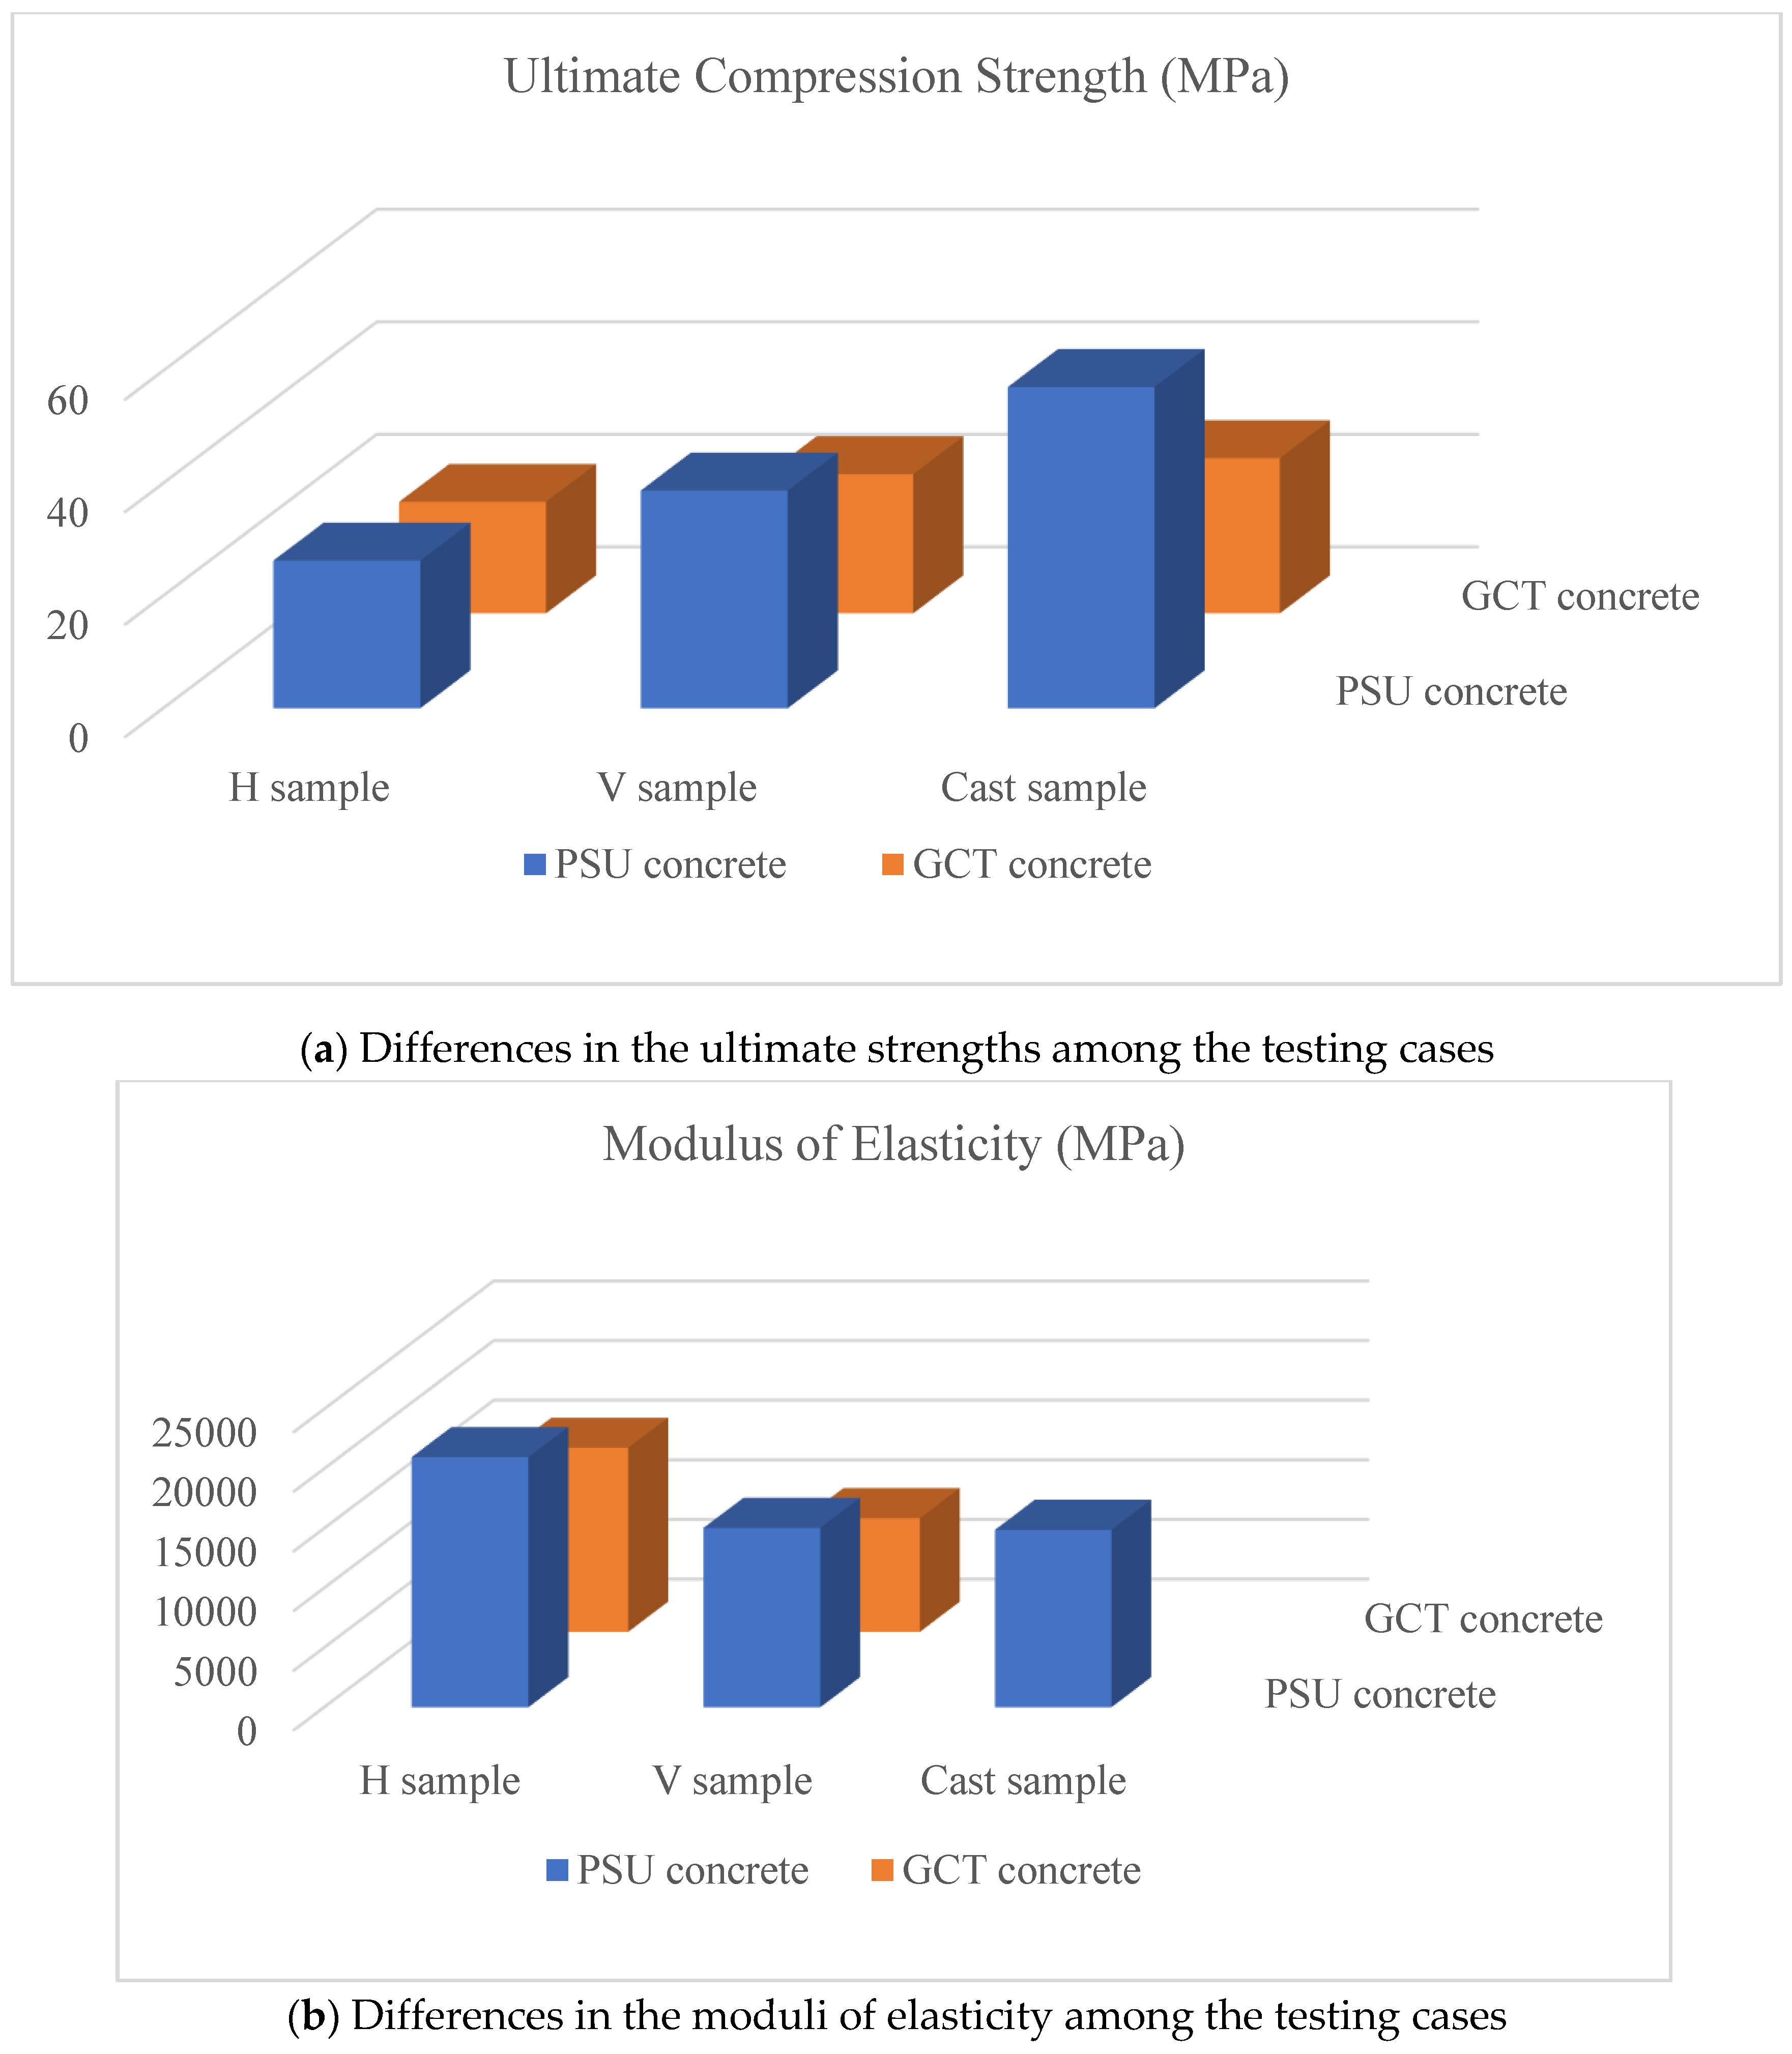
3.1. Comparison of Test Results and Detrmined Ultimate Strengths and Modulus of Elasticity of Printable Concretes

The measured ultimate strength is used to determine the material’s elastic range, which is assumed to be 40% of the ultimate strength, as listed in Table 5. The V-samples tend to have higher ultimate compressive strengths than the H-samples for both material cases.
The material’s modulus of elasticity is calculated as the average of the compressive stress divided by the corresponding strain until the stress reaches 40% of the ultimate compressive strength. The elastic modulus is calculated according to Pauw’s work (Pauw 1960) in Section 19.2 of ACI 318-14 [39]. The section permits the calculation of the modulus of elasticity, as shown in Equation (10) for the normal weight concrete and Equation (11) for the general concrete, whose weight is between 90 and 160 pounds per cubic foot or between 1.4 and 2.6 tons per cubic meter.
E c = 57000 f c   ( psi )
E c = w c 1.5 33 f c   ( psi )
Within the determined elastic behavior range for each sample, the strain history at the center of each perimeter surface of the sample is measured through testing using the setup in Figure 8, with the results plotted in Figure 9. Every sample was tested for two repeated compressive material tests.
The testing machine measured the applied total force from the load cell contacting the sample top, while the strain gauge measured the axial deformation along with the axial force. Determining axial stress responding to the strains used the fixed cross-section area for the calculation, as shown in Equation (12).
σ a x i a l = F t o t a l A g
The strain-stress curves from the testing data show the varying inclination for the samples, representing the samples’ modulus of elasticity, as shown in Figure 10.
The stress-strain curves of all samples are drawn simultaneously in Figure 11 for comparison. There are certain noticeable patterns between the material testing cases. The V-samples have a lower inclination of stresses per strain, which is the modulus of elasticity. Meanwhile, the PSU concrete, denoted as 1, has a higher elastic modulus than GCT concrete, denoted as 2.
Table 6 clarifies the differences between the testing cases in the derived modulus of elasticity from the material testing. The GCT concrete’s ultimate strength of 4 ksi is called the GCT company’s material specification [28]. The modulus of elasticity of GCT concrete can be calculated using the equation provided by ACI 318-14 Section 19.2.2 [39].
Figure 12 shows the differences in the mechanical properties among the testing cases. It is observed that the V-sample has higher ultimate strength than the H-sample, while the H-sample has a higher modulus of elasticity than the V-sample; that is the case for both types of concrete materials (GCT and PSU). At the same time, the PSU concrete has higher ultimate strength and modulus of elasticity than GCT concrete.
Because of the expected low interlocking between printed beads, it is reasonable to expect that the printed samples will have lower strength than the cast samples. In other words, the weak bonding between beads may fail to hold the internal pressure due to the compressive loading.
In Figure 12, the H-sample indicates that the major principal compressive stresses are oriented perpendicular to the printed beads. In this configuration, the compressive stresses may enhance the bonding strength between the beads, while the longitudinal direction of the beads appears strong enough to withstand the minor principal stresses. Conversely, in the V-sample, the printed beads are aligned parallel to the major principal compressive stresses. The weaker bonding between the beads may not be sufficient to resist the minor principal stresses, which act perpendicular to the beads’ longitudinal axis. This explanation aligns with the cracking observed in the failure mode of the compressive test specimens, highlighting the critical role of interlocking strength between beads, as shown in Figure 13.
However, this explanation does not account for why the H-samples exhibited lower compressive strength, but a higher modulus of elasticity compared to the V-samples. To address this, an additional factor must be considered: the bonding strength between the beads is significantly weaker than the inherent strength of the printed concrete itself. In the V-samples, stresses can develop within the beads until the bonding strength fails to resist the splitting (minor principal) stress. In contrast, in the H-samples, the interlocking surfaces are directly subjected to the major principal stresses, potentially compromising the compressive strength of the specimen.
The printed beams with reinforcement were tested under the pin loading, as shown earlier in Figure 5. The beam’s pin load capacity is estimated based on the moment capacity at the critical location. As shown in Table 7, the printed beams with steel rebars have an average of 14% difference with respect to the analytical solution (i.e., nominal strength). However, the tested FRP beam was shown to have almost half the load capacity compared to the nominal strength. The differences between the prediction and test results for the FRP beam’s strength prediction are speculated to be mainly due to the weaker bond strength between the concrete and the FRP rebars, which have a somewhat untraditional rib shape. This did not allow the bars to develop their strengths, resulting in bond failure.

3.2. Flexural Moment Capacity Deterioration and Anisotropic Mechanical Behavior

Based on the relationship between the modulus of rupture and the moment capacity of the cross-section under the elastic behavior, the relationship between the modulus of elasticity and the compressive strength is as follows:
E = α ϵ c r f c
where f c is the compressive strength, ϵ c r is the critical strain corresponding to the cracking moment, and α is the ratio of the modulus of rupture to the compressive strength. In the preliminary study performed by Ko and Memari [40], the critical strain ϵ c r at flexural failure was assumed as 0.0002 based on the studies by Siess and Abbasi [41] and Carreira and Chu [42]. After substituting the assumed cracking strain, the derived values are compared to the derived result from the test. Figure 14 shows how the material properties of the printed concrete are determined and validated. The modulus of elasticity is compared with the compressive strength, strain-stress relation, and modulus of rupture. Then, the relationships between the compressive strength, the modulus of elasticity, and the modulus of rupture are modified for the printed concrete.
The average value of 2205 psi (15.20 MPa) from the compressive strength tests measured by the CMT lab [43] and the equation E c = 57,000 f c provides the modulus of elasticity value of 2676.5 ksi (18,454 MPa). The modulus of elasticity value derived from the modulus of rupture E = f r / ϵ c r is 1609.9 ksi (11,100 MPa) with the values for the constant α and cracking strain εcr of 6.857 and 0.0002, respectively. The weight per unit volume of concrete of 116.5 lbs/ft3 (1.866 × 10⁻⁹ t/mm3) and the compressive strength value of 2205 psi (15.20 MPa) measured by CMT lab was used in the equation for modulus of elasticity, i.e., E c = w c 1.5 33 f c , which gives the modulus of elasticity value of 1948.5 ksi (13,435 MPa). The difference between the modulus of elasticity determined from the measured compressive strength and the calculated value is 21%. Accordingly, one can assume that the cracking strain of 0.0002, which represents the PSU concrete’s cracking mechanism, is reasonable.
In the same way, in addition to the material testing of PSU concrete performed for Phase 2 of the NASA 3D printed habitat competition, further material tests of PSU and GCT concrete were performed as part of the study of material characteristics for Phase 3 of the competition. Based on the compressive test results in Table 5, the derived modulus of elasticity using Equations (10), (11) and (13) are compared and listed in Table 8.
The modulus of rupture value calculated is 1768 psi, while the printed GCT concrete beam held 4110 lbs of pin loading in the three-point bending test. The modulus of elasticity derived by using the modulus of rupture is 4130 ksi with the critical strain ϵ c r of 0.0003 for the GCT beam, which is much higher than the values for GCT concrete cases. On the other hand, the critical strain for GCT is derived as 0.000553 based on the modulus of elasticity from its compressive strength to agree with the stress-strain data. While the higher strength of PSU concrete having a lower critical strain may be explained by the relationship between concrete’s compressive strength and modulus of elasticity, further study is needed to estimate the exact critical strain for GCT concrete to verify the variation in the derived modulus of elasticity.

4. Summary, Conclusions, and Possible Follow-Up Studies

The concrete mixture provided by GCT company was studied to evaluate its structural feasibility as a ready-market available alternative printable concrete. The mechanical properties of GCT concrete were compared to those of a 3D printable concrete developed at Pennsylvania State. When cast, the GCT concrete compressive strength is 48% lower than that of PSU concrete. The differences in printed concrete’s compressive strengths are reduced by 36% when a compressive force is applied to the printing layer in a parallel direction and by 25% in perpendicular directions. On the other hand, the modulus of elasticity derived from the compressive strength disagrees with the modulus of elasticity from direct stress-strain measurement under the compressive test. The GCT concrete’s modulus of elasticity is 105% that of the PSU concrete when a compressive force is in the parallel direction of the printed layer and 156% of PSU concrete when the force is in the perpendicular orientation.
The reinforced printed beams were tested and compared to the analytical modeling based on the measured compressive strengths and modulus of elasticity for PSU and GCT concretes. Beams with steel rebars generally have expected moment capacity based on the measured mechanical properties, ranging from −25% to 11.4%. However, the beam with FRP rebars has a much lower moment capacity than expected, with a −50.2% difference. The main reason for the difference in the moment capacity is thought to be due to the complex failure modes resulting from the printing layer’s reduced bond strength with the rebar, which deteriorates the developed force in the rebars. Accordingly, this study shows the necessity of large-size specimens to statistically quantify the effect of the anisotropic mechanical properties of printed concrete and the lower bond strength between filaments and rebars.
It is clear that the orientation of printed beads significantly impacts the structural behaviors of materials, as evidenced by the anisotropic mechanical properties observed in material tests. However, applying these anisotropic behaviors in practice is rarely done due to the complexity of accurately modeling the material properties along the printing path and accounting for reinforcing elements. As a result, studies on artificial intelligence (AI) have gained attention for utilizing machine learning based on physics-informed data. Gaur et al. [44] demonstrated the potential of machine learning in solving structural mechanics problems, where trained models can instantly predict mechanical responses based on test data, bypassing traditional iterative calculations. This flexibility allows for embedding precise mechanical properties in structural analyses of unconventional materials, such as printed concrete. Liu and Lu [45] proposed surrogate models for computational stochastic multi-scale modeling in material design, highlighting AI’s benefits for 3D concrete printing. These include the performance of deep neural networks, the rapid computation of gradient-boosting machines for multi-scale modeling, and the broader application of AI in such analyses. The multi-scale nature of 3D printed concrete requires modeling at multiple levels: micro-scale material properties and printing path-oriented mesoscale structures integrated into macro-scale models. Luo [46] introduced kernel-embedded local learning based on data-intensive modeling, where the kernel function, combined with local learning methods optimized for reduced-memory environments, presents vast potential for AI collaboration in 3D concrete printing analysis. Although Zhang et al.’s review [47] hints at combining machine learning with 3D printing, it does not delve deeply into the application of AI to 3D concrete printing specifically.

Author Contributions

Conceptualization, K.P., A.M.M., M.H., A.R., J.P.D. and S.N.; methodology, K.P., A.M.M., M.H., A.R.; software, K.P., M.H., J.P.D.; validation, K.P., A.M.M., M.H., A.R., J.P.D. and S.N.; formal analysis, K.P., A.M.M., M.H., A.R.; investigation, K.P., A.M.M., M.H., A.R., J.P.D. and S.N.; resources, A.M.M., M.H., A.R., J.P.D. and S.N.; data curation, K.P., M.H., J.P.D.; writing—original draft preparation, K.P., A.M.M., M.H., A.R., J.P.D. and S.N.; writing—review and editing, K.P., A.M.M., M.H., A.R., J.P.D. and S.N.; visualization, K.P., A.M.M., M.H., A.R., J.P.D. and S.N.; supervision, A.M.M., M.H., A.R., J.P.D. and S.N.; project administration, A.M.M., M.H., A.R., J.P.D. and S.N.; funding acquisition, A.M.M., A.R., J.P.D. and S.N. All authors have read and agreed to the published version of the manuscript.

Funding

This research was financially sponsored by The Raymond A. Bowers Program for Excellence in Design and Construction of the Built Environment, The Pennsylvania State University, Autodesk, Inc.®, Golf Concrete Technology (GCT), and NASA.

Data Availability Statement

Data for the test results are not readily available. However, the source document link is: https://etda.libraries.psu.edu/files/final_submissions/22236.

Conflicts of Interest

Two of the co-authors, Jose P. Duarte and Shadi Nazarian, have equity in a company, X-Hab 3D, whose activity is concrete printing.

Appendix A

Table A1. Analytical solution for the beam with varying steel reinforcement configuration.
CasesEffective Depth de (in, mm)Rebar Area
(in2, mm2)
Rebar Area
Ratio (%)
Max. Tensile Stress σt at the Rebar,
(ksi, MPa)
Max. Tensile Strain of
Rebar (in/in)
Nominal
Moment
Capacity *,
(k-ft, kN-m)
Failure ModePin Load
Capacity for Beam,
(kips, kN) **
#3 Rebar15 mm cover1-Layer with 2 Rebar per layer5.1
130
0.22
142
1.158.0
400
0.009294.4
6.0
Tension-controlled5.4
23.9
1-Layer with 3 Rebar per layer 5.1
130
0.33
213
1.658.0
400
0.005196.2
8.4
Tension-controlled7.6
33.7
2-Layer with 2 Rebar per layer4.6
118
0.44
284
2.258.0
400
0.003165.7
7.7
Tension-controlled6.9
30.8
2-Layer with 3 Rebar per layer4.6
118
0.66
426
3.358.0
400
0.002526.4
8.6
Tension-controlled7.7
34.5
30 mm cover1-Layer with 2 Rebar per layer4.5
115
0.22
142
1.258.0
400
0.007873.8
5.2
Tension-controlled4.7
20.8
1-Layer with 3 Rebar per layer 4.5
115
0.33
213
1.958.0
400
0.004255.0
6.8
Tension-controlled6.1
27.1
2-Layer with 2 Rebar per layer4.1
103
0.44
284
2.558.0
400
0.003084.6
6.2
Tension-controlled5.6
24.7
2-Layer with 3 Rebar per layer4.1
103
0.66
426
3.758.0
400
0.002495.1
7.0
Tension-controlled6.3
27.9
#4 Rebar15 mm cover1-Layer with 2 Rebar per layer5.1
129
0.4
258
2.058.0
400
0.003686.3
8.5
Tension-controlled7.6
34.0
1-Layer with 3 Rebar per layer5.1
129
0.6
387
3.058.0
400
0.002797.5
10.1
Tension-controlled9.1
40.5
2-Layer with 2 Rebar per layer4.5
115
0.8
516
4.058.0
400
0.002406.6
8.9
Tension-controlled8.0
35.6
2-Layer with 3 Rebar per layer4.5
115
1.2
774
6.057.0
393
0.001977.5
10.1
Compression-controlled9.1
40.5
30 mm cover1-Layer with 2 Rebar per layer4.5
114
0.4
258
2.358.0
400
0.003405.2
7.0
Tension-controlled6.3
28.1
1-Layer with 3 Rebar per layer4.5
114
0.6
387
3.458.0
400
0.002776.3
8.6
Tension-controlled7.7
34.3
2-Layer with 2 Rebar per layer3.9
100
0.9
516
4.558.0
400
0.002415.3
7.3
Tension-controlled6.5
29.0
2-Layer with 3 Rebar per layer3.9
100
1.2
774
6.858.0
400
0.002016.2
8.4
Tension-controlled7.6
33.6
* Nominal moment capacity adopts the strength reduction factor value of 0.65 for the compression-controlled beam, 0.9 for the tension-controlled beam with the max tensile strain in the rebar greater than 0.005 and interpolated between 0.65 and 0.9 based on the rebar’s strain for the beam with the max tensile strain in the rebar between 0.002 and 0.005 (ACI 318-14, Section 21.2). ** The simple pin support beam has a 1 m length.
Table A2. Analytical solution for the beam with varying FRP reinforcement configuration.
CasesEffective Depth, de, (in, mm)Rebar Area
(in2, mm2)
Rebar Area
Ratio (%)
Max. Tensile Stress σt at the Rebar,
ksi (MPa)
Max. Tensile Strain of
Rebar (in/in)
Nominal
Moment
Capacity *,
(k-ft, kN-m)
Failure ModePin Load
Capacity for Beam,
(kips, kN) **
#3 Rebar15 mm cover1-Layer with 2 Rebar per layer5.1
130
0.22
142
1.172.6
500
0.010013.9
5.2
Compression-controlled4.7
20.9
1-Layer with 3 Rebar per layer 5.1
130
0.33
213
1.658.2
401
0.008024.5
6.1
Compression-controlled5.5
24.4
2-Layer with 2 Rebar per layer4.6
118
0.44
284
2.249.6
342
0.006854.0
5.4
Compression-controlled4.9
21.7
2-Layer with 3 Rebar per layer4.6
118
0.66
426
3.339.6
273
0.005474.6
6.2
Compression-controlled5.6
24.8
30 mm cover1-Layer with 2 Rebar per layer4.5
115
0.22
142
1.269.5
479
0.009593.2
4.4
Compression-controlled3.9
17.6
1-Layer with 3 Rebar per layer 4.5
115
0.33
213
1.955.8
385
0.007703.8
5.1
Compression-controlled4.6
20.5
2-Layer with 2 Rebar per layer4.1
103
0.44
284
2.547.7
329
0.006583.3
4.4
Compression-controlled4.0
17.7
2-Layer with 3 Rebar per layer4.1
103
0.66
426
3.738.2
263
0.005273.7
5.0
Compression-controlled4.5
20.1
#4 Rebar15 mm cover1-Layer with 2 Rebar per layer5.1
129
0.4
258
2.053.5
369
0.007384.9
6.6
Compression-controlled5.9
26.3
1-Layer with 3 Rebar per layer5.1
129
0.6
387
3.042.9
296
0.005925.6
7.6
Compression-controlled6.8
30.4
2-Layer with 2 Rebar per layer4.5
115
0.8
516
4.036.6
253
0.005054.7
6.4
Compression-controlled5.8
25.7
2-Layer with 3 Rebar per layer4.5
115
1.2
774
6.029.3
202
0.004055.3
7.2
Compression-controlled6.5
28.9
30 mm cover1-Layer with 2 Rebar per layer4.5
114
0.4
258
2.351.7
356
0.007134.1
5.5
Compression-controlled5.0
22.2
1-Layer with 3 Rebar per layer4.5
114
0.6
387
3.441.6
287
0.005734.7
6.4
Compression-controlled5.8
25.6
2-Layer with 2 Rebar per layer3.9
100
0.9
516
4.535.6
246
0.004913.8
5.2
Compression-controlled4.7
20.9
2-Layer with 3 Rebar per layer3.9
100
1.2
774
6.828.7
198
0.003964.3
5.9
Compression-controlled5.4
23.5
* Nominal moment capacity adopts the strength reduction factor value of 0.65 for all cases because FRP rebar has no ductility after it yields (ACI 318-14, Section 21.2). ** The simple pin support beam has a 1 m length.

References

  1. ISO/ASTM 52900; Additive Manufacturing—General Principles—Fundamentals and Vocabulary. ISO: Geneva, Switzerland, 2021.
  2. ASTM F2792-12a; Standard Terminology for Additive Manufacturing Technologies: Designation. ASTM International: West Conshohocken, PA, USA, 2012.
  3. Pegna, J. Exploratory investigation of solid freeform construction. Autom. Constr. 1997, 5, 427–437. [Google Scholar] [CrossRef]
  4. Khoshnevis, B.; Dutton, R. Innovative rapid prototyping process makes large sized, smooth surfaced complex shapes in a wide variety of materials. Mater. Technol. 1998, 13, 53–56. [Google Scholar] [CrossRef]
  5. Khoshnevis, B. Automated construction by contour crafting—Related robotics and information technologies. Autom. Constr. 2004, 13, 5–19. [Google Scholar] [CrossRef]
  6. Kazemian, A.; Yuan, X.; Cochran, E.; Khoshnevis, B. Cementitious materials for construction-scale 3D printing: Laboratory testing of fresh printing mixture. Constr. Build. Mater. 2017, 145, 639–647. [Google Scholar] [CrossRef]
  7. Nematollahi, B.; Xia, M.; Sanjayan, J. Current progress of 3D concrete printing technologies. In ISARC, Proceedings of the International Symposium on Automation and Robotics in Construction; IAARC Publications: Taipei, Taiwan, 2017; Volume 34, pp. 1–8. [Google Scholar]
  8. Nazarian, S.; Duarte, J.P.; Bilén, S.G.; Memari, A.; Radlinska, A.; Meisel, N.; Hojati, M. Additive manufacturing of architectural structures: An interplay between materials, systems, and design. In Sustainability and Automation in Smart Constructions; Springer International Publishing: Cham, Switzerland, 2021; pp. 111–119. [Google Scholar]
  9. Ambily, P.S.; Kaliyavaradhan, S.K.; Rajendran, N. Top challenges to widespread 3D concrete printing (3DCP) adoption—A review. Eur. J. Environ. Civ. Eng. 2024, 28, 300–328. [Google Scholar] [CrossRef]
  10. Carneau, P.; Mesnil, R.; Roussel, N.; Baverel, O. Additive manufacturing of cantilever—From masonry to concrete 3D printing. Autom. Constr. 2020, 116, 103184. [Google Scholar] [CrossRef]
  11. Liu, C.; Yue, S.; Zhou, C.; Sun, H.; Deng, S.; Gao, F.; Tan, Y. Anisotropic mechanical properties of extrusion-based 3D printed layered concrete. J. Mater. Sci. 2021, 56, 16851–16864. [Google Scholar] [CrossRef]
  12. Malik, U.J.; Riaz, R.D.; Rehman, S.U.; Usman, M.; Riaz, R.E.; Hamza, R. Advancing mix design prediction in 3D printed concrete: Predicting anisotropic compressive strength and slump flow. Case Stud. Constr. Mater. 2024, 21, e03510. [Google Scholar] [CrossRef]
  13. Zhang, K.; Lin, W.; Zhang, Q.; Wang, D.; Luo, S. Evaluation of anisotropy and statistical parameters of compressive strength for 3D printed concrete. Constr. Build. Mater. 2024, 440, 137417. [Google Scholar] [CrossRef]
  14. Baktheer, A.; Classen, M. A review of recent trends and challenges in numerical modeling of the anisotropic behavior of hardened 3D printed concrete. Addit. Manuf. 2024, 89, 104309. [Google Scholar] [CrossRef]
  15. Xiao, J.; Liu, H.; Ding, T. Finite element analysis on the anisotropic behavior of 3D printed concrete under compression and flexure. Addit. Manuf. 2021, 39, 101712. [Google Scholar] [CrossRef]
  16. Le, T.T.; Austin, S.A.; Lim, S.; Buswell, R.A.; Law, R.; Gibb, A.G.F.; Thorpe, T. Hardened properties of high-performance printing concrete. Cem. Concr. Res. 2012, 42, 558–566. [Google Scholar] [CrossRef]
  17. Paul, S.C.; Tay, Y.W.D.; Panda, B.; Tan, M.J. Fresh and hardened properties of 3D printable cementitious materials for building and construction. Arch. Civ. Mech. Eng. 2018, 18, 311–319. [Google Scholar] [CrossRef]
  18. Li, Z.; Hojati, M.; Wu, Z.; Piasente, J.; Ashrafi, N.; Duarte, J.P.; Nazarian, S.; Bilén, S.G.; Memari, A.M.; Radlińska, A. Fresh and hardened properties of extrusion-based 3D-printed cementitious materials: A review. Sustainability 2020, 12, 5628. [Google Scholar] [CrossRef]
  19. Panda, B.; Paul, S.C.; Tan, M.-J. Anisotropic mechanical performance of 3D printed fiber reinforced sustainable construction material. Mater. Lett. 2017, 209, 146–149. [Google Scholar] [CrossRef]
  20. Daungwilailuk, T.; Pheinsusom, P.; Pansuk, W. Uniaxial load testing of large-scale 3D-printed concrete wall and finite-element model analysis. Constr. Build. Mater. 2021, 275, 122039. [Google Scholar] [CrossRef]
  21. Vuong, N.-V.; Liu, J.; Li, S.; Zhang, G.; Hung, N.-X.; Tran, P. Modelling of 3D-printed bio-inspired bouligand cementitious structures reinforced with steel fibres. Eng. Struct. 2023, 274, 115123. [Google Scholar] [CrossRef]
  22. Liu, B.; Liu, X.; Li, G.; Geng, S.; Li, Z.; Weng, Y.; Qian, K. Study on anisotropy of 3D printing PVA fiber reinforced concrete using destructive and non-destructive testing methods. Case Stud. Constr. Mater. 2022, 17, e01519. [Google Scholar] [CrossRef]
  23. Hojati, M.; Sedghi, R.; Li, Z.; Memari, A.; Nazarian, S.; Radlińska, A.; Duarte, J.P. Flexural strength of 3D printed concrete beams: Exploring barbed-wire reinforcement and cross-sectional geometry. In Proceedings of the Fourth RILEM International Conference on Concrete and Digital Fabrication, Munich, Germany, 4–6 September 2024; Springer Nature Switzerland: Cham, Switzerland, 2024; pp. 342–350. [Google Scholar]
  24. Hojati, M.; Memari, A.M.; Zahabi, M.; Wu, Z.; Li, Z.; Park, K.; Nazarian, S.; Duarte, J.P. Barbed-wire reinforcement for 3D concrete printing. Autom. Constr. 2022, 141, 104438. [Google Scholar] [CrossRef]
  25. Hojati, M.; Li, Z.; Memari, A.M.; Park, K.; Zahabi, M.; Nazarian, S.; Duarte, J.P.; Radlińska, A. 3D-printable quaternary cementitious materials towards sustainable development: Mixture design and mechanical properties. Results Eng. 2022, 13, 100341. [Google Scholar] [CrossRef]
  26. Ma, G.; Wang, L. A critical review of preparation design and workability measurement of concrete material for largescale 3D printing. Front. Struct. Civ. Eng. 2018, 12, 382–400. [Google Scholar] [CrossRef]
  27. 3D-Printed Habitat Challenge—NASA. Available online: https://www.nasa.gov/prizes-challenges-and-crowdsourcing/centennial-challenges/3d-printed-habitat-challenge/ (accessed on 31 August 2024).
  28. GCT© Gulf Concrete Technology. Available online: https://structuralpanelsgct.com/ (accessed on 31 August 2024).
  29. Ashrafi, N.; Nazarian, S.; Meisel, N.A.; Duarte, J.P. Experimental calibration and compensation for the continuous effect of time, number of layers and volume of material on shape deformation in small-scale additive manufacturing of concrete. Addit. Manuf. 2021, 47, 102228. [Google Scholar] [CrossRef]
  30. ASTM C109; Standard Test Method for Compressive Strength of Hydraulic Cement Mortars (Using 2-in. or [50-mm] Cube Specimens). ASTM International: West Conshohocken, PA, USA, 2020.
  31. ASTM C191; Standard Test Methods for Time of Setting of Hydraulic Cement by Vicat Needle. ASTM International: West Conshohocken, PA, USA, 2021.
  32. ASTM C1437; Standard Test Method for Flow of Hydraulic Cement Mortar. ASTM International: West Conshohocken, PA, USA, 2020.
  33. Duo mix—M-Tec. Available online: https://m-tec.com/construction-site-equipment/machines/mixing-pumps/duo-mix/ (accessed on 31 August 2024).
  34. Watson, N.D.; Meisel, N.A.; Bilén, S.G.; Duarte, J.; Nazarian, S. Large-scale additive manufacturing of concrete using a 6-axis robotic arm for autonomous habitat construction. In Proceedings of the 2019 Annual International Solid Freeform Fabrication Symposium—An Additive Manufacturing Conference, Austin, TX, USA, 12–14 August 2019. [Google Scholar]
  35. Menna, C.; Mata-Falcón, J.; Bos, F.P.; Vantyghem, G.; Ferrara, L.; Asprone, D.; Salet, T.; Kaufmann, W. Opportunities and challenges for structural engineering of digitally fabricated concrete. Cem. Concr. Res. 2020, 133, 106079. [Google Scholar] [CrossRef]
  36. Ngo, T.D.; Kashani, A.; Imbalzano, G.; Nguyen, K.T.Q.; Hui, D. Additive manufacturing (3D printing): A review of materials, methods, applications and challenges. Compos. Part B Eng. 2018, 143, 172–196. [Google Scholar] [CrossRef]
  37. Wolfs, R.J.M.; Bos, F.P.; Salet, T.A.M. Hardened properties of 3D printed concrete: The influence of process parameters on interlayer adhesion. Cem. Concr. Res. 2019, 119, 132–140. [Google Scholar] [CrossRef]
  38. ASTM C469; Standard Test Method for Static Modulus of Elasticity and Poisson’s Ratio of Concrete in Compression. ASTM International: West Conshohocken, PA, USA, 2022.
  39. ACI Committee 318. ACI 318-08 Building Code Requirements for Structural Concrete and Commentary; American Concrete Institute (ACI): Farmington Hills, MI, USA, 2008; ISBN 978-0-87031-264-9. [Google Scholar]
  40. Ko, M.; Memari, A.; Duarte, J.; Nazarian, S.; Asghrafi, N.; Craveiro, F.; Bilén, S. Preliminary structural testing of a 3D printed small concrete beam and finite element modeling of a dome structure. In Proceedings of the 42nd IAHS World Congress, Naples, Italy, 10–13 April 2018. [Google Scholar]
  41. Siess, C.; Abbasi, A. Tests of Reinforced Concrete Beams with Cadweld Reinforcing Bar Splices; Erico Products, Inc.: Cleveland, OH, USA, 1967. [Google Scholar]
  42. Carreira, D.; Chu, K.-H. Stress-strain relationship for plain concrete in compression. J. Am. Concr. Inst. 1985, 82, 797–804. [Google Scholar]
  43. CMT Lab. Available online: https://www.cmtlabsinc.com/ (accessed on 31 August 2024).
  44. Gaur, H.; Khidhir, B.; Manchiryal, R.K. Solution of structural mechanic’s problems by machine learning. Int. J. Hydromechatron. 2022, 5, 22–43. [Google Scholar] [CrossRef]
  45. Liu, B.; Lu, W. Surrogate models in machine learning for computational stochastic multi-scale modelling in composite materials design. IJHM 2022, 5, 336. [Google Scholar] [CrossRef]
  46. Luo, C. KELL: A kernel-embedded local learning for data-intensive modeling. Artif. Intell. Appl. 2024, 2, 38–44. [Google Scholar] [CrossRef]
  47. Zhang, X.; Chu, D.; Zhao, X.; Gao, C.; Lu, L.; He, Y.; Bai, W. Machine learning-driven 3D printing: A review. Appl. Mater. Today 2024, 39, 102306. [Google Scholar] [CrossRef]
Figure 1. Schematic of 3D printing concrete system: (1) Computer for printing path (or tool path) design; (2) Robot controller; (3) Six-axis robotic arm; (4) Storage container for raw materials; (5) Dry mixer; (6) Wet mixer and pump; (7) Pumping hose; (8) Printing nozzle; and (9) Printed specimen. Figure adopted with permission from Elsevier for a paper published by Hojati et al. [24].
Buildings 14 03175 g001
Figure 2. Specimen sampling of a printed object for varying printing path configuration.
Buildings 14 03175 g002
Figure 3. Schematic representation of the compression load test on the sample with printing path configuration. (a) Compressive loading test of a sample with beads aligned parallel to the loading direction marked with “V”; (b) compressive loading test on a sample with beads aligned perpendicular to the loading direction, marked with “H”.
Buildings 14 03175 g003
Figure 4. The material testing machine used to determine the ultimate strength of the samples: Boart Longyear loading frame Model CM-625 with a CSI. Model CS-100-2A Retrofit with a Capacity of 400 kips.
Buildings 14 03175 g004
Figure 5. The printed beam with GCT concrete tested under three-point bending.
Buildings 14 03175 g005
Figure 6. Cross-sectional reinforcement schemes for the printed beams. (a) Printed beam with GCT concrete and testing machine for bending test; (b) Beam with three #3 size rebars in a layer and 15 mm (left) and 30 mm (right) clear cover thickness at the bottom of the beam; (c) Beam with two #4 size rebars in a layer and 15 mm (left) and 30 mm (right) clear cover thickness at the bottom of the beam.
Buildings 14 03175 g006aBuildings 14 03175 g006b
Figure 7. Rebar configurations selected for the printed beams: steel rebar (left) and FRP rebar (right).
Buildings 14 03175 g007
Figure 8. A universal testing machine is used to apply an axial compression load onto the samples: compressive loading test with strain gauges within the elastic deformation range (left) and ultimate compressive strength test until failure (right).
Buildings 14 03175 g008
Figure 9. Axial strain-time history curves for the testing trial cases: V12 (top left) and V23 (top right), H12 (middle left) and H23 (middle right), C1 (bottom). (a) V12 (PSU, beads are parallel to the axial load); (b) V23 (GCT, beads are parallel to the axial load); (c) H12 (PSU, beads are perpendicular to the axial load); (d) H23 (GCT, beads are perpendicular to the axial load); (e) C1 (PSU, no beads (cast)).
Buildings 14 03175 g009aBuildings 14 03175 g009b
Figure 10. Regressed stress-strain curves of the two repeated tests plotted up to the elastic range (40% of ultimate strength).
Buildings 14 03175 g010
Figure 11. The stress-strain curves of the material tests with varying printing path configurations.
Buildings 14 03175 g011
Figure 12. Comparison of the material test results between varying printing path configurations for PSU and GCT concretes.
Buildings 14 03175 g012
Figure 13. Failure modes of V-samples (left) and H-samples (right) after the compressive tests.
Buildings 14 03175 g013
Figure 14. The derivation process of the material’s mechanical properties based on compressive and bending tests.
Buildings 14 03175 g014
Table 1. Oxide compositions of individual constituents used in the PSU mixture by mass percentages.
Solid CompoundSiO2Al2O3CaOFe2O3MgOSO3Na2OeqLOI
PC19.254.6562.303.524.082.710.512.5
MK58.1823.333.890.680.840.089.781.9
BFS30.8011.4547.502.263.653.030.272.6
SS46.230.050.050.08-0.0349.633.8
SF93.960.240.690.260.480.070.513.2
NC55.2012.201.984.058.56-0.9815.7
PC19.254.6562.303.524.082.710.512.5
MK58.1823.333.890.680.840.089.781.9
BFS30.8011.4547.502.263.653.030.272.6
SS46.230.050.050.08-0.0349.633.8
SF93.960.240.690.260.480.070.513.2
Table 2. Strengths, times of setting, and flow test results, with the values in brackets as the standard deviations obtained from three specimens.
PropertyQuantity
PSUGCT
28-day compressive strength (MPa)44.7 [1.46]24.55 [1.46]
Initial setting time (min)90.080.7
Final setting time (min)120.0143.0
Flow (%)91.9128.7
Table 3. Printing parameters for different experiments in this work.
MixturePumping Rate (Lit/Min)Water Flow Rate (kg/h) *Nozzle Speed (mm/s) **Experiments
Effect of Concrete MixtureEffect of Nozzle SpeedEffect of Cross-Section
PSU3.16850210
GCT3.16800170
225
* A higher water flow rate was used for the PSU mixture as it had a higher water mass ratio of water to dry mixture. ** Note that different nozzle speeds for different concrete mixtures were used for the experiment “effect of concrete mixture” to achieve desired printing quality by balancing material extrusion speed (controlled by water flow rate) and nozzle speed.
Table 4. Analytical solution for the beam with the selected reinforcement configuration.
Rebar SizeClear CoverNumber of Rebar per LayerNumber of LayerRebar MaterialEffective Depth
(in, mm)
Rebar Area,
(in2, mm2)
Rebar Area
Ratio (%)
Max. Tensile Stress at the Rebar
(ksi, MPa)
Max.
Tensile Strain of Rebar (in/in)
Nominal Moment
Capacity *
(k-ft, kN-m)
Failure ModePin Load Capacity for Beam,
(kips, kN) **
#315 mm22FRP5.1
(130)
0.22
(142)
1.172.6
(500)
0.010013.9
(5.2)
Compression-controlled4.7
(20.9)
#4Steel5.1
(129)
0.4
(258)
2.058.0
(400)
0.003686.3
(8.5)
Tension-controlled7.6
(34.0)
* Nominal moment capacity adopts the strength reduction factor value of 0.65 for the compression-controlled beam, 0.9 for the tension-controlled beam with the max tensile strain in the rebar greater than 0.005 and interpolated between 0.65 and 0.9 based on the rebar’s strain for the beam with the max tensile strain in the rebar between 0.002 and 0.005 (ACI 318-14, Section 21.2) [39]. ** The simple pin support beam has a 1 m length.
Table 5. Measured ultimate compressive strengths and calculated elastic ranges in compression for individual specimen cases.
CaseUltimate Compressive Strength40% of Ultimate Compressive Strength
Axial LoadAxial StressAxial LoadAxial Stress
(lbs)(kN)(psi) (MPa)(lbs)(kN)(psi)(MPa)
V11 1-PSU 4130,350 579.835614 38.7152,140231.93224615.48
V21-GCT 579,485 221.453586 24.7228,294125.8614349.89
H11 2-PSU89,130 383.133807 26.2535,652158.59152310.50
H22-GCT66,130 294.162872 19.8026,452117.6611497.92
C2 3-PSU108,200 481.308283 57.1143,280192.52331322.84
1 V means that the bead pattern in the specimen is aligned parallel to the loading direction; 2 H means that the bead pattern in the specimen is aligned perpendicular to the loading direction; 3 C means that there is no bead pattern in the specimen because it is cast; 4 PSU means that Pennsylvania State designed the material; 5 GCT means Golf Concrete Technology designed the material.
Table 6. The second moduli of elasticity based on the measures of compressive strengths.
CaseSecant Modulus of Elasticity at 40% of the Ultimate StrengthMeasured Ultimate Compressive Strength
(ksi)(MPa)(psi)(MPa)
V12 1-PSU 4213914,748561438.71
2223 15,327
V23-GCT 51317 9080358624.72
1445 9963
H12 2-PSU2893 19,947380726.25
3190 21,994
H23-GCT2438 16,809287219.80
2037 14,045
C1 3-PSU2151 14,831828357.11
2164 14,920
C0-GCT 6365025,166400027.58
1 V means that the bead pattern in the specimen is aligned parallel to the loading direction; 2 H means that the bead pattern in the specimen is aligned perpendicular to the loading direction; 3 C means that there is no bead pattern in the specimen because it is cast; 4 PSU means that Pennsylvania State designs the material; 5 GCT means Golf Concrete Technology designs the material; 6 GCT’s ultimate compressive strength is referred the GCT company’s specification, and modulus of elasticity is calculated by using the Equation in ACI 318-14 Section 19.2.2 [39].
Table 7. Comparison of the load capacities from the analytical solution to the test results.
Reinforcement CasesMaximum Load CapacityError, %
Testing Result
(lbf, kN)
Nominal Strength
(lbf, kN)
Steel Rebar 1 *5980 (26.6)5366 (23.9)11.4
Steel Rebar 25665 (25.2)5.6
Steel Rebar 34024 (17.9)−25.0
FRP Rebar **2338 (10.4)4699 (20.9)−50.2
* The number after “Steel Rebar” (1, 2, or 3) shows the test number of the three test repetitions of a pin-loading test of the beam having the rebar scheme of Figure 7 (left). ** F.R.P. Rebar means the pin-loading test of the beam having the rebar scheme of Figure 7 (right).
Table 8. Comparison of the moduli of elasticity from multiple derivations.
Cases *Modulus of Elasticity, (ksi, (MPa))
By Compressive Strength 1By Compressive Strength 2By Modulus of
Rupture
By Stress-Strain
Relationship
V-PSU4271 (29,446)3109 (21,437)1610 (11,100)2139 (15,038)
H-PSU3517 (24,249)2560 (17,653)-1381 (9522)
C-PSU5188 (35,767)3777 (26,038)-3042 (20,971)
V-GCT3413 (23,534)2066 (14,243)4130 (28,475)2238 (15,427)
H-GCT3055 (21,061)1849 (12,746)-2158 (14,876)
C-GCT3605 (24,856)2917 (20,112)--
1 The modulus of elasticity is calculated by using Equation (10); 2 The modulus of elasticity is calculated by using Equation (11), * PSU concrete weight is 116.5 lbs/ft3, and GCT concrete weight is 103.1 lbs/ft3.
Disclaimer/Publisher’s Note: The statements, opinions and data contained in all publications are solely those of the individual author(s) and contributor(s) and not of MDPI and/or the editor(s). MDPI and/or the editor(s) disclaim responsibility for any injury to people or property resulting from any ideas, methods, instructions or products referred to in the content.

