Abstract
Based on the deep foundation pit project of the TOD (Transit-Oriented Development) complex of the Shaoxing North High-speed Railway Station, the influence of different construction stages on the deformation and inclination rate of the adjacent elevated bridge and its variation law are studied through field measurement and numerical simulation. The construction process is optimized by the method of reinforcement outside the pit and adjustment of preloaded axial force, and the influence of distance on elevated bridges is summarized. The results show that with the excavation of the foundation pit, the deformation of the bridge pier and bridge pile foundation gradually increases, and the deformation of the bridge piers is larger than that of the bridge pile foundations. As the depth of soil reinforcement outside the pit and the preloaded axial force increases, the maximum vertical displacement of the bridge pier and bridge pile foundations gradually decreases. The deeper the depth of soil reinforcement, the better the displacement control effect on the elevated bridge. In actual construction, it is recommended that the depth of reinforcement be taken as the excavation depth of the pit. It is obvious that the preloaded axial force is subject to the pit angle effect, and the appropriate value of the preloaded axial force should be selected according to the site conditions. The deformation of the bridge pier and bridge pile foundation generally shows a decreasing trend with the increase in the distance between the elevated bridge and the foundation pit. When the elevated bridge is close to the foundation pit, it will be affected by the pit angle effect, and the fluctuation will decrease. The conclusions drawn in the article can serve as the basis and reference for design and construction, and provide reference for similar projects.
1. Introduction
With the rapid pace of urbanization, there has been a notable shift towards developing underground spaces as a strategic response to alleviating surface land constraints in urban areas. Excavation of foundation pits inevitably introduces additional stresses and deformations to surrounding structures, such as pile foundations and bridge piers, potentially compromising their integrity [1,2,3,4]. In severe cases, this can even lead to significant safety incidents. Therefore, effectively managing the impact of adjacent foundation pit excavations on existing structures has become an increasingly serious problem that needs urgent attention [5,6].
Regarding the impact of deep foundation pit excavation on adjacent structures, numerous scholars worldwide have conducted extensive research across theoretical studies, field measurements, and numerical simulations. (Delo, G., et al., 2022) [7] use interferometric satellite data for urban health monitoring to demonstrate the impact of excavation on urban areas. (Lei, M., et al., 2018) [8] predicted deformation in buildings adjacent to subway station foundation pits with a combination of theoretical and monitoring approaches. Based on the second-order partial differential equations of elasticity theory, (Li, D, and Yan, C, 2018) [9] proposed a novel computational method for predicting ground surface settlement around excavation sites. (Zhou, Z, et al., 2021) [10] elucidated the mechanism of ground surface settlement due to double-tunnel excavation, and then modified existing equations based on field measurement data. (Song, D., et al., 2020) [11] utilized long-term on-site monitoring methods to analyze the deformation characteristics of retaining structures and surrounding buildings throughout the whole excavation process of foundation pits. (Zhang, D. 2023) [12] focused on a deep foundation pit project in Xi’an to investigate the deformation of an underground diaphragm wall and the settlement deformation of adjacent ancient buildings, with and without MJS pile reinforcement, through on-site monitoring and numerical simulation. The effect of MJS pile reinforcement was verified. (Xue, H. 2023) [13] analyzed the deformation mechanisms of old masonry structures during the whole excavation process of nearby foundation pits through numerical simulation. (Xu, C. J, et al., 2021) [14] examined excessive settlement and wall deformation in foundation pit excavations in soft soil regions using numerical simulation methods. With reference to existing projects, (Wang et al., 2019) [15] simulated the impact of bilateral foundation pit excavation on the structure and operation of an existing metro station and proposed optimization methods for foundation pit excavation. Based on practical foundation pit construction, (Huang, J., et al., 2024) [16] performed numerical simulations of foundation pit construction near railway lines to reveal the deformation of railway structures affected by excavation. (Zhang, X., et al., 2020) [17] explored parameters for controlling the deformation of retaining structures in conjunction with a rotational displacement model for shield tunneling, and analyzed the effect of foundation pit excavation on longitudinal deformation of adjacent shield tunnels. (Wang et al., 2024) [18] combined practical engineering scenarios with numerical simulations to analyze the effects of the excavation sequence of interconnected twin foundation pits and tunnels on their deformations. (Gui, Y., et al., 2020) [19] analyzed the impact of soft soil foundation pit excavations on the deformation of adjacent metro tunnels based on long-term monitoring data and numerical simulations. (Niu, Y., et al., 2023) [20] analyzed tunnel deformation characteristics under various geological conditions by considering the coupled deformation effects of retaining piles and excavated soil, and then developed a predictive formula for tunnel deformation. (Liu, J., et al., 2020) [21] proposed a new evaluation method for the impact of adjacent foundation pit excavations on pile foundations by taking into account the shear effect of piles, the disturbance to soil caused by foundation pit excavation, and the inherent properties of soil layers. (Zhong, W., et al., 2023) [22] developed a three-dimensional numerical model to analyze the effects of various excavation-related factors and different pile foundation parameters on the lateral displacements of piles adjacent to the existing pile foundation. (Jiang, Z., et al., 2024) [23] established a three-dimensional numerical model to analyze the deformation characteristics of the retaining structure, adjacent subway stations, and tunnels at different stages of deep foundation pit excavation. (Jia, Y., et al., 2024) [24] found that there are various control measures for the deformations caused by subway pit excavations, and that pre-treatment measures can effectively reduce the impact of deformation on subway tunnels under different working conditions.
Regarding the impacts of foundation pit excavation on bridge structures, numerous scholars have also conducted pertinent research. (Feng, S., et al., 2021) [25] analyzed the influence of major factors related to foundation pit excavation on bridge foundation via a combination of analytic hierarchy process (AHP) and finite element method (FEM). (Yang, Y. B., et al., 2023, Yang, Y., et al., 2021) [26,27] analyzed the causes for the settlement of bridge pile foundations induced by foundation pit excavations in karst regions based on case studies. They also utilized nonlinear finite element analysis to examine the deformation of bridge pile structures influenced by critical parameters. (Gu, R., et al., 2022) [28] performed large-scale model tests to analyze the deformation of adjacent existing bridge structures during the construction of seabed immersed tube tunnels. (Miao, Y., et al., 2022) [29] used numerical software to simulate tunnel construction beneath an existing bridge, and analyzed the effect of construction disturbances on the deformation of the bridge structure. (Huang, J., et al., 2024) [30] analyzed the three phases of monitoring data within one year after the completion of the foundation pit, and found that the deformation of the bridge structure gradually stabilized due to the consolidation of the soil.
The aforementioned studies often oversimplify soil layers as homogeneous entities and approximate soil pressure distributions as triangular, which may not accurately reflect actual soil pressure profiles. There are limited numerical analyses focusing on deformation patterns influenced by foundation pit excavations in soft soil regions and their impact on the surrounding environment. This paper addressed these shortcomings through a case study involving the Shaoxing North High-Speed Railway Station TOD Complex. By employing on-site measurements and numerical simulations, we investigated how deep foundation pit excavations influence adjacent bridge piers. Our study emphasized the implementation of reinforcement measures aimed at mitigating these impacts on the stability of bridge piers. Ultimately, we explored the correlation between pier deformation and its relative position to the foundation pit. The findings of the current study can serve as a reference for design and construction practices.
2. Project Overview
2.1. Engineering Background
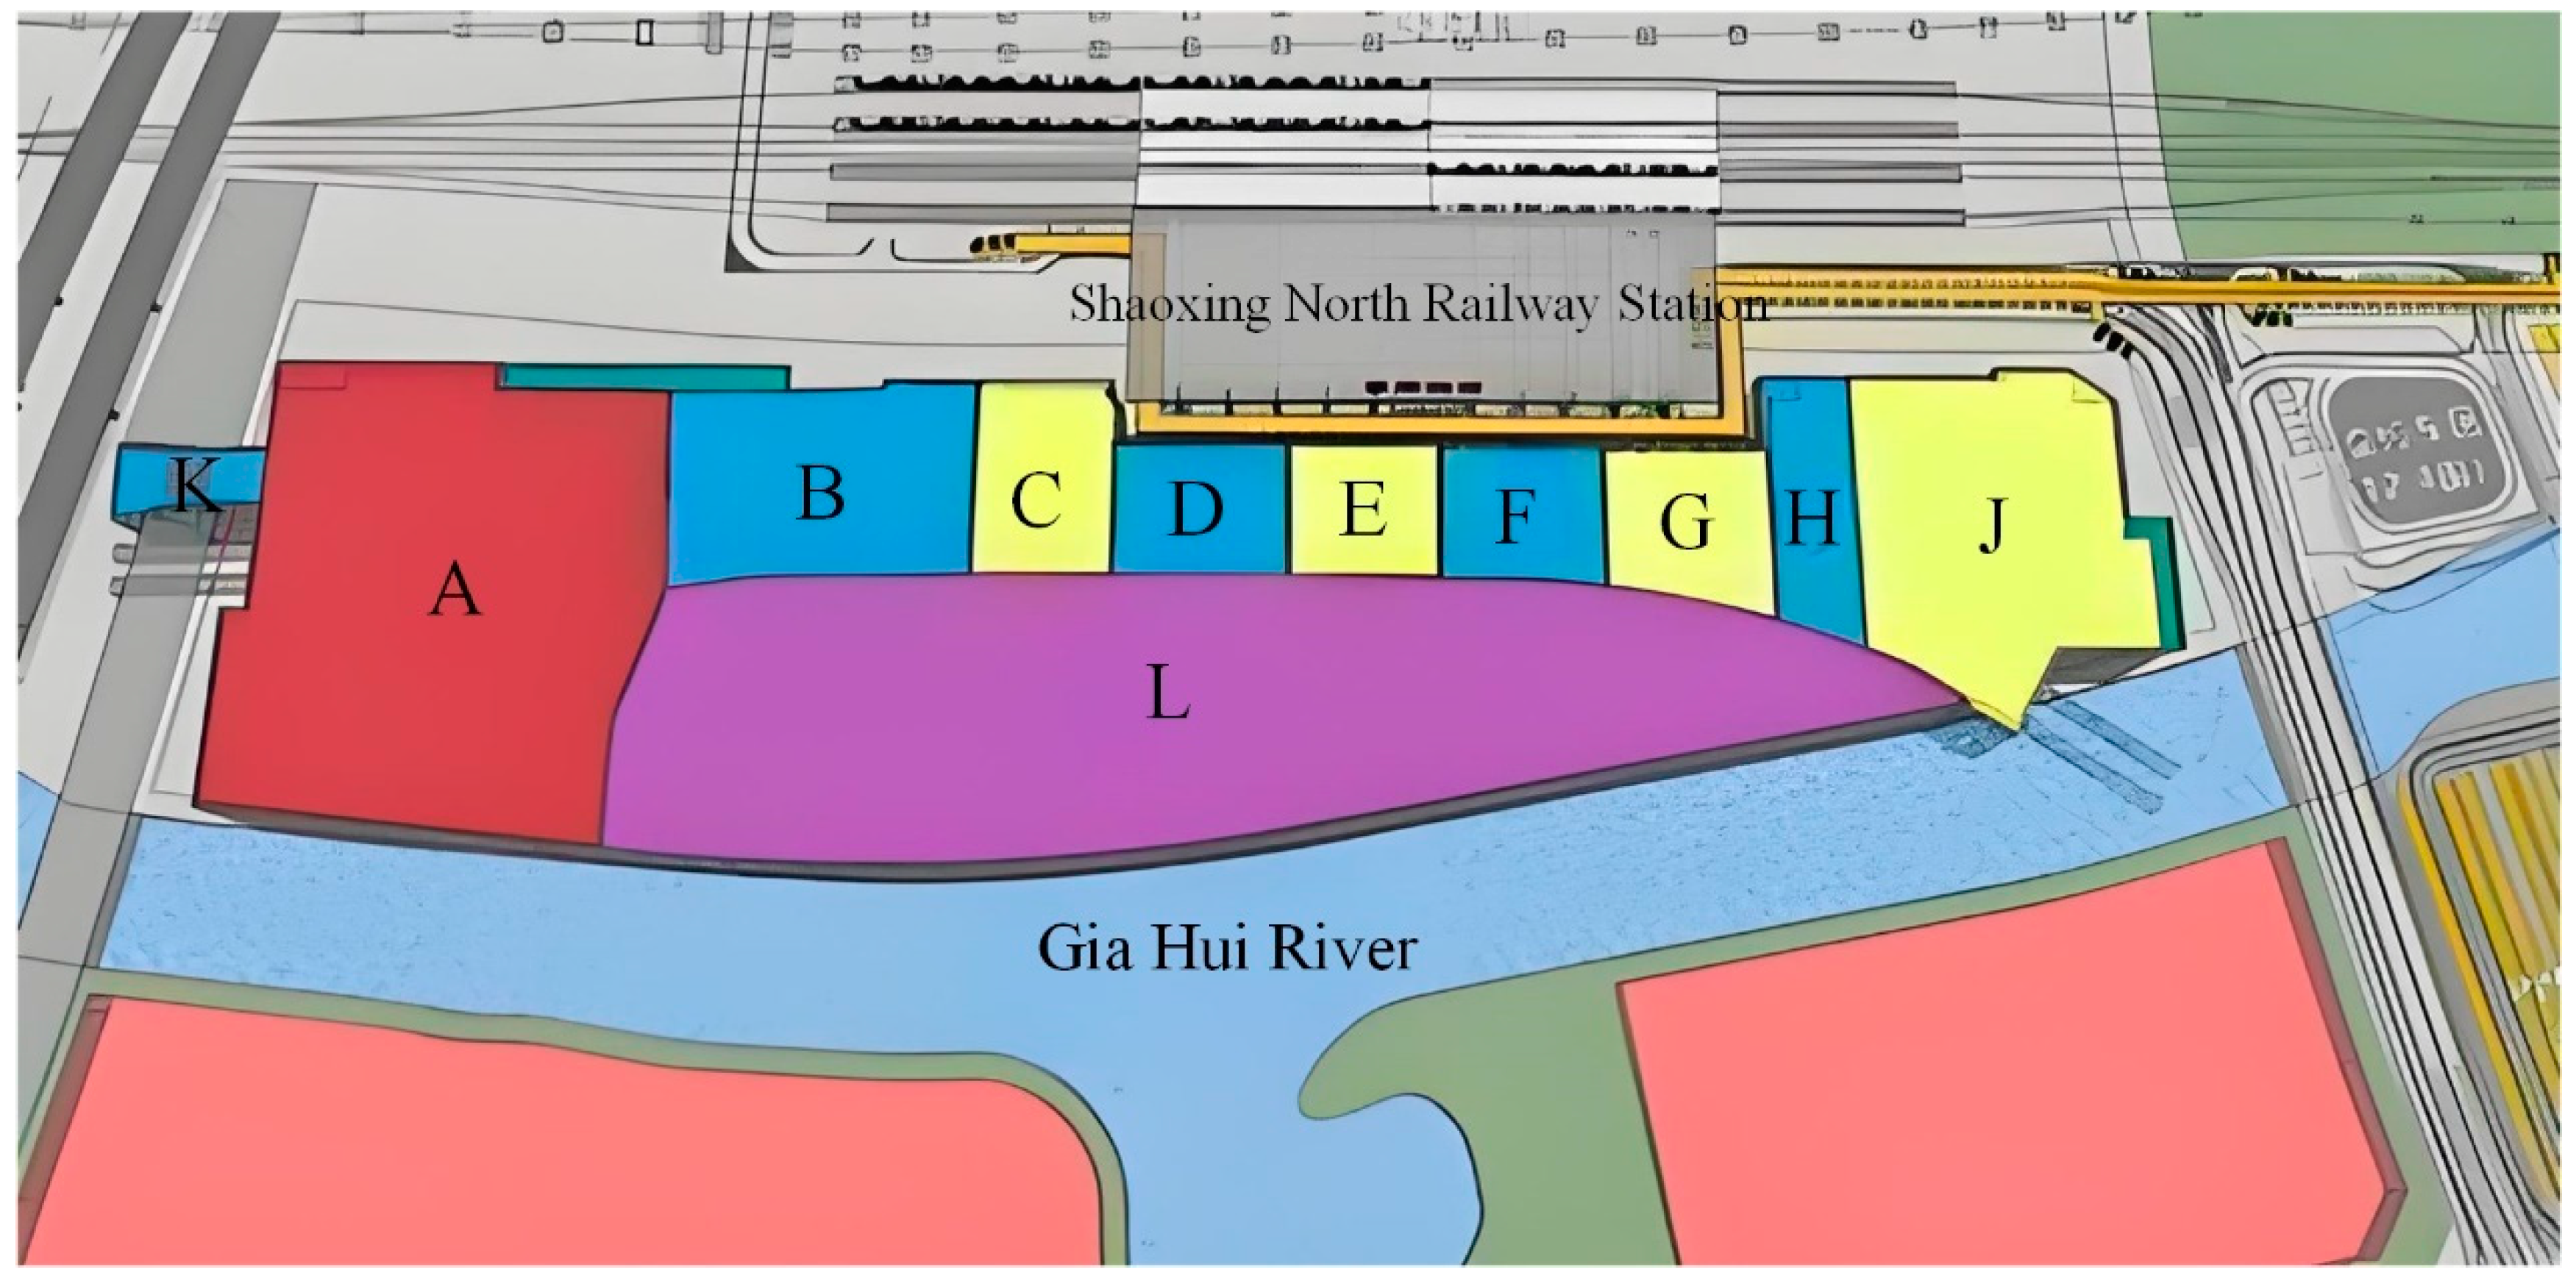
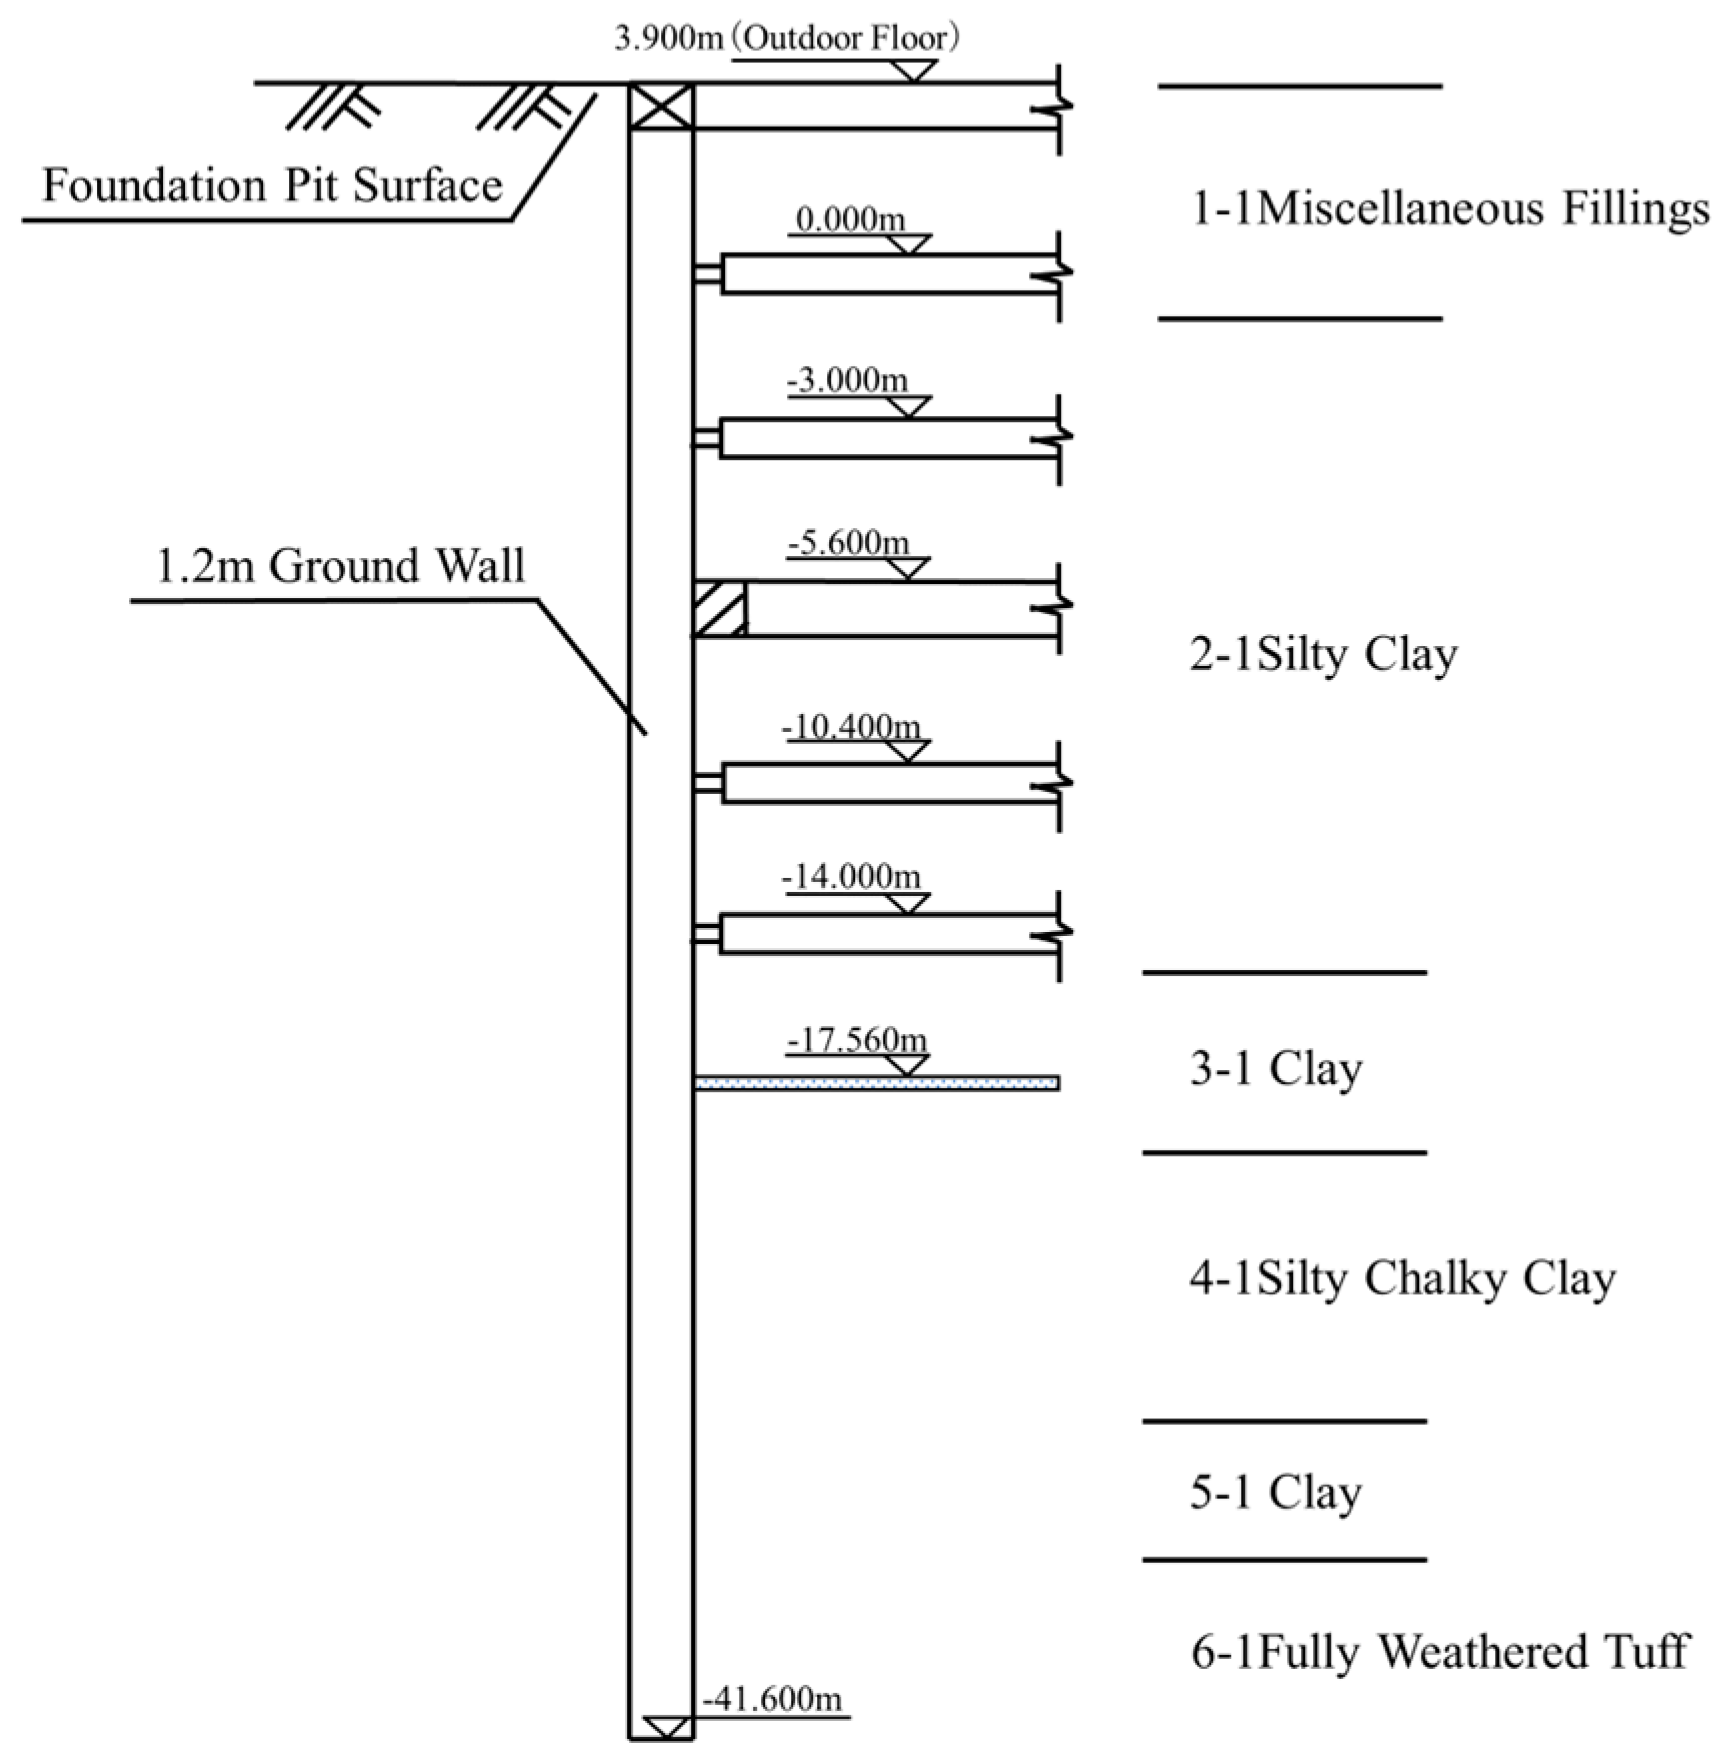
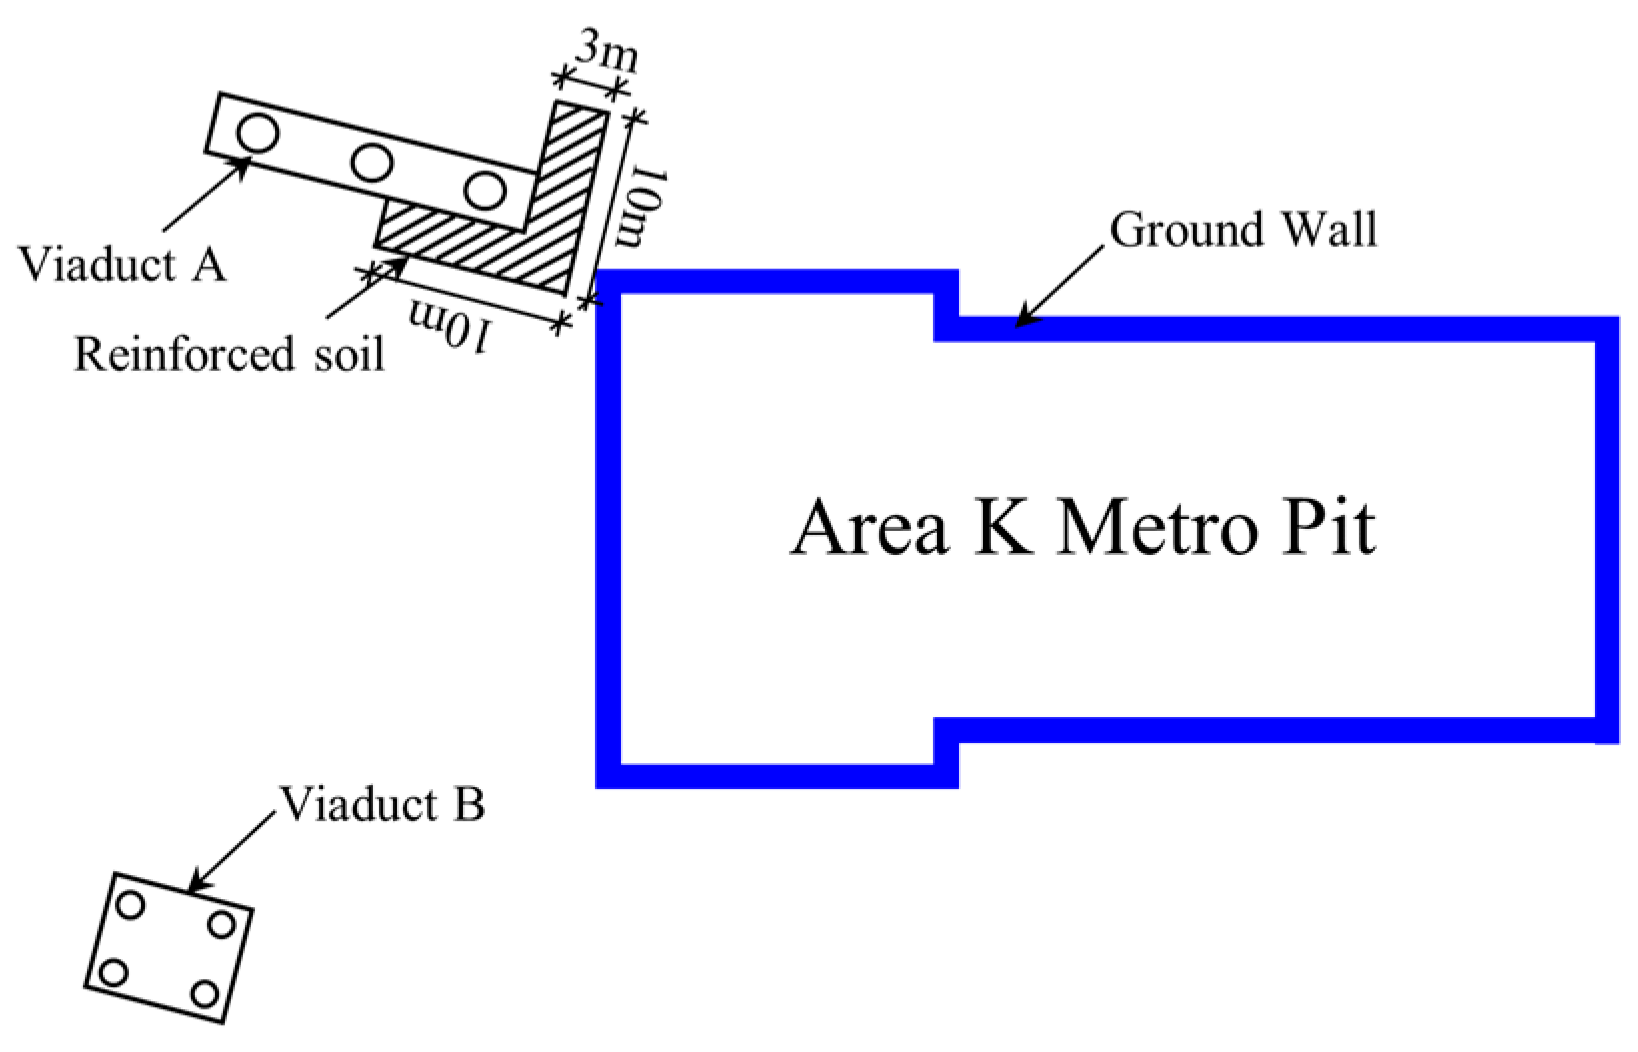
The Shaoxing High-speed Railway North Station TOD complex deep foundation pit is located in the station area of the high-speed railway Shaoxing North Station. The excavation depth is about 16 m, and the support structure adopts an underground diaphragm wall with internal support, using the open excavation method. The pit plan is shown in Figure 1. The pit is divided into eleven sub-pits according to the actual conditions of the site. Three reinforced concrete internal supports are set up, and the excavation depth of the pit in the pit part (the subway station area) is about 20.7 m. Four internal supports are set up (the deepening position of the local subway line 1 end wells is added with one support). Near the side of the North Station and the station end well, a 1.2 m-thick diaphragm wall is used, and the rest of the diaphragm wall is a 1 m and 0.8 m-thick diaphragm wall. All four internal supports are made of reinforced concrete, and the typical section of support arrangement is shown in Figure 2. The total length of the pit is 675.1 m, the width of the standard section is 44.9 m, and the total construction area is about 45,859 square meters. The pit is divided into three phases with 11 sub-pits. Phase 1 (Area A, Area C, Area E, Area G, and Area J) → Phase 2 (Area B, Area D, Area F, Area H, and Area K) → Phase 3 (Area L). There are four excavation phases for the one-phase pit and the two-phase pit, and three excavation phases for the three-phase pit. After each phase of excavation, the main structure of the building is built back to the ground elevation and then the next phase of excavation is carried out. K pit is a subway pit, adopting a 1.2 m thick C35 underground diaphragm wall. The first course is concrete support using 900 × 900 C45 reinforced concrete supports. The second and third courses are steel support using φ609 × 16 steel pipe supports. The fourth course is concrete support using 1200 × 900 C45 reinforced concrete supports, and the fifth and sixth courses are steel support using φ800 × 16 steel pipe supports. A typical cross-section of the support arrangement profile of K pit is shown in Figure 3. The Hangzhou–Shaoxing elevated bridge is located at the end well of the pit, and the nearest distance of the pit sideline from the bridge pier is only 3.8 m, which is located in the main influence area of the pit excavation (the main influence area is about 0~1 times of the depth of the excavation, the secondary influence area is about 1~3 times of the depth of the excavation, and the non-influence area is about 3 times of the depth of the excavation from the pit). The plane of the pit in the area of K and the layout of the monitoring points are shown in Figure 4.

Figure 1.
Foundation pit plan.
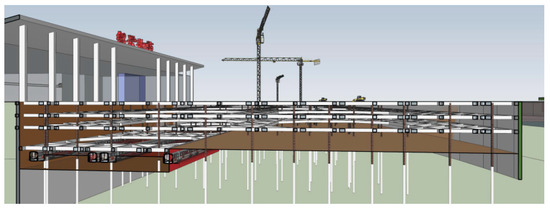
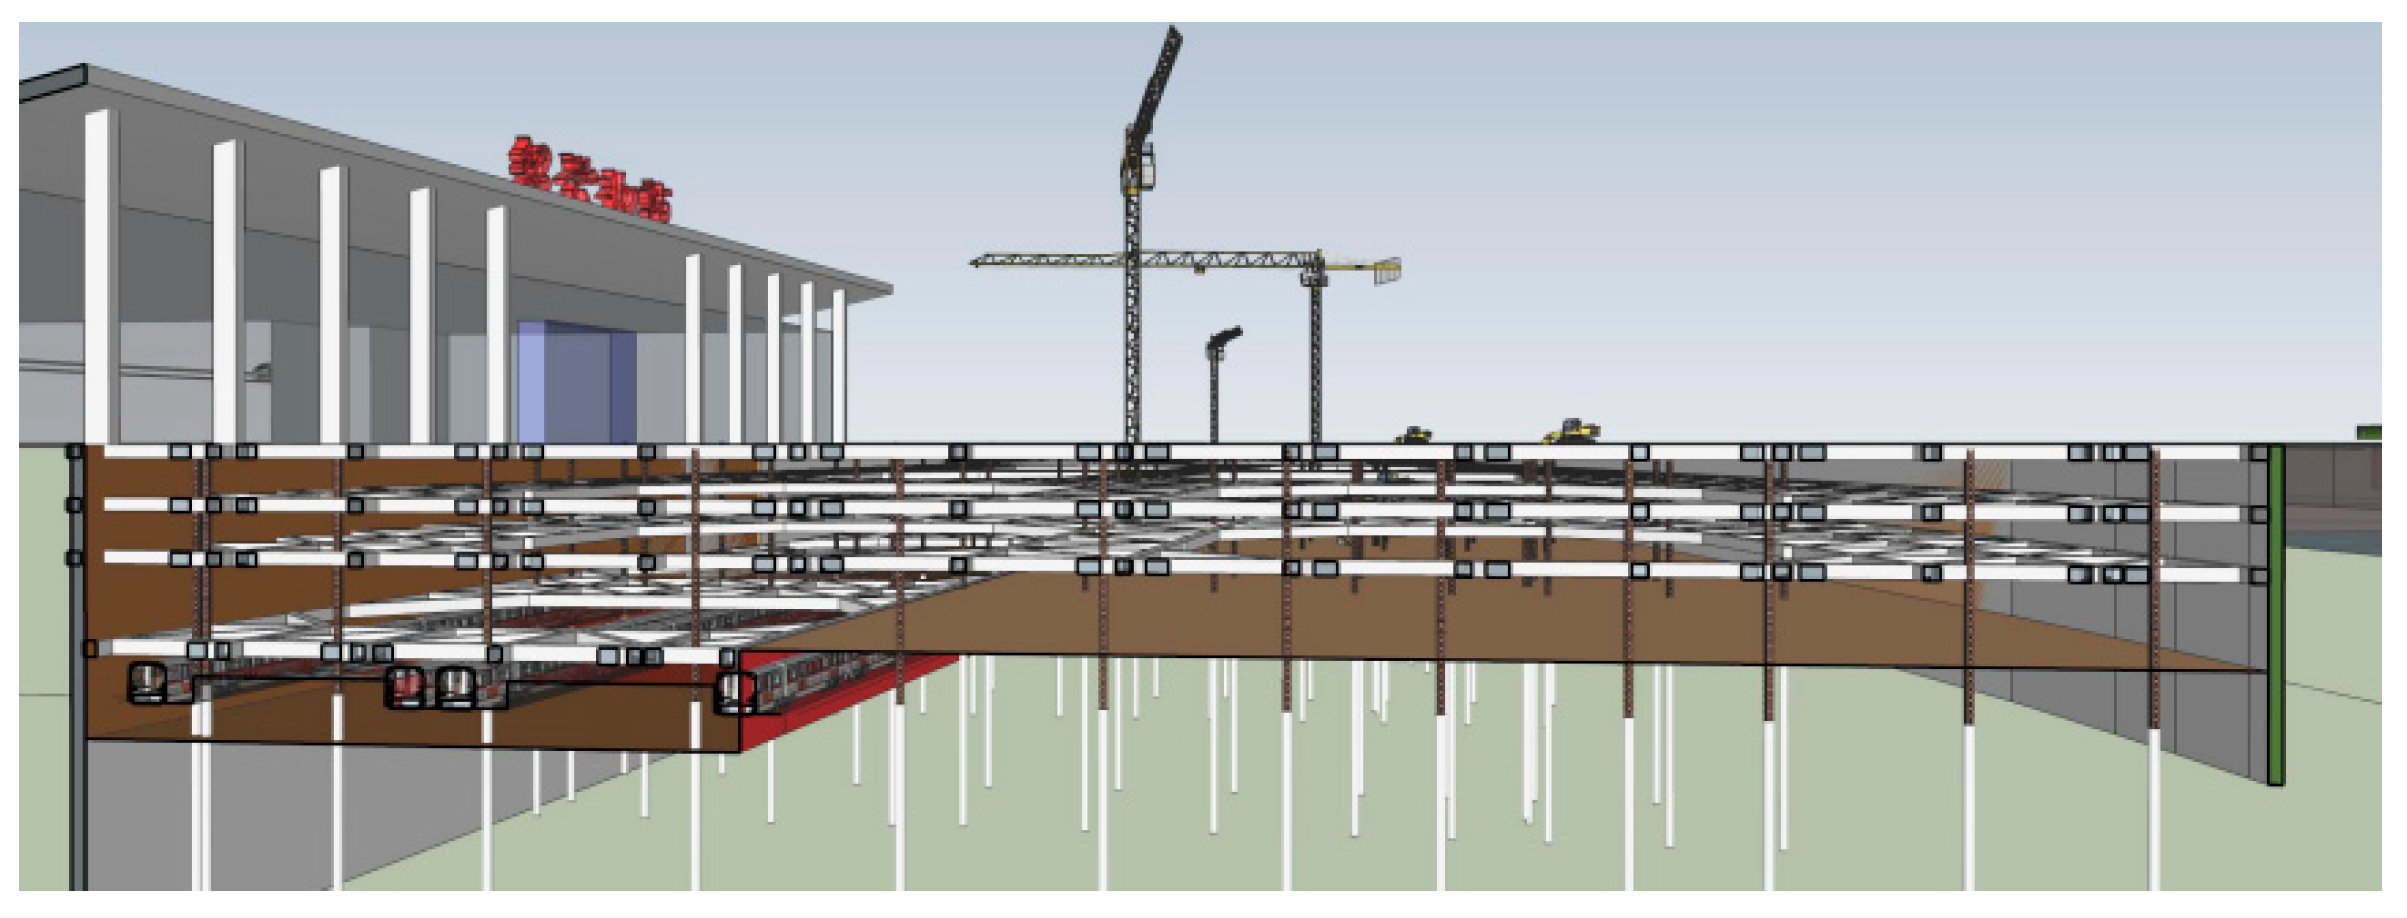
Figure 2.
Typical section support layout profile.
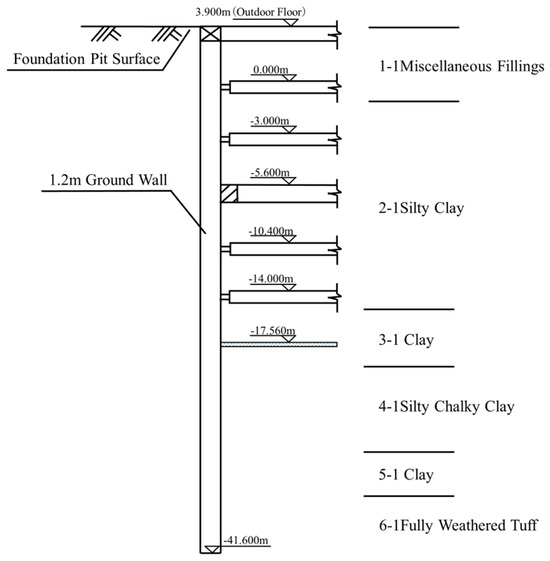
Figure 3.
Plan view and monitoring point layout of the K area foundation pit.
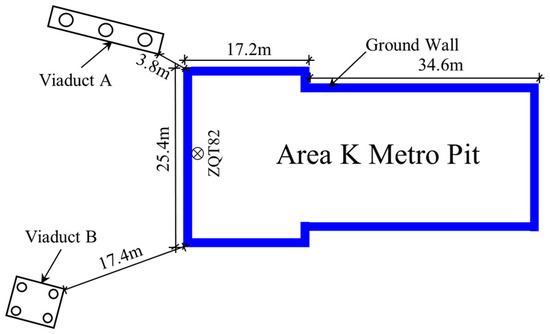
Figure 4.
Excavation sequence of foundation pit group.
2.2. Hydrogeology
In the depth range of 92.0 m, the foundation soil mainly consists of bay-to-river (land) sediments and underlying Cretaceous bedrock. According to their genesis and physical and mechanical properties, the foundation soils of the site can be divided into six engineering geological layers, namely: 1-1 Miscellaneous Fillings, 2-1 Silty Clay, 3-1 Clay, 4-1 Silty Chalky Clay, 5-1 Clay, and 6-1 Fully Weathered Tuff, as shown in Figure 3.
The pore dives are mainly recharged by atmospheric precipitation and surface water infiltration. During the survey, the groundwater level in the borehole was measured between 0.15 m and 3.20 m below the surface, and the elevation of the groundwater level ranged from 2.39 m to 6.06 m, while the elevation of the normal water level was 4.00 m. The shallow groundwater generally shows a trend of being high in the north and low in the south, which is affected by the seasonal climate, and the change of the water level is generally about 1.0~1.5 m. Evaporation and discharge to low-lying places and rivers (Gia Hui River) are the main causes, and the shallow groundwater is complementary to the surface water of Jiahui River in the south.
3. Numerical Simulation of Deep Foundation Pit
3.1. Model Establishment
The surrounding environment of the foundation pit is complex, and the finite element model and calculations were simplified as follows. (1) Soil conditions within the foundation pit were assumed to be horizontally homogeneous. (2) Box girder and vehicle loads on the elevated bridge piers were converted into uniformly distributed loads acting on the piers. (3) A linear elastic plate element model was adopted for the diaphragm walls. (4) A beam element model was employed for the concrete braces. (5) Steel braces were modeled with a point-to-point anchor rod model. (6) Lattice columns were modeled with an Embedded pile model. (7) The numerical simulation did not consider the impact of diaphragm wall construction and construction machinery on soil disturbance.
According to Saint-Venant’s principle and relevant standards, the influence range of deep foundation pit excavation is approximately three times the excavation depth of the foundation pit. The maximum excavation depth of the foundation pit was 19.6 m. Considering actual conditions, the model dimensions were set as 208 m in the x-axis direction (longitudinal), 400 m in the y-axis direction (transverse), and 80 m in the z-axis direction (vertical). The finite element model of the foundation pit is illustrated in Figure 5. There are two types of bridge piers: a strip-shaped cap measuring 15.7 m × 3.0 m and a rectangular cap measuring 6.8 m × 5.8 m. Three bridge piles, with a length of approximately 43 m and a diameter of 2.0 m, are located under the strip-shaped cap, as shown in bridge pier A in Figure 5b, while four bridge piles, with a length of 42 m and a diameter of 1.3 m, are located under the rectangular cap, as shown in bridge pier B in Figure 5b. The bridge piers were modeled using solid elements, while the bridge piles were simulated using the built-in pile model.
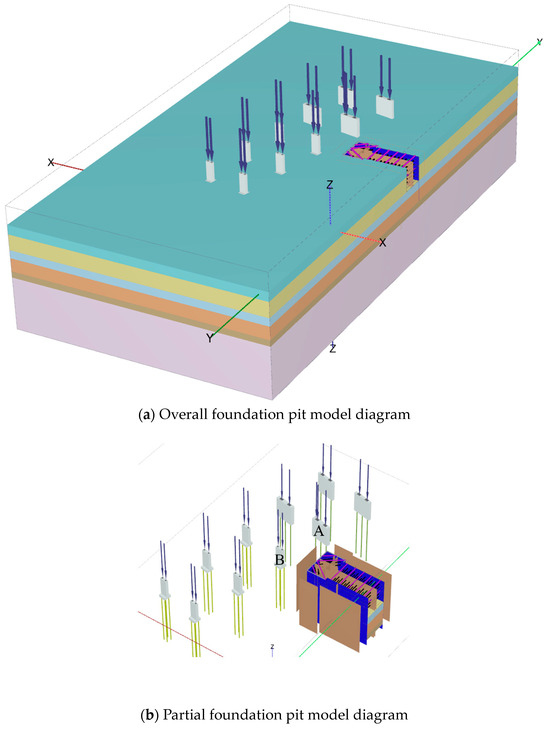
Figure 5.
Finite element model of the foundation pit. (a) Overall foundation pit model diagram. (b) Partial foundation pit model diagram.
3.2. Selection of Model Parameters
Existing practices and research suggest that soil strain during excavation generally remains in a small strain state. The HSS model, which accounts for an increase in soil shear modulus with strain, is effective in capturing the hydrostatic pressure and the expansiveness of soft clay. This model allows for distinguishing soil unloading stiffness under loading and heavy loading conditions. Therefore, the HSS model was adopted in this study. The parameters of structures and soils are listed in Table 1 and Table 2, respectively.

Table 1.
Main structural parameters.
Table 2.
Soil constitutive model parameters.
3.3. Validation of Computational Model Suitability
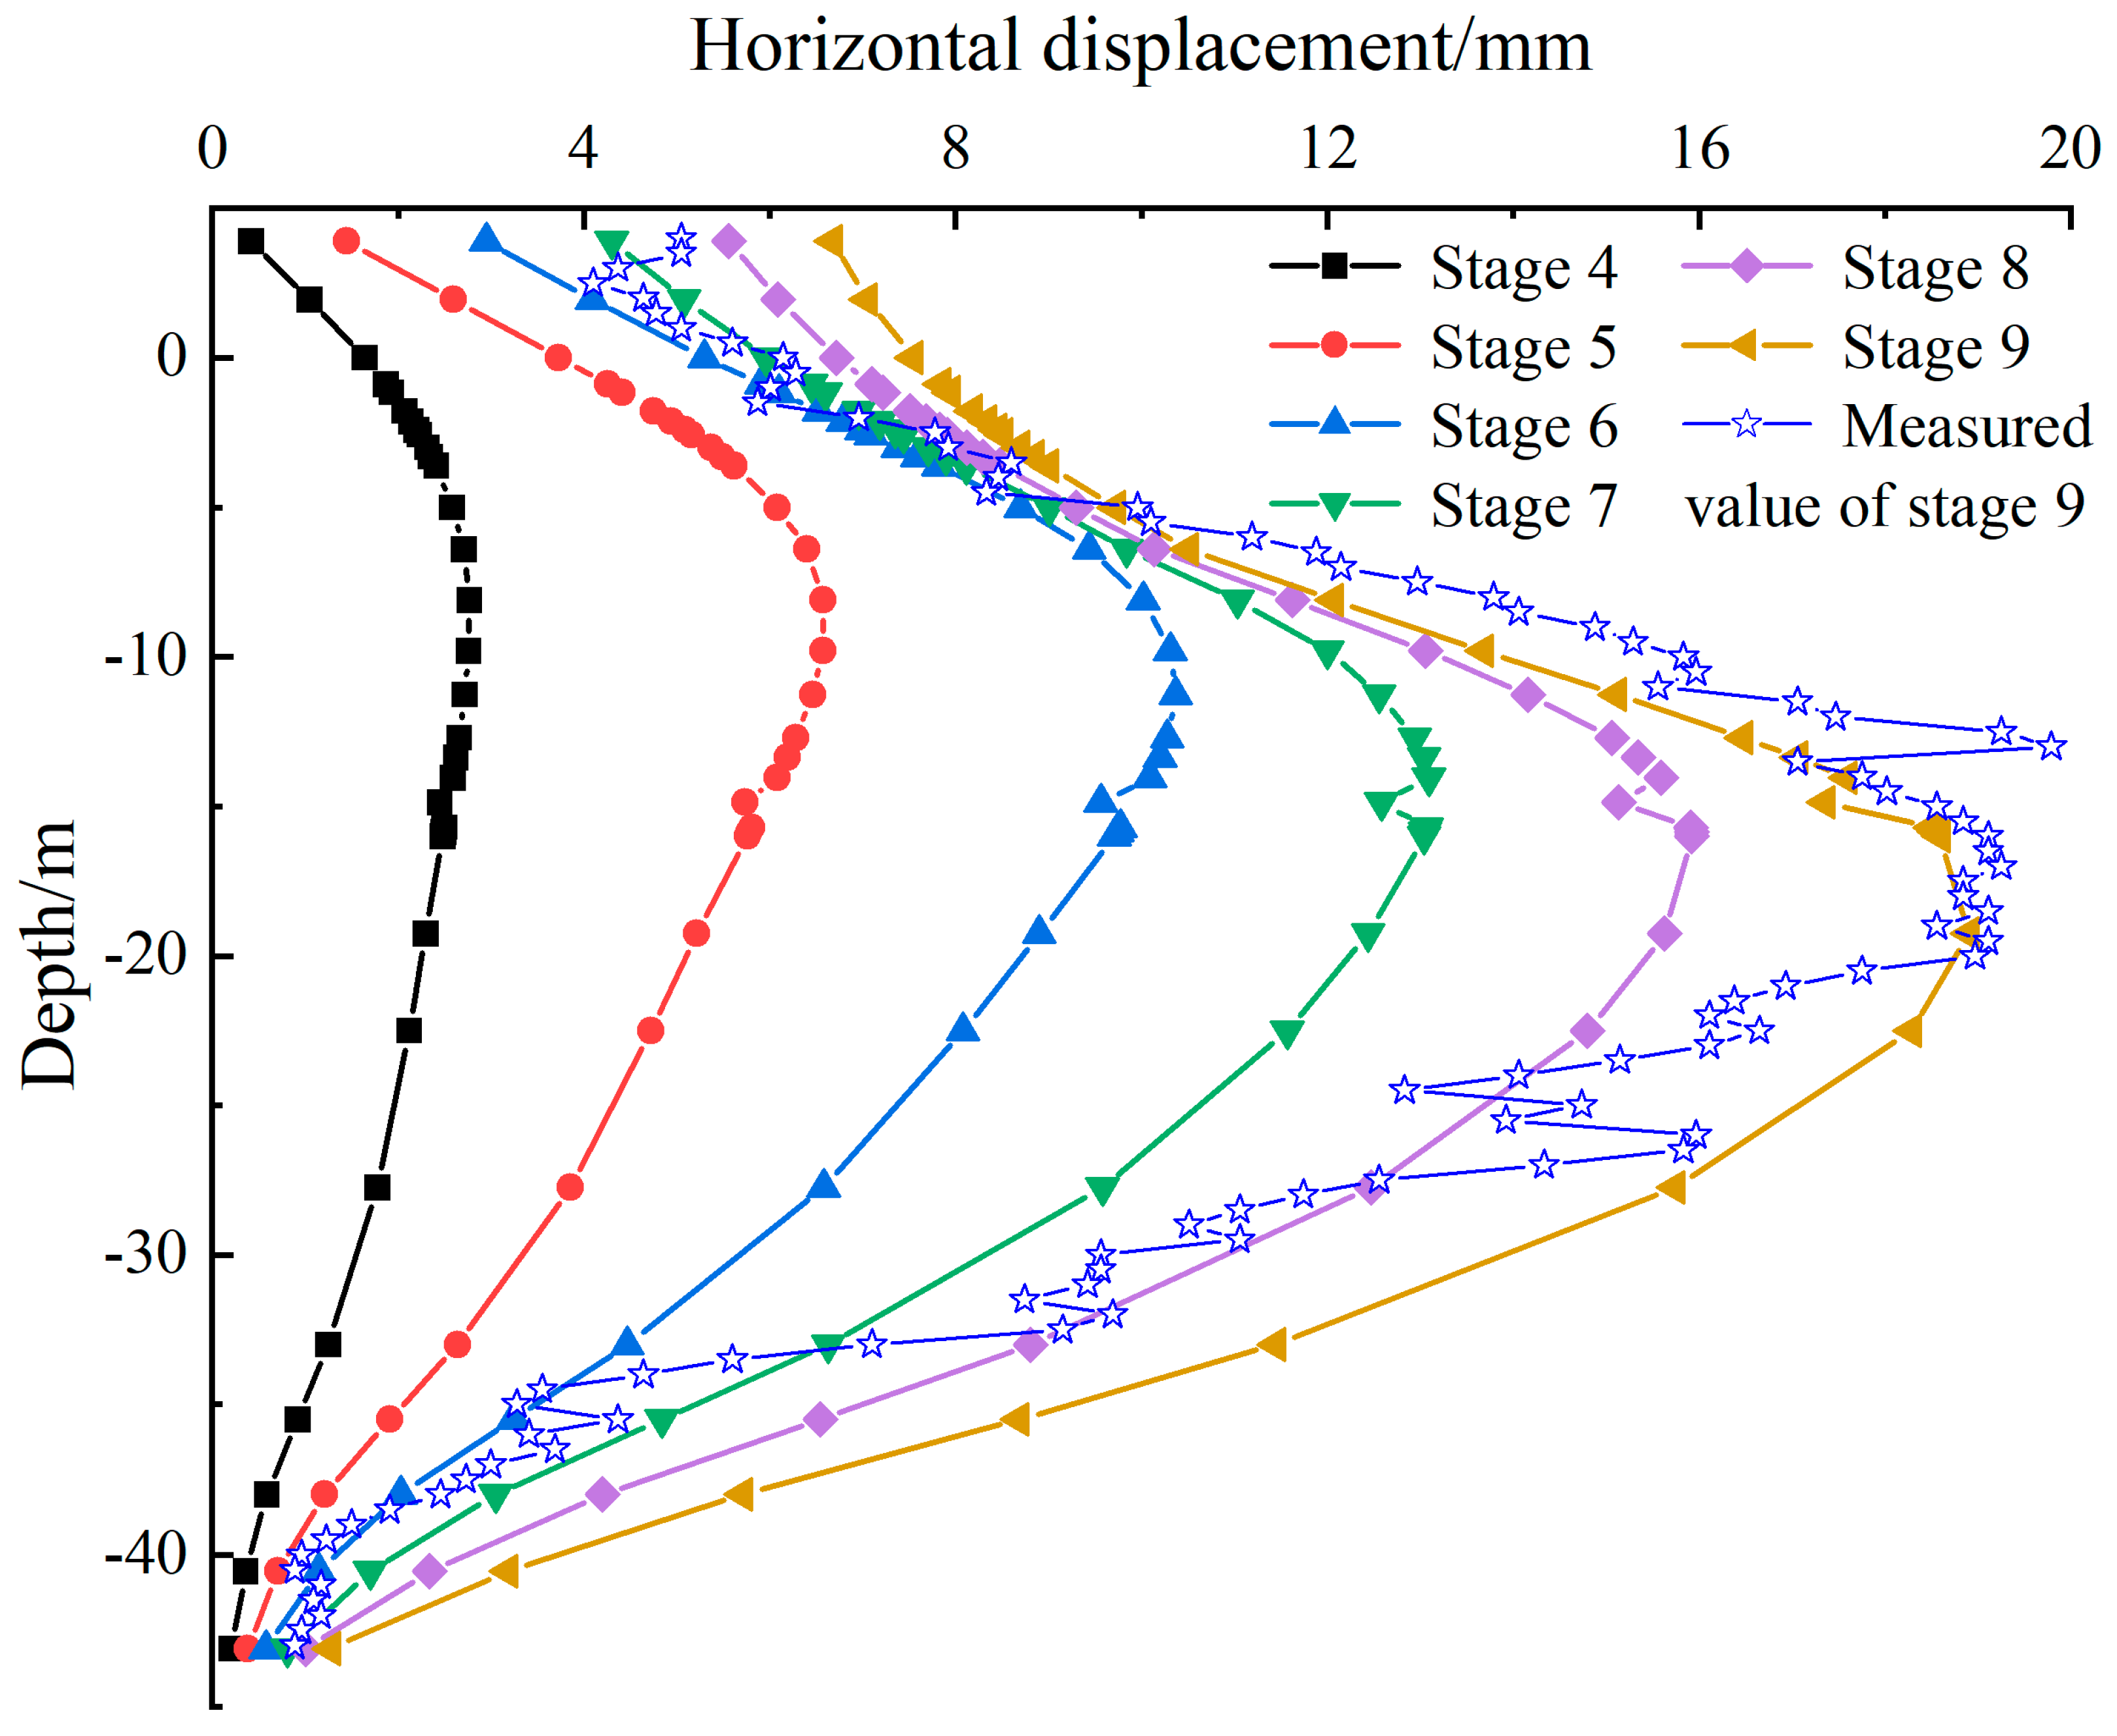
A three-dimensional finite element model was developed based on Area K of the Shaoxing North Station’s metro excavation site to analyze the impact of the excavation on adjacent elevated bridge piers. The model that reflects the actual project was divided into nine construction phases. The actual excavation scenarios were simulated by activating and deactivating elements in the finite element model, with detailed excavation scenarios outlined in Table 3. A comparative analysis was conducted between the measured and simulated horizontal displacements of the diaphragm wall at monitoring point ZQT82 in Area K, as depicted in Figure 6. It demonstrated that simulated and measured horizontal displacements of the diaphragm wall matched well, demonstrating a similar trend and confirming the accuracy of the computational model.
Table 3.
Finite element analysis conditions.
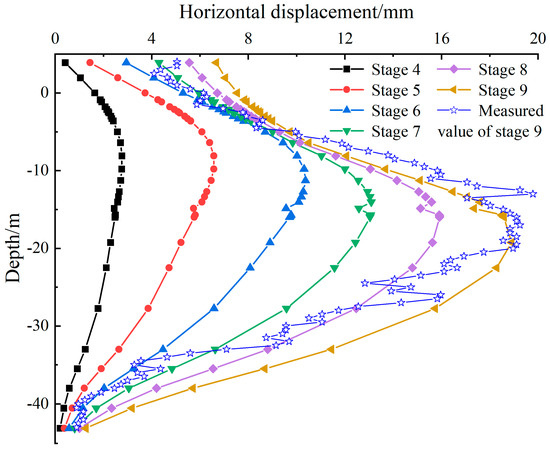
Figure 6.
Measured and simulated values at monitoring point ZQT82.
3.4. Numerical Analysis
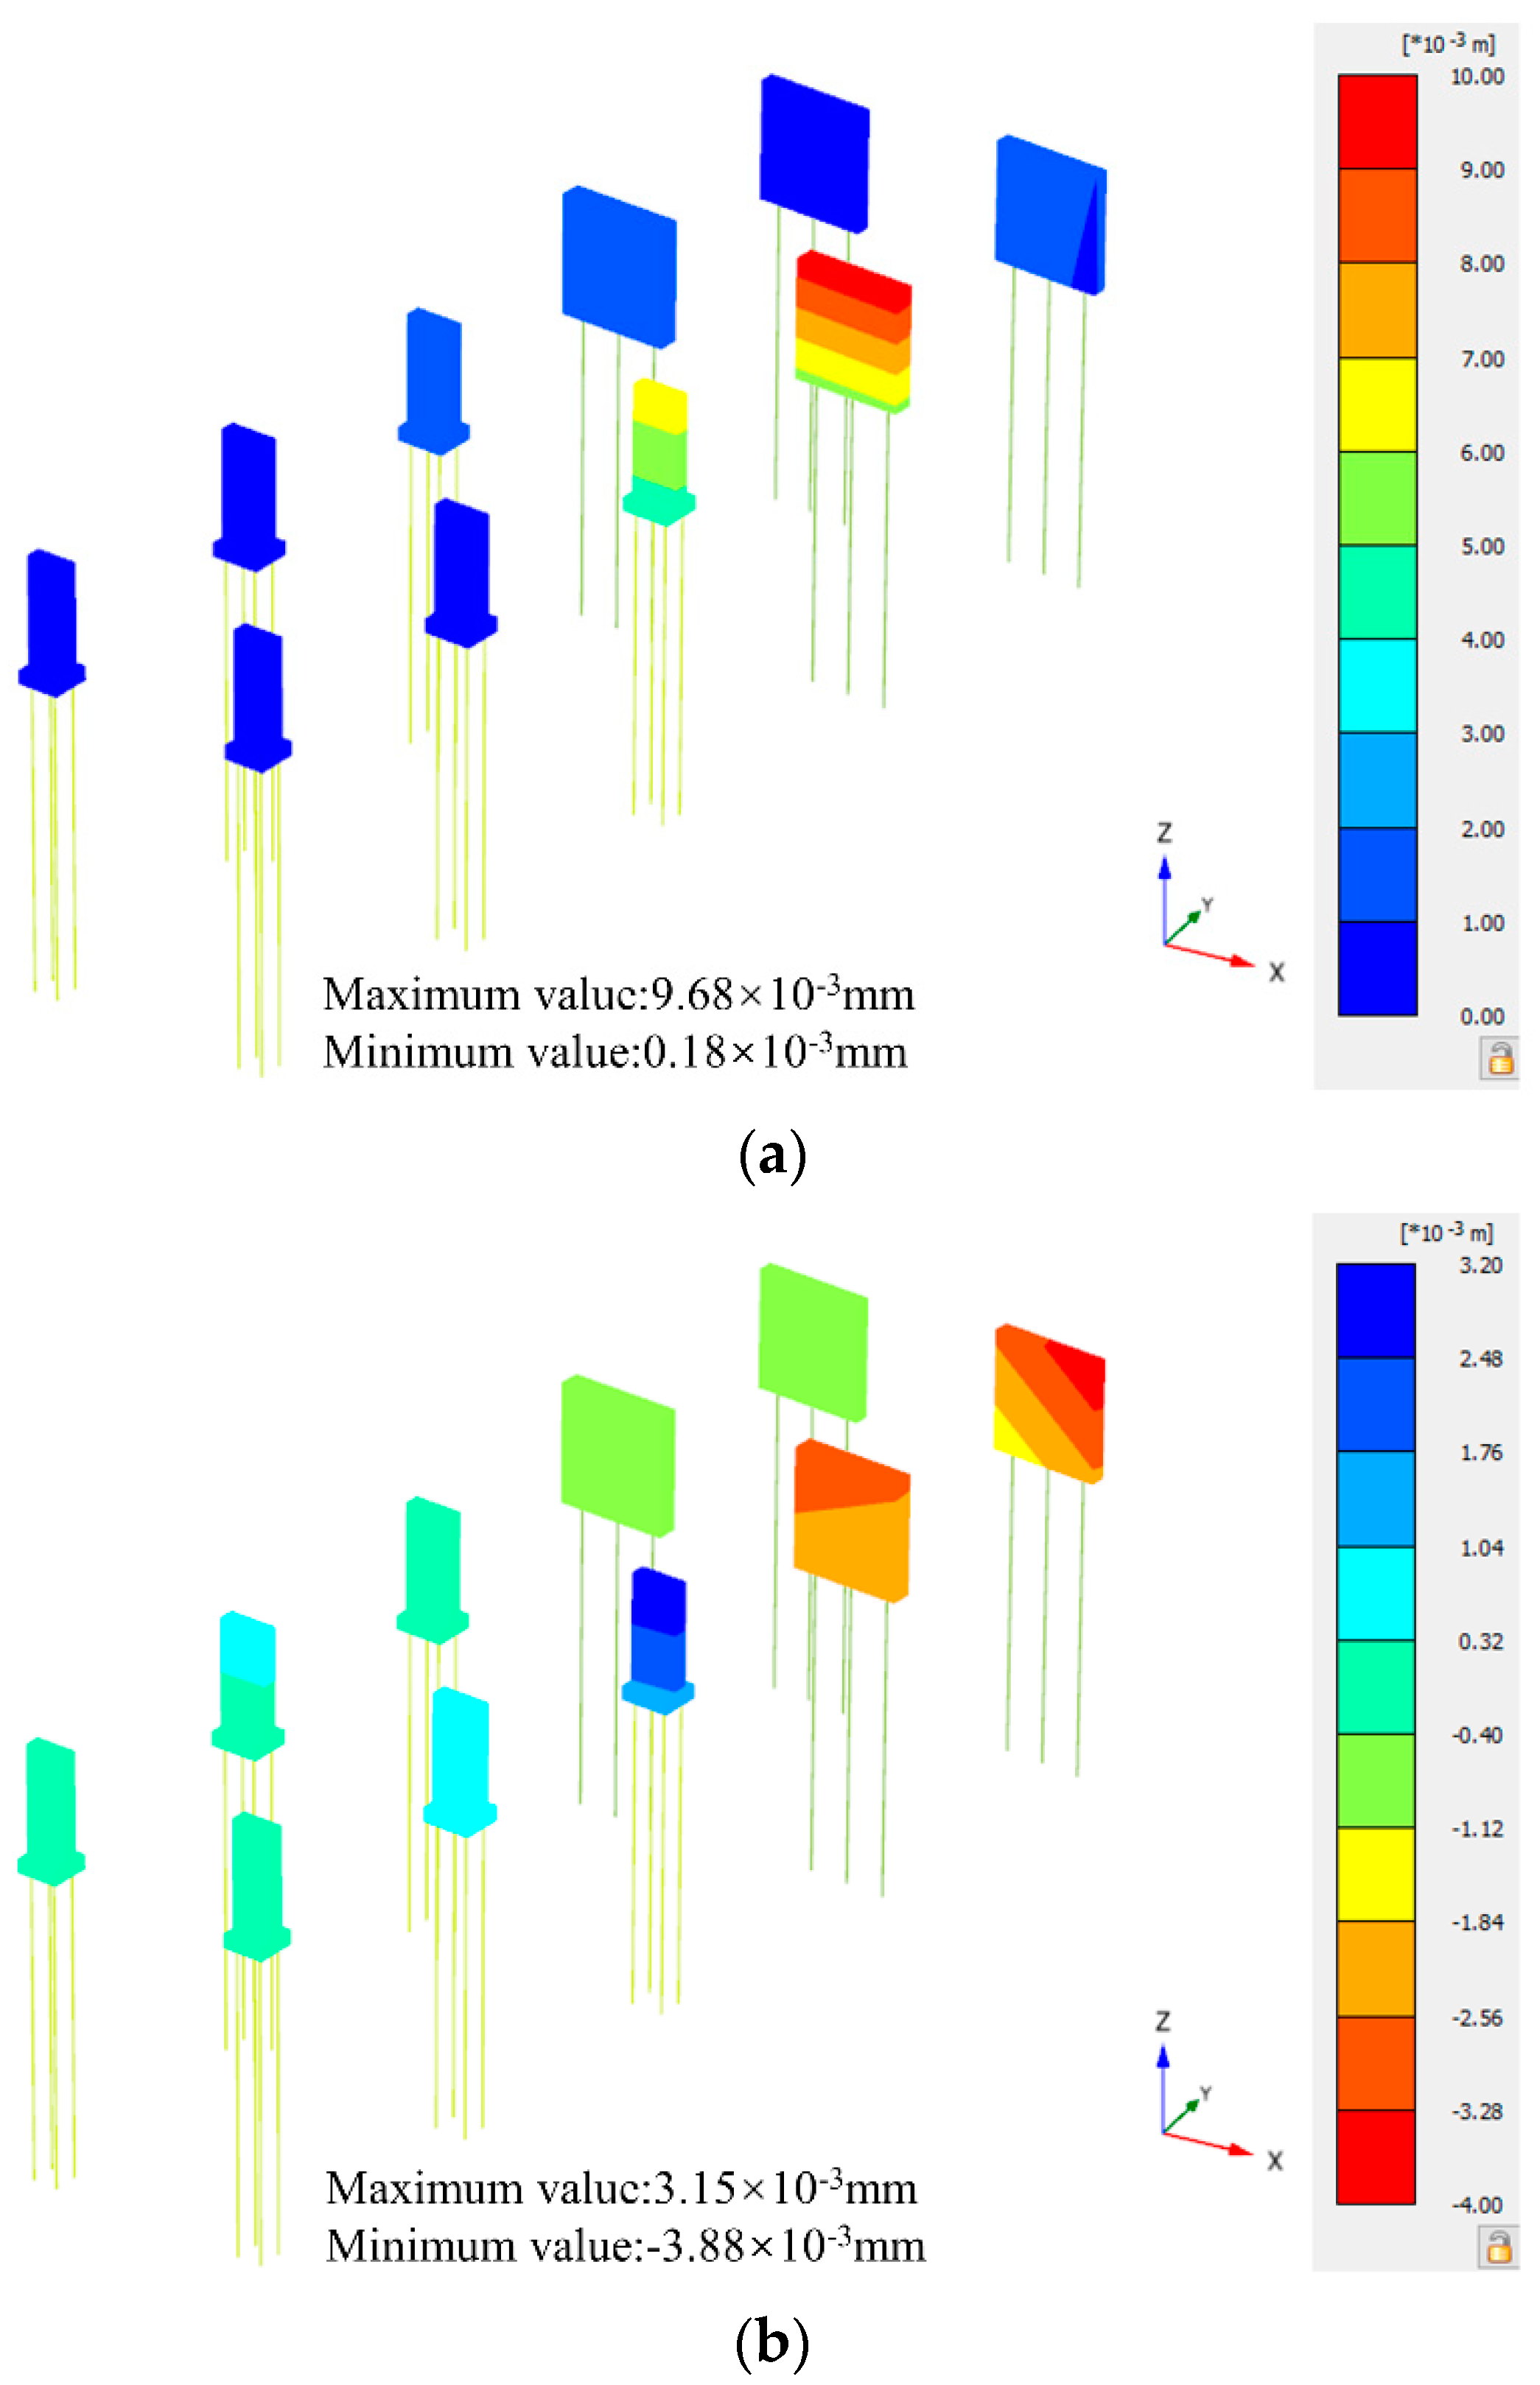
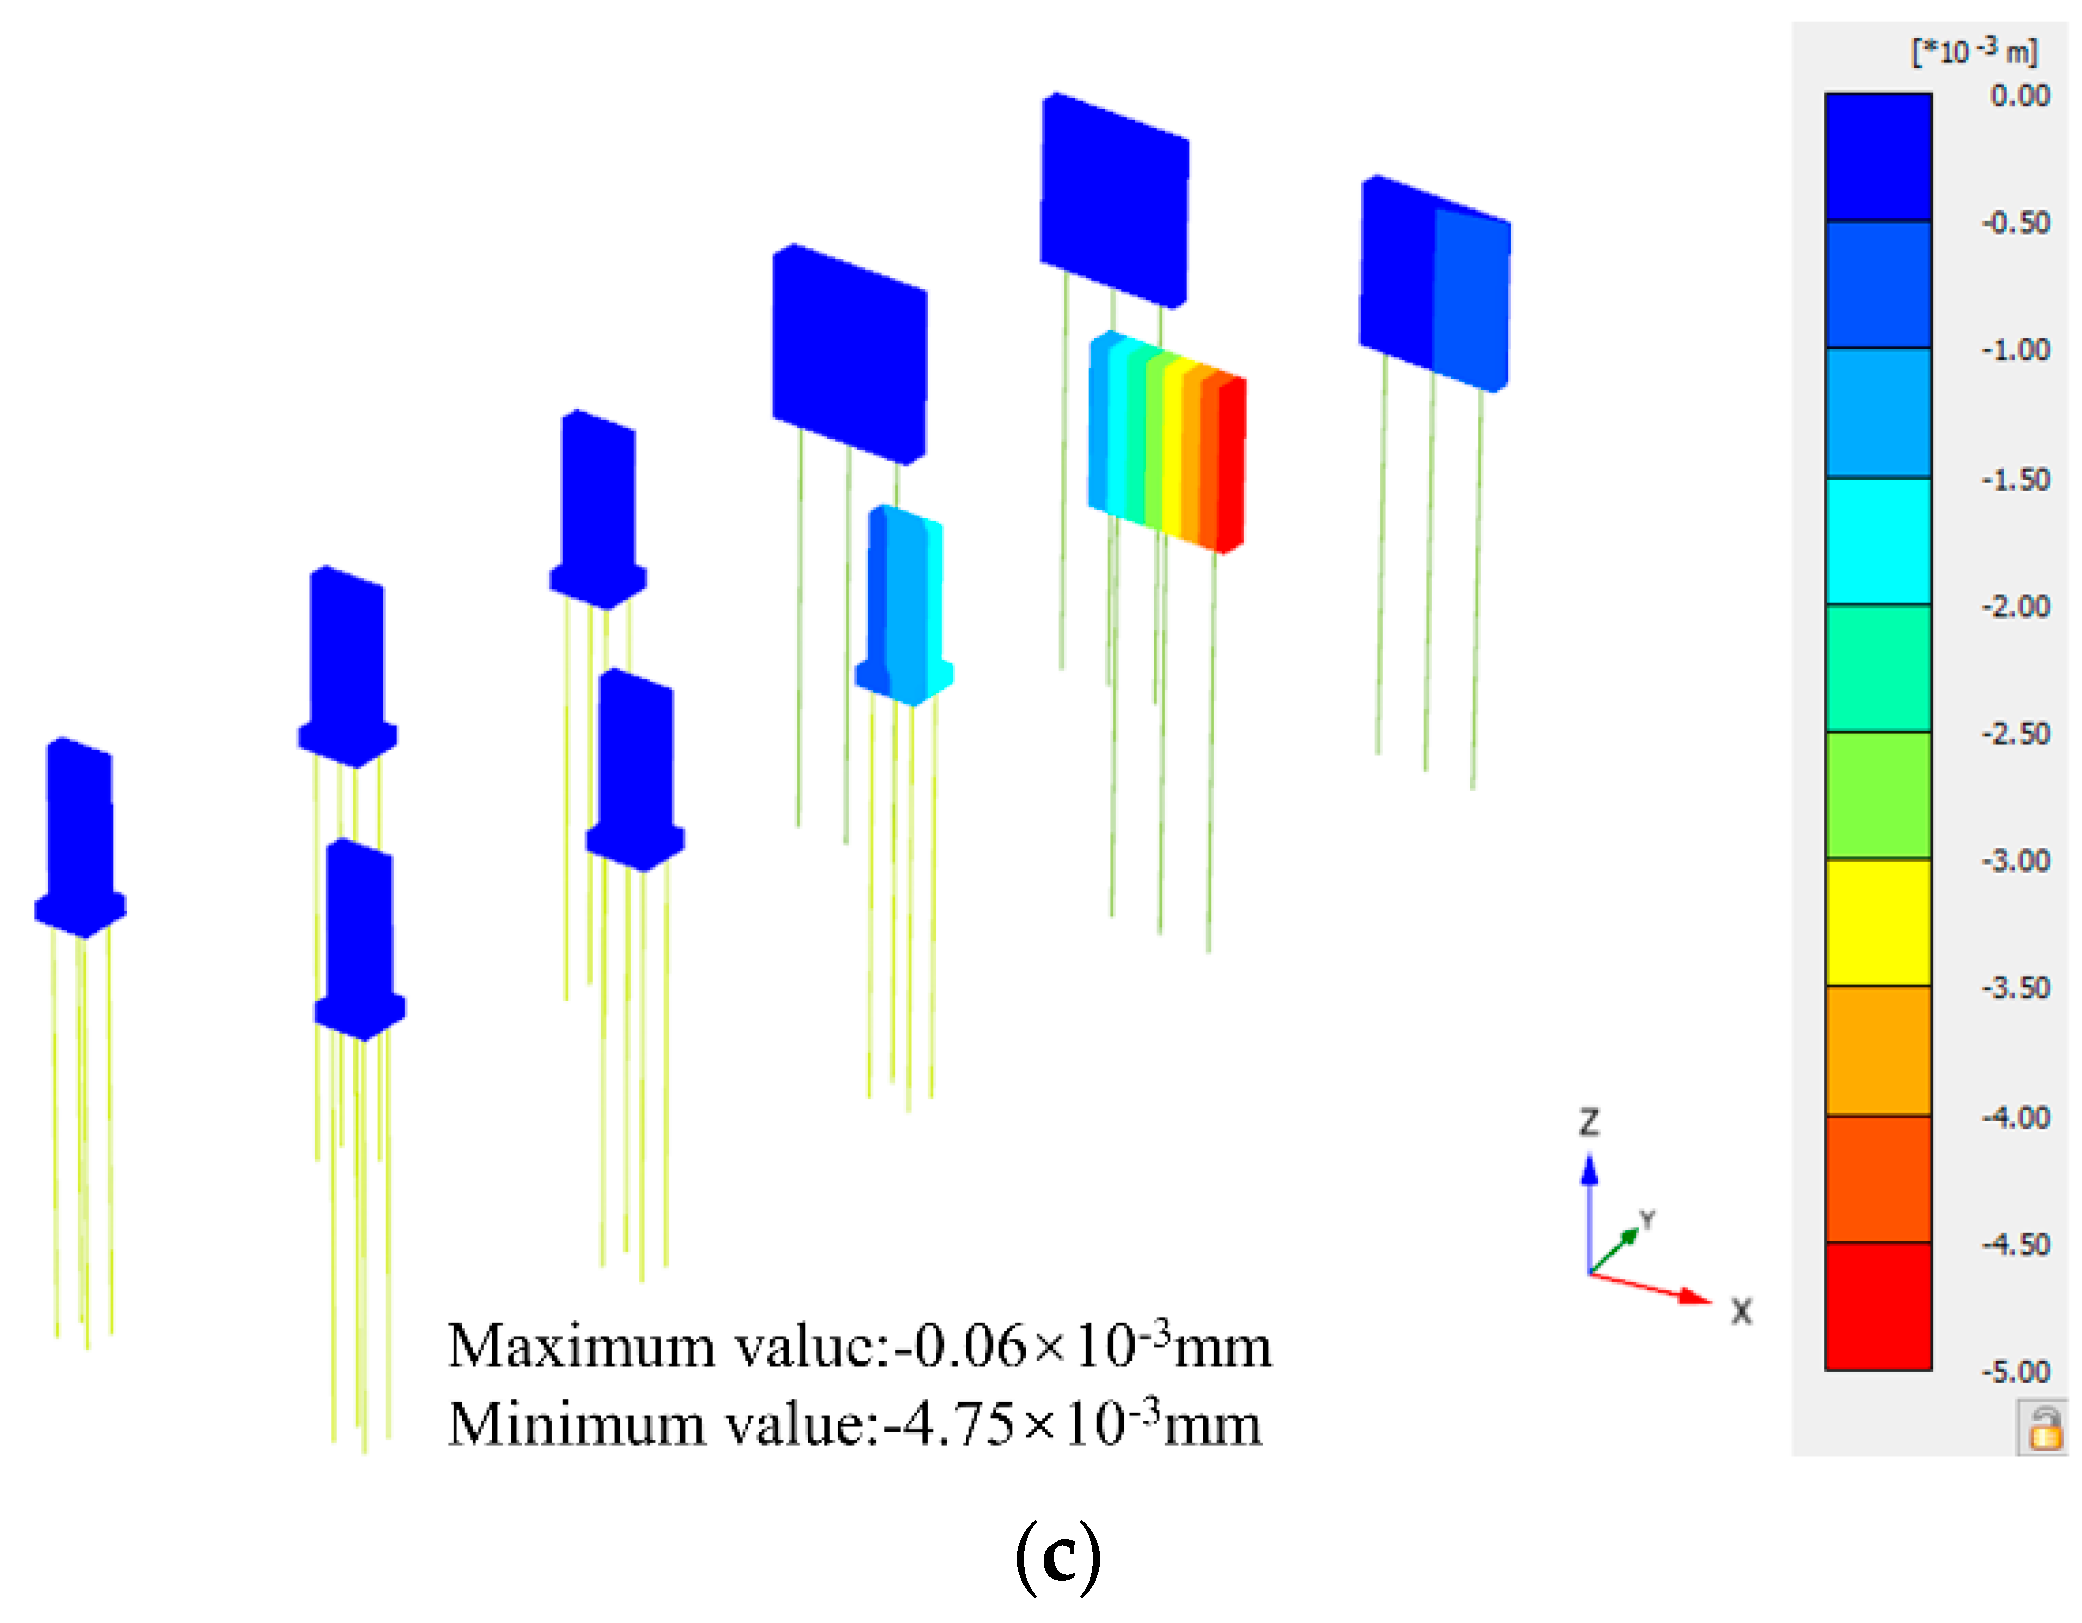
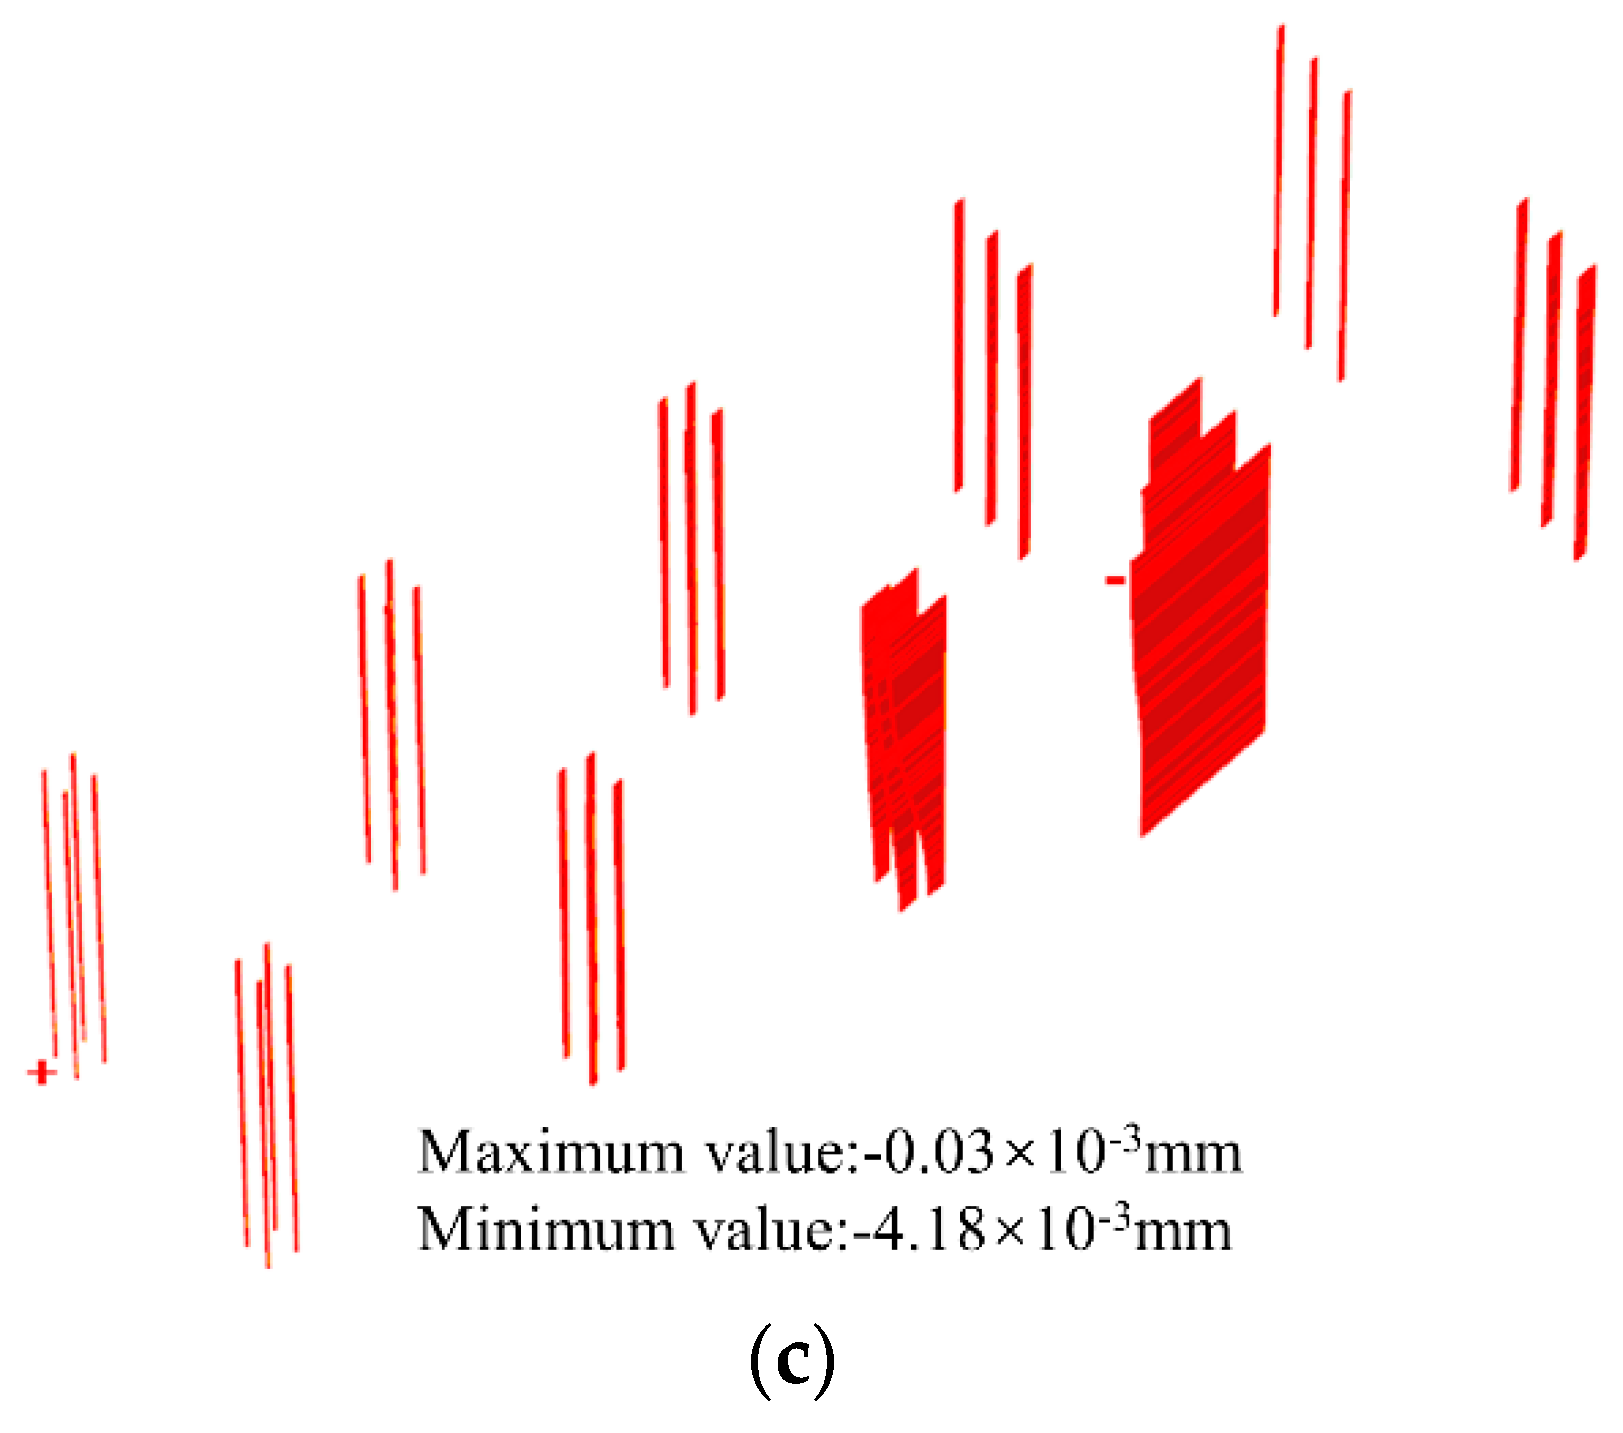
The displacement nephograms of the bridge piers in the x-, y-, and z-axis directions after the final excavation stage of the foundation pit are shown in Figure 7. It was observed that during this stage, due to the small distances of Piers A and B from the foundation pit (3.8 m and 17.4 m, respectively), they were significantly affected by the unloading of the foundation pit excavation, resulting in large deformations in all directions. Other elevated bridges farther from the foundation pit were less affected by the excavation. The displacement nephograms of the bridge pile foundations in the x-, y-, and z-axis directions are displayed in Figure 8. A comparison of Figure 7 and Figure 8 revealed consistent deformation trends for the bridge piers and the pile foundations. The closer to the foundation pit, the greater the deformation, with the maximum deformation of the bridge piers being larger than that of the pile foundations. This is because the bridge piers and pile foundations form an independent entity, and the absolute height of the bridge piers is greater than that of the pile foundations. As the elevated bridge inclined towards the foundation pit, its maximum deformations in all directions were greater than those of the pile foundations. Further analysis revealed that for the same elevated bridge, both the horizontal and vertical displacements of the bridge piers and pile foundations decreased gradually with increasing distance from the foundation pit, as detailed in Table 4. The values in the table represent the deformations at the tops of the bridge piers and pile foundations. It was observed that the vertical displacement in the z-axis direction demonstrated the most substantial variation, with reduction rates ranging from 63.72% to 79.49%, which was followed by vertical displacement in the y-axis direction, exhibiting reduction rates between 9.90% and 15.70%. Vertical displacements in the x-axis direction showed the least notable change, with reduction rates ranging from 1.06% to 1.86%.

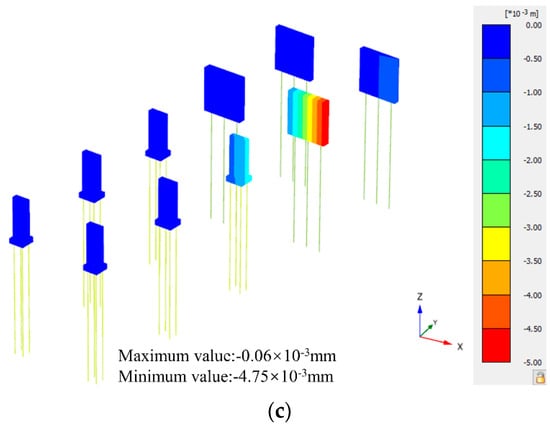
Figure 7.
Displacement contour map of bridge piers at the final excavation stage. (a) Displacement contour map of bridge piers in the x-axis direction. (b) Displacement contour nap of bridge piers in the y-axis direction. (c) Displacement contour map of bridge piers in the z-axis direction.
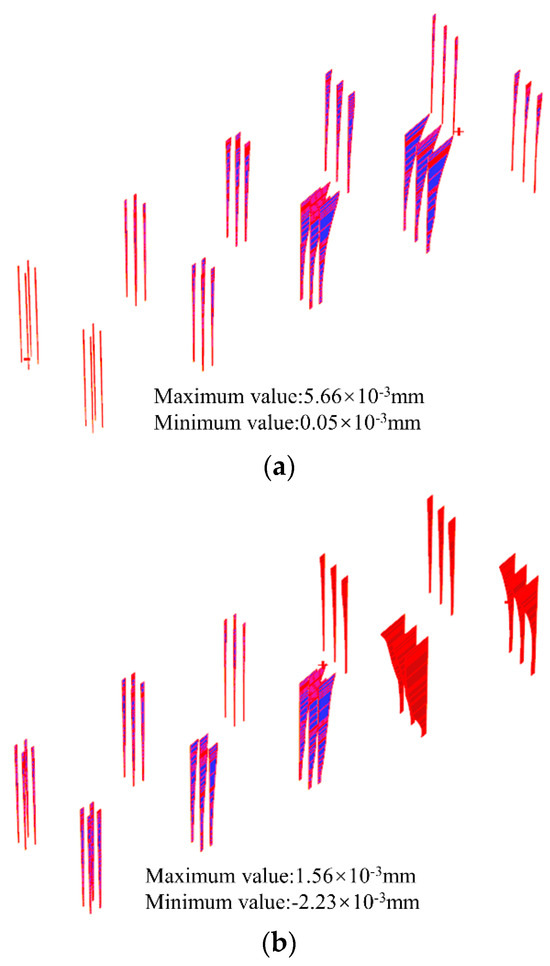
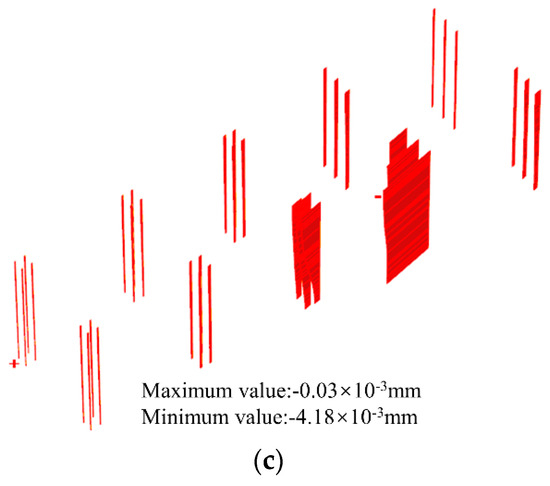
Figure 8.
Displacement contour nap of pile foundations at the final excavation stage. (a) Displacement contour map of pile foundations in the x-axis direction. (b) Displacement contour map of pile foundations in the y-axis direction. (c) Displacement contour map of pile foundations in the x-axis direction.
Table 4.
Deformation values of bridge piers and pile foundations at different distances from the foundation pit.
The impact of the foundation pit excavation on the adjacent elevated bridge was assessed with a focus on pier A of the elevated bridge that is situated closest to the foundation pit edge. Vertical displacement of the elevated bridge was defined as positive upwards and negative otherwise, while horizontal displacements in the x- and y-axis directions, as well as the pier tilt towards the foundation pit, were positive, otherwise they were negative. Similarly, the diaphragm wall deformation towards the inside of the foundation pit was positive, otherwise it was negative.
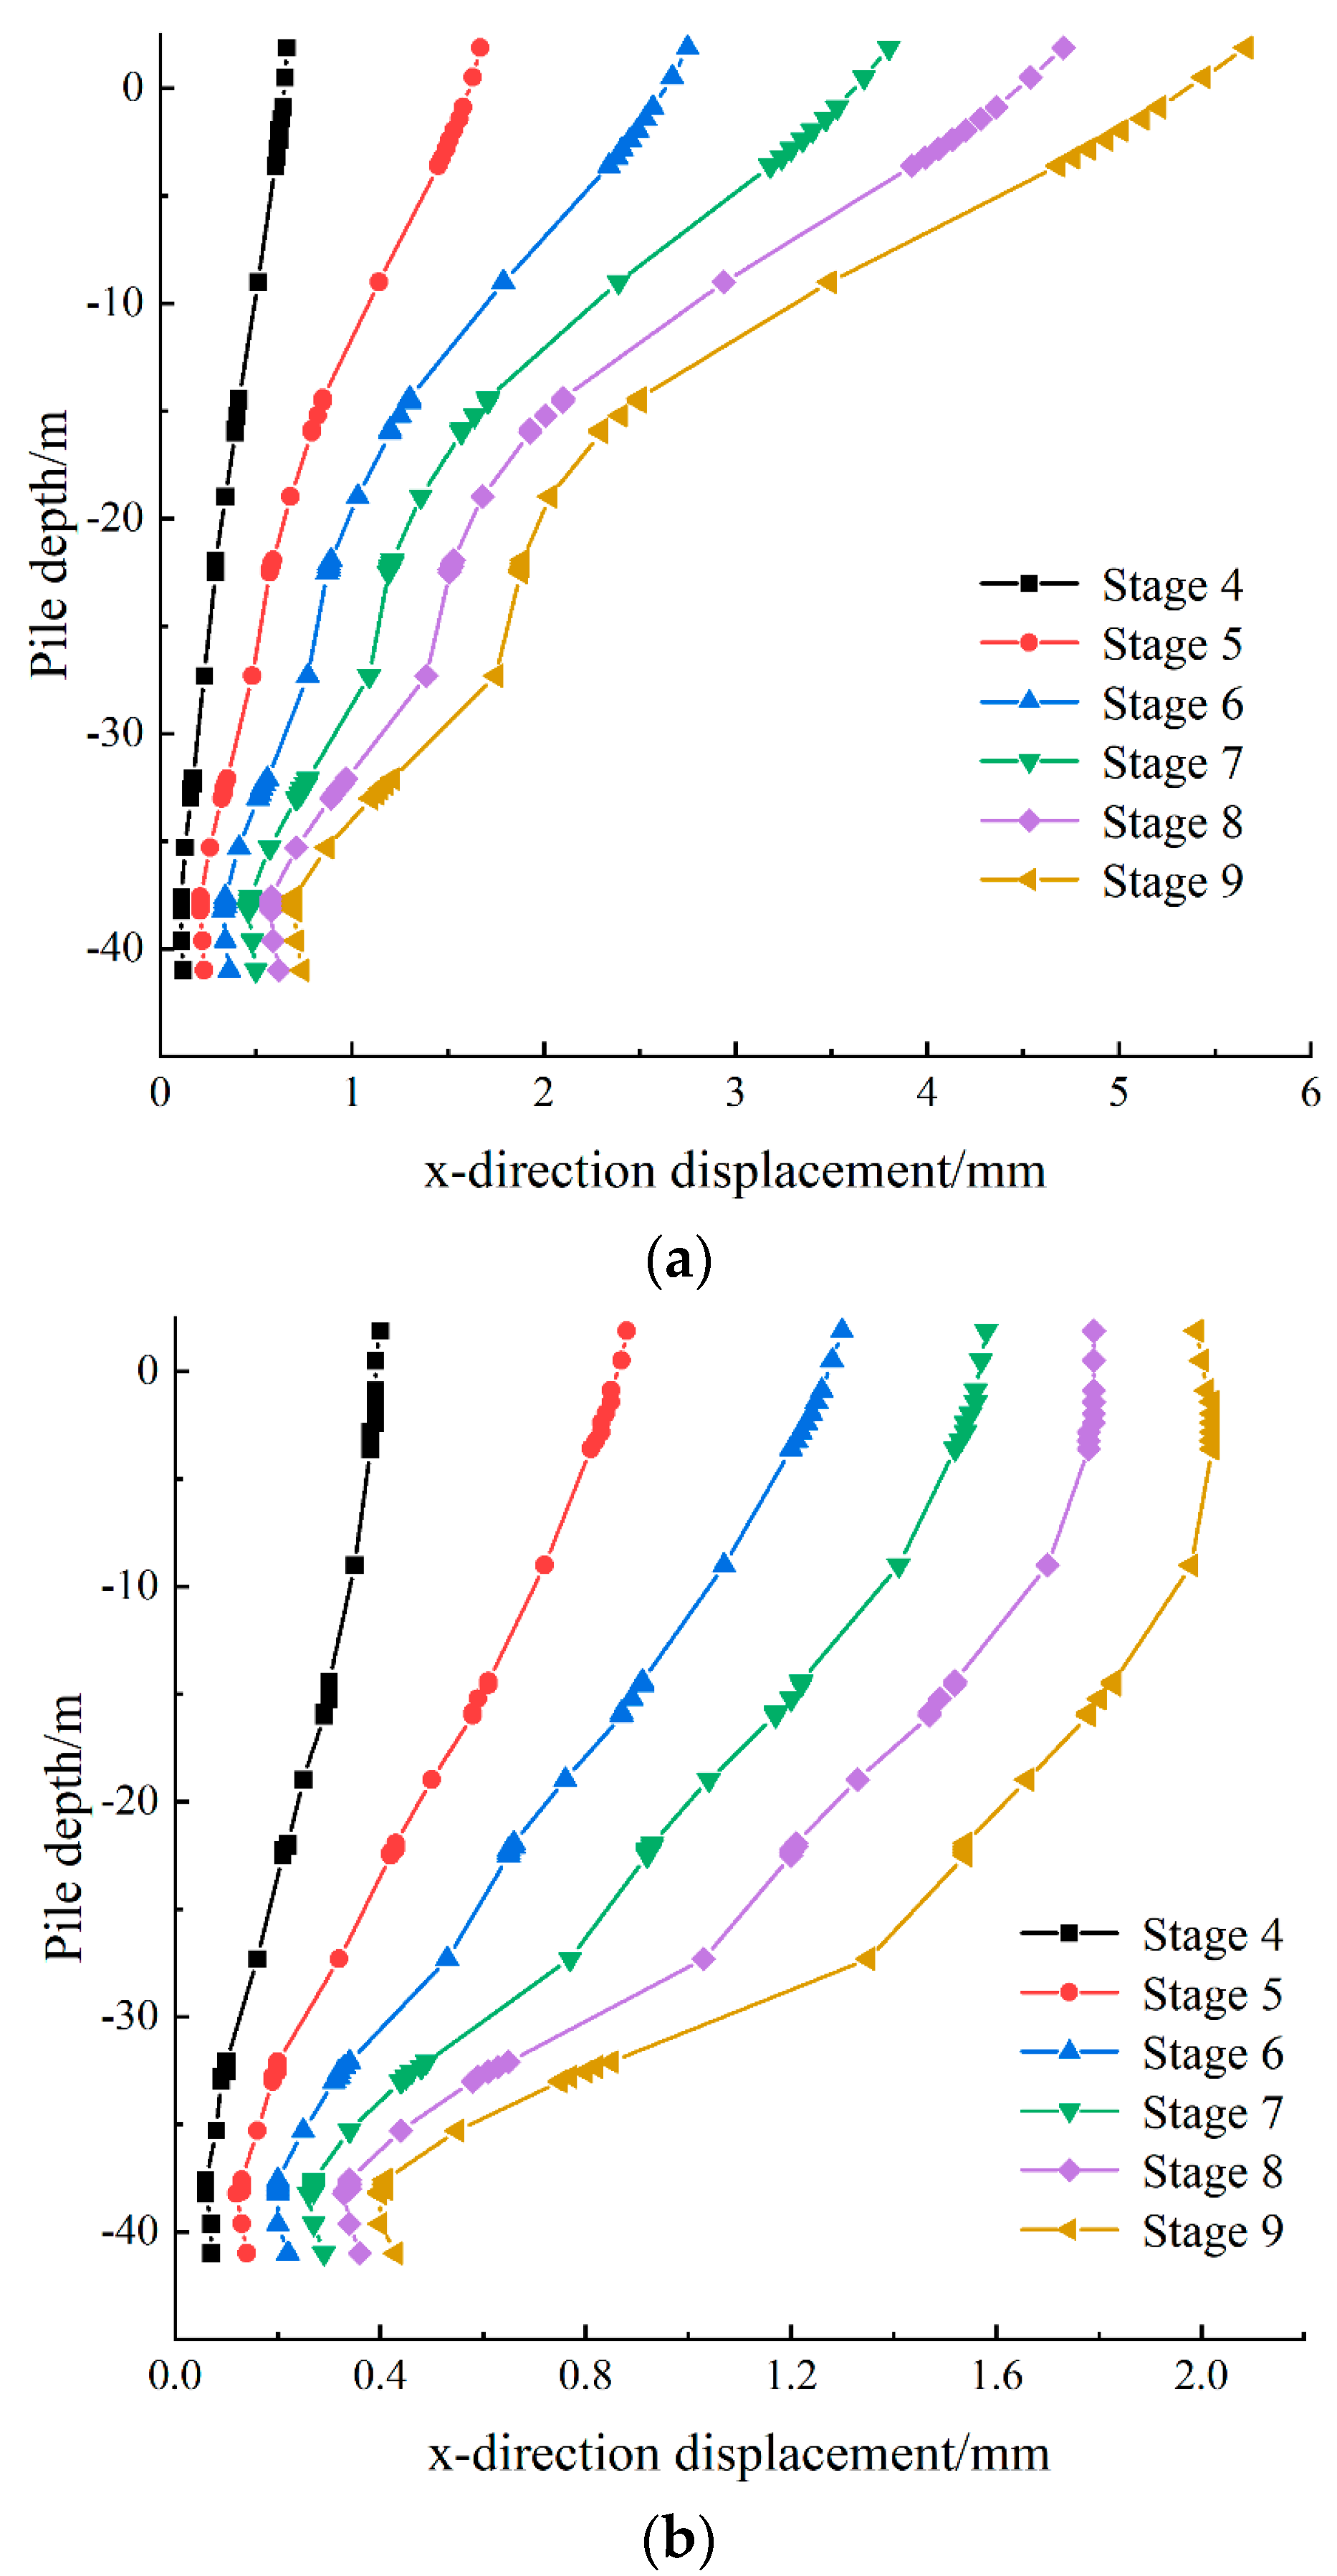
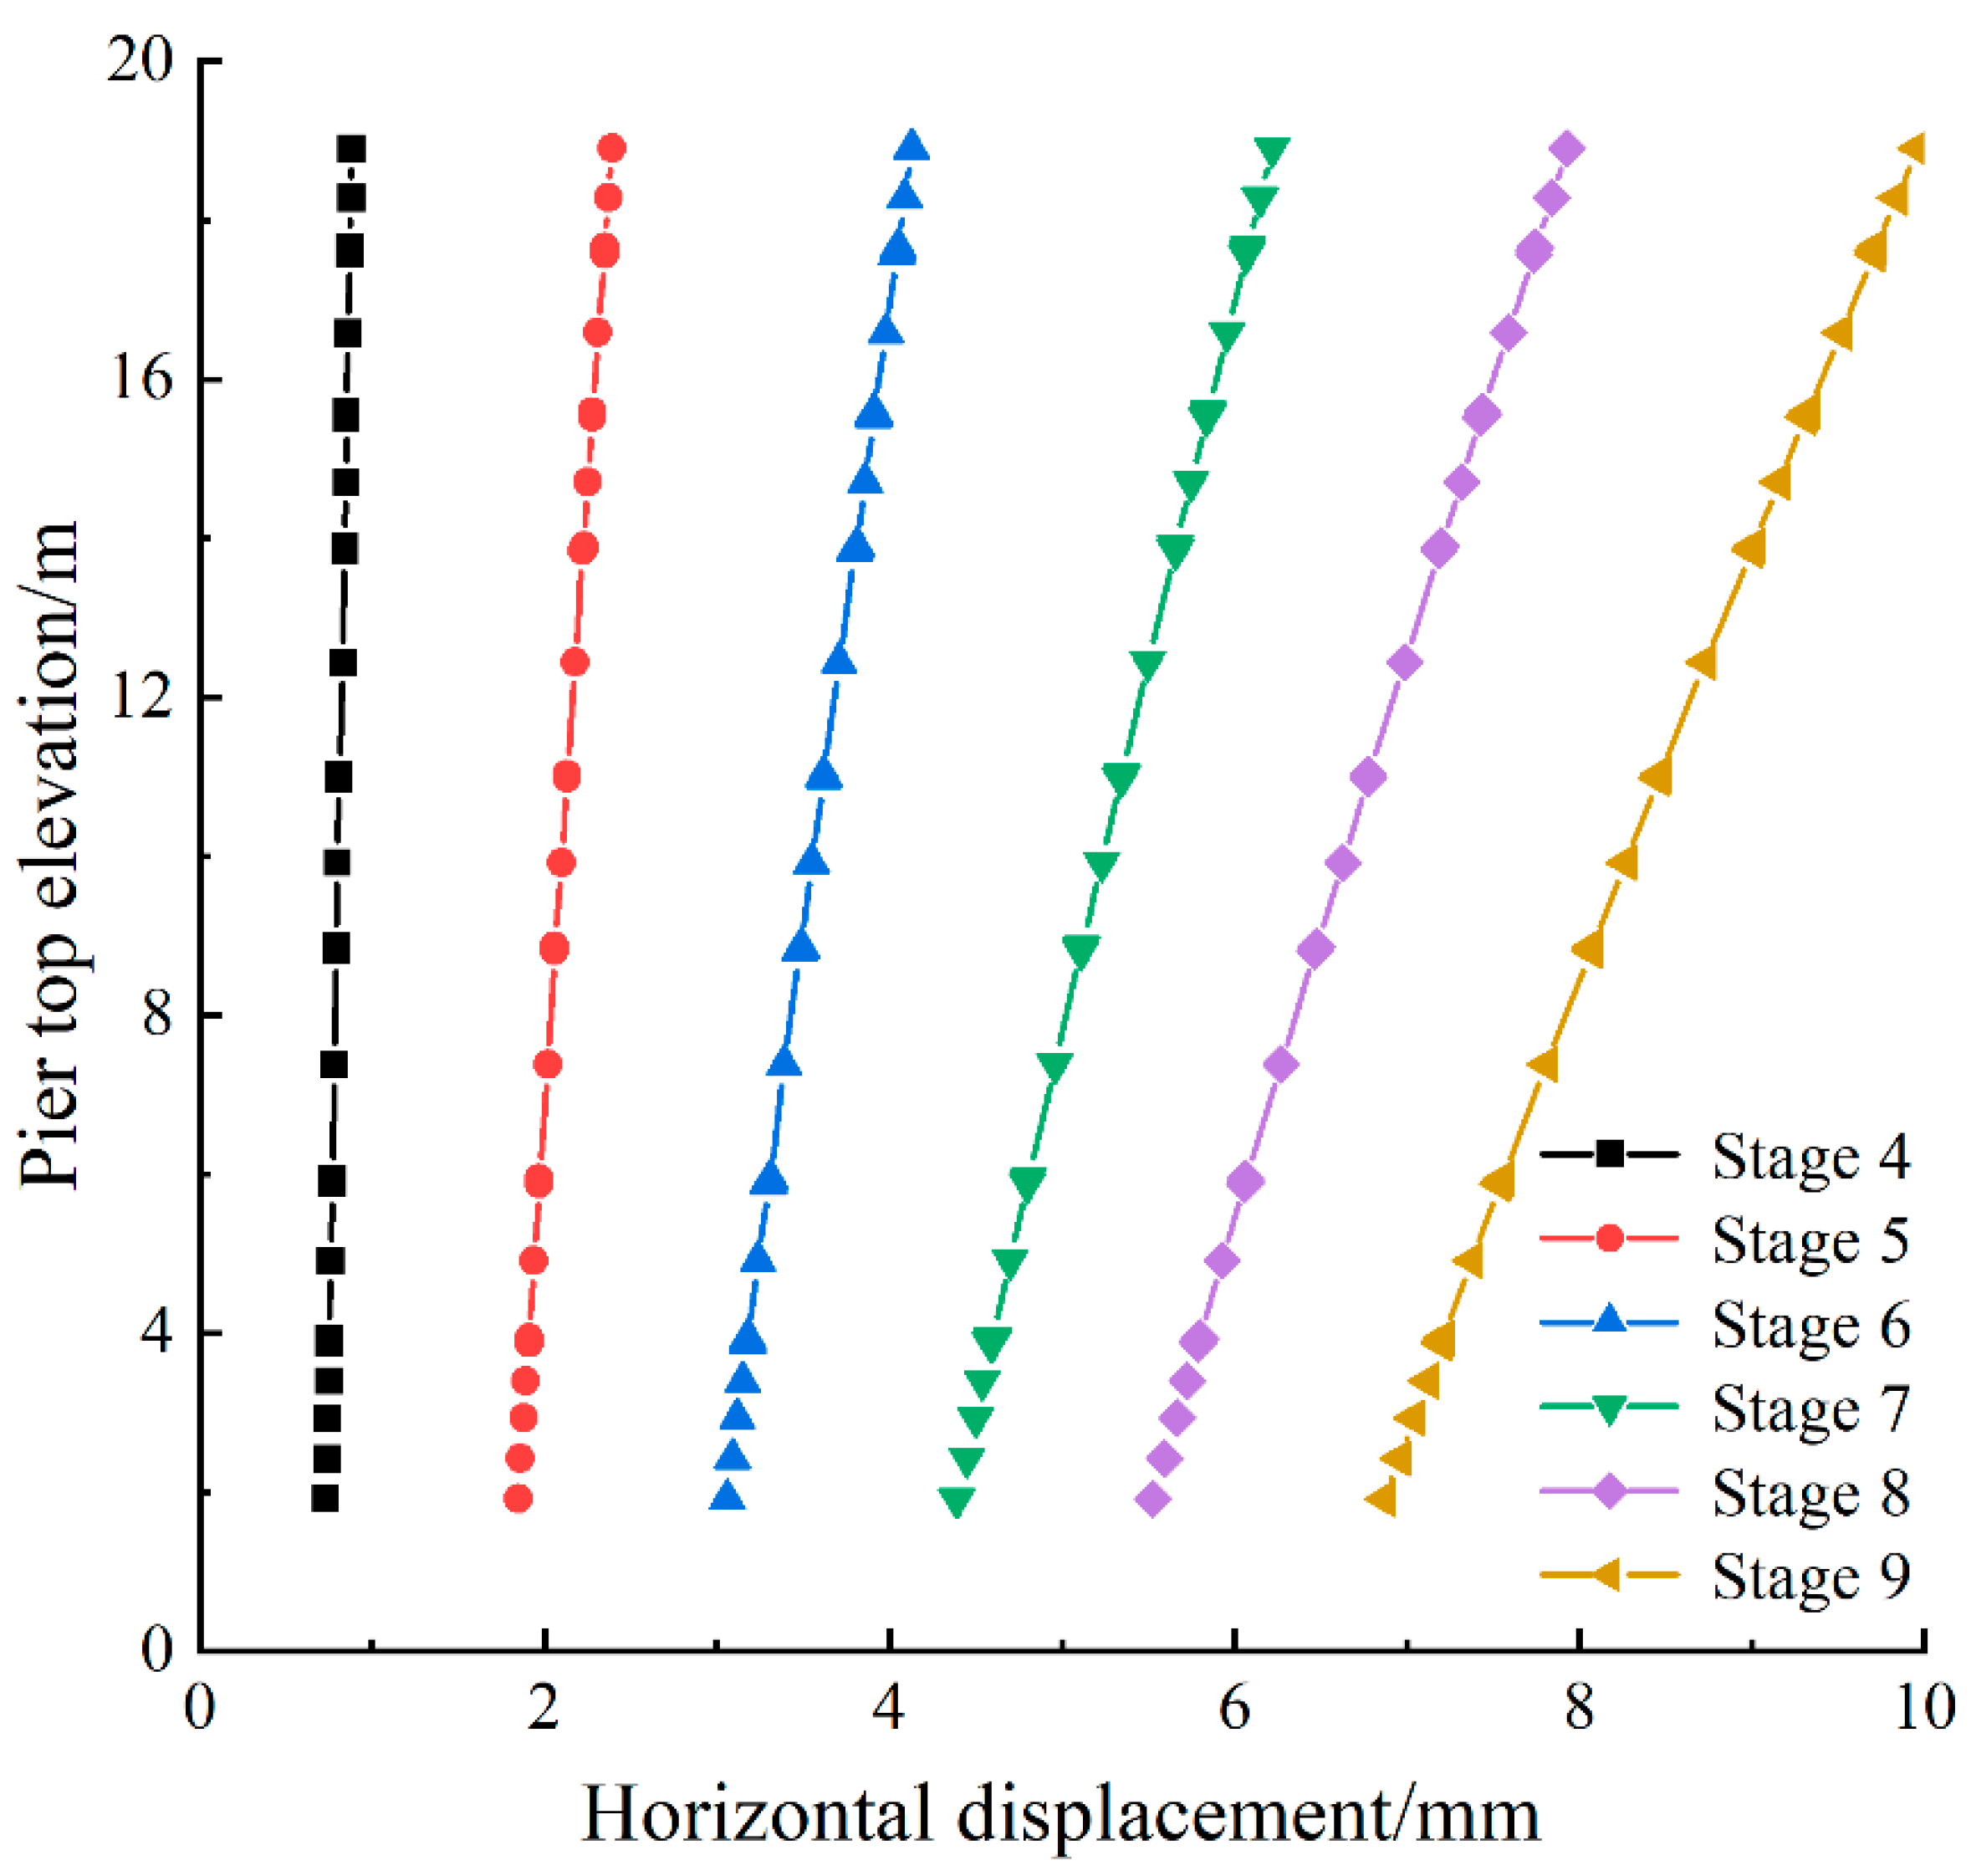
Figure 9, Figure 10 and Figure 11 illustrate the horizontal displacement of the pile foundation along the depth direction, the maximum vertical displacement of the bridge pier and pile foundation, and the tilt rate of pier A of the elevated bridge under different excavation stages, respectively. Figure 9 revealed a progressive trend in the horizontal deformation of the pile foundation towards the excavation side of the foundation pit and a gradually increasing horizontal displacement, which was characterized by an “S” shape as excavation proceeded. The maximum horizontal displacement of the pile foundation in the x-axis direction was 5.66 mm, while it reached 2.03 mm in the y-axis direction. The maximum horizontal displacement in the x-axis direction occurred at the pile foundation top, coinciding with the bottom of the bridge pier cap. Furthermore, the horizontal displacement of the pile foundation gradually decreased with increasing pile depth. However, in the y-axis direction, the maximum horizontal displacement occurred at the top during the initial excavation stage and gradually moved downward with further excavation, reaching a maximum displacement of 4 m below the ground surface during the final excavation stage.
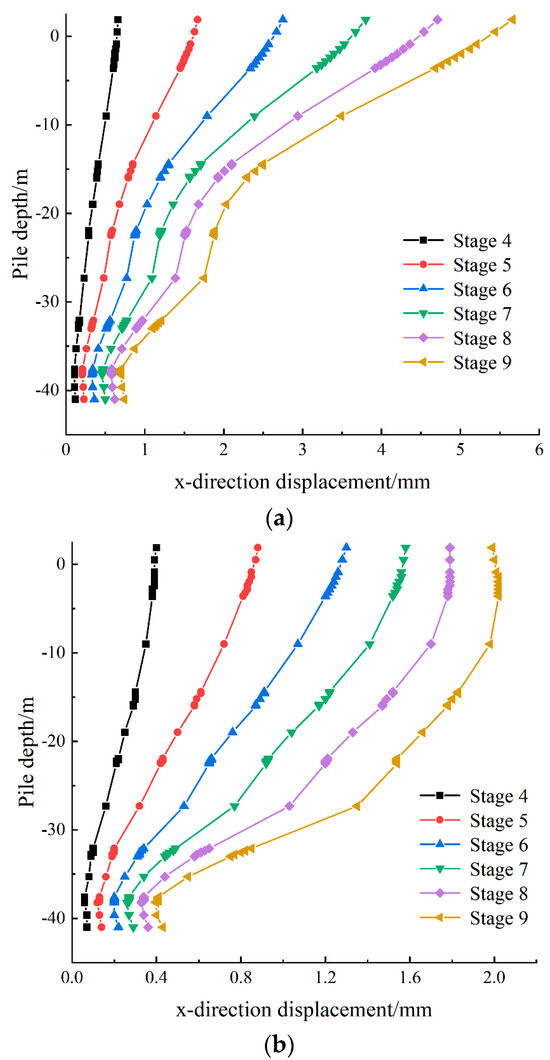
Figure 9.
Horizontal displacement of Pile Foundation A under different excavation conditions. (a) Horizontal displacement of Pile Foundation A in the x-axis direction. (b) Horizontal displacement of Pile Foundation A in the y-axis direction.
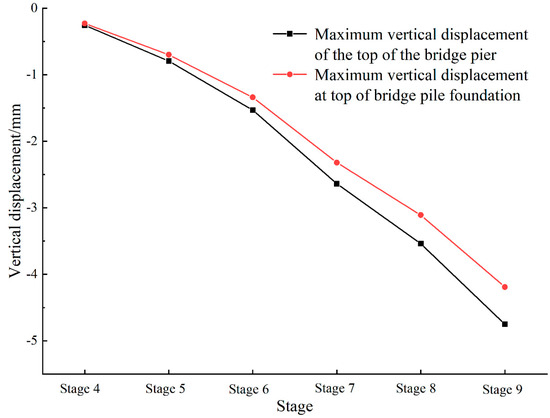
Figure 10.
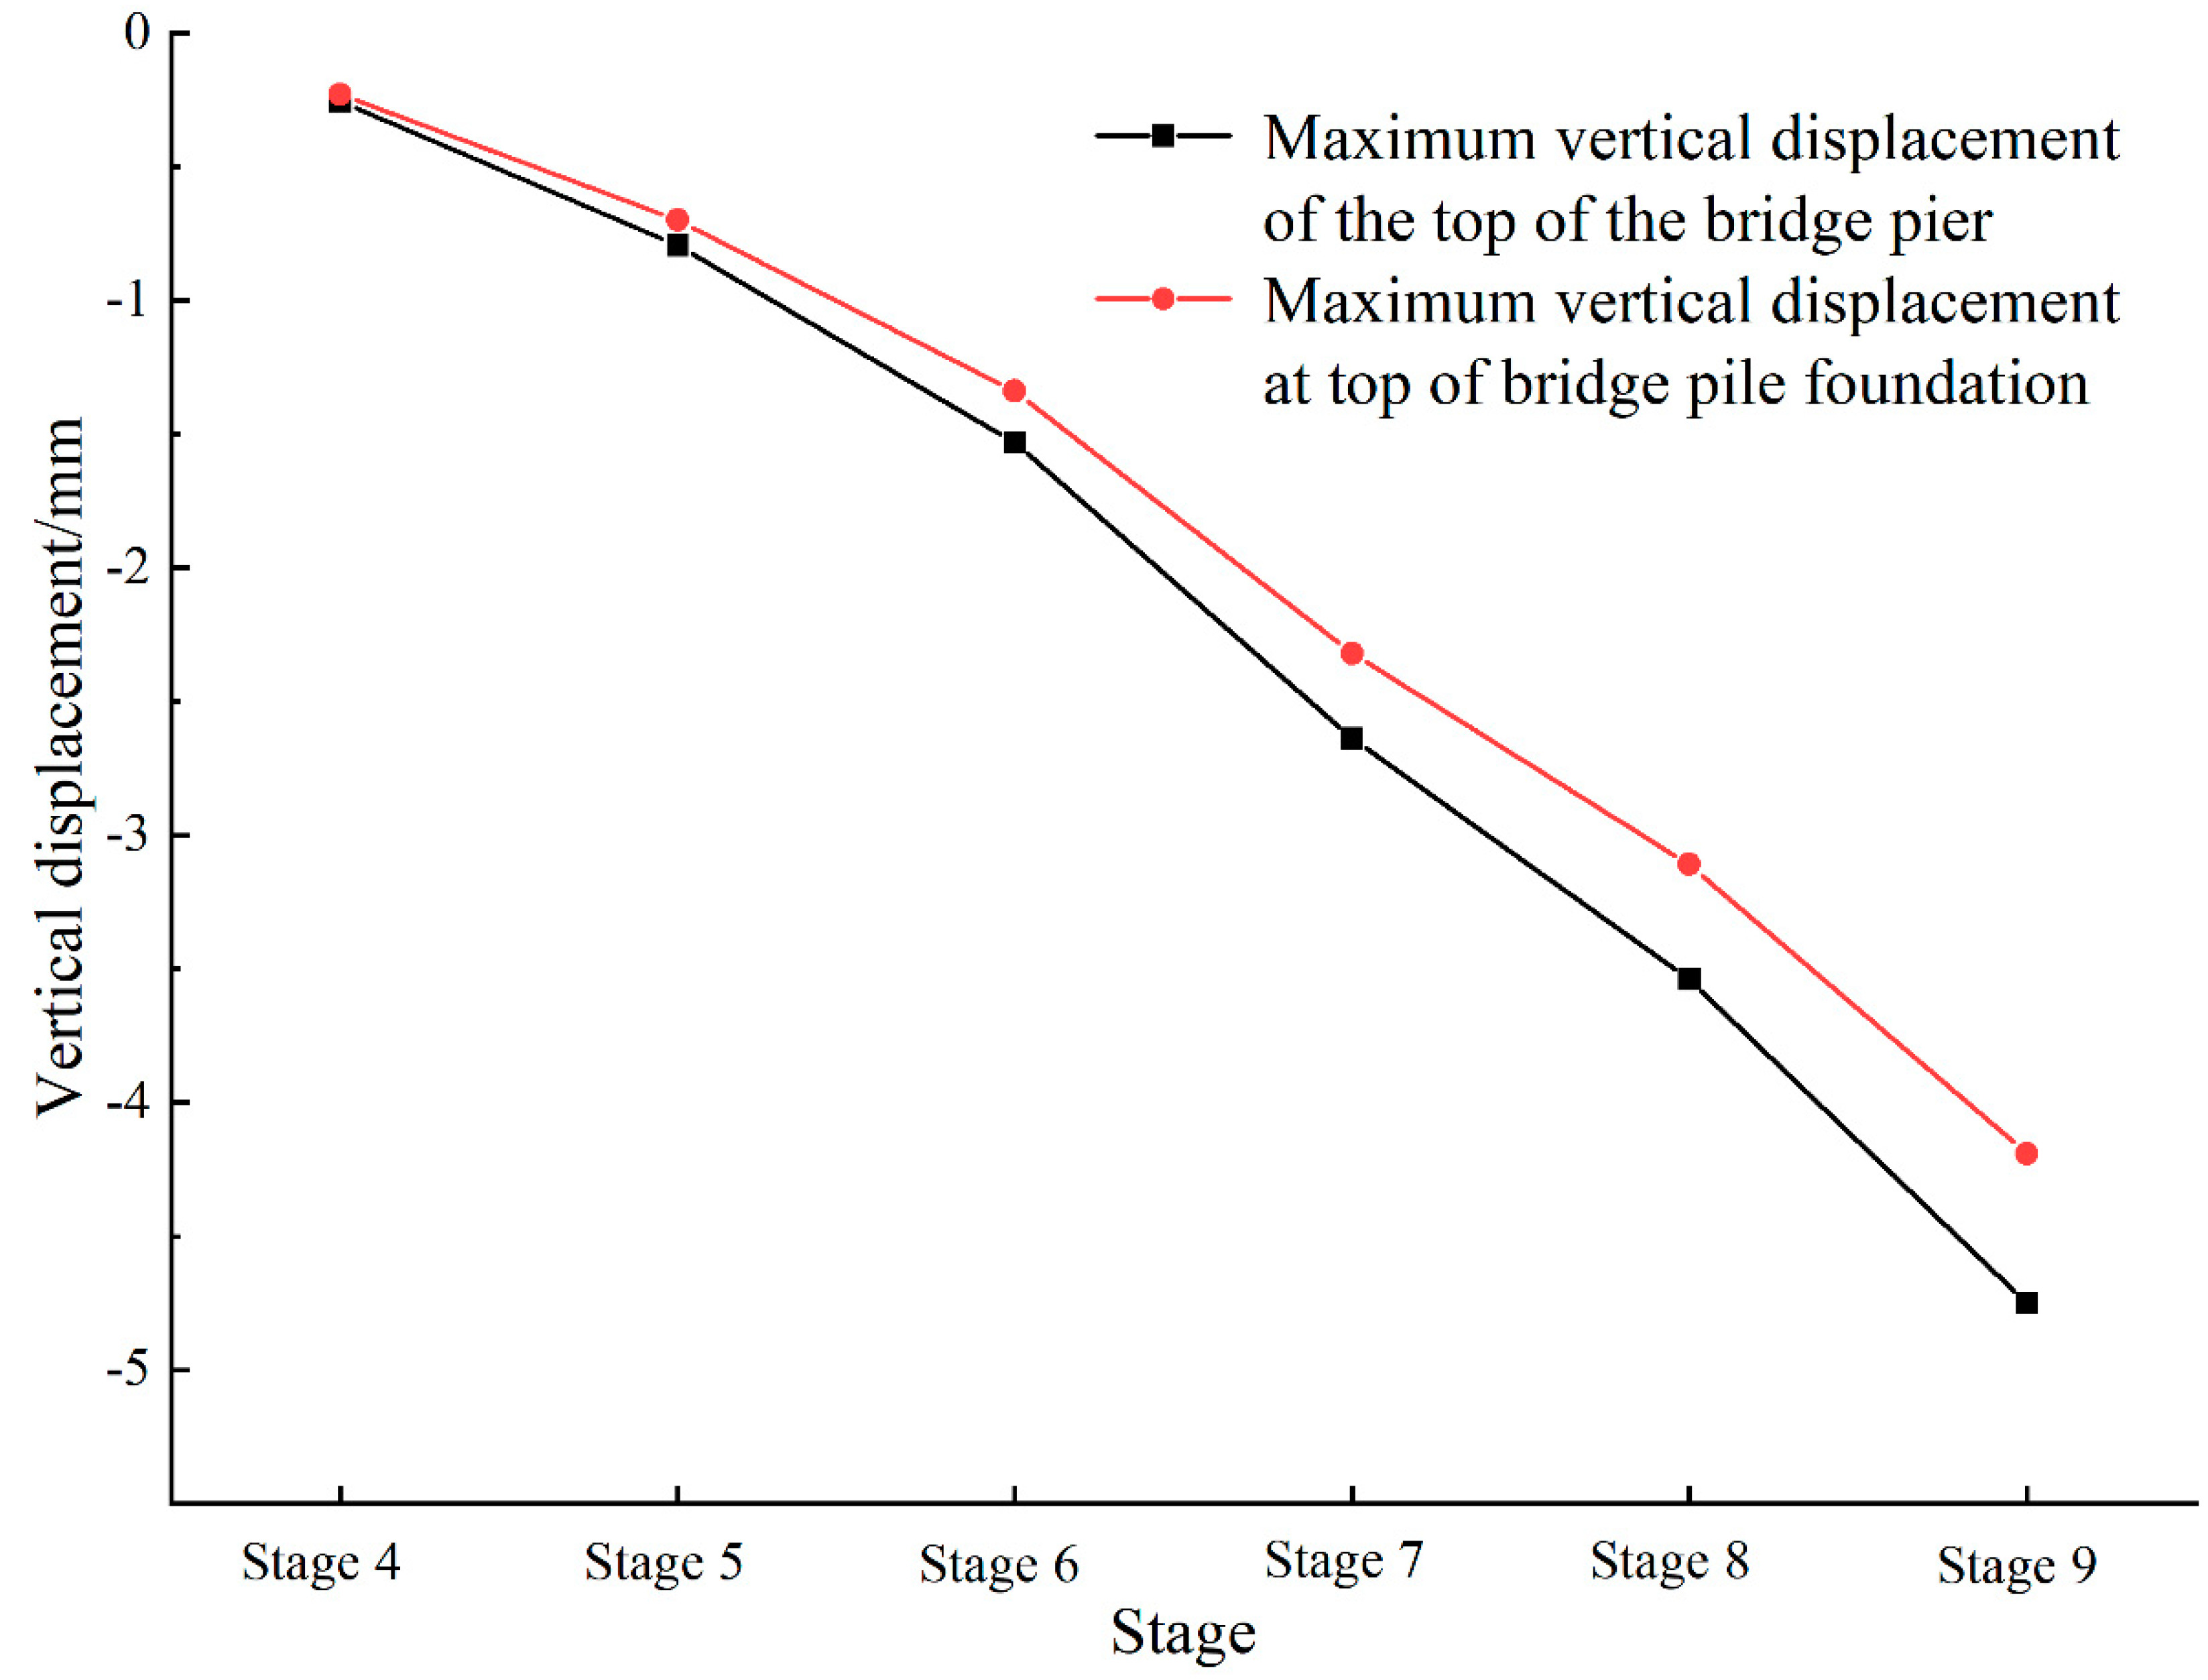
Maximum vertical displacement of the pier and pile foundation of elevated bridge A under different excavation conditions.
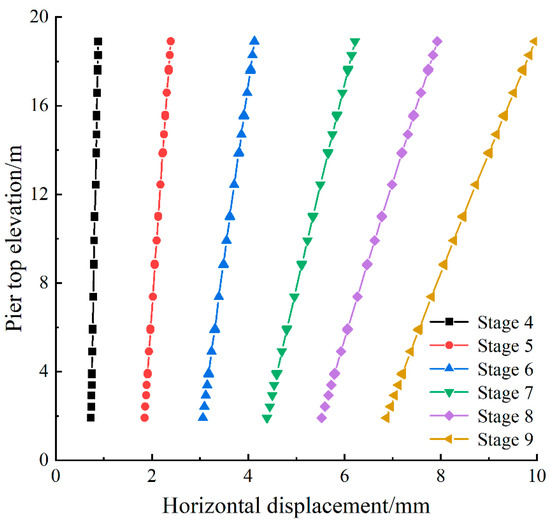
Figure 11.
Tilt rate of pier A under different excavation conditions.
Figure 10 illustrates that as the foundation pit excavation progressed, the maximum vertical displacement at the top of the bridge pier and the pile foundation gradually increased, reaching 4.75 mm and 4.19 mm, respectively. This trend aligned closely with the deformation observed in the pile foundation. In the initial excavation stage, the maximum deformations of the bridge pier and bridge pile foundation were similar. However, as the excavation continued, the difference between their maximum deformations gradually increased. Figure 11 depicts the tilt rate of pier A induced by the foundation pit excavation, where the horizontal displacement is a composite of displacements in the x- and y-axis directions. The tilt rate was calculated by dividing the horizontal displacement difference between the top and bottom of the bridge pier by the pier height. As the excavation progressed, the horizontal displacement of pier A gradually increased, which was characterized by smaller displacements at the bottom and larger displacements at the top. This trend intensified with further excavation, causing the pier to tilt towards the foundation pit side. The tilt rate also gradually increased, reaching a maximum of 0.018%.
4. Optimization Study on Deformation Control of Bridge Piers
The nearest distance between the foundation pit boundary and pier A is only 3.8 m, placing it within the primary impact zone of the foundation pit excavation. Therefore, it is necessary to control the displacement of the elevated bridge. According to the “Urban Rail Transit Design Standard” (DG/TJ08-109-2017) [31] and the “Technical Standards for Safety Protection Areas of Urban Bridges and Tunnels” (2010) [32], the deformation control standards for the foundation pit support structure and the elevated bridge are detailed in Table 5. In practical engineering, when deformation reaches 80% of the control standard, attention is warranted. This paper adopted 80% of the control standard as the deformation control threshold. The maximum horizontal deformation of the diaphragm wall was 19.8 mm and the tilt rate of the elevated bridge was 0.018%, both of which met the requirements. However, the maximum vertical displacement of the elevated bridge was 4.78 mm, which exceeded 80% of the control standard and failed to meet the requirements.
Table 5.
Deformation control standard.
4.1. Optimization Analysis of Soil Reinforcement around the Foundation Pit
The aforementioned analyses confirmed that controlling the vertical displacement of the bridge piers is essential. Here, soil reinforcement outside the foundation pit was employed for optimization analysis. The reinforcement area primarily involved the soils around elevated bridge A. A 10 m long and 3 m wide “angle steel” type reinforcement zone was selected from the right-angle area near the end of elevated bridge A to facilitate the numerical study. The schematic diagram of soil reinforcement is displayed in Figure 12. Different reinforcement depths were studied to simulate the impact of foundation pit excavation on the adjacent elevated bridge, with simulation conditions detailed in Table 6.
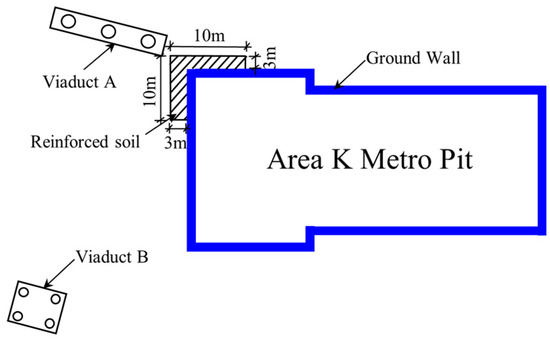
Figure 12.
Schematic diagram of soil reinforcement around the foundation pit.
Table 6.
Soil reinforcement simulation conditions around the foundation pit.
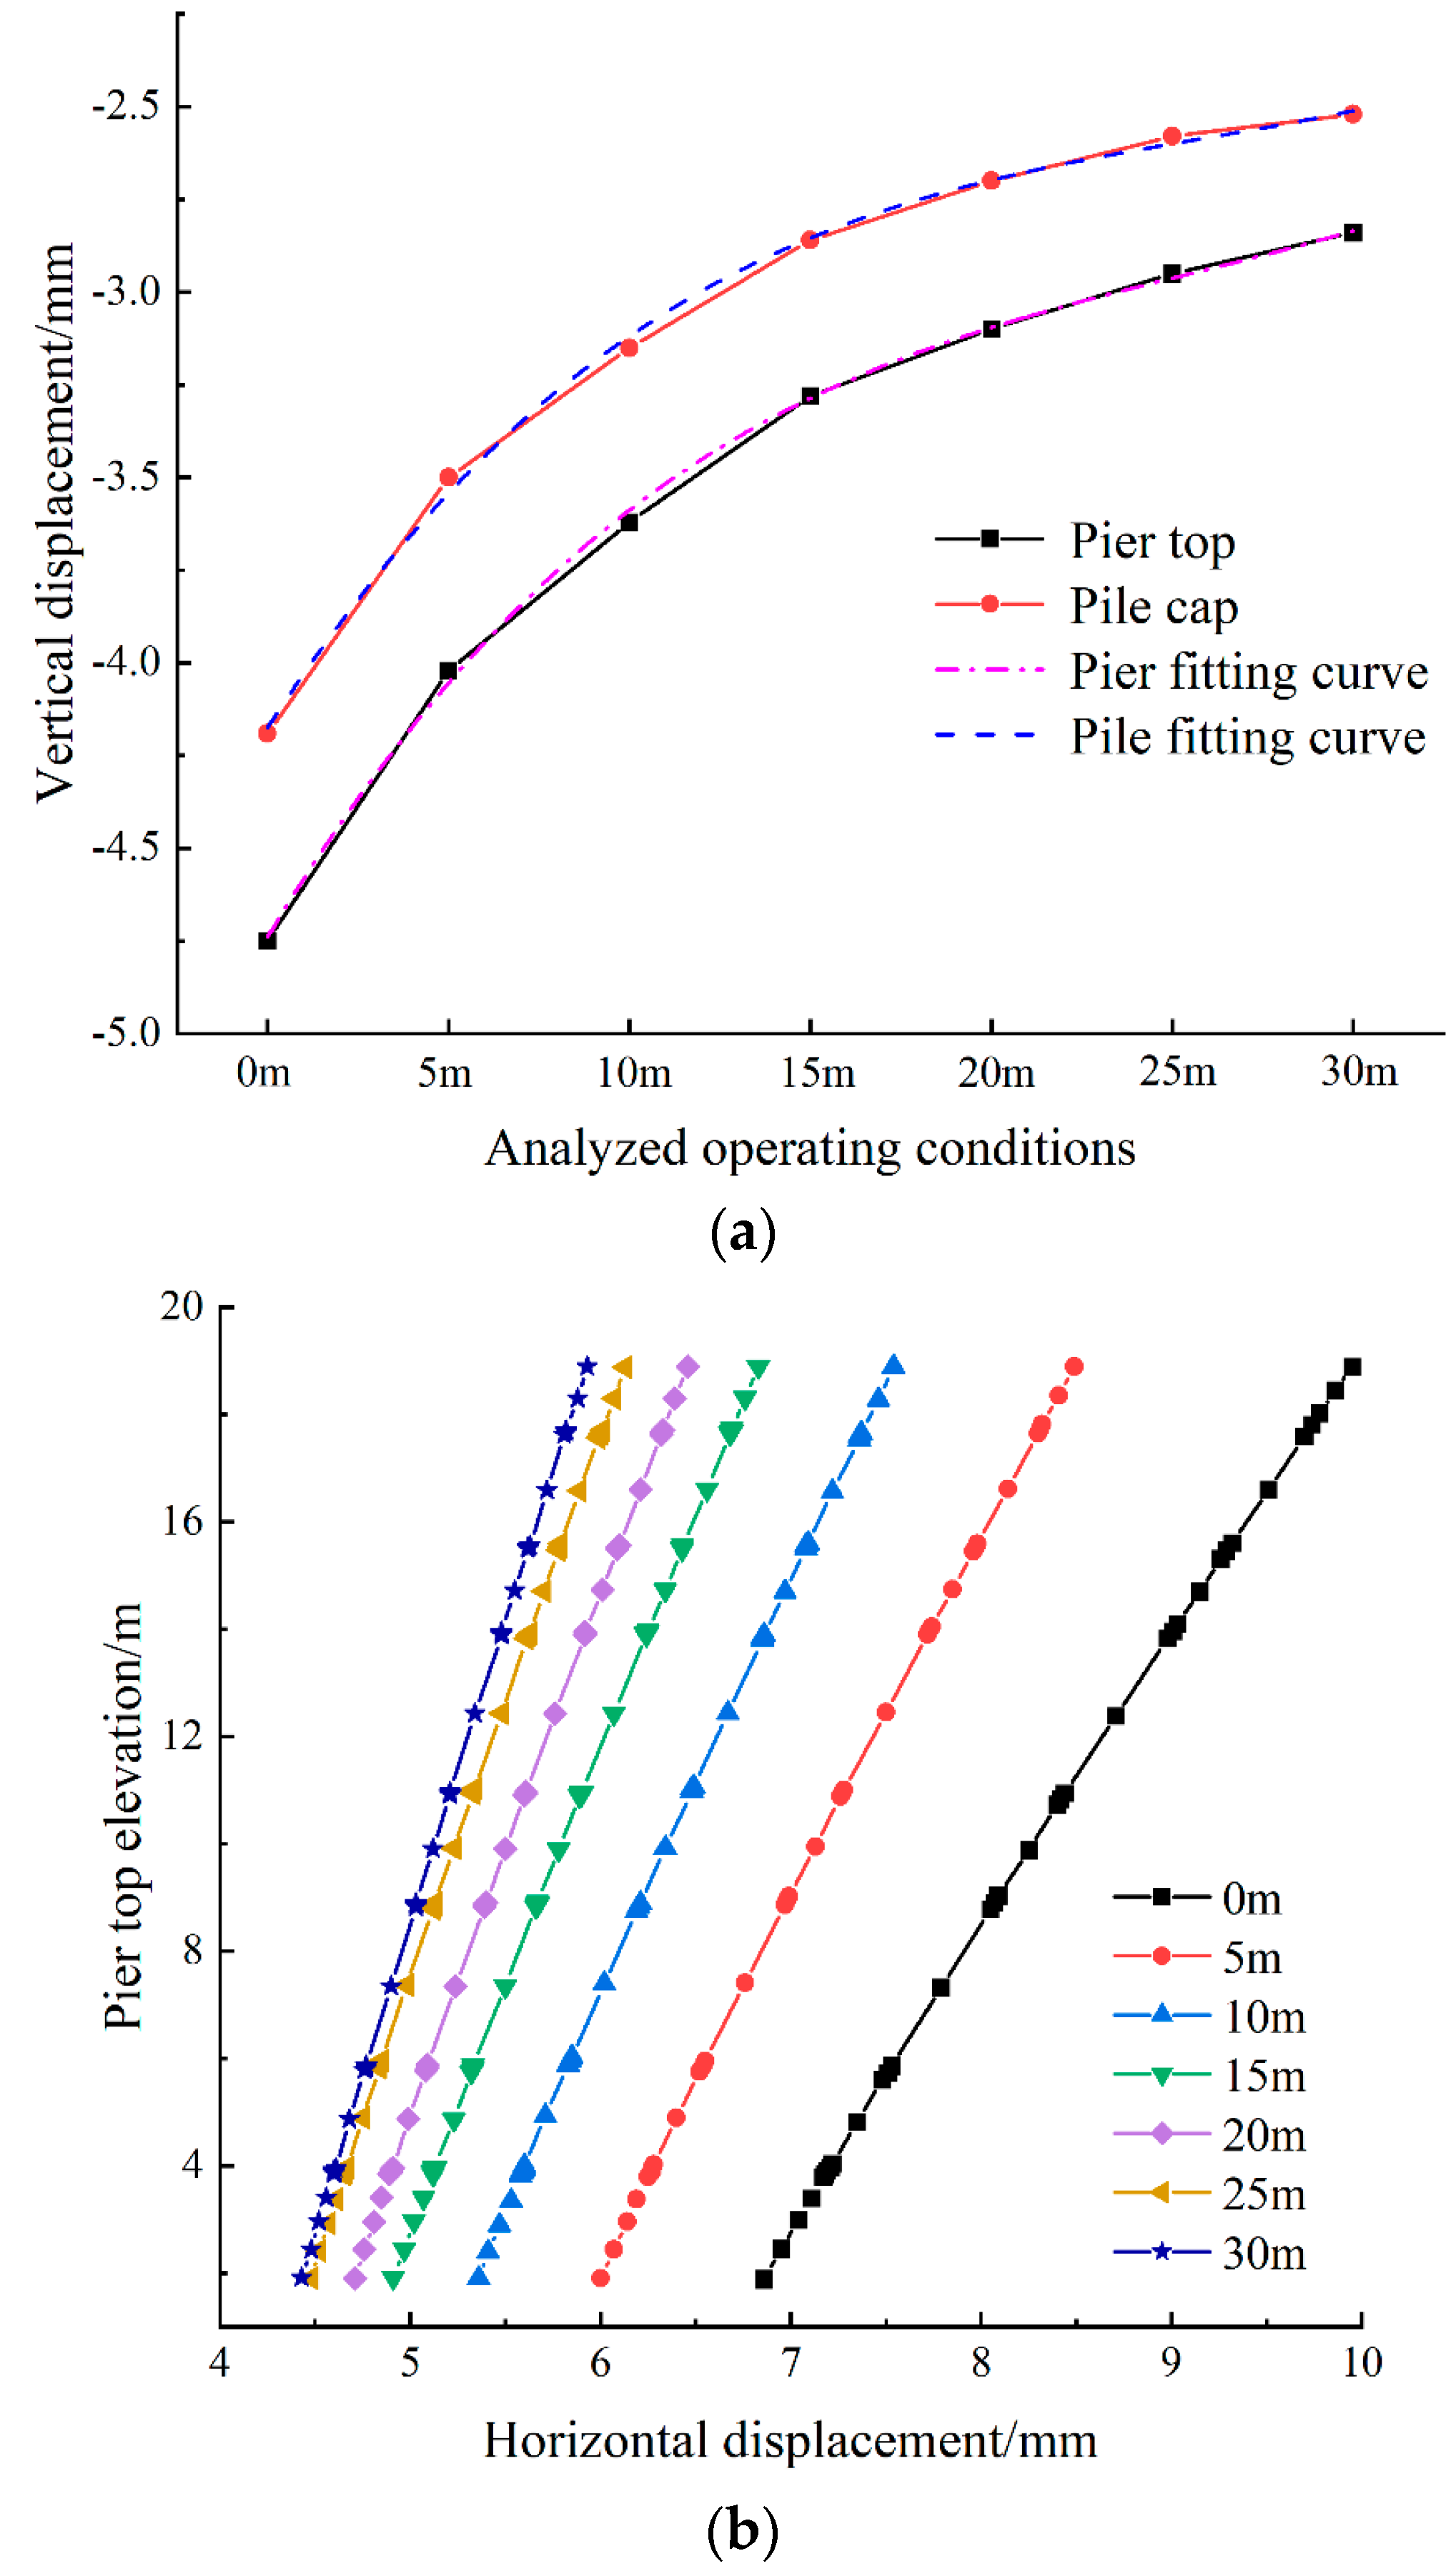
The vertical displacement and tilt rate of the pier top, as well as the vertical displacement of the pile top of elevated bridge A under different reinforcement depths, are illustrated in Figure 13. As depicted in Figure 13a, the vertical displacement at the tops of the pier and pile gradually decreased with increasing soil reinforcement depth. Deeper reinforcement depths yielded more effective control over elevated bridge displacement. The maximum vertical displacement at the pier top decreased from 4.75 mm without reinforcement to 2.84 mm, with a reduction of 40.21%, while that at the pile top decreased from 4.19 mm without reinforcement to 2.52 mm, with a reduction of 39.85%. Polynomial fitting was performed on them to establish the relationship curves of deformations at the tops of the pier and pile versus the reinforcement depth, as illustrated in Equations (1) and (2), respectively, where the x-axis is the reinforcement depth and the y-axis is the vertical displacement.
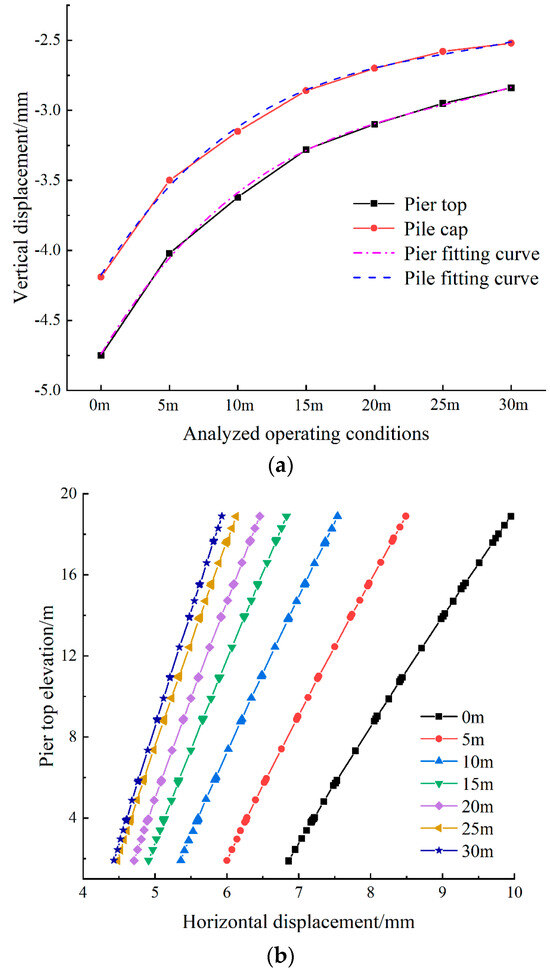
Figure 13.
Deformation of bridge pier A under different construction conditions with soil reinforcement around the foundation pit (a) Vertical displacement of the piers and pile foundations of elevated bridge A. (b) Tilt rate of pier A under different conditions.
Further analysis of the deformation curves revealed that as the reinforcement depth gradually increased, the reduction in deformation of the elevated bridge decreased. This indicated that deepening the reinforcement did not entirely mitigate the impact of excavation on the adjacent elevated bridge; instead, it tended to stabilize at a fixed value. The main reasons for this are as follows: when the reinforcement depth is increased to a certain degree, the interaction between the reinforcement and the surrounding soil reaches an equilibrium state. At this time, a further increase in the reinforcement depth provides a limited enhancement of deformation control [1] during the excavation process of the foundation pit. The soil stress will be redistributed, and the increase in the depth of the reinforcement changes the distribution of the stress to a certain degree, but when the depth of the reinforcement reaches a certain value, the contribution of the distribution of the stress reduces the contribution to deformation control. The tilt rate of the pier under various reinforcement depths is depicted in Figure 13b. As illustrated, the horizontal displacement and tilt rate of the pier gradually decreased with increasing reinforcement depth. The reduction trend was similar to that of the vertical displacement, showing a gradual attenuation. Comparison of horizontal displacements between the top and bottom of the pier revealed that the horizontal displacement at the pier top was greater than at the pier bottom, and that the horizontal displacement at the pier top was more significantly affected by changes in soil reinforcement depth than at the pier bottom. The tilt rate of the pier decreased from 0.018% without reinforcement to 0.009%, with a reduction of 50.0%.
4.2. Optimization Analysis of Soil Reinforcement around the Pier
The reinforcement schematic is displayed in Figure 14. A simulation analysis was conducted to study the impact of foundation pit excavation on the adjacent elevated bridge A under different reinforcement depths. The conditions of soil reinforcement depths are detailed in Table 7.
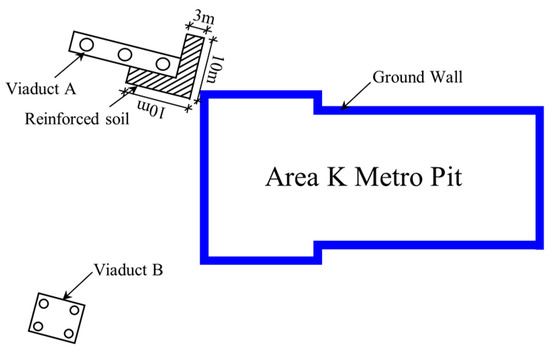
Figure 14.
Schematic diagram of soil reinforcement around the pier.
Table 7.
Soil reinforcement simulation conditions around the pier.
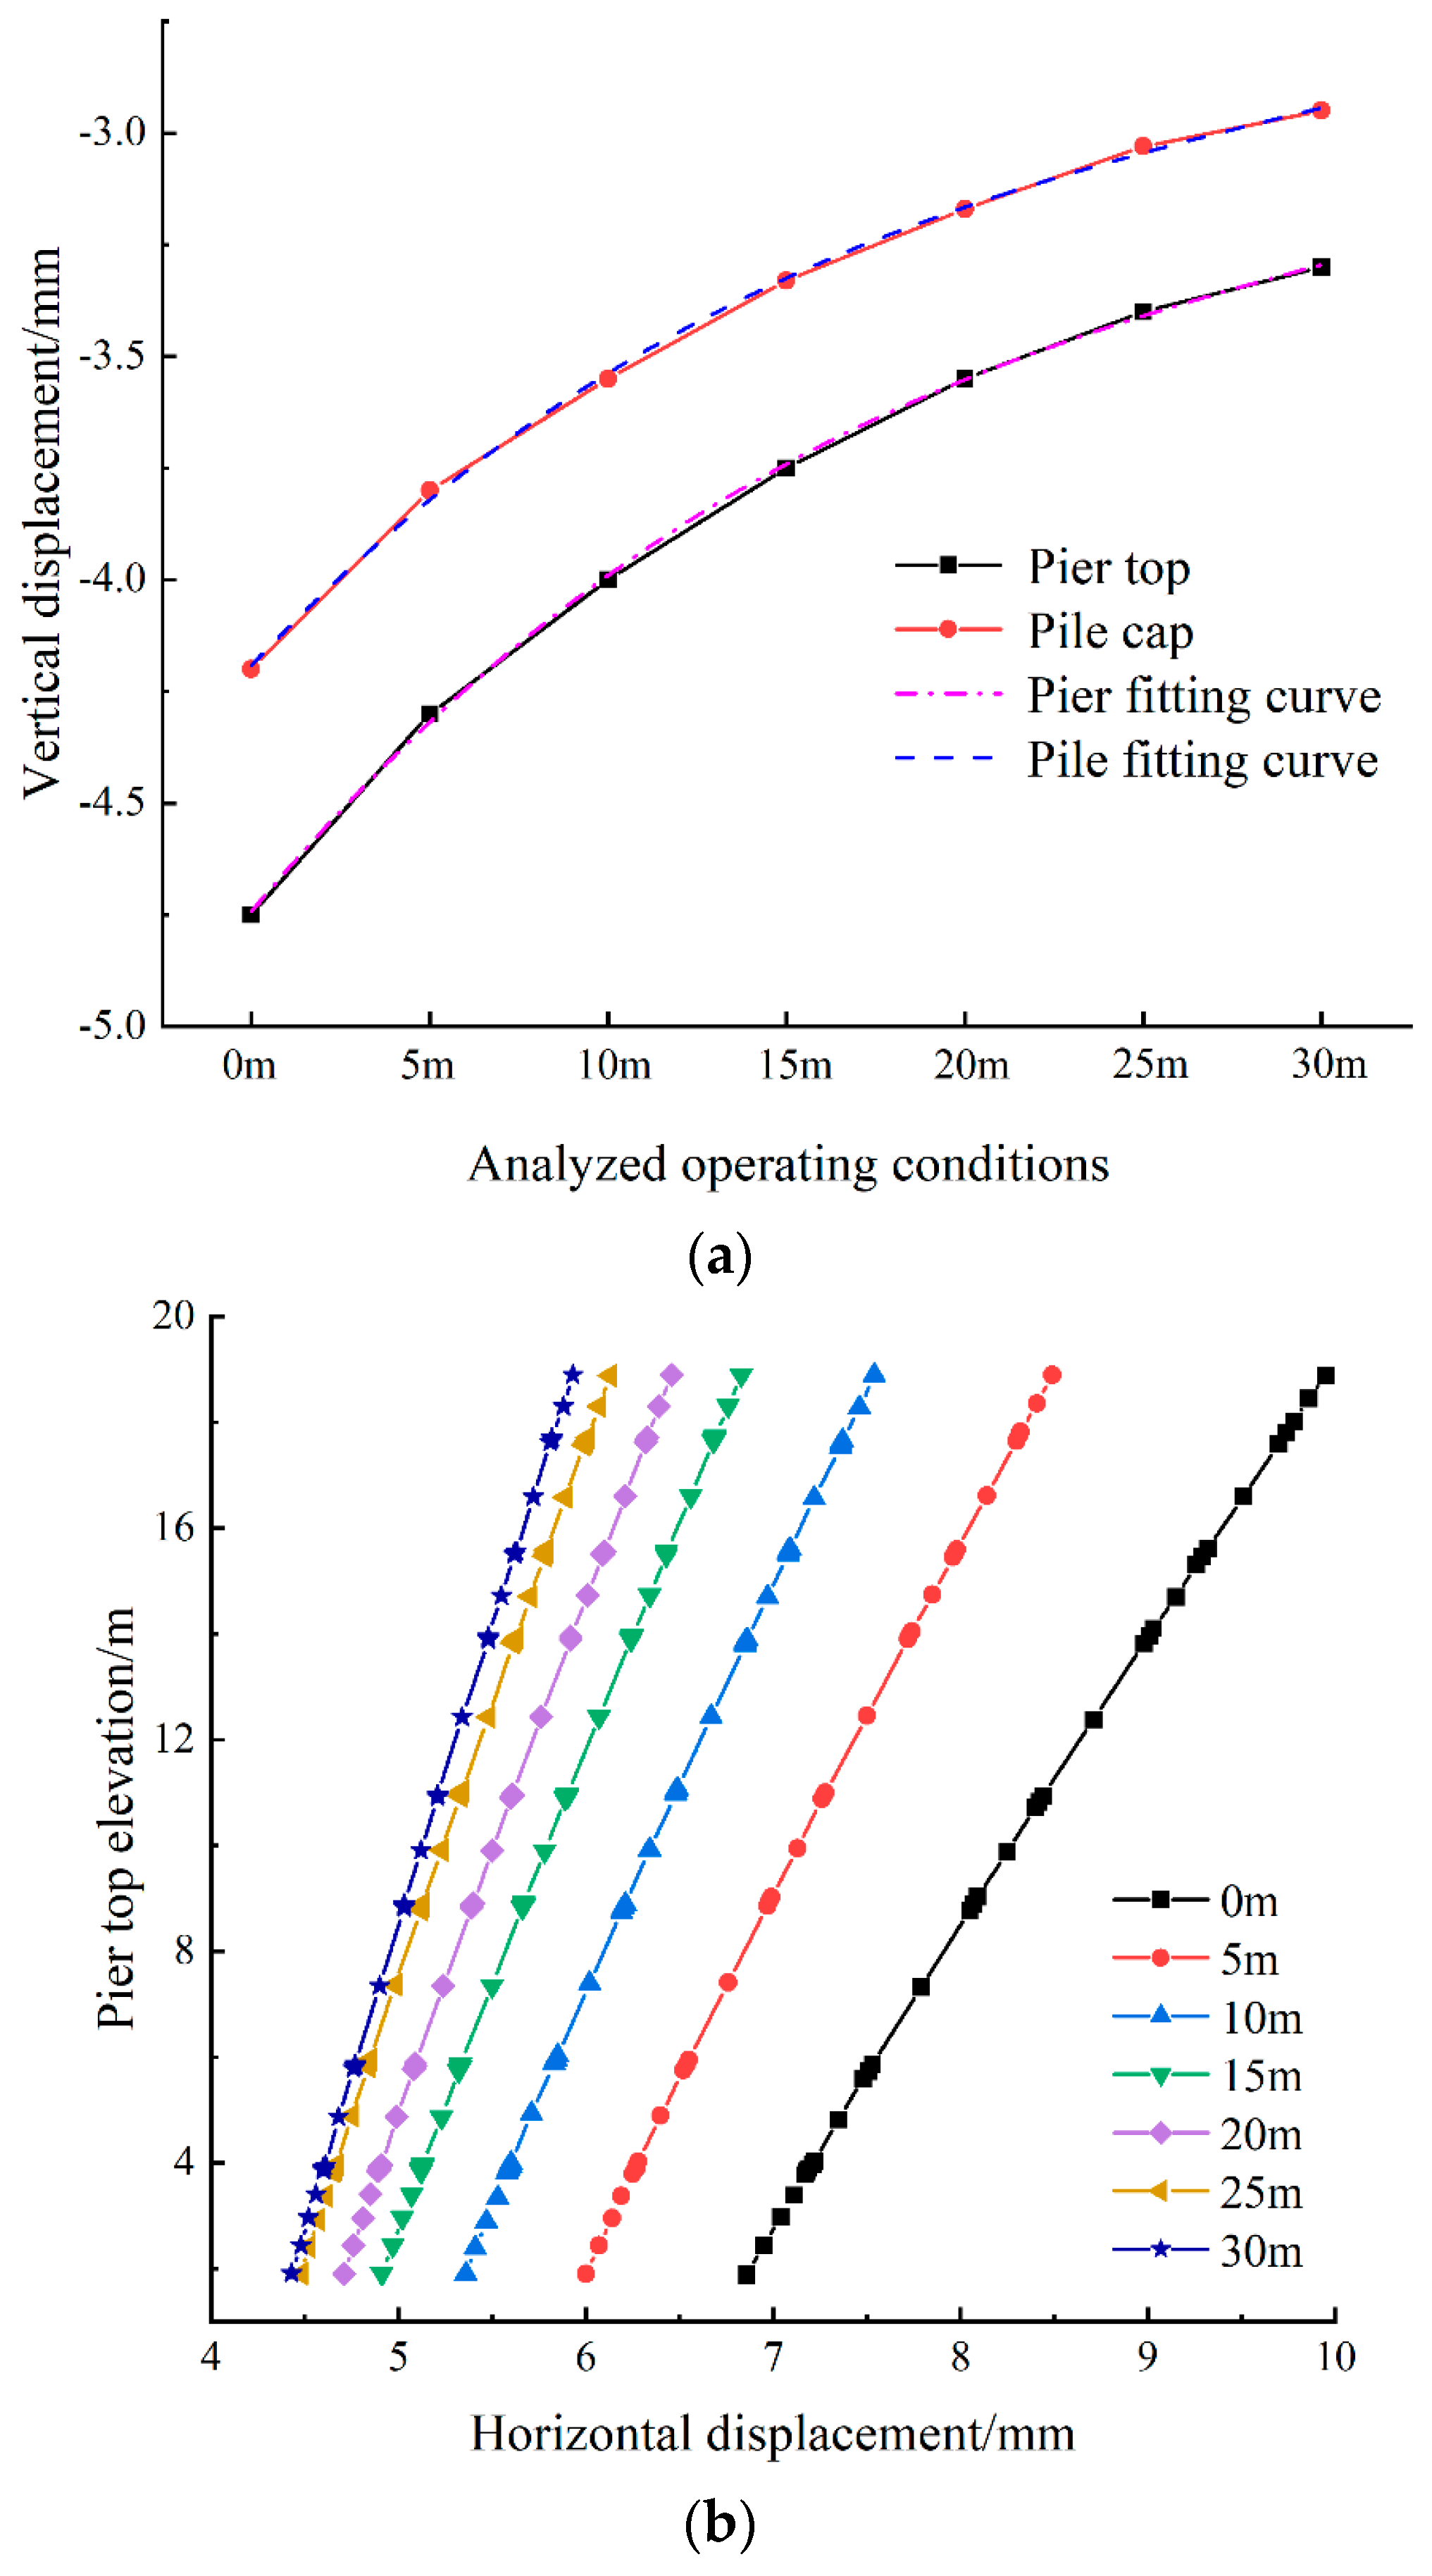
Figure 15 displays the maximum vertical displacement at the tops of piers and pile foundations, as well as the horizontal displacement of pier A under different soil reinforcement depths. Comparing Figure 15a with Figure 13a revealed that the deformation trends of pier A remained consistent for soil reinforcement around the pier and foundation pit, but soil reinforcement around the foundation pit was more effective than that around the pier. The maximum vertical displacement at the top of the pier decreased from 4.75 mm without reinforcement to 3.30 mm, with a reduction of 30.52%, while that at the top of the pile foundation decreased from 4.19 mm without reinforcement to 2.95 mm, with a reduction of 29.59%. Combining Figure 13a and Figure 15a, it can be concluded that soil reinforcement outside the pit can reduce the impact of additional stresses caused by pit excavation on the neighboring bridge piers to a certain extent, and when the reinforcement depth exceeds the excavation depth of the pit, the impact of the reinforcement depth on the neighboring elevated bridge is reduced. From the viewpoint of cost-effectiveness and practicality, it is recommended that the depth of reinforcement should be taken as the excavation depth of the foundation pit in practical construction, which is in line with the conclusion reached by (Zhang, D, 2023) [12]. Due to the specific environments and conditions of different projects, the results of this study may not be fully applicable to all situations, but the methodology and theoretical framework adopted in this study are universal and can be used as a reference for similar projects. Polynomial fitting was applied to model the maximum deformations of piers and pile foundations relative to reinforcement depth, yielding the deformation versus reinforcement depth curves, as displayed in Equations (3) and (4), where the x-axis is the reinforcement depth and the y-axis is the vertical displacement.
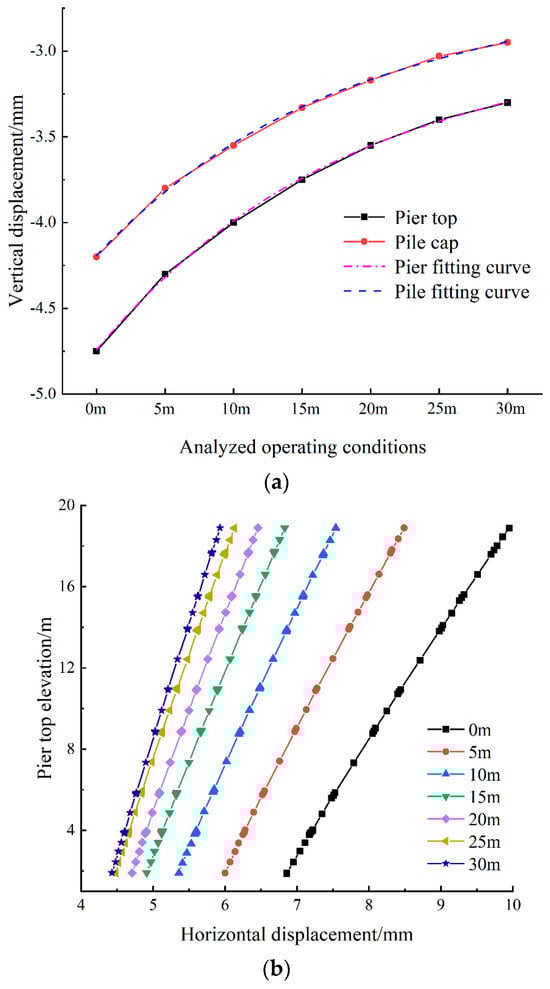
Figure 15.
Deformation of bridge pier A under different conditions with soil reinforcement around the pier. (a) Vertical displacement of the piers and pile foundations of elevated bridge A. (b) Tilt rate of pier A under different conditions.
The horizontal displacement of pier A under different soil reinforcement depths is shown in Figure 15b. As the reinforcement depth increased, the horizontal displacement of pier A gradually decreased, demonstrating a trend where the displacement at the top was greater than that at the bottom. This indicated that the deformation of the pier continued to incline towards the foundation pit, and the decreasing trend was consistent with the changes observed in vertical displacement. The sensitivity of the horizontal displacement at the pier top to changes in the soil reinforcement outside the foundation pit was greater than at the pier bottom. The tilt rate of the pier decreased from 0.018% without reinforcement to 0.012%, with a reduction of 33.33%.
4.3. Optimization Analysis of Pre-Applied Axial Force
The aforementioned study revealed it is necessary to control the vertical displacement of the elevated bridge A. In this section, the impact of foundation pit excavation on the adjacent elevated bridge A was analyzed by adjusting the pre-applied axial forces of the steel supports. The conditions of the pre-applied axial forces are summarized in Table 8.
Table 8.
Simulation conditions of pre-applied axial force.
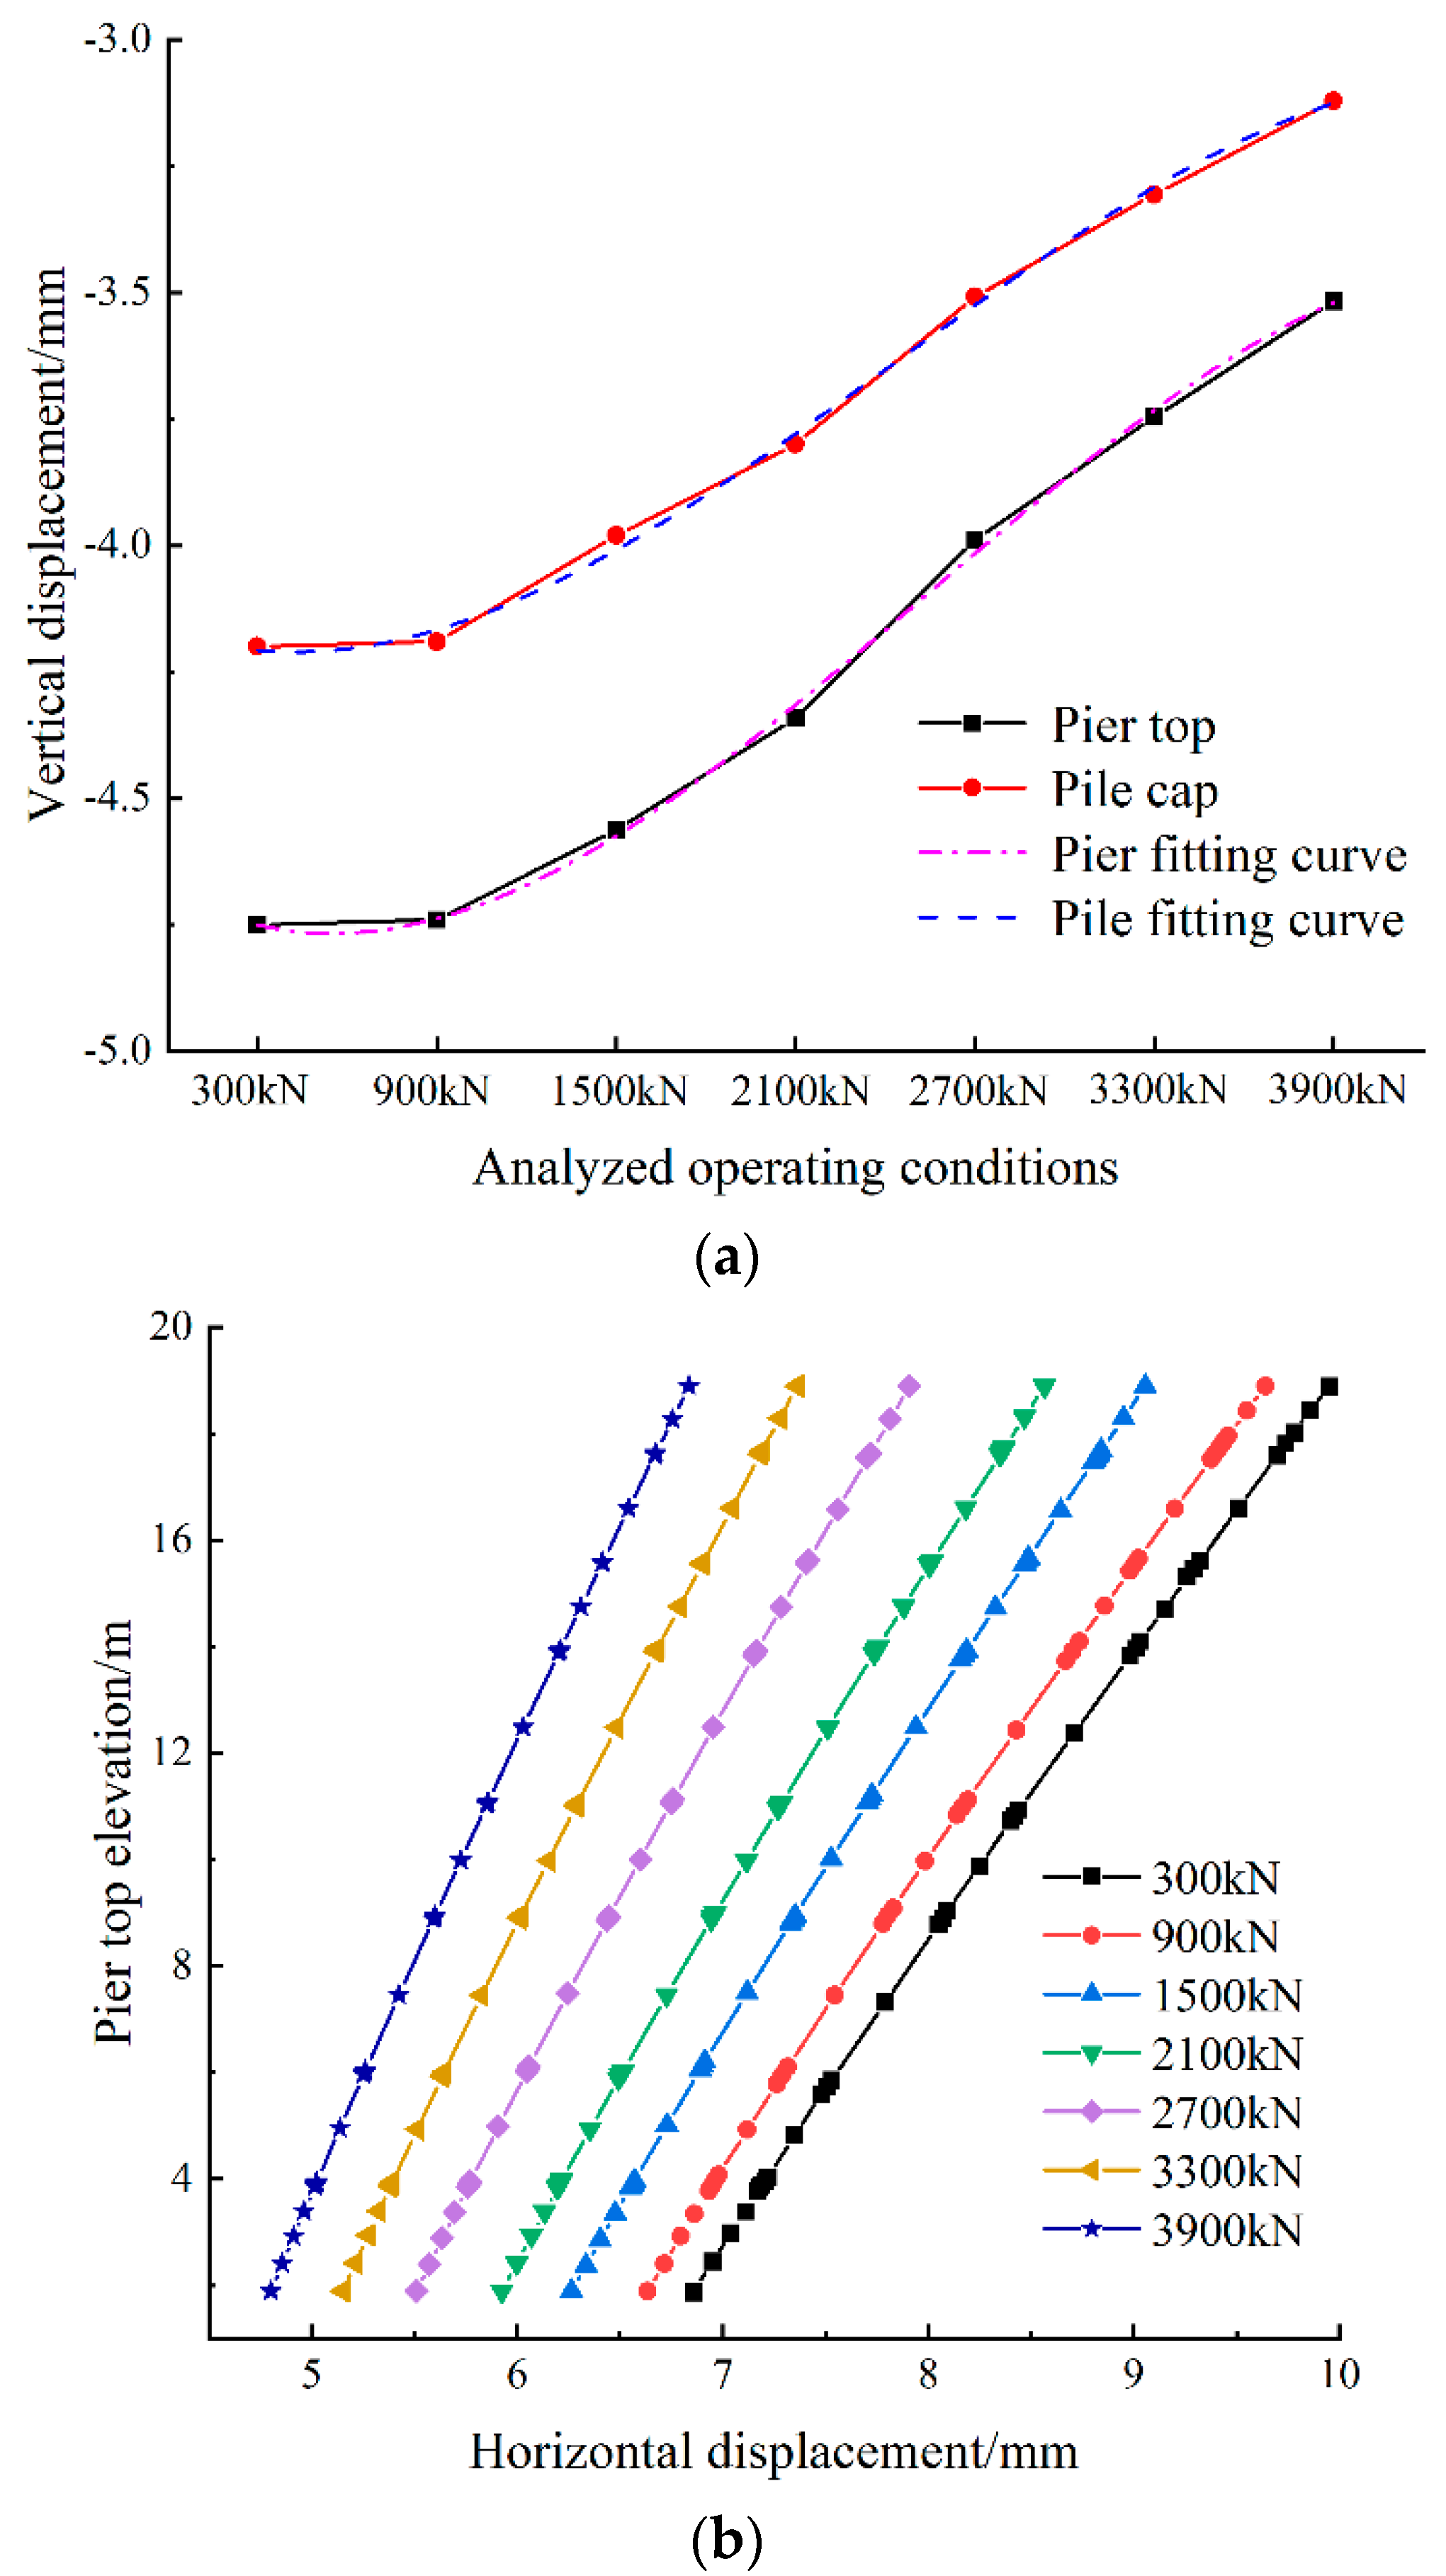
Figure 16 presents the maximum vertical displacement at the tops of piers and pile foundations, as well as the horizontal displacement of pier A under different pre-applied axial forces of the steel supports. It was observed from Figure 16a that as the pre-applied axial force of the steel supports increased, the maximum vertical displacement at the tops of piers and pile foundations gradually decreased, indicating that the greater the pre-applied axial force, the better the deformation control effect. The maximum vertical displacement at the pier top decreased from 4.75 mm without reinforcement to 3.52 mm, with a reduction of 25.89%, while that at the top of the pile foundation decreased from 4.19 mm without reinforcement to 3.12 mm, with a reduction of 25.53%. Further analysis of Figure 16a showed that at relatively low pre-applied axial force (less than 900 kN), an increase in pre-applied axial force had minimal impact on the maximum vertical displacement at the tops of piers and pile foundations. However, as the pre-applied axial force further increased (greater than 900 kN), its influence became significant. Within the studied range of maximum pre-applied axial force, the reduction in maximum vertical displacement was linearly related to the increase in pre-applied axial force. Compared to the optimized soil reinforcement scheme, increasing the pre-applied axial force was less effective, which was mainly due to the significant corner effects in the foundation pit. Considering the performance differences of equipment during construction, an appropriate pre-applied axial force should be selected based on the site conditions in actual construction. Polynomial fitting was utilized to model the maximum deformation of piers and pile foundations relative to pre-applied axial force, yielding the deformation versus pre-applied axial force curves, as shown in Equations (5) and (6), where the x-axis is the pre-applied axial force and the y-axis is the vertical displacement.
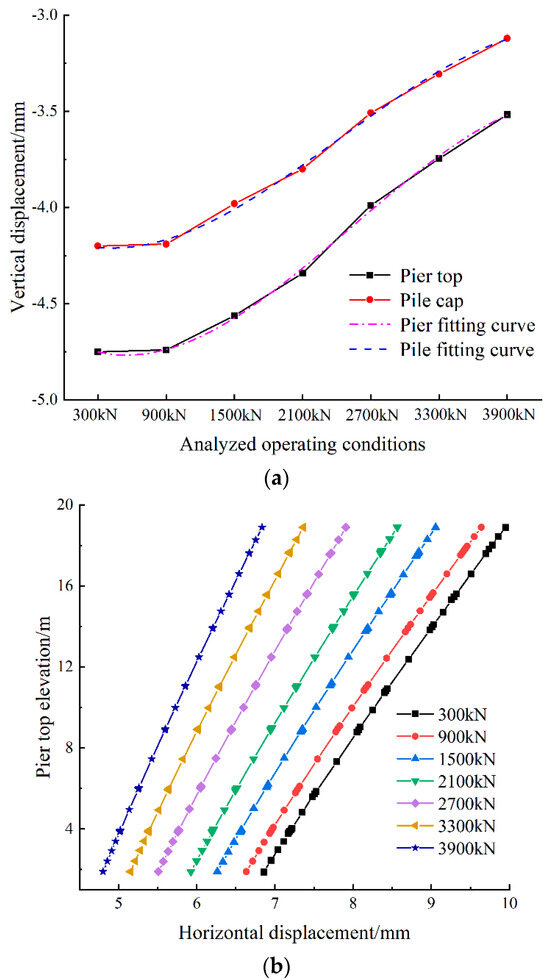
Figure 16.
Deformation of bridge pier A under different conditions with pre-applied axial force. (a) Vertical displacement of the piers and pile foundations of elevated bridge A. (b) Tilt rate of pier A under different conditions.
The horizontal displacement of pier A under different pre-applied axial forces is shown in Figure 16. As the pre-applied axial force increased, the horizontal displacement of pier A gradually decreased. A comparison of Figure 13b, Figure 15b and Figure 16b revealed that the change trends were consistent across the three cases. The tilt rate of the pier decreased from 0.018% without reinforcement to 0.012%, with a reduction of 33.33%.
5. Impact of Distance on the Pier
To further study the impact of foundation pit excavation on the deformations of piers and pile foundations of elevated bridges at different distances, the positional relationship between the pier and the foundation pit is analyzed, as illustrated in Figure 17. The model size, constitutive parameters, element type, and boundary conditions were consistent with those used for the finite element model in Section 3. Finite element modeling analysis was conducted by adjusting the horizontal distance between elevated bridge A and the foundation pit. The initial condition was that the right edge of the pier was 2 m from the subway foundation pit. Due to the spatial symmetry of the relative position between the pier and the subway foundation pit, analysis focused solely on the relative position of the upper half, which is located in the positive region of the x-axis and y-axis directions, as shown in Figure 17.
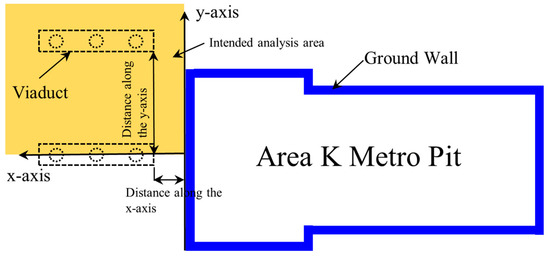
Figure 17.
Schematic diagram of the positional relationship between the pier and the pit.
5.1. Analysis of Vertical Displacement of the Elevated Bridge
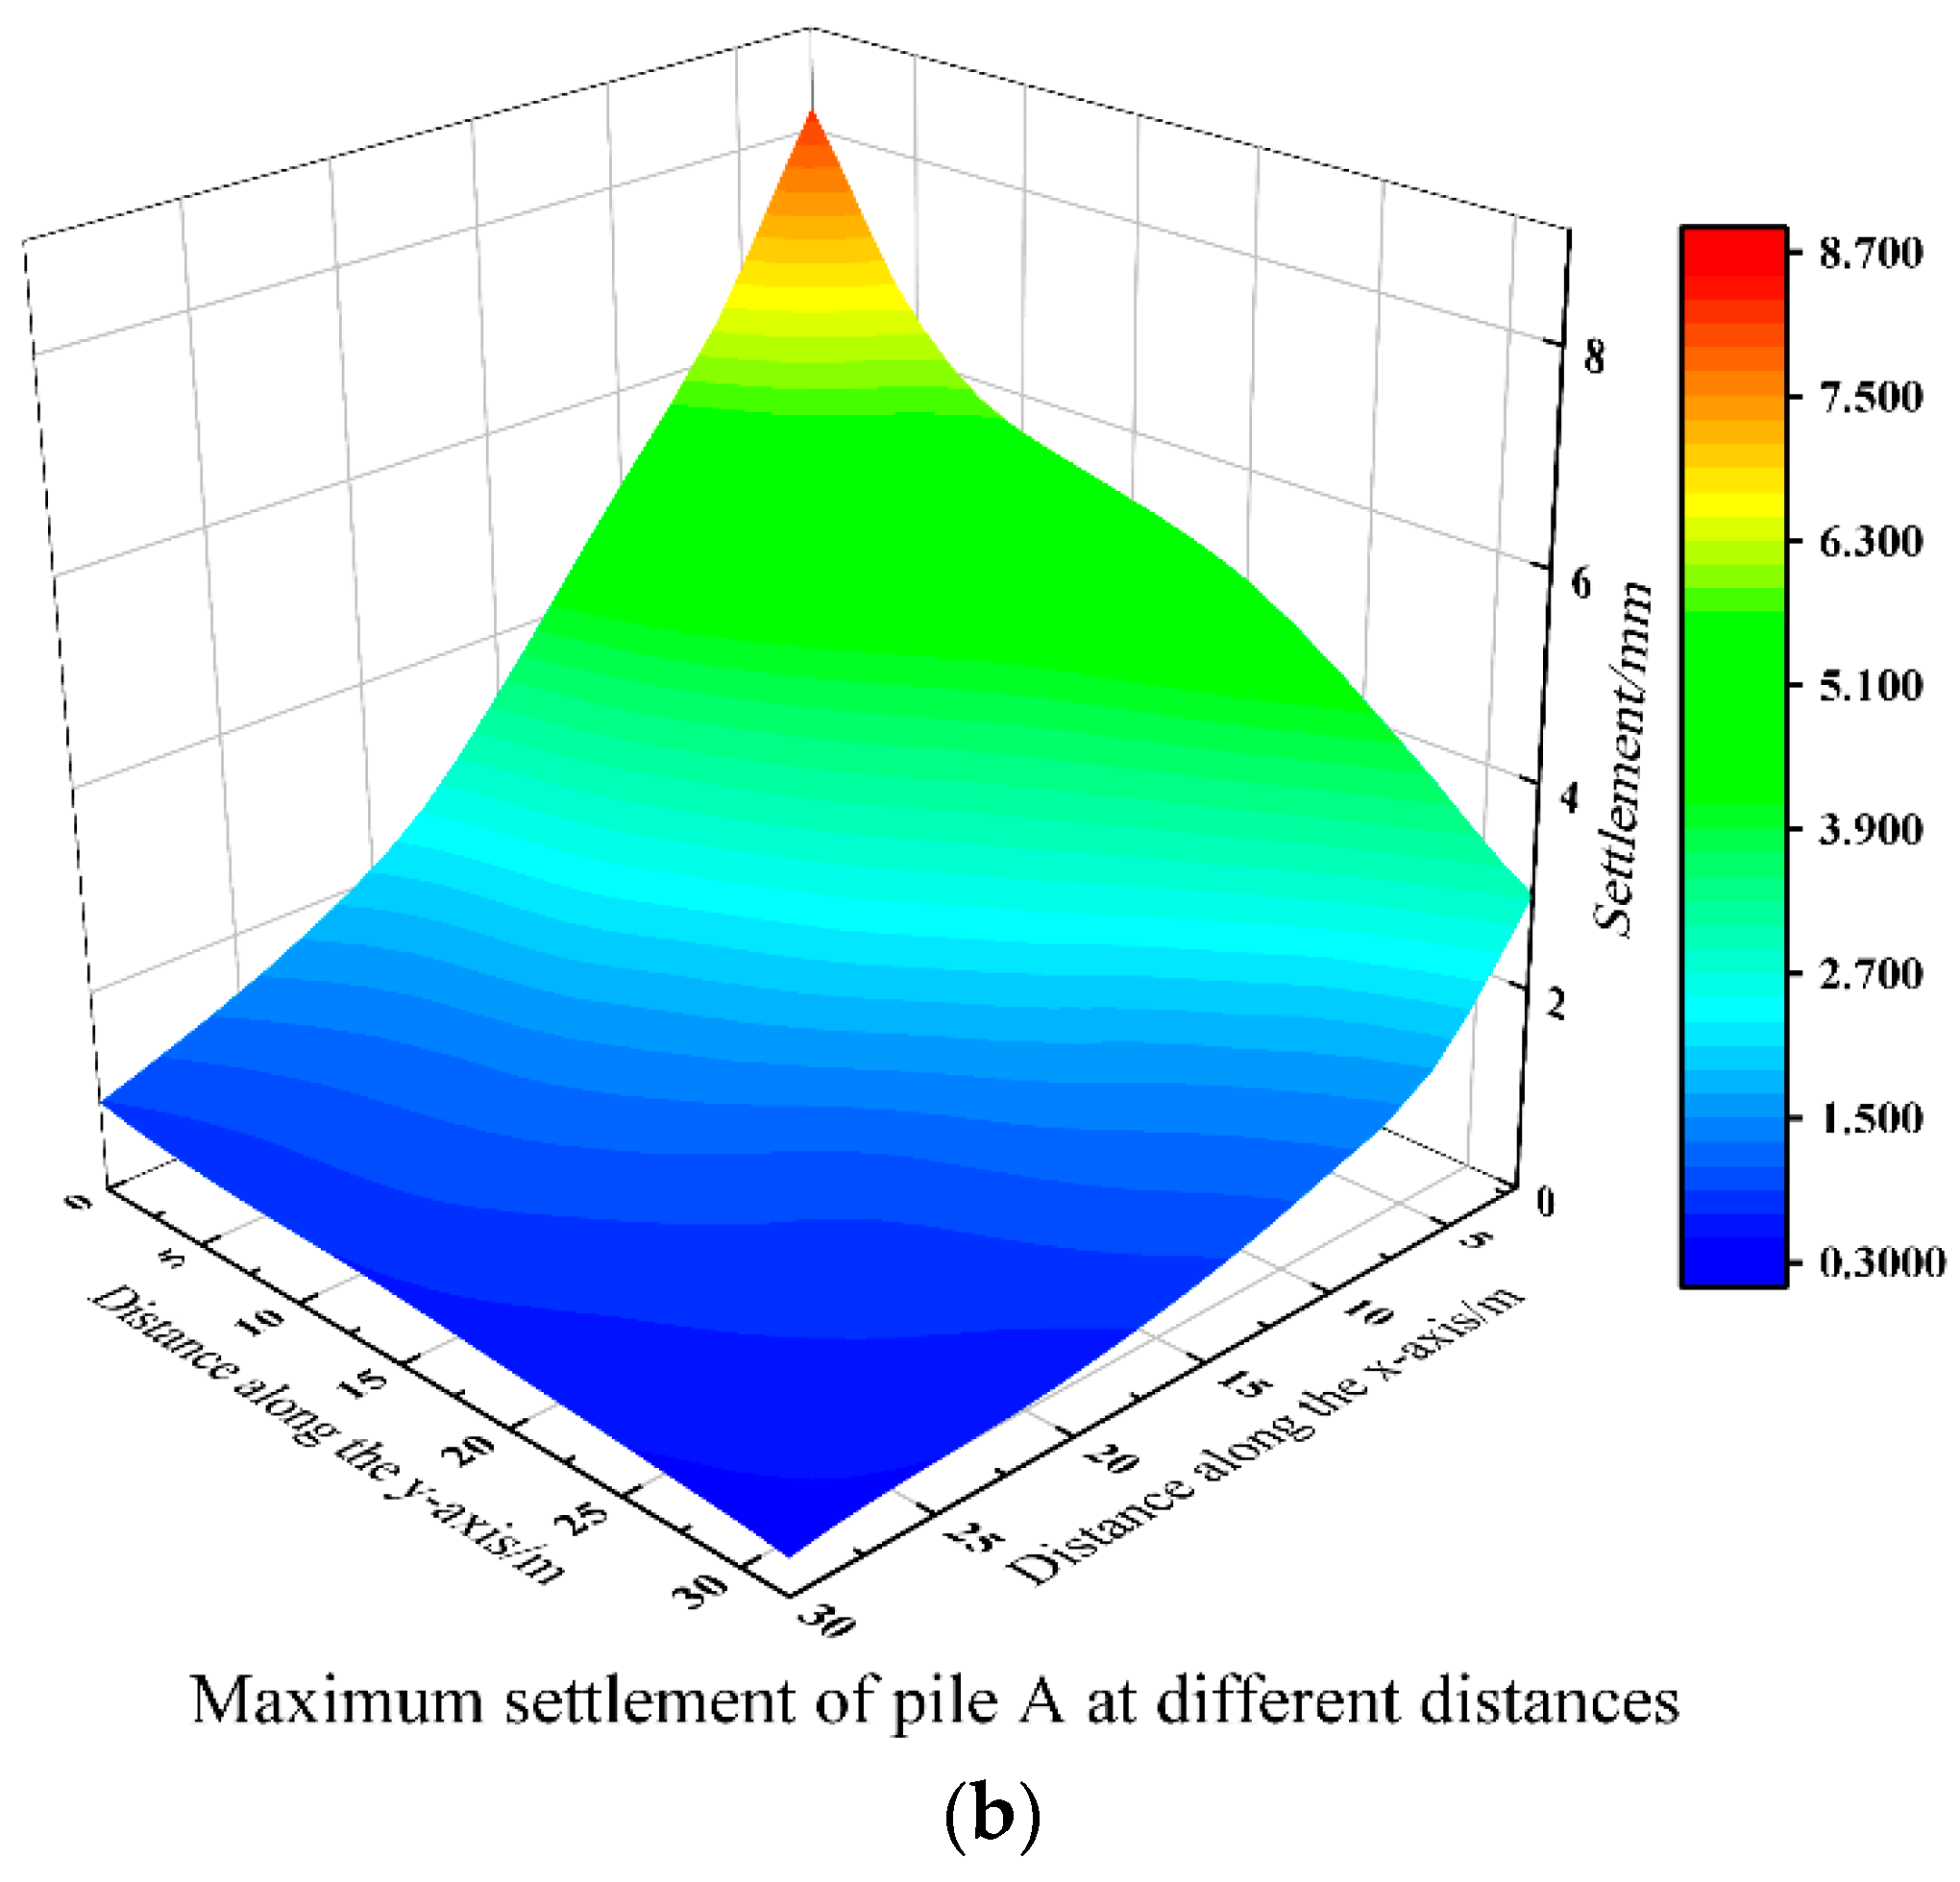
A calculation interval of 4 m was established in both the x- and y-axis directions from the foundation pit to analyze the impact of pit excavation on the adjacent elevated bridge. In the x-axis direction (perpendicular to the foundation pit), a total of eight calculation conditions were set, while in the y-axis direction (parallel to the foundation pit), a total of nine calculation conditions were set for each row. This resulted in a total of 72 different distance calculation conditions. The maximum displacements of piers and pile foundations in the x-, y-, and z-axis directions under different conditions were extracted, and their respective displacement nephograms are presented in Figure 18, Figure 19, and Figure 20, respectively.
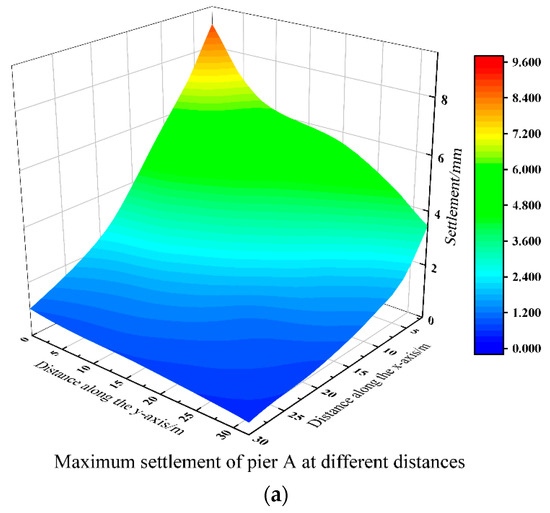

Figure 18.
Maximum settlement cloud map of piers and pile foundations at different distances. (a) Maximum settlement cloud map of the pier. (b) Maximum settlement cloud map of the pile foundation.
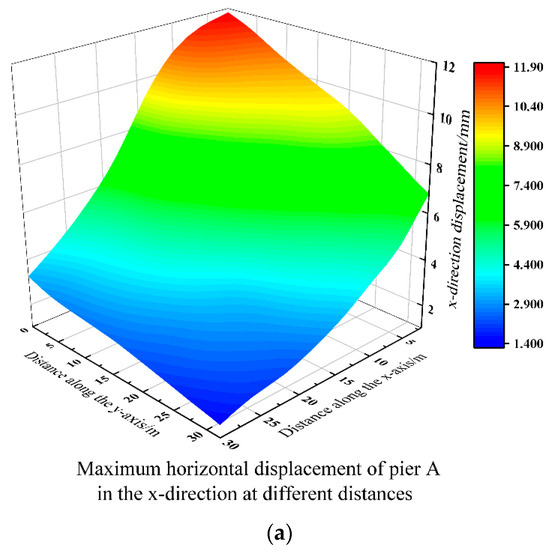
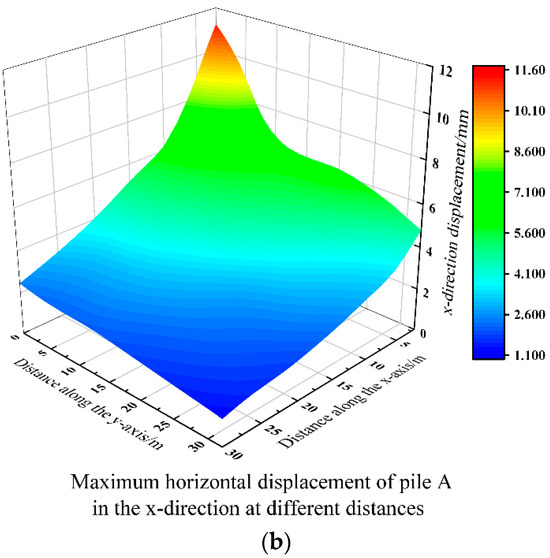
Figure 19.
Maximum horizontal displacement of piers and pile foundations in the x-axis direction at different distances. (a) Maximum horizontal displacement of the pier in the x-axis direction. (b) Maximum horizontal displacement of the pile foundation in the x-axis direction.
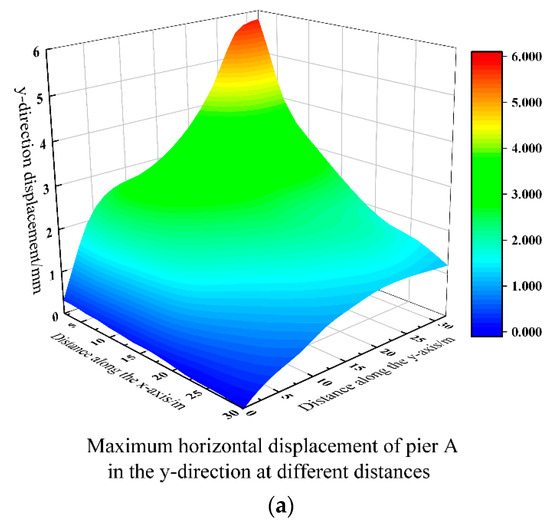

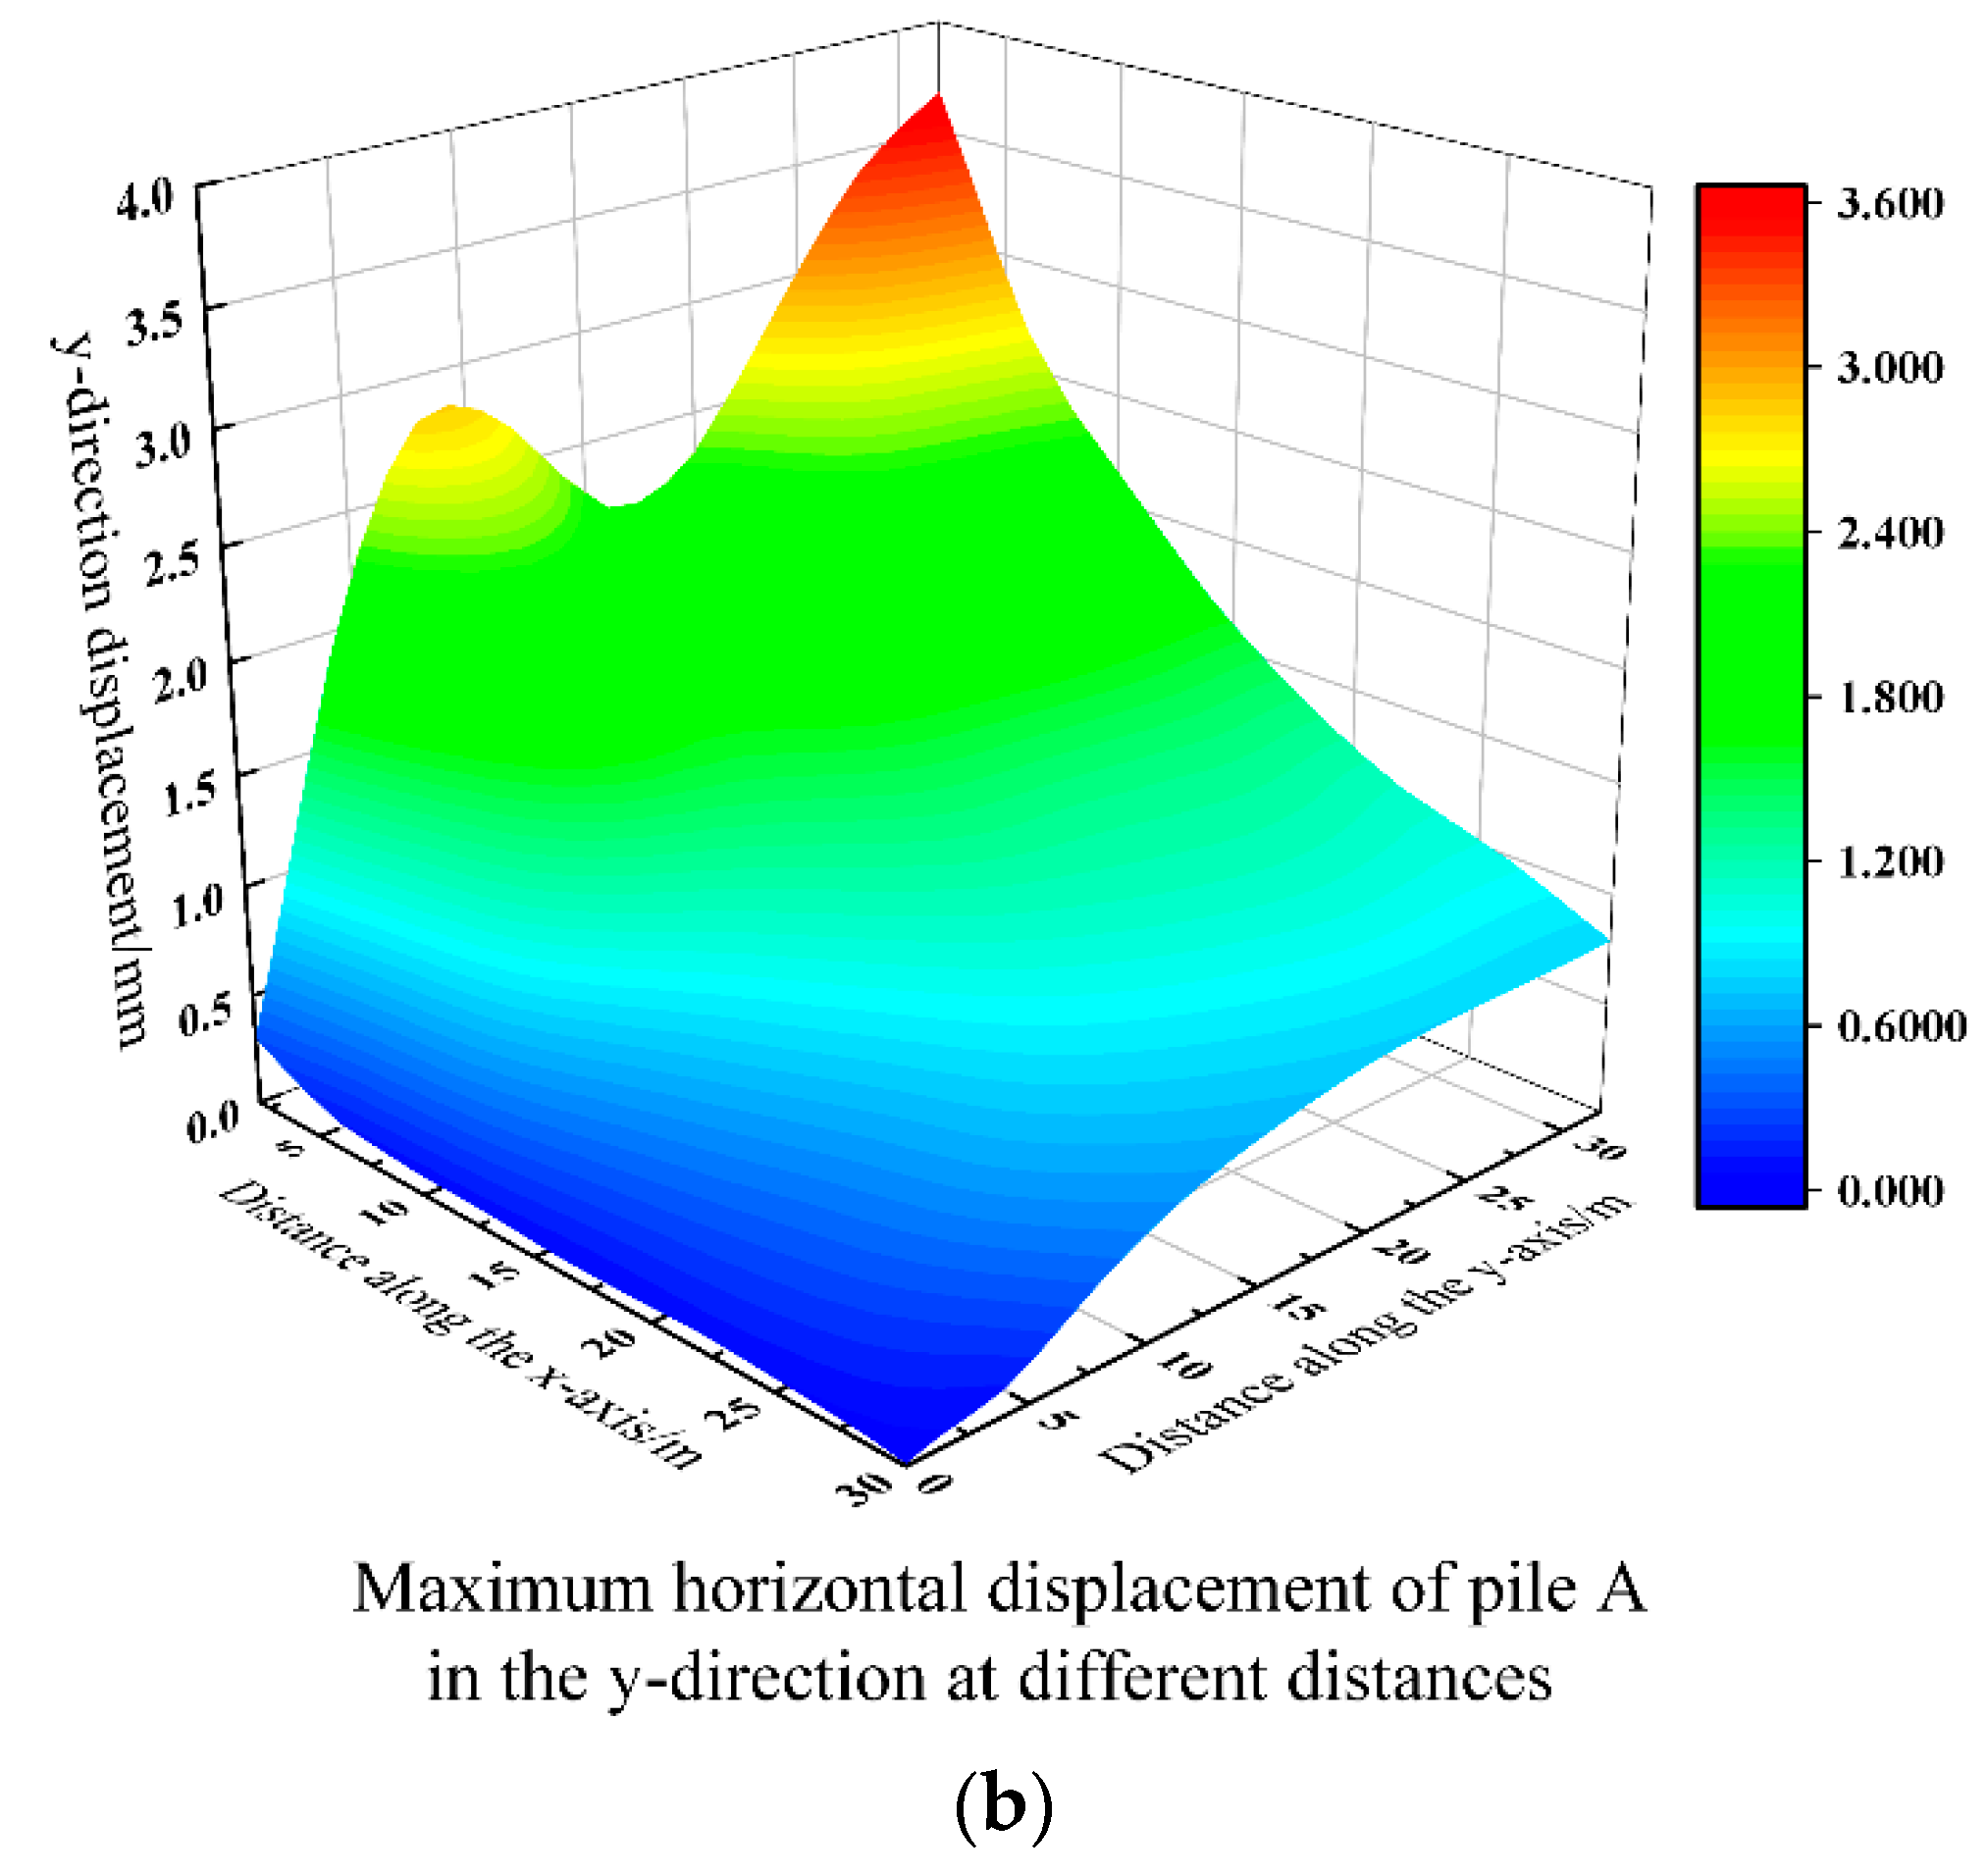
Figure 20.
Maximum horizontal displacement of piers and pile foundations in the y-axis direction at different distances. (a) Maximum horizontal displacement of the pier in the y-axis direction. (b) Maximum horizontal displacement of the pile foundation in the y-axis direction.
Analysis of the settlement nephograms in Figure 18 revealed that the maximum settlements of piers and pile foundations gradually decreased as the distance between the elevated bridge and the foundation pit increased, showing consistent trends. When the distance in the y-axis direction was fixed, the maximum settlements of piers and pile foundations gradually decreased with increasing distance in the x-axis direction. When the y-axis direction was close to the foundation pit, the settlement reduction was significant. As the distance in the y-axis direction gradually increased, the reduction in settlement gradually diminished. When the distance in the x-axis direction was fixed, the change trends of the maximum settlements of piers and pile foundations were consistent with those when the distance in the y-axis direction was fixed. The difference was that the settlement trend in the y-axis direction initially decreased sharply and then tended to level off, which was particularly evident when the distance in the x-axis direction was small. This was due to the pronounced corner effects of the foundation pit as the elevated bridge moved along the y-axis direction, as shown in Figure 21, where the elevated bridge position is 10 m from the pit x-direction and 16 m from the pit y-direction. As can be seen in Figure 19, there is a significant three-dimensional spatial effect in the deformation of the elevated bridge, which manifests itself as a smaller deformation of the pit in the position near the pit corner and a larger deformation in the middle, which is attributed to the additional constraints provided by the sidewalls at the pit corner, which have higher system stiffness. This is due to the additional constraints provided by the side walls at the corners of the pits, which have higher system stiffness, resulting in the deformation and force near the corners of the pits not being in plane strain, and the deformation at the corners of the pits tends to be smaller. This phenomenon not only affects the stability and safety of the pit itself, but also has a significant impact on the surrounding structures (e.g., elevated bridge), which also leads to significantly larger settlements of the viaduct in the center of the pit than those near the corners. The horizontal displacements of the elevated bridge in the x-axis and y-direction also have a significant pit corner effect (see Section 5.2 and Section 5.3).
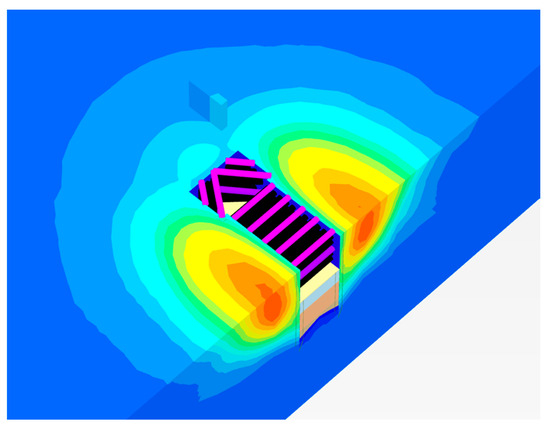
Figure 21.
Cloud map of subway deep foundation pit settlement.
5.2. Analysis of Horizontal Displacement of the Elevated Bridge in the x-Axis Direction
Figure 19 depicts the nephogram of horizontal displacement of the elevated bridge in the x-axis direction. It was revealed that the maximum horizontal displacements of piers and pile foundations gradually decreased as the distance between the elevated bridge and the foundation pit increased, but their trends were somewhat different. The horizontal displacement of the pier in the x- and y-axis directions exhibited a gradual change as it moved closer to the foundation pit. Then, as the distance increased, the horizontal displacement decreased sharply, with a more pronounced reduction observed in the x-axis direction compared to the y-axis direction. This disparity was primarily attributed to the greater impact of corner effects from the foundation pit on the y-axis direction than on the x-axis direction.
5.3. Analysis of Horizontal Displacement of the Elevated Bridge in the y-Axis Direction
Figure 20 illustrates the nephogram of horizontal displacement in the y-axis direction. It was demonstrated that the maximum horizontal displacements of piers and pile foundations generally decreased as the distance between the elevated bridge and the foundation pit increased. However, some areas exhibited a fluctuation trend where displacement initially decreased, then increased, and finally decreased. For the horizontal displacement of the pier in the y-axis direction, the deformation in the x-axis direction showed a gradual decreasing trend. In the y-axis direction, when the distance in the x-axis direction was small, the deformation sharply decreased initially, then slightly increased before sharply decreasing once more. This behavior was primarily due to the corner effects of the foundation pit. However, as the distance in the x-axis direction increased, this trend gradually weakened. Compared to the deformation trend of the piers, the pile foundations showed a similar trend in the x-axis direction, but fluctuations in the y-axis direction were more pronounced. When the distance in the x-axis direction was small, there were clearly two peak values, with the second peak consistently smaller than the first one. As the distance in the x-axis direction increased, this trend gradually diminished until it disappeared, indicating a gradual weakening of the corner effects of the foundation pit. This also meant that the elevated bridge gradually moved away from the primary influence zone into the secondary influence zone or non-influence zone.
6. Conclusions
The impact of various construction stages on the deformation and tilt rate of an adjacent elevated bridge was analyzed using numerical simulations based on a deep excavation pit at the Shaoxing High-Speed Railway North Station TOD complex. The construction process was optimized by employing soil reinforcement outside the foundation pit and the preloaded axial force. Finally, the impact of the distance between the elevated bridge and the foundation pit on the elevated bridge was summarized. The main conclusions are as follows:
6.1. Original Working Condition Simulation
- (1)
- The deformation trend of the bridge pier and bridge pile foundation is consistent: the closer the distance to the foundation pit, the larger the deformation. The maximum deformation of the bridge pier is larger than the maximum deformation of the bridge pile foundation.
- (2)
- For elevated Bridge A, the horizontal and vertical displacements of the bridge piers and bridge pile foundations gradually decrease with the increase in distance from the foundation pit. The vertical displacement in the z-axis direction is the most obvious change, with a reduction rate as high as 63.72%~79.49%. The change in the y-axis direction is the second, with a reduction rate of 9.90%~15.70%. The change in the x-axis direction is the least obvious, with a reduction rate of only 1.06%~1.86%.
- (3)
- With the excavation of the foundation pit, the horizontal displacement, vertical displacement, and tilt rate of elevated Bridge A gradually increase with the increase in the excavation depth, in which the maximum horizontal displacement of the bridge pile foundation in the x-axis direction is 5.66 mm; the maximum horizontal displacement in the y-axis direction is 2.03 mm; the maximum vertical displacements of the top of the bridge piers and the top of the bridge pile foundation are 4.75 mm and 4.19 mm, respectively; and the maximum tilt rate of the bridge piers is 0.018%.
6.2. Reinforcement Optimization Analysis
- (1)
- With the increase in the depth of soil reinforcement outside the pit, the vertical displacement and tilt rate of the bridge pier and the bridge pile foundation are gradually reduced, and the deeper the depth of reinforcement, the better the displacement control effect of the elevated bridge.
- (2)
- When the depth of reinforcement is close to the excavation depth, increasing the depth of reinforcement, the control effect of deformation growth is not obvious. It is recommended that the depth of reinforcement is taken as the best excavation depth of the pit in the actual construction, in which using pit peripheral soil reinforcement is better than using the soil around the bridge pier in controlling the deformation.
- (3)
- In controlling the deformation of the surrounding environment caused by the excavation of the foundation pit, the preloaded axial force is the worst, mainly because the preloaded axial force is subjected to the pit angle effect is obvious. Therefore, in the actual construction, the appropriate preloaded axial force should be selected according to the site conditions.
6.3. Influence of Distance on Bridge Piers
- (1)
- The deformation of bridge piers and bridge pile foundations on the whole presents a trend of gradual reduction with the increase in the distance of the viaduct from the pit. The two trends remain consistent.
- (2)
- When the elevated bridge is closer to the foundation pit, it will be affected by the pit angle effect, and the fluctuation of horizontal displacement in the y-axis direction is more significant than the fluctuation of horizontal displacement in the x-axis direction and vertical displacement in the z-axis direction. This indicates that the pit angle effect is more significant to the horizontal displacement in the y-axis direction.
Author Contributions
Conceptualization, X.T. and J.W.; methodology, J.Y.; software, F.F.; validation, G.L. and X.T.; formal analysis, X.T.; investigation, C.X.; resources, J.W.; data curation, J.Y.; writing—original draft preparation, F.F.; writing—review and editing, G.L.; visualization, H.D.; supervision, X.T.; project administration, J.W.; funding acquisition, C.X. All authors have read and agreed to the published version of the manuscript.
Funding
National Key R&D Program of China: 2023YFC3009400; The National Natural Science Foundation of China: 52238009.
Data Availability Statement
Data is contained within the article.
Conflicts of Interest
Author Jiangpeng Wu and Junping Yu are employed by the Jiangxi Transportation Research Institute Co., Ltd. Author Fuguan Fang is employed by the Zhejiang Infrastructure Construction Group Co., Ltd. The remaining authors declare that the research was conducted in the absence of any commercial or financial relationships that could be construed as a potential conflict of interest.
References
- Chen, H.; Li, J.; Yang, C.; Wang, X. A theoretical study on ground surface settlement induced by a braced deep excavation. Eur. J. Environ. Civ. Eng. 2020, 24, 1234–1249. [Google Scholar] [CrossRef]
- Lin, Z.; Jiang, Y.; Xiong, Y.; Xu, C.; Guo, Y.; Wang, C.; Fang, T. Analytical solution for displacement-dependent active earth pressure considering the stiffness of cantilever retaining structure in cohesionless soil. Comput. Geotech. 2024, 170, 106258. [Google Scholar] [CrossRef]
- Song, S.; Wang, P.; Yin, Z.; Cheng, Y.P. Micromechanical modeling of hollow cylinder torsional shear test on sand using discrete element method. J. Rock Mech. Geotech. Eng. 2024. [Google Scholar] [CrossRef]
- Wang, P.; Xu, C.; Yin, Z.Y.; Song, S.X.; Xu, C.; Dai, S. A DEM-based Generic Modeling Framework for Hydrate-Bearing Sediments. Comput. Geotech. 2024, 171, 106287. [Google Scholar] [CrossRef]
- Wang, P.; Yin, Z.Y.; Hicher, P.Y.; Cui, Y.J. Micro—Mechanical analysis of one—Dimensional compression of clay with DEM. Int. J. Numer. Anal. Methods Geomech. 2023, 47, 2706–2724. [Google Scholar] [CrossRef]
- Wang, T.; Wang, P.; Yin, Z.Y.; Laouafa, F.; Hicher, P.Y. Hydro-mechanical analysis of particle migration in fractures with CFD-DEM. Eng. Geol. 2024, 335, 107557. [Google Scholar] [CrossRef]
- Delo, G.; Civera, M.; Lenticchia, E.; Miraglia, G.; Surace, C.; Ceravolo, R. Interferometric satellite data in structural health monitoring: An application to the effects of the construction of a subway line in the urban area of Rome. Appl. Sci. 2022, 12, 1658. [Google Scholar] [CrossRef]
- Lei, M.; Lin, D.; Huang, Q.; Wang, X. Research on the construction risk control technology of shield tunnel underneath an operational railway in sand pebble formation: A case study. Eur. J. Environ. Civ. Eng. 2018, 22, 657–673. [Google Scholar] [CrossRef]
- Li, D.; Yan, C. Building deformation prediction based on ground surface settlements of metro-station deep excavation. Adv. Civ. Eng. 2018, 2018, 1–10. [Google Scholar] [CrossRef]
- Zhou, Z.; Ding, H.; Miao, L.; Li, Y. Predictive model for the surface settlement caused by the excavation of twin tunnels. Tunn. Undergr. Space Technol. 2021, 108, 103730. [Google Scholar] [CrossRef]
- Song, D.; Chen, Z.; Dong, L.; Zhou, Q. Monitoring analysis of influence of extra-large complex deep foundation pit on adjacent environment: A case study of Zhengzhou City. China. Geomat. Nat. Hazards Risk 2020, 11, 1165–1178. [Google Scholar] [CrossRef]
- Zhang, D. Influences of deep foundation pit excavation on the stability of adjacent ancient buildings. Buildings 2023, 13, 123–134. [Google Scholar] [CrossRef]
- Xue, H. Research on the control of excavation deformation of super deep foundation pit adjacent to the existing old masonry structure building. Sustainability 2023, 15, 1432. [Google Scholar] [CrossRef]
- Xu, C.J.; Yang, K.F.; Fan, X.Z.; Li, M. Numerical investigation on instability of buildings caused by adjacent deep excavation. J. Perform. Constr. Facil. 2021, 35, 04021065. [Google Scholar] [CrossRef]
- Wang, Q.; Qingtao, W.; Haoyong, Q. Analysis of impact of bilateral deep foundation pit excavation on adjacent existing station. IOP Conf. Ser. Earth Environ. Sci. 2019, 240, 052007. [Google Scholar] [CrossRef]
- Huang, J.; Liu, J.; Guo, K.; Wu, C.; Yang, S.; Luo, M.; Lu, Y. Numerical Simulation Study on the Impact of Deep Foundation Pit Excavation on Adjacent Rail Transit Structures—A Case Study. Buildings 2024, 14, 1853. [Google Scholar] [CrossRef]
- Zhang, X.; Wei, G.; Jiang, C. The study for longitudinal deformation of adjacent shield tunnel due to foundation pit excavation with consideration of the retaining structure deformation. Symmetry 2020, 12, 1507. [Google Scholar] [CrossRef]
- Wang, S.; Wang, W.; Yang, H.; Zhao, J. Study on the influence of adjacent double deep foundation pit excavation sequence on existing tunnel deformation based on HSS constitutive model. Appl. Sci. 2024, 14, 2347. [Google Scholar] [CrossRef]
- Gui, Y.; Zhao, Z.; Qin, X.; Wang, L. Study on deformation law of deep foundation pit with the top-down method and its influence on adjacent subway tunnel. Adv. Civ. Eng. 2020, 2020, 1–15. [Google Scholar] [CrossRef]
- Niu, Y.; Wang, Q.; Ma, F. Study on the influence of foundation pit excavation on the deformation of adjacent subway tunnel in the affected area of fault zones. Sustainability 2023, 15, 2012. [Google Scholar] [CrossRef]
- Liu, J.; Shi, C.; Cao, C.; Zhou, Y. Improved analytical method for pile response due to foundation pit excavation. Comput. Geotech. 2020, 117, 103303. [Google Scholar] [CrossRef]
- Zhong, W.; Huang, N.; Nie, N.; Ding, H.; Gao, F. Study on the Influence of Excavation of Superlarge and Ultra—Deep Foundation Pits on the Pile Foundation of Existing Viaducts. Adv. Civ. Eng. 2023, 2023, 5834958. [Google Scholar] [CrossRef]
- Jiang, Z.; Zhu, S.; Que, X.; Ge, X. Deformation Effects of Deep Foundation Pit Excavation on Retaining Structures and Adjacent Subway Stations. Buildings 2024, 14, 2521. [Google Scholar] [CrossRef]
- Jia, Y.; Shang, Y.; Du, J.; Dang, H. Study on the Control Effect of Pretreatment Measures on the Deformation of Subway Caused by the Excavation of Foundation Pit. In Proceedings of the International Conference on Civil Engineering, Singapore, 24–26 March 2023; Springer Nature Singapore: Singapore, 2023; pp. 683–690. [Google Scholar]
- Feng, S.; Lei, H.; Wan, Y.; Li, W. Influencing factors and control measures of excavation on adjacent bridge foundation based on analytic hierarchy process and finite element method. Front. Struct. Civ. Eng. 2021, 15, 789–799. [Google Scholar] [CrossRef]
- Yang, Y.B.; Chen, C.Y.; Liu, C.; Zhang, Z. Performance of a deep excavation and the influence on adjacent piles: A case history in karst region covered by clay and sand. Undergr. Space 2023, 8, 45–60. [Google Scholar] [CrossRef]
- Yang, Y.; Li, J.; Liu, C.; Wang, S. Influence of deep excavation on adjacent bridge piles considering underlying karst cavern: A case history and numerical investigation. Acta Geotech. 2021, 16, 2453–2471. [Google Scholar] [CrossRef]
- Gu, R.; Zhan, L.; Fang, Y. Model test on the effect of the new undersea tunnel in Macao on the existing Ponte Governador Nobre de Carvalho. Arab. J. Geosci. 2022, 15, 1–14. [Google Scholar] [CrossRef]
- Miao, Y.; Guo, M.; Zhao, X.; Zhang, H. Study on influence of shallow buried tunnel excavation on adjacent bridge piles. Geotech. Geol. Eng. 2023, 41, 3457–3470. [Google Scholar] [CrossRef]
- Huang, J.; Yan, J.; Guo, K.; Yang, X.; Peng, S.; Wu, C. Study on the Impact of Deep Foundation Pit Construction on Nearby Elevated Structures—Case Study. Buildings 2024, 14, 2541. [Google Scholar] [CrossRef]
- DG/TJ08-109-2017; Urban Rail Transit Design Standard. Tongji University Press: Shanghai, China, 2017.
- DBJT08-115-2010; Technical Standards for Safety Protection Areas of Urban Bridges and Tunnels. Tongji University Press: Shanghai, China, 2010.


Disclaimer/Publisher’s Note: The statements, opinions and data contained in all publications are solely those of the individual author(s) and contributor(s) and not of MDPI and/or the editor(s). MDPI and/or the editor(s) disclaim responsibility for any injury to people or property resulting from any ideas, methods, instructions or products referred to in the content. |
© 2024 by the authors. Licensee MDPI, Basel, Switzerland. This article is an open access article distributed under the terms and conditions of the Creative Commons Attribution (CC BY) license (https://creativecommons.org/licenses/by/4.0/).