Article

Experimental Study on the Mechanical Properties of Rock–Concrete Composite Specimens under Cyclic Loading

1
China Anergy Group Third Engineering Bureau Co., Ltd., Chengdu 610036, China
2
School of Civil Engineering and Architecture, Chongqing University of Science and Technology, Chongqing 401331, China
3
Chengdu Sunvison Intelligent Technology Co., Ltd., Chengdu 610065, China
*
Author to whom correspondence should be addressed.
Buildings 2024, 14(3), 854; https://doi.org/10.3390/buildings14030854
Submission received: 5 March 2024 / Revised: 16 March 2024 / Accepted: 19 March 2024 / Published: 21 March 2024
(This article belongs to the Special Issue Building Foundation Analysis: Soil–Structure Interaction)

Abstract

:
The foundations of bridges and other tall buildings are often subjected to cyclic loads. Therefore, it is essential to investigate the mechanical properties of rock–concrete composite foundations under cyclic loads. In this paper, uniaxial cyclic loading and unloading tests were conducted on rock–concrete composite specimens using the TFD-2000 microcomputer servo-controlled rock triaxial testing machine. The stress–strain curves, elastic modulus variation, and energy dissipation were analyzed. The results showed that the stress–strain curves of composite specimens under uniaxial cyclic loading and unloading conditions formed hysteresis loops. The hysteresis loop exhibited a sparse–dense–sparse pattern under the upper stress of 27.44 MPa, which was 90% of the uniaxial strength. The elastic modulus, as well as the dissipated energy, decreased rapidly in the first few cycles and then gradually decreased at a constant rate, with the upper stress increasing to 27.44 MPa. Both the elastic modulus and the dissipated energy exhibited an accelerated stage before specimen failure. The primary failure mode of the composite specimen was split failure from concrete to sandstone. A damage variable was derived to better reflect the laws governing the damage evolution of the composite under cyclic loads.

1. Introduction

Building foundations are often composed of both concrete and rock, especially in areas with complex geological conditions. The interaction between the concrete foundation and the underlying rock foundation plays a critical role in the overall stability of the structure. However, the mechanical properties of the rock–concrete composite system under cyclic loads, such as those experienced during earthquakes or other dynamic events, are not well understood. Therefore, it is important to investigate the behavior of rock and concrete composite specimens under cyclic loads to enhance the design and construction of building foundations.
Numerous scholars have studied the effects of cyclic loading on the mechanical properties of rock masses in recent decades [1]. Based on the type of loading applied to rocks, the cyclic loading tests can be classified as cyclic uniaxial or triaxial compressive tests, cyclic tensile tests, cyclic shear tests, and cyclic flexural tests [2]. In the research field of rock fatigue characteristics, it has been found that factors such as loading frequency, temperature, stress amplitude, and cycle number in cyclic loading and unloading tests mainly affect the strength of rock mass [3,4,5]. With more in-depth research, many scholars have become concerned about fatigue damage [6,7,8] and the energy dissipation mechanism [9,10,11] of rock during cyclic loading. Sun et al. [12] deduced a damage variable according to the strength characteristics and energy evolution law in the cyclic loading process. Meng et al. [13] found that the energy density and hysteresis energy variation in different loading conditions show a decrease in the first few cycles and then start to increase up to failure. In addition, different types of experimental techniques, such as optics and acoustics, have been employed to observe the failure process of rock materials during cyclic loading.
As early as 1934, O. Graf and E. Brenner [14] began to study the effect of loading frequency on the fatigue life of concrete. Since then, numerous scholars have conducted experimental, theoretical, and numerical modeling studies on the cyclic loading behavior of concrete. Most of these studies have focused on common concrete [15,16,17], reinforced concrete [18,19], recycled concrete [20], and foamed concrete [21]. Cook et al. [15] conducted a pioneering study on the impact of sustained constant load and fatigue loading history on the compressive strength of common concrete and revealed that the application of a constant load leads to an increase in both the compressive strength and elastic modulus of concrete. Bian et al. [18] conducted uniaxial compression tests on basalt-fiber-reinforced concrete (BFRC) specimens with five different strength grades to investigate their stress–strain relationship. Feng et al. [21] investigated the dynamic mechanical properties and damage characteristics of lightweight foamed concrete under impact loading. They found that the material’s dynamic mechanical properties showed a significant strain rate enhancement effect and density dependence.
In recent years, there has been growing interest in the study of the cyclic loading mechanical properties of composite specimens, which are composed of concrete and other materials. Researchers have conducted experiments to investigate the behavior of such composite materials under dynamic loading conditions, aiming to understand their response to cyclic loading and its implications for engineering practice. He et al. [22] examined the cyclic loading test properties of composite laminated beams and found that the stiffness of the specimen, which failed in the cyclic loading test, decreased by about 30%, while the bearing capacity decreased by about 10%. Zhang et al. [23] investigated the cyclic behavior of FRP–concrete–steel double-skin tubular columns under a combined loading condition of axial compression and cyclic lateral loading.
Despite efforts in the field of rocks, concrete, and composite materials, there is still a lack of comprehensive understanding of the behavior of rock and concrete composite specimens under cyclic loading, particularly in the context of building foundation systems. Therefore, this study aims to contribute to the existing body of knowledge by investigating the mechanical properties of composite specimens under cyclic loading. By doing so, the study aims to offer valuable insights into the behavior of rock and concrete composite foundations under dynamic loading conditions and to enhance the design and construction of building foundations in practice.

2. Materials and Method

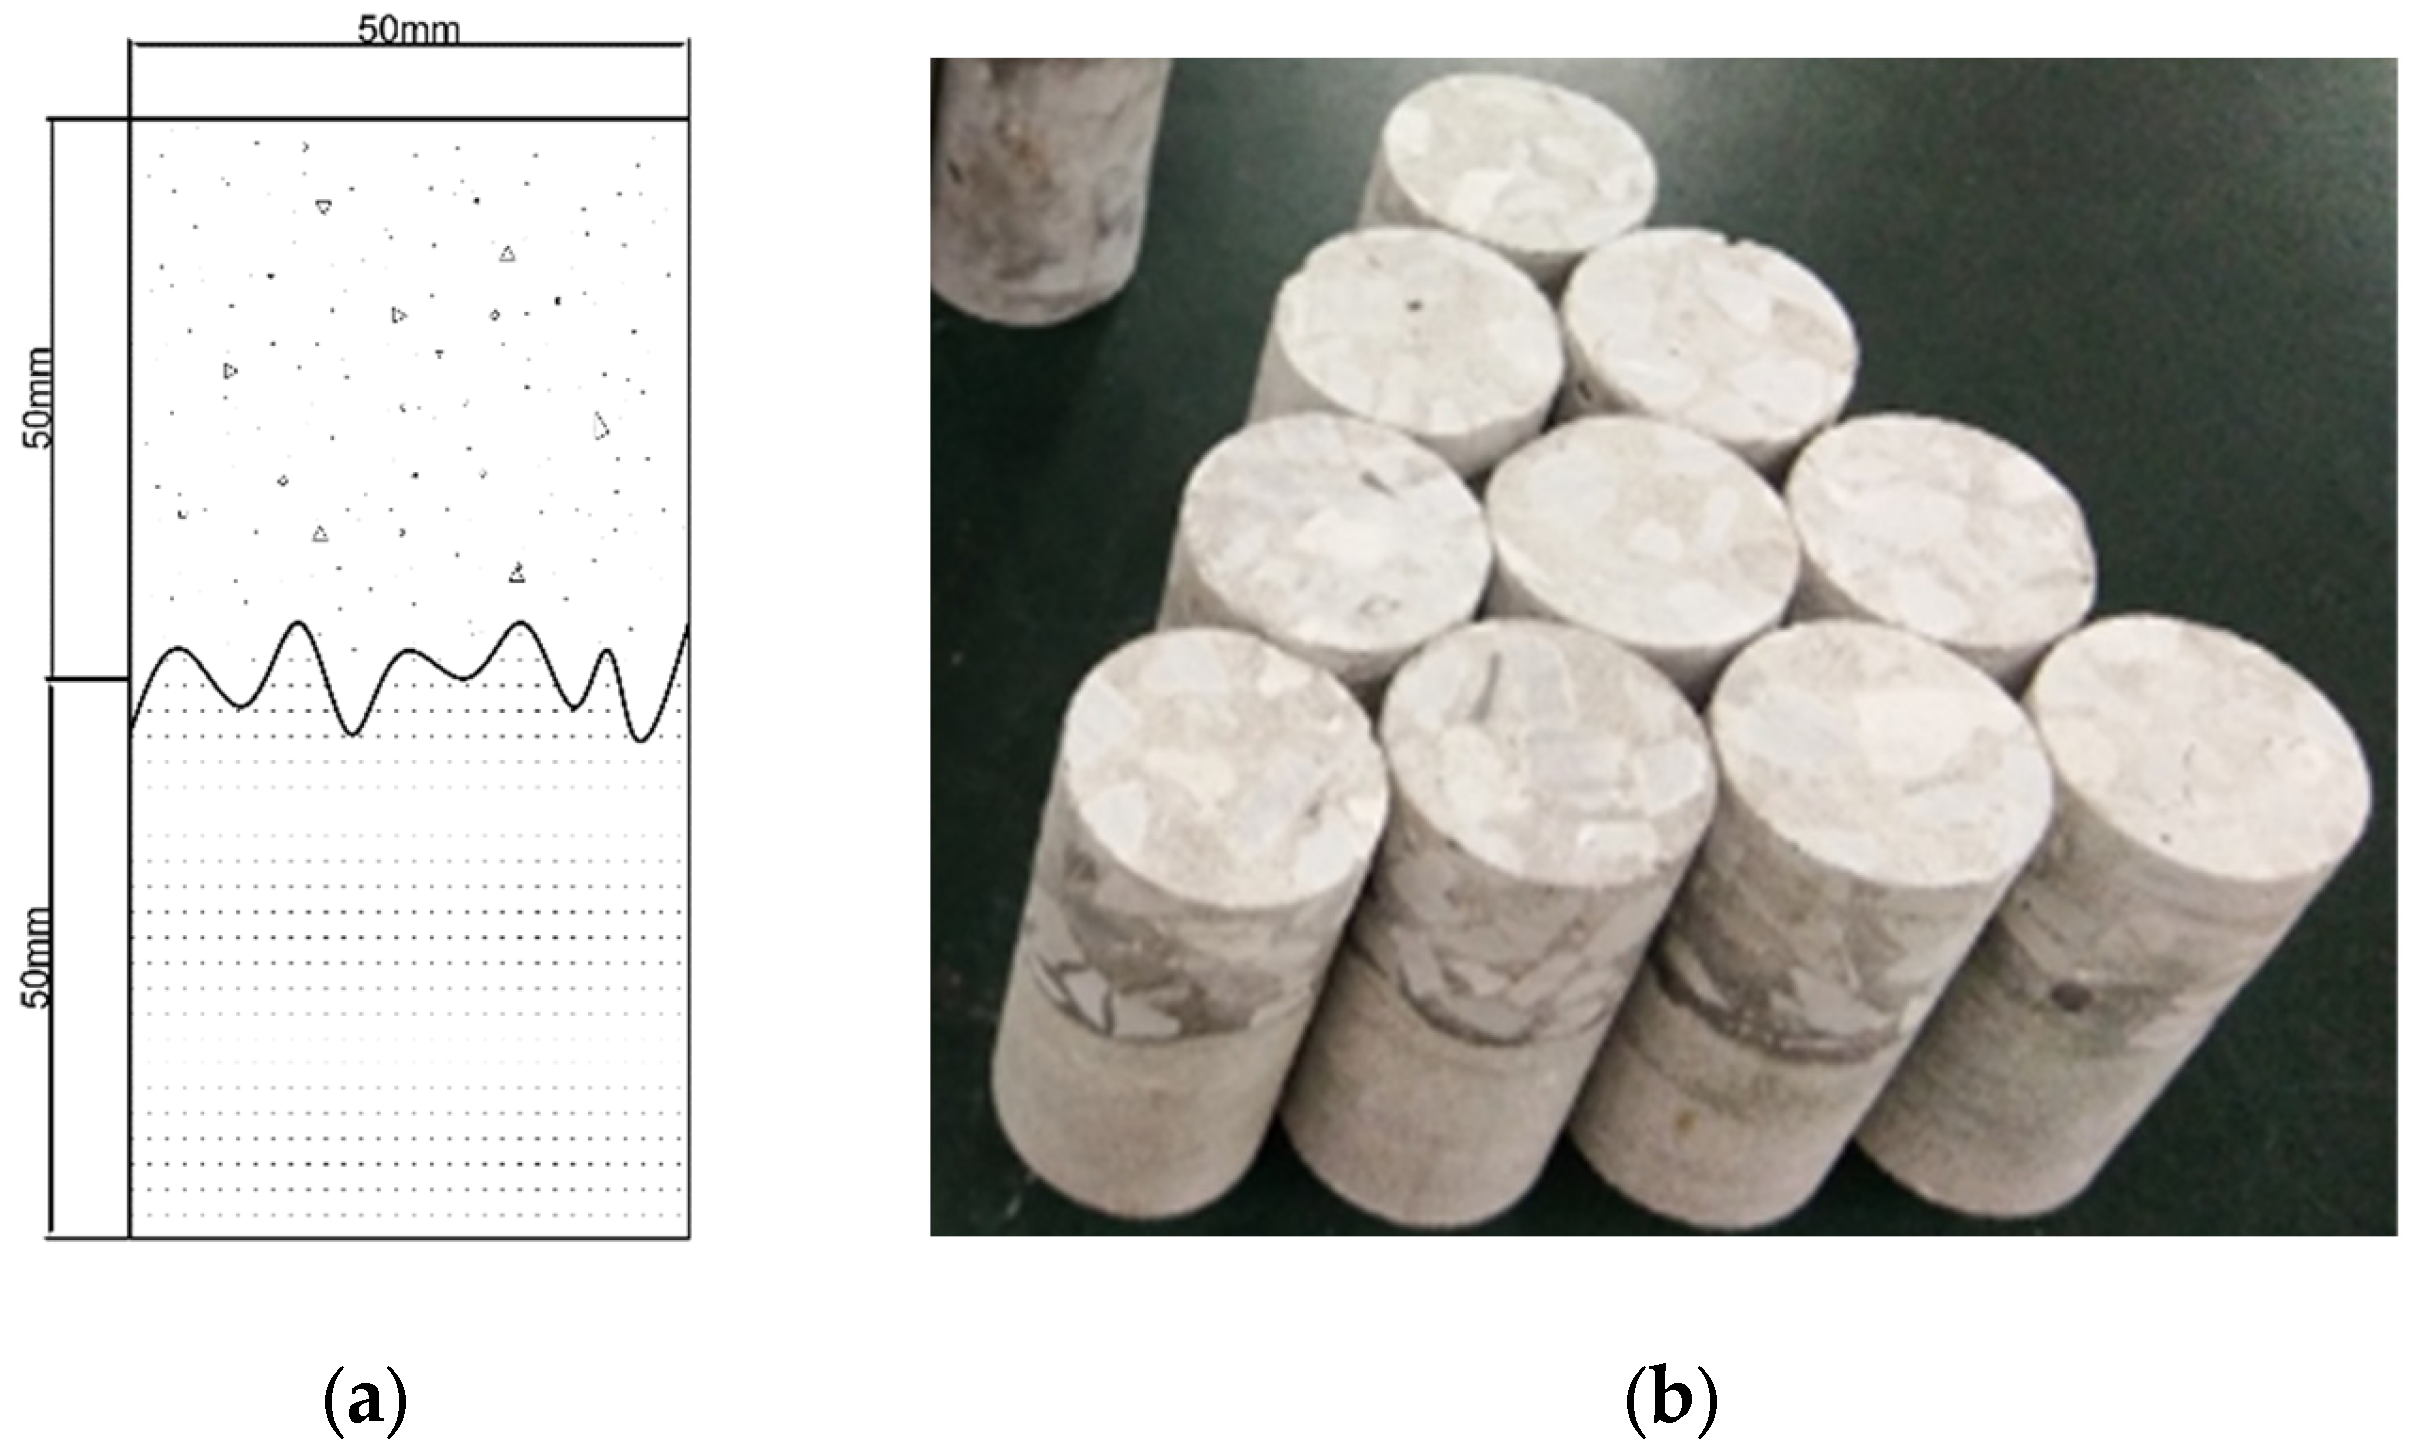
2.1. Specimen Preparation

Sandstone blocks were extracted from a foundation engineering site in southern Sichuan Province. The sandstone was compact and uniform in structure, displaying a white-gray appearance. Its mineral composition mainly consisted of quartz, feldspar, calcite, and a small amount of iron, among others. Its chemical composition primarily included SiO2, Al2O3, CaO, and Fe2O3, classifying it as a low-strength, brittle rock. First, the surface of one sandstone block was cleaned, and it was treated to achieve a certain degree of roughness. Then, concrete was poured on the surface. After 28 days of curing, the composite block was cored in the laboratory, and the composite specimens with a diameter of 50 mm and a height of 50 + 50 mm were prepared. The specimen preparation diagram and prepared specimens are shown in Figure 1.

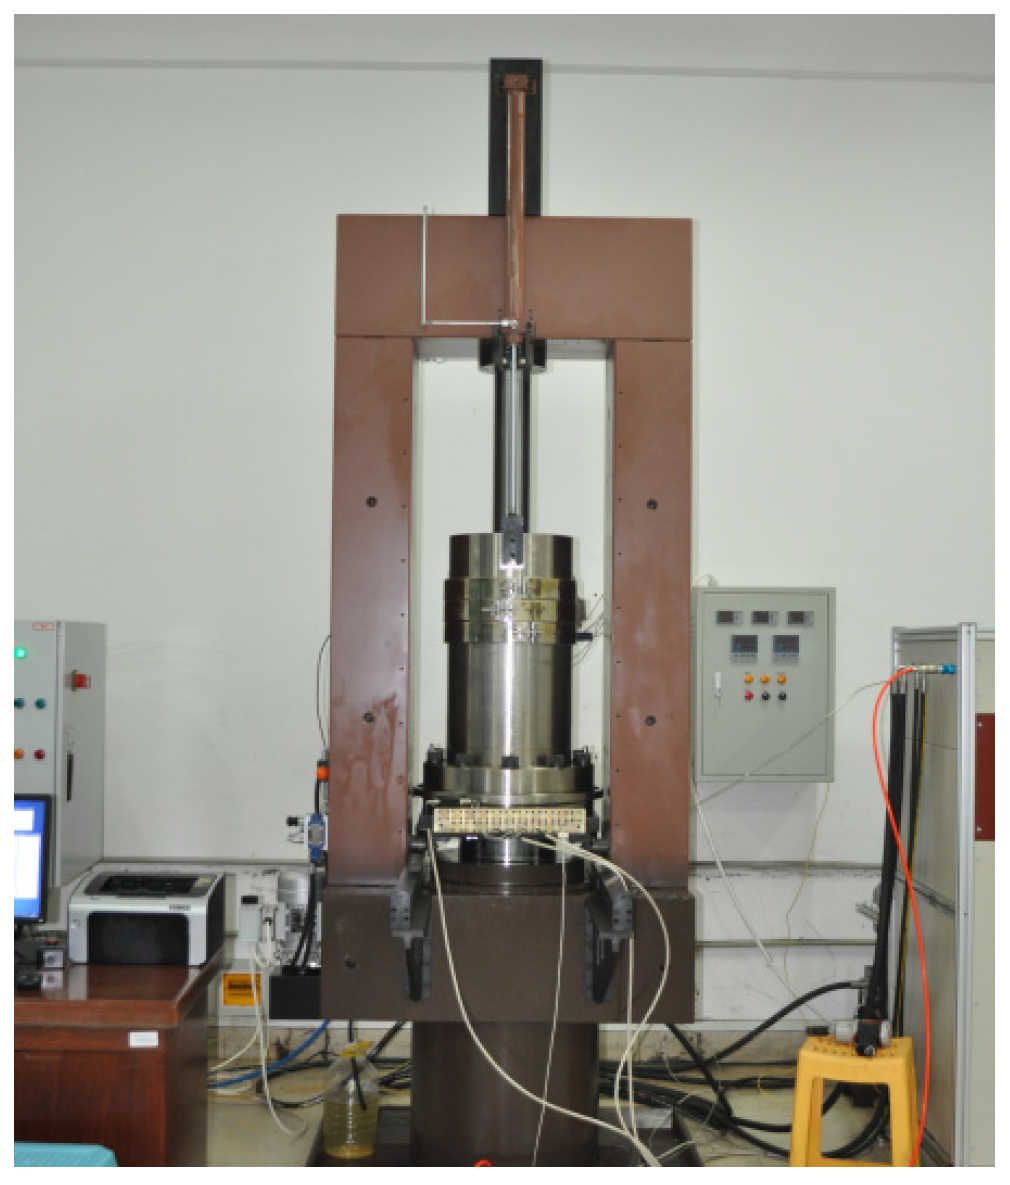
2.2. Testing Equipment

The TFD-2000 microcomputer servo-controlled rock triaxial testing machine which was manufactured by Changchun Keyi Testing Instrument Co., Changchun, China was used in the test, as shown in Figure 2. The maximum axial compressive force of the test machine is 2000 kN. The measurement resolution is 0.001 MPa, and the pressure measurement error range is ±0.5%. During the test, the test data can be automatically collected by a microcomputer.

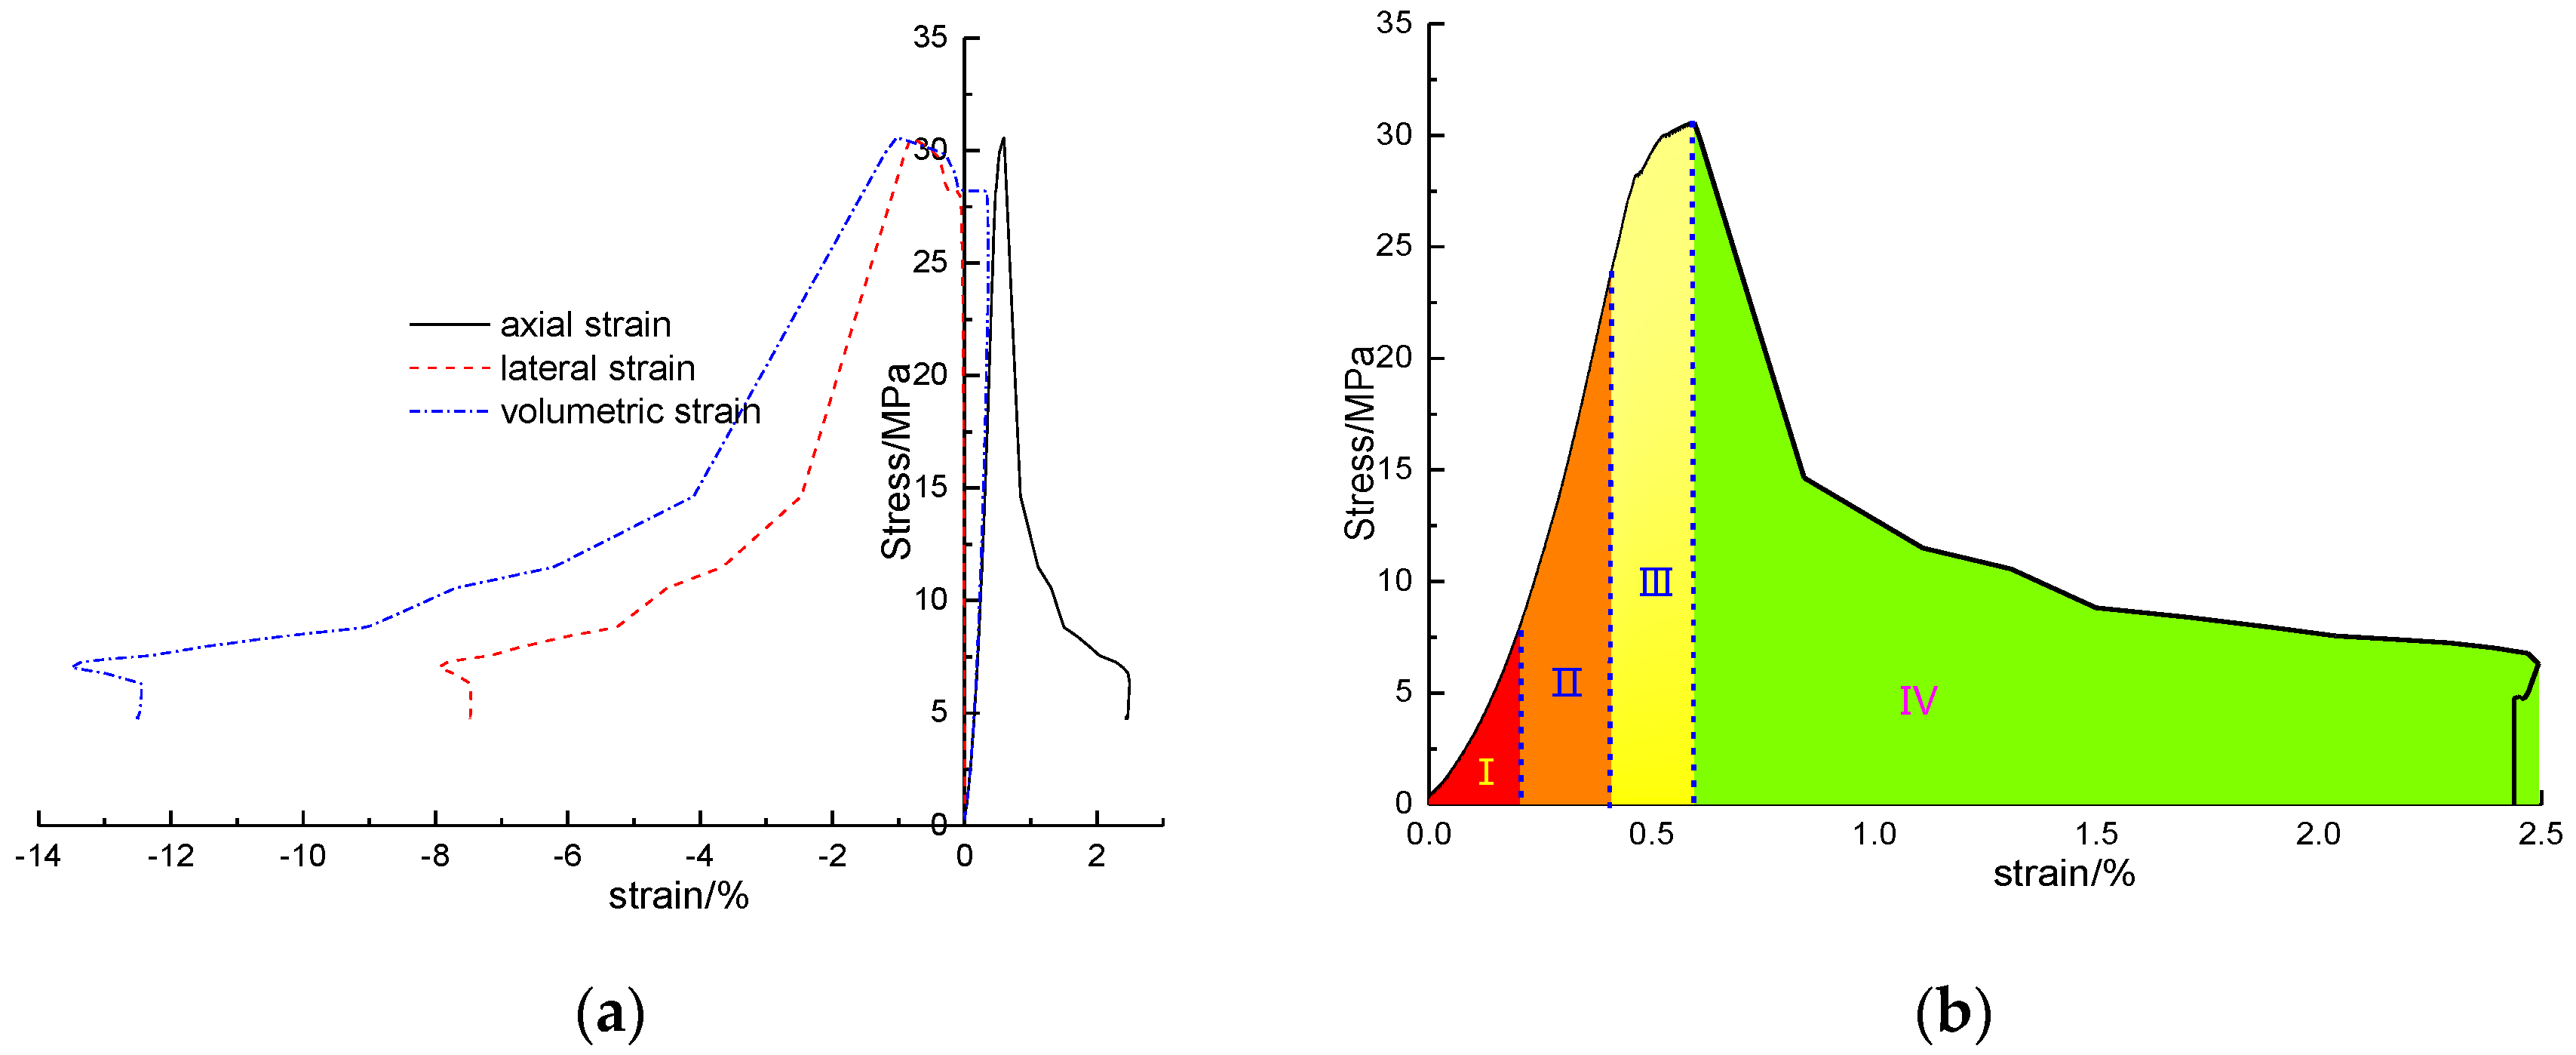
2.3. Preliminary Test

Before conducting the uniaxial cyclic loading and unloading test, the uniaxial compression tests of a sandstone and concrete composite specimen were performed at a displacement control rate of 0.01 mm/min. The test results are shown in Figure 3. It can be observed that the uniaxial compression test curve under different cycles can be divided into four stages. The first stage was the compaction stage of the micro-cracks (Stage Ⅰ). The original cracks gradually closed under axial pressure in this stage, and the slope of the stress–strain curve gradually increased, indicating that the original cracks closed gradually with the increase in load. The second stage was the elastic deformation stage (Stage II), where the slope of the curve in the elastic stage remained approximately constant. The third stage was the plastic yield deformation stage (Stage III). The decrease in the slope of the curve at the end of the elastic deformation stage indicated that the specimen continued to form new cracks and progress towards an unstable state. The fourth stage was the failure stage following the peak strength (Stage IV). The stress decreased rapidly and then gradually decreased to a constant value. The uniaxial compressive strength of the composite specimen was 30.52 MPa.

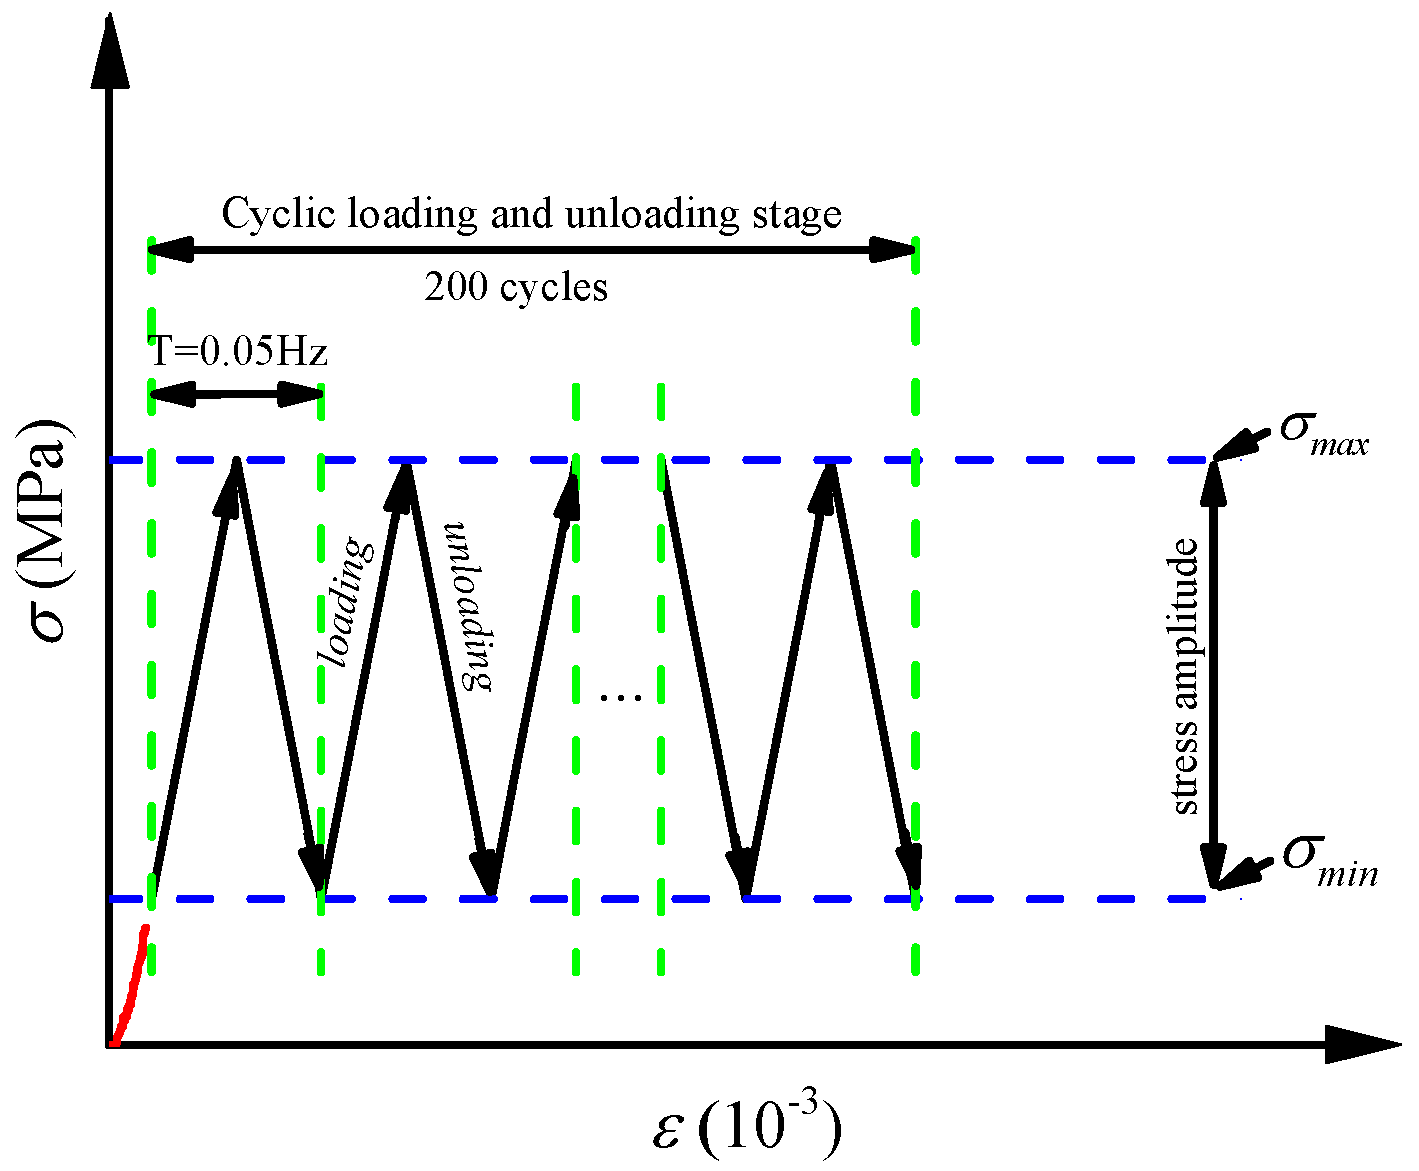
2.4. The Cyclic Loading and Unloading Test Method

According to uniaxial compression test results, 18.29, 21.34, 34.39, and 27.44 MPa were selected as the cyclic upper limit stress amplitudes. These values corresponded to 60%, 70%, 80%, and 90% of the uniaxial compressive strength, respectively. Additionally, 6.11 MPa (20% of the uniaxial compressive strength) was the cyclic lower limit stress. Each specimen underwent 200 loading and unloading cycles. A force-controlled rate of 0.2 kN/s was adopted in the loading and unloading cycles. Figure 4 shows the stress path diagram of cyclic loading and unloading tests, while Table 1 presents the detailed test parameters.

3. Results and Discussion

3.1. Mechanical Properties of Composite Specimens under Cyclic Loading and Unloading

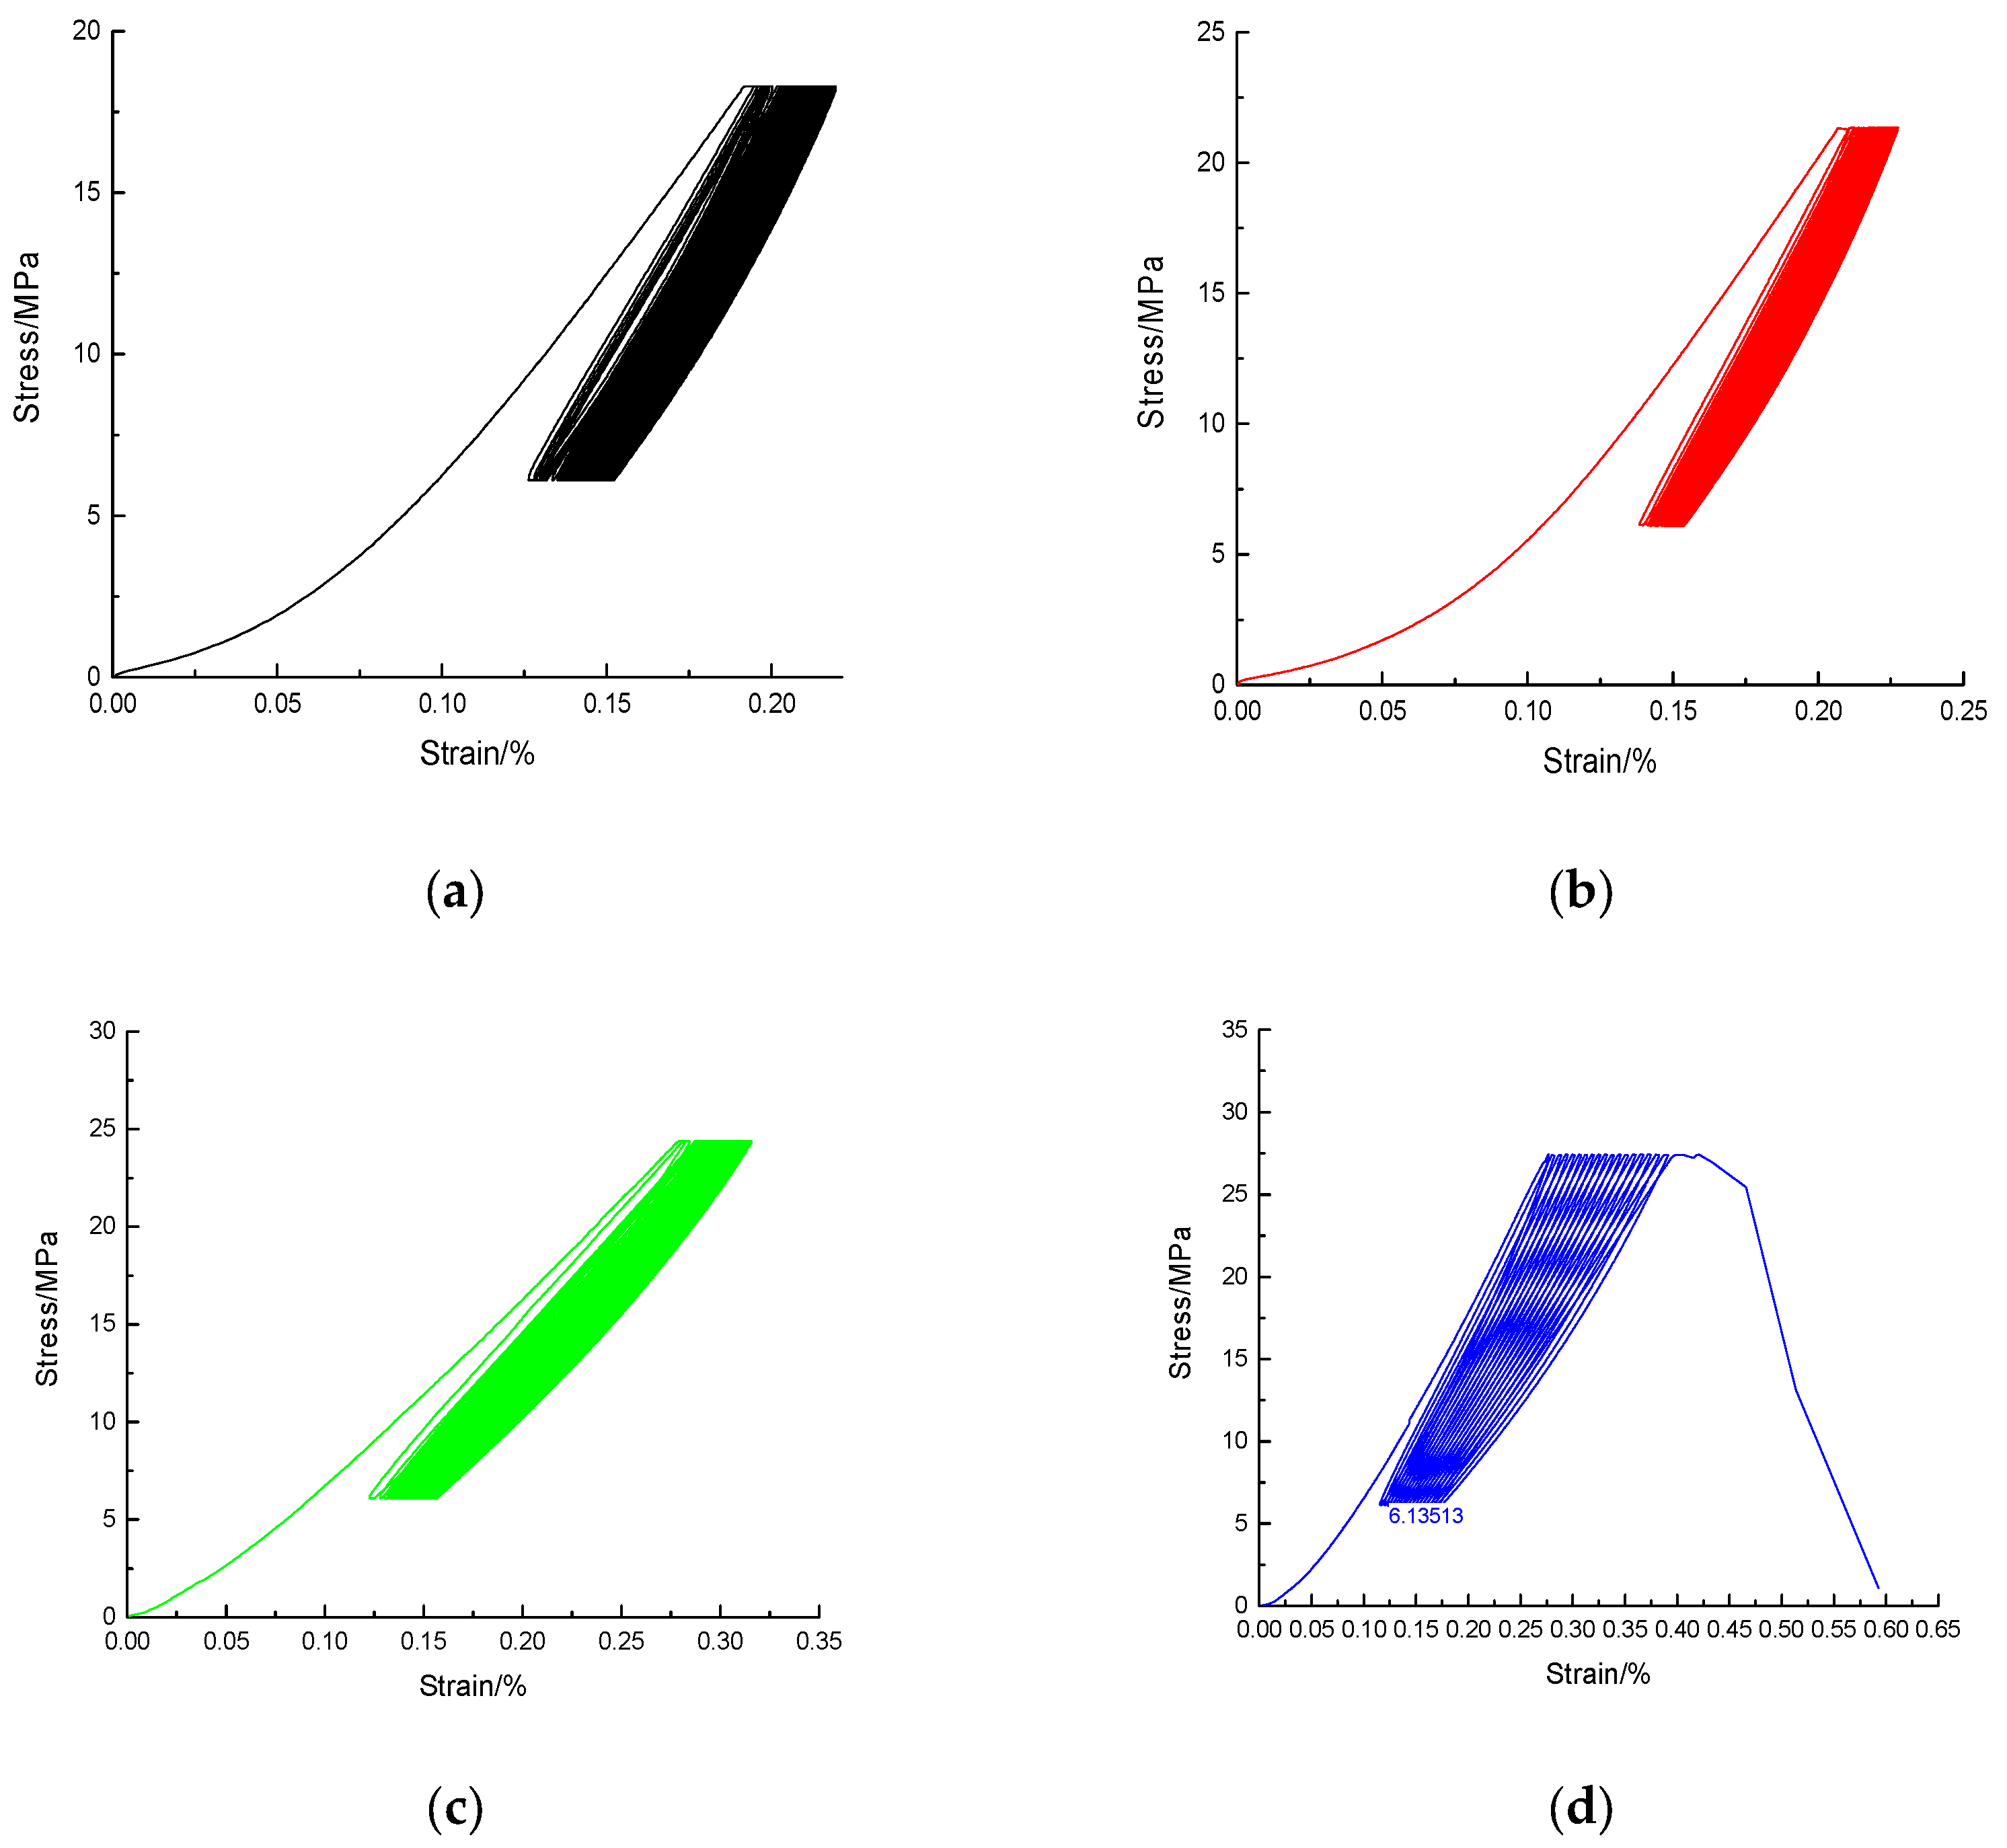
3.1.1. Deformation Characteristics

Figure 5a–d shows the stress–strain curves of rock–concrete composite specimens under uniaxial cyclic loading and unloading for tests conducted at stress amplitudes of 12.18, 15.03, 18.28, and 21.33 MPa.
It can be seen from Figure 5 that the stress and axial strain curves of the rock–concrete composite specimens formed hysteresis loops under cyclic loads. From the perspective of the entire experiment process, the axial strain hysteresis loop formed by the stress–strain curve demonstrated a trend from sparse to dense when the stress amplitude was less than 21.33 MPa. However, the axial strain hysteresis loop exhibited an evolution pattern from sparse to dense to sparse when the stress amplitude reached 21.33 MPa. The cyclic loading only endured for 19 cycles before the specimen was destroyed. It can be concluded that the axial deformation of the composite specimen develops rapidly, and the distance between the hysteresis loops is relatively larger, resulting in a larger area of hysteresis loop at the beginning of the cycle. This indicates that more energy is consumed under each loading and unloading cycle, and the cumulative fatigue damage inside the composite specimen is larger at this stage. After the first few cycles, the development rate of composite specimen deformation gradually decreases and enters the stable growth stage. The distance between each hysteresis loop becomes very dense, the area of the hysteresis loop is correspondingly reduced, and the fatigue damage caused by each loading and unloading cycle is significantly reduced. When the upper stress reaches a certain value, the axial deformation rate accelerates, leading to significant deformation and a more spread-out hysteresis loop.
Figure 6 shows the curve of residual strain with cycles for the rock–concrete composite specimen. It can be seen from Figure 6 that each cycle produced residual strain. The residual strain had a nonlinear relationship with the number of cycles, which was very similar to the typical three-stage rock creep curve. Referring to the division method of the rock creep curve, the curve of residual strain and cycles can be divided into two stages for stress amplitudes less than 21.33 MPa: the deceleration accumulation stage and the stable accumulation stage, as shown in Figure 7. The curve of residual strain and cycles can be divided into three stages for a stress amplitude of 21.33 MPa: the deceleration accumulation stage (I), the stable accumulation stage (II), and the acceleration accumulation stage, as shown in Figure 8. It can be concluded that during the early cycles (III), the residual strain increases relatively rapidly as the specimen adjusts to the cyclic stresses. However, as the number of cycles continues to increase, the rate of residual strain accumulation may slow down, reaching a more stable or saturated level. After the residual strain accumulates to a certain value, micro-cracks in the rock gradually connect. Consequently, the residual strain increases rapidly before failure.

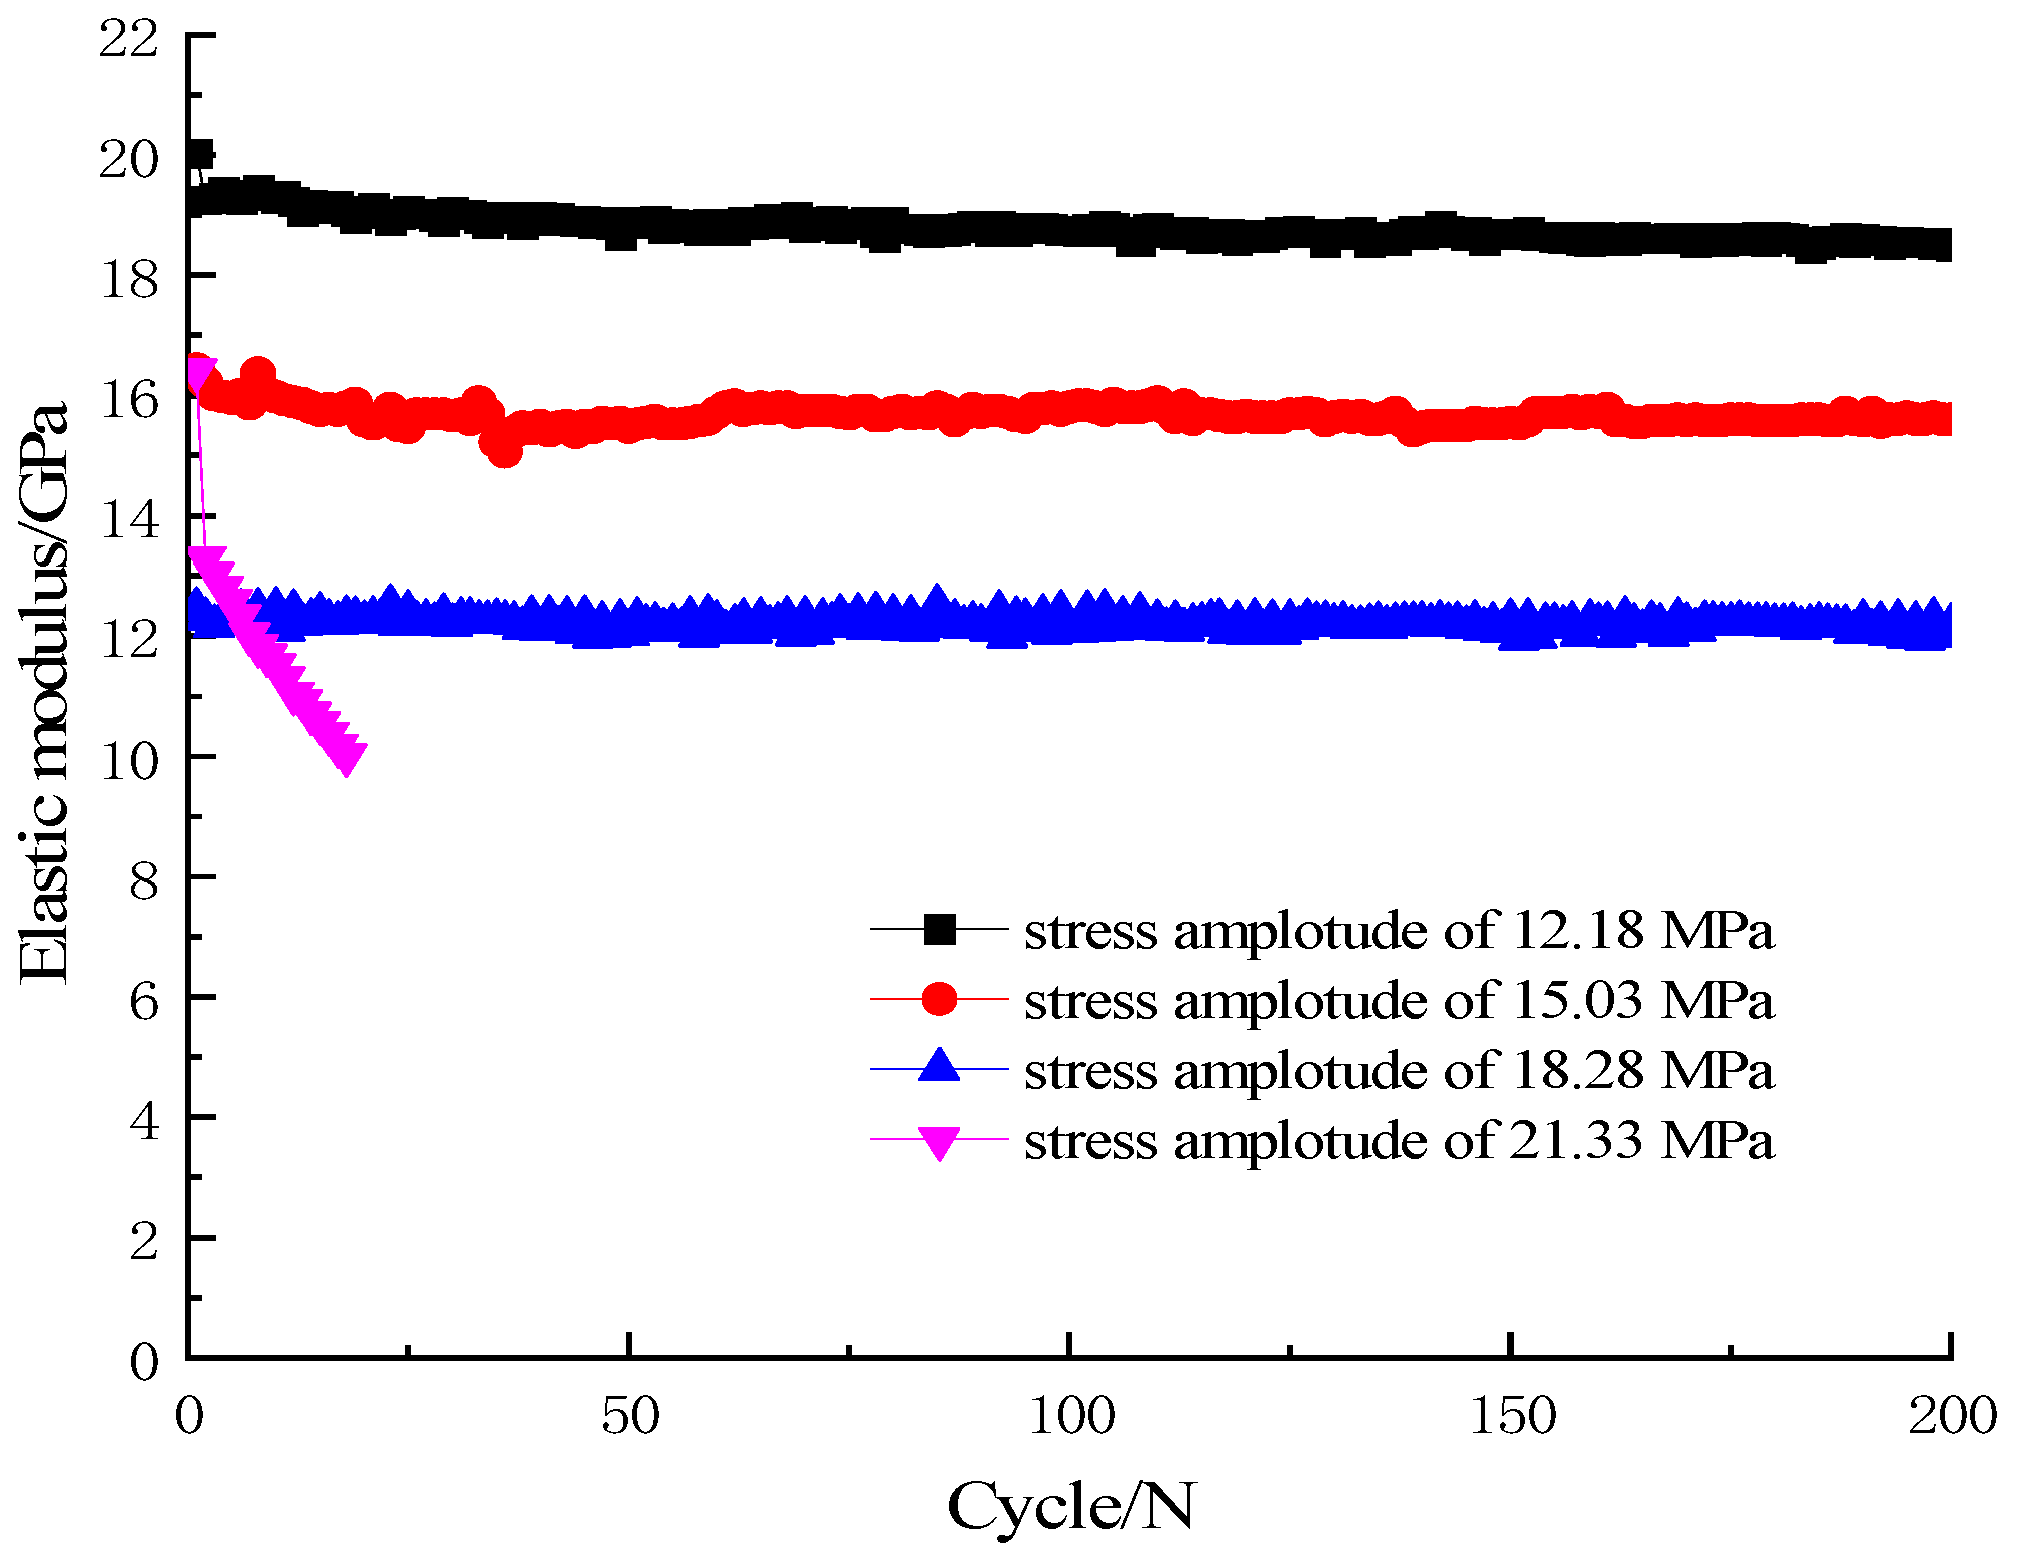
3.1.2. The Elastic Modulus: Changing Characteristics
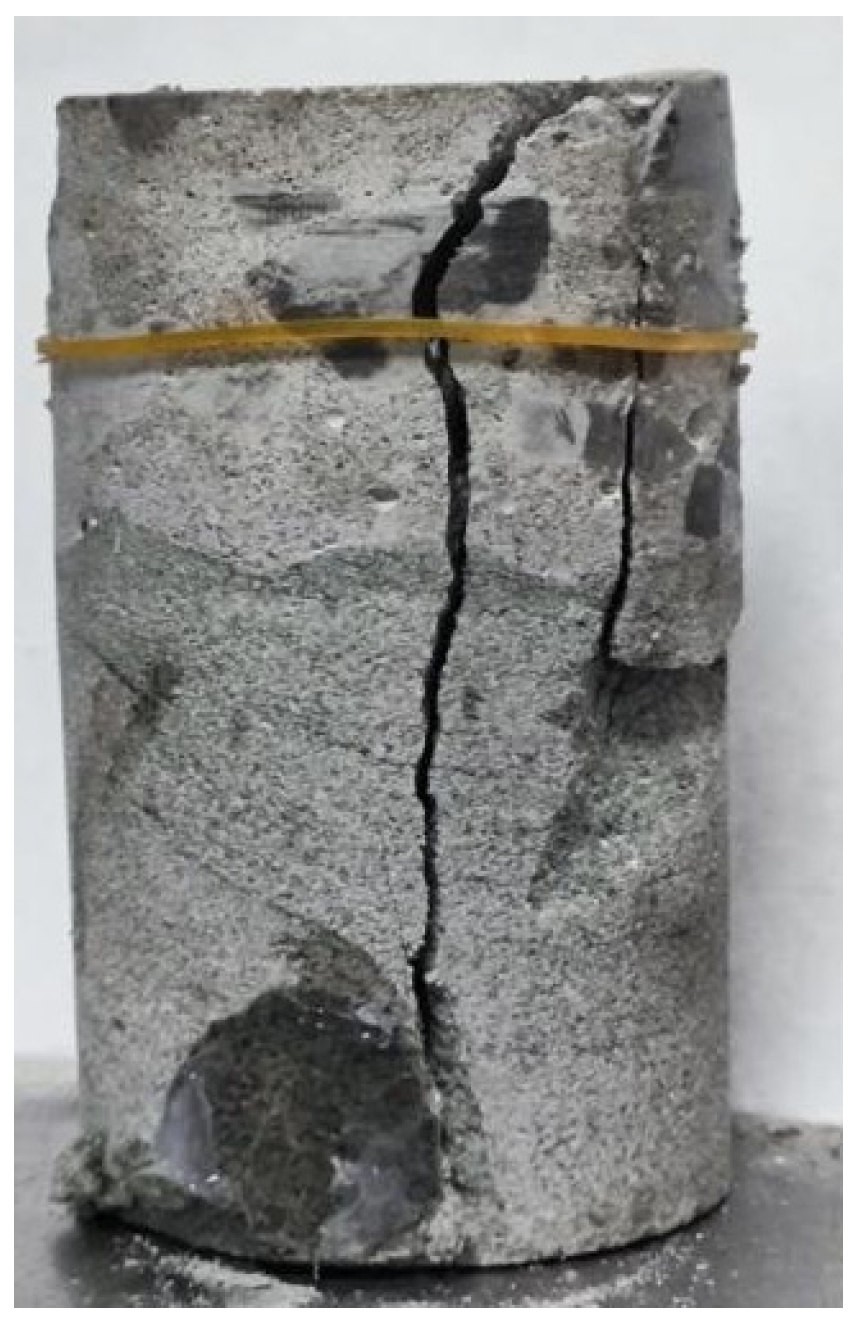
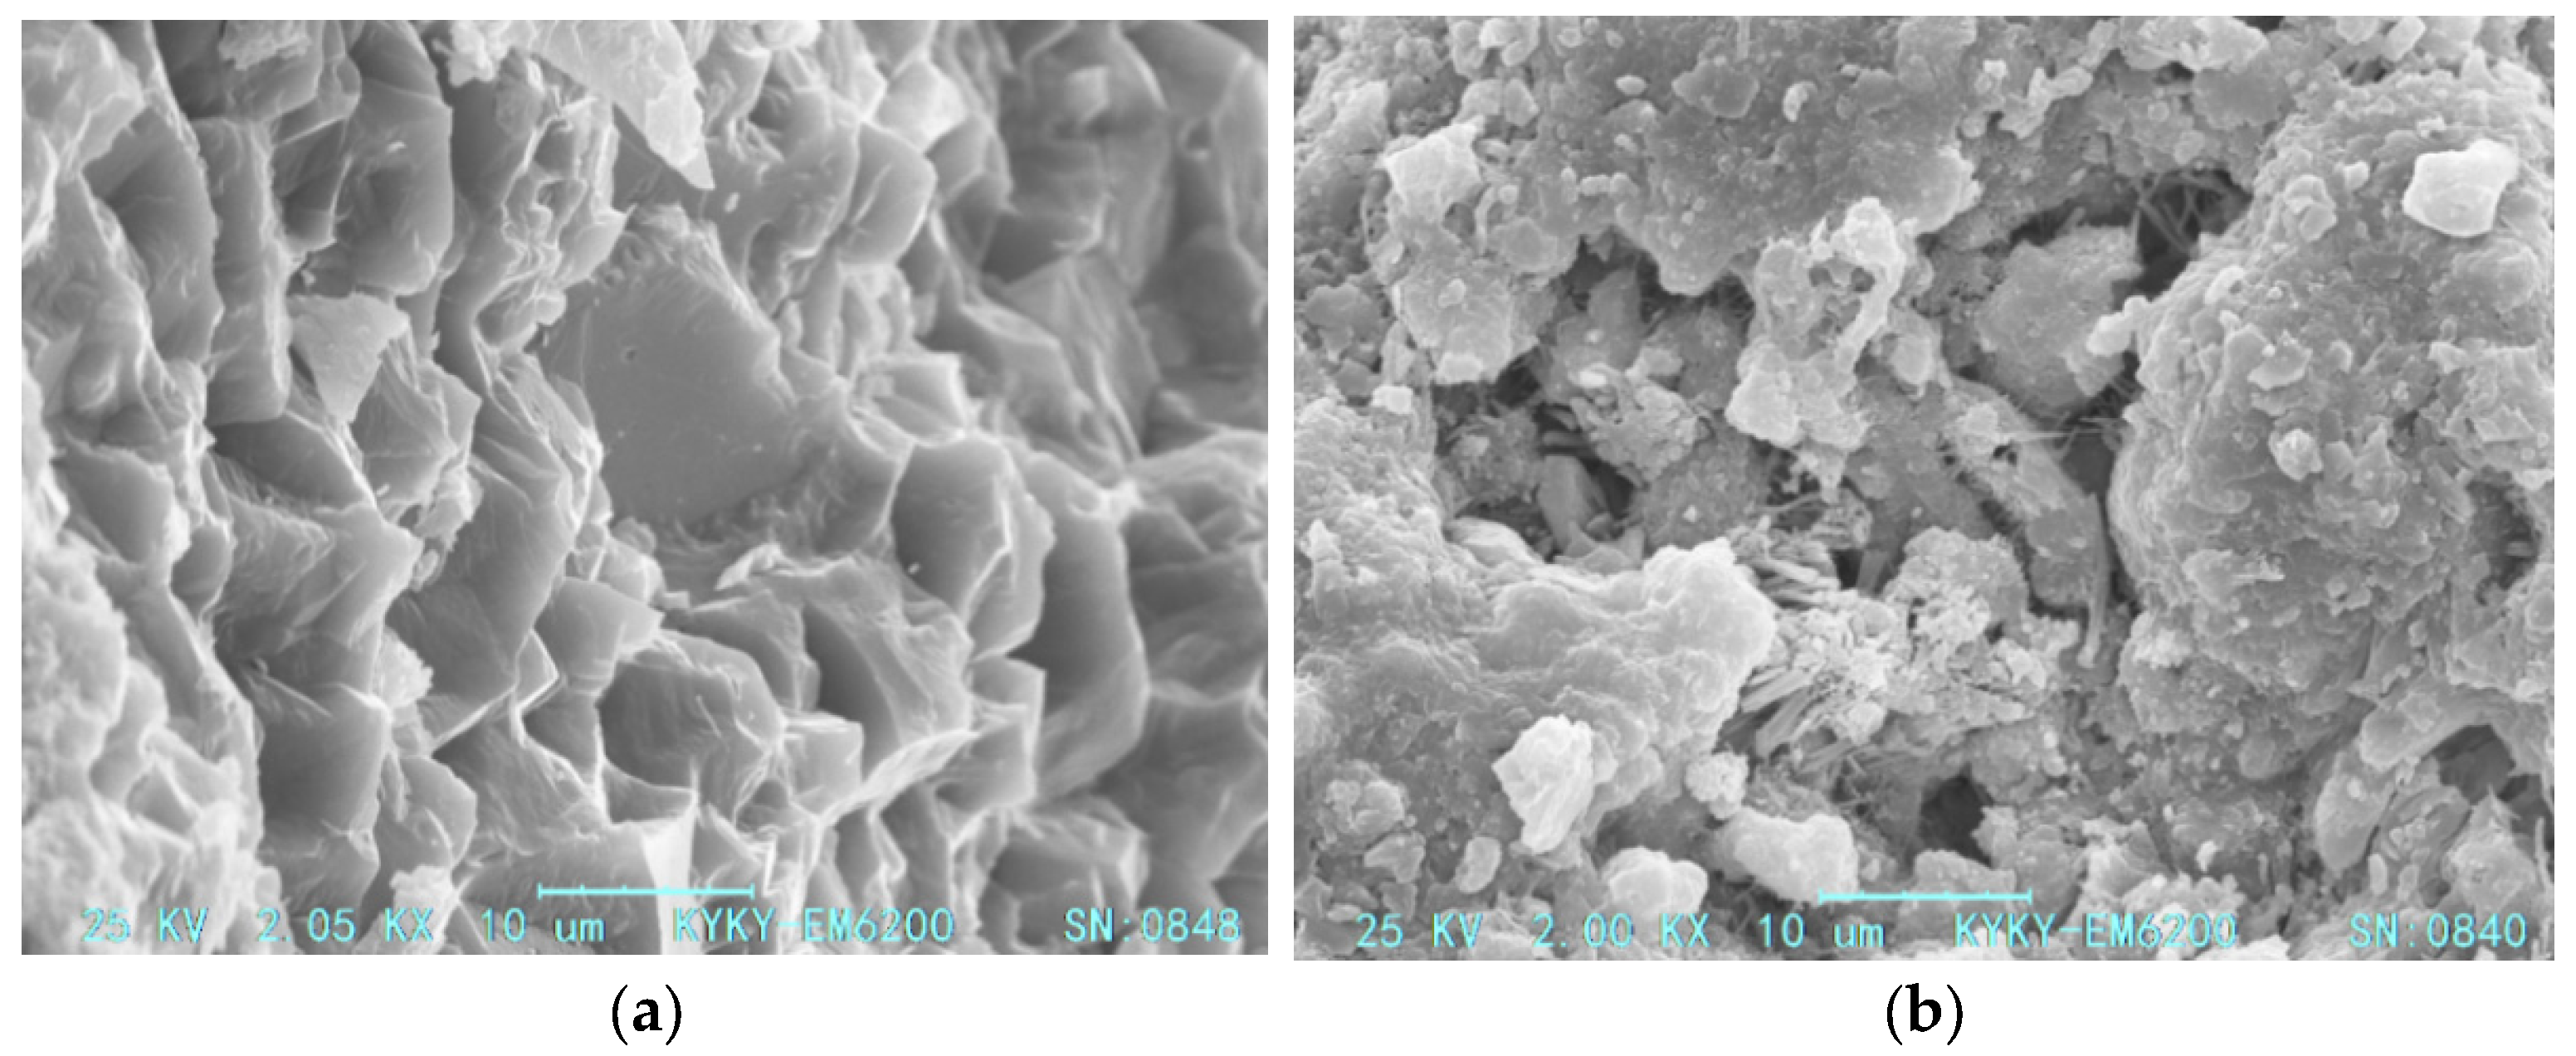
The Young’s modulus (E) is one of the most important mechanical properties of materials and is often used to describe their elastic behavior. Elastic modulus is one of the most important parameters for evaluating the mechanical properties of rocks. According to the Regulation for testing the physical and mechanical properties of rock—Part 19: Test for determining the deformability of rock in uniaxial compression (DZ/T 0276.19-2015 19) [24], the elastic modulus in each load cycle was calculated by Equation (1):
E = σ max σ min ε max ε min
where E is the elastic modulus, MPa; σ m a x is the maximum axial stress in each cycle, MPa; σ m i n is the minimum axial stress in each cycle; ε m a x is the maximum axial strain; and ε m i n is the minimum axial strain.
The elastic modulus of the composite specimen under different stress amplitudes can be calculated using Equation (1). The curves depicting the evolution of the elastic modulus are shown in Figure 9. It can be seen in the figure that the evolution trends of the elastic modulus under different stress amplitudes decreased rapidly in the first three cycles, after which the elastic modulus gradually decreased at a constant rate. With the increase in stress amplitude, the elastic modulus showed a rapid decreasing trend, indicating that higher stress amplitudes caused irreversible fatigue damage. Under the same stress amplitude, the primary pores inside the composite specimen are gradually compacted, the cracks are gradually closed in the first few cycles, and the composite specimen enters the elastic phase. This is the main reason that the elastic modulus of the composite specimen gradually tends to a constant value after decreasing in the first few cycles. The elastic strain of the specimen played a major role, resulting in a stable elastic modulus. Before failure, new cracks formed inside the composite specimens, leading to the destruction of the specimen’s integrity. This resulted in a rapid decrease in the loading elastic modulus under significantly higher stress amplitudes.

3.2. Failure Mode

Figure 10 displays the apparent damage pattern of the rock–concrete composite specimen after various levels of cyclic loading. It can be seen from Figure 10 that the main forms of damage were split failures from concrete to sandstone, and a partial blocking phenomenon appeared in both the concrete and sandstone sections. During the cyclic loading test, the micro-cracks inside the rock–concrete composite specimen were consistently opening and closing with each load–unload cycle. This phenomenon created room for the development of additional micro-cracks. During a long test period, the micro-cracks in rock–concrete composite specimens can grow significantly. Moreover, because the maximum stress from cyclic loading was 27.44 MPa, which was lower than the conventional compression strength of the rock–concrete composite specimen, the propagation of large cracks in the specimen was limited during the cyclic loading test. Instead, the development of micro-cracks prevailed. With the propagation and coalescence of the micro-cracks, the rock–concrete composite specimen eventually failed.
The rock and concrete portions of the failed samples were microscopically scanned with the aid of a scanning electron microscope (SEM), yielding the microstructures of the rock and concrete at the same magnification, as illustrated in Figure 11. The microstructures of the two blocks were evidently very different. The rock blocks were composed of a dense array of nested silicon dioxide crystals with very few additional large ratios of impurities. The compact and regular crystal arrangement formed the microstructure. The concrete’s coarse and fine aggregates were interspersed with numerous micropores and micro-cracks; these meso-fracture characteristics elucidate the primary mechanism by which the failure characteristics of the rock–concrete composite specimen transitioned from the concrete to the rock portion.

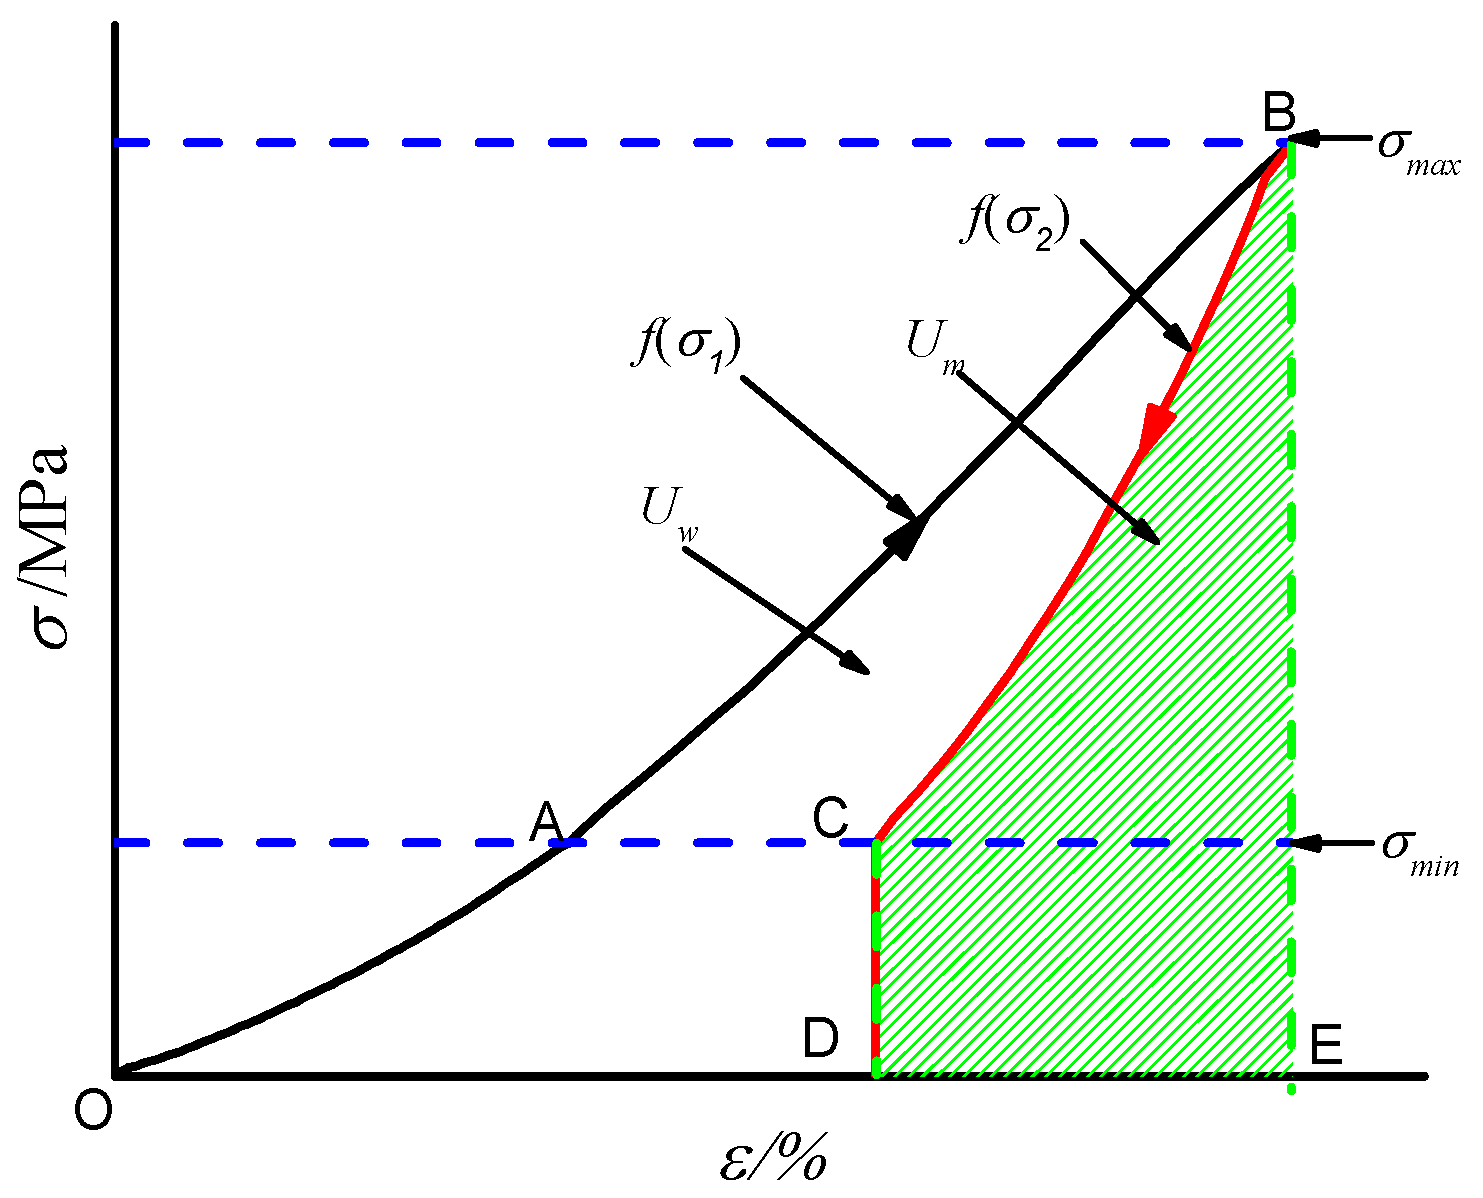
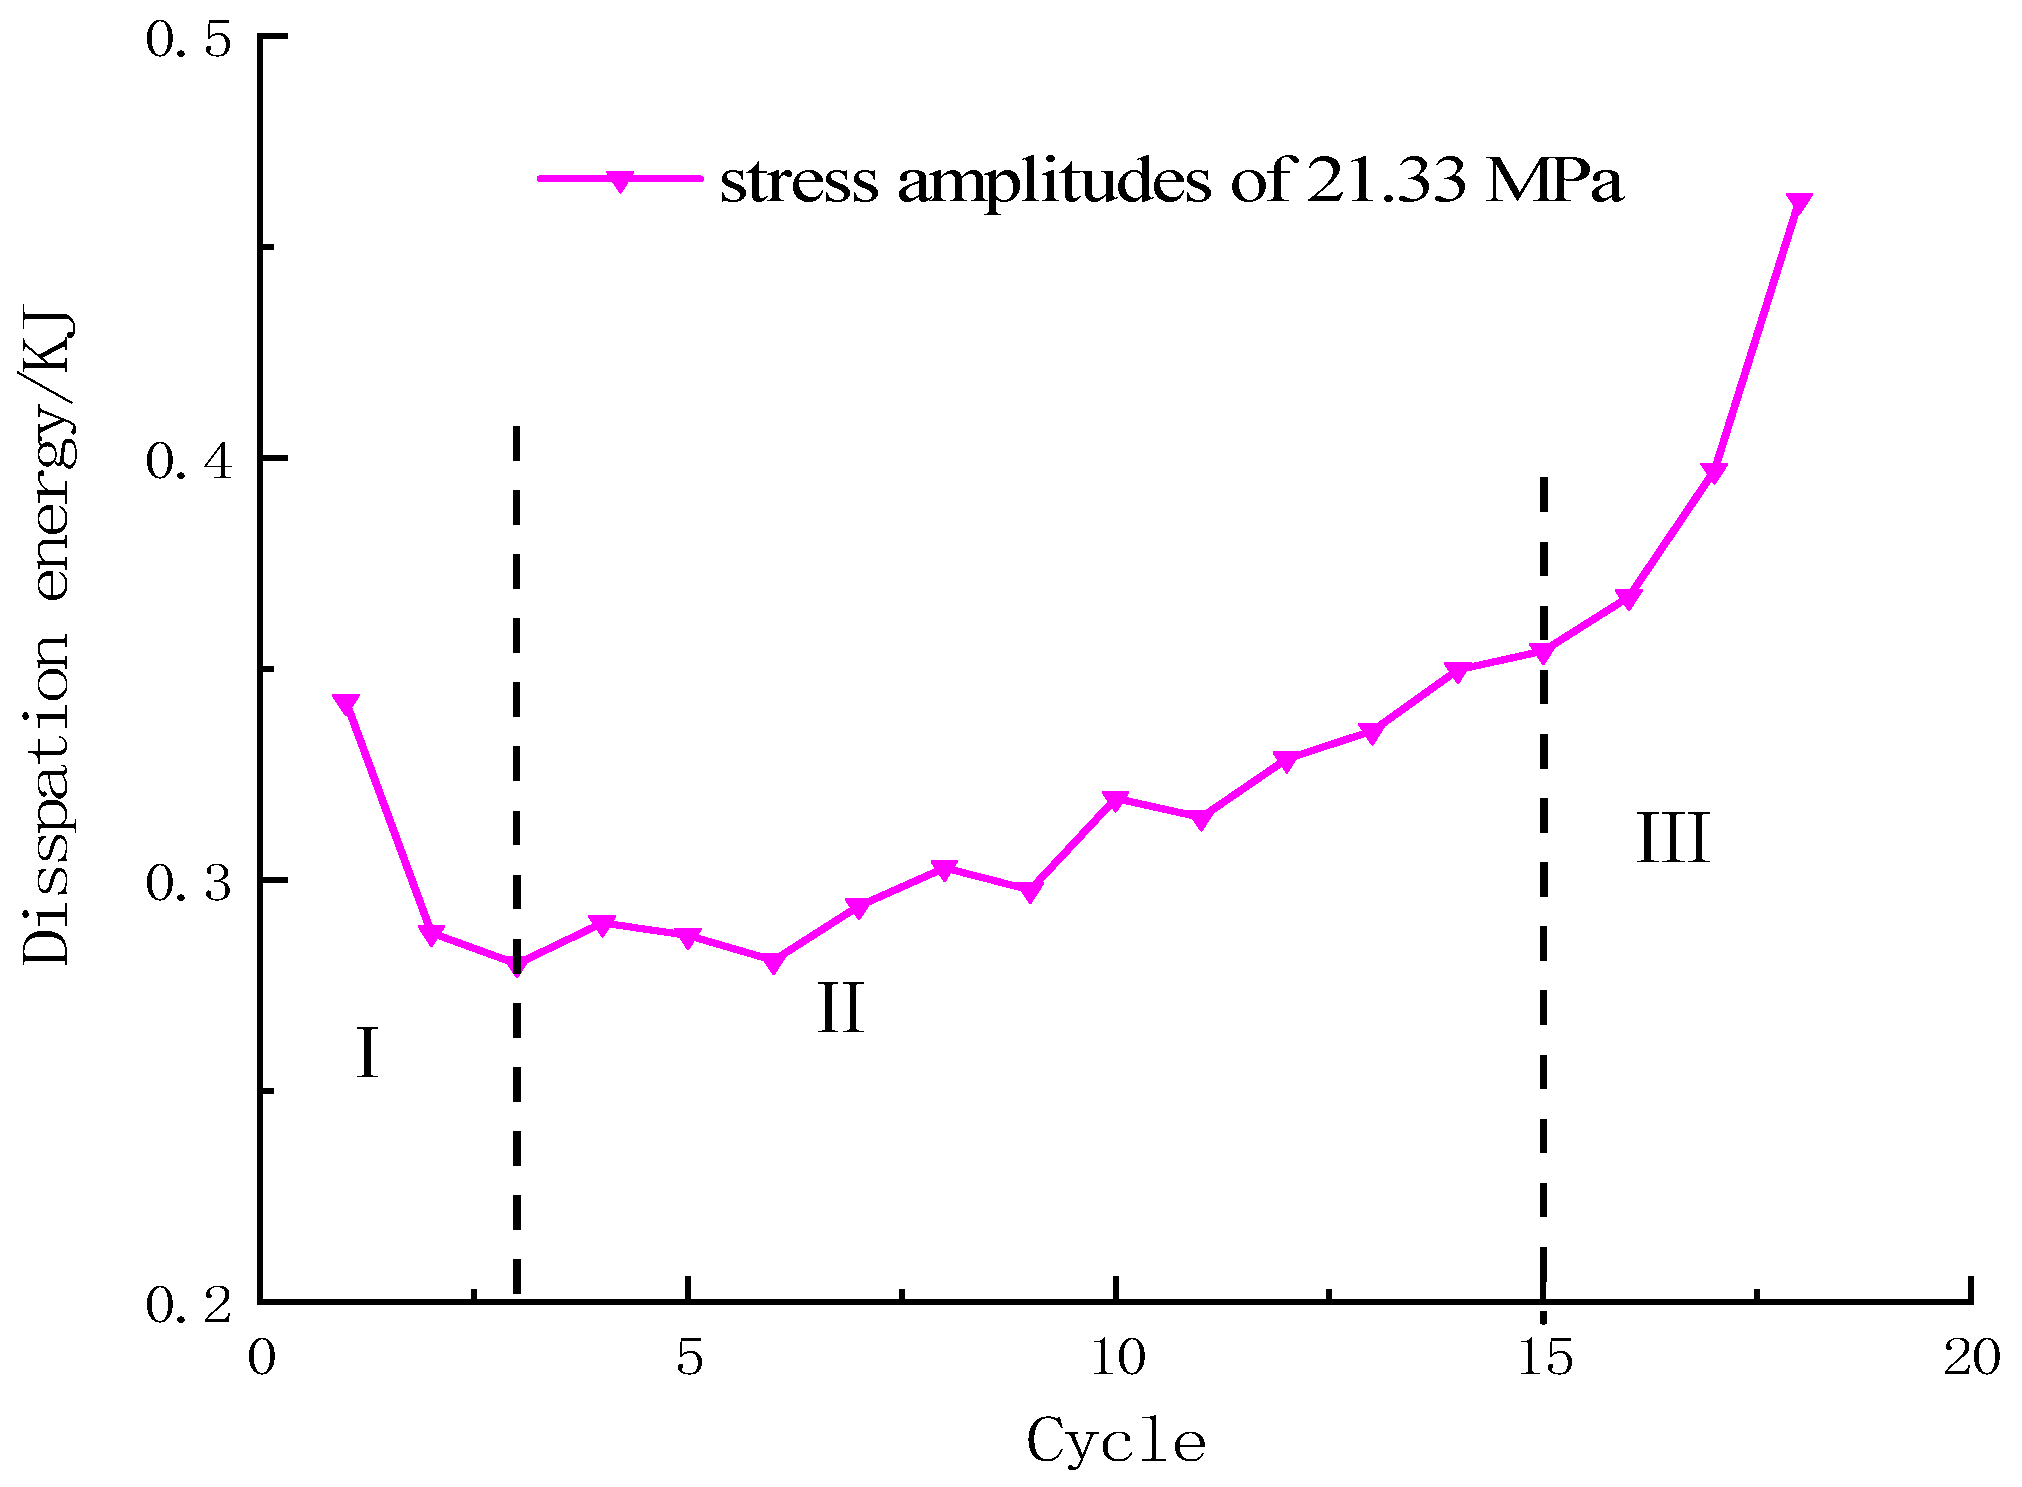
4. The Dissipated Energy Evolution and Analysis of Damage Characteristics

4.1. The Dissipated Energy

The specimen underwent cyclic loading and unloading, which is essentially a process of energy input and dissipation. The area of OABE which below the loading section OAB and the X-axis represents the input energy U, the area of BCDE which below the unloading section BC and the X-axis represents the elastic strain energy Um, and the area OAB represents the dissipation energy density UW, as illustrated in Figure 12. The energy of each part of the specimen can be defined as follows [24]:
U = ε 0 ε B σ L d ε
U m = ε C ε B σ U d ε
U w = U U m
where σ L is the stress of each cycle loading segment; σ U is the stress of the unloading section for each cycle; and ε0, εB, and εC are the axial strains at points of O, B, and C, respectively.
According to Equations (2)–(4), the energy of each cycle of the composite specimen under different stress amplitudes was calculated. The energy evolution curve of the composite specimen under different stress amplitudes can be seen in Figure 13 and Figure 14. It can be seen from Figure 13 that the energy evolution curves showed a sudden-drop stage (I) and a steady-speed stage (II) when the stress amplitude was less than 21.33 MPa. The curve of energy evolution can be divided into three stages for a stress amplitude of 21.33 MPa: the sudden-drop stage (I), the steady-speed stage (II), and the accelerated development stage (III). During the sudden-drop stage, the energy dissipation decreased rapidly in the first few cycles. Subsequently, the energy dissipation rate gradually stabilized at a certain value. This phenomenon primarily occurred due to energy consumption during the closure of micro-defects inside the specimen in the initial cycles. As the cycles progressed, the specimen became more compact, leading to a decrease in energy dissipation. In the steady-speed stage, the energy was mainly consumed in the form of acoustic energy, thermal energy, and plastic deformation. The dissipation energy rate gradually approached a constant speed with the increase in cycles. During the accelerated development stage, the upper stress exceeded the yield strength. The energy was primarily consumed in initiating micro-cracks, facilitating effective expansion, and creating new plastic areas. Energy dissipation escalated rapidly at this stage.

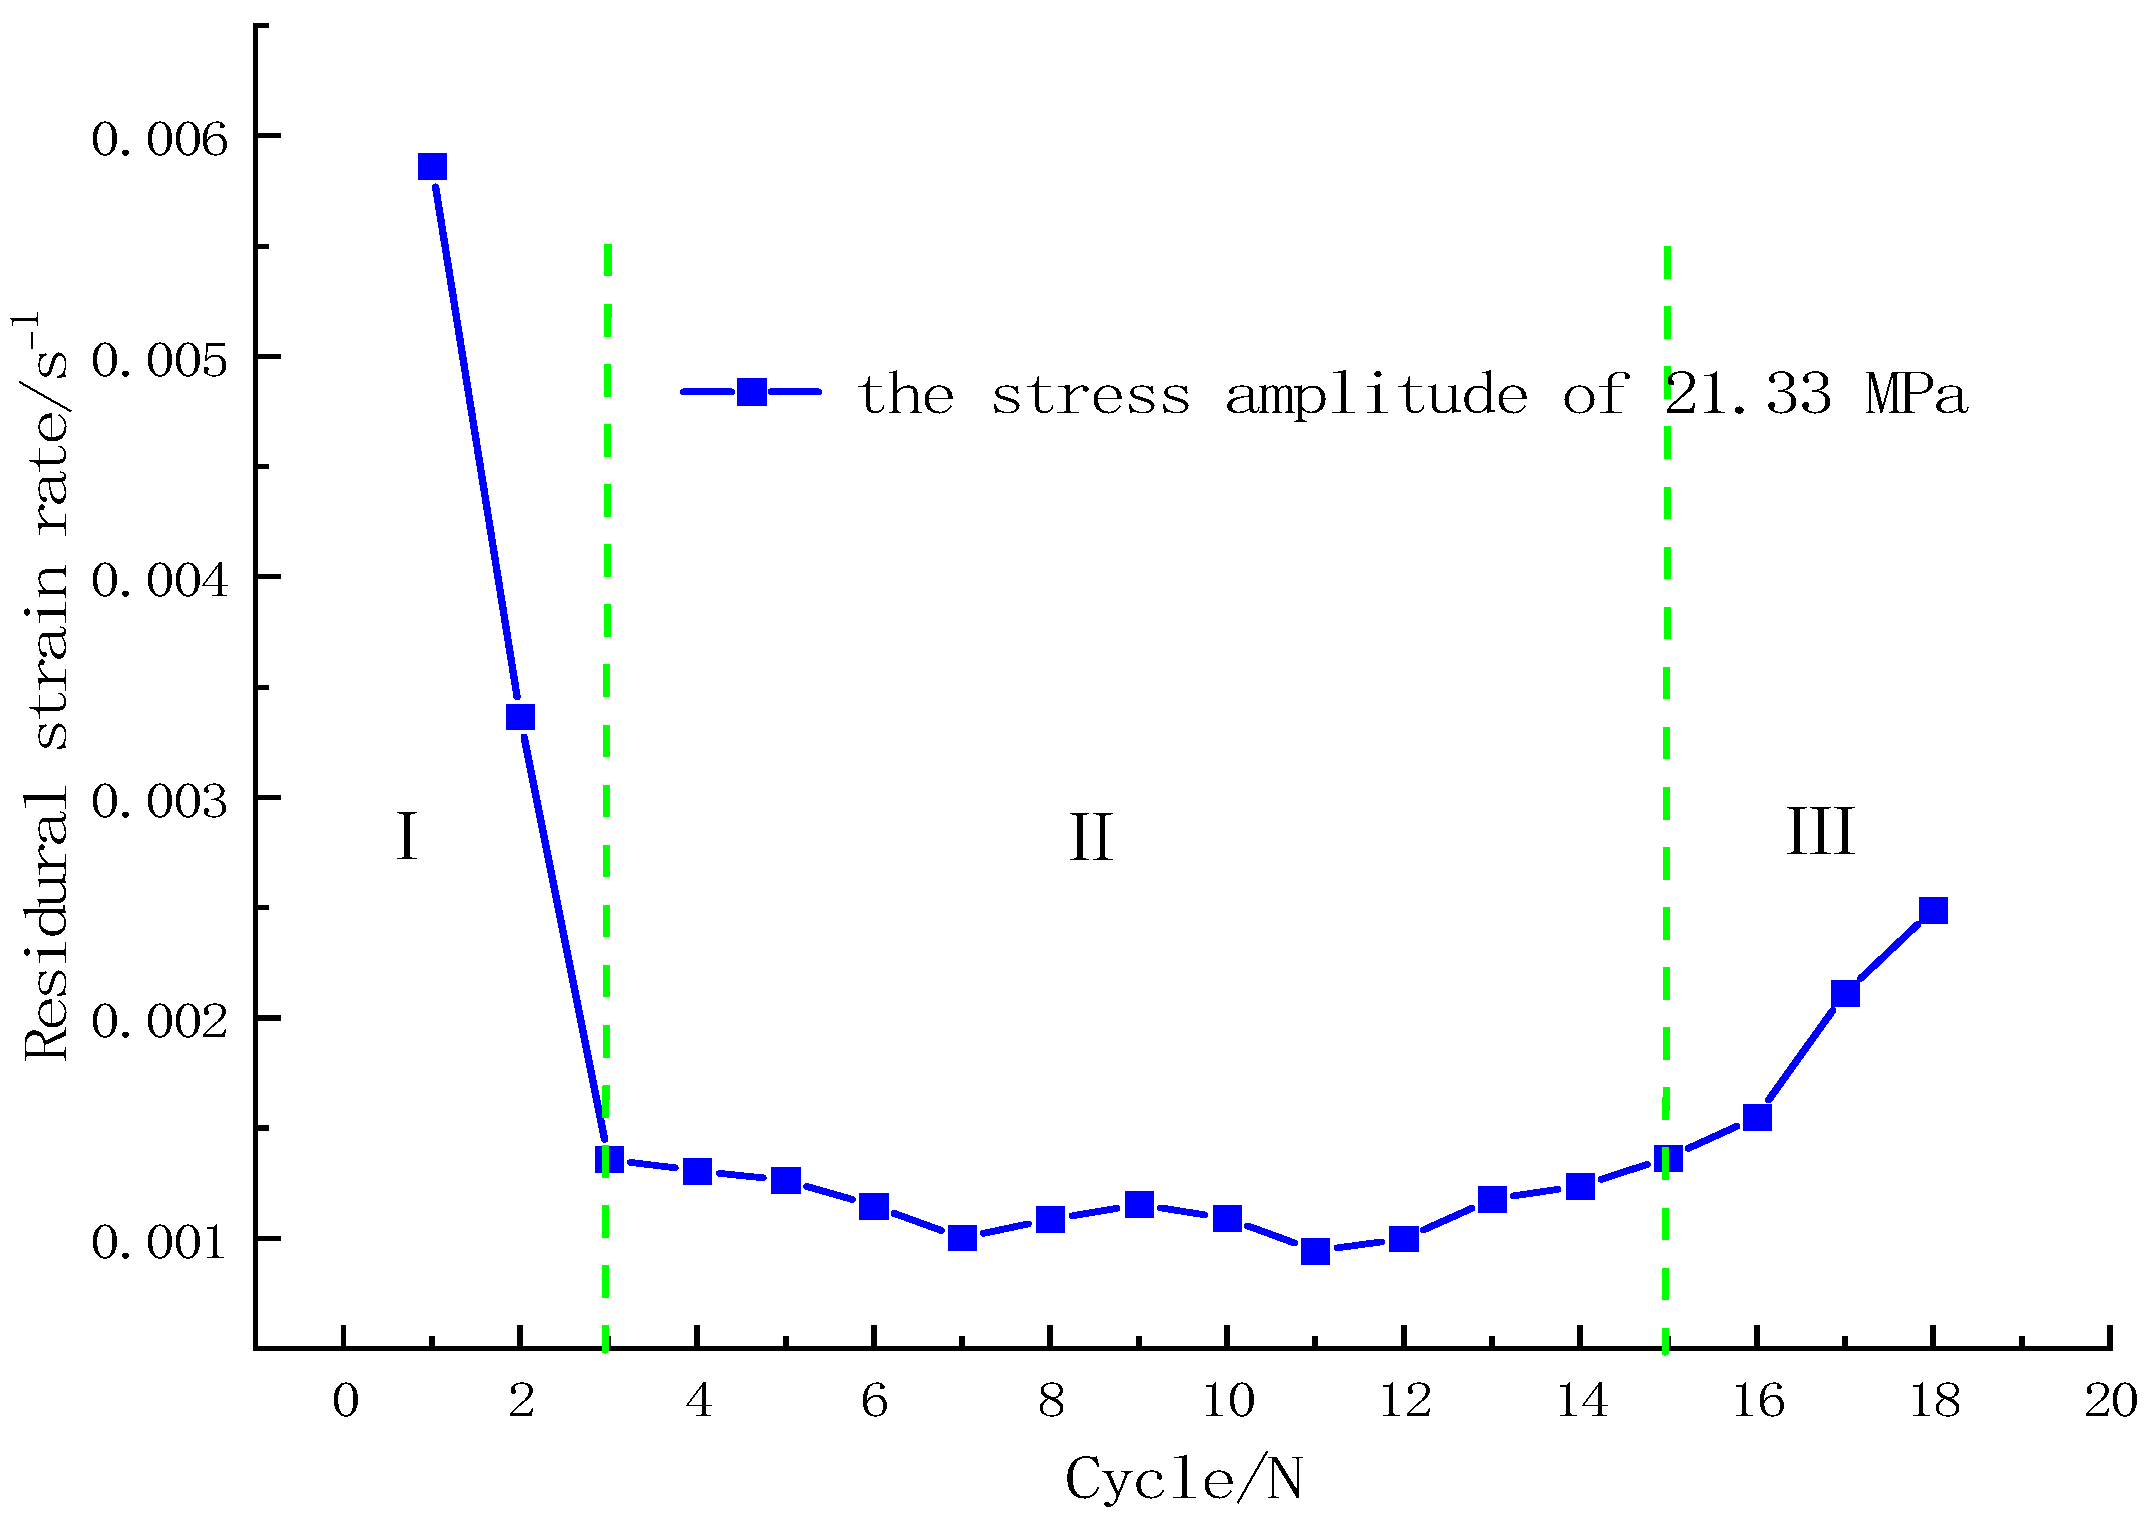
4.2. Damage Evolution Law

With the increase in fatigue cycles, the internal pores, micro-cracks, and irreversible deformation gradually accumulated, leading to continuous damage and deterioration of the specimen. Based on the equivalent strain hypothesis of a continuously damaged medium, the damage constitutive equation of a rock–concrete composite specimen under uniaxial compression can be expressed as follows [25]:
1   D = σ E ε
where D is the damage variable, σ is the stress of a non-destructive material, E is the elastic modulus of the non-destructive material, and ε is the strain of the non-destructive material. When D = 0, the rock–concrete composite material is in an undamaged state and intact; when D = 1, the rock–concrete composite material is completely destroyed.
In the loading and unloading tests, if we ignore the single cyclic damage change, the material stress σ can be calculated. Therefore, it can be treated as a known constant in Equation (5). By taking the derivative of ε on both sides of Equation (5), we can obtain the following:
d D = σ E ε 2 d ε
Assume that ε0 represents the axial strain at the beginning of the cycle, with the damage variable D = 0 at this point. εe represents the axial strain at the point of failure after various cycles, with the damage variable D = 1 when the specimen fails. Integrating D in Equation (6) from 0 to 1 and ε from ε0 and εe, respectively, the Equation (6) can be expressed as follows:
0 D d D = ε 0 ε e σ E ε 2 d ε
D = σ E 1 ε 0   1 ε + C
By substituting D = 0 and ε = ε0 into Equation (8), C = 0 can be obtained. By substituting D = 1, ε = εe, and C = 0 into Equation (8), the following can be obtained:
1 = σ E 1 ε 0   1 ε e
Therefore, the damage variable D can be expressed as follows:
D = ε e ε ε   ε 0 ε e   ε 0
According to Equation (10), the damage variable of the composite specimen under a stress amplitudes of 21.33 MPa was calculated using the data of residual strains, and the damage evolution curve of the composite specimen is shown in Figure 15. It can be seen from Figure 15 that the composite specimen’s damage variable during the cyclic fatigue process can be divided into three stages. In the initial stage (I), the damage variable decreased rapidly with the increase in cycles. During the steady-state stage (II), the damage variable increased at a constant rate with the increase in cycles. During the acceleration stage (III), as the damage accumulated to a certain extent, the damage variable started to increase rapidly until the composite specimen was destroyed. Compared to other rocks, the composite specimen contained more pores, especially in the concrete part. Under cyclic loading, the micro-cracks from pressure-sealing cracks and new cracks further expanded during the initial cycle, leading to some irreversible deformation. When the damage accumulated to a certain extent, a large number of new cracks began to appear in the composite specimen and gradually connected. Consequently, the damage variable started to increase more rapidly.
The damage variable of dissipated energy [26], shown in Equation (11), and the damage variable of residual strain [27], shown in Equation (12), were used for a comparative analysis of the damage evolution of the composite specimen.
D i = i n U ip U p
where Di is the damage variable of the i-th cycle, Uip is the cumulative energy dissipation at the i-th cycle, and Up is the total energy dissipation.
D i = i n ε ip ε p
where Di is the damage variable of the i-th cycle, εip is the cumulative residual strain at the i-th cycle, and εp is the total residual strain.
Figure 16 illustrates the calculated damage evolution of a composite specimen under a stress amplitude of 21.33 MPa in three different ways. It can be seen from Figure 16 that both the damage variable of cumulative energy dissipation and the damage variable of cumulative residual strain present a straight line with an increase in cycles. However, neither of them accurately represents the trend of rapid propagation, steady development, and accelerated expansion of cracks in rocks. This indicates that the damage calculated by these two methods cannot reflect the damage evolution characteristics of the specimen.

5. Conclusions

In conclusion, this study investigated the mechanical properties of rock and concrete composite specimens under cyclic loads. In accordance with the experimental results, the deformation characteristics and energy dissipation of composite specimens under cyclic loading were analyzed. The damage variable equation was deduced to evaluate the damage evolution of the specimen. Based on our research results, the following conclusions can be drawn.
Referring to the division method of the rock creep curve, the curve of residual strain and cycles can be divided into two stages for stress amplitudes less than 21.33 MPa: the deceleration accumulation stage and the stable accumulation stage.
The elastic modulus, as well as the dissipated energy, under different stress amplitudes decreased rapidly in the first three cycles. Subsequently, the elastic modulus gradually decreased at a constant rate. With the increase in stress amplitude to 21.33 MPa, the elastic modulus showed a rapid decreasing trend, while the dissipated energy showed an accelerated increase before specimen failure.
A damage variable was deduced, and the damage evolution curve of the composite specimen exhibited three distinct stages: the initial stage, the steady-state stage, and the acceleration stage.

Author Contributions

The first draft of the manuscript was written by H.L. and Z.H.; project administration, B.Z.; data curation, H.M. All authors have read and agreed to the published version of the manuscript.

Funding

This research was funded by the National Natural Science Foundation of China, grant number 41302223, the Scientific and Technological Research Program of Chongqing Municipal Education Commission, grant number KJZD-K202101505, And Tibet Autonomous Region Science and Technology Program XZ202301ZY0037G.

Data Availability Statement

The data underlying this article are available in the article.

Conflicts of Interest

Author Hongjun Li was employed by the company China Anergy Group Third Engineering Bureau Co., Ltd. Author Zhengjun Hou was employed by the company Chengdu Sunvison Intelligent Technology Co., Ltd. The remaining authors declare that the research was conducted in the absence of any commercial or financial relationships that could be construed as a potential conflict of interest.

References

  1. Xue, F.; Lin, Z.; Wang, T. Experimental study on effects of cyclic loading paths on cracking behavior and fracture characteristics of granite. Eng. Fract. Mech. 2024, 295, 109761. [Google Scholar] [CrossRef]
  2. Liu, Y.; Dai, F. A review of experimental and theoretical research on the deformation and failure behavior of rocks subjected to cyclic loading. J. Rock Mech. Geotech. Eng. 2021, 13, 1203–1230. [Google Scholar] [CrossRef]
  3. Arora, K.; Chakraborty, T.; Rao, K.S. Experimental study on stiffness degradation of rock under uniaxial cyclic sinusoidal compression loading. Rock Mech. Rock Eng. 2019, 52, 4785–4797. [Google Scholar] [CrossRef]
  4. Meng, Q.; Liu, J.; Pu, H.; Yu, L.; Wu, J.; Wang, C. Mechanical properties of limestone after high-temperature treatment under triaxial cyclic loading and unloading conditions. Rock Mech. Rock Eng. 2021, 54, 6413–6437. [Google Scholar] [CrossRef]
  5. Xiao, F.; Jiang, D.; Wu, F.; Zou, Q.; Chen, J.; Chen, B.; Sun, Z. Effects of prior cyclic loading damage on failure characteristics of sandstone under true-triaxial unloading conditions. Int. J. Rock Mech. Min. Sci. 2020, 132, 104379. [Google Scholar] [CrossRef]
  6. Tang, L.X.; Fan, J.Y.; Li, Z.Z.; Chen, J.; Liu, W. A new constitutive model for salt rock under cyclic loadings based on state variables. Geoenergy Sci. Eng. 2024, 233, 212433. [Google Scholar] [CrossRef]
  7. Guo, J.C.; Li, X.Y.; Lu, C. Modified Model and Simulation Verification of Rock-Fatigue Damage Considering Repeated Discharge Impact. Processes 2023, 11, 2366. [Google Scholar] [CrossRef]
  8. Ren, C.H.; Yu, J.; Liu, X.Y. Cyclic constitutive equations of rock with coupled damage induced by compaction and cracking. Int. J. Min. Sci. Technol. 2022, 32, 1153–1165. [Google Scholar] [CrossRef]
  9. Li, Y.Q.; Huang, D. Mechanical Responses and Damage Model of Anchored Jointed Rock Mass under Fatigue Shear Load. Int. J. Geomech. 2022, 23, 3. [Google Scholar] [CrossRef]
  10. Li, P.; Cai, M. Energy evolution mechanism and failure criteria of jointed surrounding rock under uniaxial compression. J. Cent. S. Univ. 2021, 28, 1857–1874. [Google Scholar] [CrossRef]
  11. Peng, R.D.; Ju, Y.; Wang, J.G.; Xie, H.P.; Gao, F.; Mao, L.T. Energy Dissipation and Release During Coal Failure Under Conventional Triaxial Compression. Rock Mech. Rock Eng. 2015, 48, 509–526. [Google Scholar] [CrossRef]
  12. Sun, Y.D.; Yang, Y. Energy and Fatigue Damage Evolution of Sandstone under Different Cyclic Loading Frequencies. Shock. Vib. 2021, 2021, 5585983. [Google Scholar] [CrossRef]
  13. Meng, Q.B.; Liu, J.F.; Pu, H.; Huang, B.X.; Zhang, Z.Z.; Wu, J.Y. Effects of cyclic loading and unloading rates on the energy evolution of rocks with different lithology. Geomech. Energy Environ. 2023, 34, 100455. [Google Scholar] [CrossRef]
  14. Graf, O.; Brenner, E. Experiments for investigating the resistance of concrete under often repeated compression loads. Bull. Dtsch. Aussch. Fur Stahlbeton Berl. 1934, 35, 17–25. [Google Scholar]
  15. Cook, D.J.; Chindaprasirt, P. Influence of loading history upon the compressive properties of concrete. Mag. Concr. Res. 1980, 32, 89–100. [Google Scholar] [CrossRef]
  16. Long, X.; Mao, M.H.; Su, T.X.; Su, Y.T.; Tian, M.K. Machine learning method to predict dynamic compressive response of concrete-like material at high strain rates. Def. Technol. 2023, 23, 100–111. [Google Scholar] [CrossRef]
  17. Yang, S.C. Special Issue on Fatigue, Performance, and Damage Assessments of Concrete. Appl. Sci. 2024, 14, 1845. [Google Scholar] [CrossRef]
  18. Bian, H.B.; Liu, Y.Z.; Guo, Y.D.; Liu, Y.; Shi, W.J. Investigating stress–strain relationship and damage constitutive model of basalt fiber reinforced concrete under uniaxial compression. J. Build. Eng. 2023, 73, 106789. [Google Scholar] [CrossRef]
  19. Lei, X.; Sun, X.J.; Yu, Z.P.; Guan, Z.X.; Long, A.X.; Lian, H.H.; Lian, Y.J. Experimental study and theoretical analysis on dynamic mechanical properties of basalt fiber reinforced concrete. J. Build. Eng. 2022, 62, 105334. [Google Scholar]
  20. Li, X.N.; An, H.W.; Chen, Y.L.; Qin, Y.; Li, Y.C.; Zhou, Y.J. Mechanical properties of recycled aggregate concrete under cyclic loading and unloading in alpine areas. J. Build. Eng. 2024, 85, 108759. [Google Scholar] [CrossRef]
  21. Feng, S.W.; Zhou, Y.; Wang, Y.; Lei, M.D. Experimental research on the dynamic mechanical properties and damage characteristics of lightweight foamed concrete under impact loading. Int. J. Impact Eng. 2020, 140, 103558. [Google Scholar] [CrossRef]
  22. He, H.Q.; Liang, X.; Shang, J.K.; Long, Y.S. Experimental study on residual mechanical properties after cyclic loading of steel-concrete composite-laminated beams. Case Stud. Constr. Mater. 2023, 19, 202257. [Google Scholar] [CrossRef]
  23. Zhang, B.; Gao, Y.H.; Zheng, H.Z.; Xu, F.; Zhang, Q.B.; Wang, S.Z. Seismic behaviour and modelling of rectangular FRP-concrete-steel tubular columns under axial compression and cyclic lateral loading. Structures 2023, 48, 1505–1518. [Google Scholar] [CrossRef]
  24. DZ/T 0276.19-2015 19; Regulation for Testing the Physical and Mechanical Properties of Rock-Part 19: Test for Determing the Deformability of Rock in Uniaxiail Compression. Standards Press of China: Beijing, China, 2015. (In Chinese)
  25. Li, T.T.; Pei, X.J.; Guo, J.; Meng, M.H.; Huang, R.Q. An Energy-Based Fatigue Damage Model for Sandstone Subjected to Cyclic Loading. Rock Mech. Rock Eng. 2020, 53, 5069–5079. [Google Scholar] [CrossRef]
  26. LI, S.C.; Xu, J.; Tao, Y.Q.; Tang, X.-J.; Yang, H.-W. Low cycle fatigue damage model and damage cariable expression of rock. Rock Soil Mech. 2009, 30, 1611–1614+1619. (In Chinese) [Google Scholar]
  27. Liu, Y.; Dai, F.; Dong, L.; Xu, N.; Feng, P. Experimental investigation on the fatigue mechanical properties of intermittently jointed rock models under cyclic uniaxial compression with different loading parameters. Rock Mech. Rock Eng. 2018, 51, 47–68. [Google Scholar] [CrossRef]
Figure 1. Pictures and schematic diagram of rock–concrete composite specimens. (a) Schematic diagram of rock–concrete composite specimens; (b) pictures of rock–concrete composite specimens.
Buildings 14 00854 g001
Figure 2. TFD-2000 microcomputer servo-controlled triaxial testing machine.
Buildings 14 00854 g002
Figure 3. Uniaxial stress−strain curves. (a) The uniaxial compression stress−strain curve; (b) the four-stage diagram of uniaxial compression.
Buildings 14 00854 g003
Figure 4. Stress path diagram of the cyclic loading and unloading test.
Buildings 14 00854 g004
Figure 5. Stress–strain curve of a rock–concrete composite specimen under different upper cycle loads. (a) Stress amplitude of 12.18 MPa; (b) stress amplitude of 15.03 MPa; (c) stress amplitude of 18.28 MPa; (d) stress amplitude of 21.33 MPa.
Buildings 14 00854 g005
Figure 6. The curve of residual strain vs. cycles under cyclic loads.
Buildings 14 00854 g006
Figure 7. The curve of residual strain rate vs. cycles under cyclic loads (stress amplitudes less than 21.33 MPa).
Buildings 14 00854 g007
Figure 8. The curve of residual strain rate vs. cycles under cyclic loads (stress amplitude of 21.33 MPa).
Buildings 14 00854 g008
Figure 9. The evolution curves of the elastic modulus of the composite specimen under different stress amplitudes.
Buildings 14 00854 g009
Figure 10. The damage evolution of the rock–concrete composite specimen under cyclic loads.
Buildings 14 00854 g010
Figure 11. The microstructures of the rock–concrete composite specimen after failure. (a) Rock; (b) concrete.
Buildings 14 00854 g011
Figure 12. The schematic diagram of sandstone energy calculation under cyclic loading and unloading conditions.
Buildings 14 00854 g012
Figure 13. The energy evolution curve of the composite specimen under different stress amplitudes less than 21.33 MPa.
Buildings 14 00854 g013
Figure 14. The energy evolution curve of composite specimens under a stress amplitude of 21.33 MPa.
Buildings 14 00854 g014
Figure 15. The damage evolution curve of the composite specimen under a stress amplitude of 21.33 MPa.
Buildings 14 00854 g015
Figure 16. The damage evolution curve of the composite specimen under a stress amplitude of 21.33 MPa.
Buildings 14 00854 g016
Table 1. Uniaxial cyclic loading and unloading test plan.
Specimen/NoUpper Stress/MPaLower Stress/MPaStress Amplitude/MPaCycles/NLoading
Speed/(kN/s)
RC-118.296.1112.182000.2
RC-221.346.1115.032000.2
RC-324.396.1118.282000.2
RC-427.446.1121.332000.2
Disclaimer/Publisher’s Note: The statements, opinions and data contained in all publications are solely those of the individual author(s) and contributor(s) and not of MDPI and/or the editor(s). MDPI and/or the editor(s) disclaim responsibility for any injury to people or property resulting from any ideas, methods, instructions or products referred to in the content.

