
Investigation of the Post-Fire Behavior of Different End-Plated Beam–Column Connections


Abstract
:1. Introduction
2. Materials and Methods
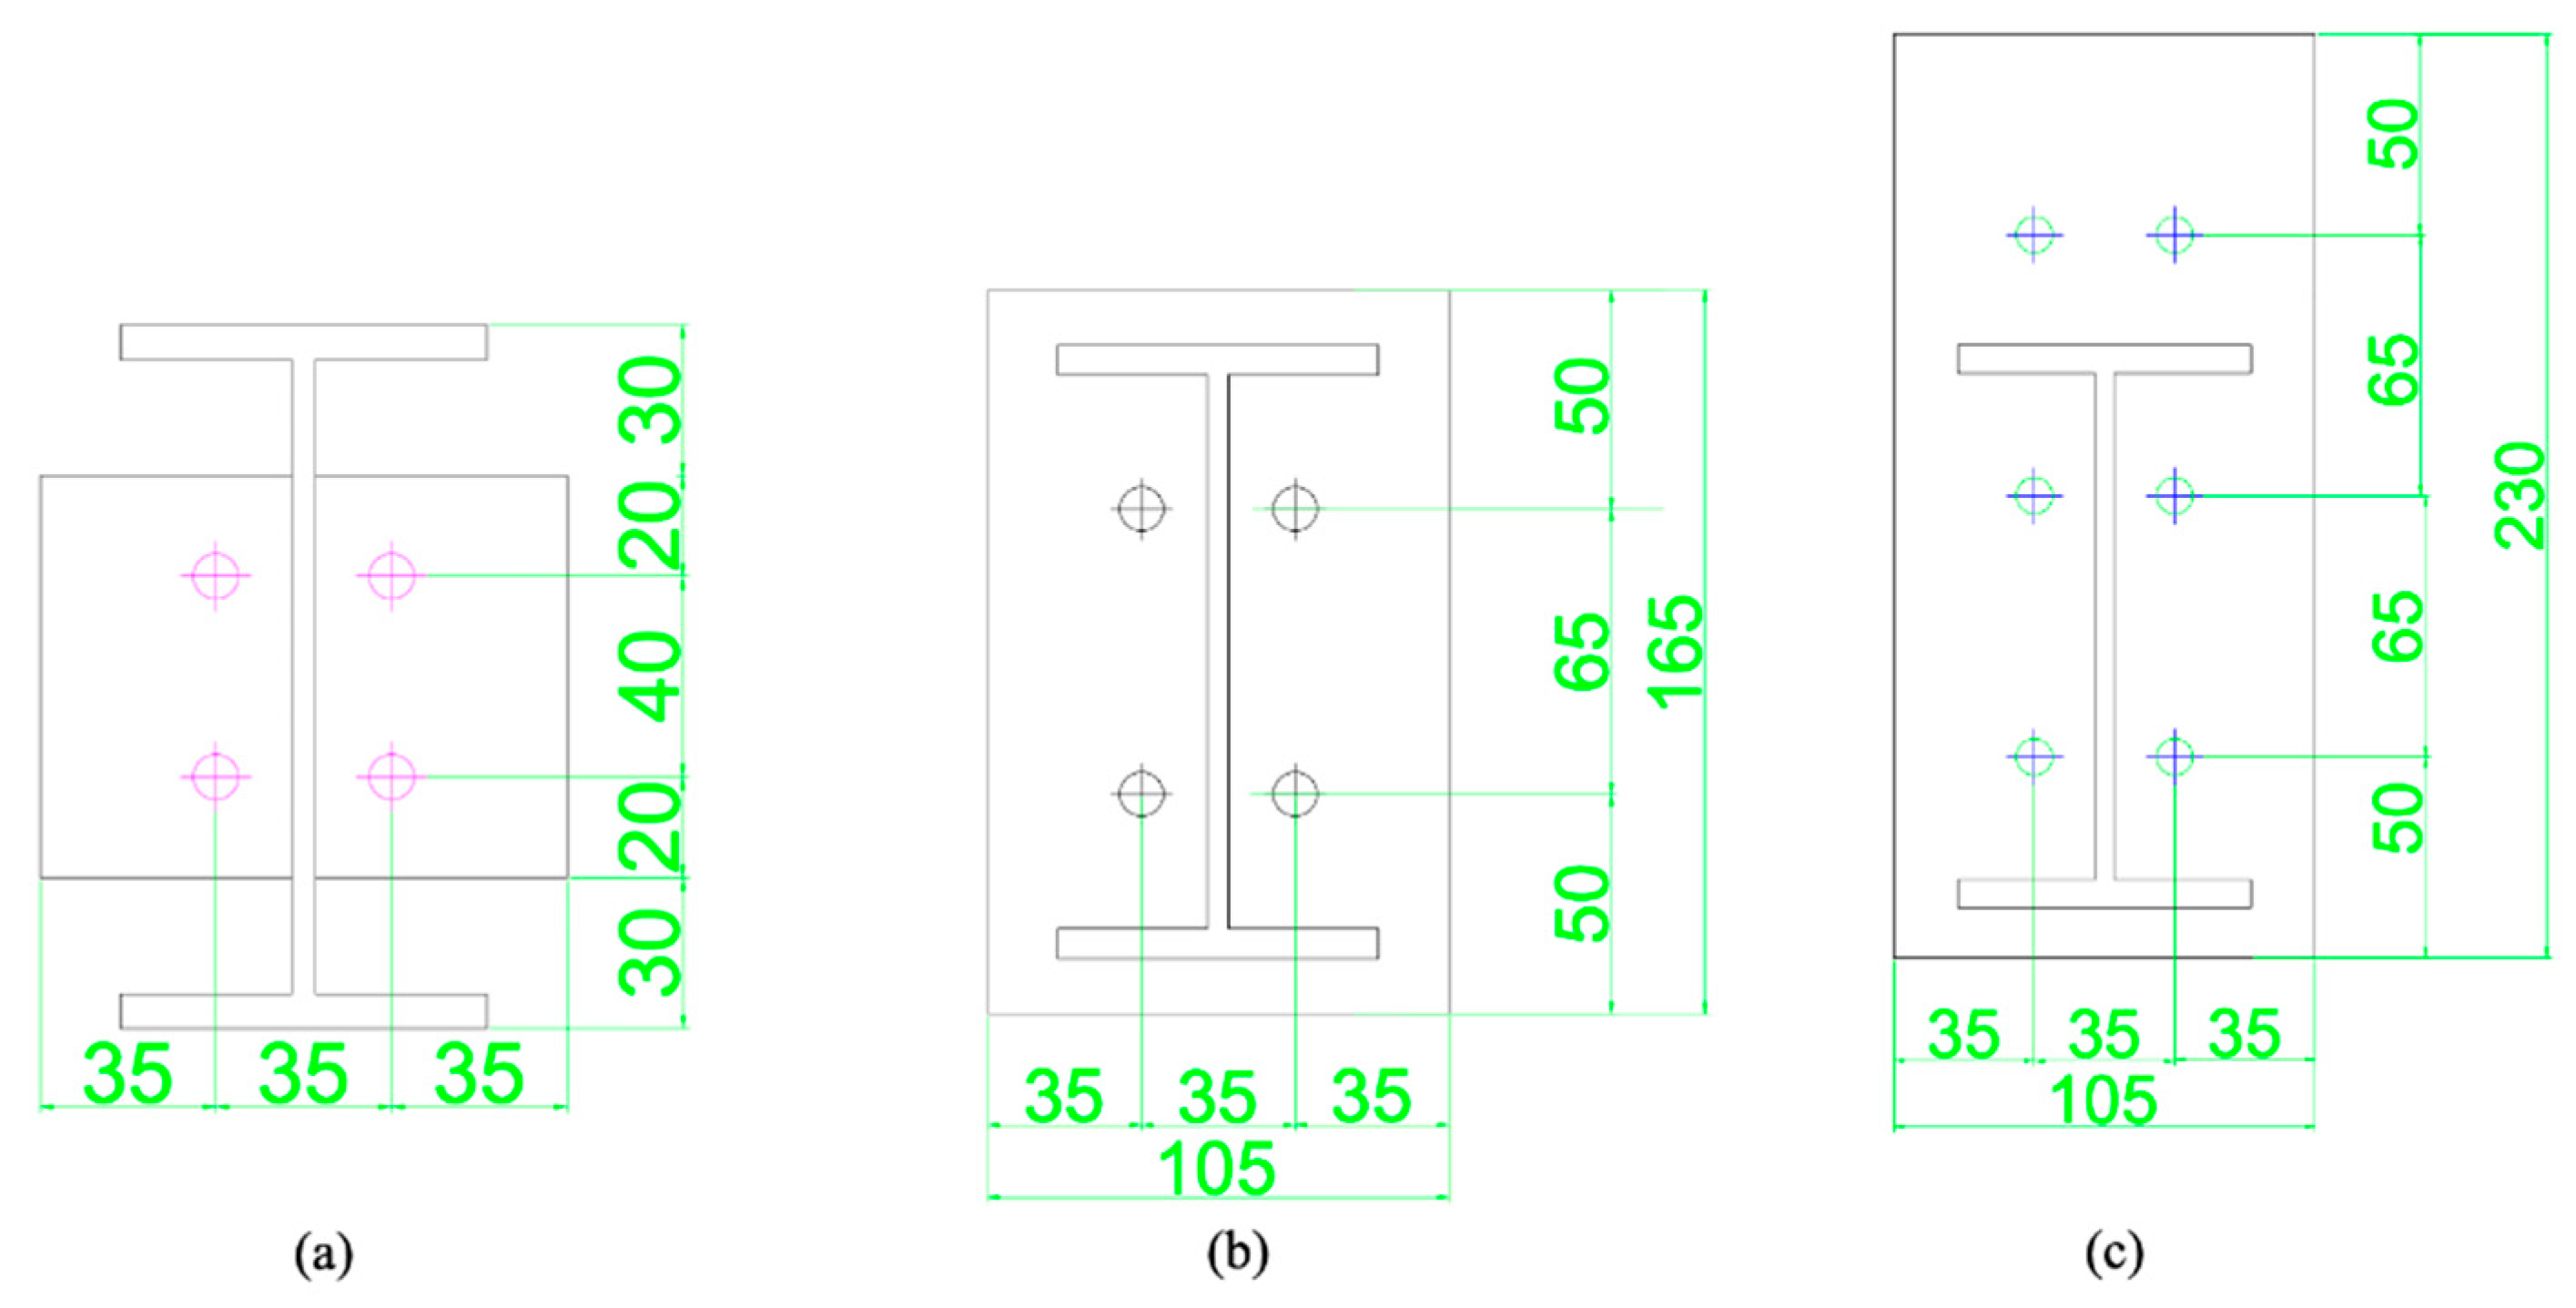
2.1. Connection Details
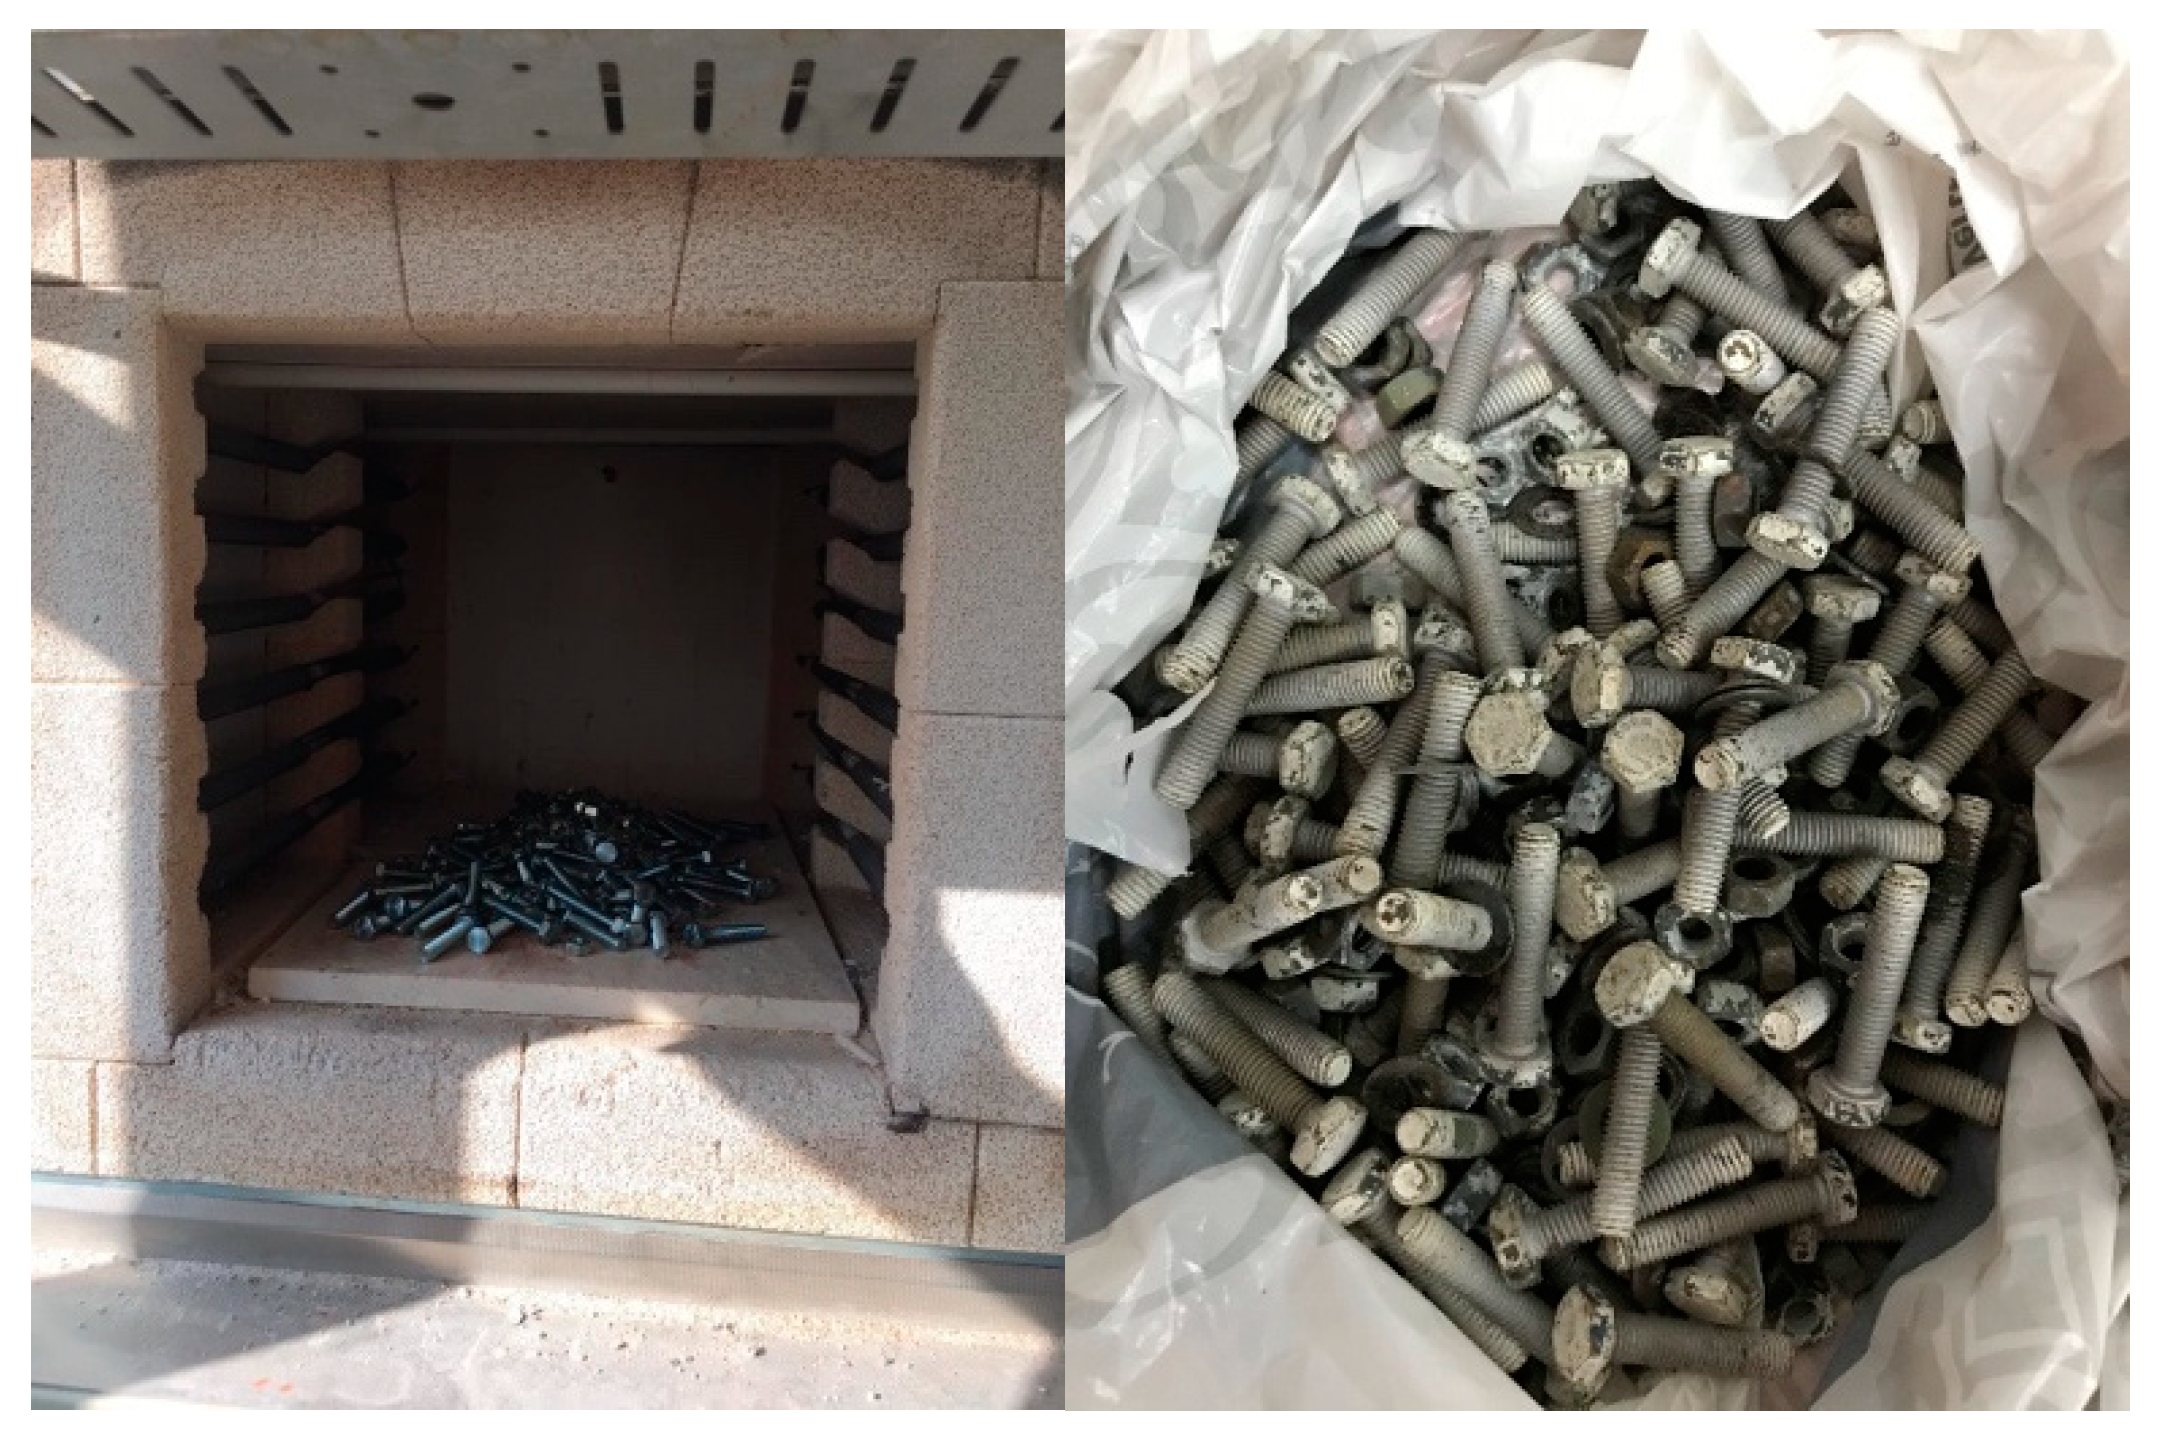
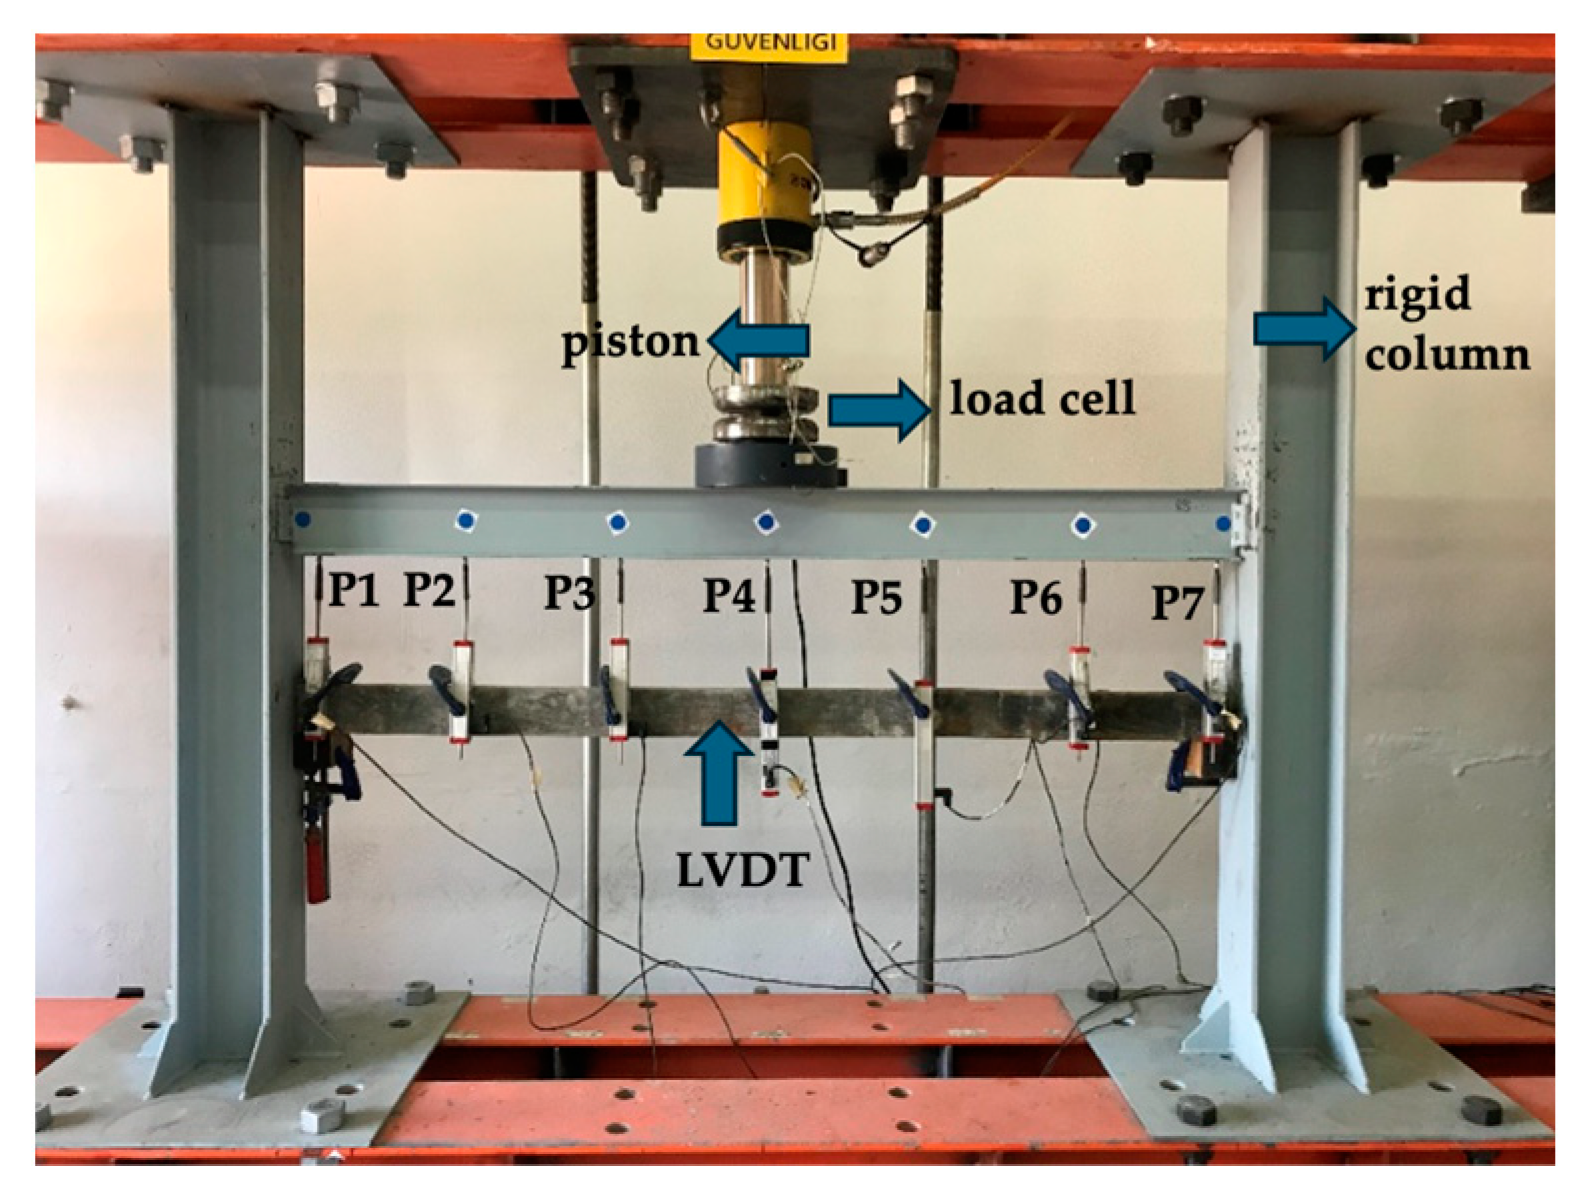
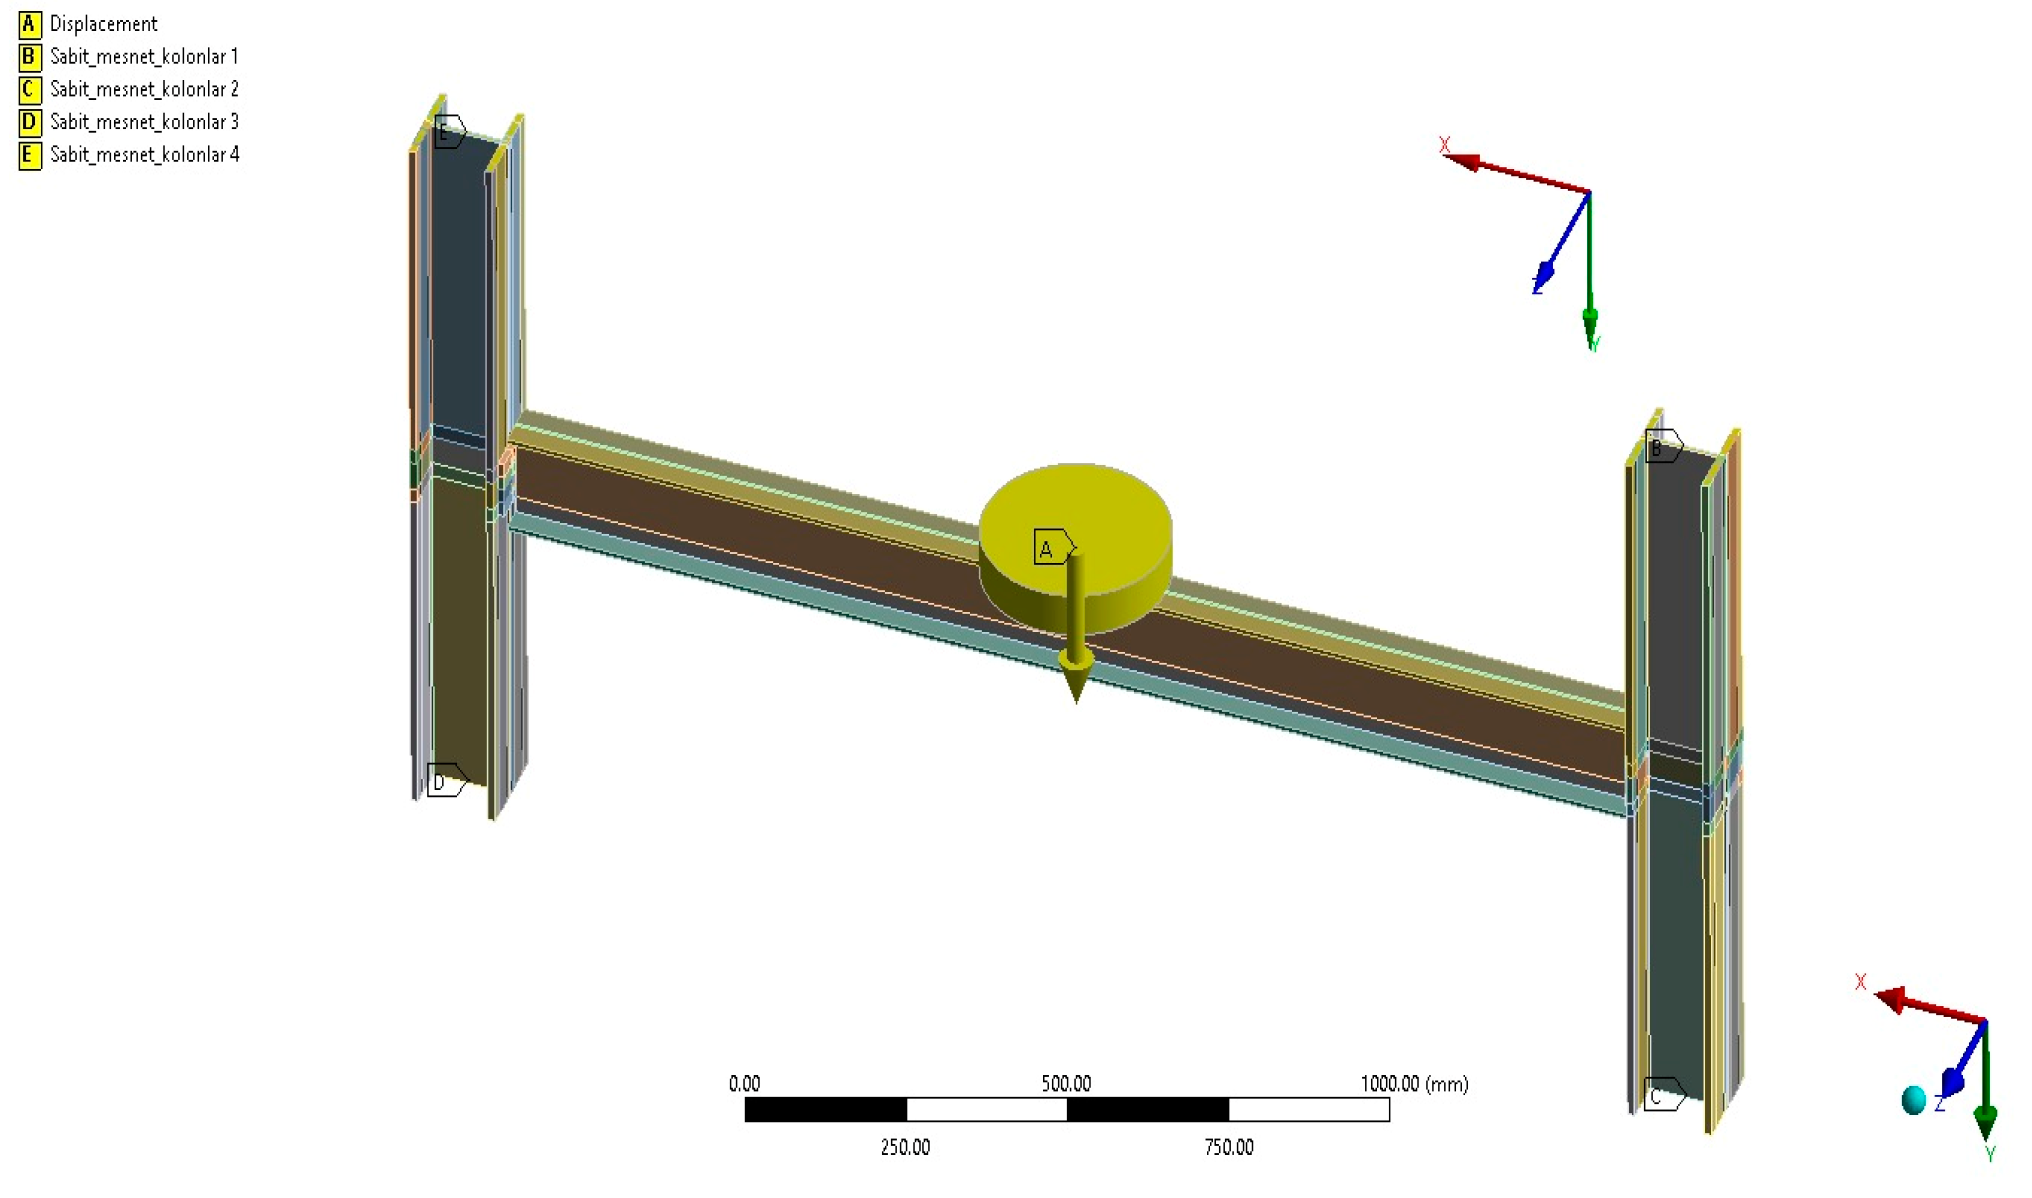
2.2. Experimental Setup
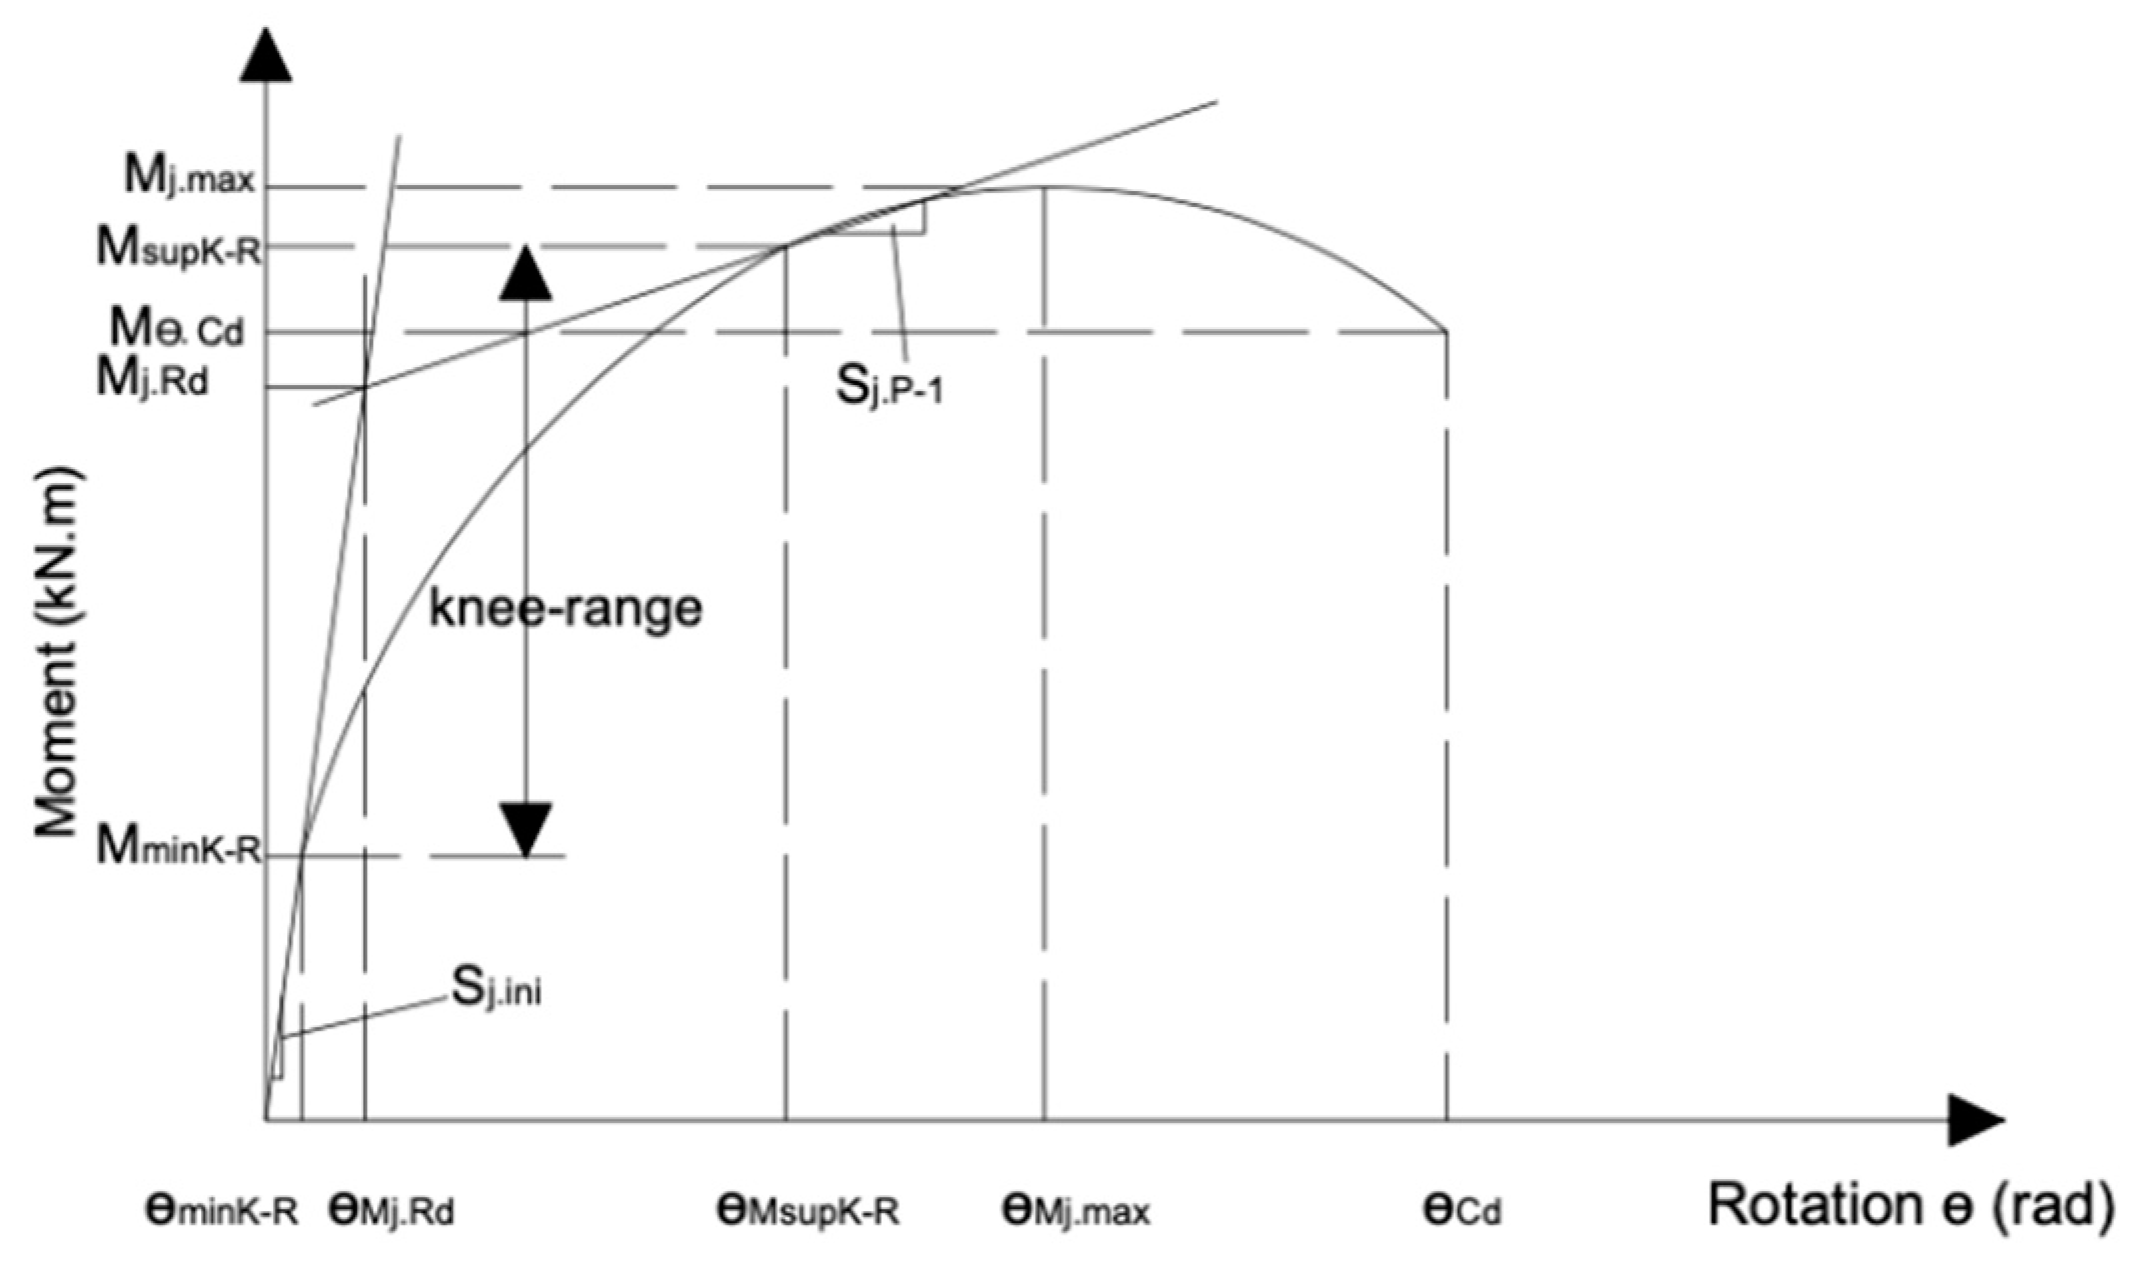
2.3. Moment–Rotation Relationships
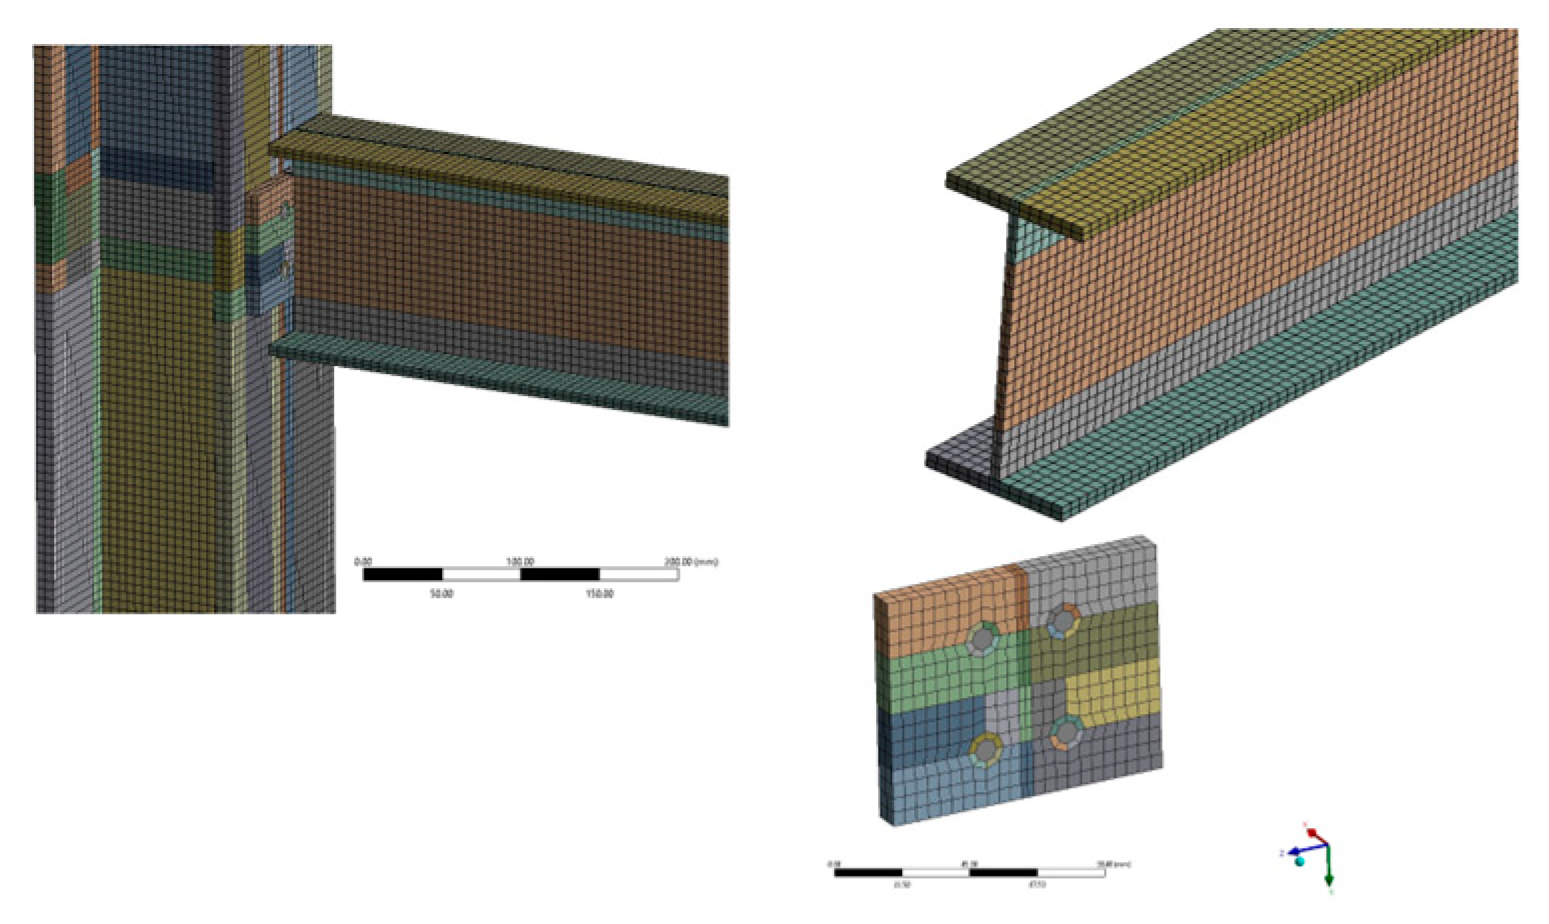
2.4. Finite Element Method
3. Experimental Results
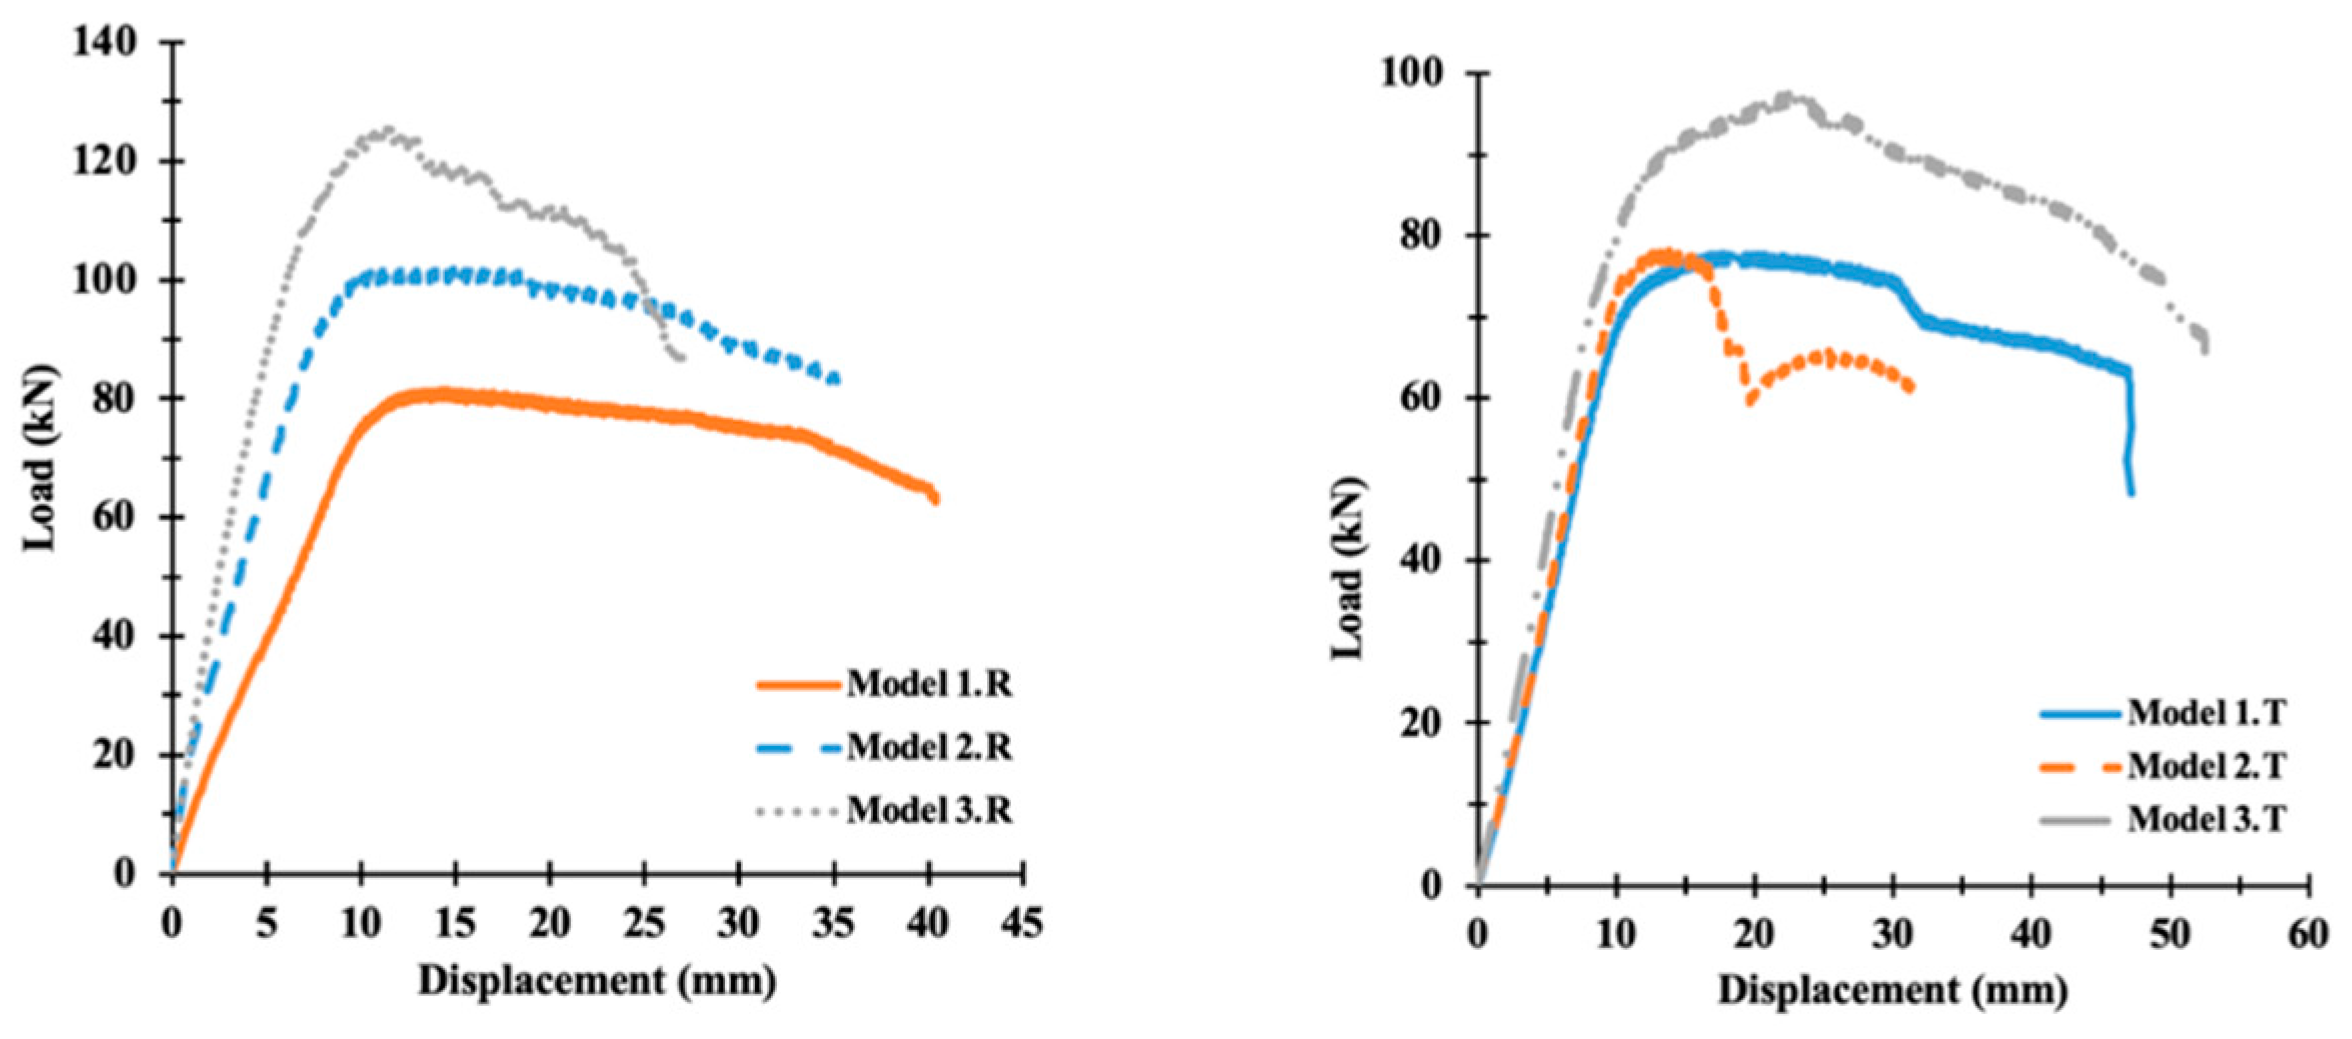
4. Moment–Rotation Relationships Obtained from Experiments
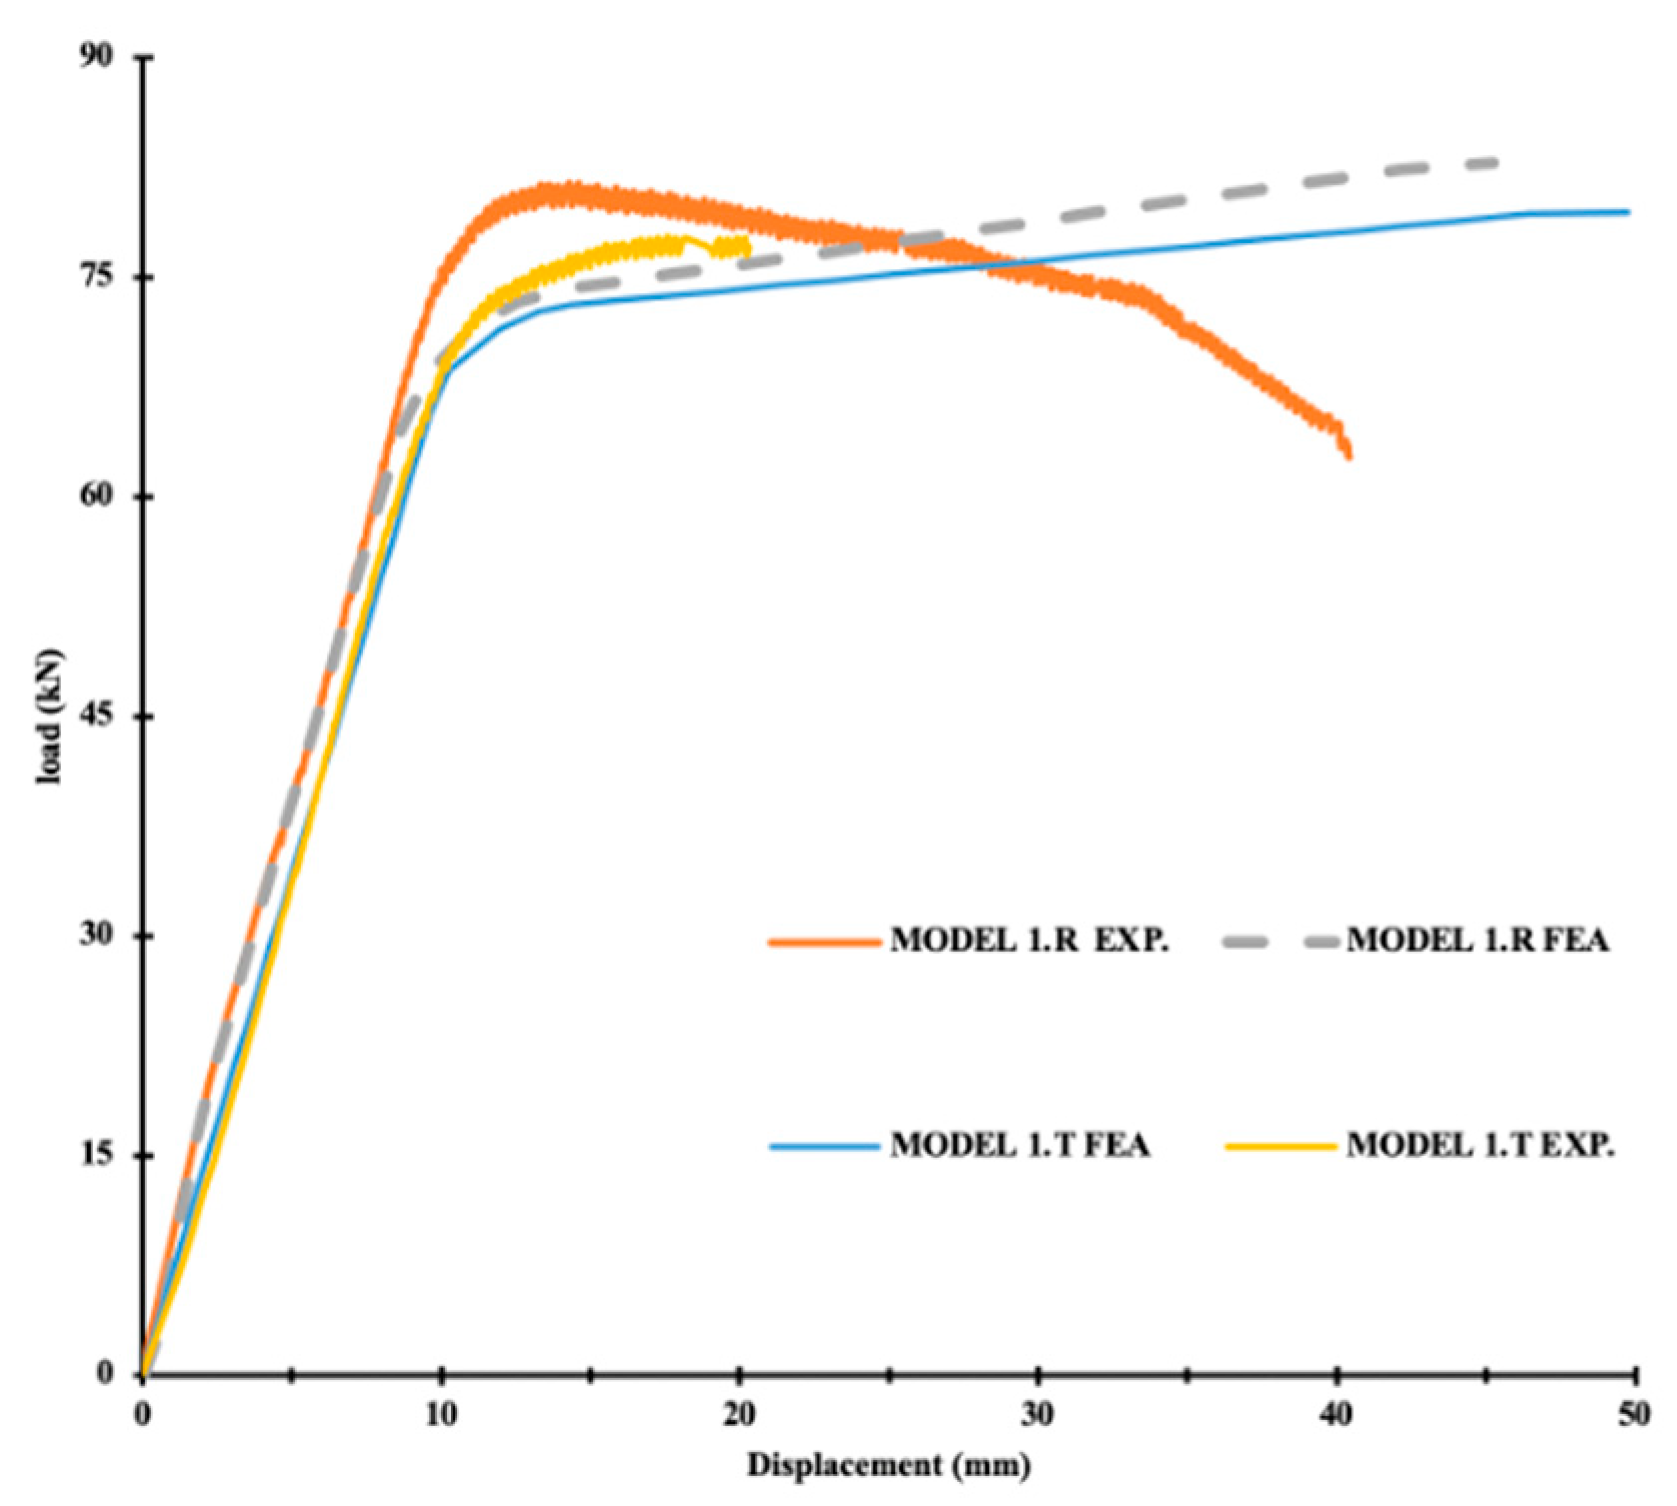
5. Finite Element Analysis Results
6. Conclusions
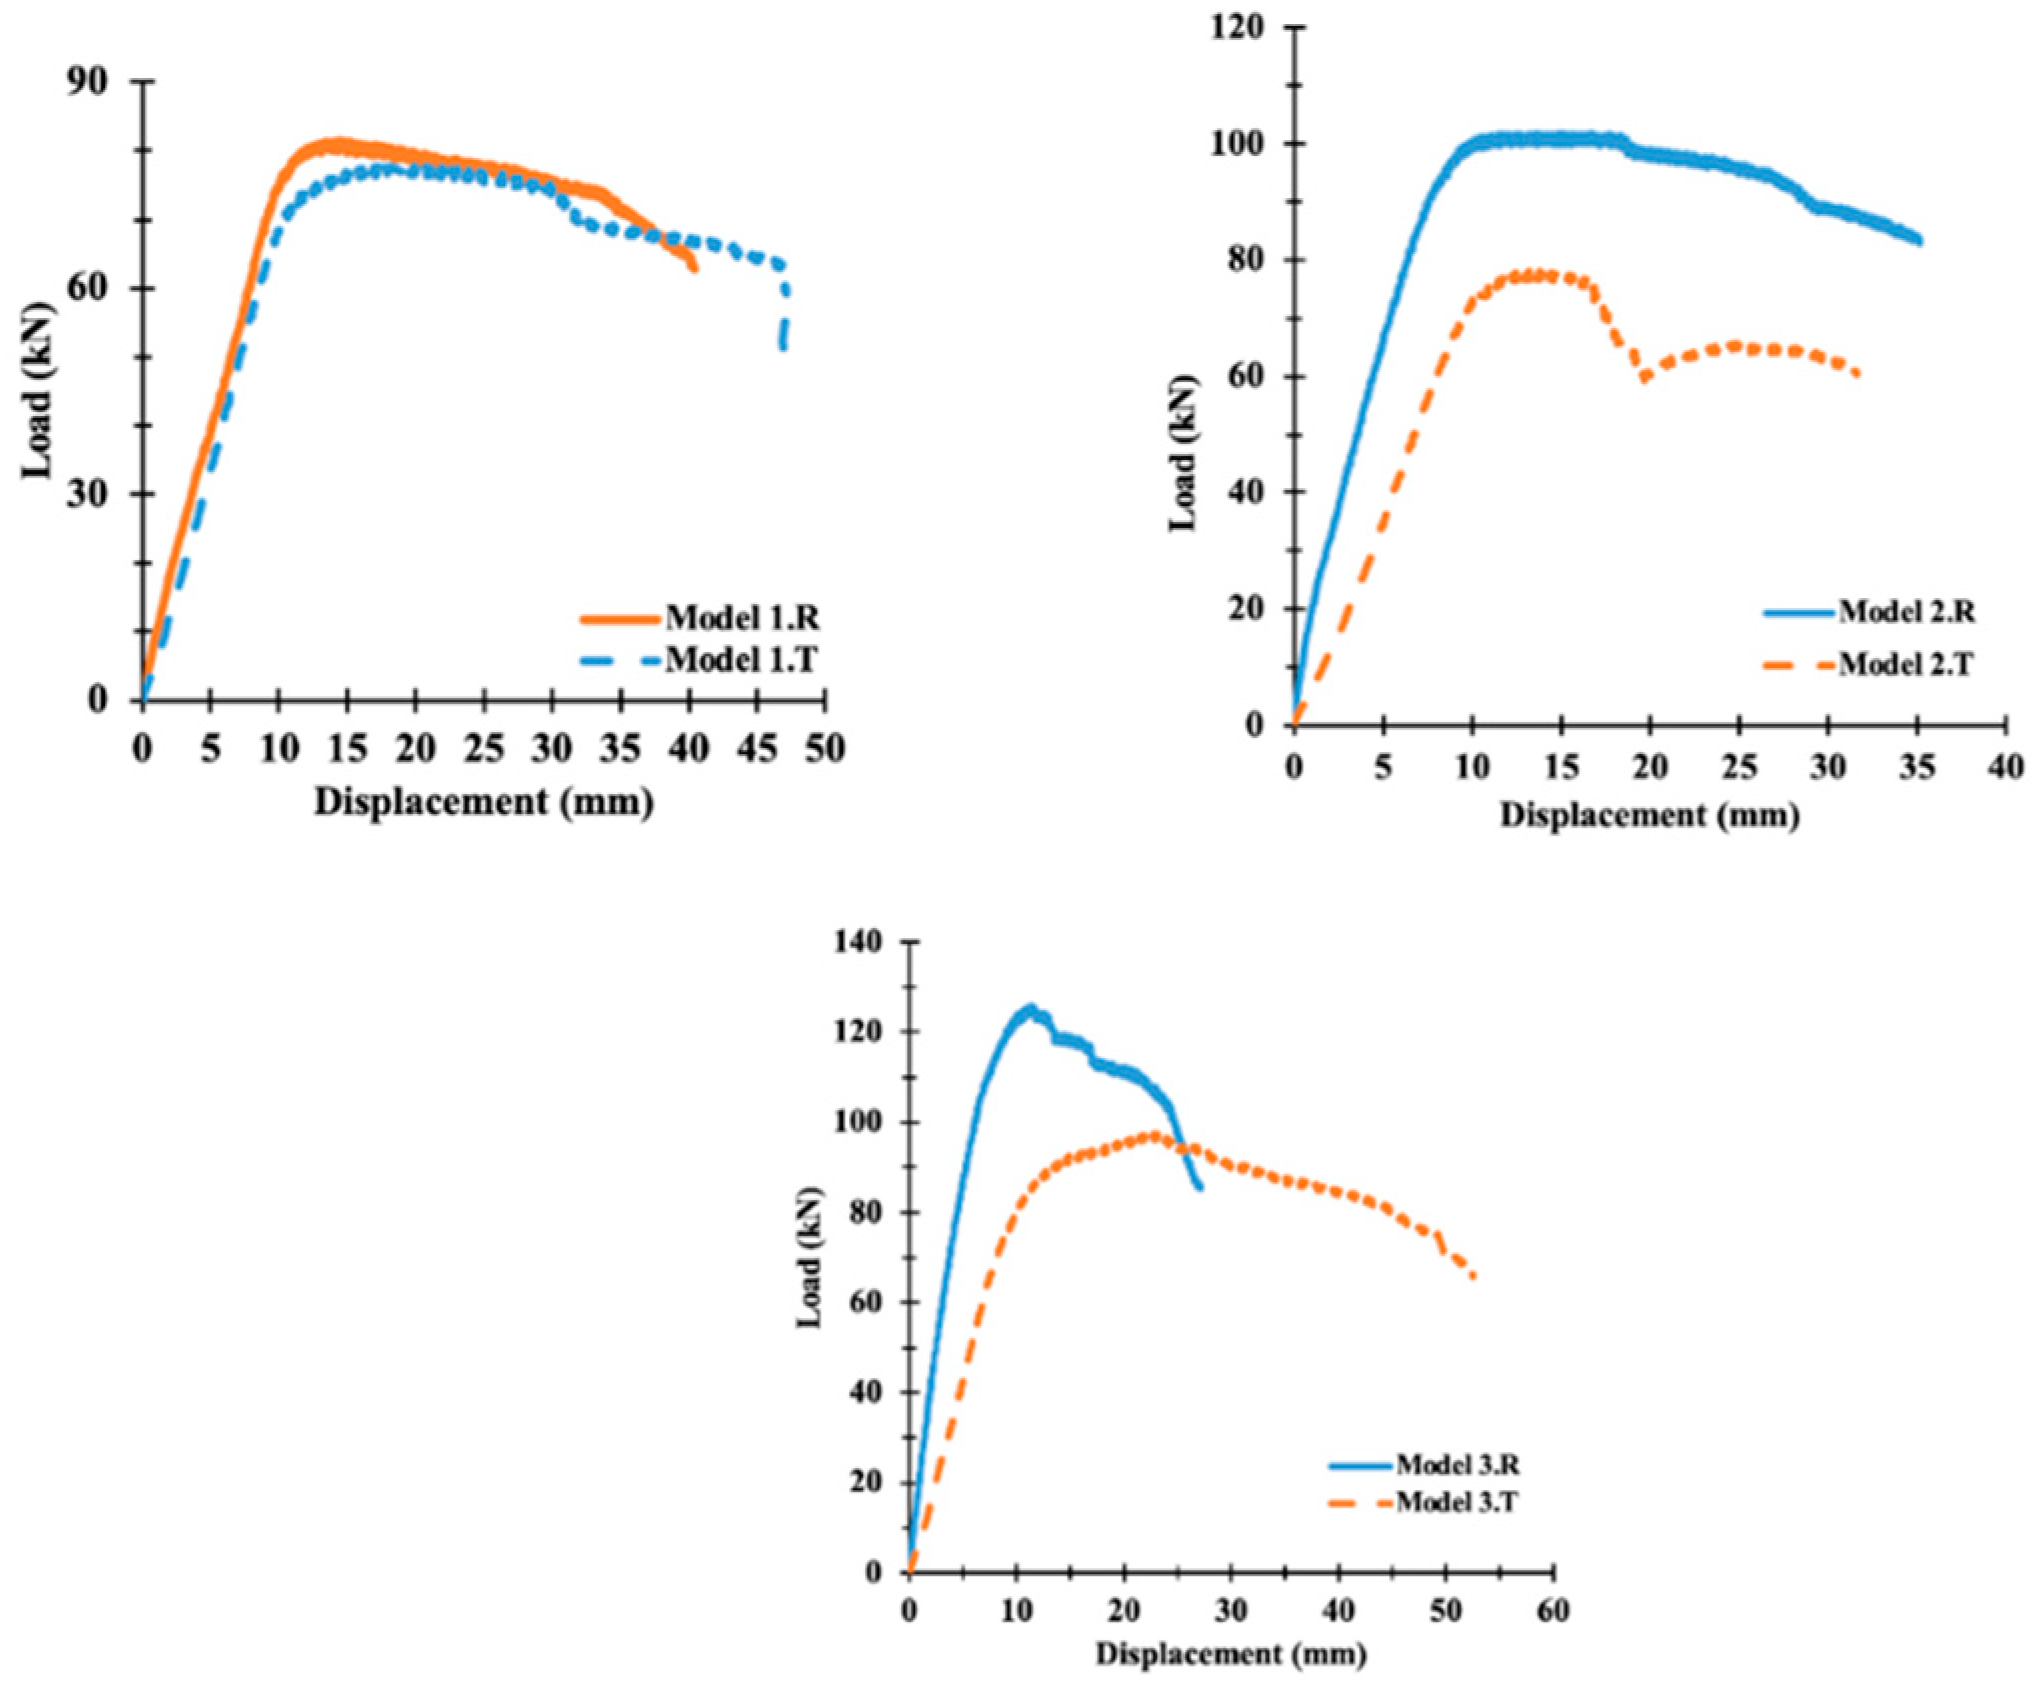
- Heating the connection elements reduces the load-bearing capacity of the connection while increasing the deflection in the beam.
- Heating the connection elements reduced the connection stiffness.
- Increasing the end plate length increased the load-bearing capacity of the beam and reduced the amount of deflection at room temperature. When the connection elements were heated, the increase in the end plate length increased both the load-bearing capacity and the value of deflection.
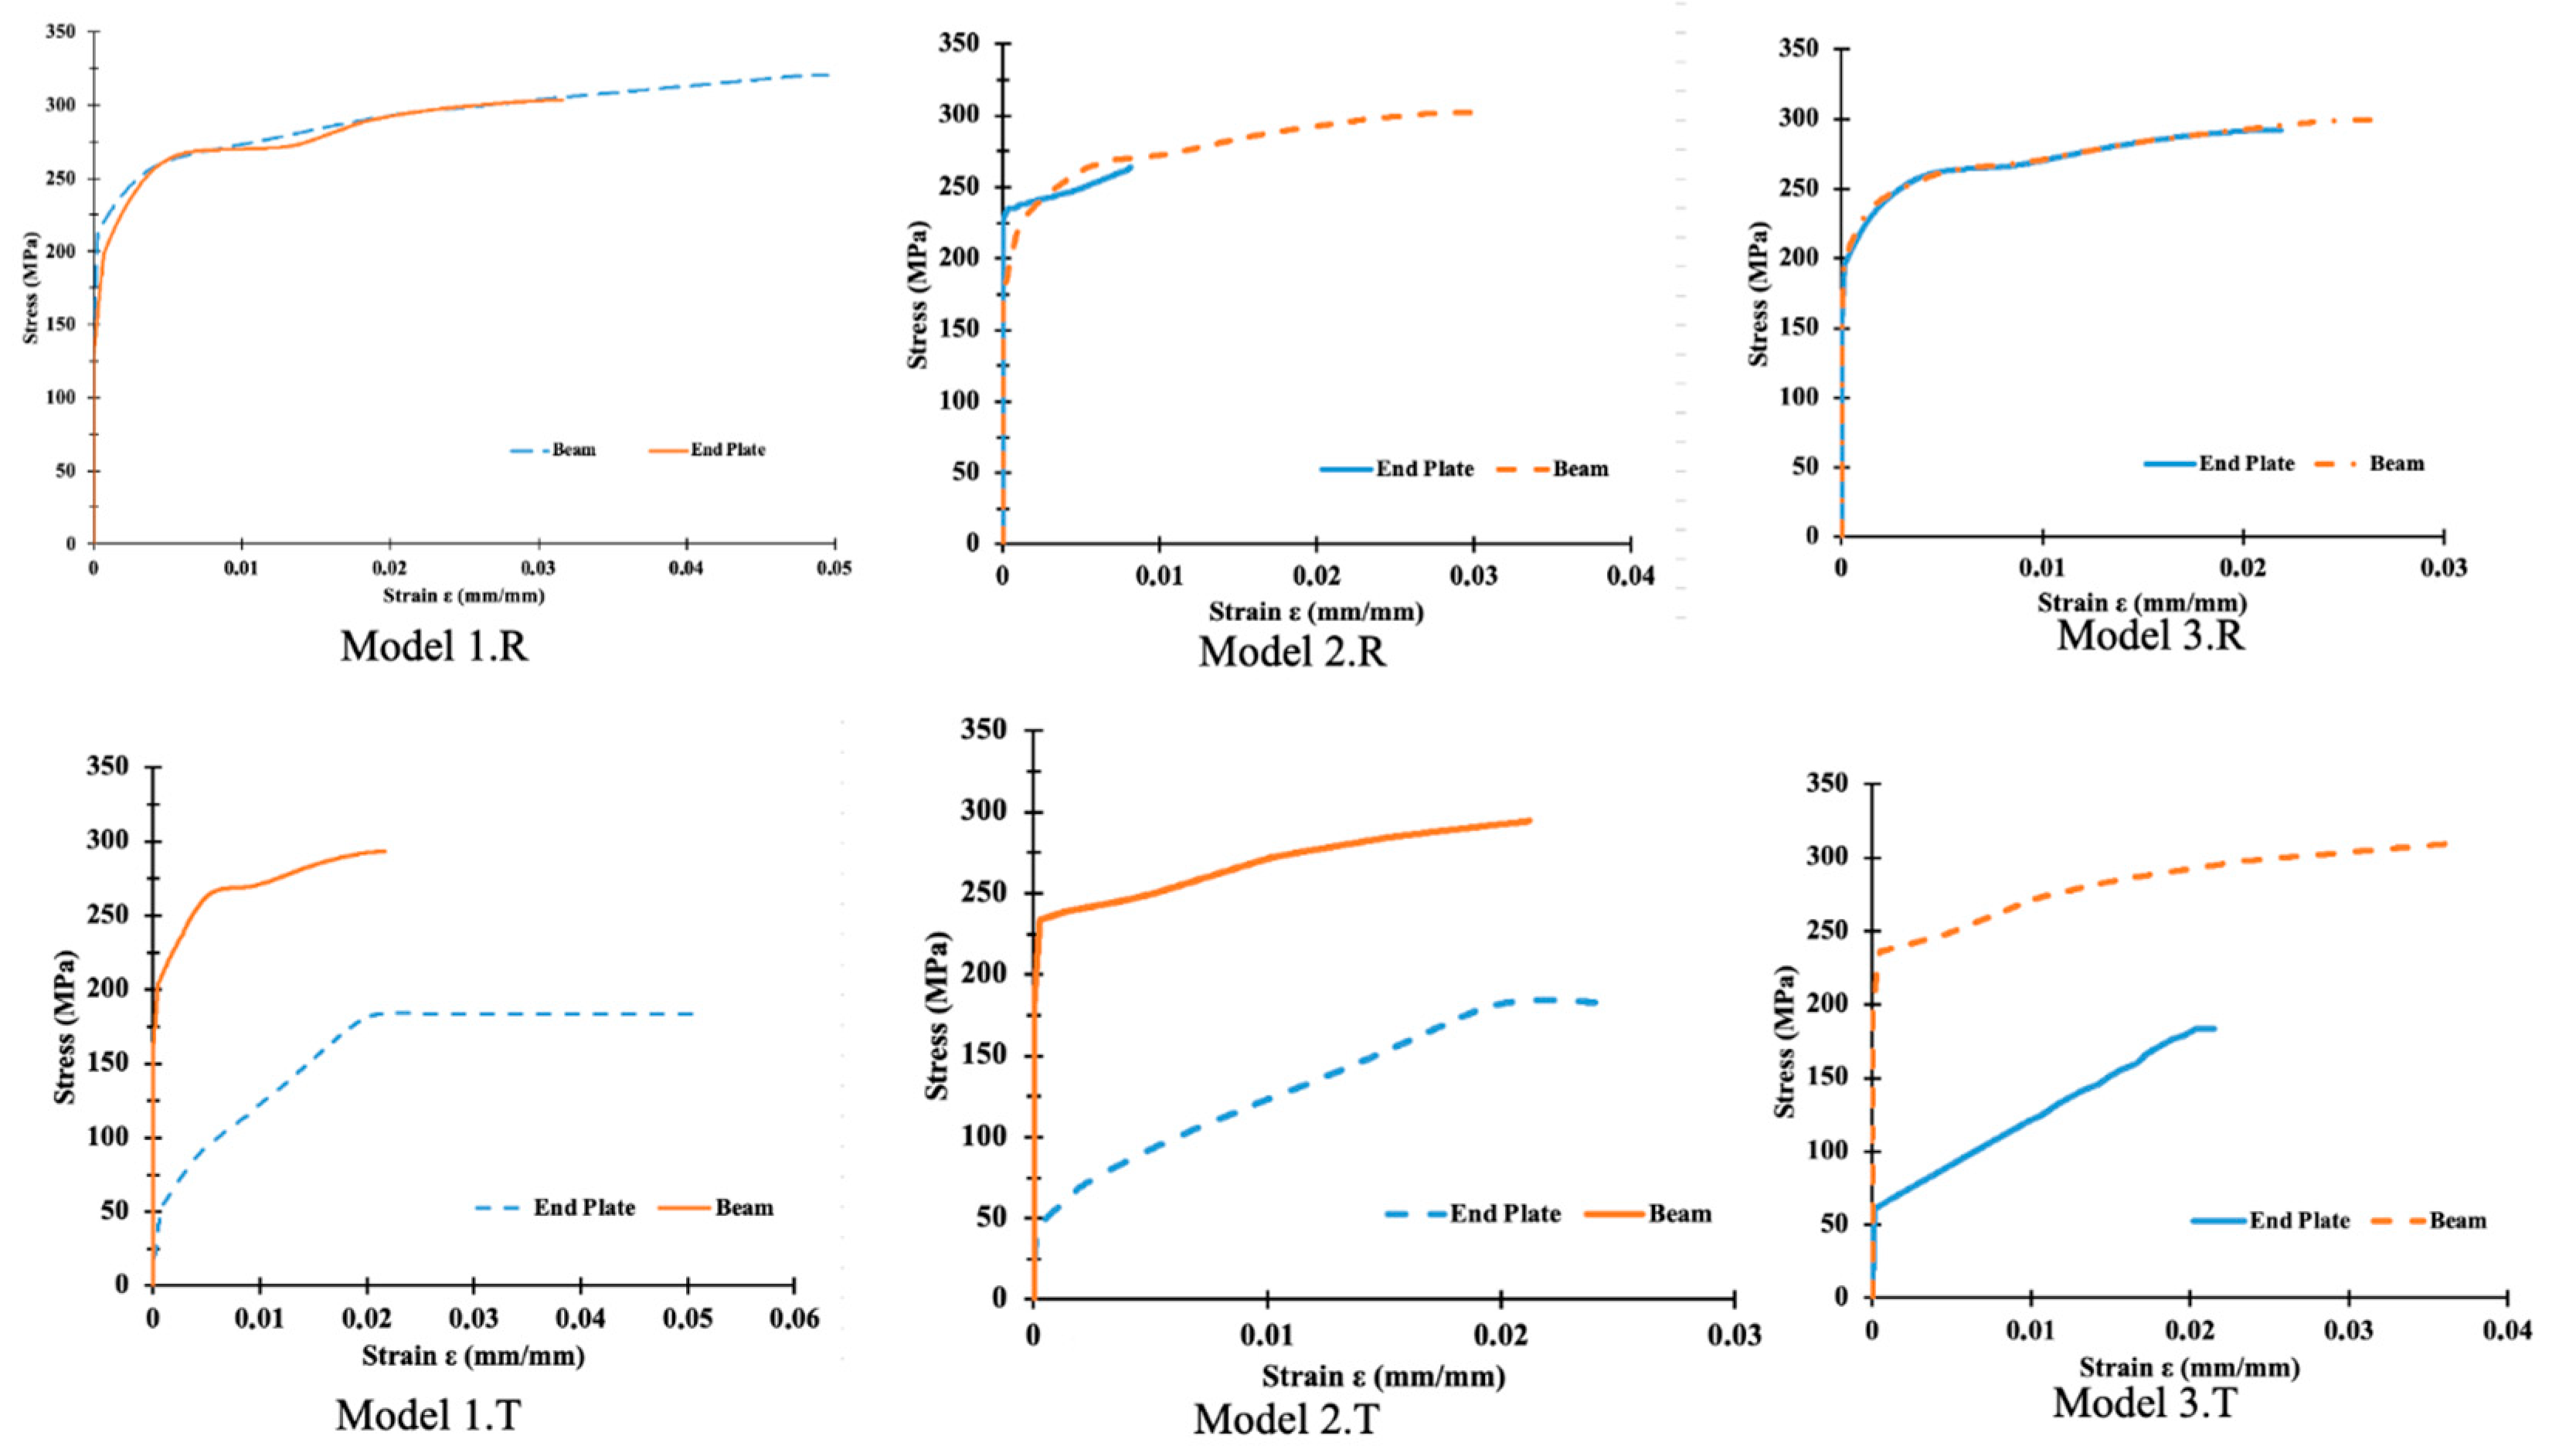
- The plastic bending strength and the bending moment capacity of the connection increased with the increase in end plate length. However, heat reduced the plastic bending strength of the connection. The increase in end plate length increased the rotation capacity of the connection with heat.
- Heat softened the connection. In other words, connections with heat reached the maximum moment value by performing more vertical displacement compared to without-heat models. In room temperature connections, the connection reached the maximum moment value with less rotation because of the increase in end plate length.
- The ductility coefficient of the connection increased with the increase in end plate height in the room temperature connection. The ductility coefficient of the connection decreased with the heat.
- Load-bearing capacity and the slope of the moment–rotation curve reduced because of the heat. For this reason, plastic bending strengths decreased with heat effects, too.
- Heating and then reusing the connection elements reduced the load-bearing capacity of the beam. Even at the limit temperature threshold of 600 °C, the decrease in load-bearing capacity indicates that higher temperatures occurring in a fire could result in a more significant loss of load-bearing capacity. Therefore, even during the post-fire repair stage, collapses could occur.
- The finite element model created in the numerical analysis, validated by the experimental results, can be used for future research, and the number of samples can be increased.
- Frames with different material and connection details can be loaded up to a certain capacity and then exposed to fire, allowing for comparison between fire and environmental loads.
- In the frame, seismic load can be applied first, and then fire effect can be studied.
- In the frame, the post-fire seismic behavior of different joints can be studied via finite elements.
Author Contributions
Funding
Data Availability Statement
Acknowledgments
Conflicts of Interest
References
- Dai, X.H.; Wang, Y.; Bailey, C.G. Numerical Modelling of Structural Fire Behaviour of Restrained Steel Beam Column Assemblies Using Typical Joint Types. Eng. Struct. 2010, 32, 2337–2351. [Google Scholar] [CrossRef]
- Li, J.T.; Li, G.Q.; Lou, G.B.; Chen, L.Z. Experimental Investigation on Flush End-Plate Bolted Composite Connection in Fire. J. Constr. Steel Res. 2012, 76, 121–132. [Google Scholar] [CrossRef]
- Li, G.Q.; Chen, L.Z.; Li, J.T.; Lou, G.B. Modeling of End-Plate Bolted Composite Connection in Fire Considering Axial Force Effects. J. Constr. Steel Res. 2012, 76, 133–143. [Google Scholar] [CrossRef]
- Qiang, X. Behaviour of High Strength Steel Endplate Connections in Fire and after Fire. Ph.D. Thesis, Tongji University, Shanghai, China, 2003; p. 260. [Google Scholar]
- Qiang, X.; Bijlaard, F.S.K.; Kolstein, H.; Jiang, X. Behaviour of Beam-to-Column High Strength Steel Endplate Connections Under Fire Conditions—Part 2: Numerical Study. Eng. Struct. 2014, 64, 39–51. [Google Scholar] [CrossRef]
- Lin, S.; Huang, Z.; Fan, M. Modelling Partial End-Plate Connections under Fire Conditions. J. Constr. Steel Res. 2014, 99, 18–34. [Google Scholar] [CrossRef]
- Hantouche, E.G.; Sleiman, S.A. Axial Restraint Forces in Shear Endplates of Steel Frames Due to Fire. J. Constr. Steel Res. 2017, 128, 528–541. [Google Scholar] [CrossRef]
- Sagiroglu, M. Experimental Evaluation of the Post-Fire Behavior of Steel T-Component in the Beam-to-Column Connection. Fire Saf. J. 2018, 96, 153–164. [Google Scholar] [CrossRef]
- Liu, T.C.H. Fire Resistance of Unprotected Steel Beams with Moment Connections. J. Constr. Steel Res. 1999, 51, 61–77. [Google Scholar] [CrossRef]
- Qiang, X.; Jiang, X.; Bijlaard, F.S.K.; Kolstein, H.; Luo, Y. Post-Fire Behaviour of High Strength Steel Endplate Connections—Part 1: Experimental Study. J. Constr. Steel Res. 2015, 108, 82–93. [Google Scholar] [CrossRef]
- Qiang, X.; Jiang, X.; Bijlaard, F.S.K.; Kolstein, H.; Luo, Y. Post-Fire Behaviour of High Strength Steel Endplate Connections—Part 2: Numerical Study. J. Constr. Steel Res. 2015, 108, 94–102. [Google Scholar] [CrossRef]
- Petrina, T. Fire Resistance of Steel Beam to Column End Plate Connections. Procedia Eng. 2016, 161, 143–149. [Google Scholar] [CrossRef]
- Sha, W.; Kirby, B.R.; Kelly, F.S. The Behaviour of Structural Steels at Elevated Temperatures and the Design of Fire-Resistant Steels. Mater. Trans. 2001, 42, 1913–1927. [Google Scholar] [CrossRef]
- Tao, Z.; Wang, X.-Q.; Uy, B. Stress-Strain Curves of Structural and Reinforcing Steels after Exposure to Elevated Temperatures. J. Mater. Civ. Eng. 2013, 25, 1306–1316. [Google Scholar] [CrossRef]
- Kac, S.; Kusinski, J. SEM Structure and Properties of ASP2060 Steel after Laser Melting. Surf. Coat. Technol. 2004, 180–181, 611–615. [Google Scholar] [CrossRef]
- Verma, P.; Rao, G.S.; Chellapandi, P.; Mahobia, G.S.; Chattopadhyay, K. Dynamic Strain Ageing, Deformation and Fracture Behavior of Modified 9Cr-1Mo Steel. Mater. Sci. Eng. A 2015, 621, 39–51. [Google Scholar] [CrossRef]
- Cirpici, B.K.; Orhan, S.N.; Kılıç, M.; Maali, M.; Sagiroglu, M. Experimental Behavior of Cold-Formed Stainless Steel Screwed Beam–Column Connections at Post-Fire Condition. Iran. J. Sci. Technol. Trans. Civ. Eng. 2021, 45, 1593–1609. [Google Scholar] [CrossRef]
- Maali, M.; Kılıç, M. Post-Fire Behavior of CFRP Retrofitted Thin-Walled Steel Tanks. Fire Mater. 2020, 44, 1013–1028. [Google Scholar] [CrossRef]
- Sagiroglu, M.; Maali, M.; Kar, M.; Bilen, M.B. Cold-Formed Steel Beam to Column Screw Connections Exposed to High Temperatures Reinforced with CFRP. Iran. J. Sci. Technol. Trans. Civ. Eng. 2023, 47, 1941–1957. [Google Scholar] [CrossRef]
- Krol, P.A.; Wachowski, M. Effect of Fire Temperature and Exposure Time on High-Strength Steel Bolts Microstructure and Residual Mechanical Properties. Materials 2021, 14, 3116. [Google Scholar] [CrossRef]
- Sagiroglu-Maali, M.; Senger, D.; Maali, M.; Cirpici, B.K.; Orhan, S.N.; Kilic, M. Post-fire Behaviour of Screwed CFS Frames Protected by Intumescent Coatings. Sādhanā 2023, 48, 262. [Google Scholar] [CrossRef]
- EN 1993-1-8 Eurocode 3; Design of Steel Structures-Parts 1–8: General Rules-Design of Joints. European Committee for Standardization: Brussels, Belgium, 2005.
- EN 1993-1-2 Eurocode 3; Design of Steel Structures-Parts 1–2: General Rules-Structural Fire Design. European Committee for Standardization: Brussels, Belgium, 2005.
- Karalar, M.; Öztürk, H.; Özkılıç, Y.O. Experimental and numerical investigation on flexural response of reinforced rubberized concrete beams using waste tire rubber. Steel Compos. Struct. 2023, 48, 43–57. [Google Scholar] [CrossRef]
- Çeçen, F.; Aktaş, B.; Öztürk, H.; Öztürk, İ.Ş.; Navdar, M.B. Comparative modal analysis of B70 and LCR-6 type railway sleepers after repeated impact loads. Constr. Build. Mater. 2022, 336, 127563. [Google Scholar] [CrossRef]
- Çeçen, F.; Aktaş, B.; Öztürk, H.; Navdar, M.B.; Öztürk,, İ.Ş. Behaviour of new LCR and ordinary prestressed concrete railway sleepers under repeated impact loads. Constr. Build. Mater. 2022, 319, 126151. [Google Scholar] [CrossRef]
- Çeçen, F.; Aktaş, B.; Öztürk, H.; Öztürk, İ.Ş.; Navdar, M.B. Comparison of new LCR and ordinary prestressed concrete railway sleepers with LUR tests. Constr. Build. Mater. 2022, 321, 126414. [Google Scholar] [CrossRef]
- Olabi, M.N.; Çağlar, N.; Arslan, M.E.; Öztürk, H.; Demir, A.; Dok, G.; Aykanat, B. Response of nonconforming RC shear walls with smooth bars under quasi-static cyclic loading. Bull. Earthq. Eng. 2022, 20, 6683–6704. [Google Scholar] [CrossRef]
- Coelho, A.M.G.; Bijlaard, F.S.K.; Silva, L.S. Experimental Assessment of the Ductility of Extended End Plate Connections. Eng. Struct. 2004, 26, 1185–1206. [Google Scholar] [CrossRef]
- Maali, M. Dikey Berkitmeli Alın Levhalı Kiriş-Kolon Birleşimlerinin Davranışının Deneysel Olarak İncelenmesi. Gümüşhane Üniversitesi Fen Bilim. Derg. 2018, 8, 255–263. [Google Scholar] [CrossRef]
- ANSYS Version 2020: R2 ANSYS Workbench. Available online: https://www.ansys.com/ (accessed on 1 March 2024).
- Kirby, B.R. The Behaviour of High-Strength Grade 8.8 Bolts in Fire. J. Constr. Steel Res. 1995, 33, 3–38. [Google Scholar] [CrossRef]
- Bursi, O.S.; Jaspart, J.P. Basic Issues in the Finite Element Simulation of Extended End Plate Connections. Comput. Struct. 1998, 69, 361–382. [Google Scholar] [CrossRef]
- Hu, Y.; Davison, B.; Burgess, I.; Plank, R. Multi-Scale Modelling of Flexible End Plate Connections Under Fire Conditions. Open Constr. Build. Technol. J. 2010, 4, 88–104. [Google Scholar] [CrossRef]
- Kodur, V.; ASCE, F.; Dwaikat, M.; Fike, R. High-Temperature Properties of Steel for Fire Resistance Modeling of Structures. J. Mater. Civ. Eng. 2010, 22, 423–434. [Google Scholar] [CrossRef]
- Lu, J.; Liu, H.; Chen, Z.; Liao, X. Experimental Investigation into the Post-Fire Mechanical Properties of Hot-Rolled and Cold-Formed Steels. J. Constr. Steel Res. 2016, 121, 291–310. [Google Scholar] [CrossRef]
- Yu, Y.; Lan, L.; Ding, F.; Wang, L. Mechanical Properties of Hot-Rolled and Cold Formed Steels after Exposure to Elevated Temperature: A Review. Constr. Build. Mater. 2019, 213, 360–376. [Google Scholar] [CrossRef]
- BS 5950-8; Structural Use of Steelwork in Building, Part 8: Code of Practice for Fire Resistant Design. British Standard Institution: London, UK, 2003.
- CEC252:2009; Standard for Building Structural Assessment after Fire. China Planning Press: Beijing, China, 2009.
- Yang, H.; Han, L.H.; Wang, Y.C. Effects of Heating and Loading Histories on Post-fire Cooling Behaviour of Concrete-Filled Steel Tubular Columns. J. Constr. Steel Res. 2008, 64, 556–570. [Google Scholar] [CrossRef]
- Hosseini, S.A.; Zeinoddini, M.; Darian, A.S. Modelling of I Shaped Beam to Tubular Column Connection Subjected to Post-Fire Conditions. Int. J. Steel Struct. 2014, 14, 513–528. [Google Scholar] [CrossRef]
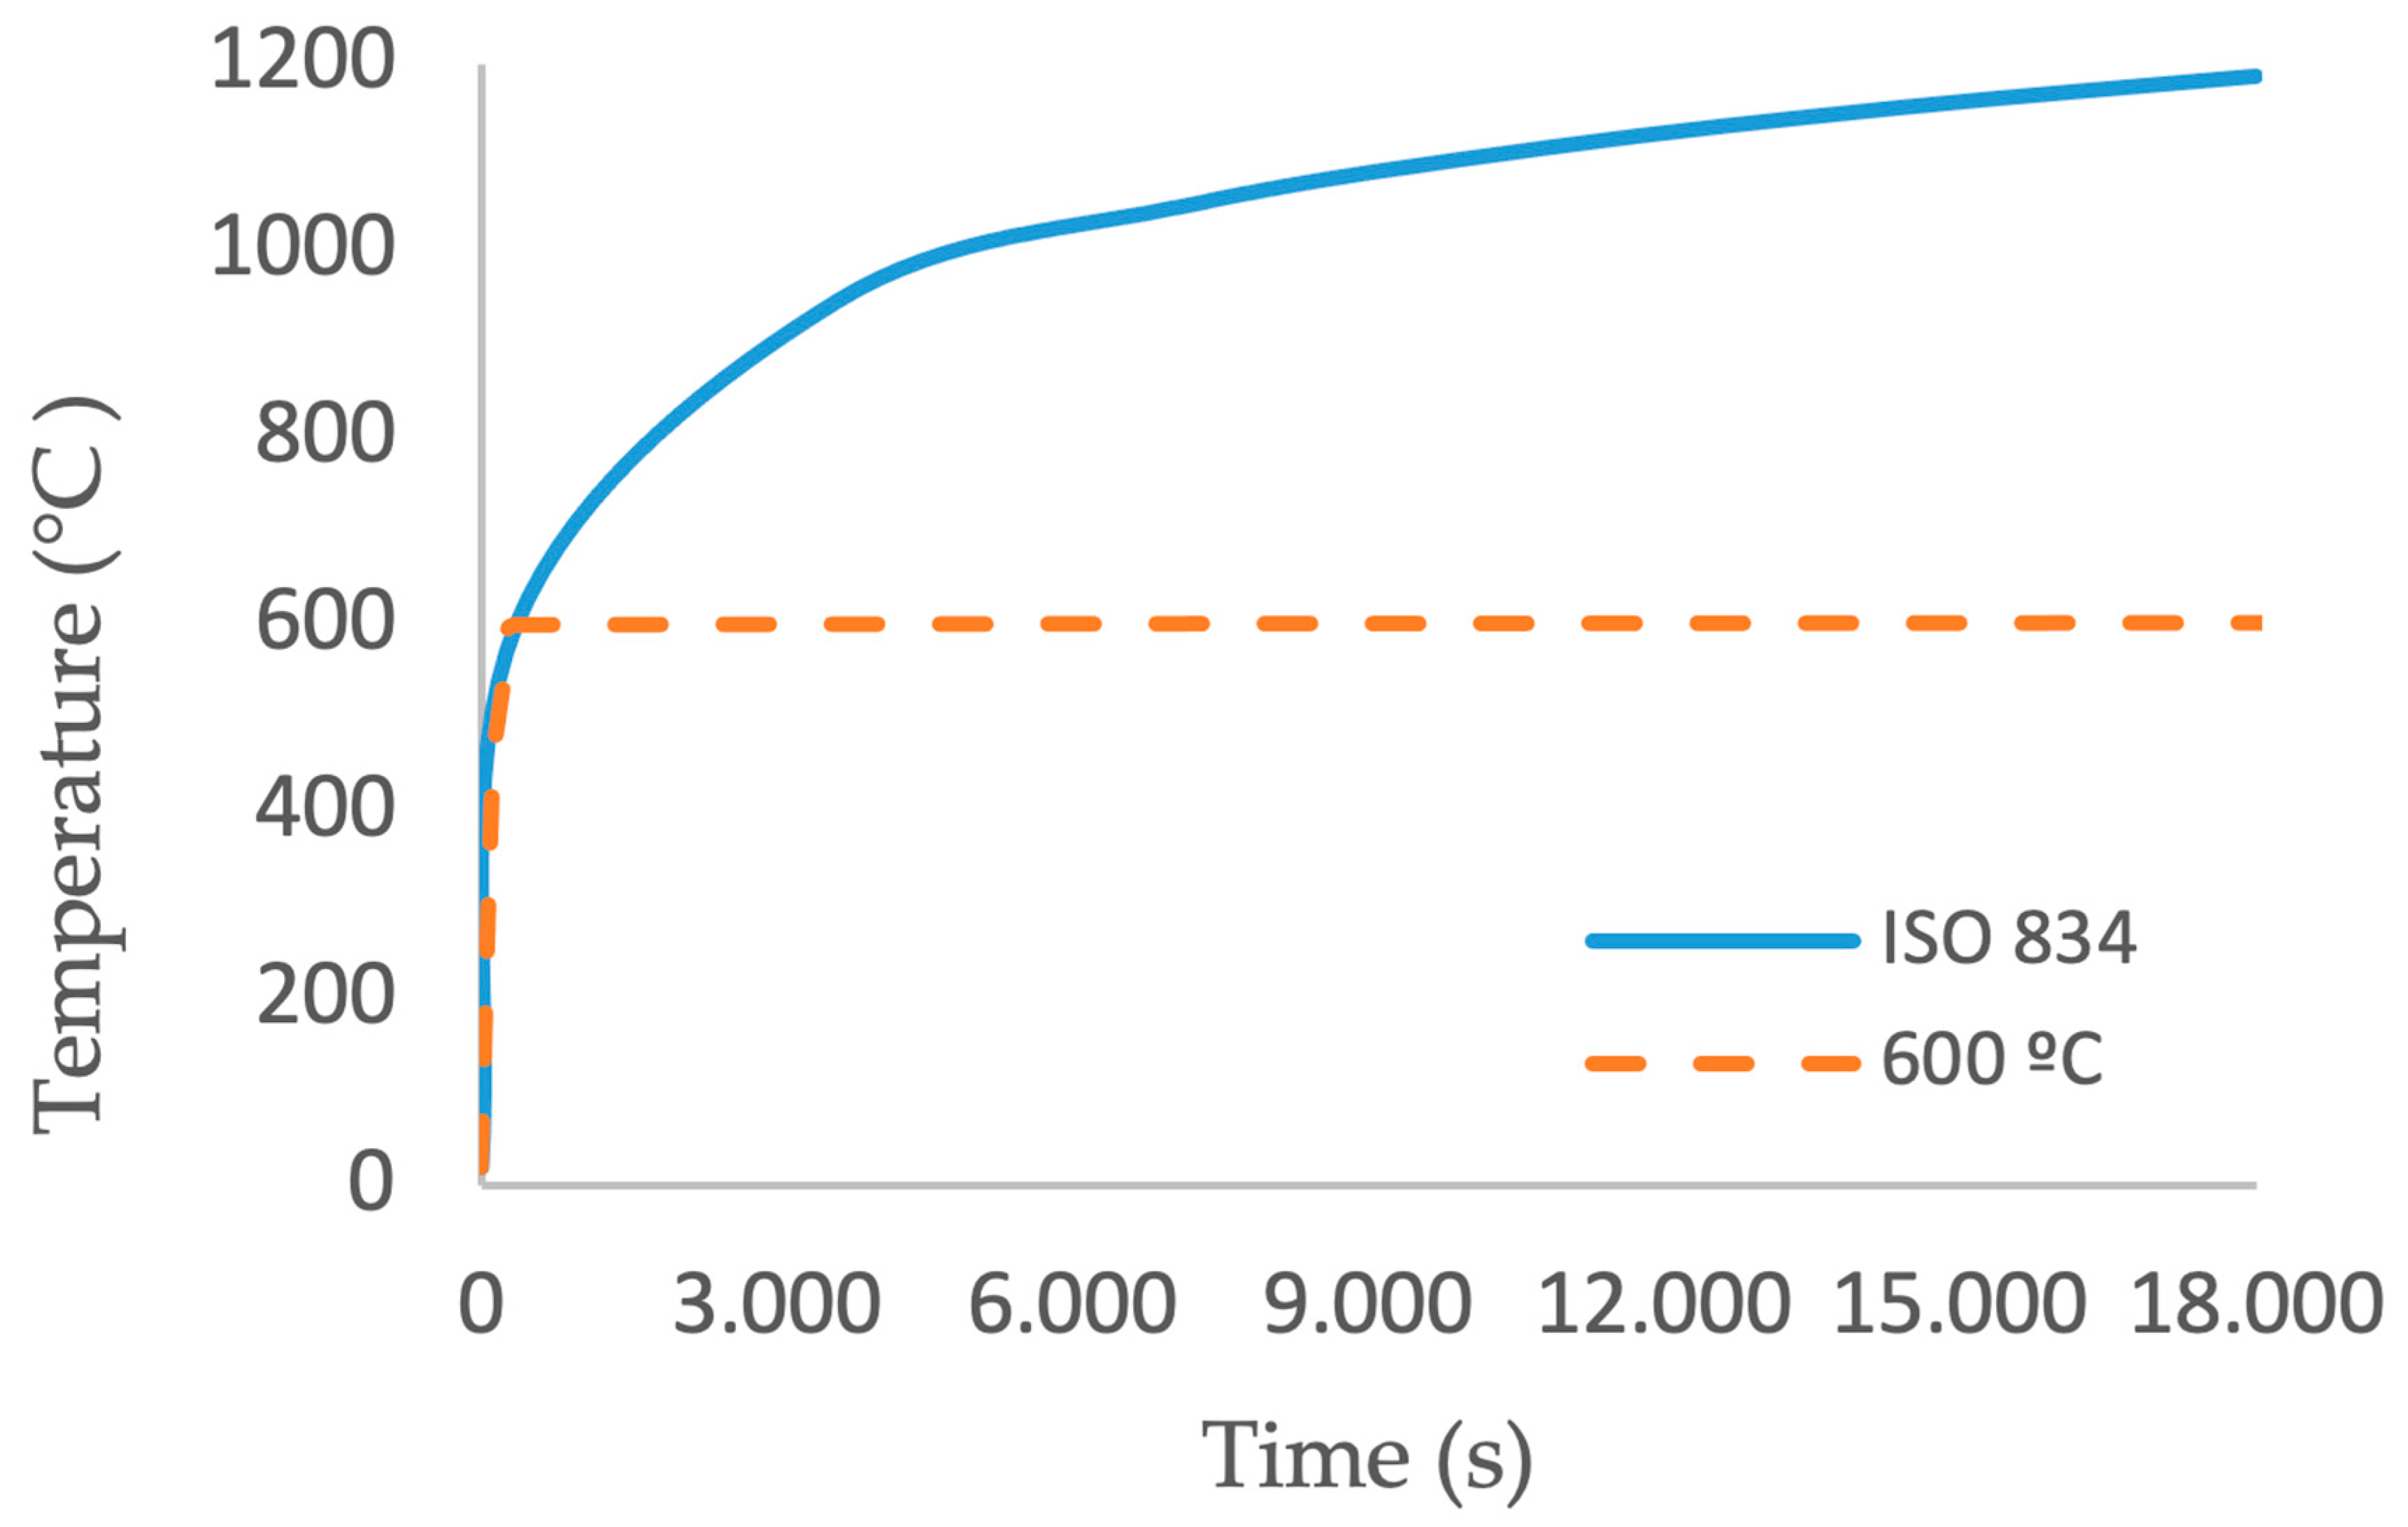
- ISO 834-1:1999; Fire-resistance tests—Elements of building construction—Part 1: General requirements. ISO—The International Organisation for Standardisation: Geneva, Switzerland, 1999.
- Wu, S.; Liu, W.; Wang, X. The Best Preload of Bolted Joint Plate for Anti-resonance. IOP Conf. Ser. Mater. Sci. Eng. 2019, 576, 012004. [Google Scholar] [CrossRef]


| No | Joint Type | Temperature | |
|---|---|---|---|
| 20 °C | 600 °C | ||
| Model 1 | Partial end plate | Model 1.R | Model 1.T |
| Model 2 | Flush end plate | Model 2.R | Model 2.T |
| Model 3 | Extended end plate | Model 3.R | Model 3.T |
| The Material | Yield (MPa) | Failure (MPa) | Moduls of Elasticity (MPa) |
|---|---|---|---|
| End plates (S235) (S235) | 235 | 360 | 200.000 |
| Bolts (Grade 8.8) | 640 | 800 | 200.000 |
| Beam (S235) | 251 | 391 | 200.000 |
| Column (S235) | 351 | 450 | 200.000 |
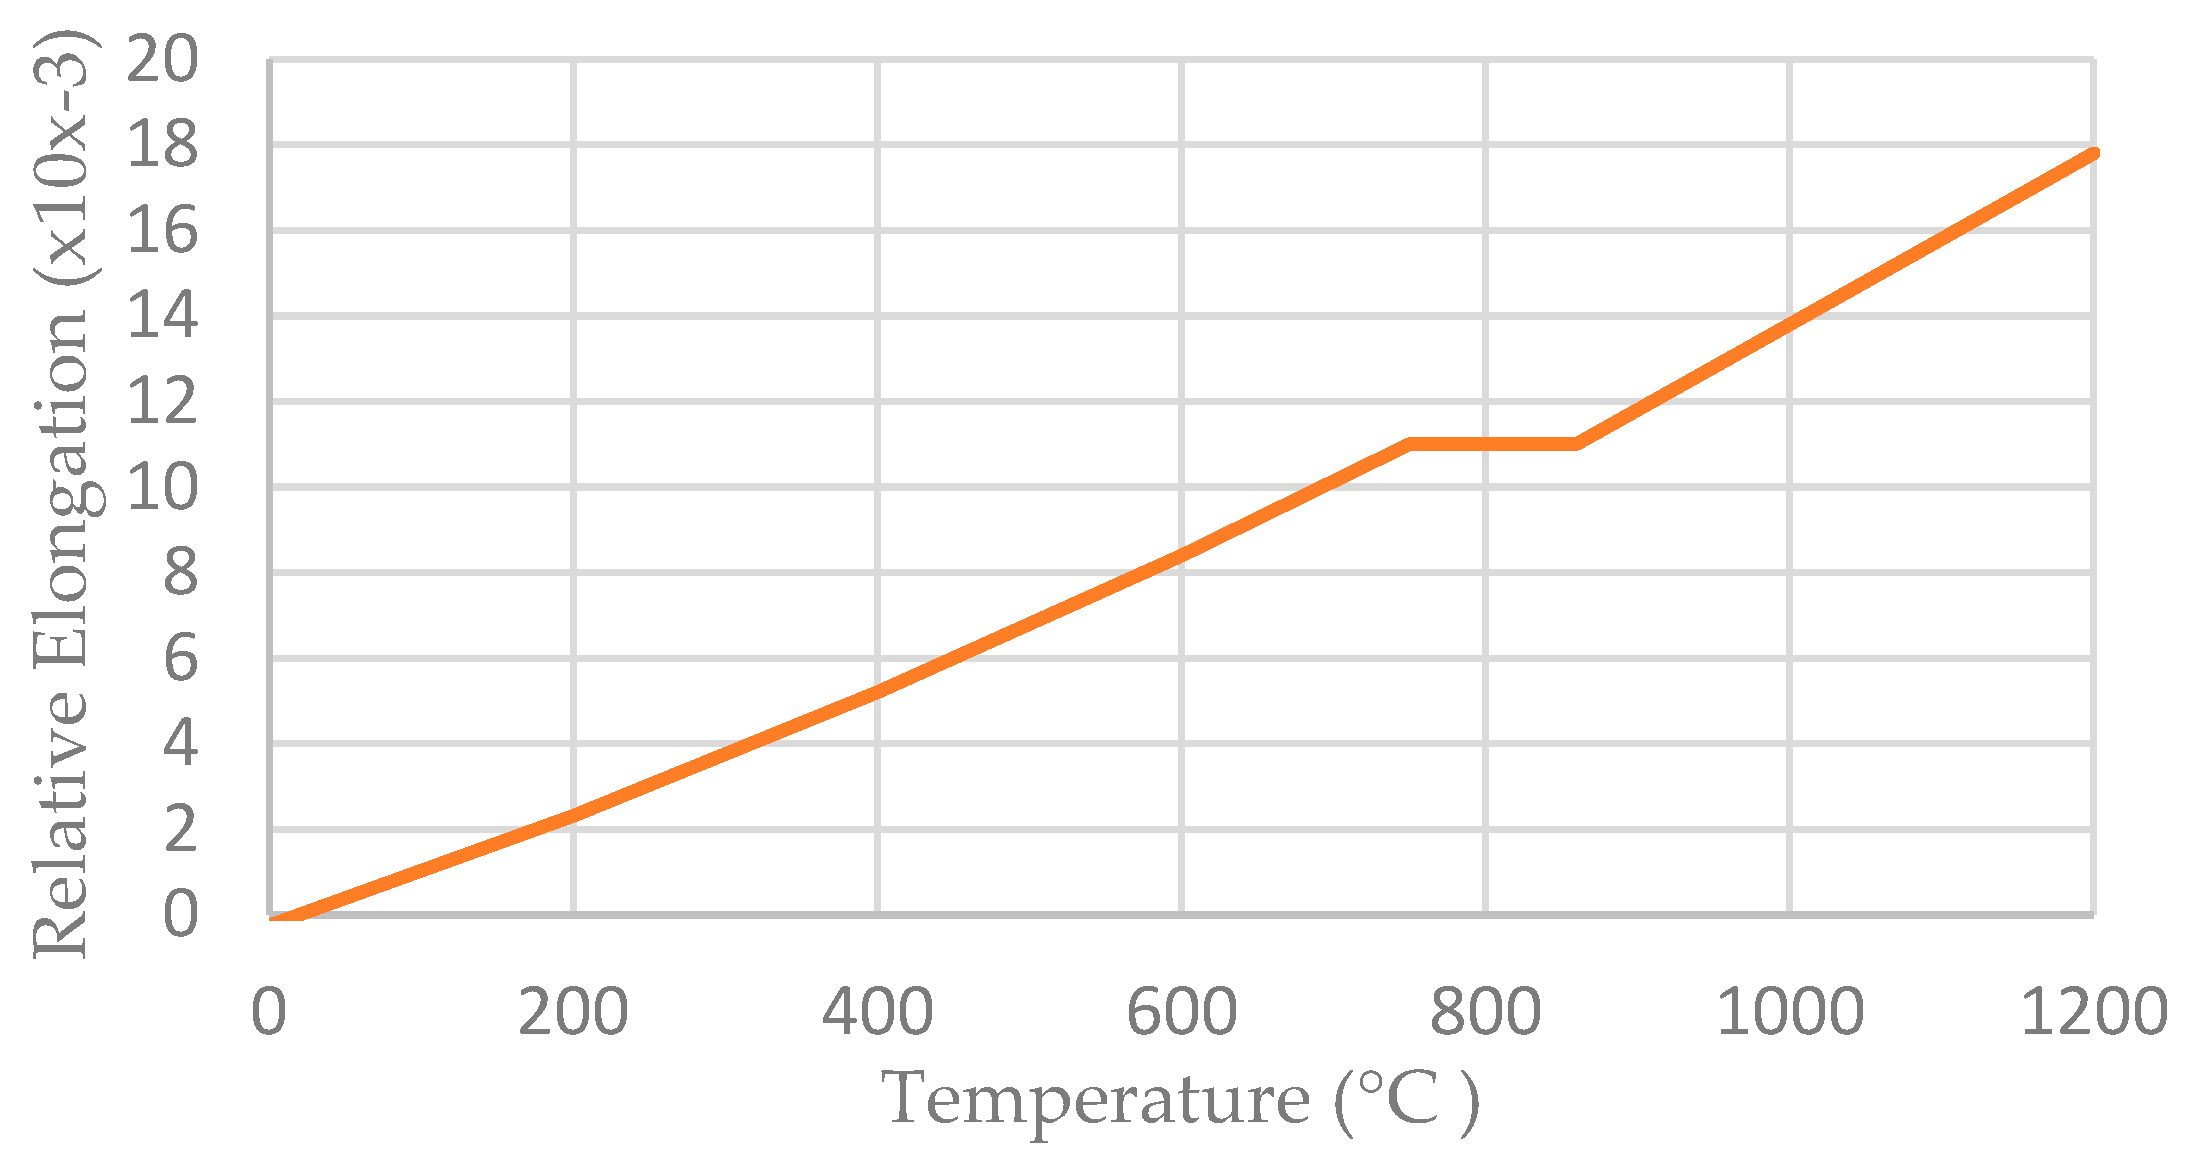
| Steel Temperature, θa (°C) | Reduction Factors for Yield Stress fy, and Young’s Modulus Ea, at Steel Temperature θa | |
|---|---|---|
| Reduction Factor (Relative to fy) for Effective Yield Strength | Reduction Factor (Relative to Ea) for the Slope of the Linear Clastic Range | |
| 20 | 1 | 1 |
| 100 | 1 | 1 |
| 200 | 1 | 0.90 |
| 300 | 1 | 0.80 |
| 400 | 1 | 0.70 |
| 500 | 0.78 | 0.60 |
| 600 | 0.47 | 0.31 |
| 20 °C | 600 °C | Difference(%) | |
|---|---|---|---|
| Model | Max.Load (kN) | Max.Load (kN) | |
| Model 1 | 81 | 77.8 | 4 |
| Model 2 | 101.8 | 78.2 | 23.2 |
| Model 3 | 125.8 | 97.5 | 22.5 |
| Exp. Group | Exp. No | KR (Knee–Range) | Resistance (kNm) | Stiffness (kNm/mrad) | Rotation (mrad) | ||||||||
|---|---|---|---|---|---|---|---|---|---|---|---|---|---|
| Mj.Rd | Mj.max | MθCd | Sj.ini | Sj.p-1 | Sj.ini/Sj.p-1 | θMj.Rd | θMinK-R | θMsupK-R | θMj.max | θCd | |||
| 20 °C Exp. | Model 1.R | 27.59–75.8 | 71.84 | 78.57 | 59.16 | 8.84 | 1.83 | 4.83 | 8.09 | 3.19 | 10.56 | 13.59 | 41.31 |
| Model 2.R | 25.32–95.13 | 83.12 | 98.21 | 70.69 | 18.06 | 2.59 | 6.97 | 4.52 | 1.51 | 8.65 | 14.31 | 40.51 | |
| Model 3.R | 28.01–104.96 | 90.58 | 121.41 | 72.24 | 21.04 | 5.81 | 3.62 | 4.29 | 1.32 | 6.78 | 10.88 | 31.44 | |
| 600 °C Exp. | Model 1.T | 40.69–72.34 | 69.64 | 75.04 | 61.02 | 7.51 | 0.96 | 7.83 | 9.53 | 5.6 | 11.84 | 16.62 | 45.06 |
| Model 2.T | 30.41–72.57 | 68.37 | 75.42 | 30.47 | 10.38 | 1.55 | 6.69 | 6.58 | 3.12 | 9.19 | 11.49 | 30.47 | |
| Model 3.T | 60.69–87.53 | 81.95 | 94.05 | 52.93 | 9.97 | 1.15 | 8.69 | 8.21 | 6.16 | 12.67 | 22.36 | 52.93 | |
| Exp. Group | Exp. No | Rotation (mrad) | ψj | ψj.max load | ||
|---|---|---|---|---|---|---|
| θMj.Rd | θMj.max | θCd | ||||
| 20 °C Exp. | Model 1.R | 8.09 | 13.59 | 41.31 | 5.11 | 1.68 |
| Model 2.R | 4.52 | 14.31 | 40.51 | 8.96 | 3.17 | |
| Model 3.R | 4.29 | 10.88 | 31.44 | 7.33 | 2.54 | |
| 600 °C Exp. | Model 1.T | 9.53 | 16.62 | 45.06 | 4.73 | 1.74 |
| Model 2.T | 6.58 | 11.49 | 30.47 | 4.63 | 1.75 | |
| Model 3.T | 8.21 | 22.36 | 52.93 | 6.45 | 2.72 | |
| Exp. | FEA | |
|---|---|---|
| Model | Load (kN) | Load (kN) |
| Model 1.R | 81 | 82.84 |
| Model 2.R | 101.8 | 102.9 |
| Model 3.R | 125.8 | 127.9 |
| Model 1.T | 77.8 | 80.95 |
| Model 2.T | 78.2 | 79.66 |
| Model 3.T | 97.5 | 100.36 |
| Equivalent Stress Values (MPa) | |||
|---|---|---|---|
| Model | Frame | End Plate | Beam Mid Span |
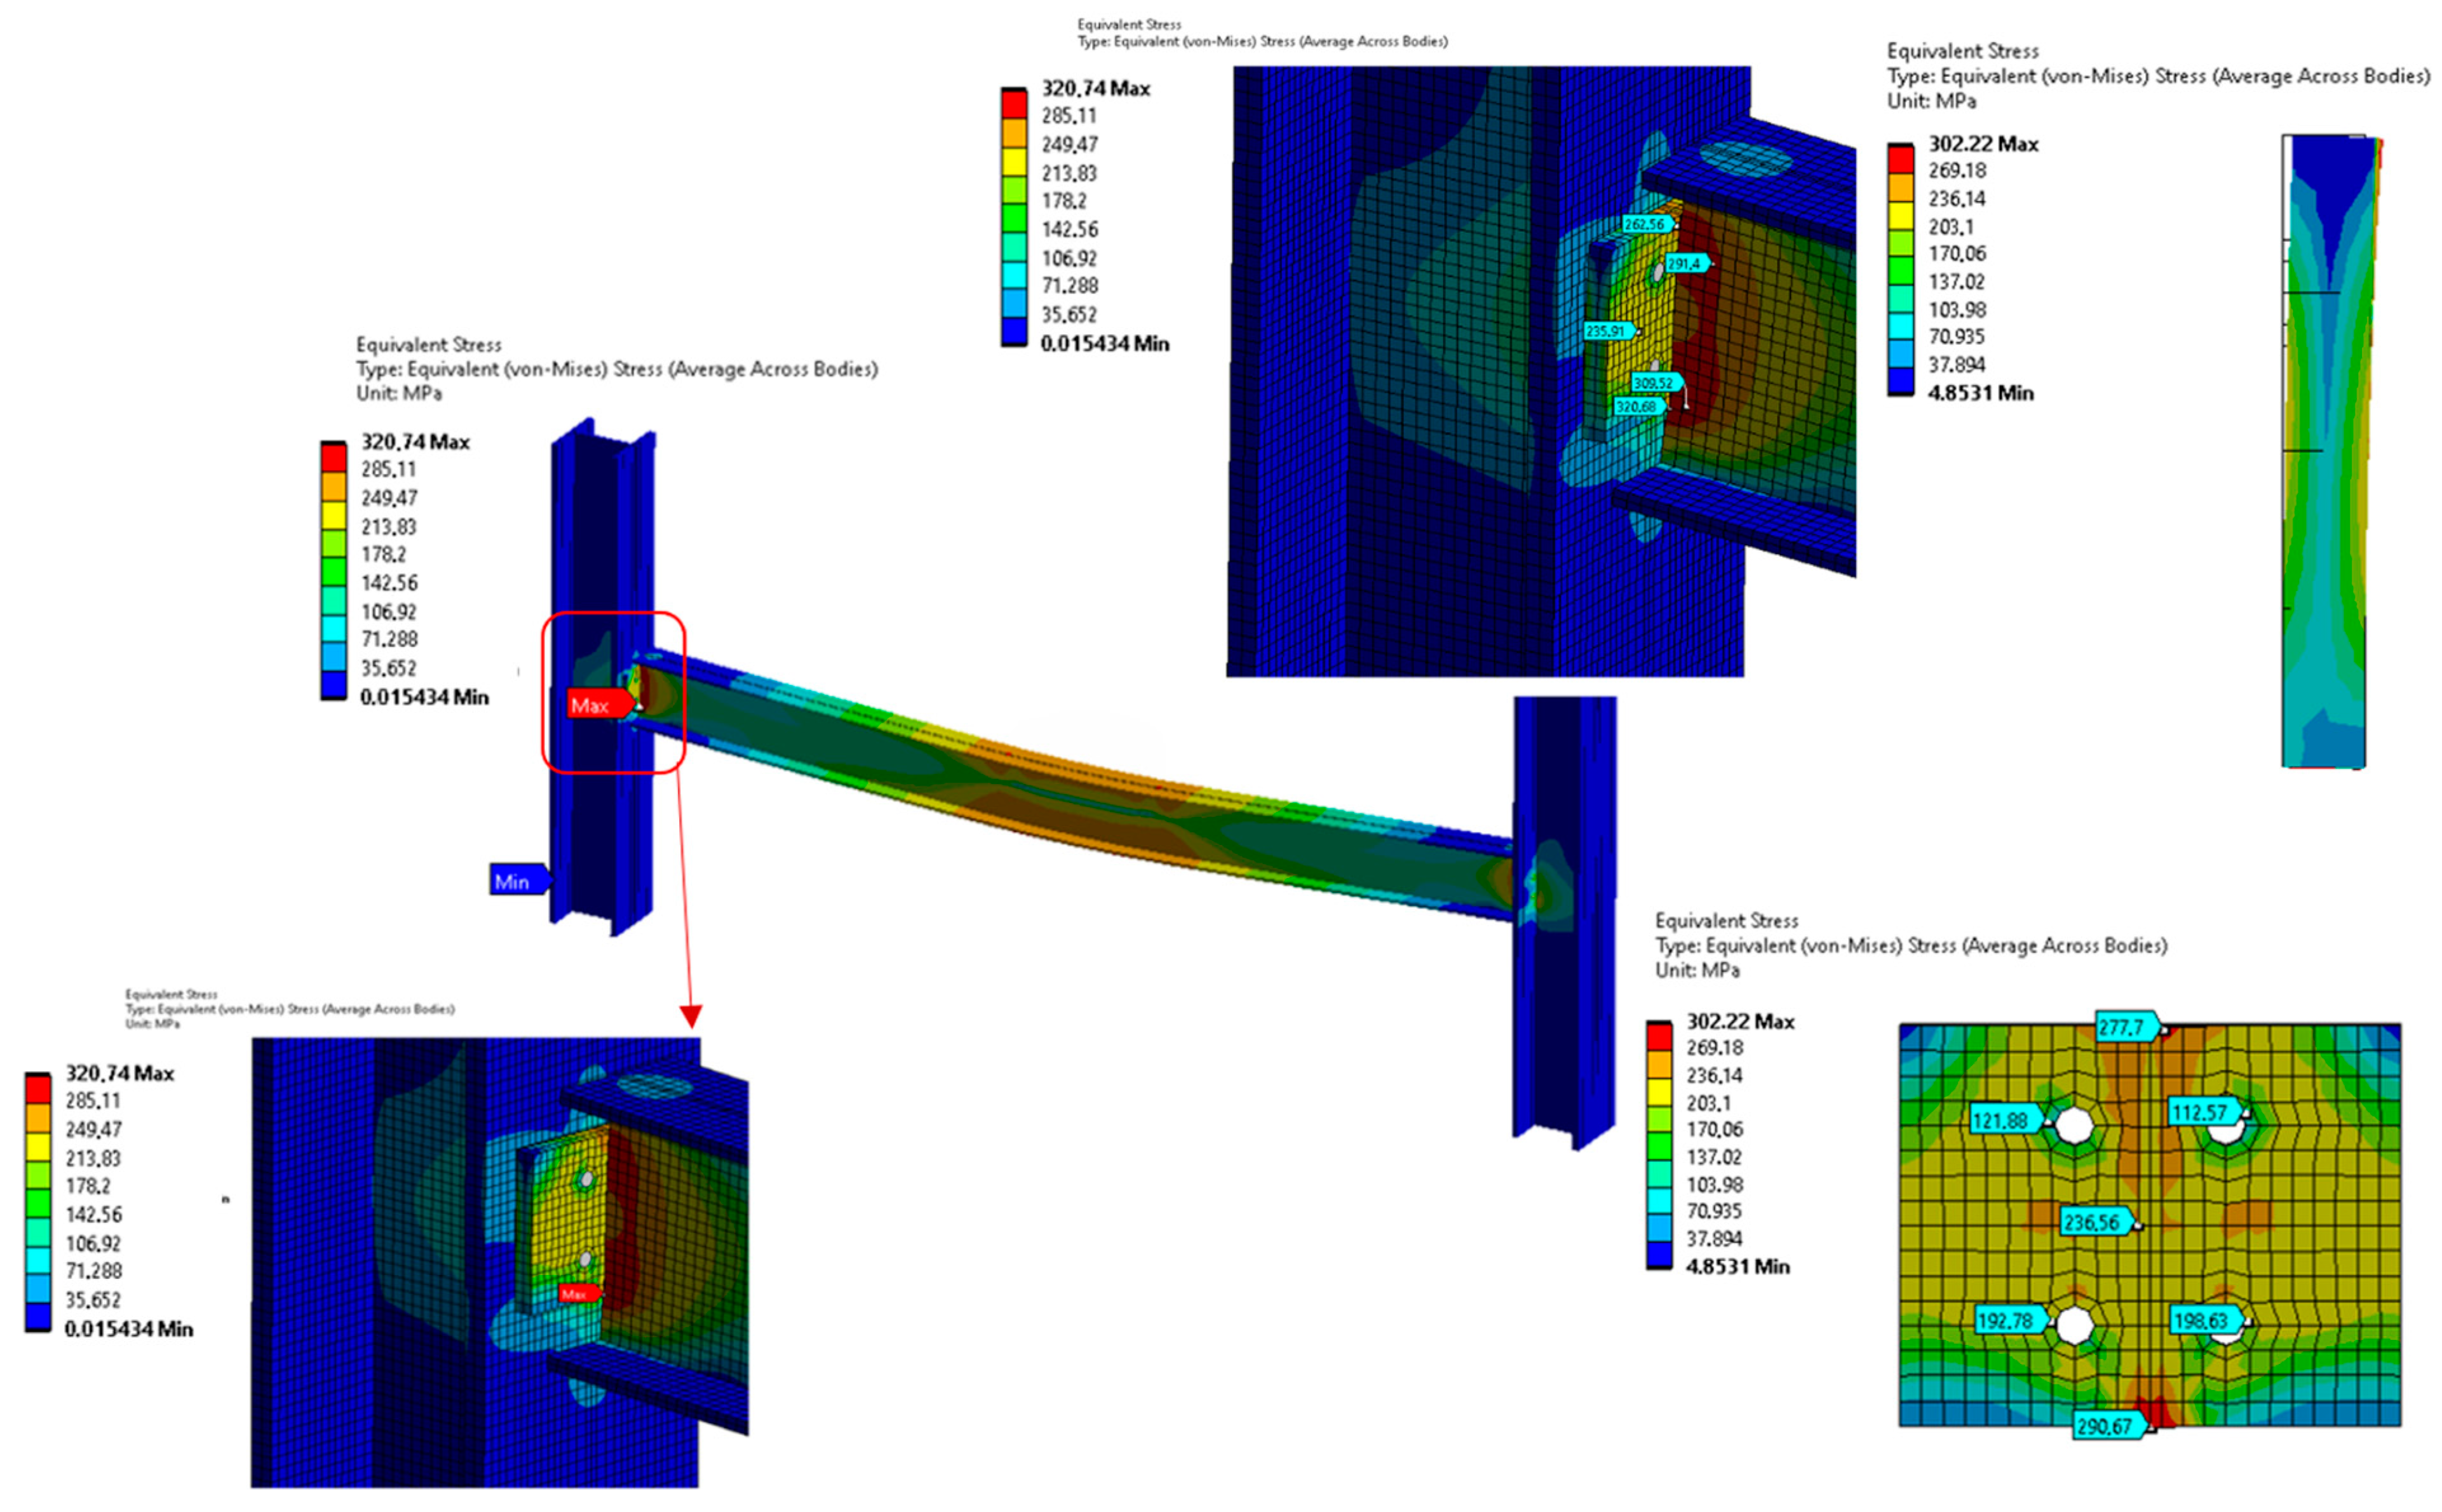
| Model 1.R | 320.7 | 302.22 | 287.47 |
| Model 2.R | 298.34 | 253.04 | 287.82 |
| Model 3.R | 293.28 | 291.89 | 293.28 |
| Model 1.T | 290.41 | 183.29 | 282.4 |
| Model 2.T | 288.51 | 173.46 | 288.49 |
| Model 3.T | 310.09 | 182.87 | 310.02 |
| Model | The Picture of Joints in the Exp.—Numerical Analysis—20 °C | The Picture of Joints in the Exp.—Numerical Analysis—600 °C |
|---|---|---|
| Model 1 |  5 mm/3.9 mm |  6.5 mm/5.8 mm |
| Model 2 |  6.5 mm/6.2 mm | 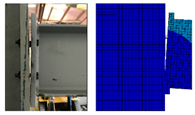 10 mm/9.5 mm |
| Model 3 |  7 mm/6 mm |  15 mm/13 mm |
| Numerical Analysis | Experiment | ||
|---|---|---|---|
| Model | Stress (MPa) | Failure Condition | Failure Condition |
| Model 1.R | 791.57 | No Failure | No Failure |
| Model 2.R | 980.97 | Failed | Failed |
| Model 3.R | 952.45 | Failed | Failed |
| Model 1.T | 458.2 | No Failure | No Failure |
| Model 2.T | 606.94 | Failed | Failed |
| Model 3.T | 606.55 | Failed | Failed |
Disclaimer/Publisher’s Note: The statements, opinions and data contained in all publications are solely those of the individual author(s) and contributor(s) and not of MDPI and/or the editor(s). MDPI and/or the editor(s) disclaim responsibility for any injury to people or property resulting from any ideas, methods, instructions or products referred to in the content. |
© 2024 by the authors. Licensee MDPI, Basel, Switzerland. This article is an open access article distributed under the terms and conditions of the Creative Commons Attribution (CC BY) license (https://creativecommons.org/licenses/by/4.0/).
Share and Cite
Akduman, S.; Karalar, M.; Mert, N.; Öztürk, H. Investigation of the Post-Fire Behavior of Different End-Plated Beam–Column Connections. Buildings 2024, 14, 1013. https://doi.org/10.3390/buildings14041013
Akduman S, Karalar M, Mert N, Öztürk H. Investigation of the Post-Fire Behavior of Different End-Plated Beam–Column Connections. Buildings. 2024; 14(4):1013. https://doi.org/10.3390/buildings14041013
Chicago/Turabian StyleAkduman, Seda, Memduh Karalar, Necati Mert, and Hakan Öztürk. 2024. "Investigation of the Post-Fire Behavior of Different End-Plated Beam–Column Connections" Buildings 14, no. 4: 1013. https://doi.org/10.3390/buildings14041013