1. Introduction
The construction industry increasingly adopts sustainable practices, focusing on light wood-framed buildings and prefabrication technologies as promising solutions [
1,
2]. These innovations aim to establish a regenerative production system, minimizing waste and promoting the circular flow of materials.
In the 1990s, buildings accounted for 40% of global material consumption and one-third of energy usage, with the construction sector remaining a significant contributor to raw material consumption and global carbon dioxide emissions (25–40%) [
3].
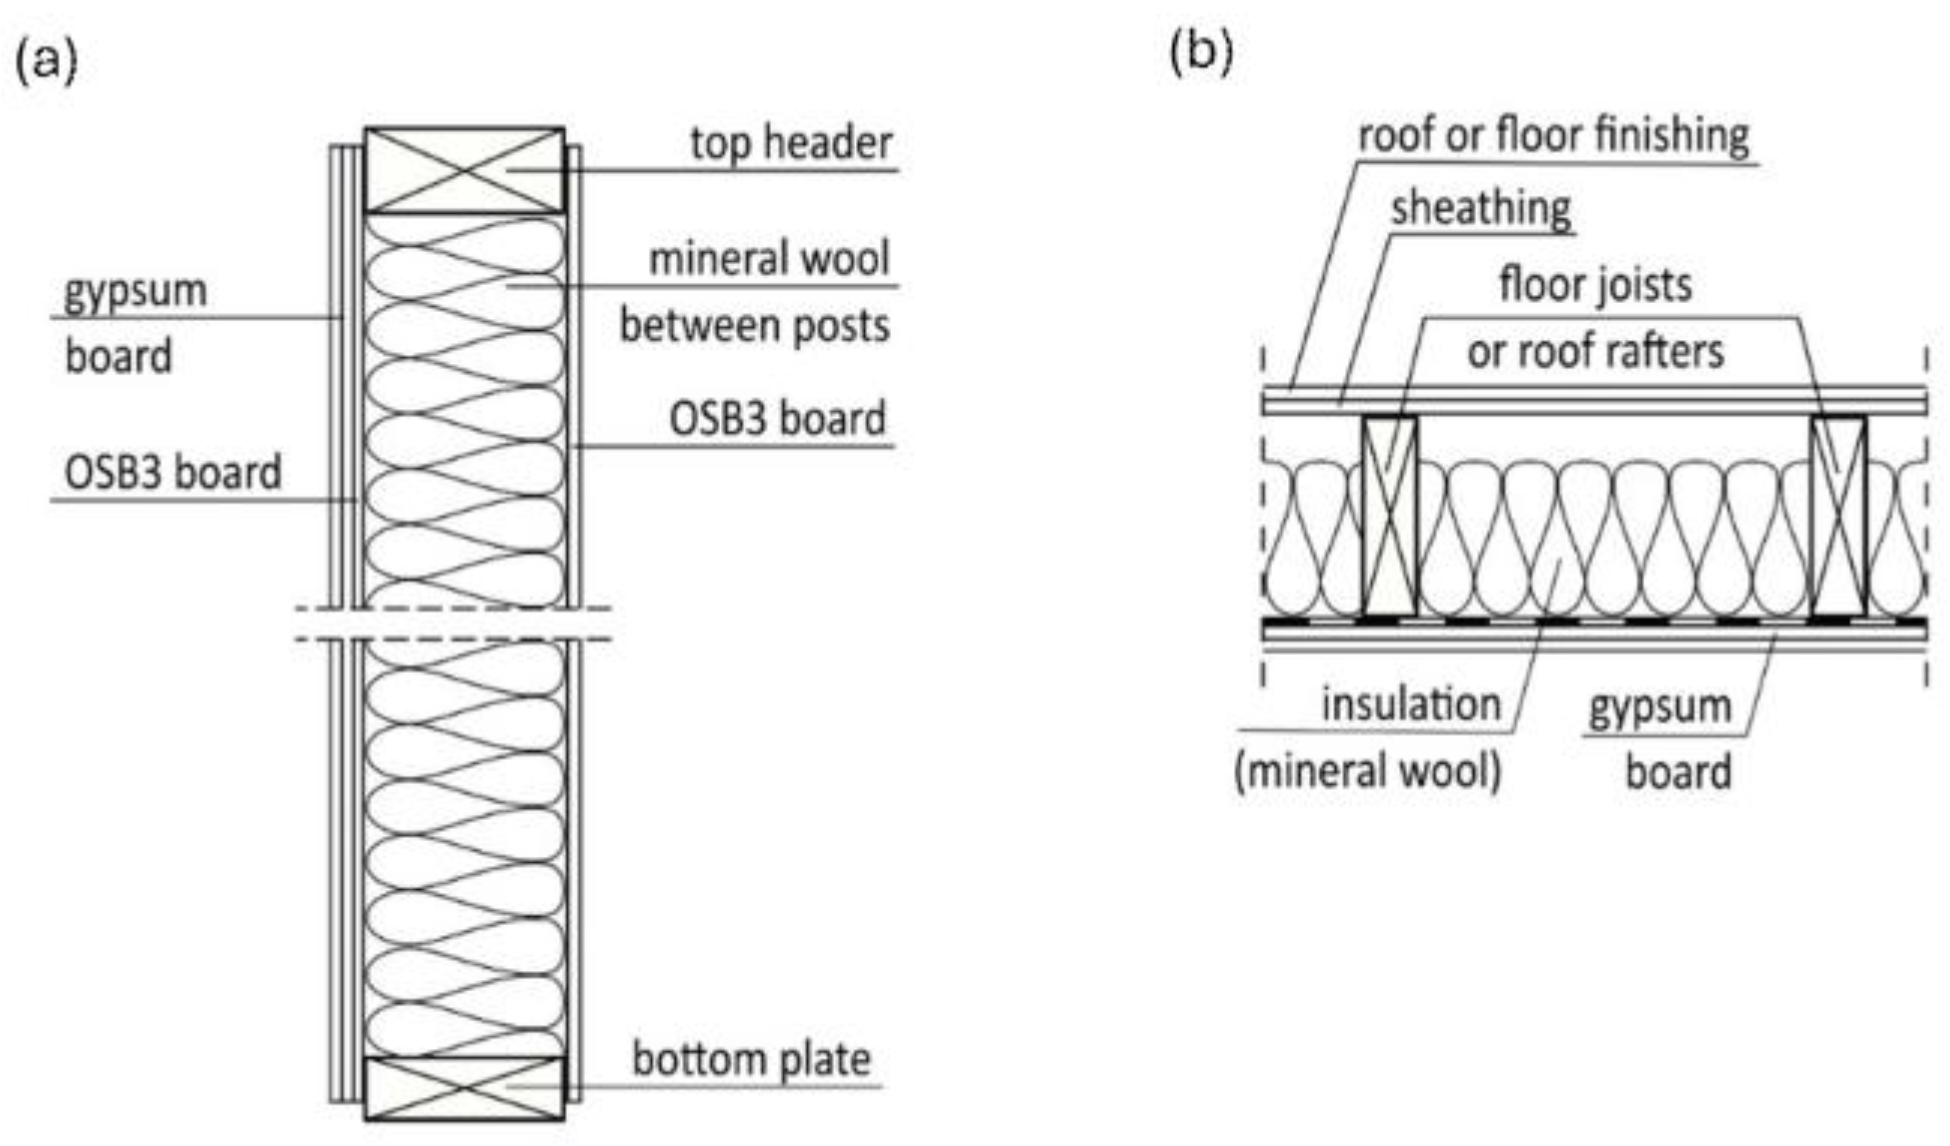
Timber buildings, characterized by wood-framed structures with rigid wood derivative boards and mineral wool insulation, exemplify eco-friendly construction [
4,
5,
6]. Prefabricated wood-framed houses, relying on industrialized processes, enable off-site production, ensuring consistent quality and precise dimensional tolerances [
7,
8].
Despite their benefits, the increasing demand for these eco-friendly products raises concerns about trade-offs, impacting biomass availability, forest ecosystem services, and the forests’ climate change mitigation potential [
9]. Nevertheless, combining eco-friendliness and technological advancements offers a path to a greener future, addressing critical challenges that traditional construction methods face [
10].
Decision-makers in this context need support to select the most profitable realization alternatives, considering factors like building price, execution time, warranty period, and failure points. The current literature needs a unified and robust approach for holistically evaluating different realization alternatives while accounting for the importance of varying criteria. This research addresses the gap by introducing the MADAMOS decision support system, which combines MCDM techniques with prefabrication and transportation logistics, providing a comprehensive and reliable framework for selecting the most rational realization alternatives for light wood-framed buildings in the Nordic region (
Figure 1).
This research significantly advances sustainable development in construction by promoting prefabricated wood-framed houses. The MADAMOS system empowers decision-makers globally, optimizing processes for cost efficiency, time savings, and enhanced quality assurance.
The United Nations’ 2030 Agenda for Sustainable Development Goals provides a global reference [
11,
12]. MCDM offers adaptable tools for quantitative assessment, aligning with the OECD’s framework for constructing multi-attribute utility functions [
13].
Recent studies highlight the growing trend of adopting prefabricated construction for sustainable development goals. Xu et al. [
14] compared traditional and prefabricated techniques, emphasizing resource efficiency and reduced construction waste. Hussein et al. [
15] underscored environmental benefits, including lower greenhouse gas emissions.
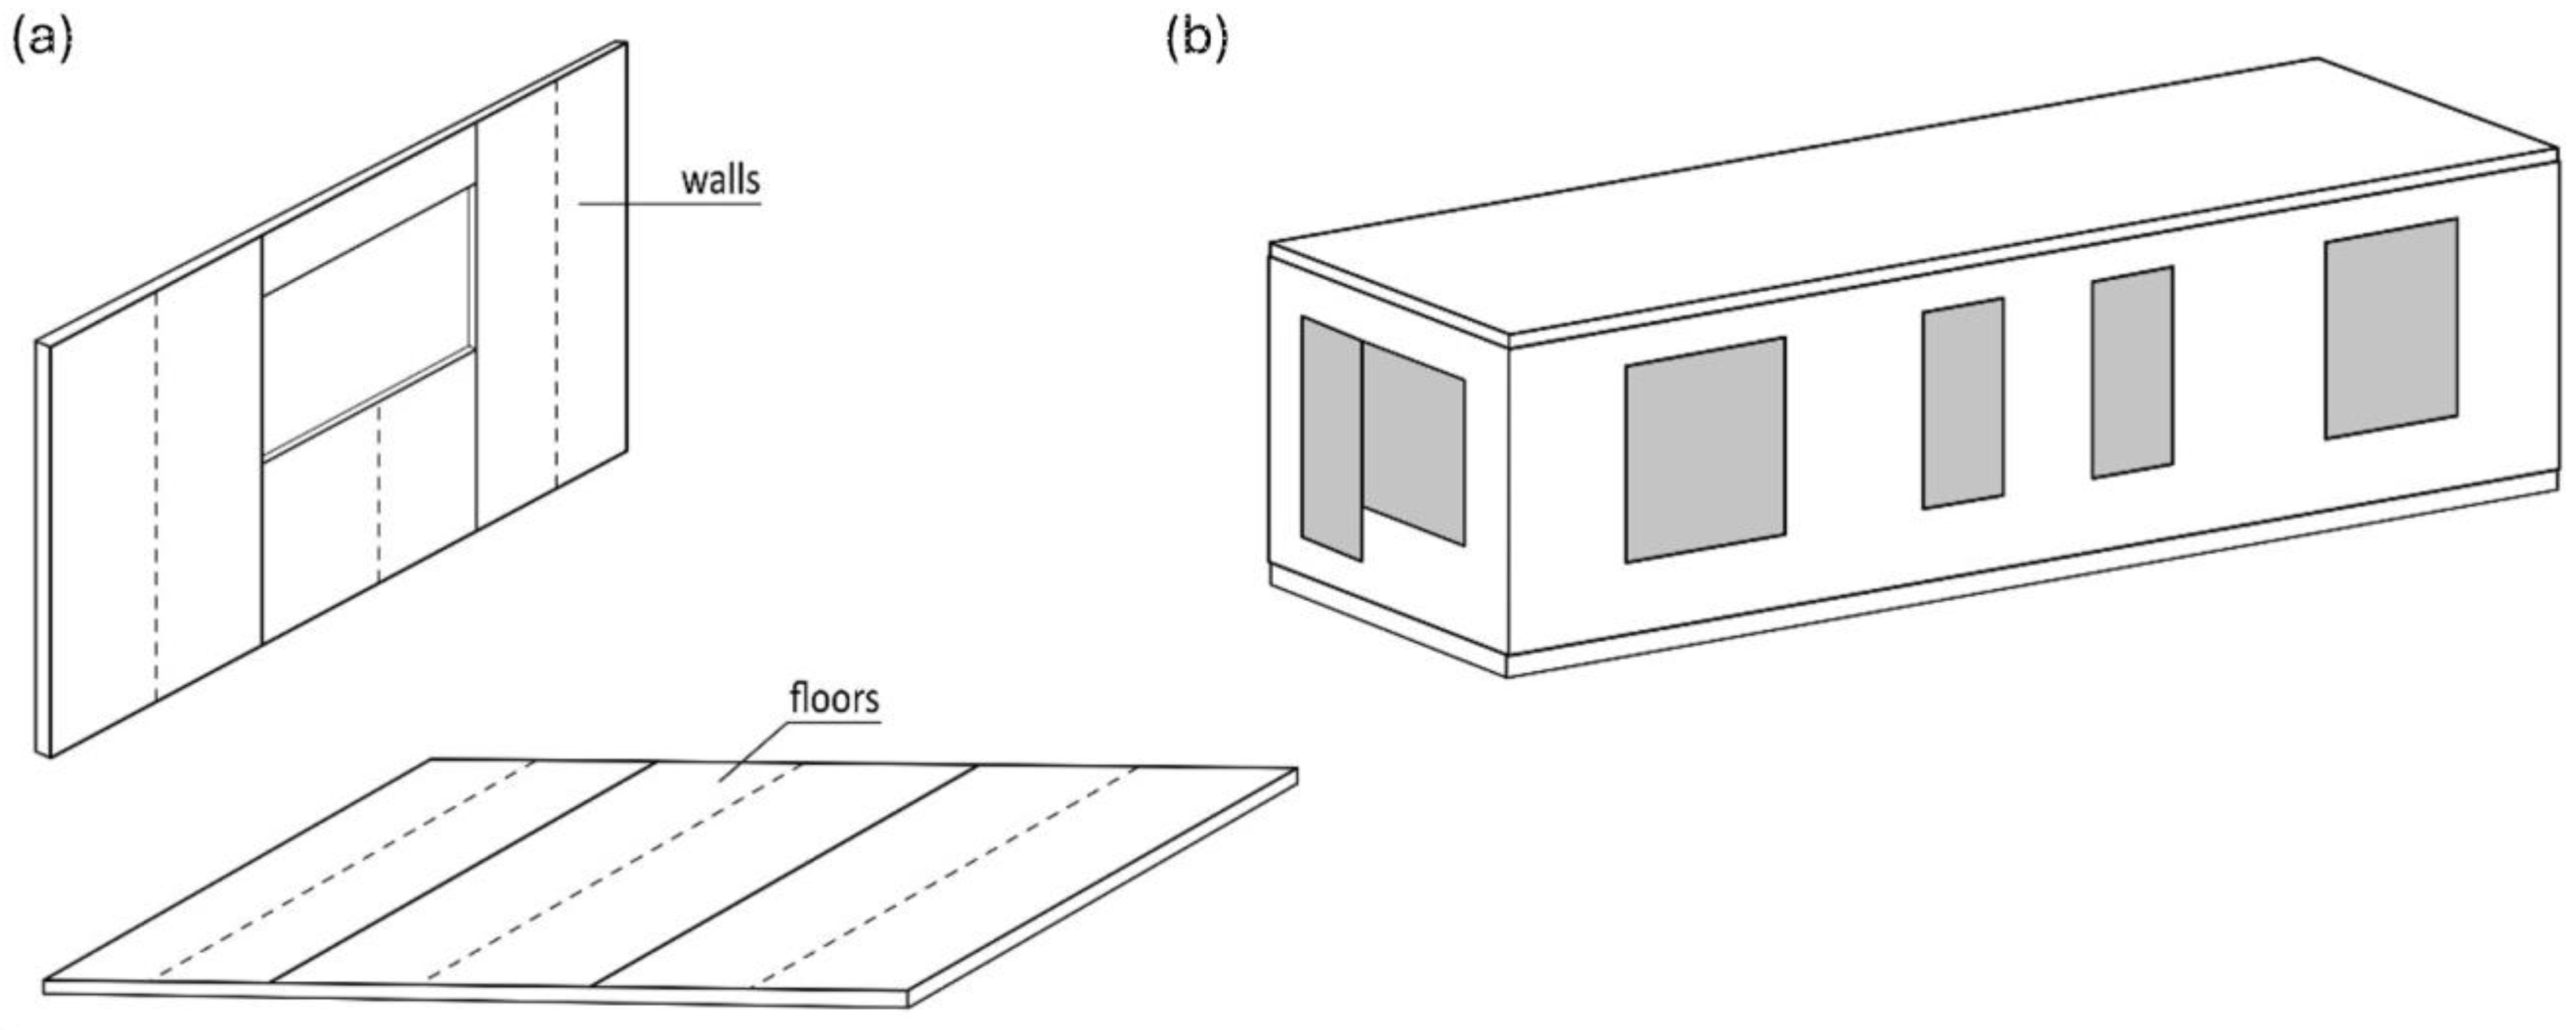
Two prevailing prefabrication technologies, 2D plain large panels and 3D modular systems [
16,
17,
18], are prominent in constructing wood-framed buildings. These elements offer excellent thermal performance [
19].
Wood-framed buildings, especially mass timber like cross-laminated timber, are preferred in Europe and North America due to their ease, speed, low weight, cost-effective production, and positive environmental impact [
20,
21]. Advancements are notable in various structures [
2,
5,
22]. Brigante et al. [
23] explored design for adaptability strategies, emphasizing adaptability for future needs.
This article highlights the significance of wood-framed buildings, driven by ease of realization, eco-friendliness, and meeting thermal and acoustic requirements [
24]. It explores current trends, describing the evolution of implementation technology and the production process of precast building elements.
The evolution of wood-framed building technology, dating back to the early twentieth century, is characterized by its ease and speed of realization, particularly in Europe and North America [
25,
26,
27]. Advances in single-family, multifamily, and other-purpose structures highlight its popularity. The low volume weight of wood enables cost-effective production in factories, easy handling, and inexpensive transportation to construction sites. Its positive environmental impact, cost-effectiveness compared to traditional materials, and technological advancements contribute to its resurgence, especially in multi-story construction [
20].
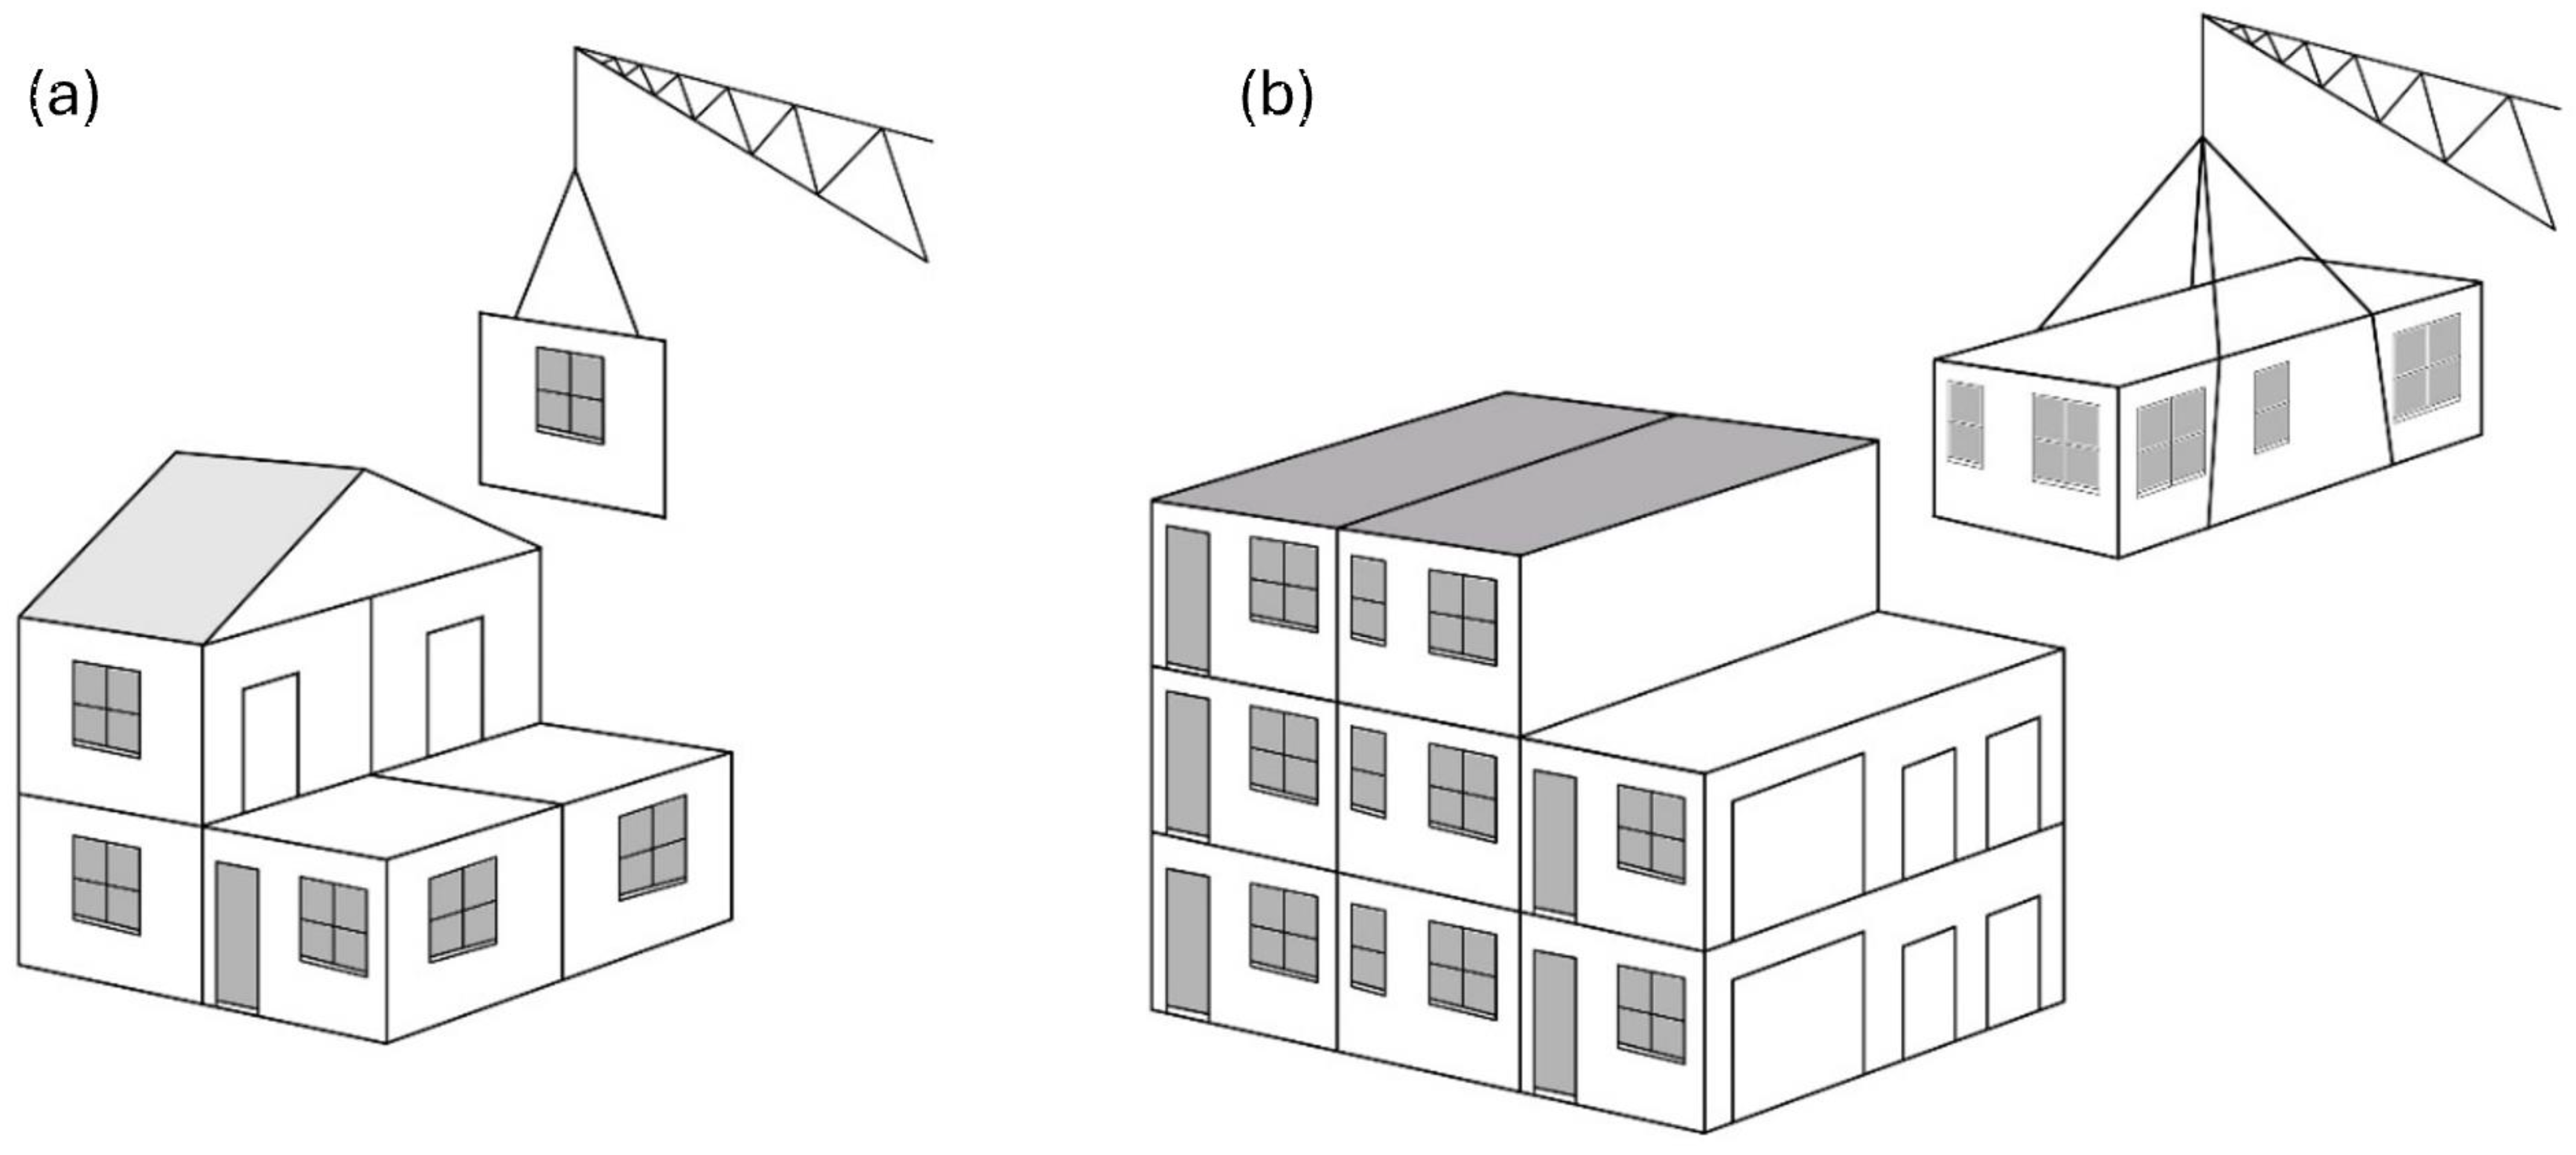
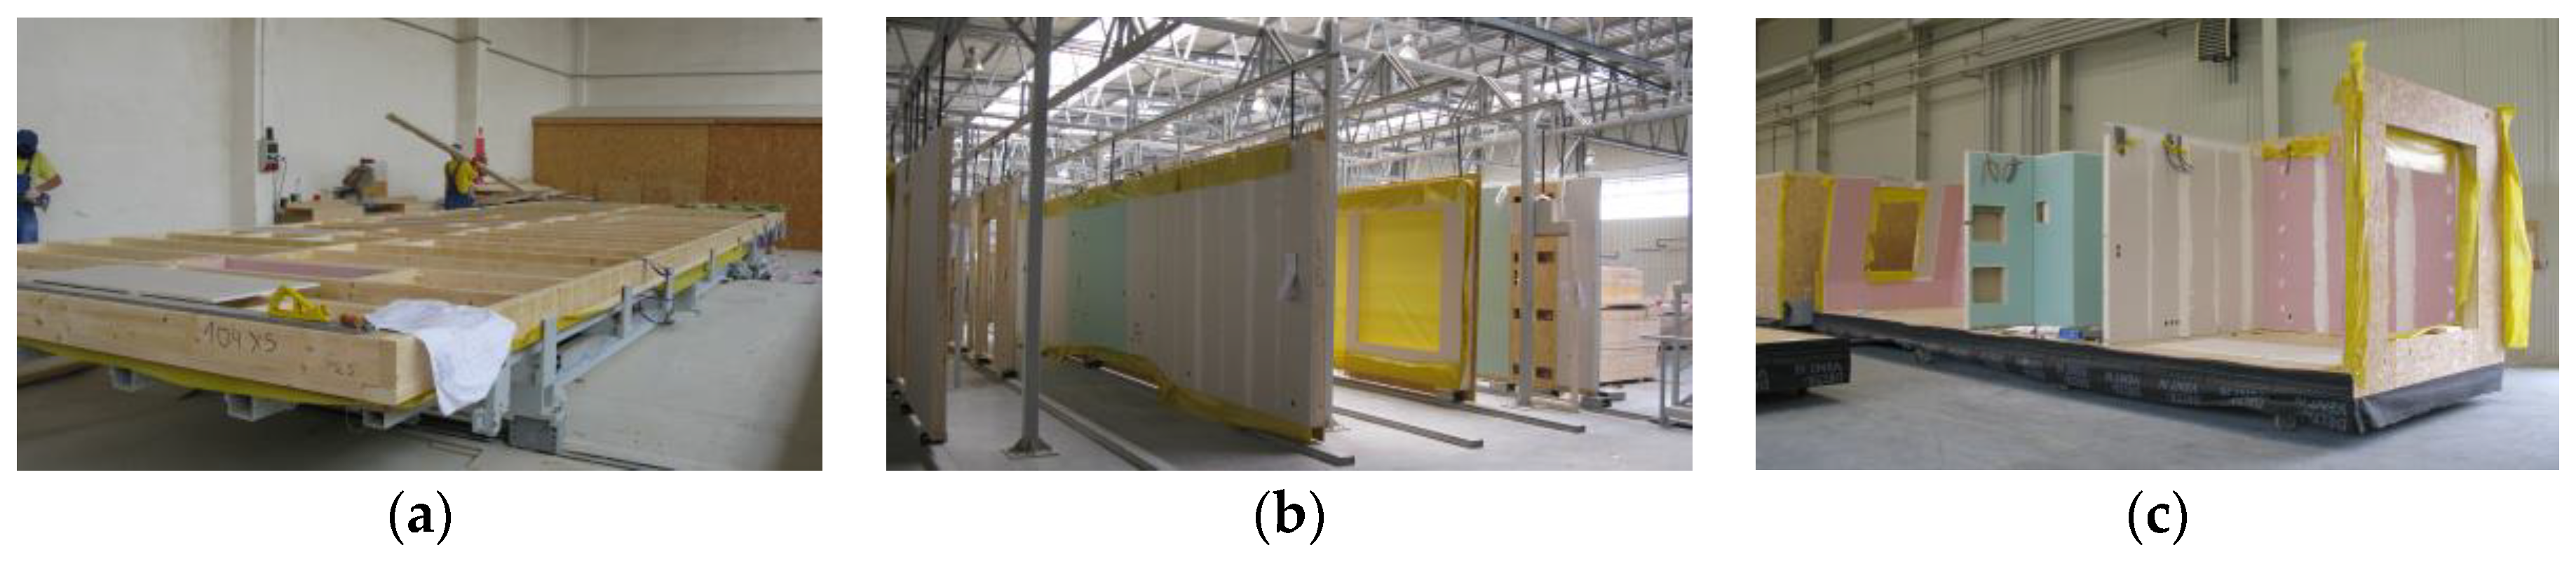
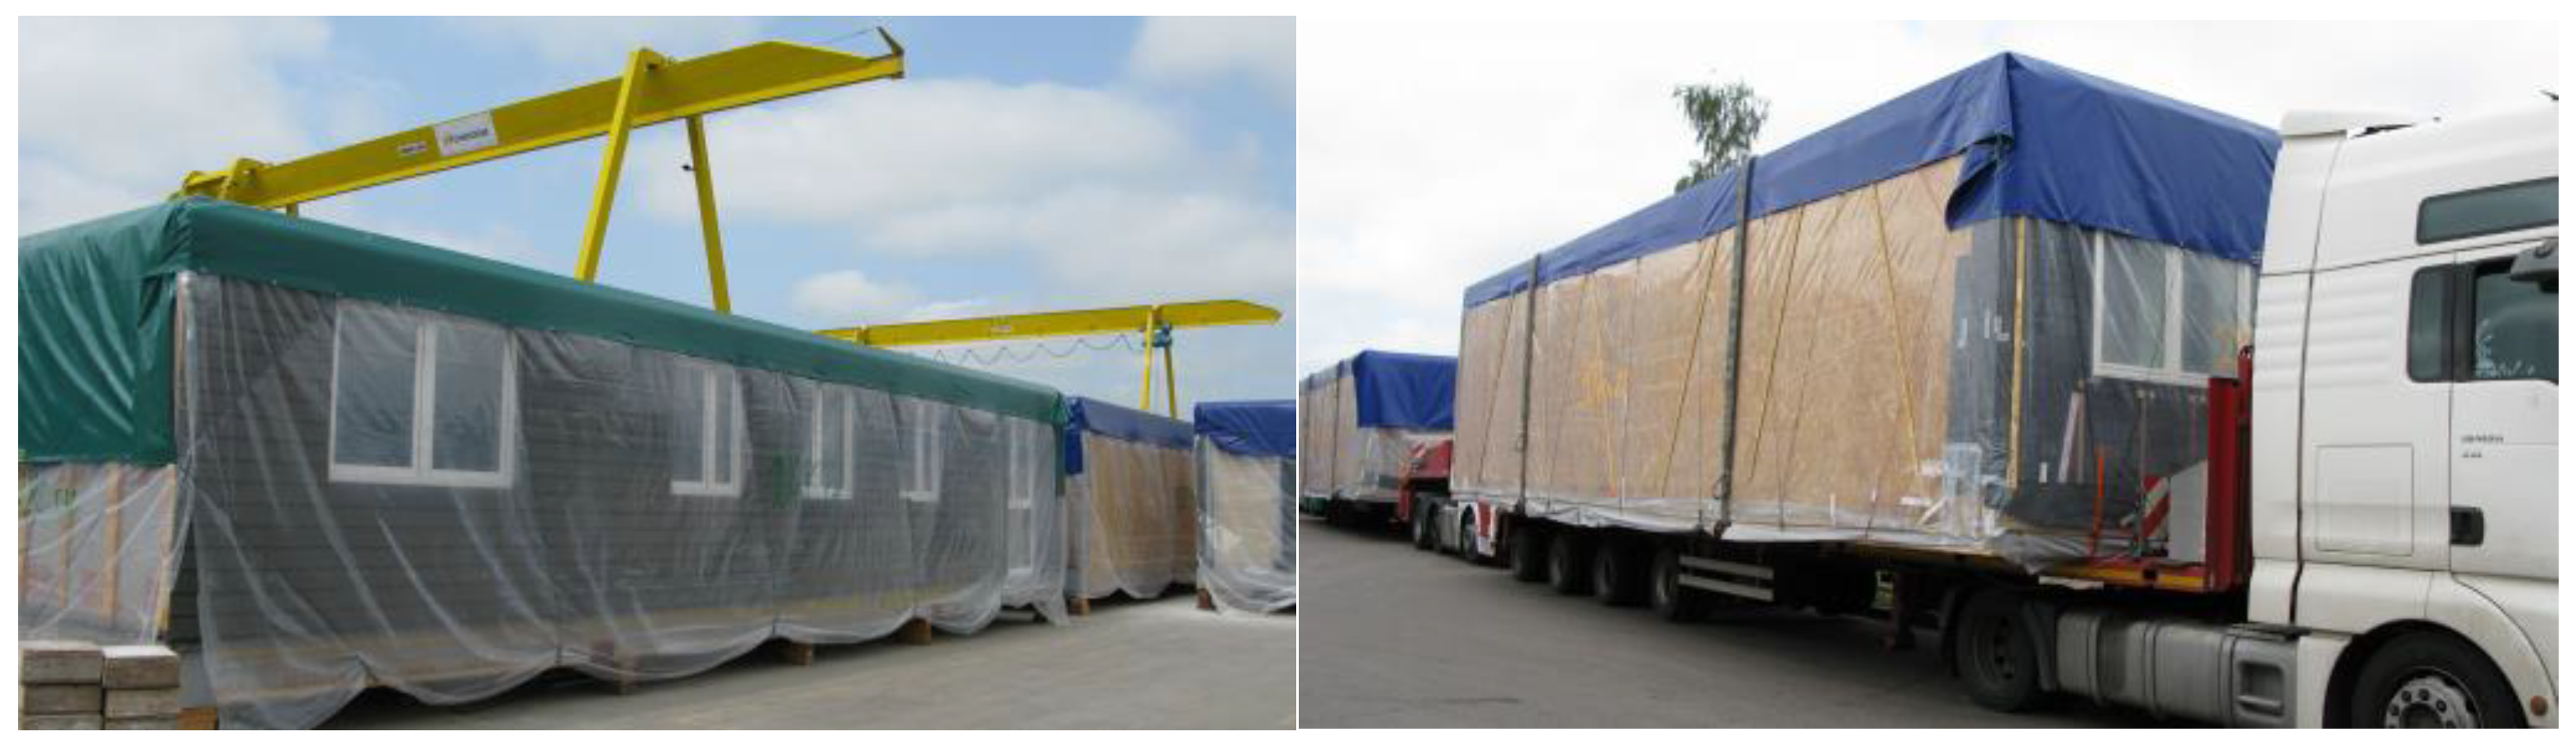
The current trends in wood-framed building construction rely on industrially constructed component units, with mass timber, particularly cross-laminated timber, as a standout choice for multifamily residential and commercial multi-story buildings (
Figure 2 and
Figure 3) [
21]. Large panel elements are common in one- or two-story residential buildings, while stakeholders prefer modules for constructing multifamily and multi-story structures.
The construction industry is shifting toward sustainable practices, notably in wood-framed buildings. Prefabricated wood-framed houses have gained traction due to benefits such as time and cost savings, rhythmic production, and enhanced structural reliability [
17,
28].
MCDM Applications in Construction
Decision-makers in construction need practical tools like MCDM methods and multi-attribute utility functions to effectively evaluate and rank various alternatives based on multiple criteria, thereby contributing to achieving sustainable development goals. Multi-attribute utility functions help rank and benchmark alternatives in complex concepts. Researchers emphasize the significance of multi-attribute utility functions and MCDM methods in quantitatively assessing and ranking sustainability and human development options. Various fields and disciplines have benefited from MCDM methods; however, researchers often face challenges in selecting appropriate methods and parameters for decision problems [
29]. Despite the availability of sophisticated MCDM methods, users often prefer relatively straightforward approaches due to the decisional conflict introduced by complex methods [
30]. Moreover, a notable criticism is that different MCDM techniques can yield divergent results when applied to the same problem [
31].
In recent years, the methodology of multi-criteria decision-aiding has developed significantly and proposed some interesting, complex approaches to eliminate the weaknesses of MCDM [
32]. Kadziński and Martyn [
33] highlighted methodological advances concerning weighting, aggregation, and robustness analysis. The successful application of these methods in achieving multi-dimensional targets underscores their effectiveness [
34,
35]. The MCDM approaches enable stakeholders to make informed decisions based on a systematic evaluation of various alternatives while also considering the interests and preferences of all involved parties [
36,
37,
38].
Benchmarking studies [
39] have compared and evaluated different MCDM methods. Gan et al. [
40] discussed weighting and aggregation methods, while other researchers explored integrated MCDM frameworks for project performance evaluation [
41,
42]. Zanakis et al. [
43] investigated the performance of eight MADM methods, including SAW, MEW, ELECTRE, and AHP, and found that all methods produced similar ranking results.
Gan et al. [
40] discussed the advantages and disadvantages of nine weighting and three aggregation methods, proposing a procedure to select the most suitable weighting and aggregation methods. Sałabun et al. [
44] analyzed several MCDA methods, including TOPSIS, VIKOR [
45], and PROMETHEE II (The Preference Ranking Organization Method for the Enrichment of Evaluations). PROMETHEE is a family of MCDA methods developed by Brans [
46], which involves a complete ranking of actions based on multi-criteria net flow and includes preferences and indifferences. Other methods like MACBETH (Measuring Attractiveness by a Categorical Based Evaluation Technique) [
47] and MACONT (Mixed Aggregation by Comprehensive Normalization Technique) [
48] rely on qualitative evaluations or mixed aggregation techniques. Some methods, like COMET (Characteristic Objects Method) [
49] and DRSA [
50], are strictly based on decision rules and employ fuzzy or rough sets [
51]. Daugavietis et al. [
38] analyzed five MCDM methods—WSM, TOPSIS, PROMETHEE (Preference Ranking Organization METHod for Enrichment of Evaluations), ELECTRE (Elimination and Choice Expressing REality), and DEA. Więckowski et al. [
52] investigated the ARAS, EDAS, MAIRCA, TOPSIS, and VIKOR methods in a fuzzy sustainable environment. Debnath et al. [
41] explored the integration of Step-wise Weight Assessment Ratio Analysis (SWARA) and weighted aggregated sum product assessment (WASPAS), Additive Ratio Assessment (ARAS), and Evaluation based on Distance from Average Solution (EDAS).
While numerous studies have explored MCDM methods for performance assessment, a consensus on the best-performing method still needs to be discovered, leading decision-makers to often rely on experience or recommendations. Many studies covered problem structuring, analysis, sustainability assessment, weighting, aggregation, and robustness analysis [
53,
54]. Researchers have critically evaluated and applied these methods to address complicated challenges, aiming to achieve multi-dimensional targets [
54]. However, the presence of subjectivity in criteria selection and weighting underscores the necessity for a well-defined and balanced approach to sustainability performance evaluation. Turskis [
55] ranked the available project options using the QUALIFLEX method [
56].
In cases where critical information about criteria is lacking, decision-makers can employ any of the scoring methods mentioned above in MCDM procedures. While scholars explored various MCDM methods, subjectivity in criteria selection and weighting remains challenging, emphasizing the need for a well-defined and balanced approach to sustainability performance evaluation [
57].
The application of mathematical methods follows a specific five-step algorithm:
Select the feature criteria influencing the decision.
Establish scales for each criterion with the participation of experts and representatives involved in the investment.
Code the alternative number scales for individual criteria.
Determine the number scales for alternative solutions based on the accepted criteria (data matrix).
Evaluate alternative solutions by computing synthetic indicators.
Examining and comparing project alternatives involves striking a balance among various impact types to assess the merits of each option. Multi-criteria analysis has proven valuable in this assessment as it provides a framework for integrating available information about impacts with the values and preferences of stakeholders and decision-makers. A vital aspect of this model is the determination of criteria weights. MCDM methods that generate a cardinal preference of the alternatives require the decision-maker to provide information in specific ways on the relative importance (weights) of the criteria concerning the objectives of the decision problem and performance ratings of the alternatives concerning each criterion [
58].
MCDM methods in construction project decision-making have become famous for handling complex criteria [
59]. Oluah et al. applied TOPSIS to evaluate construction material alternatives based on cost, environmental impact, and performance. Many studies demonstrate the applicability of MCDM techniques in construction decision-making, especially in sustainable development [
60].
When selecting an MCDM method, careful consideration of subjective and objective approaches is crucial. Subjective methods, such as the Analytic Hierarchy Process [
60] and SWARA [
61], may introduce biases based on decision-makers’ past beliefs [
62]. Objective methods, like entropy-based methods [
63], enhance objectivity by eliminating biases associated with subjective evaluations [
64]. CRITIC stands out for considering contrast intensity and conflicting relationships between decision criteria [
65].
Researchers developed various methods for determining criteria weights, including LINMAP [
66], the eigenvector method, the entropy method, and more [
60,
61,
67,
68,
69,
70,
71,
72]. Decision-makers normalize weights to sum to 1 [
73] with methods like the Neumann–Morgenstern or the Pattern method [
74,
75].
The practical solution is characterized by the lowest or highest synthetic mark depending on minimization or maximization normalization. Analyzed alternatives are ranked based on synthetic values calculated through summation indicators with or without criteria weights [
75].
Despite the growing interest in prefabricated construction and the application of MCDM and decision support systems, decision-makers need a unified system combining prefabrication, MCDM, and sustainability criteria [
74]. Integrating these elements is crucial for holistically evaluating and selecting profitable alternatives for sustainable implementation.
Contribution and Novelty of MADAMOS: MADAMOS pioneers sustainable implementation processes for prefabricated wood-framed buildings by integrating MCDM techniques, technologies, and transportation logistics. This research bridging literature gaps significantly contributes to advancing sustainable construction practices, fostering informed decision-making, and promoting the global adoption of prefabricated construction methods. The proposed decision support system, effective in large-scale applications, facilitates inclusive and sustainable decision-making in civil engineering and business planning.
4. Modeling of the Decision-Making System
Before creating a model, decision-makers should evaluate the sequence and interdependence of enterprise realizations.
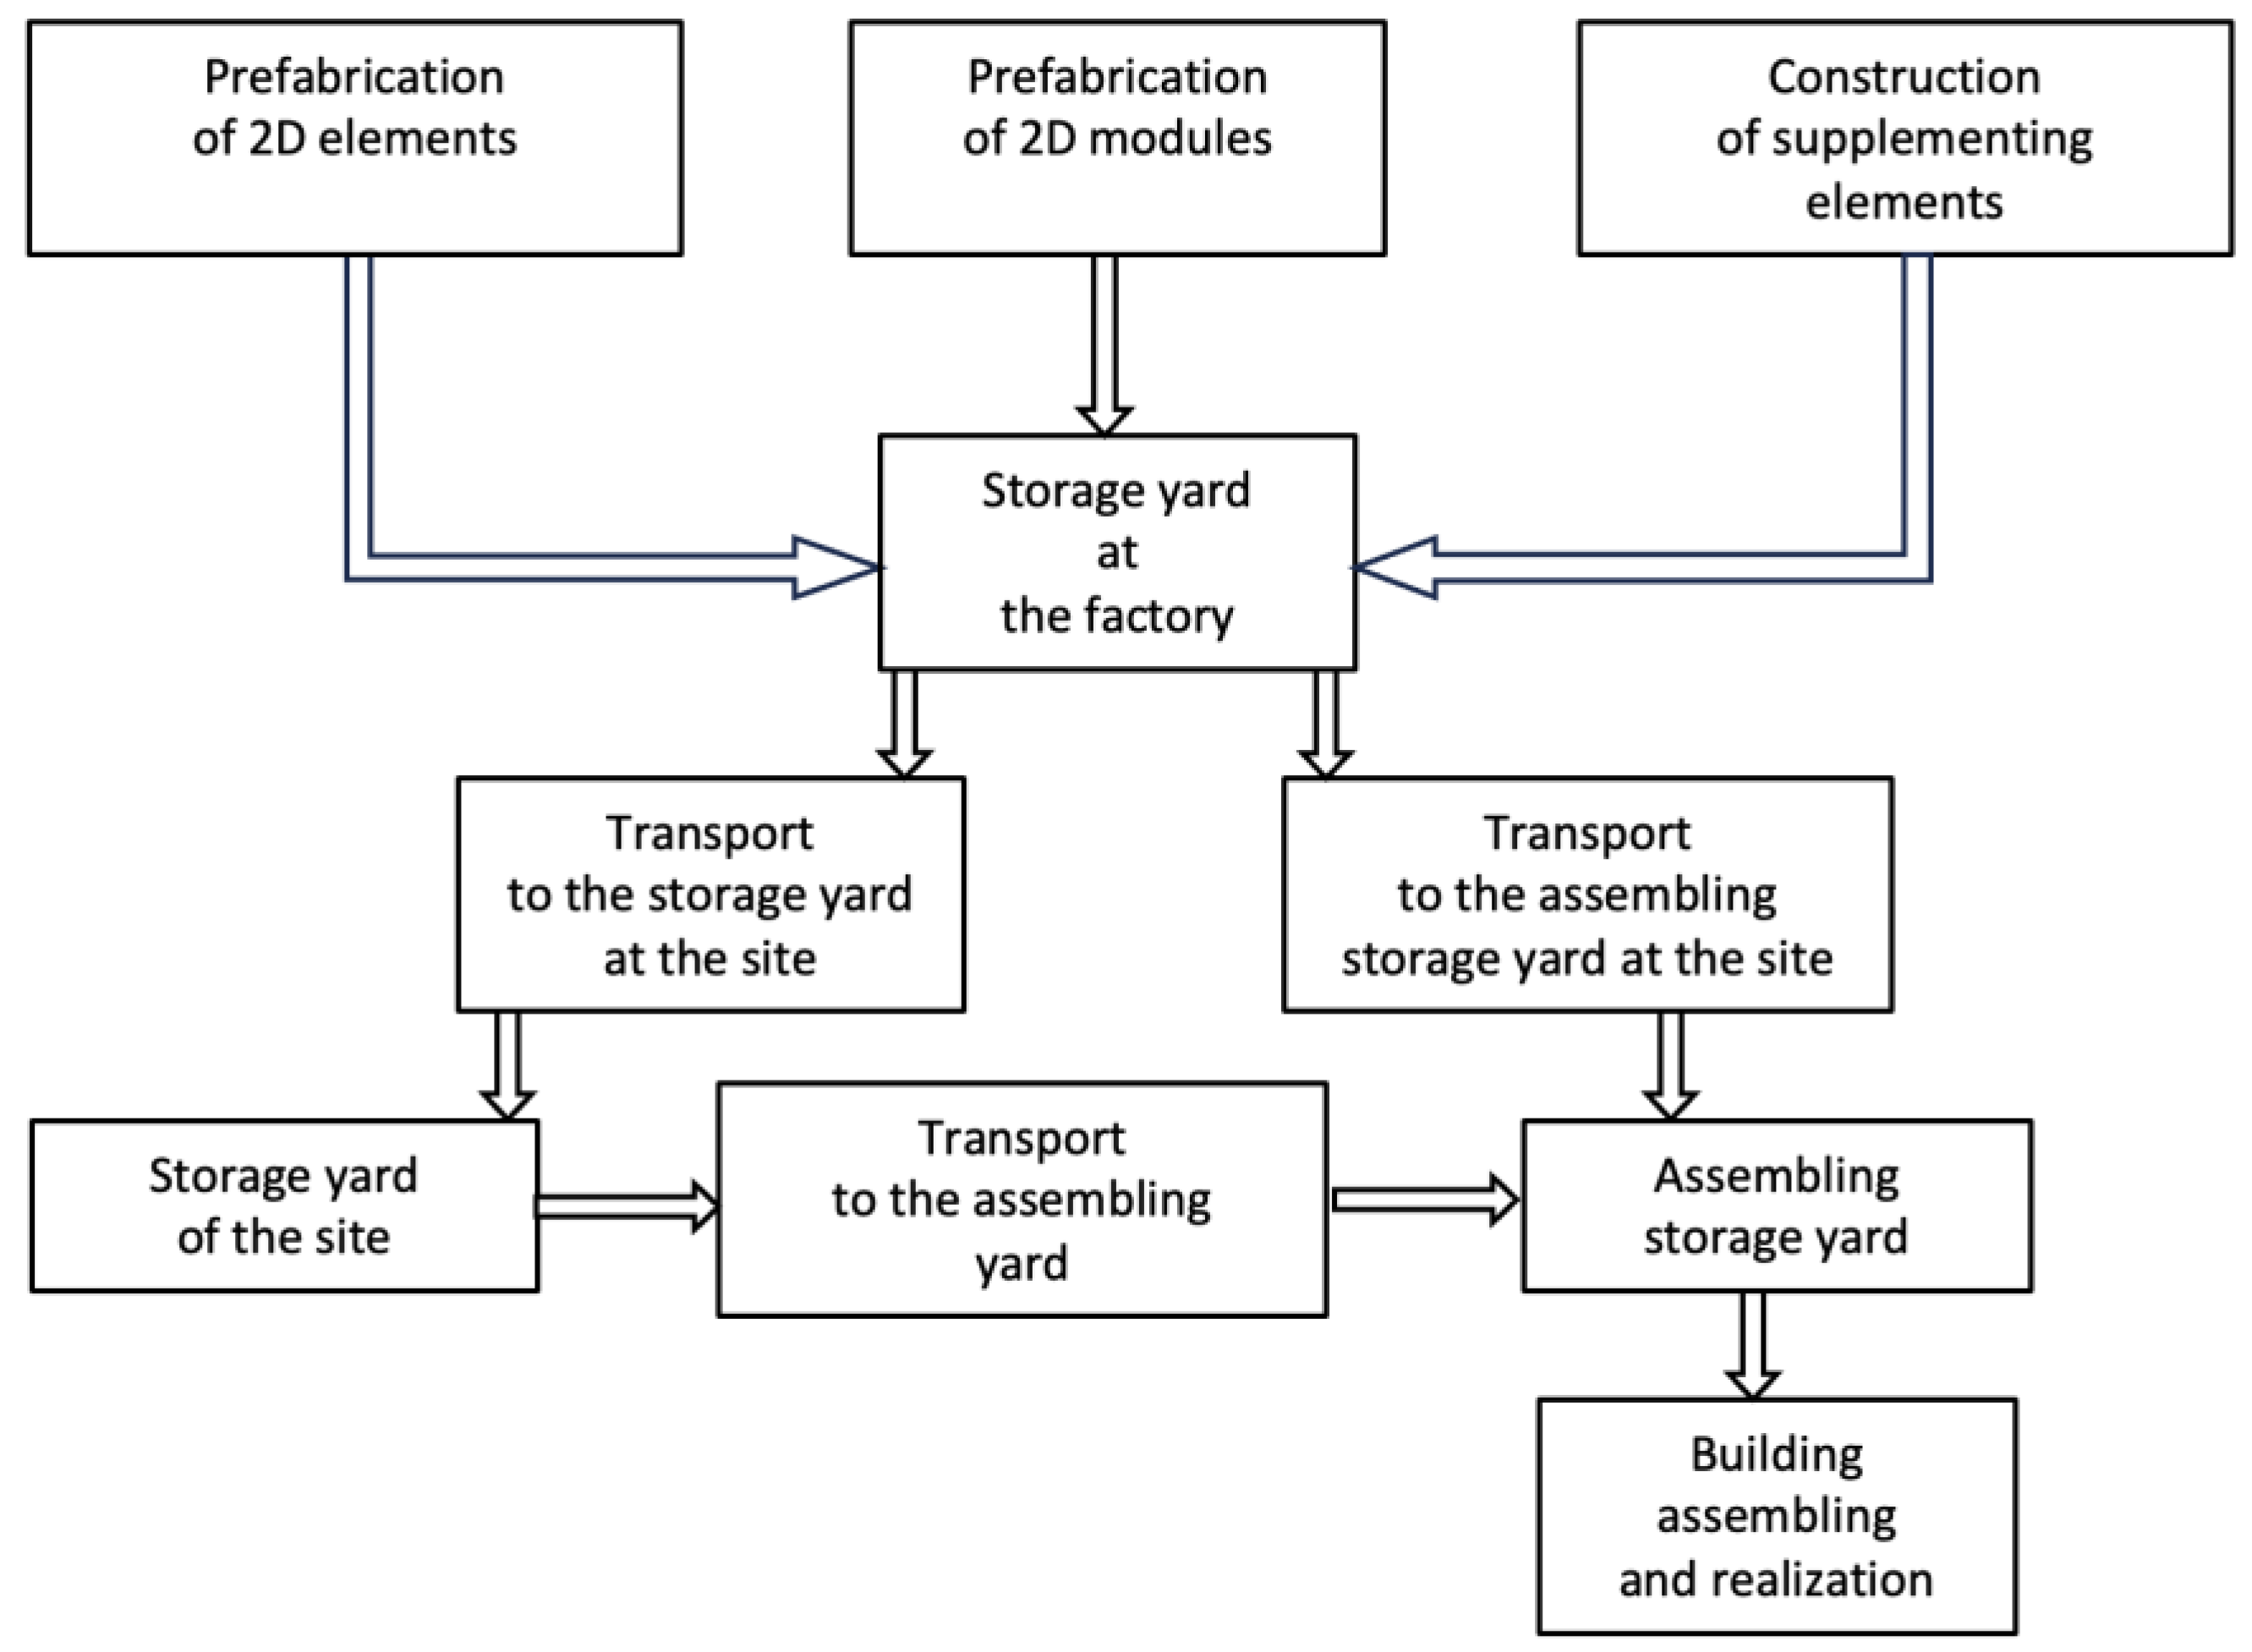
Figure 7 illustrates the sequence of enterprise realization in different alternatives, explicitly focusing on the transportation of structural elements from the factory stockyard to the assembling yard at the construction site. The first alternative requires additional transport operations from the stockyard to the assembling site.
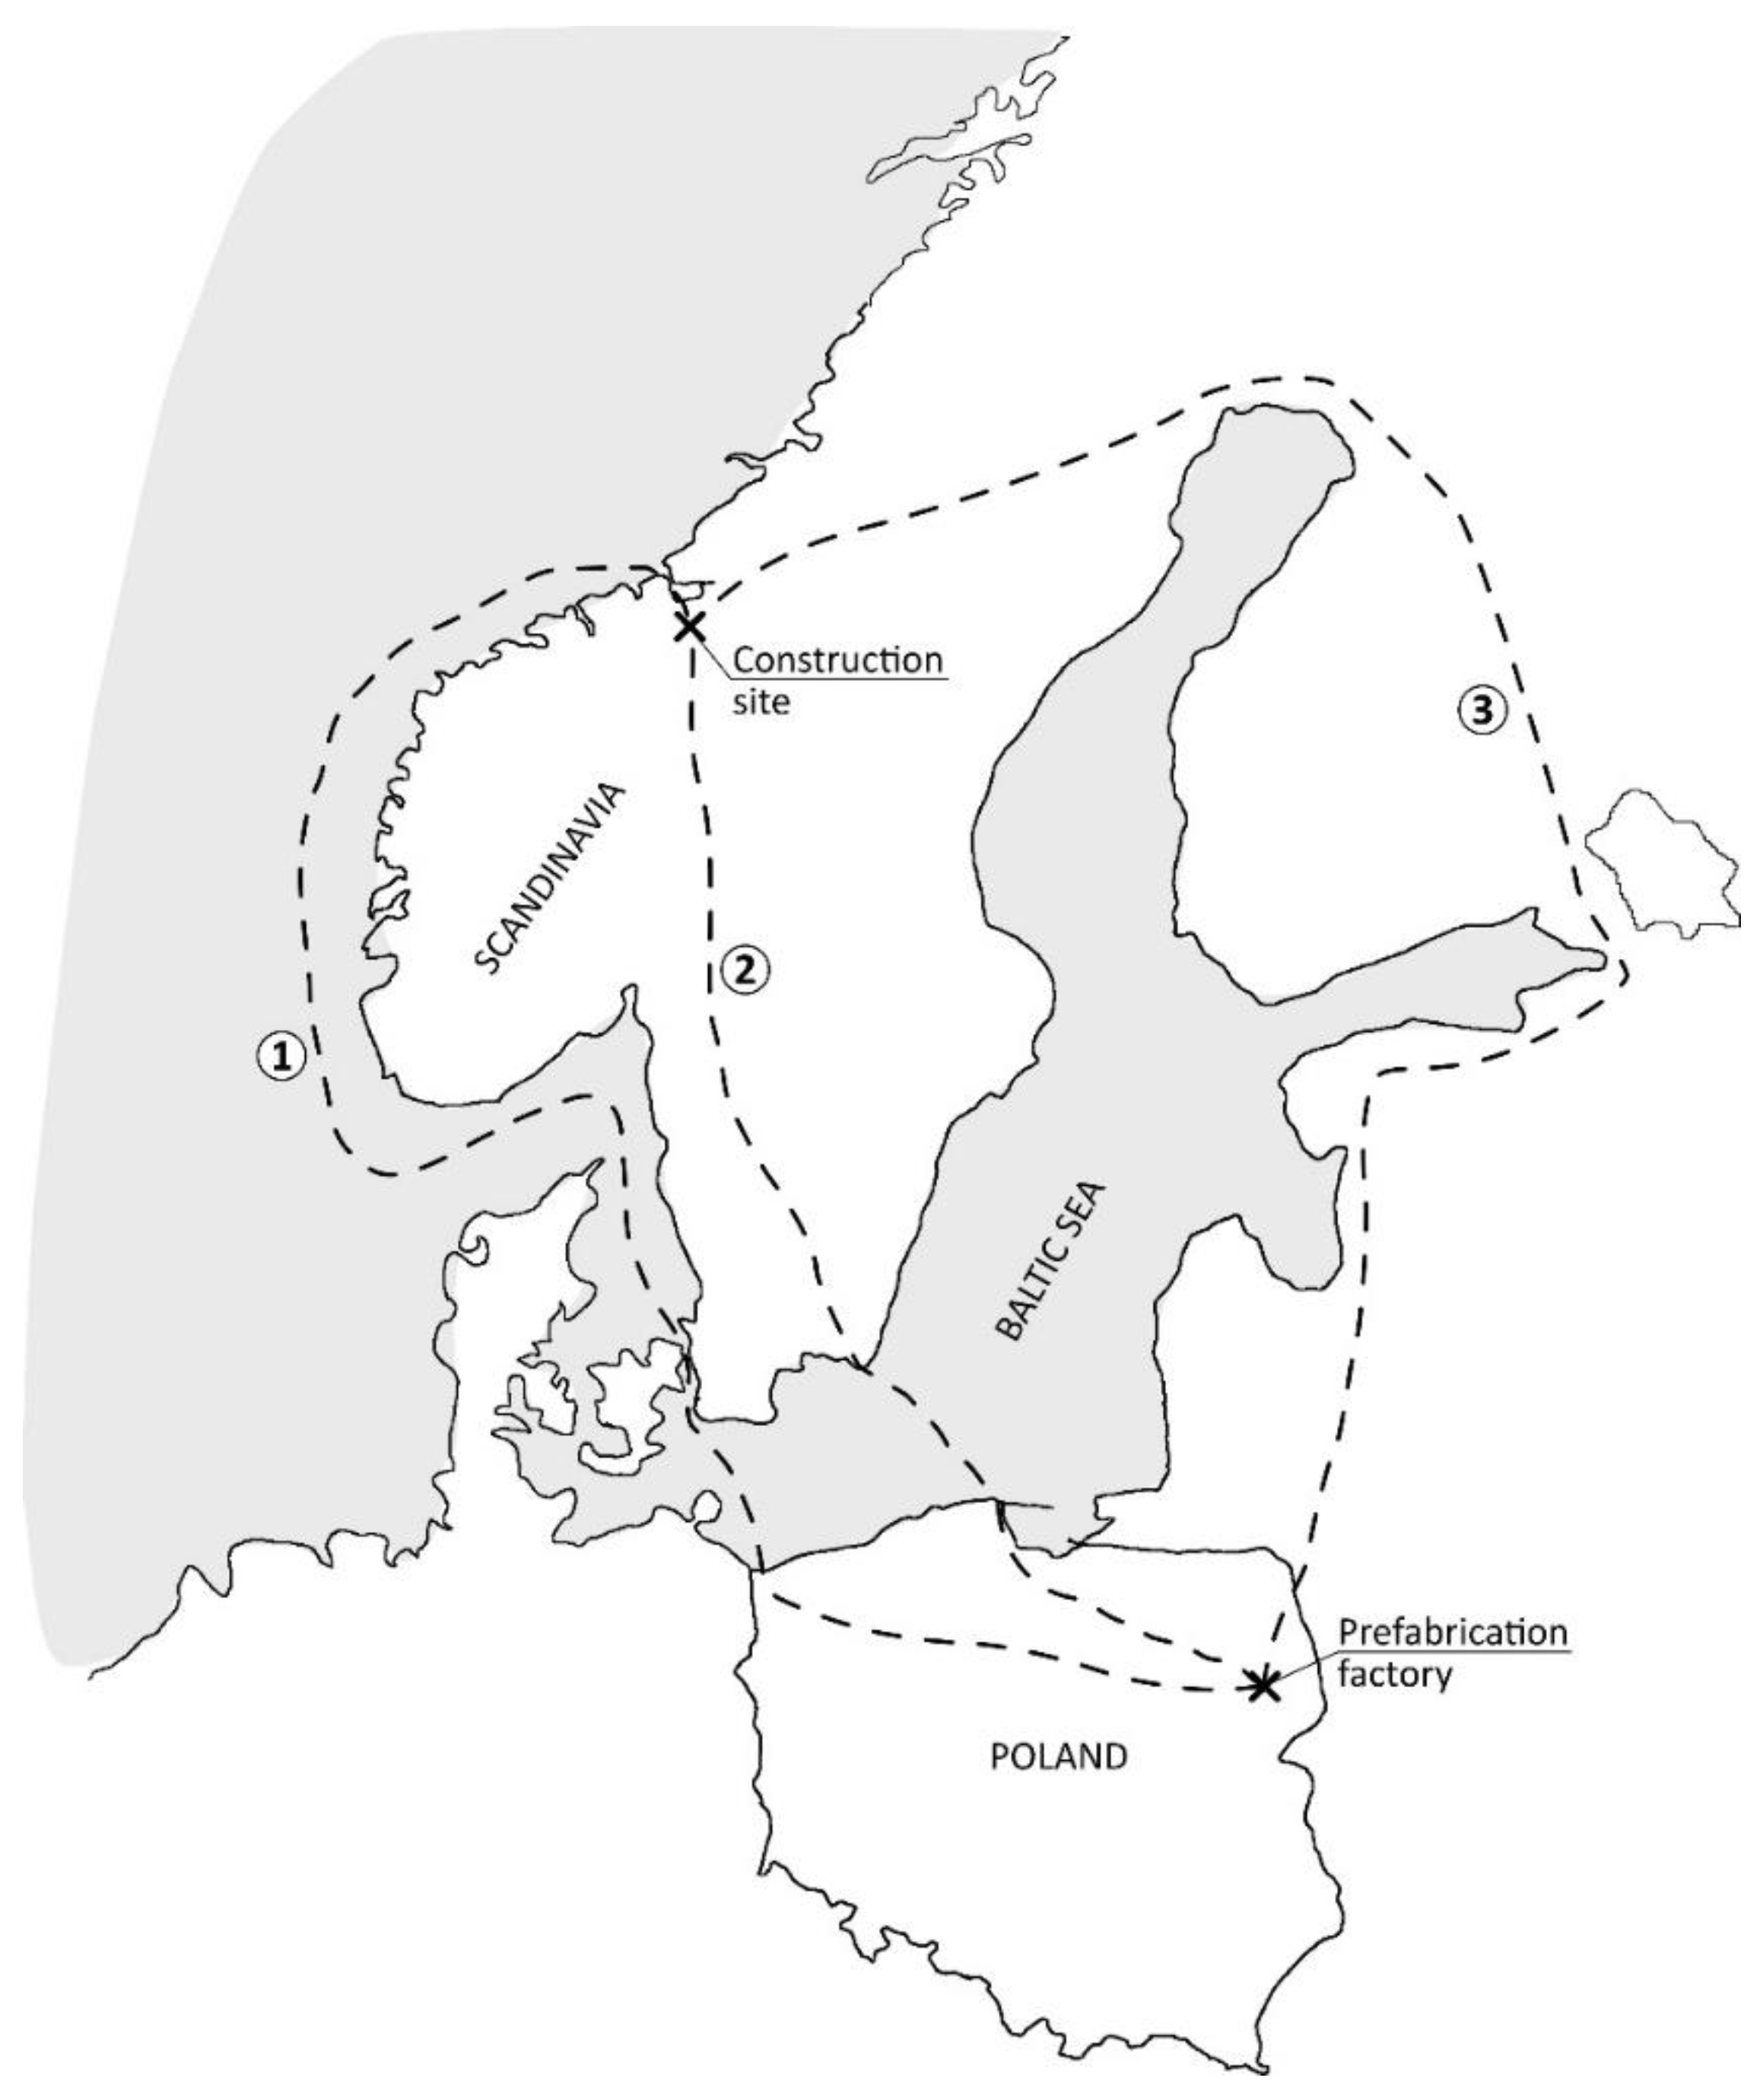
Figure 8 presents a diagram showcasing the transportation routes from Poland to Scandinavian countries to exemplify the transportation routes. Decision-makers investigated the following three transportation variants:
Semi-trailer transport and shipping via the Baltic, North, and Norwegian Seas.
Railway platform transport and shipping via the Baltic Sea.
Semi-trailer transport by land.
Given that the civil engineering sector and business planning affect the interests and resources of multiple actors, it is unacceptable to suggest (or even implement) an alternative without considering the interests and preferences of the (multiple) affected factors and actors. This paper presents an assessment and ranking model of alternatives based on an expert evaluation method to determine criteria weights and integrates the results of four different MCDM methods. Leading managers determined the sets of criteria based on the Delphic process and the direct ranking and rating approach. Integrating expert evaluation and various MCDM methods in an innovative assessment and ranking model aims to promote sustainable and inclusive decision-making in civil engineering and business planning. The Delphi method is a systematic and interactive approach that relies on a panel of independent experts [
76]. The fundamental principle of the Delphi methodology is that forecasts from a structured group of experts tend to be more accurate than those from unstructured groups or individuals [
77]. The selected experts answer questionnaires for selection to evaluate alternatives in two or more rounds [
78]. After each round, the moderator returns the experts a summary of the experts’ findings from the previous round and the basis of their decisions. Thus, participants are encouraged to revise their earlier answers in light of the replies of other group members [
79]. Finally, the moderator stopped the Delphi process after pre-defined top criteria (e.g., number of rounds, achievement of consensus, and stability of results) [
80]. Decision-makers widely used the Delphi method in multiple criteria decision problems.
The decision-making process for enterprise realization comprises three distinct phases [
74,
75,
81]:
The initial phase involves examining and formulating the decision process. It includes defining parameters and decision variables while evaluating the significance and validity of criteria.
The second phase focuses on finding a suitable solution. Decision-makers adapt the decision model and generate potential solutions for the formulated problem.
The final phase involves analyzing the results, modifying the model, and making the ultimate decision.
The procedure adheres to a structured scheme comprising the following steps:
Specifying analysis attributes.
Defining goal achievement conditions.
Evaluating criteria.
Selecting an appropriate analysis method.
Describing solutions based on the established requirements.
Processing data on alternative solutions using the chosen method’s algorithm.
Conducting a comparative analysis to facilitate the final decision-making process.
The analysis aims to determine optimal and sustainable processes for realizing prefabricated wood-framed houses [
74,
75,
81].
5. Methodology
In this section, the research details the methodology employed in this study, which constitutes a novel and integrated approach aimed at optimizing sustainable implementation processes for light wood-framed buildings in the Nordic region. The proposed decision support system, MADAMOS (An Integrated Multi-Criteria Decision-Making Approach for Profitable Realization Alternatives), addresses the identified research gap by comprehensively integrating prefabrication, transportation logistics, and MCDM techniques. The abbreviation MADAMOS stands for Multi-Attribute, Additive Ratio (ARAS), Distance from Average Solution (EDAS), Multiplicative Exponential Weighting (MEW), and Multi-Objective Optimization System.
Multi-Criteria Analysis: Decision-makers assess the profitability and viability of different realization alternatives considered multiple criteria, including building price (C1), execution time (C2), warranty period (C3), and failure points (C4). Decision-makers measure each criterion based on specific attributes and establish an optimal value for either minimization or maximization, depending on the criterion type. The integration of various criteria allows decision-makers to evaluate alternatives holistically, accounting for multiple dimensions of sustainability and profitability.
Mathematical Normalization: The decision-makers normalized the criteria measures to facilitate comparative analysis and standardize the scales across different measures. For benefit-type (maximizing) criteria, Equation (4) was used to calculate each alternative’s normalized performance measure. Similarly, for cost-type (minimizing) criteria, Equation (5) was applied to normalize the criterion measures. The normalization process enhances comparability and consistency in evaluating alternatives, ensuring a fair performance assessment.
Weight Assignment and Optimization Techniques: MADAMOS’s uniqueness lies in determining and optimizing criteria weights. An expert group, including representatives from the investor and the contractor, assigns weights to each criterion based on two priorities: price reduction (S1) and execution time reduction (S2). These weights reflect the preferences and objectives of the stakeholders.
Decision-makers normalized criteria measures are multiplied by the corresponding weights for each alternative to identify the most profitable realization alternative.
The alternative with the highest adjusted summative ratio is considered the most favorable and is ranked accordingly. The optimization process allows decision-makers to make informed choices that align with their priorities and achieve the most desirable outcomes.
The use of advanced mathematical techniques, such as MCDM and optimization, in combination with rigorous normalization procedures, underlines the rigor of this research. MADAMOS enables a systematic and thorough evaluation of alternatives, considering multiple criteria and their relative importance. Integrating prefabrication technologies and transportation logistics with sustainability criteria ensures that the decision-making process accounts for a comprehensive set of factors that are essential for sustainable construction practices.
In conclusion, the methodology employed in MADAMOS demonstrates its uniqueness and effectiveness in addressing the identified research gap. The integrated approach combines multi-criteria analysis, mathematical normalization, and optimization techniques to provide decision-makers with a robust and reliable decision support system. The rigorous evaluation process enables stakeholders to optimize sustainable implementation processes for prefabricated wood-framed buildings in the Nordic region. It fosters a transition toward more sustainable and efficient construction practices.
5.1. Multi-Attribute Decision-Aiding Method Integrating ARAS, EDAS, and MEW/WPM Method–MADAMOS
Using three different multi-attribute utility function types, such as additive (ARAS), reference point (EDAS), and multiplicative (MEW), and integrating their results can significantly enhance the depth and robustness of decision-making process. This approach provides the following:
Holistic Assessment: Each utility function provides a unique perspective on the decision problem. Additive models (ARAS) allow for a linear combination of criteria; reference point models (EDAS) incorporate aspiration levels; and multiplicative models (MEW) consider interactions and trade-offs among criteria. Using all three ensures a holistic assessment that captures many factors.
Risk Mitigation: Different utility function types have their strengths and weaknesses. By integrating the results, research mitigates the risks of relying on a single model. If the results from multiple models converge, it increases confidence in the recommendations. If they differ, it alerts decision-makers to areas of uncertainty or contention that require further exploration.
Comprehensive Analysis: Integrating results from multiple models provides a comprehensive view of the decision problem. It allows researchers to identify outliers or areas where a specific model may produce unusual results. This analysis is crucial for gaining a deep understanding of the complex interplay of criteria.
Flexibility and Adaptability: Specific modeling approaches may benefit different decision scenarios. By having a suite of models at decision-makers’ disposal, they can adapt to the unique requirements of each situation. The flexibility to use ARAS, EDAS, or MEW ensures that the research methodology aligns with the specific characteristics of the decision problem.
Comparative Evaluation: Integrating the results of ARAS, EDAS, and MEW enables a comparative evaluation. This comparison can highlight areas of consensus and divergence among the models. Understanding these patterns can guide decision-makers in making more informed choices.
Consensus Building: Integrating results from diverse models can be a powerful consensus-building tool in cases involving multiple stakeholders. It helps align the perspectives of various decision-makers by showing where models agree and where there may be differences.
Cross-Validation: Integrating different models can serve as a form of cross-validation. If the results from each model align, it boosts confidence in the recommendations. It signals a need to investigate potential discrepancies or uncertainties if they differ significantly.
The research approach using three different multi-attribute utility function types and integrating their results ensures that the analysis captures the full spectrum of considerations, addresses uncertainties, and empowers decision-makers with a deeper understanding of the decision problem, ultimately leading to more informed and effective choices.
5.2. The ARAS Method [82]
The ARAS method offers a systematic and practical approach to handling complex decision-making problems with multiple criteria, allowing decision-makers to make well-informed and objective choices. The ARAS method is a decision-making approach that evaluates and ranks different alternatives based on multiple criteria. It aims to provide a clear and objective way of integrating criteria, which describe alternatives and their values, into a single optimal value. By incorporating expert judgments and normalization techniques, the method allows decision-makers to assess and compare the performance of various alternatives systematically and sustainably.
The ARAS method is a benchmark in sustainable implementation processes due to its simplicity and popularity in practical applications. This approach enables decision-makers to integrate multiple criteria, each with distinct dimensions and preferences, into a comprehensive assessment.
Let be the set of alternatives interrelated with the examined phenomenon and bethe set of individual indicators characterizing the phenomenon, where P and N are the sets of positive and negative indicators, respectively.
The method involves several stages, as follows:
Decision-makers with the system of criteria, weights of criteria, and criteria values formed the initial decision-making matrix (table in
Section 6). The matrix values indicate each alternative’s performance concerning each criterion:
m is the number of alternatives;
n is the number of criteria describing each alternative; the
value represents the performance value of the
i-th alternative in terms of the
j-th criterion; and
x0j is the optimal value of the
j criterion.
When decision-makers do not know the optimal value for a criterion, they could approximate it using Equation (2):
The values 0.8 and 1.2 in Equation (2) are used as adjustment factors when decision-makers are uncertain about the optimal value for a criterion. These adjustment factors provide a way to approximate the optimal value based on the observed data.
Specifically, as follows:
When the maximum value of is considered preferable but unknown, is approximated as 1.2 times the maximum observed value of .
When the minimum value of is considered preferable but unknown, is approximated as 0.8 times the minimum observed value of .
These adjustment factors allow decision-makers to account for uncertainty in their data and make informed approximations of the optimal value for a criterion without precise information.
When decision-makers use a qualitative scale to assess criteria values, is the maximal available value of the used scale.
The next stage is as follows:
For criteria with preferable values as maxima, decision-makers use the following normalization procedure:
For criteria with preferable values as minima, decision-makers employ the following two-stage normalization procedure:
Decision-makers calculate the normalized-weighted values for each criterion
:
is the weight (importance) of the j criterion, and is the normalized rating of the j-th criterion.
is the value of the optimality function of the
i-th alternative.
Ranking Alternatives: The alternatives are ranked based on their optimality function values . Higher values correspond to more preferable alternatives.
Utility DegreeDetermination: Decision-makers compare each alternative’s utility degree (or performance level) with the ideally best alternative and quantify it. The utility degree values fall within the interval [0, 1], indicating the relative efficiency of each alternative:
and
are the optimality criterion values obtained from Equation (9). The
values fall within the interval [0, 1]. By following these stages, decision-makers can identify the most efficient and sustainable approach for the project at hand, such as the prefabricated wood-framed houses project in the research by Zavadskas and Turskis [
83], Turskis and Zavadskas [
82,
84], and Keršulienė and Turskis [
85].
5.3. The Method of Evaluation Based on Distance from Average Solution (EDAS)
Keshavarz Ghorabaee et al. [
86] developed the EDAS method. The EDAS method represents a groundbreaking approach to multi-criteria decision-making. This innovative technique provides decision-makers with a systematic framework for navigating complex choices. By evaluating alternatives based on their divergence from the mean solution across each criterion, the EDAS method empowers decision-makers to navigate intricate decision landscapes swiftly. Its methodical process of quantifying deviations from the mean solution equips decision-makers with the tools for efficient decision-making.
Furthermore, Keshavarz Ghorabaee et al. [
87] extend the EDAS method’s efficacy further into a fuzzy environment. In essence, the EDAS method stands as a robust and innovative solution for multi-criteria decision-making. Its ability to objectively assess alternatives by quantifying their deviations from the mean solution for each criterion underscores its value in managing intricate decision scenarios marked by conflicting criteria.
In a setting featuring n alternatives ( criteria (), the EDAS methodology can be succinctly outlined:
Step 1: Identifying Pivotal Criteria. In the initial step, the method mandates identifying the most significant criteria that define the unique attributes of the alternatives under consideration.
Step 2. Preference Decision Matrix. A core aspect of the EDAS method is the construction of a preference decision matrix, denoted as
. This matrix captures decision-makers’ preferences across
m rational alternatives
(rows) concerning
n criteria (columns). Each element
within the matrix signifies the performance rating of alternative
(
) concerning criterion
(
).
Here, denotes the performance value of alternative () concerning criterion (), as assessed by the decision-maker.
Step 3: Deriving Criteria Weights. Accurate assessment necessitates deriving criteria weights, represented as the criteria weight vector
.
This vector reflects the decision-makers’ collective weight to each criterion and is pivotal in subsequent calculations. There and symbolize the weight assigned to criterion ().
Step 4: Average Solution. The EDAS method calculates an average value
for each criterion, representing the mean performance level across all alternatives. These average values serve as a reference point for assessing alternative performance and represent the average solutions concerning each criterion, with dimensions mirroring those of the criteria weights’ matrix:
Step 5: Construct the Average Solution. Decision-makers construct the average solution based on the calculated average values
and carefully prepare the average solution
. This composite solution encapsulates the overall average performance across all criteria:
Step 6: Establishing Distance Metrics. The EDAS approach systematically calculates distances from the average solution (
) for both beneficial (
) and non-beneficial (
) criteria. This computation generates a matrix
encompassing positive
and negative
distances. These distances provide insights into how alternatives perform relative to the mean solution across all criteria:
When dealing with beneficial criteria, calculate
and
as follows:
For non-beneficial criteria, the calculations are as follows:
Step 7: Weighted Distance Aggregation. The EDAS method evaluates the weighted sum of positive
and negative
distances from the average solution
. This process captures the overall deviation of each alternative’s
performance from the average solution:
Here, represents the weight of criterion j.
Step 8: Normalization and Appraisal Scores. The derived distances are normalized to yield each alternative’s appraisal scores
and
. These scores provide a comprehensive perspective on an alternative’s performance concerning the mean solution, accounting for positive and negative deviations. Normalize the values of
and
for all alternatives as follows:
Step 9: Calculate the appraisal score values for all
alternatives as follows:
Step 10: Alternative Ranking. The final step involves ranking alternatives based on their appraisal scores . Alternatives with higher scores are deemed more favorable choices. This ranked list aids decision-makers in making informed selections and classifications.
5.4. The Multiplicative Exponential Weighting (MEW) (Weighted Product Model (WPM)) Procedure
Scholars designed the MEW to handle such situations by combining criteria and their relative importance into a single aggregated score for each alternative. The Weighted Product Model (WPM), also known as the Multiplicative Exponential Weighting (MEW) approach [
88,
89], is similar to the WSM method [
89] but with multiplication instead of addition. Decision-makers compare each alternative with others by multiplying the ratios, one for each criterion [
90]. The WPM compares each alternative with others by multiplying several ratios, one for each criterion, and each ratio is raised to the power equivalent to the relative weight of the corresponding criterion.
MEW has proven to be a valuable addition to the toolkit of MCDM methods, offering a flexible and robust approach for decision-makers to handle complex decision scenarios effectively. Its ability to progressively encapsulate prior knowledge and converge toward solutions makes it an excellent tool for decision-making. Decision-makers have applied MEW in various domains, such as airport runway selection [
91], assessing stair designs for dwelling houses [
92], and other areas [
43,
55].
MEW allows decision-makers to express the importance of each criterion and the degree to which they value high or low values for each criterion. By using the exponential function for weighting, MEW ensures that weight differences have a more pronounced effect on the final ranking, making it a helpful method for dealing with complex decision scenarios where criteria have varying levels of importance. The MEW method involves the following steps:
Step 1: Criteria Normalization: The first step in MEW is to standardize the raw data of each criterion. Standardization transforms the data of each criterion into a comparable scale, typically between 0 and 1, to ensure equal weight in decision-making.
The decision matrix entities are normalized using desired preferences for beneficial and non-beneficial attributes to make attributes comparable (the way is similar, as presented by Equations (5) and (6)):
Step 2: Exponential Weighting: In MEW, decision-makers assign weights to each criterion using the exponential function, allowing for more pronounced weight differences and expression of preferences, especially for highly relevant criteria.
A weighted normalized decision matrix is obtained using the following equation:
is the weight (importance) of the j criterion, and is the normalized rating of the j criterion.
Step 3: Aggregation of Criteria: Once the criteria are standardized and weighted, the next step is to aggregate the criteria for each alternative. Decision-makers combine the criteria using a multiplicative approach, where the standardized values of each criterion for a specific alternative are multiplied by their respective exponential weights.
The MEW method calculates the optimality function value for each alternative based on the normalized criteria values and weights. This value represents an alternative’s complex relative.
5.5. Integrating Results from MCDM Methods
Integrating results from various MCDM methods is a widely adopted practice to improve decision outcomes’ robustness and reliability. It allows decision-makers to address uncertainty and model imprecision, providing a more realistic representation of the inherent uncertainty in the decision problem and leading to a more holistic evaluation.
In the results integration process, decision-makers follow several steps:
Obtaining Results from Different MCDM Methods: Each MCDM method, such as the ARAS method, the EDAS method, and the Multiplicative Exponential Weighting, is applied to the same criteria and alternatives to derive individual rankings or scores.
Scale Normalization: Results from different methods are normalized to a standard scale by decision-makers to ensure compatibility. This step is vital when methods produce varying scales or units of measurement.
Combining the Results: Various techniques, like weighted averaging, rank aggregation, or fuzzy set approaches, merge the normalized results. Decision-makers assign appropriate weights to each method’s contribution based on factors like method reliability, expert consensus, or historical performance.
Sensitivity Analysis: Decision-makers conduct sensitivity analysis to assess the impact of different weight assignments on the final integrated result. This analysis gauges the integration process’s robustness and identifies critical factors influencing the ultimate decision.
Integrating results from three different MCDM methods, such as the ARAS, EDAS, and Multiplicative Exponential Weighting, offers a powerful approach to enhancing decision-making outcomes. The process combines diverse insights, promotes robustness, and comprehensively considers various criteria and alternatives, enabling more informed and reliable decisions.
Different multi-attribute utility functions are described based on different philosophies and logic, and the initial reference point of utility is different. Therefore, better decisions exist than simply adding or multiplying scores given by different perspectives, which could provide decision-makers with different results. Therefore, the results of three different methods that decision-makers integrate using average ranks are calculated for each alternative.
6. Analysis of the Problem under Consideration
The analysis focuses on constructing light wood-framed buildings in the Nordic region. The objective is to select the most profitable alternatives for realization, considering criteria such as building price, execution time, warranty period, and failure points. Primary analytical data for the analysis are obtained from the investor, and three investment realization alternatives are assumed.
Primary analytic data for analysis have been obtained from the investor. Construction includes part of the building above the ground level. There are assumed three alternatives of investment realization, i.e.,
Large panel technology of construction.
Semi-trailer trucks and ferries for transportation across the Baltic, North, and Norwegian Seas.
Construction from the stockyard of precast elements.
Modular technology of construction.
Transport by trucks on railway platforms and ferries across the Baltic, North, and Norwegian Seas.
Realization directly from the trucks (assembling from the wheels). At present, the alternative is almost unavailable.
Mixed technology of precast fabrication (large panel and modular).
Semi-trailer trucks for transportation through Russia and Finland.
Construction from the stockyard of precast elements.
A set of criteria and their characteristics are established for the analysis. Each criterion is measured and has an optimal value that should be either minimized or maximized, depending on the type of criterion. The criteria include the following:
It depends on the cost of materials and degree of preparation, ease of assembly, transportation, implementation time, technological features, durability, and aesthetic values.
Measured criterion value.
Minimizing (cost type criterion; the optimal value is minimal).
It depends on the degree of preparation, ease of transportation, ease of assembly, and technological execution.
Measured criterion value,
Minimizing (cost type criterion; the optimal value is minimal).
It depends on the quality of materials and production and the correct use.
Measured criterion value.
Maximizing (profit type criterion; the optimal value is maximal).
Depends on the durability, quality of materials and manufacturing, and correct use.
Measured criterion value.
Minimizing (cost type criterion; the optimal value is minimal).
Criteria measures of the options under consideration.
The investor’s documentation and information provide initial measures of criteria
C1,
C2, and
C3 for each implementation solution option. Analyzing operational parameters, such as cracks, scratches, and other potential defects, determines failure rates.
Table 1 presents the mean values of the criteria measures. An expert group of representatives from the investor and the contractor determines the weights of individual criteria. Two sets of weights are adopted: prioritizing price reduction (
S1) and execution time reduction (
S2).
Table 1 presents the sets of weights for each criterion.
6.1. Criteria Value Normalization
Decision-makers normalized the criteria measures to facilitate comparative analysis. The aim of normalization is to replace the initial measure
by its ratio to the maximum value of the measure, e.g., the criterion
cj for all alternatives [
74,
75]. The normalization process brings the values from decreasing to increasing, depending on whether the criterion is a benefit or cost type. Moreover, each specific MCDM method has a different normalization procedure.
Equations (4) and (5) present normalization for the ARAS and MEW methods.
Table 2 presents the normalized measures of criteria for individual alternatives after maximization.
Table 3 presents normalized criteria measures for the ARAS and MEW methods.
Table 4 presents normalized-weighted criteria measures and solution results for the ARAS method.
Table 5 presents normalized-weighted criteria measures and solution results for the MEW method.
The EDAS method uses Equations (16) and (17).
Table 6 and
Table 7 present normalized-weighted criteria measures and solution results for the EDAS method.
6.2. Interpretation of Results
The MADAMOS decision support system results demonstrate the effectiveness of the integrated multi-criteria decision-making approach for optimizing the sustainable implementation of light wood-framed buildings in the Nordic region. Analyzing different realization alternatives based on criteria such as building price, execution time, warranty period, and failure points provides valuable insights for construction stakeholders.
All methods showed the same results (
Table 4,
Table 5 and
Table 7). This shows the greater reliability of the acquired data.
Alternative 2 (A2), which utilizes modular technology and transportation by trucks and ferries, consistently outperformed the other options regarding cost efficiency, execution time reduction, warranty period, and failure points. Therefore, decision-makers selected it as the most preferable and implemented it. This finding aligns with recent studies in the literature, emphasizing the advantages of prefabrication and transportation logistics in improving construction efficiency and quality.
Implications for the Construction Industry and Sustainable Development
This research’s findings significantly impact the construction industry and sustainable development in the Nordic region and beyond. By embracing the proposed decision support system, construction stakeholders can make well-informed decisions that lead to cost-effective and time-saving implementation processes. Adopting prefabrication technologies and optimized transportation logistics enables the industry to achieve higher levels of quality assurance, reduce on-site construction time, and enhance overall project success.
Integrating sustainability criteria in decision-making promotes environmentally conscious practices and supports the construction industry’s transition toward more sustainable solutions. Focusing on social sustainability, such as reduced disruption to local communities during construction, further reinforces the positive impact of prefabricated wood-framed buildings on the surrounding environment and society.
6.3. Limitations and Future Research
While the MADAMOS approach presents a robust and comprehensive methodology, certain limitations should be acknowledged. This study focused on specific criteria, including building price, execution time, warranty period, and failure points. Future research could expand the analysis to incorporate additional criteria, such as environmental impact, energy efficiency, and social acceptability, to provide a more holistic assessment of sustainable construction practices.
Moreover, this study’s scope was limited to the Nordic region, and the results may vary in different geographical contexts. Future research could explore the applicability and effectiveness of the decision support system in other areas to assess its broader implications for the global construction industry.
Additionally, while the sensitivity analysis provides insights into the robustness of the results, further research could explore the uncertainties associated with data input and criteria weights. Uncertain analysis techniques would enhance the decision support system’s reliability and help decision-makers account for potential risks and uncertainties in their evaluations.
7. Conclusions
The MADAMOS decision support system offers a comprehensive and innovative approach to optimizing sustainable implementation processes for prefabricated wood-framed buildings. Integrating multi-criteria analysis, mathematical normalization, and optimization techniques allows construction stakeholders to make informed decisions prioritizing cost efficiency, time savings, and quality assurance while promoting sustainable development and environmental responsibility. By addressing the identified research gap and building upon the existing literature, this research contributes to advancing the construction industry’s practices and supports the transition toward a more sustainable future.
The MADAMOS decision support system is innovative in enhancing sustainable implementation processes for prefabricated wood-framed buildings. By integrating multi-criteria analysis, mathematical normalization, and optimization techniques, stakeholders can make informed decisions prioritizing cost efficiency, time savings, and quality assurance while fostering sustainable development and environmental responsibility. This research addresses a significant gap in the literature, contributing to the evolution of construction industry practices toward sustainability.
This article presents a modern construction: Prefabricated wood-framed buildings with sheathing, partially constructed in factories and assembled on-site, offer a contemporary and efficient construction method. This approach provides benefits such as cost effectiveness, ease of transportation, reduced on-site construction time, and enhanced quality control.
Decision-making process: The decision-making process for optimal realization alternatives involves evaluating criteria such as building price, execution time, warranty period, and failure points. The weights assigned to these criteria, determined through expert assessments, reflect the priorities of the investor and the contractor.
The research introduces effective integrated analysis methods: multi-criteria analysis and mathematical programming effectively compare and evaluate different realization alternatives. Normalizing and weighing criteria measures allows for a comprehensive assessment, revealing the strengths and weaknesses of each alternative and facilitating informed decision-making.
The analysis of a case study involving wood-framed prefabricated buildings in the Nordic region favors Alternative 2, which utilizes modular technology and transportation by trucks and ferries. This alternative outperforms others in cost, execution time, warranty period, and failure points.
The proposed decision support system offers a robust framework for optimizing the realization of prefabricated wood-framed houses. Stakeholders can make informed decisions by considering multiple criteria and applying mathematical methods to enhance efficiency and sustainability in implementation processes. This study underscores the significance of strategic planning and thorough evaluation in the construction industry. Integrating prefabrication technologies, transportation logistics, and criteria-based decision-making enables stakeholders to achieve optimal cost efficiency, time savings, quality assurance, and project success. There are many methods for all real-life cases. The primary defect of a process with precisely expressed criteria is that strategic decisions are associated with the future. Therefore, it is best to apply methods with criteria defined by non-crisp (fuzzy) numbers. Also, it is best to use weights that are fuzzy and determined by the requirements. This way, models reflected in a more natural environment would be obtained. Meanwhile, systemic problem-solving helps investigate problems that are considered and find rational solutions.
Applying a decision support system based on multi-criteria analysis and mathematical optimization methods offers valuable insights for realizing prefabricated wood-framed houses. This study’s findings contribute to advancing sustainable construction practices, empowering stakeholders to make informed decisions, and optimizing the efficiency and effectiveness of building implementation processes.
The novelty of the wooden-based houses described in the article lies in their ecological nature and relatively light weight, allowing for easy transport.
The scientific novelty of the article lies in proposing, based on multi-criteria analysis and mathematical optimization methods, the application of the “MADAMOS system” for planning transport routes of prefabricated building elements from factories to construction sites. This enables conscious and scientifically supported decision-making processes. The research fills a significant gap in evaluating the construction industry toward sustainable development.
The novelty of the examples is demonstrating the application of the presented scientific methods to specific practical transportation issues, in this case, in the Nordic region. The analysis identified the most optimal transport option using trucks and ferries.


