Article

Effect of Microwave Pretreatment on the Properties and Microstructure of Low-Concentration Carbon Dioxide Early Cured Cement-Based Materials

State Key Laboratory of Water Resources Engineering and Management, Wuhan University, Wuhan 430072, China
*
Authors to whom correspondence should be addressed.
Buildings 2024, 14(4), 1074; https://doi.org/10.3390/buildings14041074
Submission received: 4 March 2024 / Revised: 2 April 2024 / Accepted: 10 April 2024 / Published: 12 April 2024
(This article belongs to the Special Issue Green Building Materials and Intelligent Construction Technology)

Abstract

:
The utilization of microwave drying technology has expanded across various sectors due to its rapid processing speed, reduced operation time, lower sample temperatures, and consistent heating. In this research, microwave pretreatment was implemented prior to carbonation curing with low concentrations, and an array of tests including moisture content, compressive strength, carbonation depth, CO2 absorptivity, thermogravimetric analysis (TGA), X-ray diffraction (XRD), scanning electron microscopy (SEM), and mercury intrusion porosimetry (MIP) were utilized to investigate the effect of microwave pretreatment on the properties and microstructure of cementitious materials under early carbonation curing with low CO2 concentrations. The findings reveal that microwave pretreatment significantly decreases the moisture content within the test specimens, expediting the ingress of CO2 and improving the compressive strength of the specimens. At the same time, the effectiveness of microwave pretreatment in reducing moisture content diminishes as the pretreatment time increases. The absorption of CO2 is relatively rapid in the early stage of carbonation curing, with over 50% of the CO2 absorption occurring within the 0–6 h period of carbonation curing. The hydration products and microstructure of the uncarbonated part inside the specimens are generally consistent with the normal curing state. The formation of CaCO3 contributed to the densification of the specimen by infilling its internal voids, thereby enhancing its compressive strength. Although carbonation curing enlarges the average pore size of the samples, it also serves a filling function, making the samples more compact and reducing the porosity.

1. Introduction

CO2 is one of the primary greenhouse gases, and its continuous increase in atmospheric concentration is a significant driver of global climate change [1]. The average concentration of CO2 in the atmosphere reached 419 ppm in 2023, with this concentration rising at a rate of 2.8 ppm per year [2]. In order to keep the global temperature rise below 1.5 °C, countries worldwide have been introducing carbon reduction targets, aiming to achieve carbon neutrality by the mid-century [3].
In 2022, China’s annual cement production reached 2.13 billion tons [4], and approximately 0.9 tons of CO2 are emitted for every ton of cement produced, resulting in substantial carbon emissions. Research indicates that the utilization of CO2 emitted during industrial production for the curing of cement products through CO2 curing technology can serve as a means of carbon capture and storage, effectively reducing a significant amount of CO2 emissions [5,6,7,8,9]. CO2 initially exists in a gaseous state in the air, then slowly penetrates into the solid, where it reacts with pore water to form H2CO3, which ionizes to H+, HCO3, and CO32−. At the same time, substances such as Ca(OH)2, C3S, and C2S are in a continuous cycle of dissolution and consumption, releasing Ca2+ ions, which react with the ions released by H2CO3 to form CaCO3 [10,11,12]. The specific reaction equations are represented as Formulas (1)–(4).
3 C a O · S i O 2 + 3 C O 2 + n H 2 O S i O 2 · n H 2 O + 3 C a C O 3
2 C a O · S i O 2 + 2 C O 2 + n H 2 O S i O 2 · n H 2 O + 2 C a C O 3
C a ( O H ) 2 + C O 2 C a C O 3 + H 2 O
C S H + C O 2 C a C O 3 + Si O 2 + H 2 O
Through CO2 curing, the early strength of concrete formed with cementitious materials can be significantly enhanced, leading to a substantial reduction in the required curing time [13,14] while maintaining good volume stability [15,16]. CO2 curing has the ability to reduce the porosity of the formed concrete [17,18], thereby improving its mechanical properties and durability [19,20,21].
Currently, most research on early carbonation curing of concrete is conducted under high-concentration conditions (80–100%). This is because the concentration and pressure of CO2 significantly affect its diffusion and transport efficiency in concrete, directly impacting the effectiveness of CO2 carbonation curing [17]. However, research shows that the concentration of CO2 emitted from industrial processes such as thermal power generation is around 10–15% [22], and the enrichment of CO2 is both energy-intensive and challenging [23]. Therefore, investigating low-concentration CO2 curing is highly practical and meaningful.
In the process of CO2 curing, the moisture content of the specimen has a great influence on the carbonation reaction rate. The penetration rate of CO2 gas in saturated pores is approximately 1/10,000 of that in unsaturated pores, making the penetration rate nearly negligible [24,25]. Consequently, many researchers adopt a low water-to-cement ratio during formation to enhance the reaction rate of CO2 curing, yet the final degree of CO2 curing remains relatively low [20]. Researchers, such as Shi Caijun et al., conducted interventions in the curing process with both dry pre-curing and wet pre-curing, highlighting that the moisture content of specimens after pre-curing is a critical factor in the CO2 curing process [26]. Therefore, in cases where the water-to-cement ratio is not sufficiently low, it becomes necessary to subject specimens to dry pretreatment.
Among various drying methods, microwave drying technology has gained widespread application in various industries due to its advantages, such as its fast speed, short time, low sample temperature, and overall heating [27,28]. Traditional pretreatment methods, such as exposure to high-temperature environments and low-humidity airflow, are known for their drawbacks. These methods typically require extended durations and suffer from uneven heating, which can lead to damage to the specimens. In contrast, microwave pretreatment presents a promising alternative. By inducing vibration and friction of dipole molecules within the sample, microwaves efficiently convert microwave energy into volumetric heating within the specimen [29,30,31,32]. Compared to traditional drying methods, microwave drying can transfer energy to materials more quickly and uniformly, and it allows for convenient monitoring and control of the temperature, ensuring effective drying outcomes [33]. Yuli Wang et al. pointed out that microwave curing can significantly improve the early strength of concrete, which is a more environmentally friendly heat source compared with traditional thermal curing [27]. Tan Li et al. found that a reasonable microwave heating method is conducive to the activation of fly ash and can improve the strength of the fly ash-based cementitious material, but a too-high microwave heating power or too-long microwave heating time will expand the internal structure of cementitious materials and reduce the strength. Thus, employing microwave drying as a pretreatment is a preferable choice [33,34].
This paper primarily investigates the influence of microwave pretreatment on the properties and microstructure of low-concentration carbon dioxide early cured cementitious materials. The study involves testing the moisture content, compressive strength, carbonation depth, pore structure, phase composition, and micro-morphology of cement mortar under different conditions of temperature, humidity, microwave pretreatment time, and CO2 curing time. The research aims to establish the patterns of variation in these properties, providing a theoretical basis for addressing low-concentration CO2 in industrial flue gas.

2. Materials and Methods

2.1. Raw Materials

The cement utilized in this study was Huaxin P·O 42.5 ordinary Portland cement, and its primary chemical composition is presented in Table 1. The sand used in the formation of cement mortar adhered to ISO standard sand, while the mixing water was sourced from the tap water supplied in Wuhan city.

2.2. Preparation and Curing of Specimens

The water-to-cement ratio in this experiment was 0.5, and the cement-to-sand ratio was 1:3. The mortar specimens were molded into dimensions of 40 mm × 40 mm × 40 mm. After molding, the entire mold was covered with plastic wrap and placed in a standard curing room with a temperature of 20 °C and a humidity of 100% to ensure consistent temperature conditions. After curing for 1 day, the specimens were demolded and then subjected to different durations (1, 2, 3, 4 h) of microwave treatment at 70 °C (with a pause upon reaching 75 °C, followed by resuming heating after temperature decrease to 65 °C). In the microwave pretreatment process, 24 samples were processed each time with a microwave frequency of 2450 MHz and an output power of 900 W. Following the microwave pretreatment, the specimens were further subjected to carbonation curing in a carbonation curing chamber with a temperature of 30 °C, a humidity of 100%, and a CO2 concentration of 12% (volume fraction). The carbonation curing times were set at 6, 12, 24, and 36 h. After the completion of carbonation curing, testing and sampling were conducted immediately. The experimental flow chart is shown in Figure 1.
To clarify the effects of each condition, two control experiments were conducted. The first one underwent carbonation curing directly without microwave pretreatment, while the second one underwent pretreatment but did not undergo carbonation curing. Instead, it was placed under standard curing conditions for the same duration as the carbonation curing process.

2.3. Methods

2.3.1. Moisture Content Test

Due to the significant impact of specimen moisture content on carbonation rate [20], it is crucial to determine the moisture content of the specimens at the onset of carbonation to maintain consistent conditions and ensure meaningful carbonation data. Immediately after demolding, each specimen was weighed using an electronic precision scale and assigned a unique identifier. Subsequently, specimens were subjected to different durations (1, 2, 3, 4 h) of microwave treatment at 70 °C. At the end of each stage, a subset of specimens was removed and weighed. After completion of all stages, the specimens were placed in a 60 °C drying oven for 72 h, and the final mass was measured [35,36]. The moisture content of the specimens after complete drying for 72 h in a 60 °C drying oven was considered as 0, and the moisture content of specimens after various microwave pretreatments was calculated using Formula (5).
ω = M M 0 M 0
where ω represents the moisture content of the specimen, M is the mass of the specimen after microwave pretreatment, and M0 is the mass of the completely dried specimen.

2.3.2. Compressive Strength Test

Compressive strength tests were conducted at each stage using a combined flexural and compressive strength testing machine, strictly adhering to the standards outlined in GB/T 17671-2021 [37], “Test methods for strength of cement mortar (ISO method)”. In each group of experiments, three specimens were tested and averaged, and the compression speed was 2.4 kN/s.

2.3.3. Carbonation Depth Test

Upon completion of the carbonation curing period, the specimens were split in half, and a 1% mass fraction solution of phenolphthalein in alcohol [6] was sprayed onto the specimens. After the alcohol evaporated, photographs of the specimens were taken, and image processing software was subsequently used to analyze and process the colorless regions, obtaining data on carbonation depth.
Specifically, the images were imported into Photoshop, and by delineating the area, the pixel count was queried to obtain the ratio of the dark-colored area to the overall cross-sectional area. Assuming the uncarbonated area to be approximately square, the carbonation depth of the specimens was determined using Formula (6).
L = 20 20 S S 1 2
where L represents the carbonation depth of the specimen, S is the total number of pixels in the specimen’s cross-section, and S’ is the number of pixels in the dark-colored area of the specimen’s cross-section.

2.3.4. CO2 Absorptivity Test

Due to the losses from free water and bound water occurring below 500 °C and the decomposition temperature of calcium carbonate falling within the range of 500 °C to 1000 °C, the CO2 absorptivity can be calculated from the weight loss, as compared to the control group [17].
For each condition, two complete specimens were crushed and placed into ceramic crucibles. Using a resistance furnace, the samples were heated from room temperature to 500 °C, weighed after returning to room temperature, then further heated to 1000 °C, with the sample mass recorded at each stage. Let M be the sample mass at room temperature, M500°C be the mass at 500 °C, and M1000°C be the mass at 1000 °C. Taking the sample without carbonation curing as the control group, the weight loss rate from 500 °C to 1000 °C (α0) was calculated using Formula (7). As the uncarbonated specimens also experience mass loss during the 500–1000 °C process, it is necessary to subtract the mass loss rate of the uncarbonated specimens (α0) from the mass loss rate of the carbonated specimens to obtain the CO2 absorptivity (α). The CO2 absorptivity for specimens subjected to carbonation curing was calculated using Formula (8).
α 0 = M 0 , 500 ° C M 0 , 1000 ° C M 0 × 100 %
α = M 500 ° C M 1000 ° C M × 100 % α 0

2.3.5. Thermogravimetric Analysis Test (TGA)

To further analyze the hydration products and carbonation status in the uncarbonated specimens, the uncarbonated areas within the carbonated specimens, and the fully carbonated surfaces of the carbonated specimens, samples were extracted from each condition and placed in ethanol to terminate hydration. Subsequently, the samples were retrieved, ground into powder, and then dried for TGA testing. The TGA tests were conducted in a nitrogen atmosphere, with the temperature increasing from 30 °C to 1000 °C at a rate of 10 K/min. The changes in sample mass during the test were recorded.

2.3.6. X-ray Diffraction Test (XRD)

XRD was employed to characterize the phase composition of the specimens before and after carbonation. The testing equipment used was the X Pert Pro series produced by PANalytical, Germany. The testing angle ranged from 10 to 80 degrees, with a testing speed of 5°/min. The specimens were labeled as MX-CY, where X represents the hours of microwave pretreatment, and Y represents the hours of carbonation curing. If not specified, the default assumption is that the sample comes from the surface of the specimen.

2.3.7. Scanning Electron Microscope Test (SEM)

Samples were prepared in the form of slices from the surface, interior, and boundary between the carbonated and uncarbonated regions of the specimens for microscopic morphology testing. The microscopic morphology of the samples was observed and analyzed using SEM. The testing equipment used was the VEGA Compact series from TESCAN, Czech Republic. Gold sputtering was applied to the relatively flat fracture surfaces of the samples to improve conductivity and prevent image degradation caused by poor conductivity during the imaging process.

2.3.8. Mercury Intrusion Porosimetry Test (MIP)

The MicroActive AutoPore V 9600 instrument was utilized to conduct mercury intrusion porosimetry (MIP) tests on both fully carbonated and uncarbonated samples. These tests aimed to investigate the impact of carbonation on the pore structure.

3. Results and Discussion

3.1. The Influence of Moisture Content

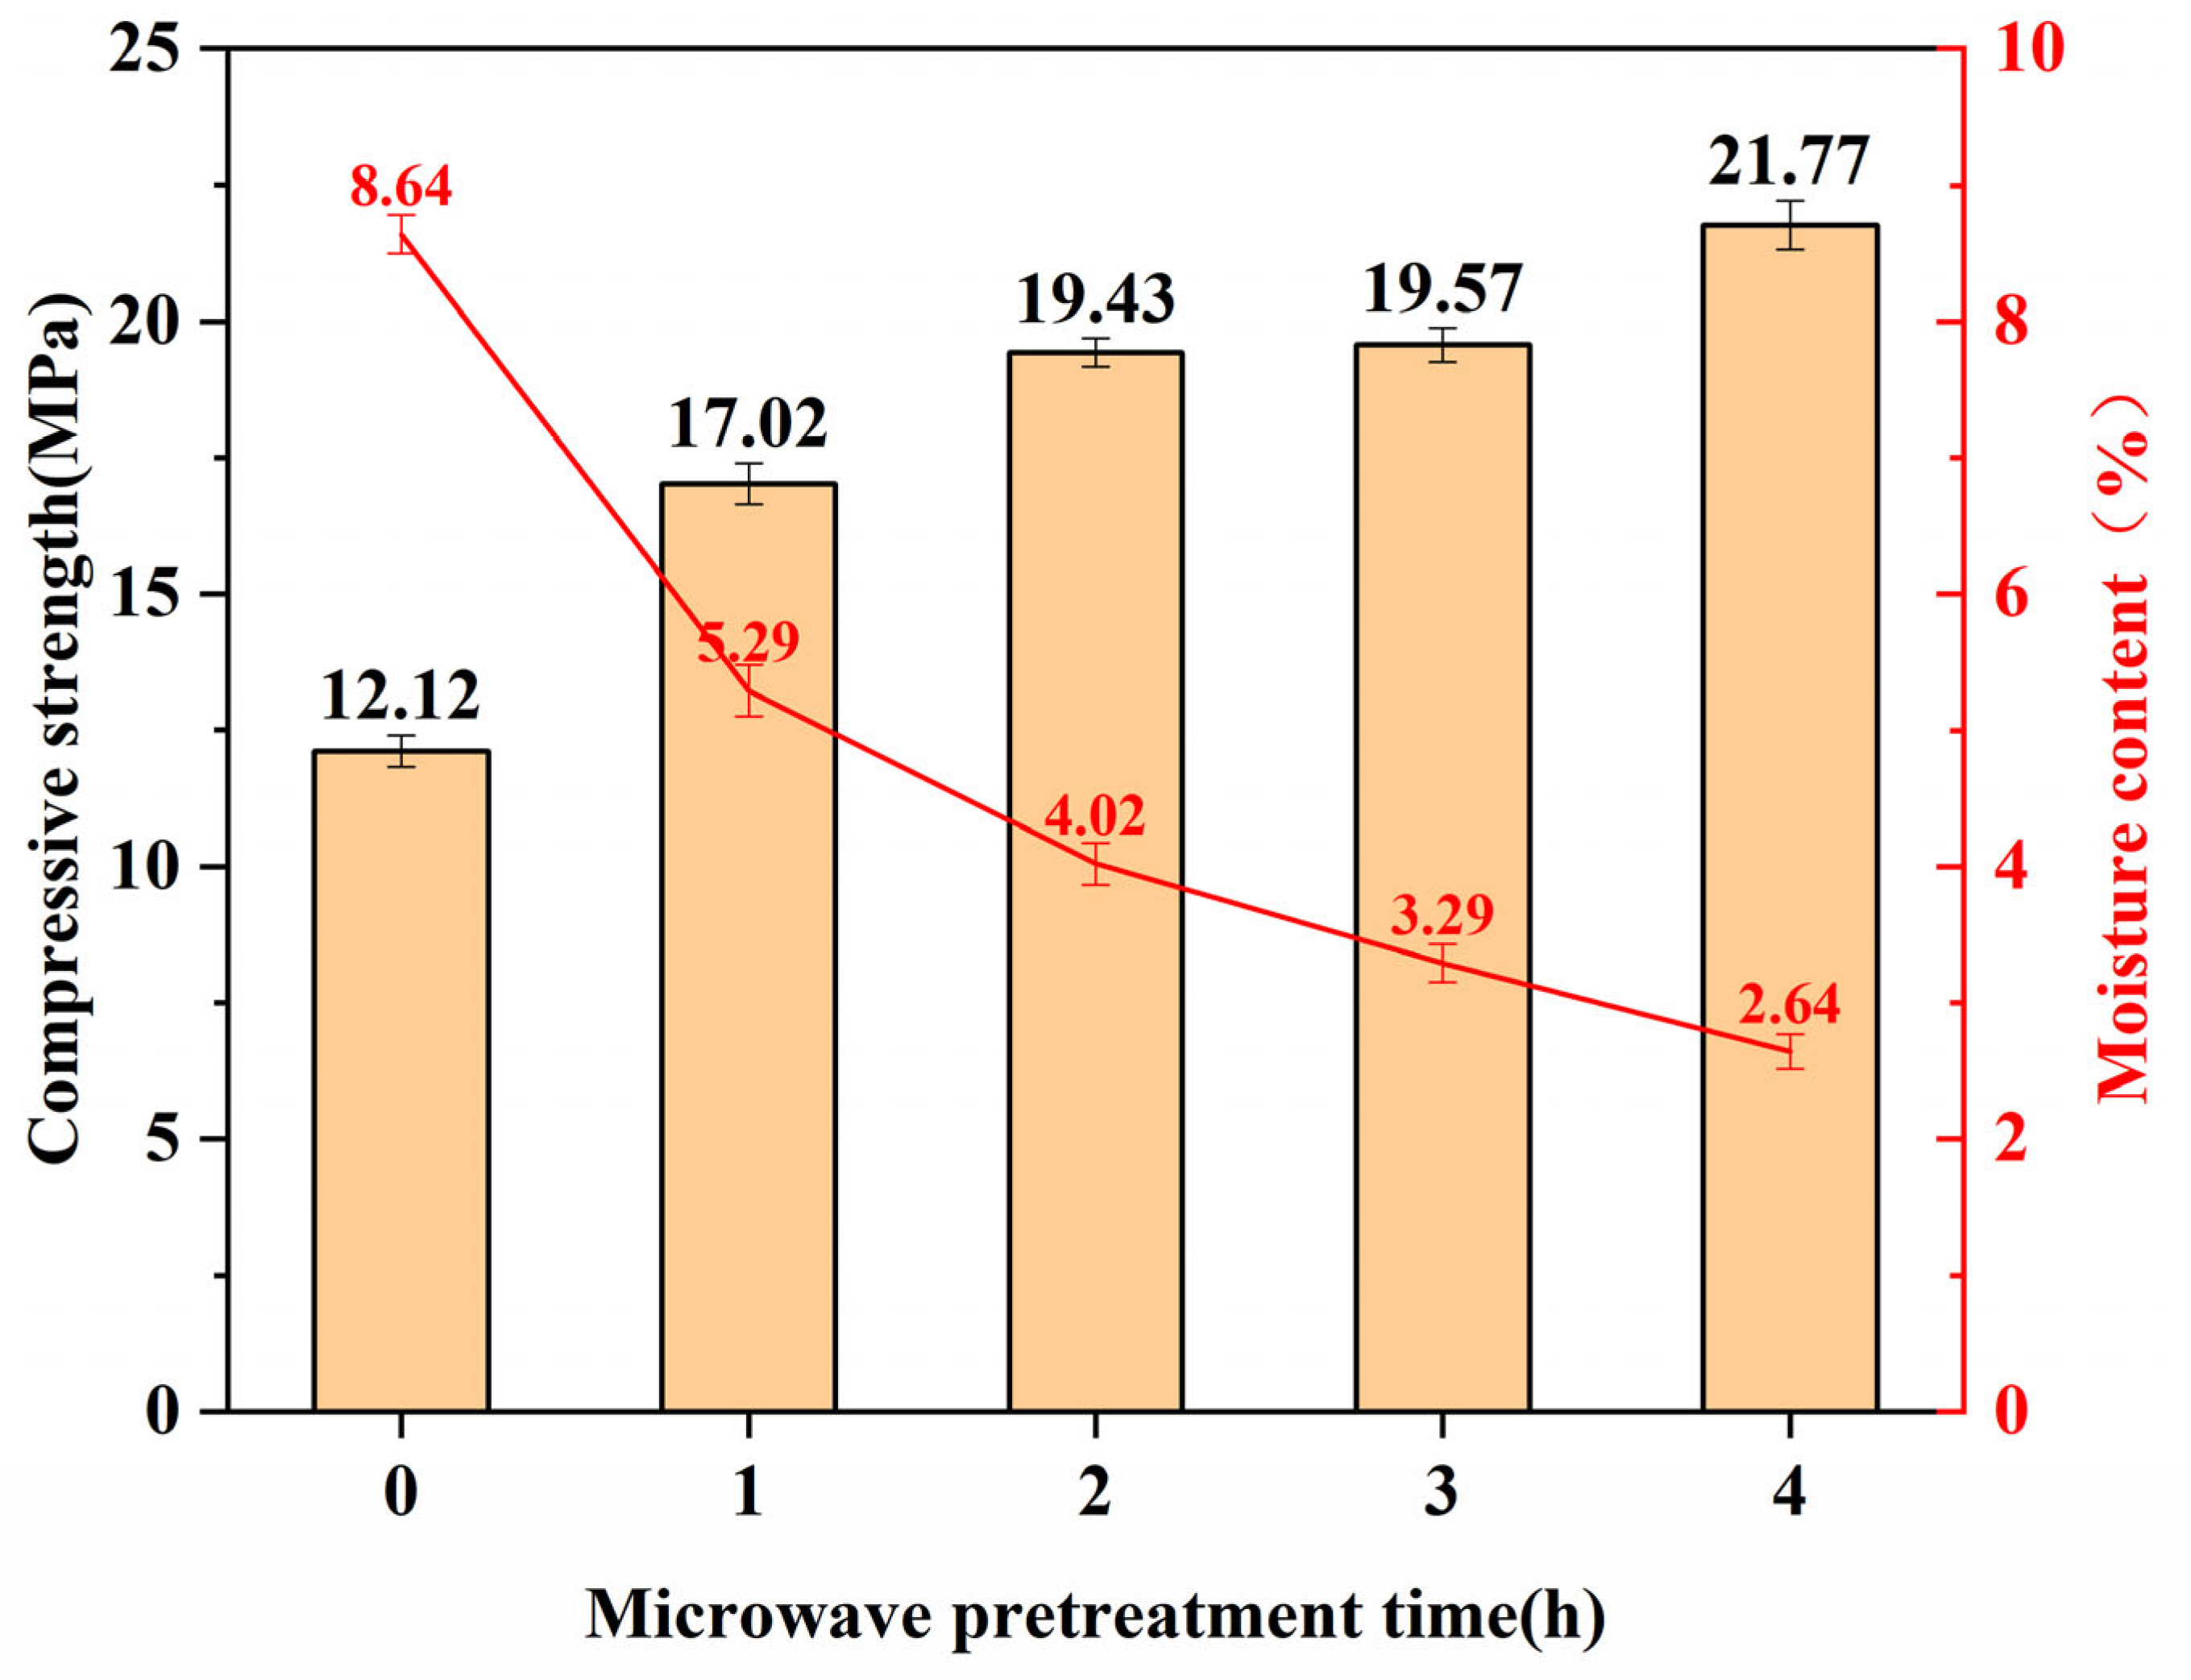
The compressive strength and moisture content of specimens after microwave pretreatment are illustrated in Figure 2.
Due to the cement mortar’s mix ratio of water/cement/sand being 1:2:6, the theoretical moisture content of the specimens right after molding should be 11.11%. From the data in Figure 2, it is observed that after 1 day of standard curing following demolding, the moisture content of the specimens is 8.64%, representing a reduction of 2.47% compared to the initial specimen. This decrease is attributed to the early hydration of cement, which consumes some water and forms hydration products like ettringite. The decomposition temperature of ettringite is approximately 70 °C [35], and during the drying process at 60 °C, no internal water release occurs. Therefore, at this point, the moisture content is significantly lower than that at the initial molding. After microwave pretreatment of the demolded specimens, the most substantial reduction in moisture content is observed within the first hour, with a decrease of 3.35%. The subsequent three hours show a diminishing effect on moisture content reduction, but there is still a noticeable impact. Simultaneously, as microwave pretreatment is known to accelerate hydration reactions and enhance compressive strength [38,39,40], a significant increase in compressive strength is observed with the extension of microwave pretreatment time. The properties of the specimens undergo substantial improvement [41].
These results indicate that microwave pretreatment has a favorable effect on reducing moisture content and increasing compressive strength in the early stages. However, its effectiveness gradually diminishes in the later stages. Therefore, a comprehensive consideration of both energy consumption and carbonation efficiency is essential. This aims to achieve a balance between ensuring effective carbonation and enhancing specimen property while minimizing energy consumption.

3.2. The Influence of Compressive Strength

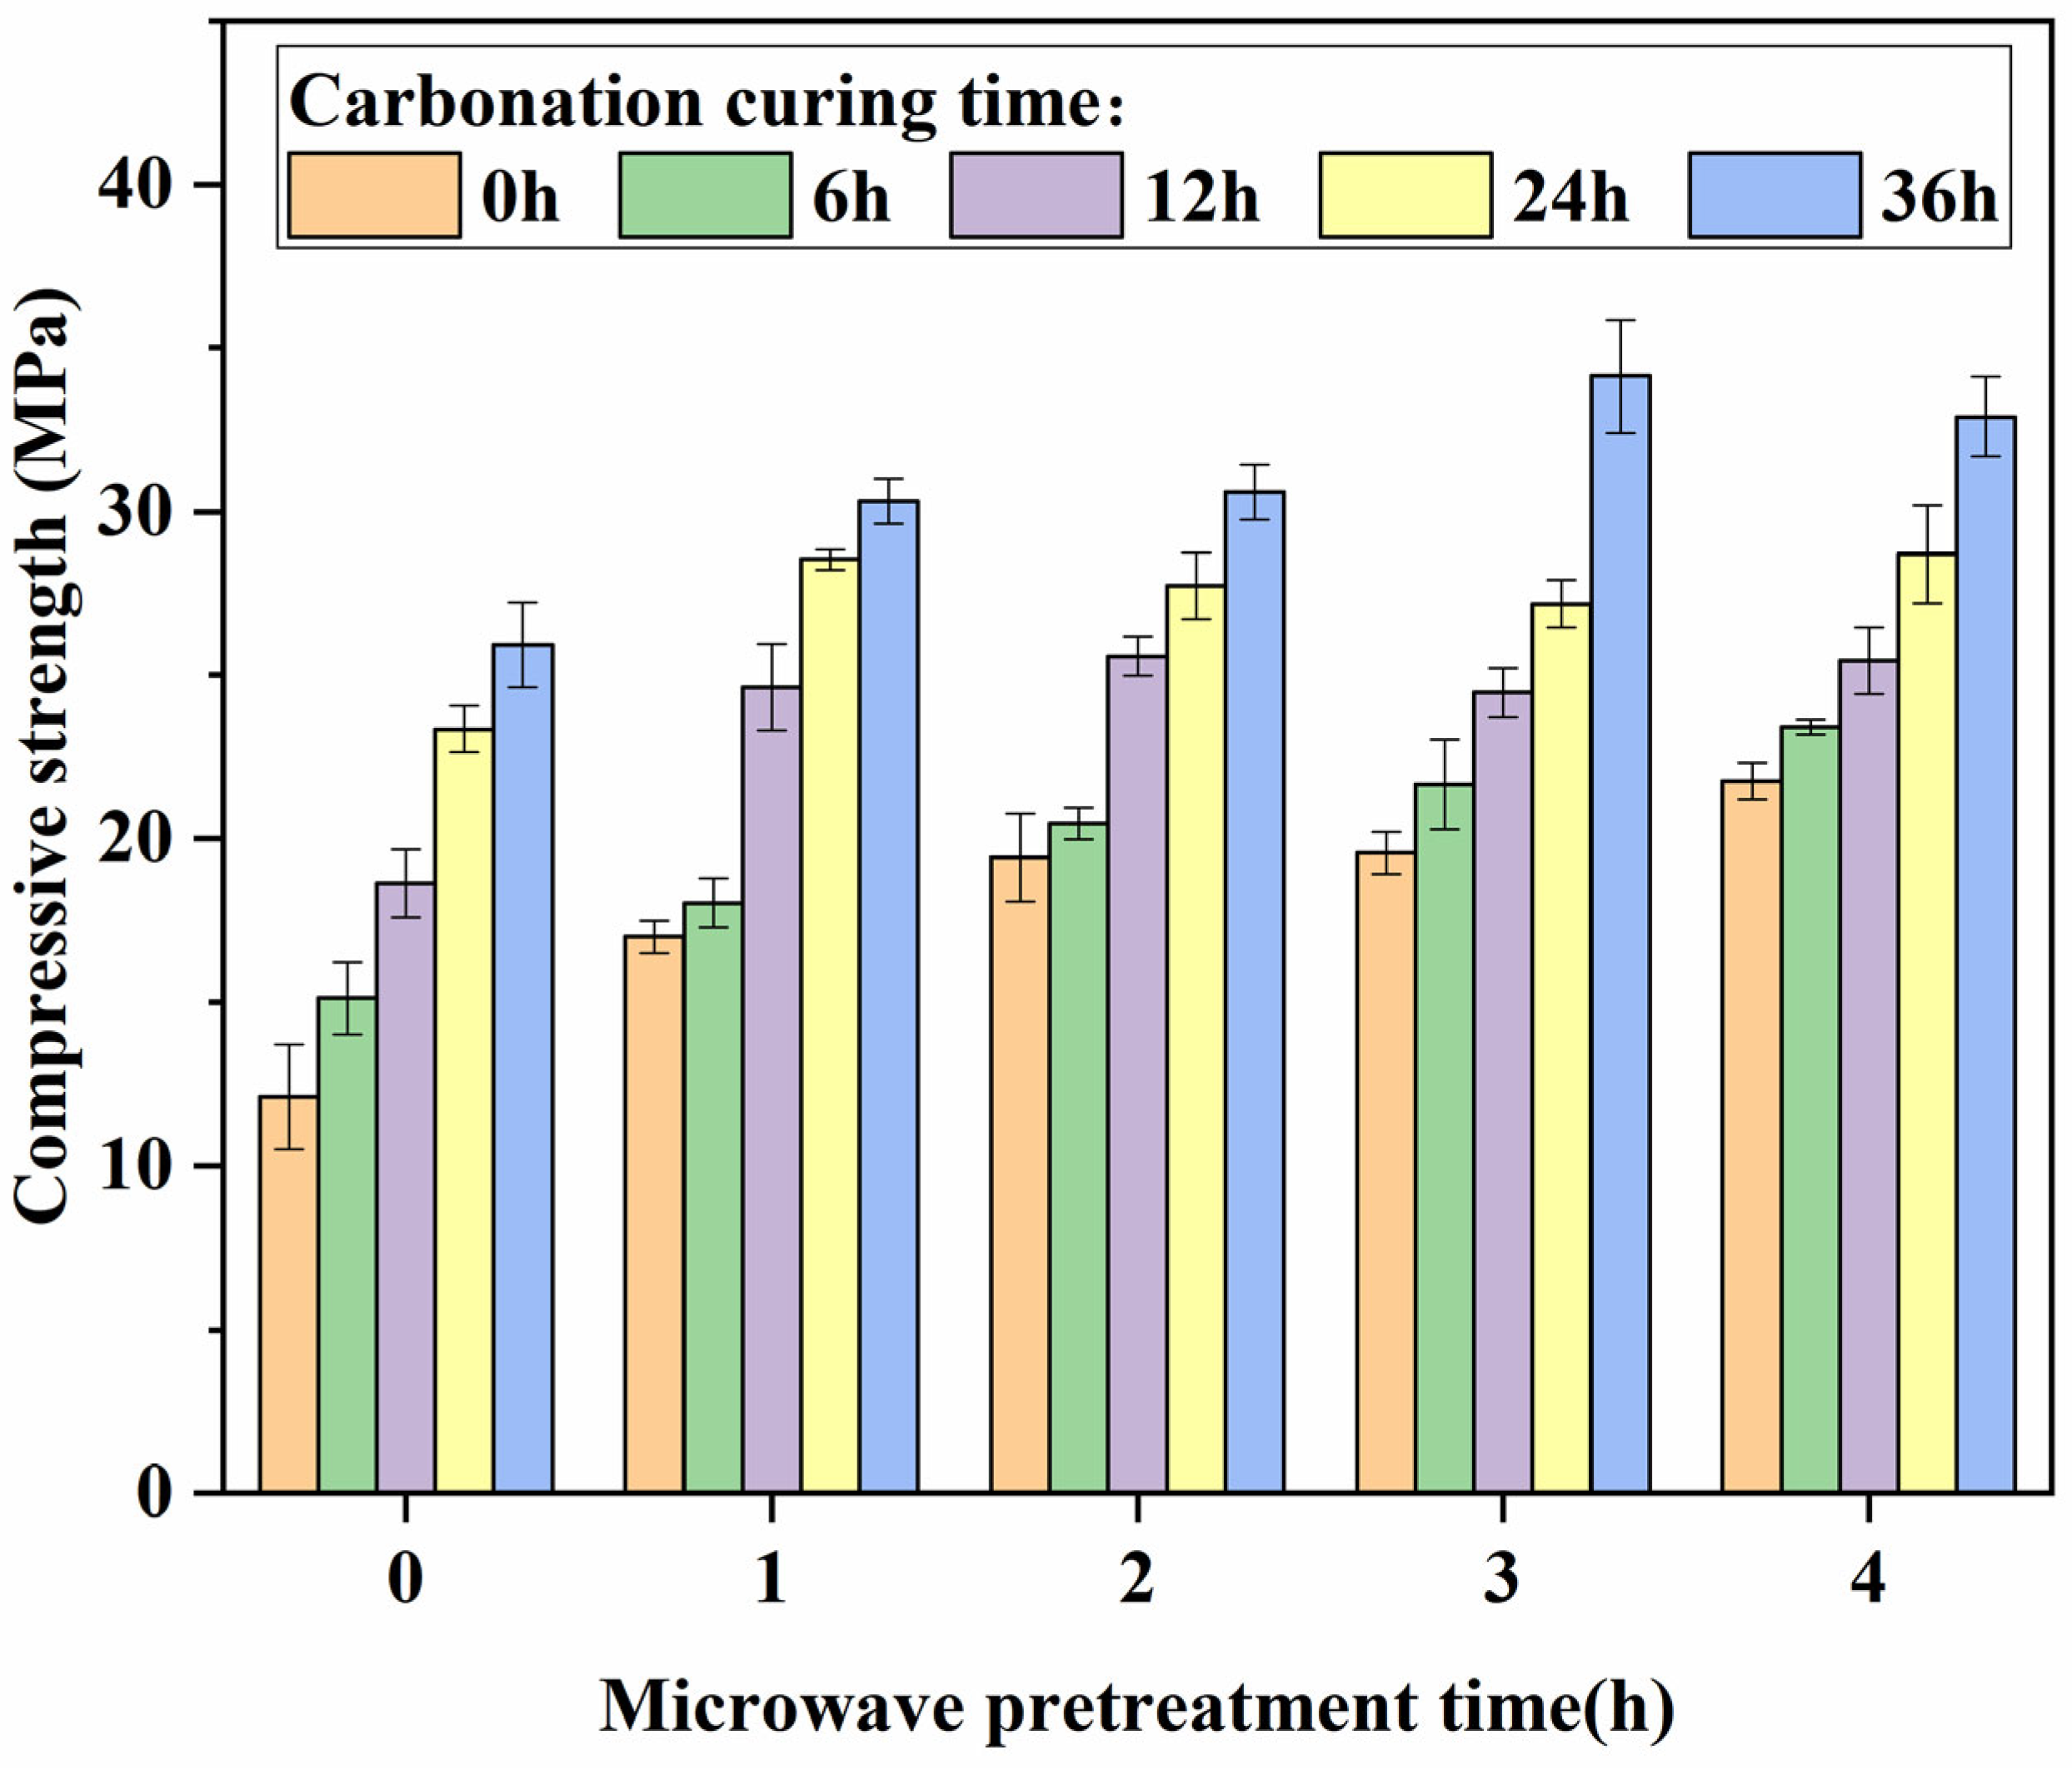
The compressive strength of the specimens is illustrated in Figure 3. Evidently, the compressive strength of specimens subjected to microwave pretreatment is significantly higher than those without pretreatment. Comparing the compressive strengths of specimens with different microwave pretreatment durations reveals that, before the commencement of carbonation curing after pretreatment, the compressive strength of the specimens increases with the duration of pretreatment. This is attributed to the effect of microwave pretreatment in accelerating cement hydration, reducing porosity, and enhancing the strength and durability of the specimens [42].
The compressive strength of specimens is influenced by two aspects: the carbonation reaction in the outer layer and the hydration reaction in the inner layer. The degree of carbonation reaction is characterized by the carbonation depth, and its reaction rate is determined by the moisture content of the specimen and the carbonation curing conditions. The CaCO3 generated by the carbonation reaction can fill the pores, making the specimen denser, thus enhancing its compressive strength.
The degree of the hydration reaction within the specimen is mainly analyzed by methods such as XRD and SEM to identify hydration products. The reaction rate is primarily determined by the degree of early-stage reaction, moisture content, and curing temperature. The hydration products formed can act as fillers, reducing the porosity and increasing the compressive strength of the specimen.
Therefore, it is not always the case that specimens with greater carbonation depth have higher compressive strength. Specimens may experience a decrease in compressive strength due to lower moisture content.
A lower moisture content corresponds to a faster carbonation rate, resulting in a more significant increase in strength due to carbonation [21]. However, the decrease in moisture content also leads to a reduction in the rate of hydration reactions, resulting in a relatively smaller increase in strength from hydration reactions [43,44].
In the 0–6 h stage, the compressive strength increase rate of specimens with a 3 h and 4 h pretreatment is significantly higher than those with a 1 h and 2 h pretreatment. This is because the surface of the specimens has not yet undergone carbonation and is fully exposed to the CO2 atmosphere. During this stage, the carbonation reaction rate is fast, and the increase in compressive strength primarily results from the carbonation of the specimens. Additionally, the specimens pretreated for 3 h and 4 h have a lower moisture content. Consequently, compared to specimens pretreated for 1 h and 2 h, they exhibit a greater carbonation depth within the same time frame, leading to a more substantial increase in compressive strength.
In the 6–12 h stage, the compressive strength increase rates of specimens with a 1 h and 2 h pretreatment are significantly higher than those with a 3 h and 4 h pretreatment. This is because, at this stage, the specimens pretreated for 3 h and 4 h have undergone carbonation to a certain depth, and the carbonation rate begins to slow down. On the other hand, the specimens pretreated for 1 h and 2 h, due to a relatively slower carbonation rate in the early stage, have not completely carbonated the surface layer. Therefore, the carbonation rate at this stage remains relatively high compared to specimens pretreated for 3 h and 4 h. Additionally, the specimens pretreated for 1 h and 2 h have a higher moisture content, resulting in a relatively higher rate of hydration reactions and, consequently, a faster increase in compressive strength.
In the 12–24 h stage, carbonation penetrated to deeper levels, with different specimens exhibiting varying rates of carbonation and hydration. However, the counteraction between these two factors results in a relatively consistent rate of compressive strength enhancement for all specimens.
In the 24–36 h stage, the carbonation reactions for specimens pretreated for 1 h and 2 h extended to even deeper layers, causing further slowdown in the carbonation rate. At this point, due to the lower moisture content of specimens pretreated for 3 h and 4 h, their carbonation rate is relatively faster. Additionally, the moisture content of specimens pretreated for 3 h maintains a hydration reaction rate that is not too low. As a result, the compressive strength growth rate for specimens pretreated for 3 h is greater than that for specimens pretreated for 4 h.
Overall, specimens with the same microwave pretreatment time exhibit minor variations in hydration reaction rates, with changes in strength growth rates primarily determined by carbonation reactions, which are initially rapid and decrease significantly as the reaction deepens. However, for specimens with different microwave pretreatment times, the accelerating effect of microwave pretreatment on hydration enhances the compressive strength at the onset of carbonation, while its reduction in moisture content both promotes carbonation reactions and diminishes hydration reaction rates. Thus, there is no single reaction at play; rather, at any given time, one reaction may have a relatively greater impact, resulting in similar characteristics in compressive strength growth for the specimens.
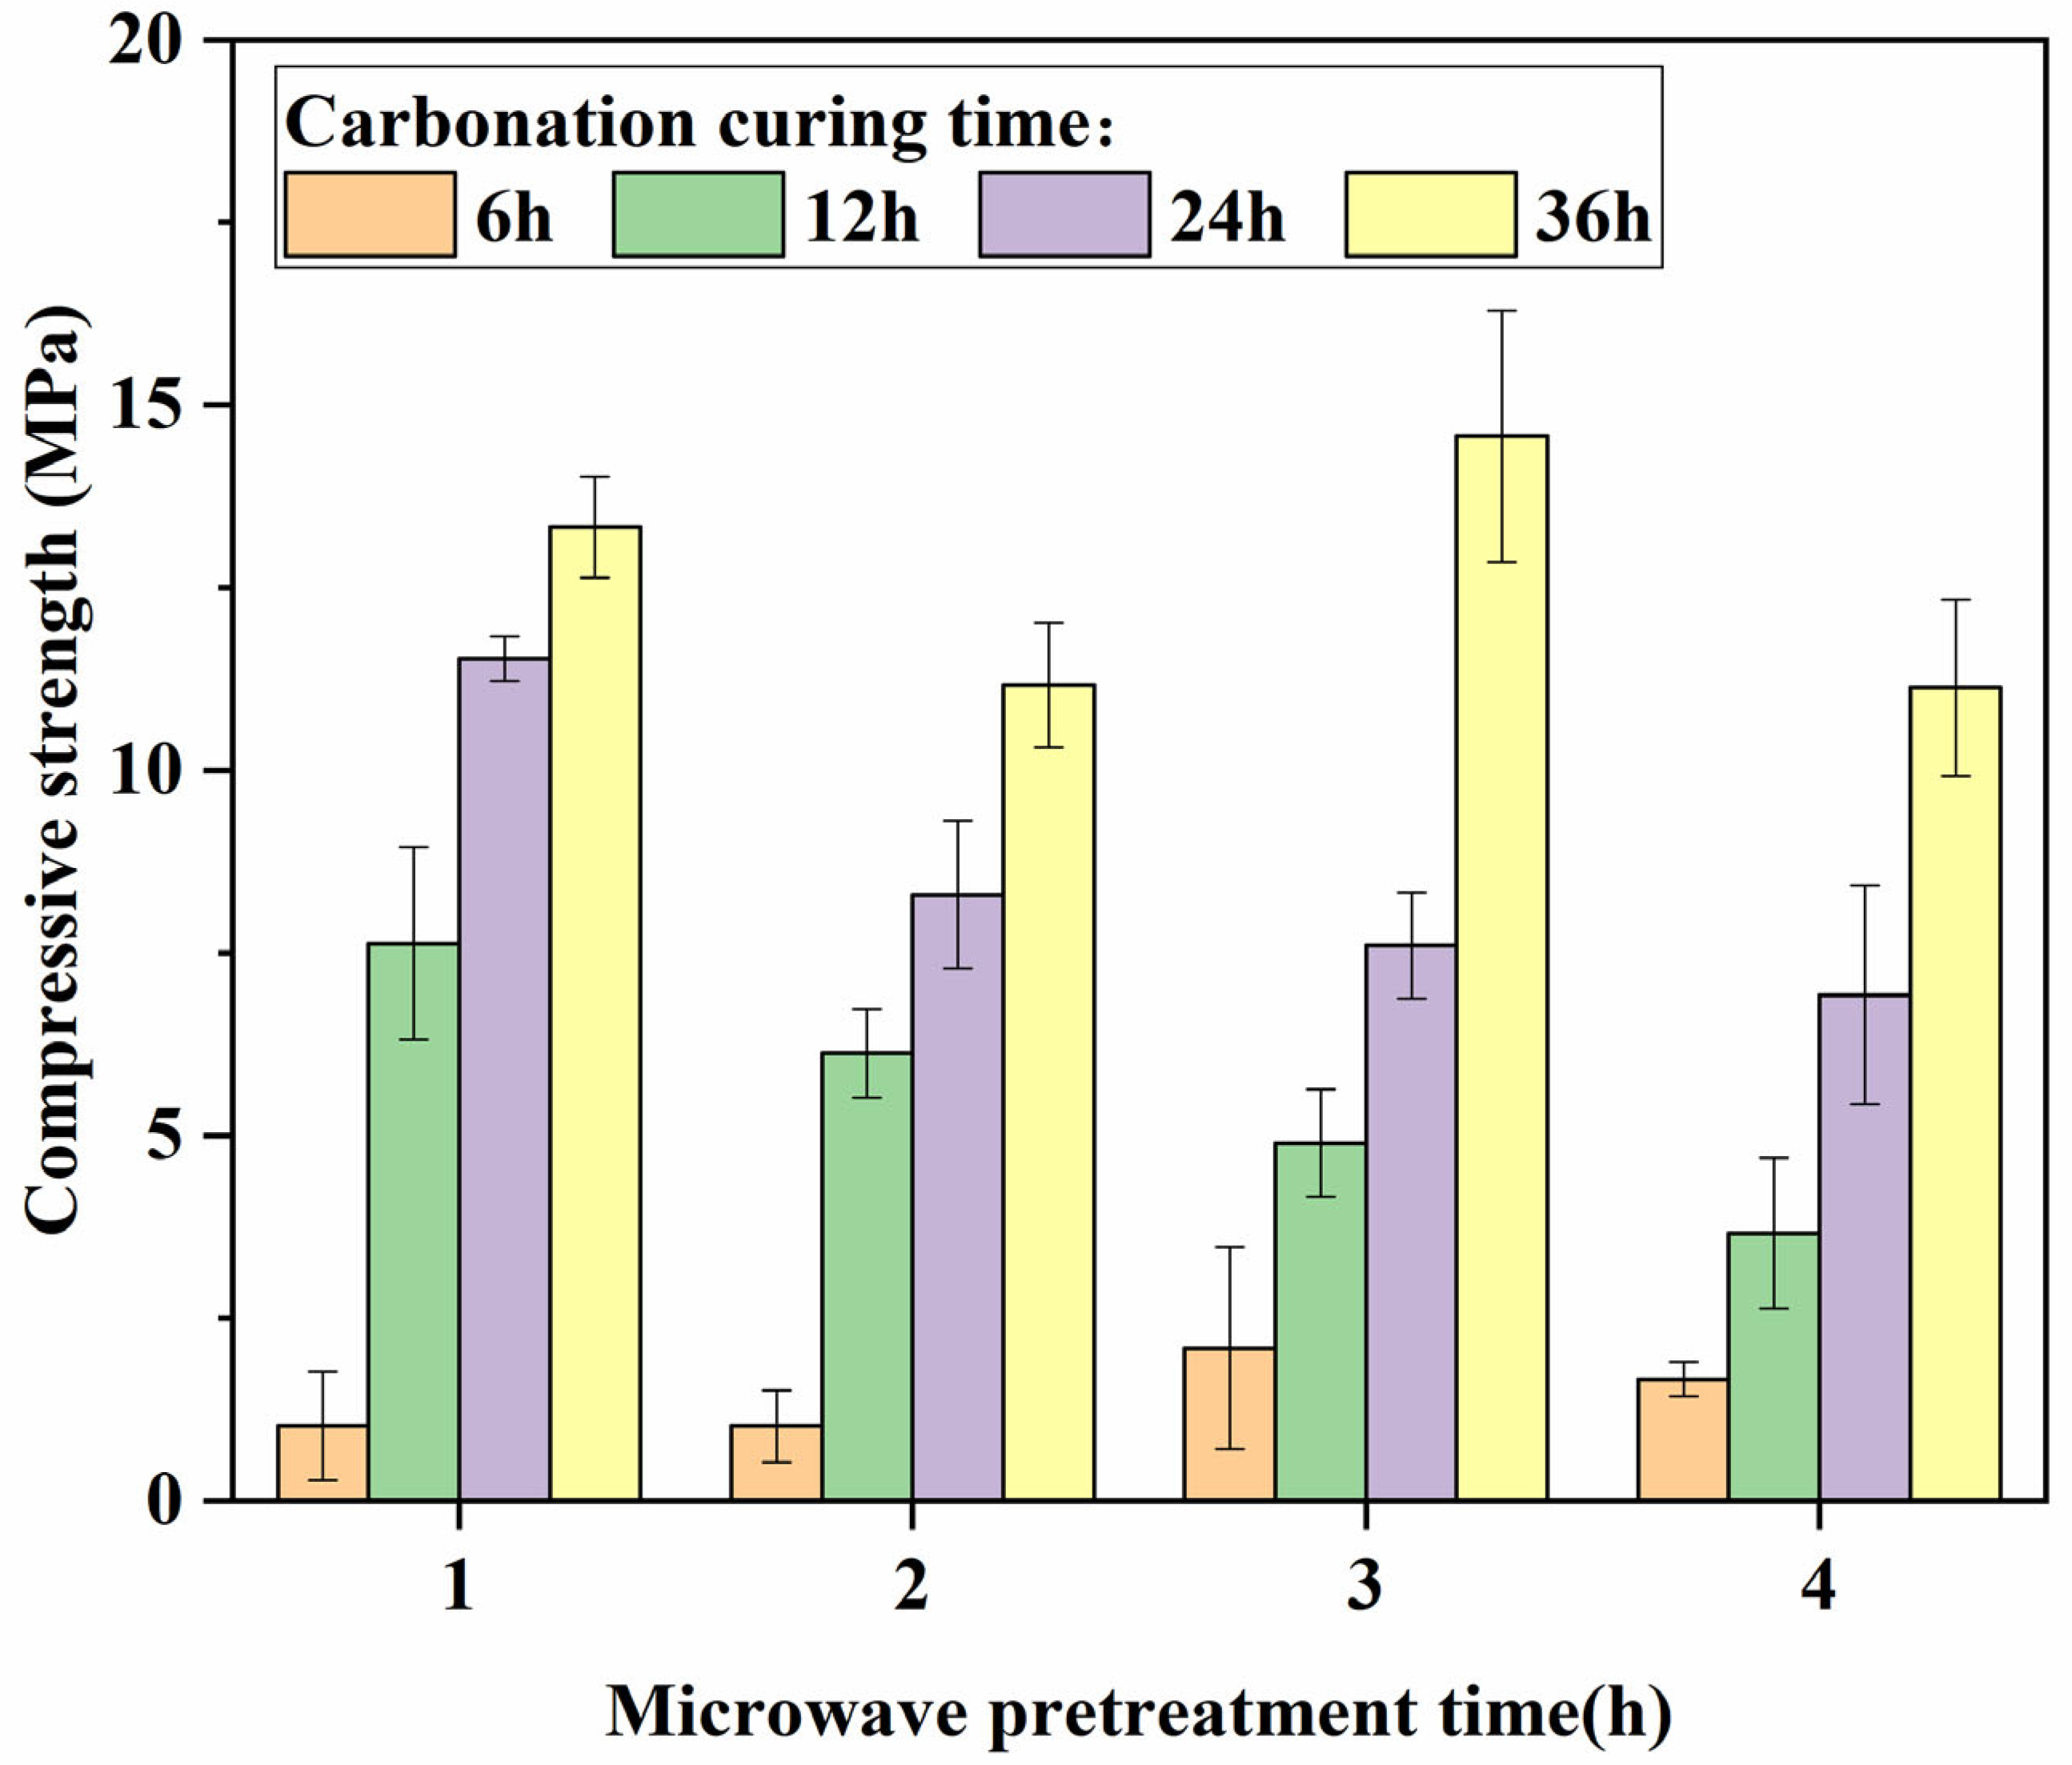
Considering that microwave pretreatment promotes hydration reactions before carbonation, leading to an increase in compressive strength [38,39,40], specimens subjected to microwave pretreatment for 1, 2, 3, and 4 h without subsequent carbonation curing were selected as the control group. The difference in compressive strength between the experimental group and the control group was analyzed to assess the impact of microwave pretreatment duration on the increase in compressive strength caused by carbonation curing. The specific details are illustrated in Figure 4, it can be observed that specimens subjected to 1 and 3 h of pretreatment exhibit a greater increase in compressive strength due to subsequent carbonation curing compared to specimens with 2 and 4 h of pretreatment. This difference may be attributed to the higher moisture content in specimens pretreated for 1 h, where the dominant contribution to strength comes from hydration reactions. In the case of specimens pretreated for 3 h, the combined effect of hydration and carbonation reactions reaches an optimal value, resulting in the maximum overall increase in strength.
Based on the above analysis, it can be concluded that the increase in strength is contributed by both the hydration reaction and the carbonation reaction. The microwave pretreatment process not only promotes the hydration reaction but also accelerates the carbonation reaction by reducing the moisture content [45]. The compressive strength of the specimens pretreated by microwave for 3 h showed the most significant improvement, while it also saved time and energy compared to the sample with 4 h pretreatment. Therefore, it is a more suitable choice.

3.3. Carbonation Depth Analysis

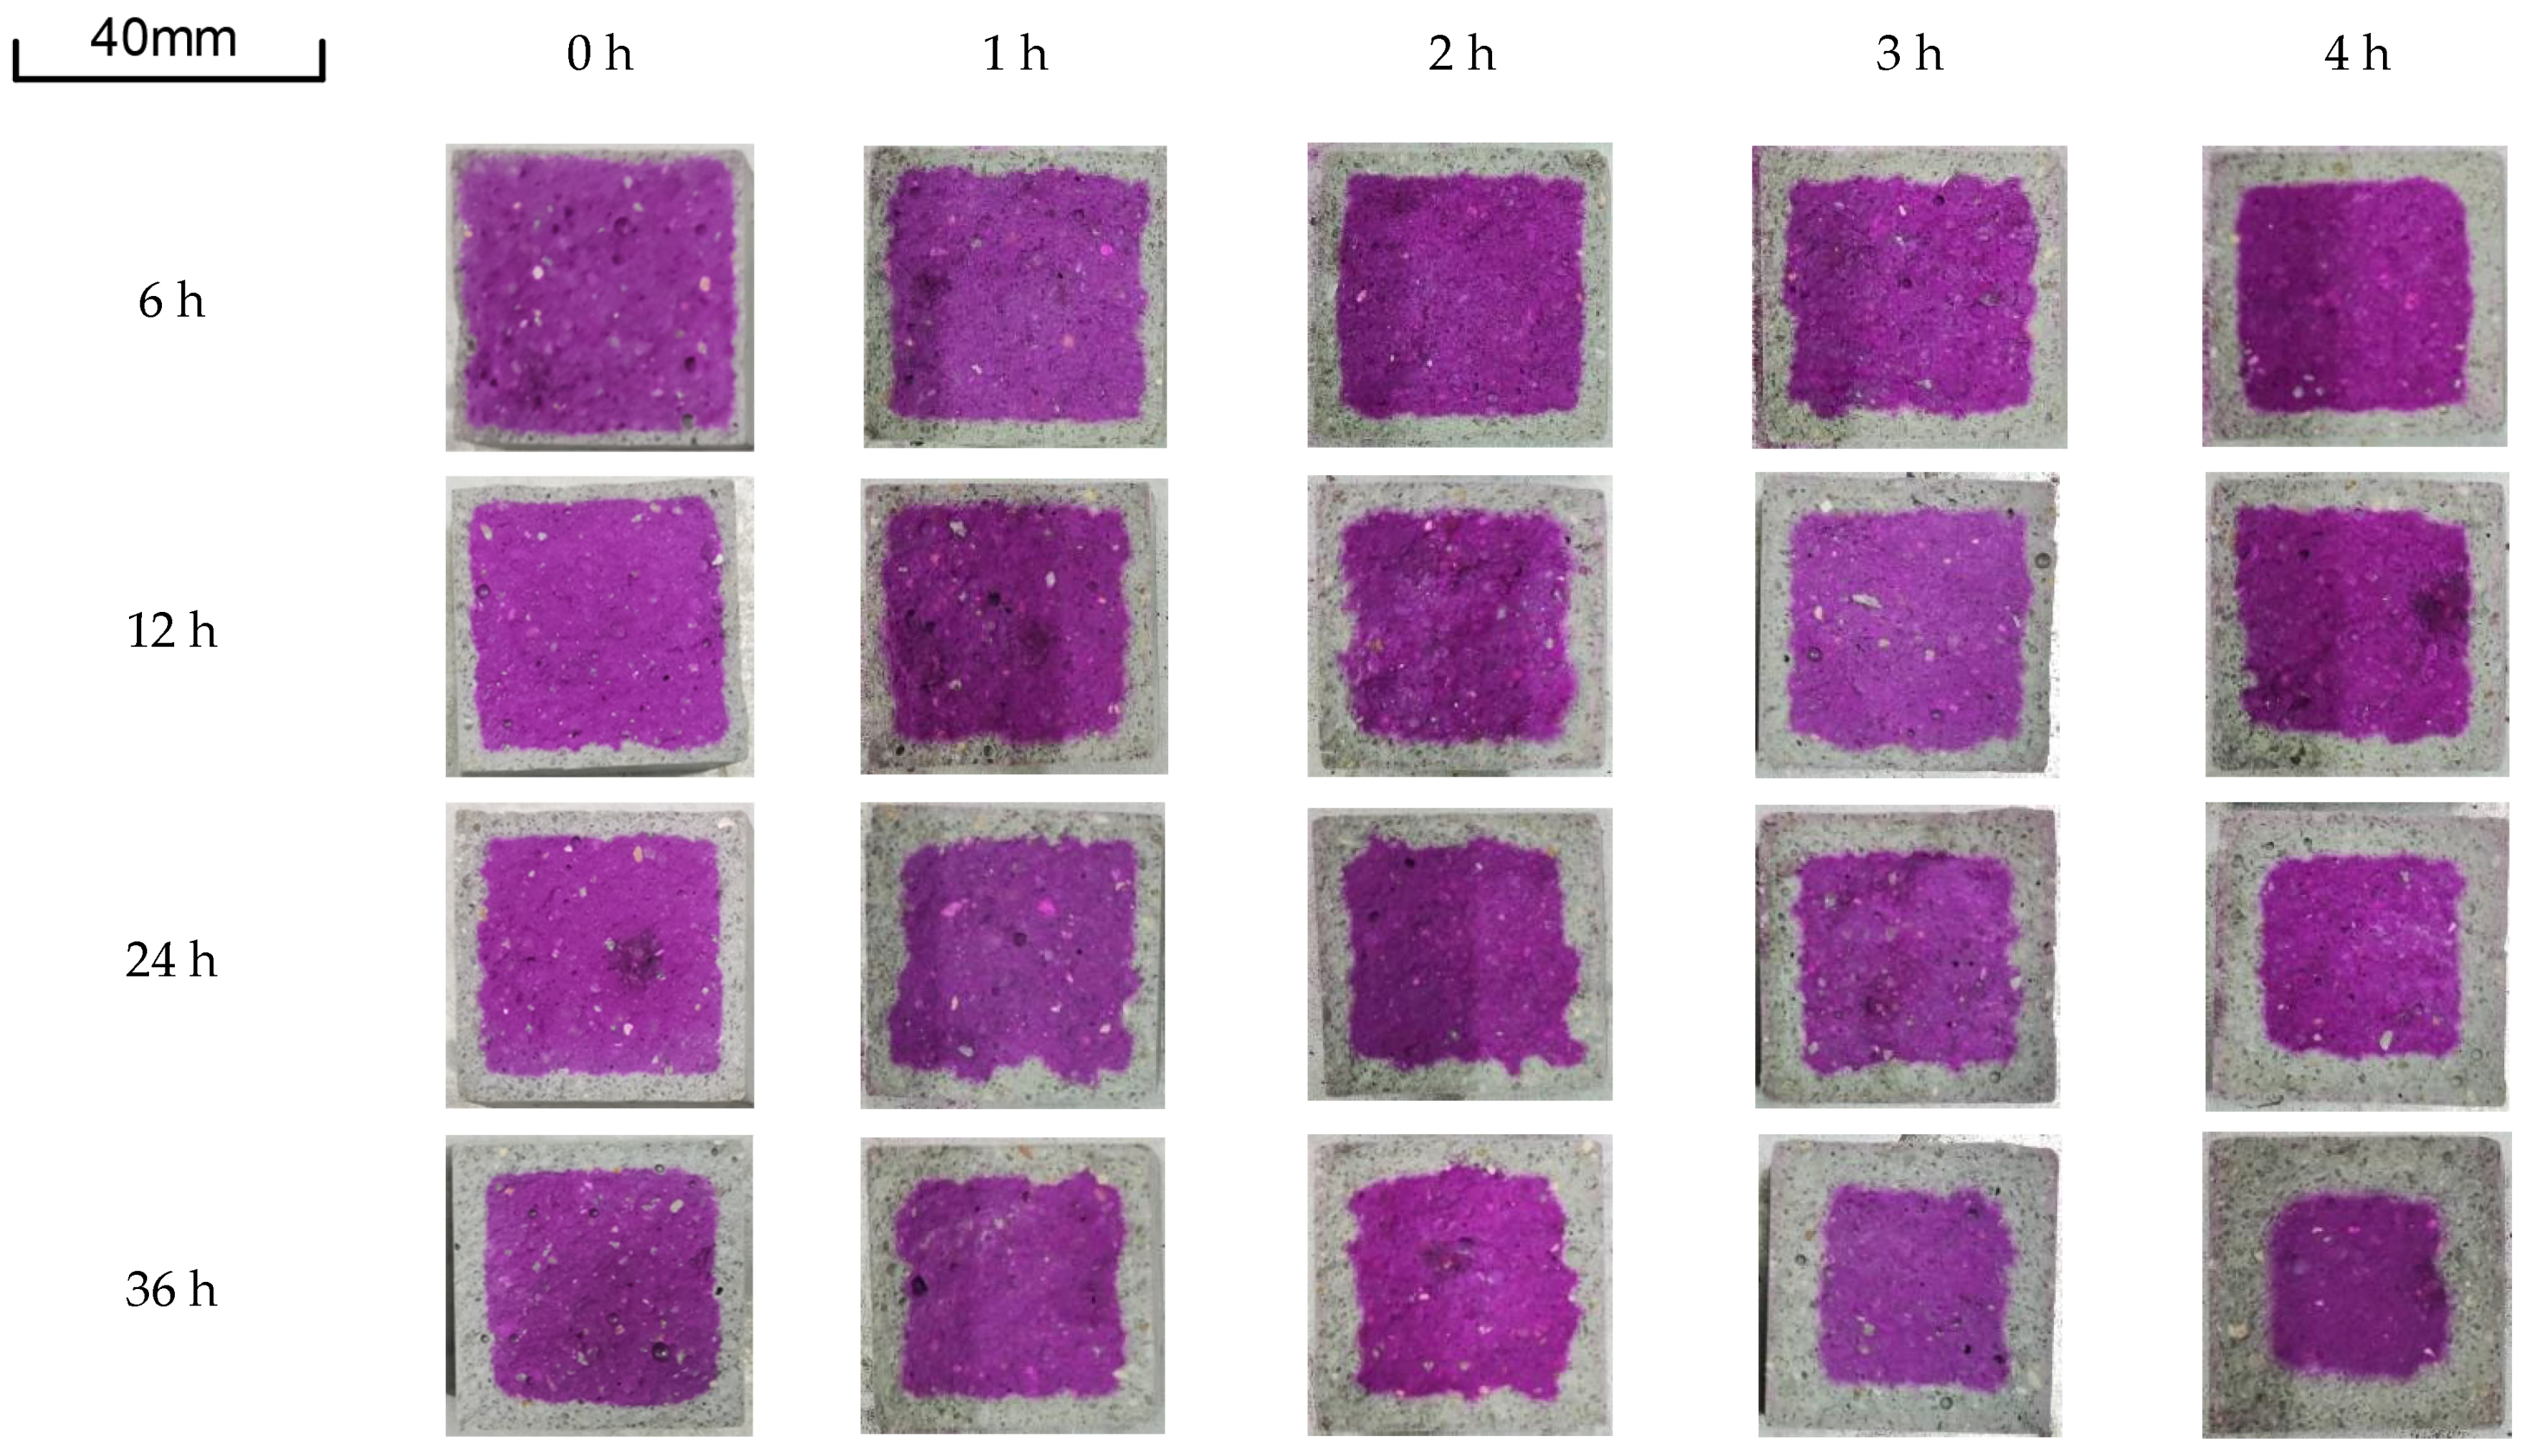
The experiment yielded the carbonation depth of specimens, as shown in Table 2, and the carbonation status after spraying phenolphthalein alcohol solution on the split surface of each group of specimens is depicted in Figure 5.
Under a constant microwave pretreatment time, the carbonation depth increases with a longer carbonation time, aligning with common knowledge [2]. With a consistent carbonation time, specimens subjected to microwave pretreatment exhibit a greater carbonation depth compared to those without microwave pretreatment. Moreover, specimens with longer microwave pretreatment times show a larger carbonation depth than those with relatively shorter pretreatment times [46]. This indicates that microwave pretreatment significantly enhances the efficiency of the carbonation reaction, and within the 0–4 h range, longer microwave pretreatment time results in higher carbonation reaction efficiency. This further confirms that microwave pretreatment, by reducing the moisture content of the specimens and facilitating CO2 penetration into the interior, effectively accelerates the carbonation rate of the specimens [21]. Meanwhile, it can be observed that the specimen subjected to 4 h of microwave pretreatment exhibits a slightly increased carbonation depth compared to the 3 h specimen, albeit to a lesser extent than in the early stage. This is because as the microwave pretreatment time increases, the rate of moisture content reduction begins to slow down.
The above results are mutually confirmed by the variation trend of compressive strength, further demonstrating that the microwave pretreatment is ineffective when the time is too short and energy-consuming when too long. Therefore, the 3 h microwave pretreatment is a relatively optimal choice.

3.4. CO2 Absorptivity Analysis

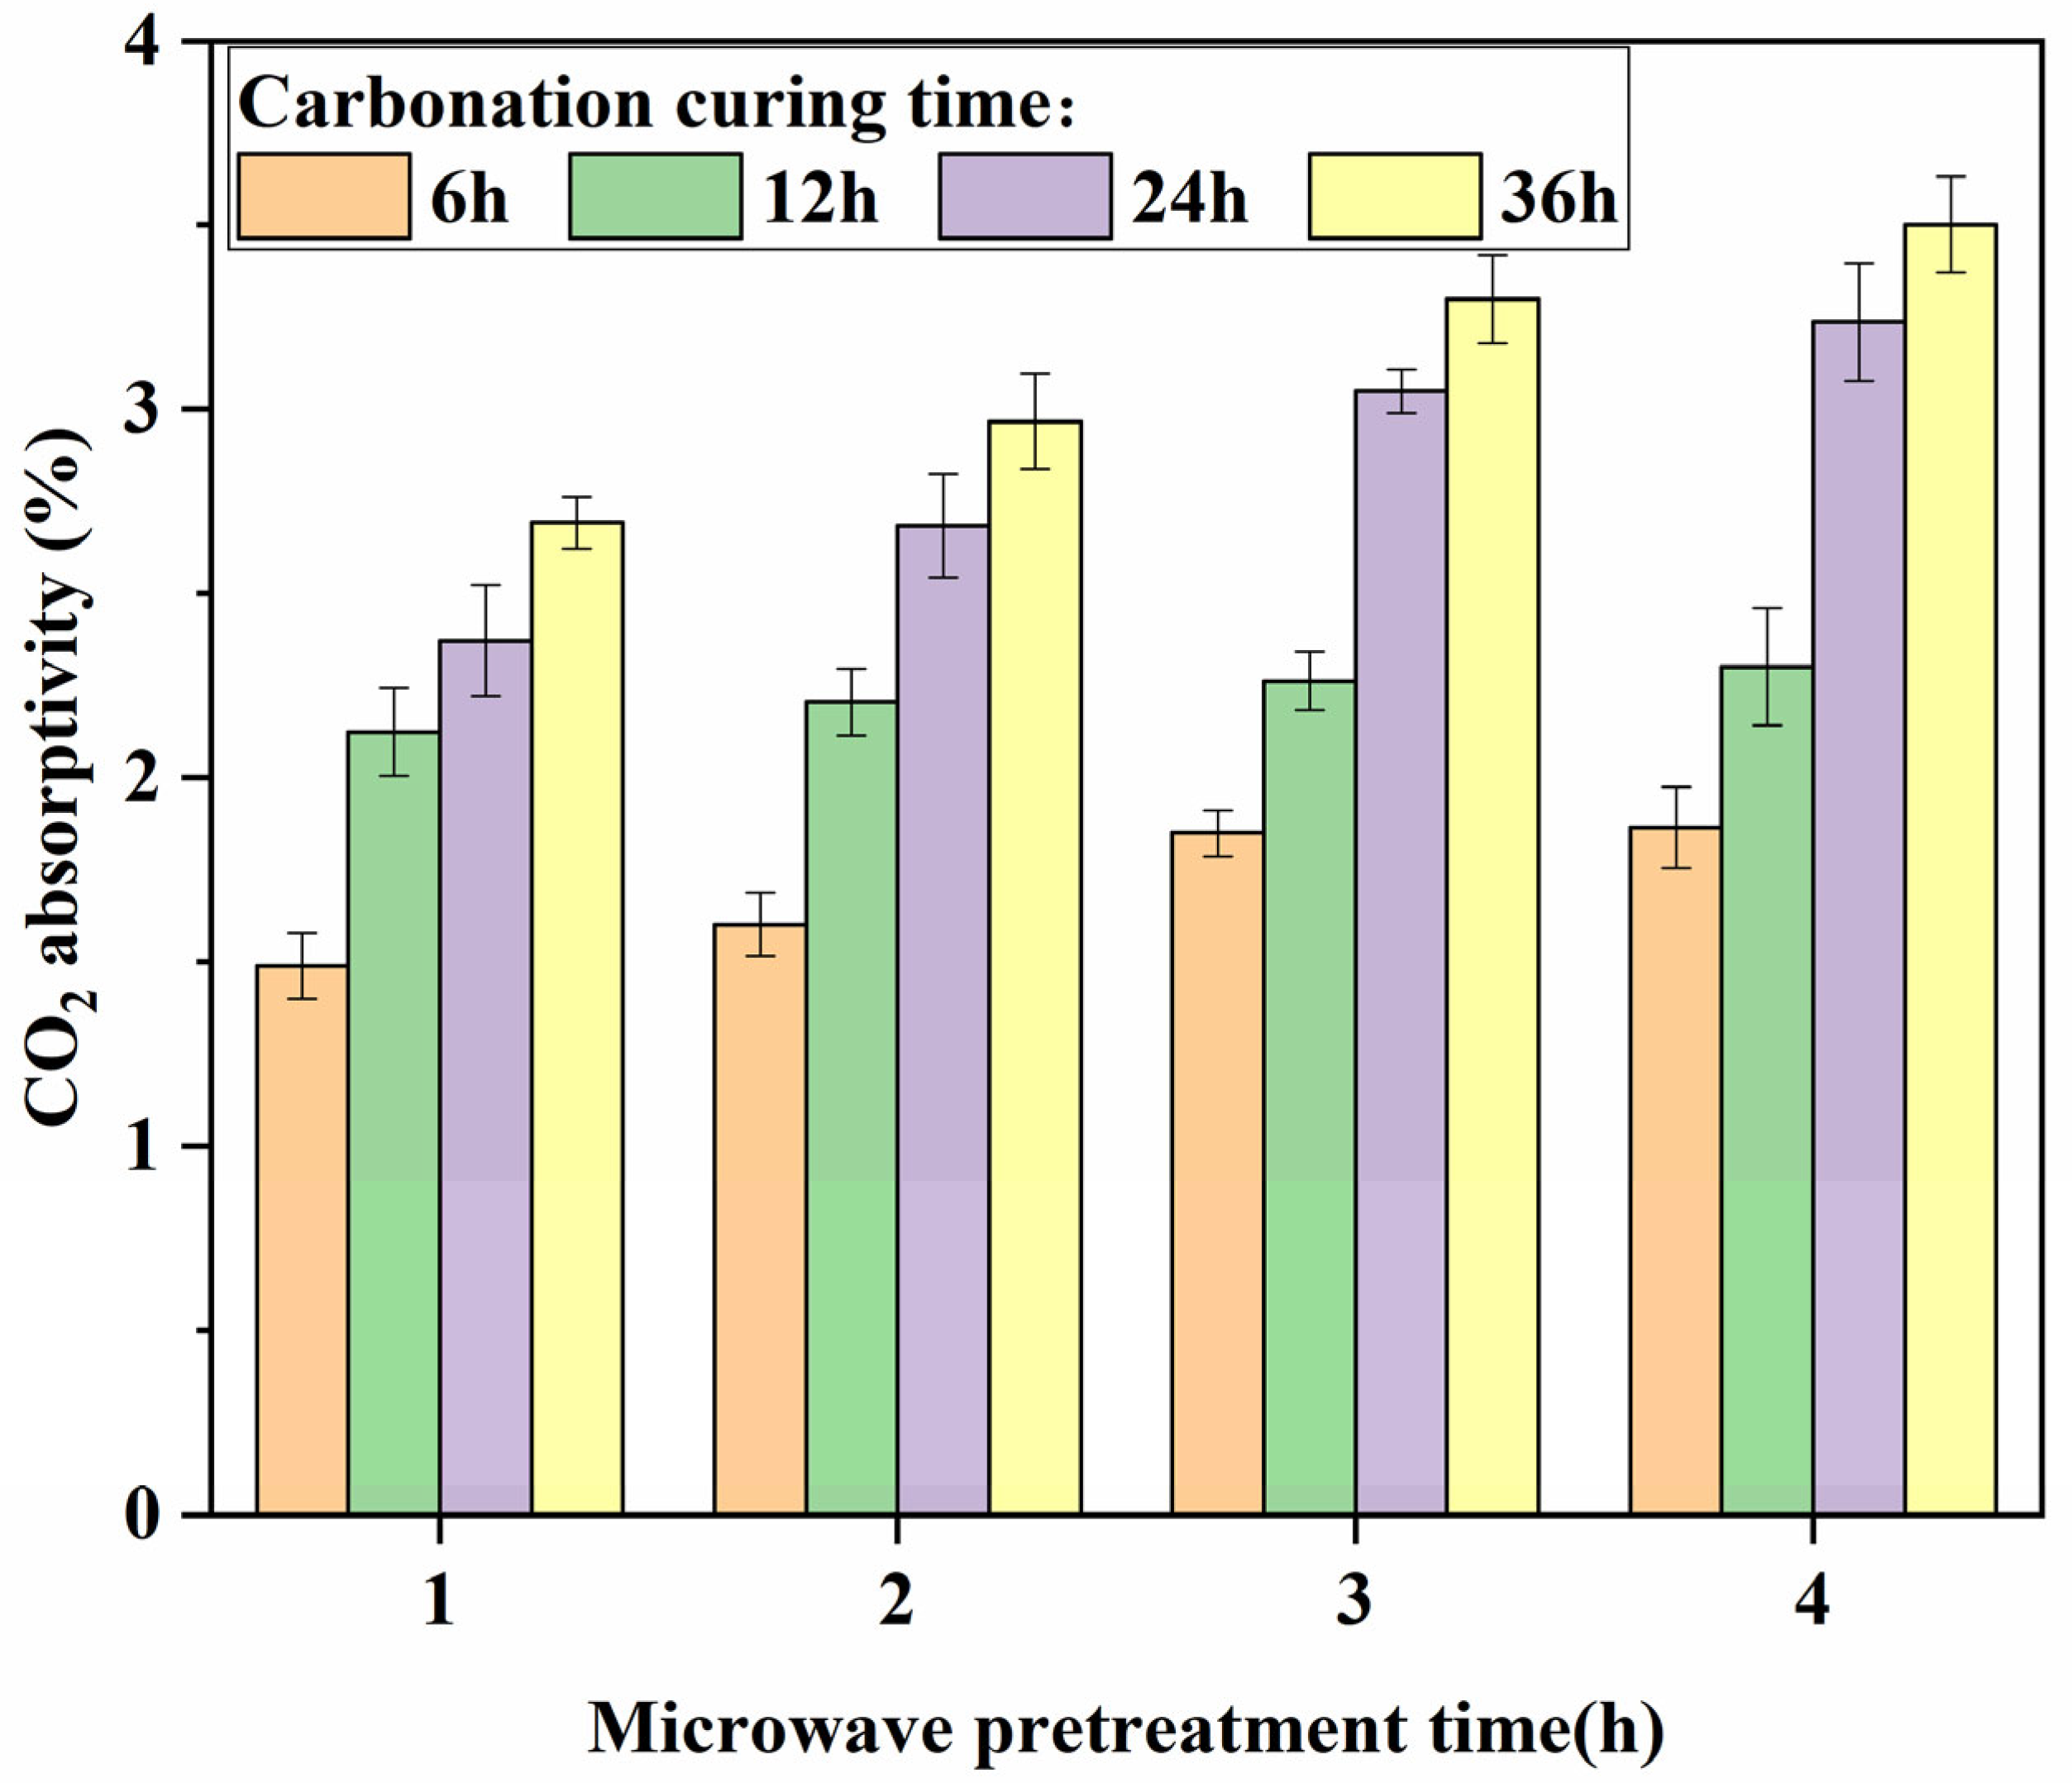
According to Figure 6, the CO2 absorptivity of the specimens continuously increases with the extension of microwave pretreatment time and carbonation curing time.
During the initial 0–6 h stage of carbonation curing, CO2 absorption occurs at the fastest rate, contributing to over half of the total absorption throughout the process. However, the influence of microwave pretreatment time on this stage is minimal. This suggests that the process of CO2 absorption on the surface of the specimens is rapid during the early stages of carbonation curing, possibly due to the uneven distribution of moisture within the specimens. The outer layer of the specimens loses moisture earlier during microwave pretreatment, leading to similar moisture content on the outer layer for specimens with different microwave pretreatment times [47,48,49].
During the 6–12 h stage of carbonation curing, the rate of CO2 absorption significantly decreases, and there is little difference among specimens with different microwave pretreatment times. This indicates that as the carbonation reaction progresses, the reaction rate begins to decrease. However, since the reaction interface is still at the outer layer, the entry of CO2 is relatively easy. Additionally, water can dissolve CO2 to generate carbonic acid, promoting the carbonation reaction. Therefore, the influence of microwave pretreatment time on the CO2 absorptivity is minimal during this stage.
During the 12–24 h and 24–36 h stages of carbonation curing, as carbonation progresses into deeper layers, the influence of specimen moisture content on the carbonation effect becomes more pronounced. With an increase in microwave pretreatment time, there is a noticeable improvement in CO2 absorptivity.
The above results indicate that the variation in microwave pretreatment time has a minor impact on the carbonation rate during the early stage of carbonation curing but a significant impact during the later stage. The absorption of CO2 is relatively rapid during the early stage of carbonation curing, while the carbonation rate decreases significantly during the later stage of carbonation curing.
The ratio of the volume of carbonation in the specimen to the total volume is defined as the carbonation rate. A scatter plot of the carbonation rate against the CO2 absorptivity was generated and fitted, as shown in Figure 7.
The linear relationship between the carbonated rate and CO2 absorptivity of the carbonated specimens is evident from the graph, and the extension of the fitted line on the left side closely approaches the origin of the coordinates. This indicates that the carbonation reaction primarily occurs at the carbonation interface, and areas that have already undergone carbonation do not further carbonate. This further confirms the regularity and effectiveness of the experimental results.
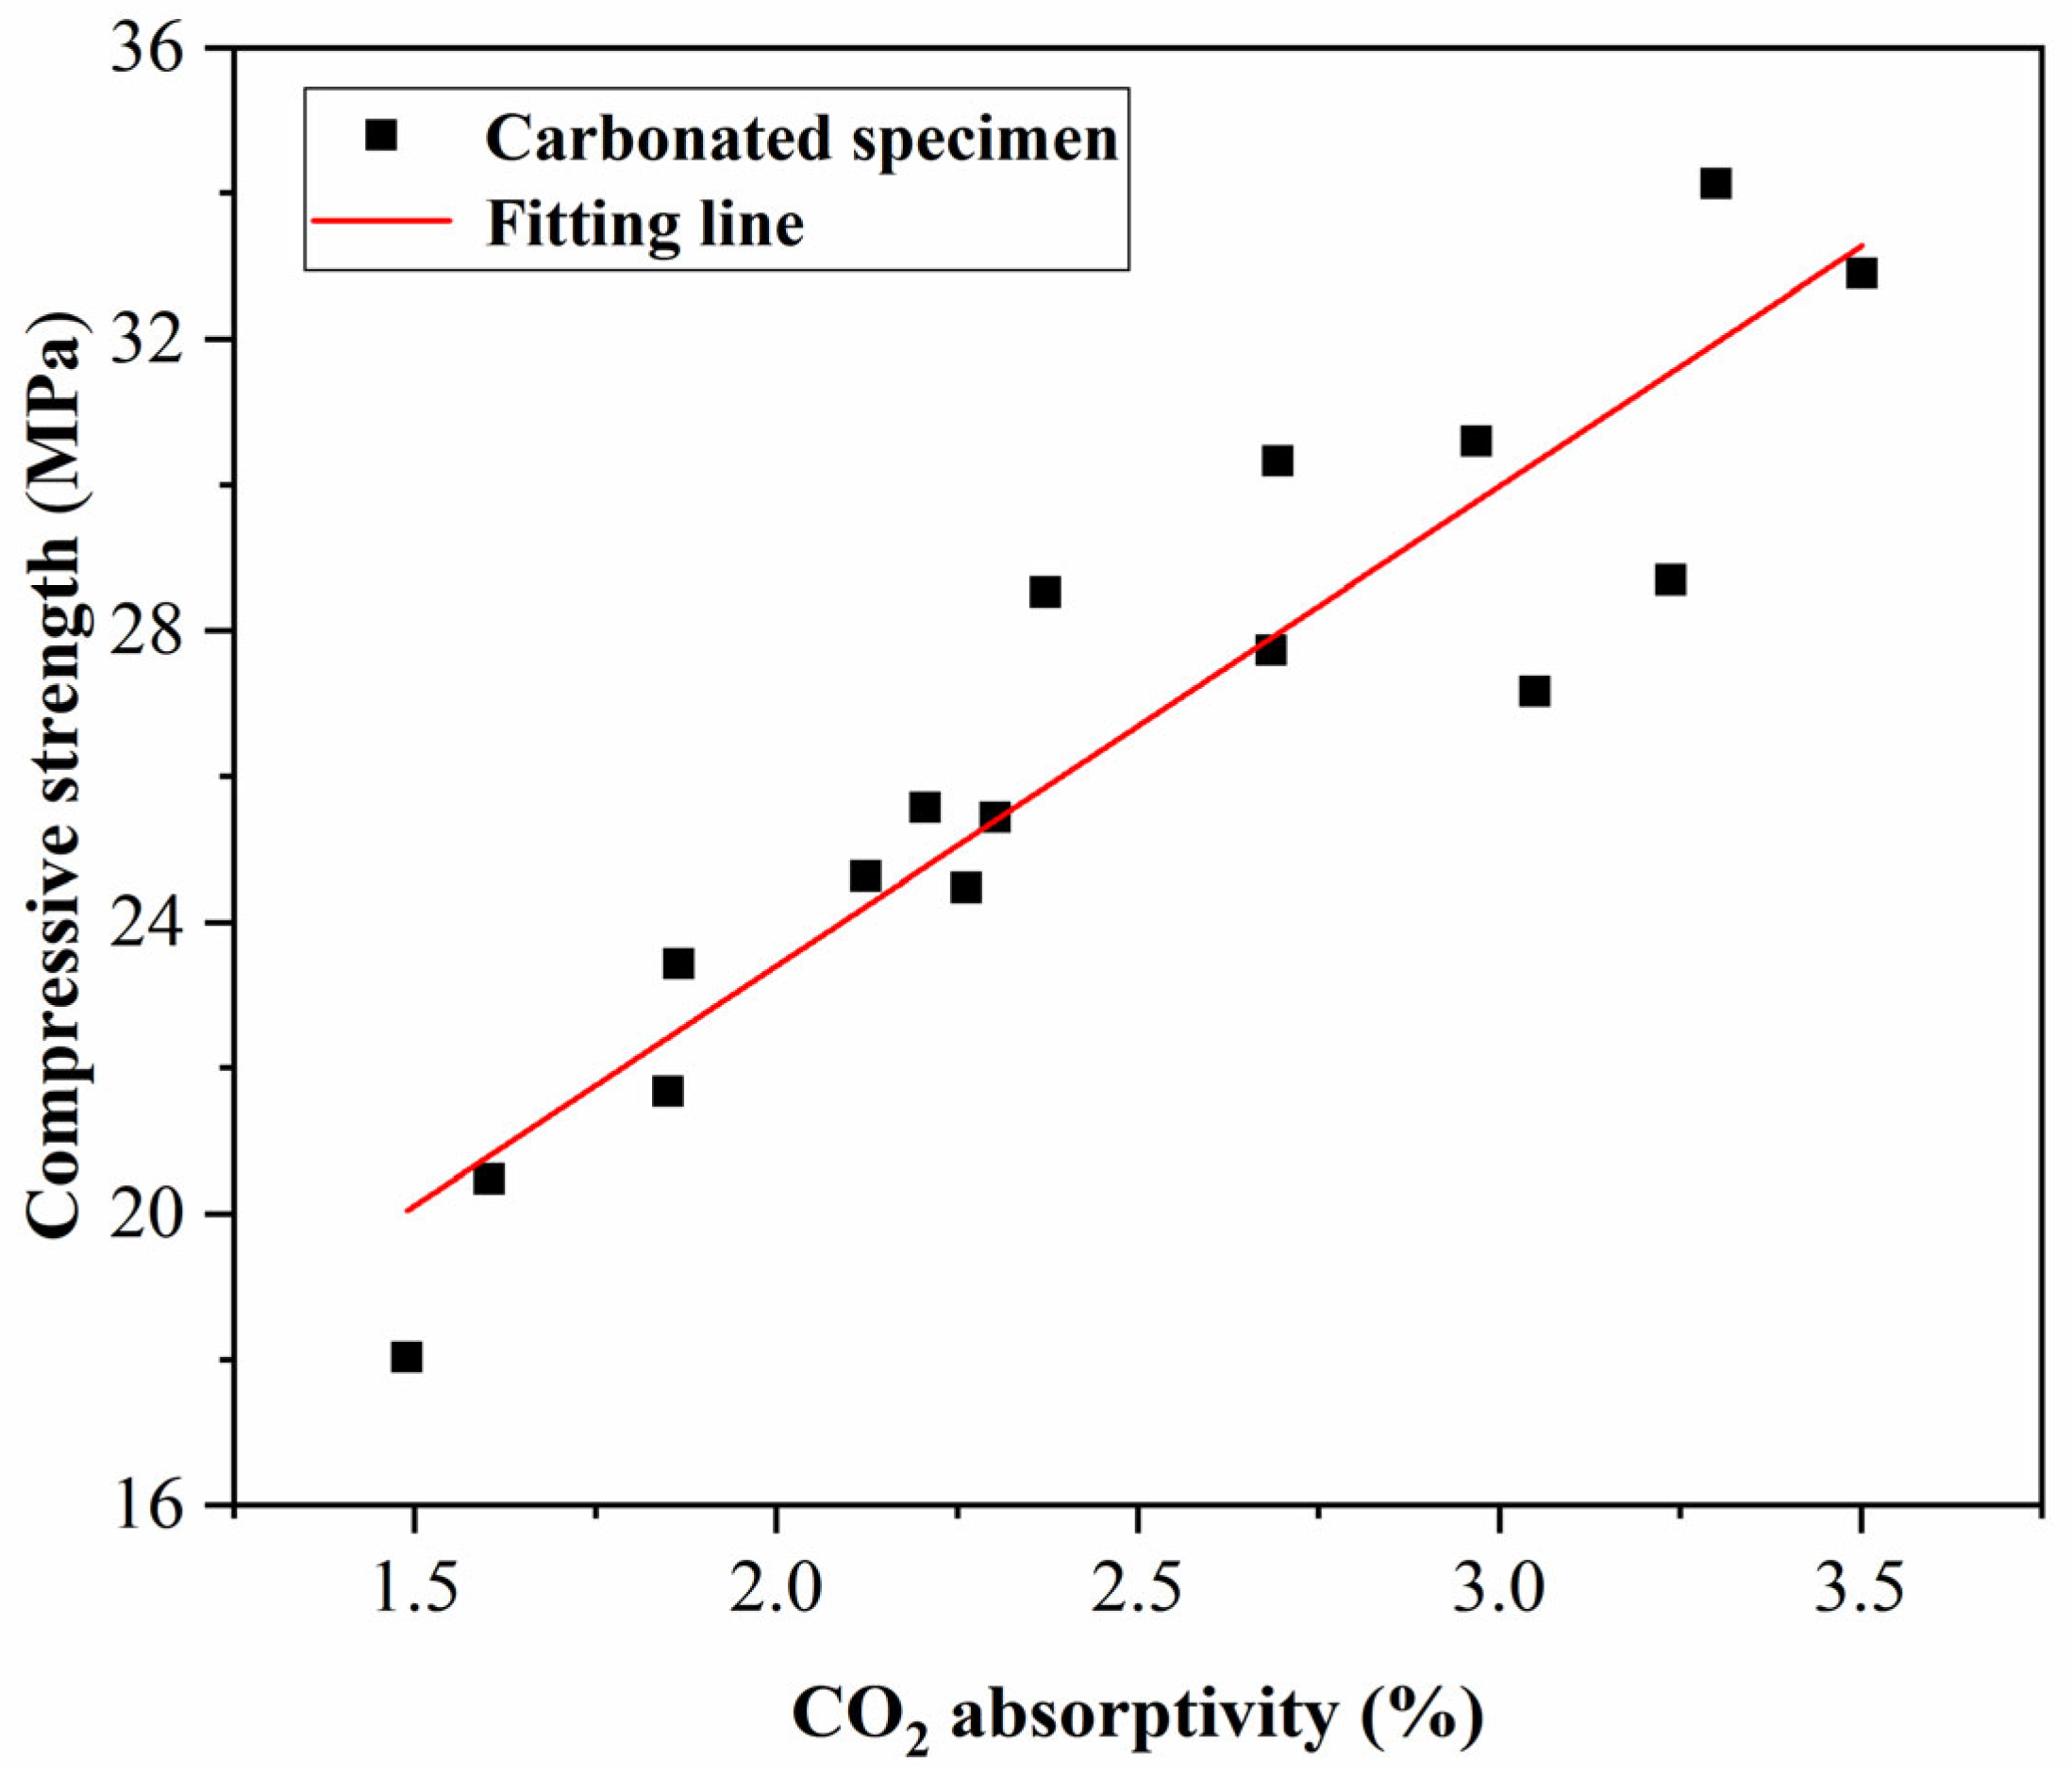
To investigate the relationship between the compressive strength of the specimens and the CO2 absorptivity, a scatter plot of the compressive strength of the specimens against the CO2 absorptivity is presented in Figure 8.
From Figure 8, it is evident that there is a linear relationship between the compressive strength and the CO2 absorptivity, with a good fit at lower levels. As the carbonation progresses, although the specimens with higher compressive strength and CO2 absorptivities are still evenly distributed on both sides of the fitted line, there is greater fluctuation. This is because specimens with higher compressive strength and CO2 absorptivities typically undergo longer microwave pretreatment and carbonation curing, which have a greater impact on the carbonation and hydration reactions, leading to increased uncertainty in the compressive strength.

3.5. Thermogravimetric Analysis (TGA)

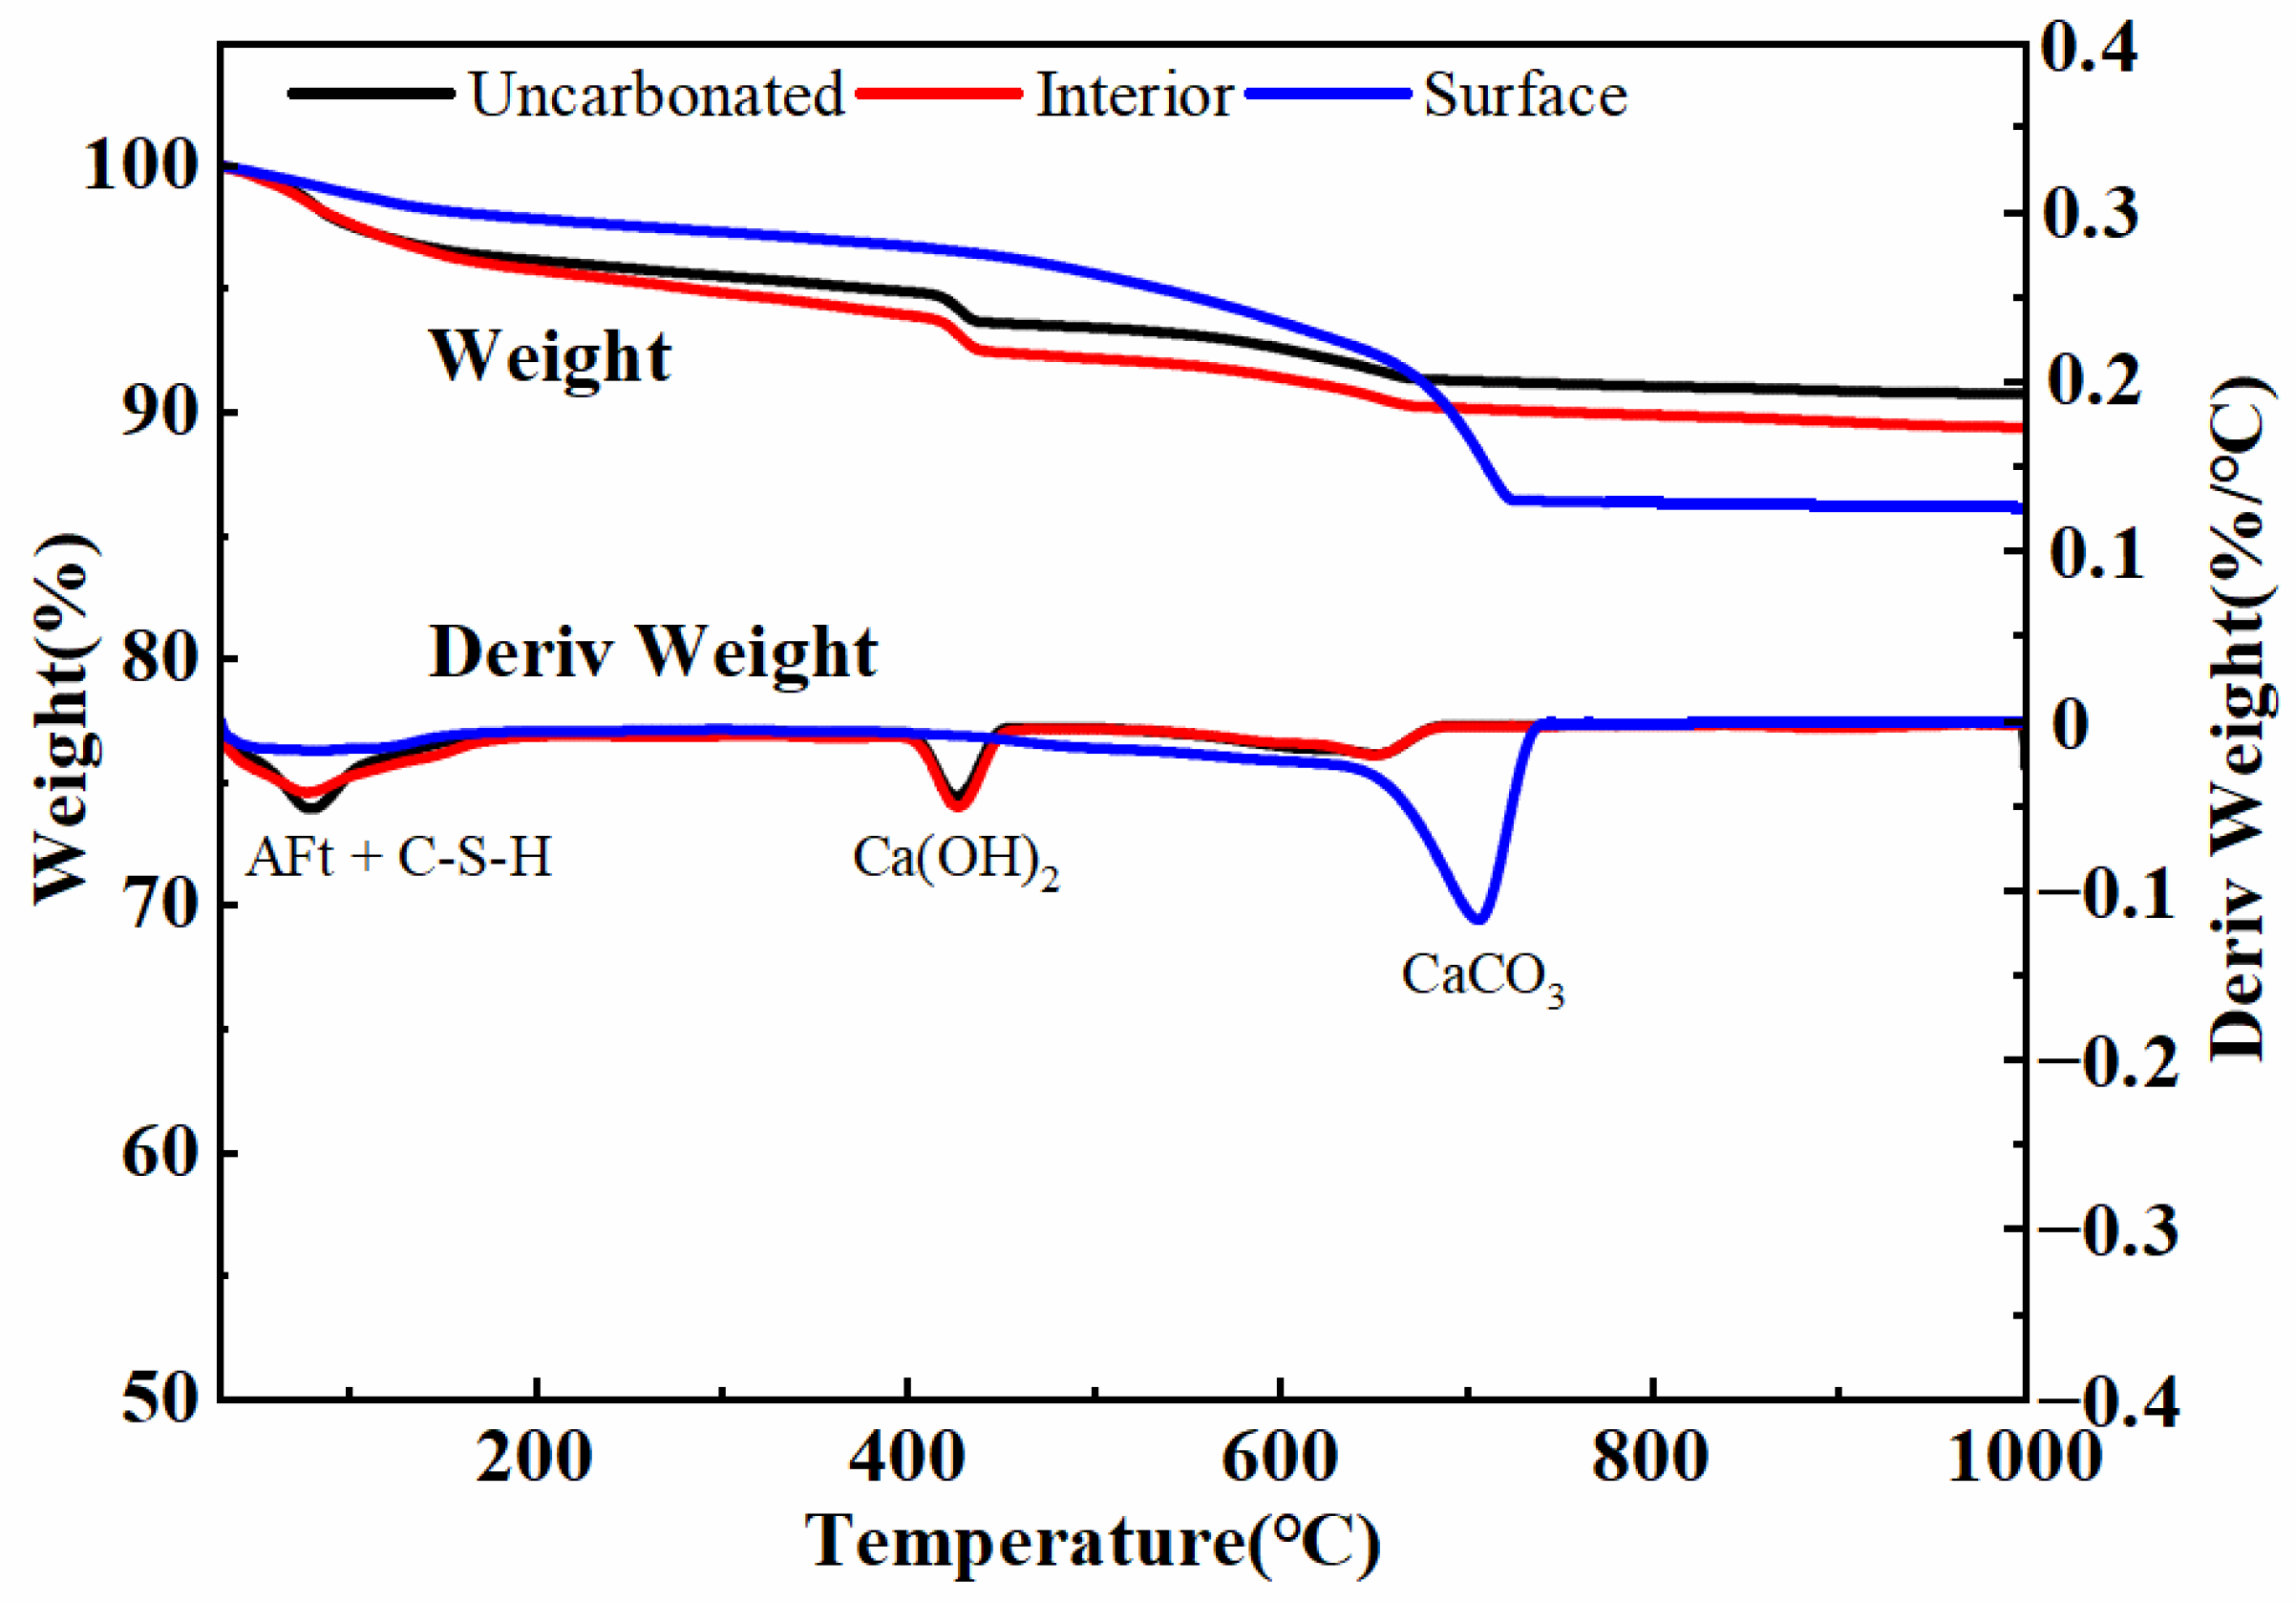
TG curves of the uncured specimens, the uncarbonated regions inside carbonated specimens, and the fully carbonated surfaces of the carbonated specimens are presented in Figure 9.
Below 200 °C, the mass changes primarily stem from the release of free water, hydration products such as calcium silicate hydrate gel (C-S-H), and bound water from phases like ettringite (AFt) [50]. The mass change in the range of 400–480 °C corresponds to the decomposition of calcium hydroxide (Ca(OH)2), while the mass change from 500 to 950 °C is attributed to the decomposition of calcium carbonate (CaCO3) [51,52,53].
The TG curves for the uncarbonated specimens and the uncarbonated regions inside the carbonated specimens are remarkably similar in the graph. The DTG curves almost completely overlap, showing significant mass changes at the decomposition temperatures of C-S-H, AFt, and Ca(OH)2, while there is minimal mass change at the decomposition temperature of CaCO3. This indicates that both the uncarbonated specimens and the uncarbonated regions inside the carbonated specimens underwent normal hydration reactions without being influenced by carbonation. Analyzing the DTG curve of the fully carbonated surfaces reveals minimal mass change at the decomposition temperatures of C-S-H, AFt, and Ca(OH)2. However, a small amount of poorly crystalline CaCO3 decomposes between 500 and 600 °C, with the main mass loss concentrated in the range of 600–740 °C, where well-crystallized CaCO3 decomposes. This suggests that the original hydration products, such as C-S-H, AFt, and Ca(OH)2, on the fully carbonated surfaces of the carbonated specimens completely transformed into CaCO3 during the carbonation curing process [20].
The above results indicate that there is a significant difference between the two sides of the carbonation interface of the specimens. The uncarbonated area undergoes normal hydration reactions without being carbonated [54].

3.6. X-ray Diffraction Analysis (XRD)

The XRD patterns of specimens with different microwave pretreatment times and carbonation curing times are presented in Figure 10. From Figure 10a, it can be observed that the surface diffraction peaks of specimens treated with 1, 2, 3, and 4 h of microwave pretreatment followed by 36 h of carbonation curing are largely consistent. Strong diffraction peaks of SiO2 and CaCO3 are evident, along with weaker diffraction peaks of Ca(OH)2, C3S, and C2S. This indicates that the surface of all specimens underwent complete carbonation, and constituents like AFt, Ca(OH)2, C3S, and C2S were consumed by the carbonation reaction, yielding a significant amount of CaCO3 [55,56].
From Figure 10b, it is evident that in specimens cured for 1 day under standard conditions, the diffraction peaks of AFt, C3S, and C2S are relatively weak, while the diffraction peak of Ca(OH)2 is strong, and CaCO3 does not exhibit a diffraction peak. In the interior of carbonated specimens, the diffraction peak of AFt disappears, and the diffraction peaks of C3S and C2S slightly weaken, while the diffraction peak of Ca(OH)2 strengthens. This indicates that during microwave pretreatment and carbonation curing, hydration reactions continue in the interior of the specimens, resulting in more Ca(OH)2 formation. On the surface of carbonated specimens, the diffraction peak of Ca(OH)2 largely disappears, and a strong CaCO3 diffraction peak appears. This suggests that Ca(OH)2 underwent carbonation, transforming into CaCO3 [57,58,59].
Figure 10c presents the XRD diffraction patterns of specimens with 1 h of microwave pretreatment and varying carbonation curing times. It can be observed that, with a shorter carbonation time, the surface of the specimens still exhibits relatively weak diffraction peaks of Ca(OH)2, C3S, and C2S alongside a strong CaCO3 diffraction peak. As the carbonation time increases, the diffraction peaks of Ca(OH)2, C3S, and C2S gradually weaken, while the CaCO3 diffraction peak becomes stronger. This suggests that carbonation reactions persist during the carbonation curing process, converting Ca(OH)2, C3S, and C2S into CaCO3 and other products [60].
Figure 10d depicts the XRD diffraction patterns of specimens with 4 h of microwave pretreatment and varying carbonation curing times. Comparing it with Figure 10c, it can be observed that the phases present and the intensity of their diffraction peaks are very similar. However, for specimens with 4 h of microwave pretreatment, the intensity of the Ca(OH)2 diffraction peak decreases more rapidly with an increasing carbonation curing time. This indicates that extending the microwave pretreatment time can accelerate the carbonation reaction.
The above results indicate that the uncarbonated area undergoes further hydration during the carbonation curing process, resulting in the production of more Ca(OH)2. The surface of the already carbonated area still contains a small amount of Ca(OH)2, which decreases further with an increasing microwave pretreatment time and carbonation curing time.

3.7. Scanning Electron Microscope Analysis

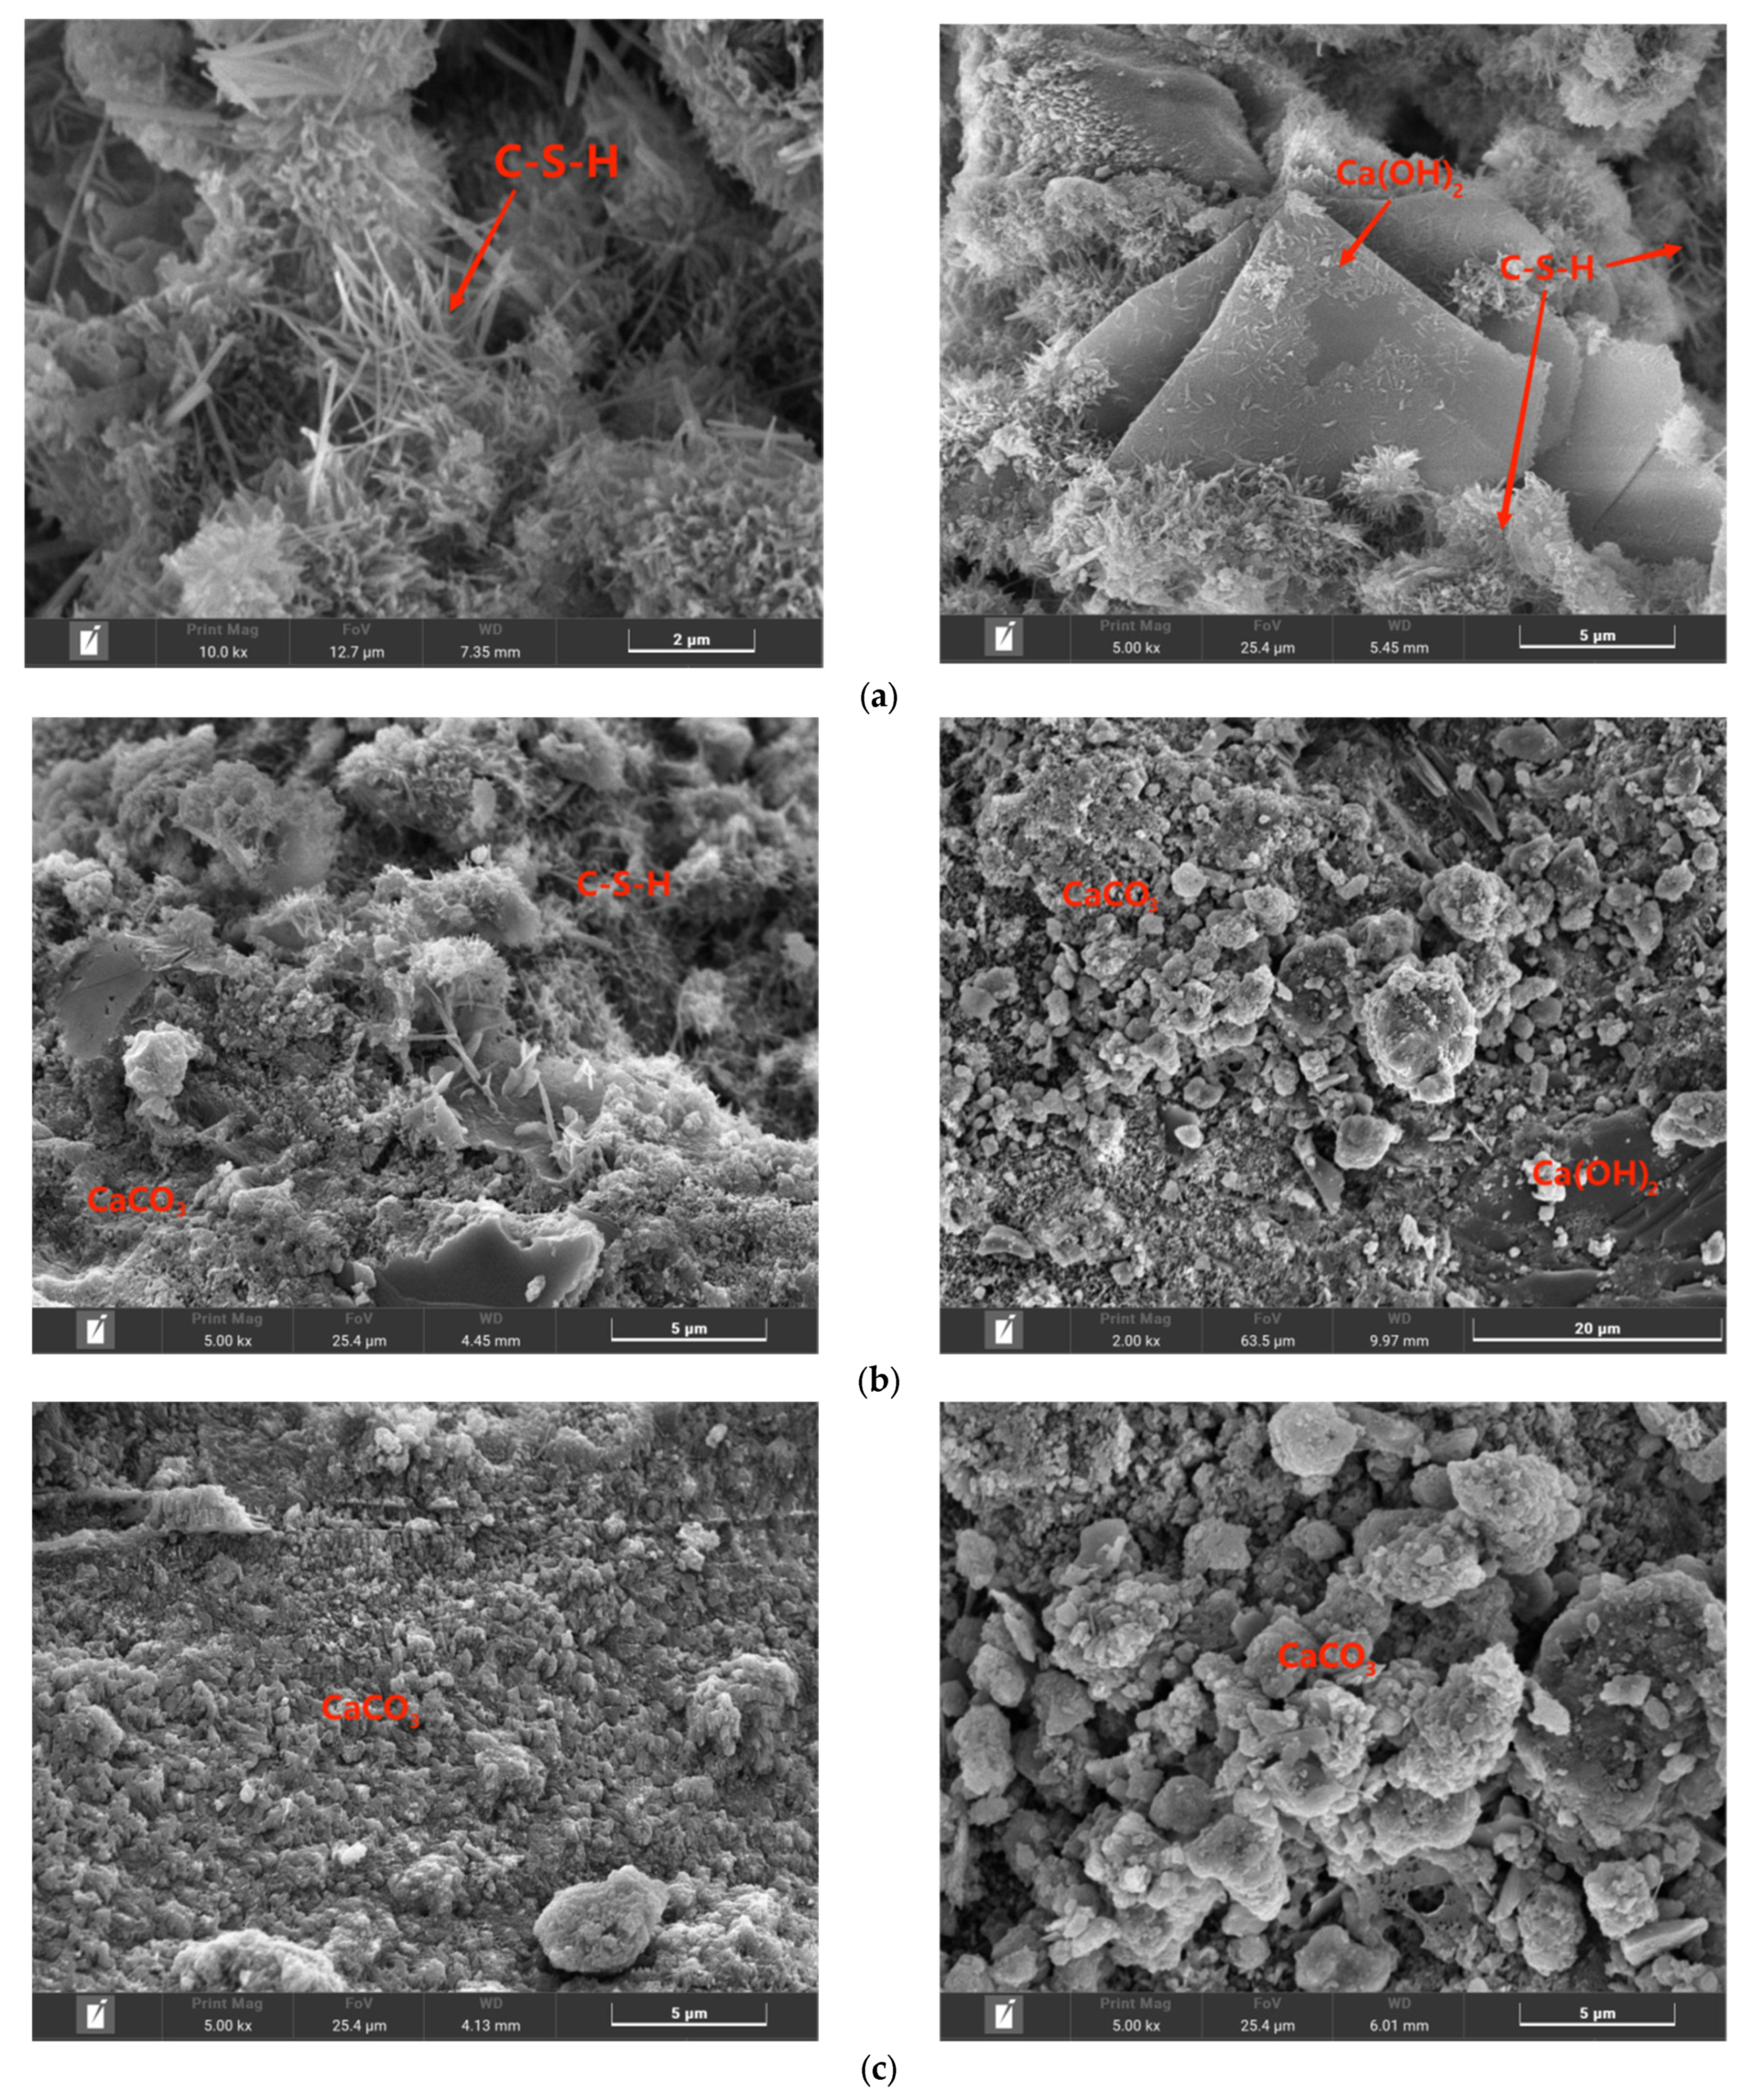
SEM images of the uncarbonated specimen, carbonation interface, and fully carbonated specimen are illustrated in Figure 11.
As seen in Figure 11a, the uncarbonated specimen exhibits a considerable amount of amorphous C-S-H gel and plate-like Ca(OH)2, with no observable CaCO3. This is attributed to the early hydration stage of the specimen, where C3S hydration produces a significant amount of C-S-H gel and Ca(OH)2. These hydration products have not undergone further reactions, leading to a porous structure and loose arrangement, consistent with the lower early strength of the specimen [61,62]. In Figure 11b, the left image displays the interface between carbonated and uncarbonated regions. The bottom left corner of the left image shows carbonated CaCO3, while the top right corner shows uncarbonated C-S-H gel. In the right image, the top left corner displays carbonated CaCO3, and the bottom right corner shows uncarbonated plate-like Ca(OH)2. It is observed that the CaCO3 generated after carbonation fills the original pores, resulting in a significantly denser structure on the carbonated side compared to the uncarbonated side [63,64]. In Figure 11c, the sample is fully carbonated, and only CaCO3 is observable as C-S-H gel and Ca(OH)2 were consumed by the carbonation reaction. The image indicates that the fully carbonated specimen is highly compact, with excellent filling by CaCO3, effectively enhancing the compressive strength of the specimen [65,66,67].

3.8. Pore Structure Analysis

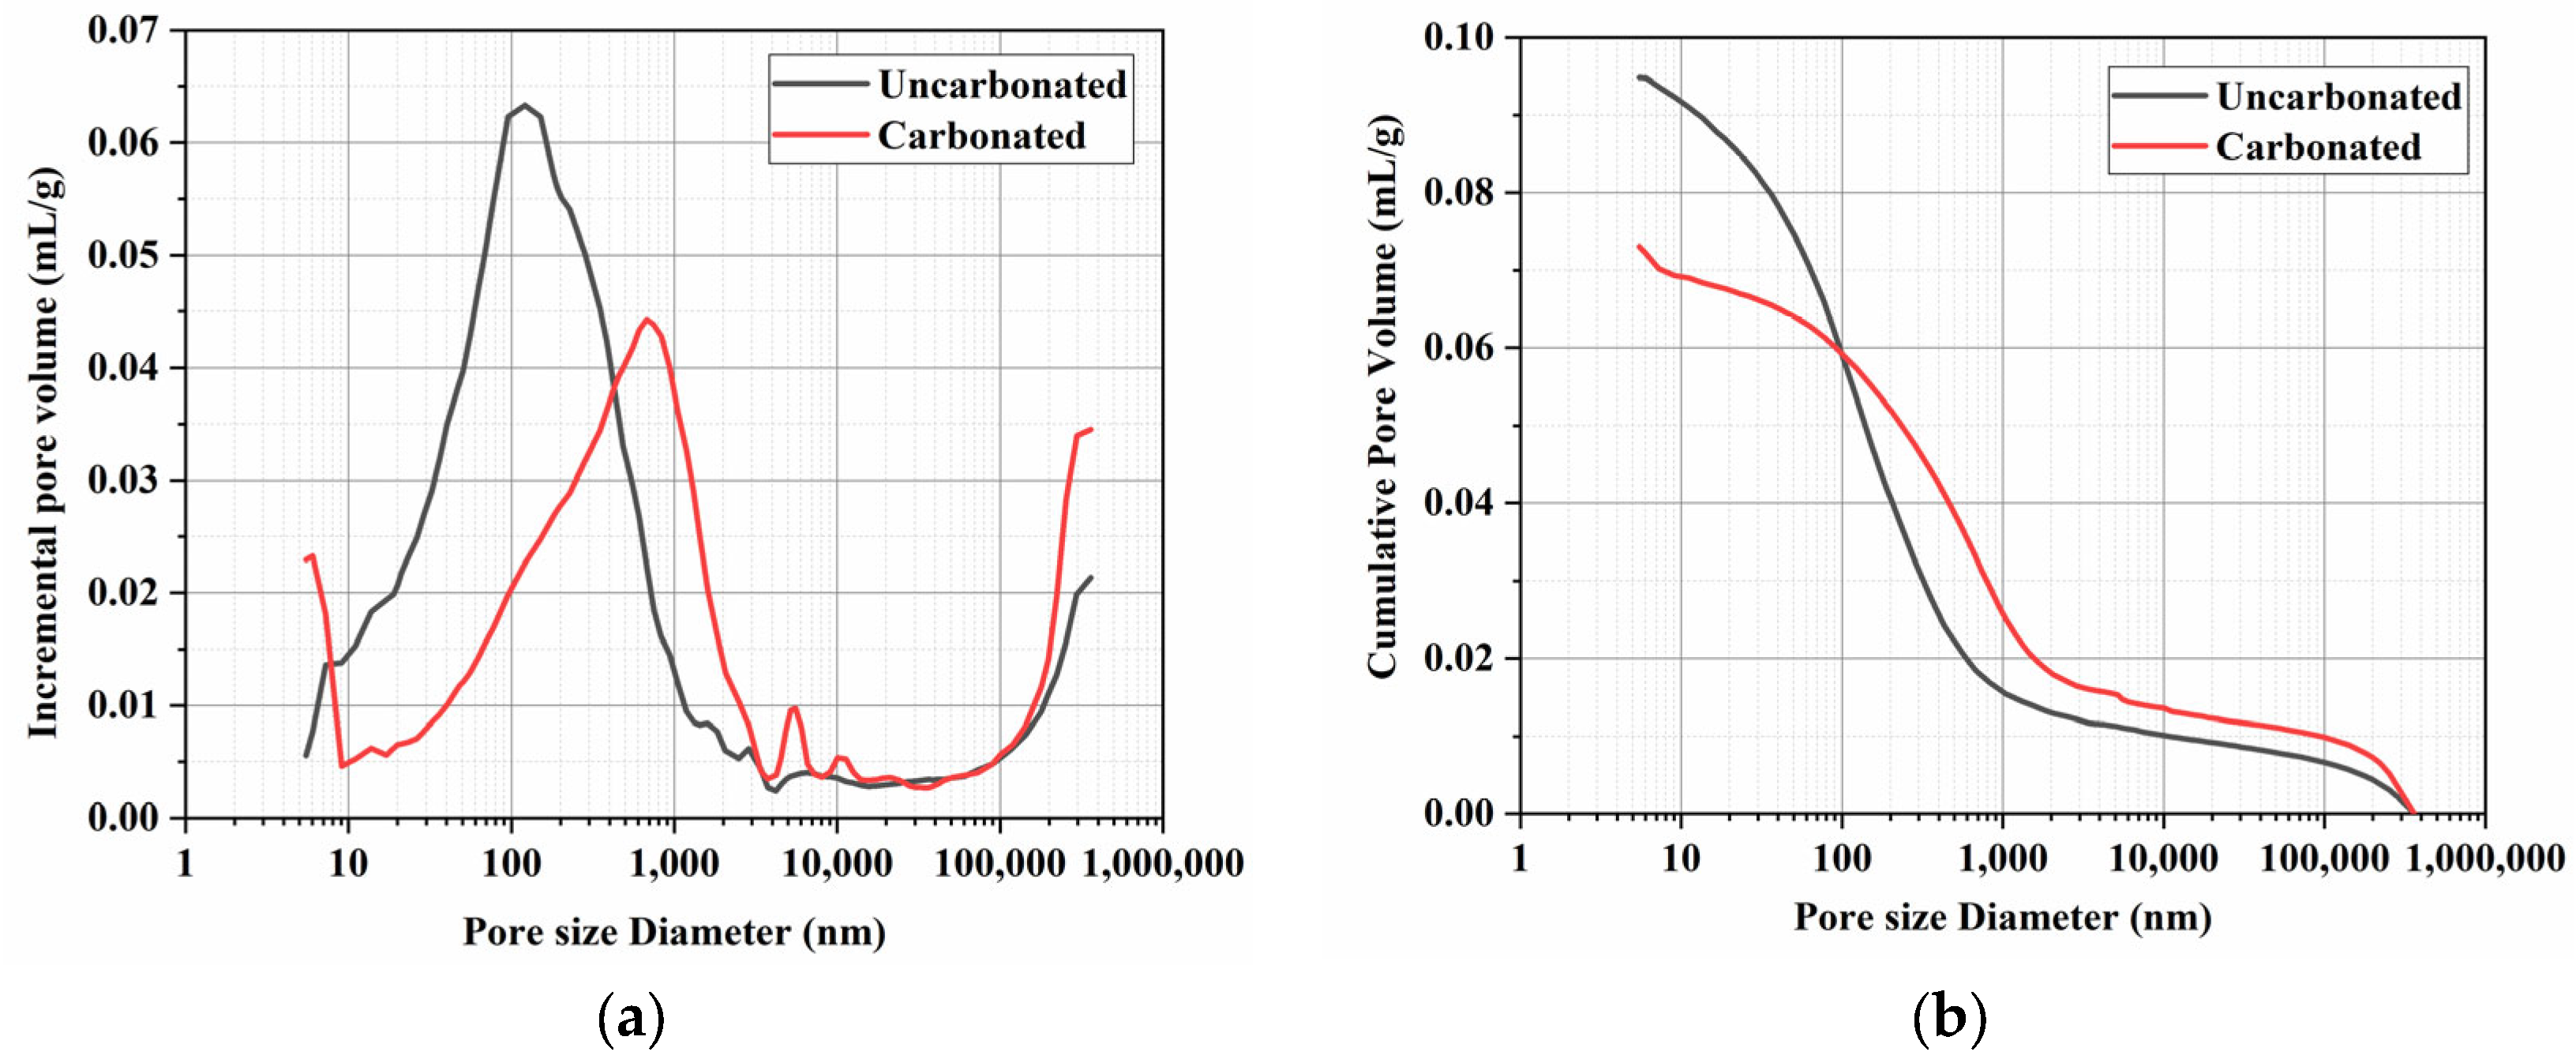
The incremental and cumulative pore diameter distribution curves of fully carbonated and uncarbonated samples are shown in Figure 12a,b.
By examining Figure 12a, it can be observed that, compared to the uncarbonated samples, the fully carbonated samples exhibit a reduction in the peak value and a rightward shift in the peak corresponding to pore size from 153 nm to 564 nm. This suggests that after carbonation curing, there is a decrease in the number of pores in the specimens but an overall increase in pore size [61,66].
Additionally, the number of pores below 7 nm and above 100 μm increases after carbonation, indicating that some of the originally intermediate-sized pores differentiated, forming more extremely fine pores and large pores. This occurrence may be attributed to the reaction of substances such as Ca(OH)2 with CO2 during carbonation, leading to the formation of CaCO3 that fills certain pores, making them denser. However, this process also creates voids in the original positions of these substances, resulting in an increase in pore size for some pores [68].
After carbonation curing, the average pore size of the samples increases from 60 nm to 74 nm, while the porosity decreases from 19.65% to 15.77%. This indicates that although carbonation curing enlarges the average pore size, it also serves a filling function, making the samples denser and reducing the overall porosity.
By observing Figure 12b, it is evident that although the carbonated samples result in an enlargement of certain pore sizes, the final cumulative pore volume is significantly smaller than that of the uncarbonated samples, highlighting the notable densification effect of carbonation curing on the specimens [69]. This is consistent with the results obtained from SEM.
The above analysis indicates that carbonation curing leads to the differentiation of some intermediate pores, resulting in the formation of very fine pores and large pores, leading to an overall increase in average pore size. However, it also plays a filling role, making the overall structure more compact and reducing the porosity.

4. Conclusions

This study investigates the effect of microwave pretreatment on the properties and microstructure of low-concentration carbon dioxide early cured cement-based materials. The main research findings are summarized as follows:
(1)
The microwave pretreatment accelerates the hydration reaction rate, enhances the compressive strength of the specimens, and significantly reduces their moisture content, thereby facilitating faster penetration of CO2 into the specimens and enhancing carbonation efficiency. The initial increase in compressive strength and decrease in moisture content due to microwave pretreatment are rapid. After 1 h of microwave pretreatment, the compressive strength of the specimens increases from 12.12 MPa to 17.02 MPa, and the moisture content decreases from 8.64% to 5.29%. However, the effects start to diminish afterward. After 4 h of microwave pretreatment, the compressive strength reaches 21.77 MPa, and the moisture content eventually drops to 2.64%. After 36 h of carbonation curing, the specimen with 3 h of microwave pretreatment and a moisture content of 3.29% exhibits the highest compressive strength.
(2)
The absorption of CO2 is relatively rapid in the early stage of carbonation curing, with over 50% of the CO2 absorption occurring within the 0–6 h period of carbonation curing, and during this stage, the variation in microwave pretreatment time has minimal impact on the absorption. In the later stage of carbonation curing, the carbonation rate significantly decreases, and specimens with longer microwave pretreatment times exhibit higher CO2 absorption. The carbonation rate and compressive strength of the specimens were linearly related to the CO2 absorption rate, and the fitting line was close to the origin of the coordinates.
(3)
The hydration products and microstructure of the uncarbonated part inside the specimens are generally consistent with the normal curing state. They are mainly influenced by microwave pretreatment, which promotes hydration reactions and is not affected by the external CO2 atmosphere. The fully carbonated part of the specimens lacks C-S-H, AFt, and Ca(OH)2, as they transform into CaCO3 during the carbonation process.
(4)
After microwave pretreatment and carbonation curing, some pores that were originally in the intermediate range differentiated, forming more extremely fine pores and large pores. The average pore size of the samples increased from 60 nm to 74 nm, but the porosity decreased from 19.65% to 15.77%. Although carbonation curing enlarges the average pore size of the samples, it also serves a filling function, making the samples more compact and reducing the porosity.

Author Contributions

Conceptualization, X.L. and S.L.; data curation, X.L.; formal analysis, X.L. and M.L.; funding acquisition, S.L.; investigation, X.L.; methodology, X.L. and L.W.; project administration, L.W.; resources, S.L.; software, M.L.; supervision, S.L.; validation, X.L., M.L. and L.W.; visualization, X.L.; writing—original draft, X.L.; writing—review and editing, X.L., M.L., L.W. and S.L. All authors have read and agreed to the published version of the manuscript.

Funding

This research was funded by the Major Science and Technology Project of China Energy Construction Co., Ltd. (No. CEEC2021-ZDYF-03), the Key Research and Development Program of Hubei Province (2022BCA059), and the China Construction Technology Research and Development Project for Western Construction (ZJXJ-2022-10).

Data Availability Statement

The data presented in this study are available on request from the corresponding author (privacy reason).

Conflicts of Interest

The authors declare no conflict of interest.

References

  1. Lin, X.; Li, X.; Liu, H.; Boczkaj, G.; Cao, Y.; Wang, C. A review on carbon storage via mineral carbonation: Bibliometric analysis, research advances, challenges, and perspectives. Sep. Purif. Technol. 2024, 338, 126558. [Google Scholar] [CrossRef]
  2. Zhang, Z.; Zheng, K.; Chen, L.; Yuan, Q. Review on accelerated carbonation of calcium-bearing minerals: Carbonation behaviors, reaction kinetics, and carbonation efficiency improvement. J. Build. Eng. 2024, 86, 108826. [Google Scholar] [CrossRef]
  3. Allen, M.; Mustafa, B.; Shukla, P. GLOBAL WARMING of 1.5 °C—An IPCC Special Report on the Impacts of Global Warming of 1.5 °C above Pre-Industrial Levels and Related Global Greenhouse Gas Emission Pathways, in the Context of Strengthening the Global Response to the Threat of Climate Change, Sustainable Development, and Efforts To Eradicate Poverty; IPCC: Geneva, Switzerland, 2018. [Google Scholar]
  4. Statistical Communiqué of the People’s Republic of China on the 2022 National Economic and Social Development; National Bureau of Statistics of China: Beijing, China, 2023; pp. 12–29.
  5. Monkman, S.; MacDonald, M. On carbon dioxide utilization as a means to improve the sustainability of ready-mixed concrete. J. Clean. Prod. 2017, 167, 365–375. [Google Scholar] [CrossRef]
  6. Zhang, R.; Scott, A.N.; Panesar, D.K. Carbonation and CO2 reabsorption of cement-based materials: Influence of limestone filler and ground-granulated blast-furnace slag. Constr. Build. Mater. 2024, 416, 135166. [Google Scholar] [CrossRef]
  7. Luo, K.; Zhang, W.; Ye, J.; Li, J.; Lu, Z.; Ren, X. Mechanism of interaction between hydration–carbonation of C2S. Constr. Build. Mater. 2024, 412, 134891. [Google Scholar] [CrossRef]
  8. Ahmad, S.; Assaggaf, R.A.; Maslehuddin, M.; Al-Amoudi, O.S.B.; Adekunle, S.K.; Ali, S.I. Effects of carbonation pressure and duration on strength evolution of concrete subjected to accelerated carbonation curing. Constr. Build. Mater. 2017, 136, 565–573. [Google Scholar] [CrossRef]
  9. Zajac, M.; Maruyama, I.; Iizuka, A.; Skibsted, J. Enforced carbonation of cementitious materials. Cem. Concr. Res. 2023, 174, 107285. [Google Scholar] [CrossRef]
  10. Fernández Bertos, M.; Simons, S.J.R.; Hills, C.D.; Carey, P.J. A review of accelerated carbonation technology in the treatment of cement-based materials and sequestration of CO2. J. Hazard. Mater. 2004, 112, 193–205. [Google Scholar] [CrossRef] [PubMed]
  11. Shi, C.; Wang, J.; Tu, Z.; Wang, D. Progresses in CO2 Curing of Concrete. Cailiao Daobao/Mater. Rev. 2017, 31, 134–138. [Google Scholar] [CrossRef]
  12. Borges, P.H.R.; Costa, J.O.; Milestone, N.B.; Lynsdale, C.J.; Streatfield, R.E. Carbonation of CH and C–S–H in composite cement pastes containing high amounts of BFS. Cem. Concr. Res. 2010, 40, 284–292. [Google Scholar] [CrossRef]
  13. Shi, C.; Liu, M.; He, P.; Ou, Z. Factors affecting kinetics of CO2 curing of concrete. J. Sustain. Cem. Based Mater. 2012, 1, 24–33. [Google Scholar] [CrossRef]
  14. Shi, C.; Wu, Y. Studies on some factors affecting CO2 curing of lightweight concrete products. Resour. Conserv. Recycl. 2008, 52, 1087–1092. [Google Scholar] [CrossRef]
  15. Shi, C.; Wu, Y. CO2 Curing of Concrete Blocks. Concr. Int. 2009, 31, 39–43. [Google Scholar]
  16. Junior, A.; Toledo Filho, R.; Fairbairn, E.; Dweck, J. CO2 sequestration by high initial strength Portland cement pastes. J. Therm. Anal. Calorim. 2013, 113, 1577–1584. [Google Scholar] [CrossRef]
  17. Jang, J.G.; Kim, G.M.; Kim, H.J.; Lee, H.K. Review on recent advances in CO2 utilization and sequestration technologies in cement-based materials. Constr. Build. Mater. 2016, 127, 762–773. [Google Scholar] [CrossRef]
  18. Neves Junior, A.; Toledo Filho, R.D.; de Moraes Rego Fairbairn, E.; Dweck, J. The effects of the early carbonation curing on the mechanical and porosity properties of high initial strength Portland cement pastes. Constr. Build. Mater. 2015, 77, 448–454. [Google Scholar] [CrossRef]
  19. Zhan, B.; Poon, C.; Shi, C. CO2 curing for improving the properties of concrete blocks containing recycled aggregates. Cem. Concr. Compos. 2013, 42, 1–8. [Google Scholar] [CrossRef]
  20. Shi, C.; He, P.; Tu, Z.; Cao, Z. Effect of pre-conditioning on process and microstructure of carbon dioxide cured concrete. Kuei Suan Jen Hsueh Pao/J. Chin. Ceram. Soc. 2014, 42, 996–1004. [Google Scholar] [CrossRef]
  21. Shi, C.; Wang, D.; He, F.; Liu, M. Weathering properties of CO2-cured concrete blocks. Resour. Conserv. Recycl. 2012, 65, 11–17. [Google Scholar] [CrossRef]
  22. Cho, J.M.; Oh, Y.-K.; Lee, J.; Chang, Y.K.; Park, W.-K. Development of dual strain microalgae cultivation system for the direct carbon dioxide utilization of power plant flue gas. Bioresour. Technol. 2024, 393, 130051. [Google Scholar] [CrossRef]
  23. Kikkinides, E.S.; Yang, R.T.; Cho, S.H. Concentration and recovery of carbon dioxide from flue gas by pressure swing adsorption. Ind. Eng. Chem. Res. 1993, 32, 2714–2720. [Google Scholar] [CrossRef]
  24. Elsener, B. Corrosion of Steel in Concrete. In Materials Science and Technology; Wiley: Hoboken, NJ, USA, 2013. [Google Scholar] [CrossRef]
  25. Galan, I.; Andrade, C.; Castellote, M. Natural and accelerated CO2 binding kinetics in cement paste at different relative humidities. Cem. Concr. Res. 2013, 49, 21–28. [Google Scholar] [CrossRef]
  26. Shi, C.; He, F.; Wu, Y. Effect of pre-conditioning on CO2 curing of lightweight concrete blocks mixtures. Constr. Build. Mater. 2012, 26, 257–267. [Google Scholar] [CrossRef]
  27. Wang, Y.; Luo, S.; Yang, L.; Ding, Y. Microwave curing cement-fly ash blended paste. Constr. Build. Mater. 2021, 282, 122685. [Google Scholar] [CrossRef]
  28. Mishra, R.R.; Sharma, A.K. Microwave–material interaction phenomena: Heating mechanisms, challenges and opportunities in material processing. Compos. Part A Appl. Sci. Manuf. 2016, 81, 78–97. [Google Scholar] [CrossRef]
  29. Rostami, V.; Shao, Y.; Boyd, A.J. Durability of concrete pipes subjected to combined steam and carbonation curing. Constr. Build. Mater. 2011, 25, 3345–3355. [Google Scholar] [CrossRef]
  30. Sharma, D.; Goyal, S. Accelerated carbonation curing of cement mortars containing cement kiln dust: An effective way of CO2 sequestration and carbon footprint reduction. J. Clean. Prod. 2018, 192, 844–854. [Google Scholar] [CrossRef]
  31. Liu, M. Microwave-Based Preconditioning Technique for Accelerated Carbonation Curing of Cementitious Materials. Ph.D. Thesis, University College London, London, UK, 2019. [Google Scholar]
  32. Al-Duri, B.; McIntyre, S. Comparison of drying kinetics of foods using a fan-assisted convection oven, a microwave oven and a combined microwave/convection oven. J. Food Eng. 1992, 15, 139–155. [Google Scholar] [CrossRef]
  33. Li, T.; Yue, Z.; Li, J.; Li, Q.; Li, Y.; Chen, G. Experimental study of microwave heating on mechanical properties of fly ash-based cementitious materials. J. Build. Eng. 2024, 83, 108454. [Google Scholar] [CrossRef]
  34. Zhou, F.; Pan, G.; Meng, H.; Mi, R. Effect of secondary curing on the performance of microwave cured concrete. Constr. Build. Mater. 2022, 330, 127256. [Google Scholar] [CrossRef]
  35. Zhang, G.; Li, Z.; Zhang, L.; Shang, Y.; Wang, H. Experimental research on drying control condition with minimal effect on concrete strength. Constr. Build. Mater. 2017, 135, 194–202. [Google Scholar] [CrossRef]
  36. Salem, S.; Eissa, E.; Zarif, E.; Sherif, S.; Shazly, M. Influence of moisture content on the concrete response under dynamic loading. Ain Shams Eng. J. 2023, 14, 101976. [Google Scholar] [CrossRef]
  37. GB/T 17671-2021; Test Method of Cement Mortar Strength (ISO Method). State Administration for Maket Regulation, Standardization Administration of the P.R.C: Beijing, China, 2021.
  38. Mangat, P.S.; Grigoriadis, K.; Abubakri, S. Microwave curing parameters of in-situ concrete repairs. Constr. Build. Mater. 2016, 112, 856–866. [Google Scholar] [CrossRef]
  39. Wang, S.; Chen, F.; Yu, M.; Liu, T.; Zhu, J.; Yin, T.; Liu, K.; Yu, R. Exploring the effect of the micropore on the microstructure development of low water-cement ratio composite (LW/B-CC) subjected to microwave pre-curing. Constr. Build. Mater. 2024, 416, 135141. [Google Scholar] [CrossRef]
  40. Makul, N. Effect of low-pressure microwave-accelerated curing on the drying shrinkage and water permeability of Portland cement pastes. Case Stud. Constr. Mater. 2020, 13, e00358. [Google Scholar] [CrossRef]
  41. Monkman, S.; Kenward, P.A.; Dipple, G.; MacDonald, M.; Raudsepp, M. Activation of cement hydration with carbon dioxide. J. Sustain. Cem. Based Mater. 2018, 7, 160–181. [Google Scholar] [CrossRef]
  42. Wu, X.; Dong, J.; Tang, M. Microwave curing technique in concrete manufacture. Cem. Concr. Res. 1987, 17, 205–210. [Google Scholar] [CrossRef]
  43. Wang, M.; Hu, Y.; Wang, Q.; Tian, H.; Liu, D. A study on strength characteristics of concrete under variable temperature curing conditions in ultra-high geothermal tunnels. Constr. Build. Mater. 2019, 229, 116989. [Google Scholar] [CrossRef]
  44. Wang, J.; Li, H.; Ma, C.; Cai, C.; Wang, J. Effect of surface curing condition on the humidity field and moisture transfer in concrete. Constr. Build. Mater. 2024, 411, 134701. [Google Scholar] [CrossRef]
  45. Jerga, J. Physico-mechanical properties of carbonated concrete. Constr. Build. Mater. 2004, 18, 645–652. [Google Scholar] [CrossRef]
  46. Chen, K.-y.; Xia, J.; Wu, R.-j.; Shen, X.-y.; Chen, J.-j.; Zhao, Y.-x.; Jin, W.-l. An overview on the influence of various parameters on the fabrication and engineering properties of CO2-cured cement-based composites. J. Clean. Prod. 2022, 366, 132968. [Google Scholar] [CrossRef]
  47. Han, Y.; Park, K.-B.; Yang, B.; Wang, X.-Y. Optimizing and designing the effects of microwave pre-curing on the properties of ternary blended concrete with slag and fly ash using the simplex centroid method. Constr. Build. Mater. 2024, 419, 135443. [Google Scholar] [CrossRef]
  48. Makul, N.; Rattanadecho, P.; Agrawal, D.K. Applications of microwave energy in cement and concrete—A review. Renew. Sustain. Energy Rev. 2014, 37, 715–733. [Google Scholar] [CrossRef]
  49. Kong, Y.; Wang, P.; Liu, S.; Gao, Z. Hydration and microstructure of cement-based materials under microwave curing. Constr. Build. Mater. 2016, 114, 831–838. [Google Scholar] [CrossRef]
  50. Asamoto, S.; Murano, K.; Kurashige, I.; Nanayakkara, A. Effect of carbonate ions on delayed ettringite formation. Constr. Build. Mater. 2017, 147, 221–226. [Google Scholar] [CrossRef]
  51. Bahafid, S.; Ghabezloo, S.; Duc, M.; Faure, P.; Sulem, J. Effect of the hydration temperature on the microstructure of Class G cement: C-S-H composition and density. Cem. Concr. Res. 2017, 95, 270–281. [Google Scholar] [CrossRef]
  52. Jang, J.G.; Lee, H.K. Microstructural densification and CO2 uptake promoted by the carbonation curing of belite-rich Portland cement. Cem. Concr. Res. 2016, 82, 50–57. [Google Scholar] [CrossRef]
  53. Alarcon-Ruiz, L.; Platret, G.; Massieu, E.; Ehrlacher, A. The use of thermal analysis in assessing the effect of temperature on a cement paste. Cem. Concr. Res. 2005, 35, 609–613. [Google Scholar] [CrossRef]
  54. Morandeau, A.; Thiéry, M.; Dangla, P. Investigation of the carbonation mechanism of CH and C-S-H in terms of kinetics, microstructure changes and moisture properties. Cem. Concr. Res. 2014, 56, 153–170. [Google Scholar] [CrossRef]
  55. Xian, X.; Mahoutian, M.; Zhang, D.; Shao, Y. Development of wet-cast Portland-cement-free concrete based on steel slag and ambient-pressure carbonation activation. Resour. Conserv. Recycl. 2024, 203, 107455. [Google Scholar] [CrossRef]
  56. Xian, X.; Shao, Y. Microstructure of cement paste subject to ambient pressure carbonation curing. Constr. Build. Mater. 2021, 296, 123652. [Google Scholar] [CrossRef]
  57. Xian, X.; Mahoutian, M.; Zhang, S.; Shao, Y.; Zhang, D.; Liu, J. Converting industrial waste into a value-added cement material through ambient pressure carbonation. J. Environ. Manag. 2023, 325, 116603. [Google Scholar] [CrossRef] [PubMed]
  58. Mo, L.; Zhang, F.; Deng, M.; Jin, F.; Al-Tabbaa, A.; Wang, A. Accelerated carbonation and performance of concrete made with steel slag as binding materials and aggregates. Cem. Concr. Compos. 2017, 83, 138–145. [Google Scholar] [CrossRef]
  59. Kakali, G.; Tsivilis, S.; Aggeli, E.; Bati, M. Hydration products of C3A, C3S and Portland cement in the presence of CaCO3. Cem. Concr. Res. 2000, 30, 1073–1077. [Google Scholar] [CrossRef]
  60. Haga, K.; Shibata, M.; Hironaga, M.; Tanaka, S.; Nagasaki, S. Change in pore structure and composition of hardened cement paste during the process of dissolution. Cem. Concr. Res. 2005, 35, 943–950. [Google Scholar] [CrossRef]
  61. Guo, B.; Chu, G.; Yu, R.; Wang, Y.; Yu, Q.; Niu, D. Effects of sufficient carbonation on the strength and microstructure of CO2-cured concrete. J. Build. Eng. 2023, 76, 107311. [Google Scholar] [CrossRef]
  62. Zeng, H.; Liu, Z.; Wang, F. Effect of Accelerated Carbonation Curing on Mechanical Property and Microstructure of High Volume Steel Slag Mortar. Kuei Suan Jen Hsueh Pao/J. Chin. Ceram. Soc. 2020, 48, 1801–1807. [Google Scholar] [CrossRef]
  63. Cheng, H.; Zhang, X.; Song, H. Morphological Investigation of Calcium Carbonate during Ammonification-Carbonization Process of Low Concentration Calcium Solution. J. Nanomater. 2014, 2014, 503696. [Google Scholar] [CrossRef]
  64. Shah, V.; Scrivener, K.; Bhattacharjee, B.; Bishnoi, S. Changes in microstructure characteristics of cement paste on carbonation. Cem. Concr. Res. 2018, 109, 184–197. [Google Scholar] [CrossRef]
  65. Liu, Z.; Van den Heede, P.; Zhang, C.; Shi, X.; Wang, L.; Li, J.; Yao, Y.; Lothenbach, B.; De Belie, N. Carbonation of blast furnace slag concrete at different CO2 concentrations: Carbonation rate, phase assemblage, microstructure and thermodynamic modelling. Cem. Concr. Res. 2023, 169, 107161. [Google Scholar] [CrossRef]
  66. Han, X.; Wang, B.; Feng, J. Relationship between fractal feature and compressive strength of concrete based on MIP. Constr. Build. Mater. 2022, 322, 126504. [Google Scholar] [CrossRef]
  67. Fermani, S.; Njegić Džakula, B.; Reggi, M.; Falini, G.; Kralj, D. Effects of magnesium and temperature control on aragonite crystal aggregation and morphology. CrystEngComm 2017, 19, 2451–2455. [Google Scholar] [CrossRef]
  68. Shi, Z.; Lothenbach, B.; Geiker, M.R.; Kaufmann, J.; Leemann, A.; Ferreiro, S.; Skibsted, J. Experimental studies and thermodynamic modeling of the carbonation of Portland cement, metakaolin and limestone mortars. Cem. Concr. Res. 2016, 88, 60–72. [Google Scholar] [CrossRef]
  69. Wang, J.; Xu, H.; Xu, D.; Du, P.; Zhou, Z.; Yuan, L.; Cheng, X. Accelerated carbonation of hardened cement pastes: Influence of porosity. Constr. Build. Mater. 2019, 225, 159–169. [Google Scholar] [CrossRef]
Figure 1. Experimental flow chart.
Buildings 14 01074 g001
Figure 2. Compressive strength and moisture content of samples after different microwave pretreatment times.
Buildings 14 01074 g002
Figure 3. Compressive strength of samples after different microwave pretreatment and carbonation curing times.
Buildings 14 01074 g003
Figure 4. The increase of compressive strength caused by carbonation curing after different microwave pretreatment times.
Buildings 14 01074 g004
Figure 5. Photos of cement mortar specimens sprayed with phenolphthalein alcohol solution after different microwave pretreatment and carbonation curing times.
Buildings 14 01074 g005
Figure 6. CO2 absorptivity (α) of samples under different microwave pretreatment and carbonation curing time.
Buildings 14 01074 g006
Figure 7. Scatter plot of carbonated rate and CO2 absorptivity.
Buildings 14 01074 g007
Figure 8. Scatter plot of compressive strength and CO2 absorptivity.
Buildings 14 01074 g008
Figure 9. TG and DTG curves of uncarbonated specimen, interior of carbonated specimen, and surface of carbonated specimen.
Buildings 14 01074 g009
Figure 10. XRD patterns of specimens with (a) different microwave pretreatment times, (b) different specimen parts, (c) different carbonation curing times with microwave pretreatment for 1 h, and (d) different carbonation curing times with microwave pretreatment for 4 h.
Buildings 14 01074 g010
Figure 11. SEM images of (a) uncarbonated specimens; (b) carbonation interface; (c) fully carbonated specimens.
Buildings 14 01074 g011
Figure 12. Incremental and cumulative pore diameter distribution curves of fully carbonated and uncarbonated samples. (a) Incremental pore diameter distribution curves; (b) cumulative pore diameter distribution curves.
Buildings 14 01074 g012
Table 1. Chemical composition analysis of cement.
CompositionCaOSiO2Al2O3Fe2O3SO3MgOK2OTiO2Na2O
Mass fraction/%61.1620.895.294.322.592.881.210.360.30
Table 2. Carbonation depth of cement mortar specimen with different microwave pretreatment and carbonation curing times.
Carbonation Curing TimeMicrowave
Pretreatment for 0 h/mm
Microwave
Pretreatment for 1 h/mm
Microwave
Pretreatment for 2 h/mm
Microwave
Pretreatment for 3 h/mm
Microwave
Pretreatment for 4 h/mm
6 h1.572.983.653.964.34
12 h2.543.684.034.394.48
24 h3.533.864.625.966.28
36 h4.094.285.076.638.08
Disclaimer/Publisher’s Note: The statements, opinions and data contained in all publications are solely those of the individual author(s) and contributor(s) and not of MDPI and/or the editor(s). MDPI and/or the editor(s) disclaim responsibility for any injury to people or property resulting from any ideas, methods, instructions or products referred to in the content.