Article

Experimental Study on and Finite Element Analysis of the Axial Compression Bearing Capacity of a UHPC Transfer Device for Pre-Stressed Anti-Floating Anchor Rods

1
School of Civil Engineering, Hunan University of Science and Technology, Xiangtan 411100, China
2
School of Civil Engineering, Changsha University of Science and Technology, Changsha 410000, China
3
Hunan Hongxing Anti-Floatation Engineering Technology Co., Changsha 410000, China
*
Author to whom correspondence should be addressed.
Buildings 2024, 14(4), 1075; https://doi.org/10.3390/buildings14041075
Submission received: 1 March 2024 / Revised: 1 April 2024 / Accepted: 10 April 2024 / Published: 12 April 2024
(This article belongs to the Section Building Structures)

Abstract

:
A new UHPC pre-stress transfer device is proposed for pre-stressed anti-floating anchor rods. To investigate the axial compression performance of the device during pre-stressing, physical experiments and a finite element verification were conducted on four different types of full-scale device specimens. The changes in the axial displacements and ultimate bearing capacities under axial pressure for the different types of devices were analyzed. The results indicated that bending failures occurred in the upper plate portions of all the types of specimens, with transverse cracks appearing near the upper plate portions of the short columns. The axial compression ultimate bearing capacity of each specimen exceeded the design value. Among them, the axial compression ultimate bearing capacity of the HM18 device increased the most relative to its design value by 87%, while axial compression ultimate bearing capacity of the HM45 device increased the least relative to its design value by only 2%. The new UHPC transfer device exhibits good applicability in pre-stressed anti-floating anchor rods.

1. Introduction

In recent years, with the continuous development and utilization of urban underground spaces, the depths of building foundations have increased, leading to significant buoyancy effects from groundwater on structures. In cities with high groundwater levels, the issue of an anti-floating design becomes particularly crucial the structural self-weight alone cannot resist the buoyancy force exerted by groundwater. Compared to other anti-floating techniques such as dewatering and resisting uplift piles, anti-floating anchor rods offer advantages such as cost-effectiveness, strong adaptability to strata, and ease of construction, making them widely utilized in underground engineering [1,2,3]. According to the Technical Standard for Anti-floating Technology in Building Construction (JGJ476-2019, 2019) [4], for projects with design levels of Grade A and Grade B in anti-floating engineering, ordinary anti-floating anchor rods often fail to meet the requirements for crack control. Therefore, pre-stressed anti-floating anchor rods have emerged as the preferred choice to address this issue.
Applying pre-stress in anti-floating anchor rods inherently offers advantages in crack control. However, conventional pre-stressed anti-floating anchor rods are characterized by complex structures, high costs, intricate construction processes, and inherent quality risks, prompting the urgent need for a new pre-stressed anti-floating anchor rod that is safe, reliable, easy to construct, and economically feasible. Tan Guangyu et al. [5] introduced a fully post-tensioned, pre-stressed anti-floating anchor rod. This anchor rod incorporates a ductile iron pre-stress transfer device installed at its top, allowing pre-stressing tendons to be tensioned and locked on the pre-stress device. Utilizing unbonded steel strands, the tensile force is transmitted to the anchoring end plate and anchorages at the bottom of the anchor rod, ensuring uniform compression along the entire length of the anchor rod and effectively controlling cracking under the buoyancy force of water. The ductile iron transfer device used in this pre-stressed anti-floating anchor rod is costly and susceptible to imitation, making it challenging to protect intellectual property rights. Hence, there is a necessity to explore lower-cost materials to replace ductile iron as the pre-stress transfer device for anti-floating anchor rods.
Ultra-high-performance concrete (UHPC) [6], primarily composed of silica fume, cement, fine aggregates, and steel fibers, represents a novel concrete material renowned for its exceptional mechanical properties, durability, and environmental sustainability [7]. Widely adopted in various engineering projects across China in recent years, UHPC has garnered significant attention from both domestic and international scholars [8]. Extensive research efforts have been devoted to investigating various aspects of UHPC, including its compressive strength, tensile strength, toughness, elastic modulus, size effect, volume stability, and durability [9,10,11,12,13,14,15,16]. These studies have collectively indicated the maturity of UHPC manufacturing technologies, and they suggest its potential as a substitute material for ductile iron pre-stress transfer devices. However, a comprehensive analysis of its mechanical behavior under load is essential. Therefore, this study designed and fabricated four different types of UHPC pre-stress transfer device specimens, subjecting them to axial compression tests and a finite element analysis to explore the axial load mechanisms and ultimate bearing capacities of UHPC pre-stress transfer devices during pre-stressing.

2. Experimental Design

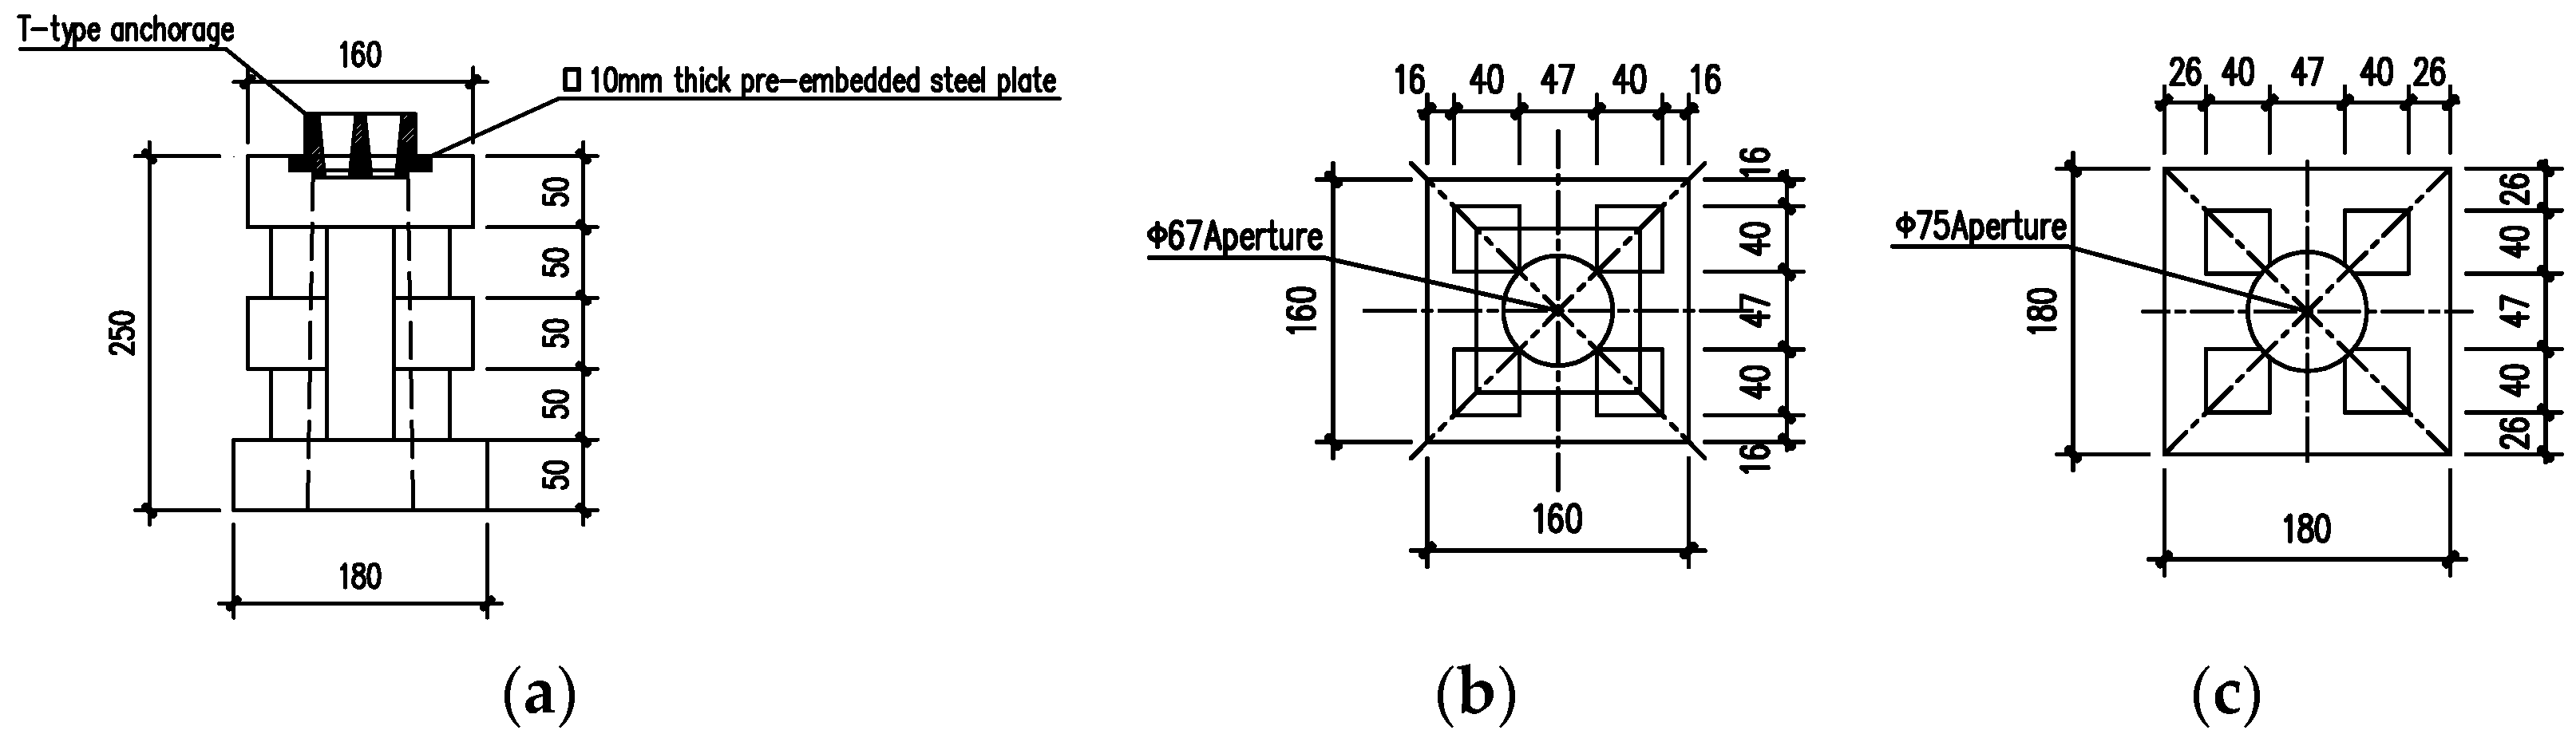
2.1. Experimental Design
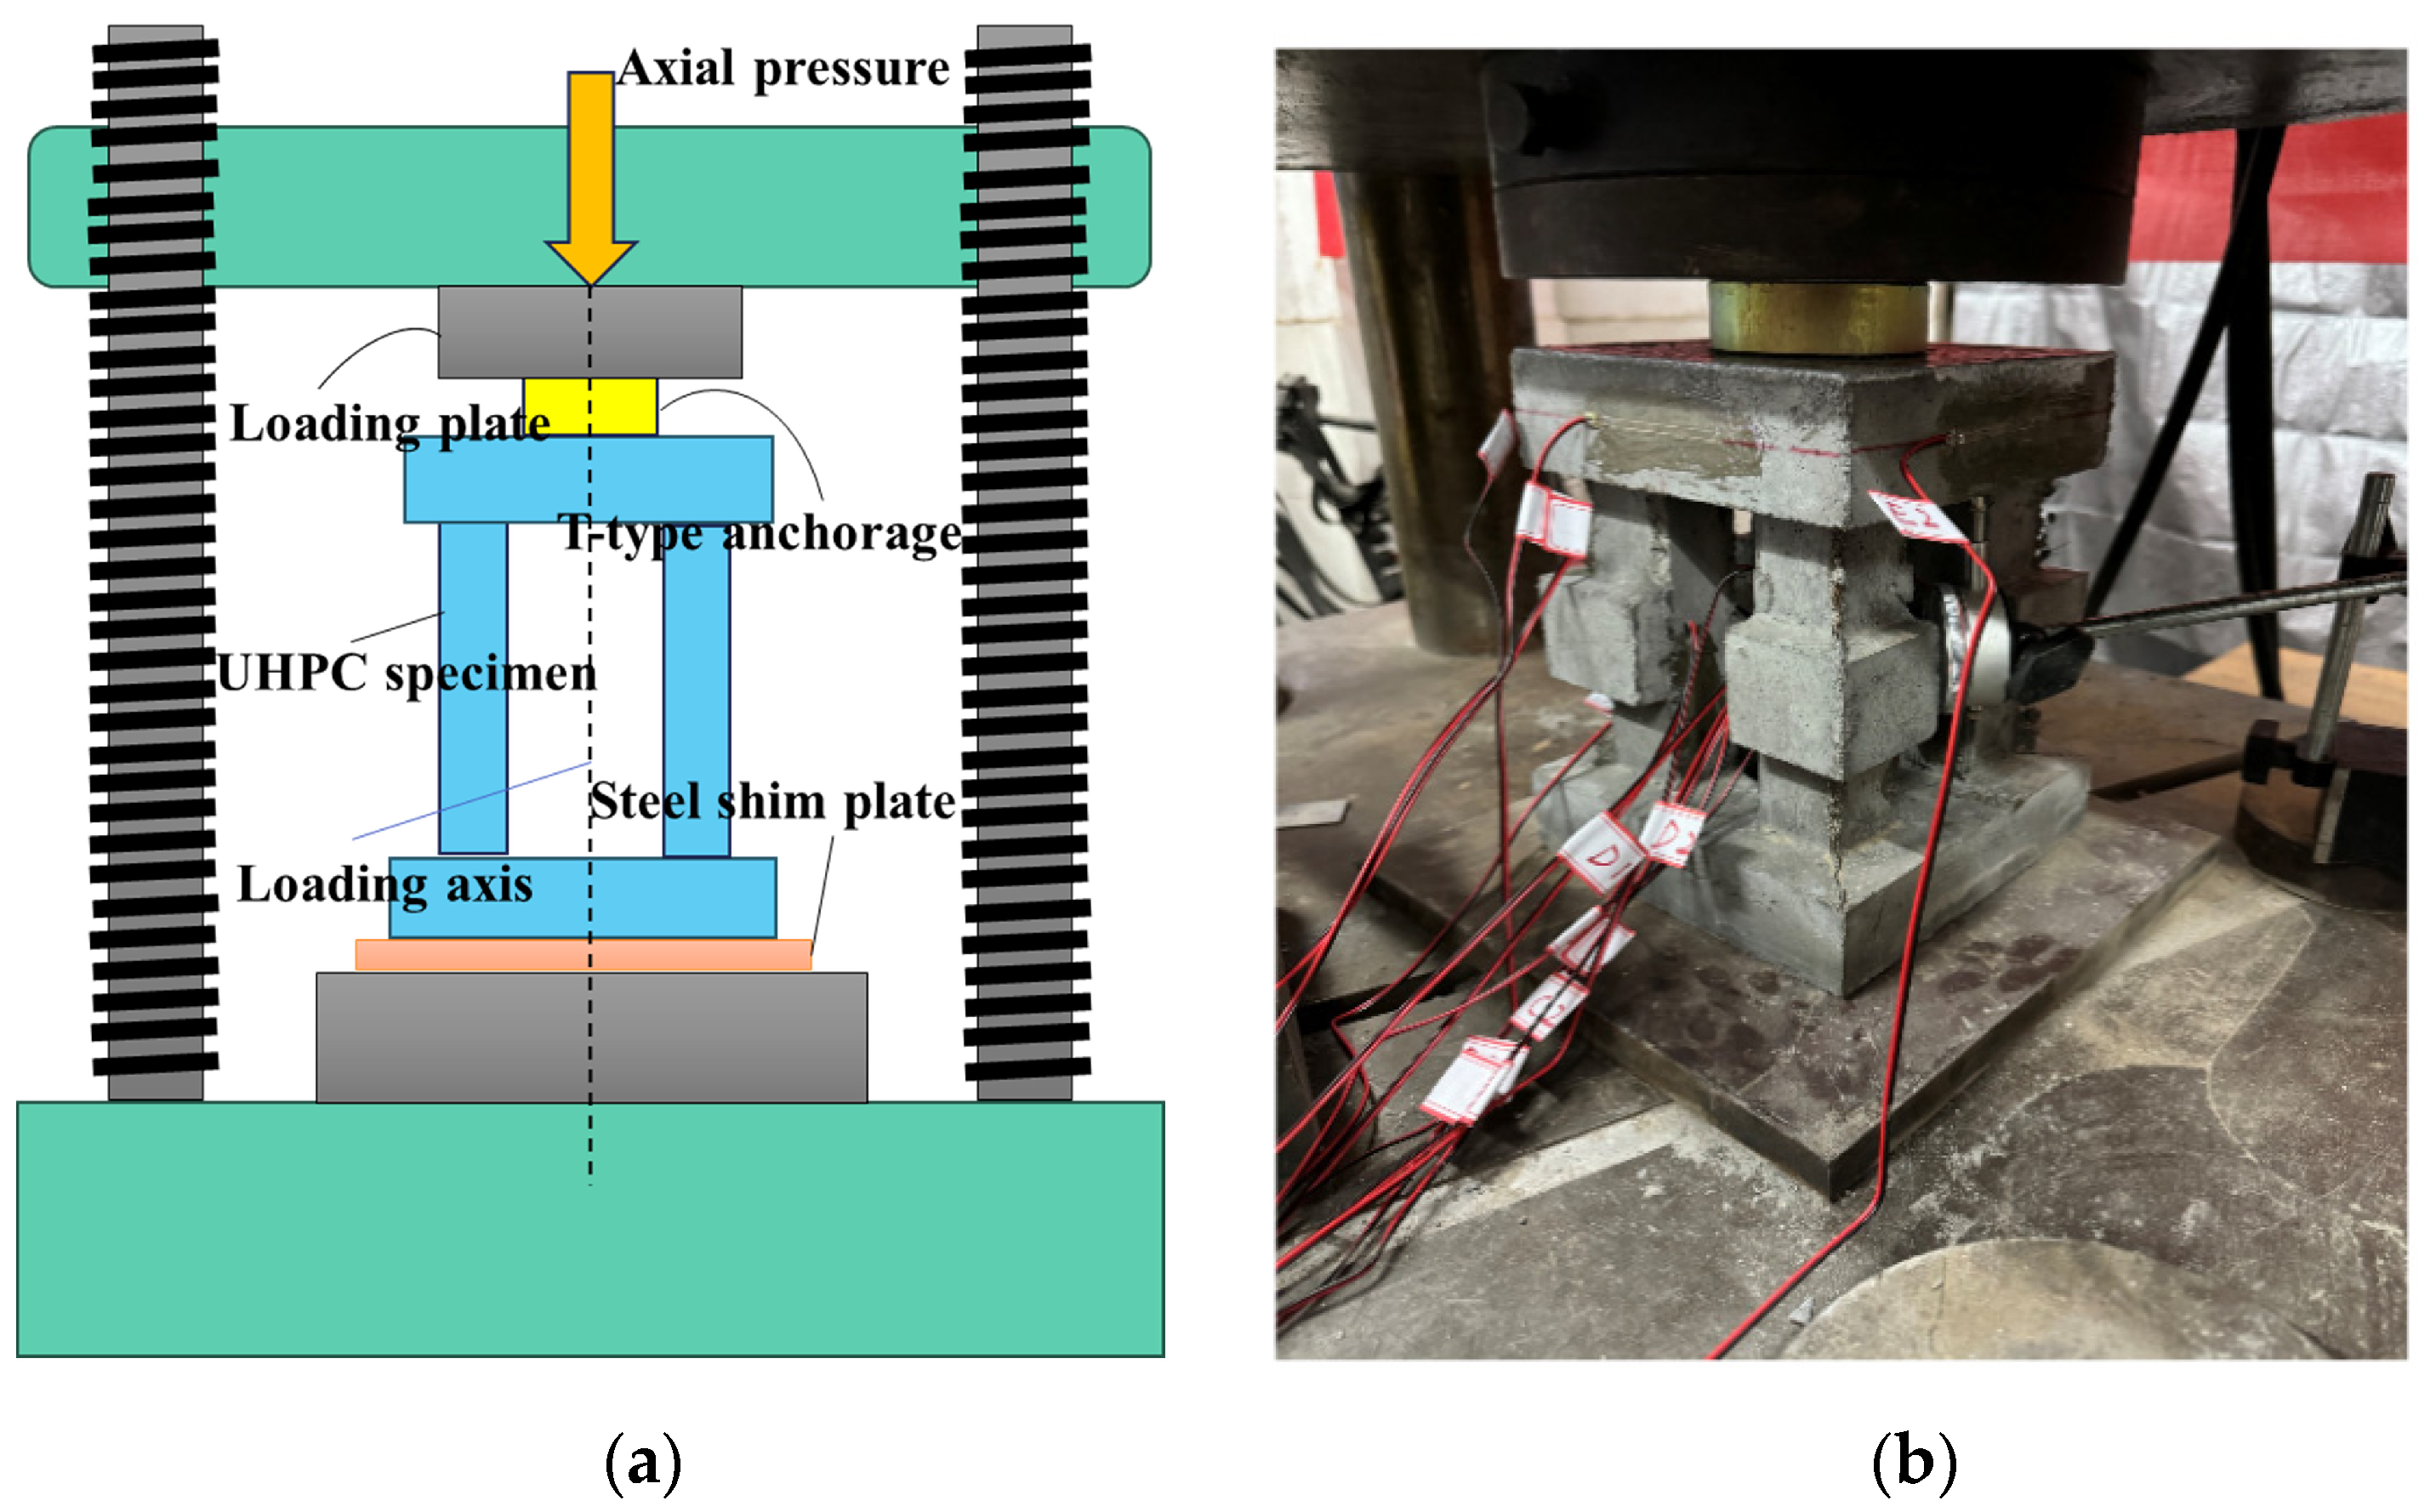
To meet the varied requirements of underground water buoyancy in engineering applications, this study designed and fabricated four different types of UHPC pre-stress transfer device specimens, all with a compressive strength of 120 MPa and a 3% volume fraction of steel fibers. These specimens were labeled as HM18, HM27, HM36, and HM45, respectively. Taking HM18 as an example, where “HM” represents the unified designation for the UHPC transfer device specimens and the number “18” signifies a design compressive bearing capacity of 180 kN, Figure 1 illustrates the shape and specific dimensions of this specimen. The entire transfer device consisted of an upper plate, a lower plate, and four short columns. Depending on the specific model, the plan dimensions of the upper plates ranged from 160 mm to 250 mm, the plan dimensions of the lower plates ranged from 180 mm to 280 mm, and the plan dimensions of the short columns ranged from 40 mm to 65 mm. The total heights of the specimens varied from 250 mm to 300 mm. Each specimen model was equipped with differently sized T-shaped anchors. To prevent localized failure during pre-stressing, square Q235 steel spacer plates with thicknesses of 10 mm were embedded within the hollow centers of the upper-plate anchors’ working ranges. The specific parameters for HM18 and the other models are detailed in Table 1.

2.2. Loading Scheme

The experiment was conducted at the Highway Engineering Testing Center of the Changsha University of Science and Technology, utilizing a 200-ton universal testing machine for axial compression static loading of the specimens. The pressure during the loading process was automatically recorded by a computer. Prior to formal loading, a pre-load equivalent to 10% of the estimated bearing capacity was applied to the specimens to ensure the proper functioning of the loading apparatus and measurement instruments. Displacement-controlled loading was employed, with a loading rate of 0.2 mm/min. Loading was halted when the specimens entered the descending portion of the load-displacement curve, where the rate of change in the load with the displacement slowed down. To prevent crushing of the bottoms of the specimens, a 10-mm-thick steel spacer plate was placed beneath the specimens’ bottom plates. The specific loading apparatus is depicted in Figure 2.

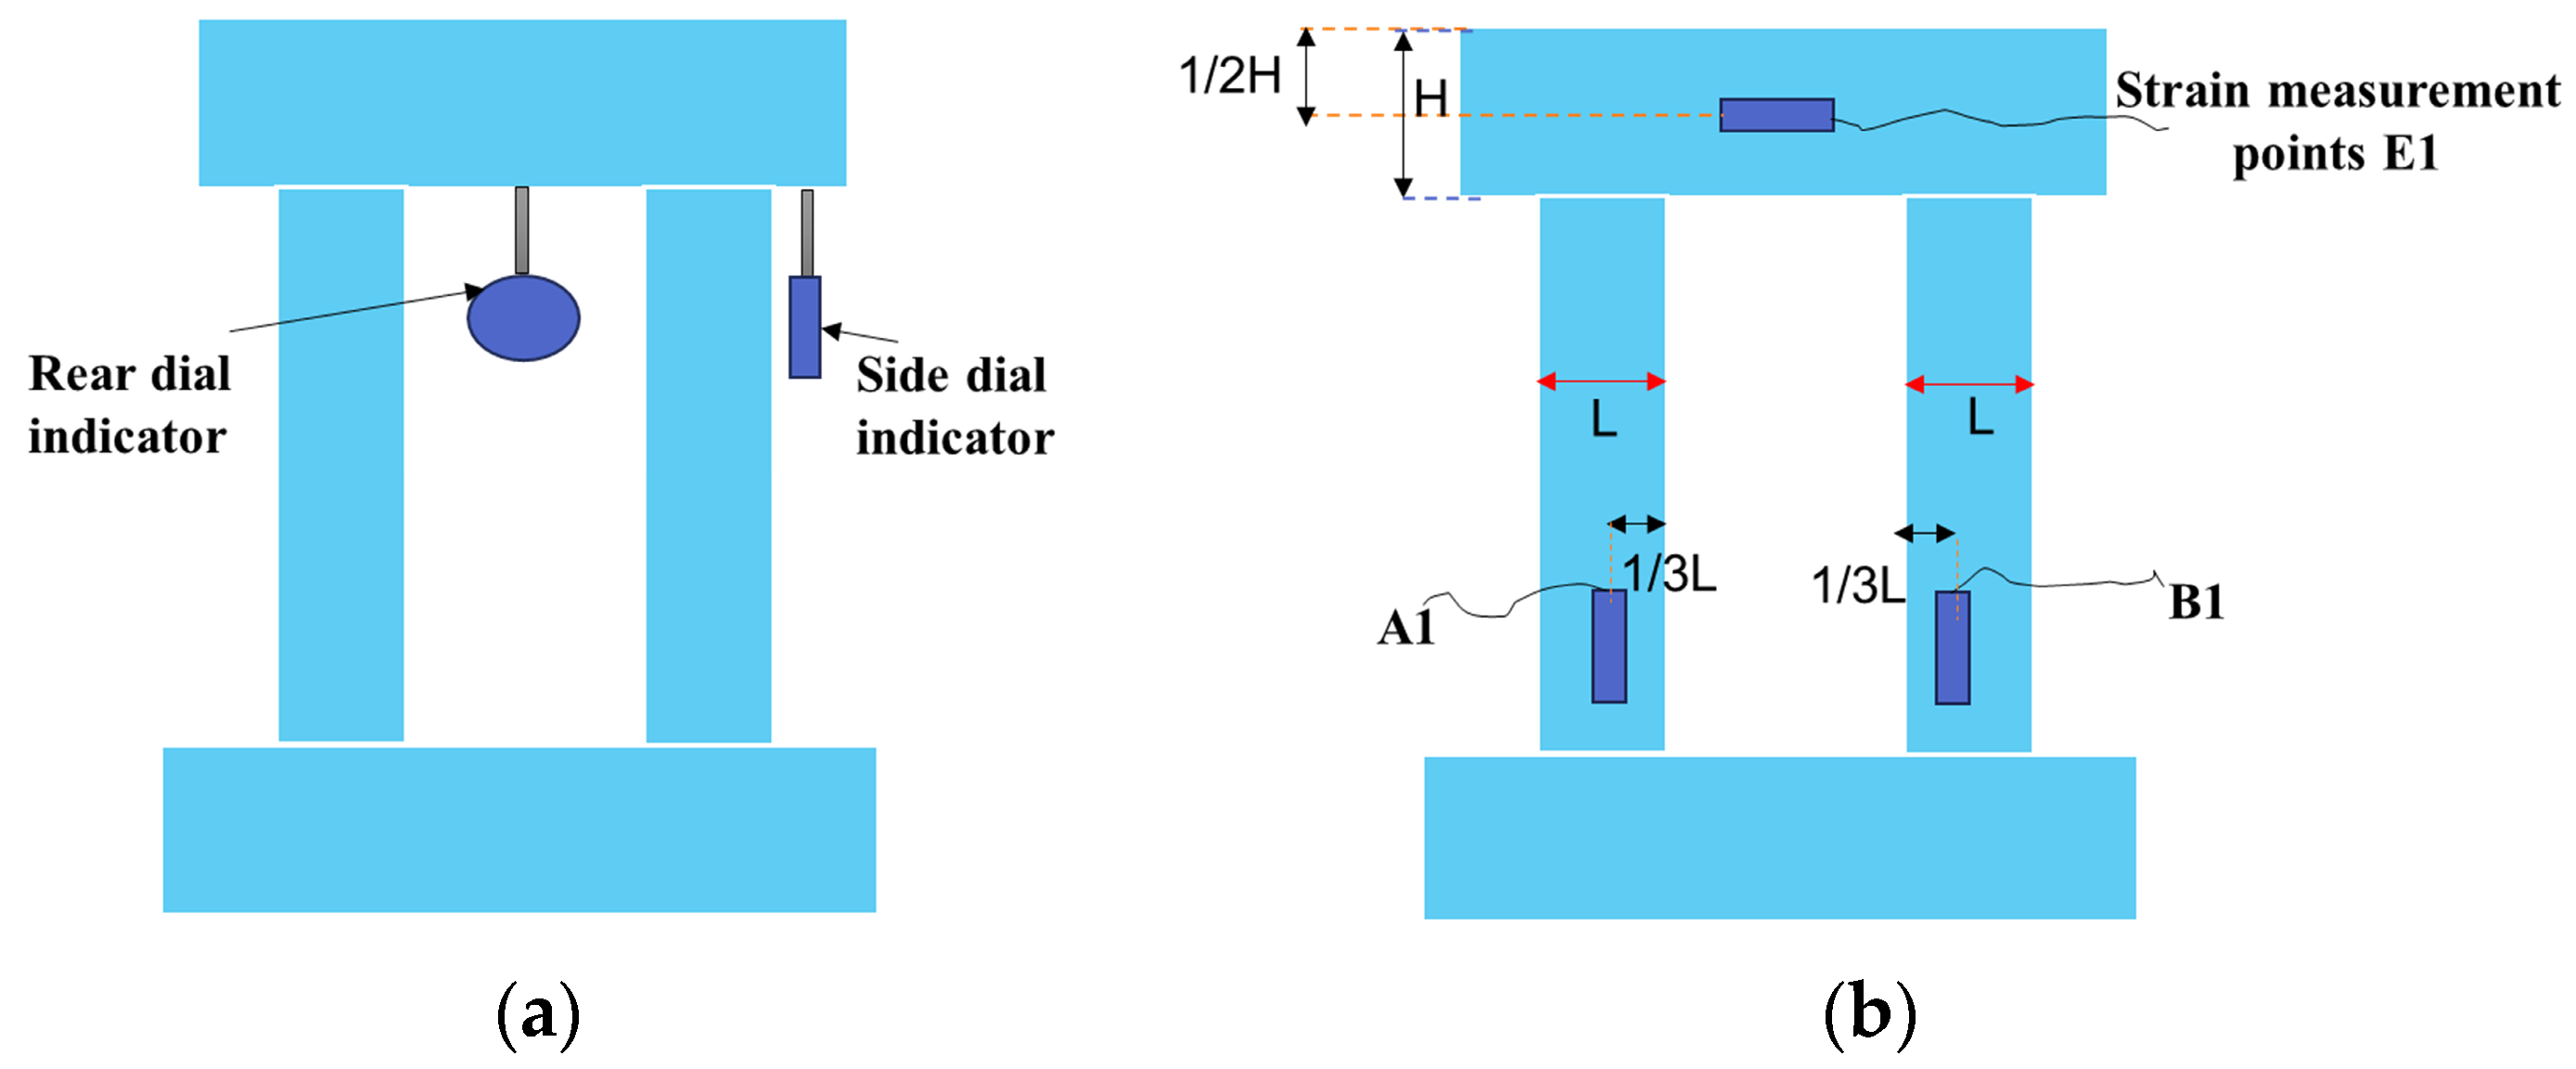
2.3. Strain Gauge Arrangement

Before officially conducting the experiments, finite element simulations were performed on the various specimen models. Stress contour maps and displacement contour maps were used to identify the locations within the specimens where stress and deformations were relatively significant. Therefore, when conducting the experiments officially, to enhance the measurement accuracy of the vertical displacement under the axial pressure for the UHPC transfer device specimens, dial indicators with an accuracy of 0.01 mm were positioned at the sides and rears of the upper plates of the specimens, halfway between each location. The average of the readings from the two dial indicators was taken as the vertical displacement result.
To measure the strain distribution of the UHPC transfer device specimens under axial pressure, strain gauges were strategically positioned as follows:
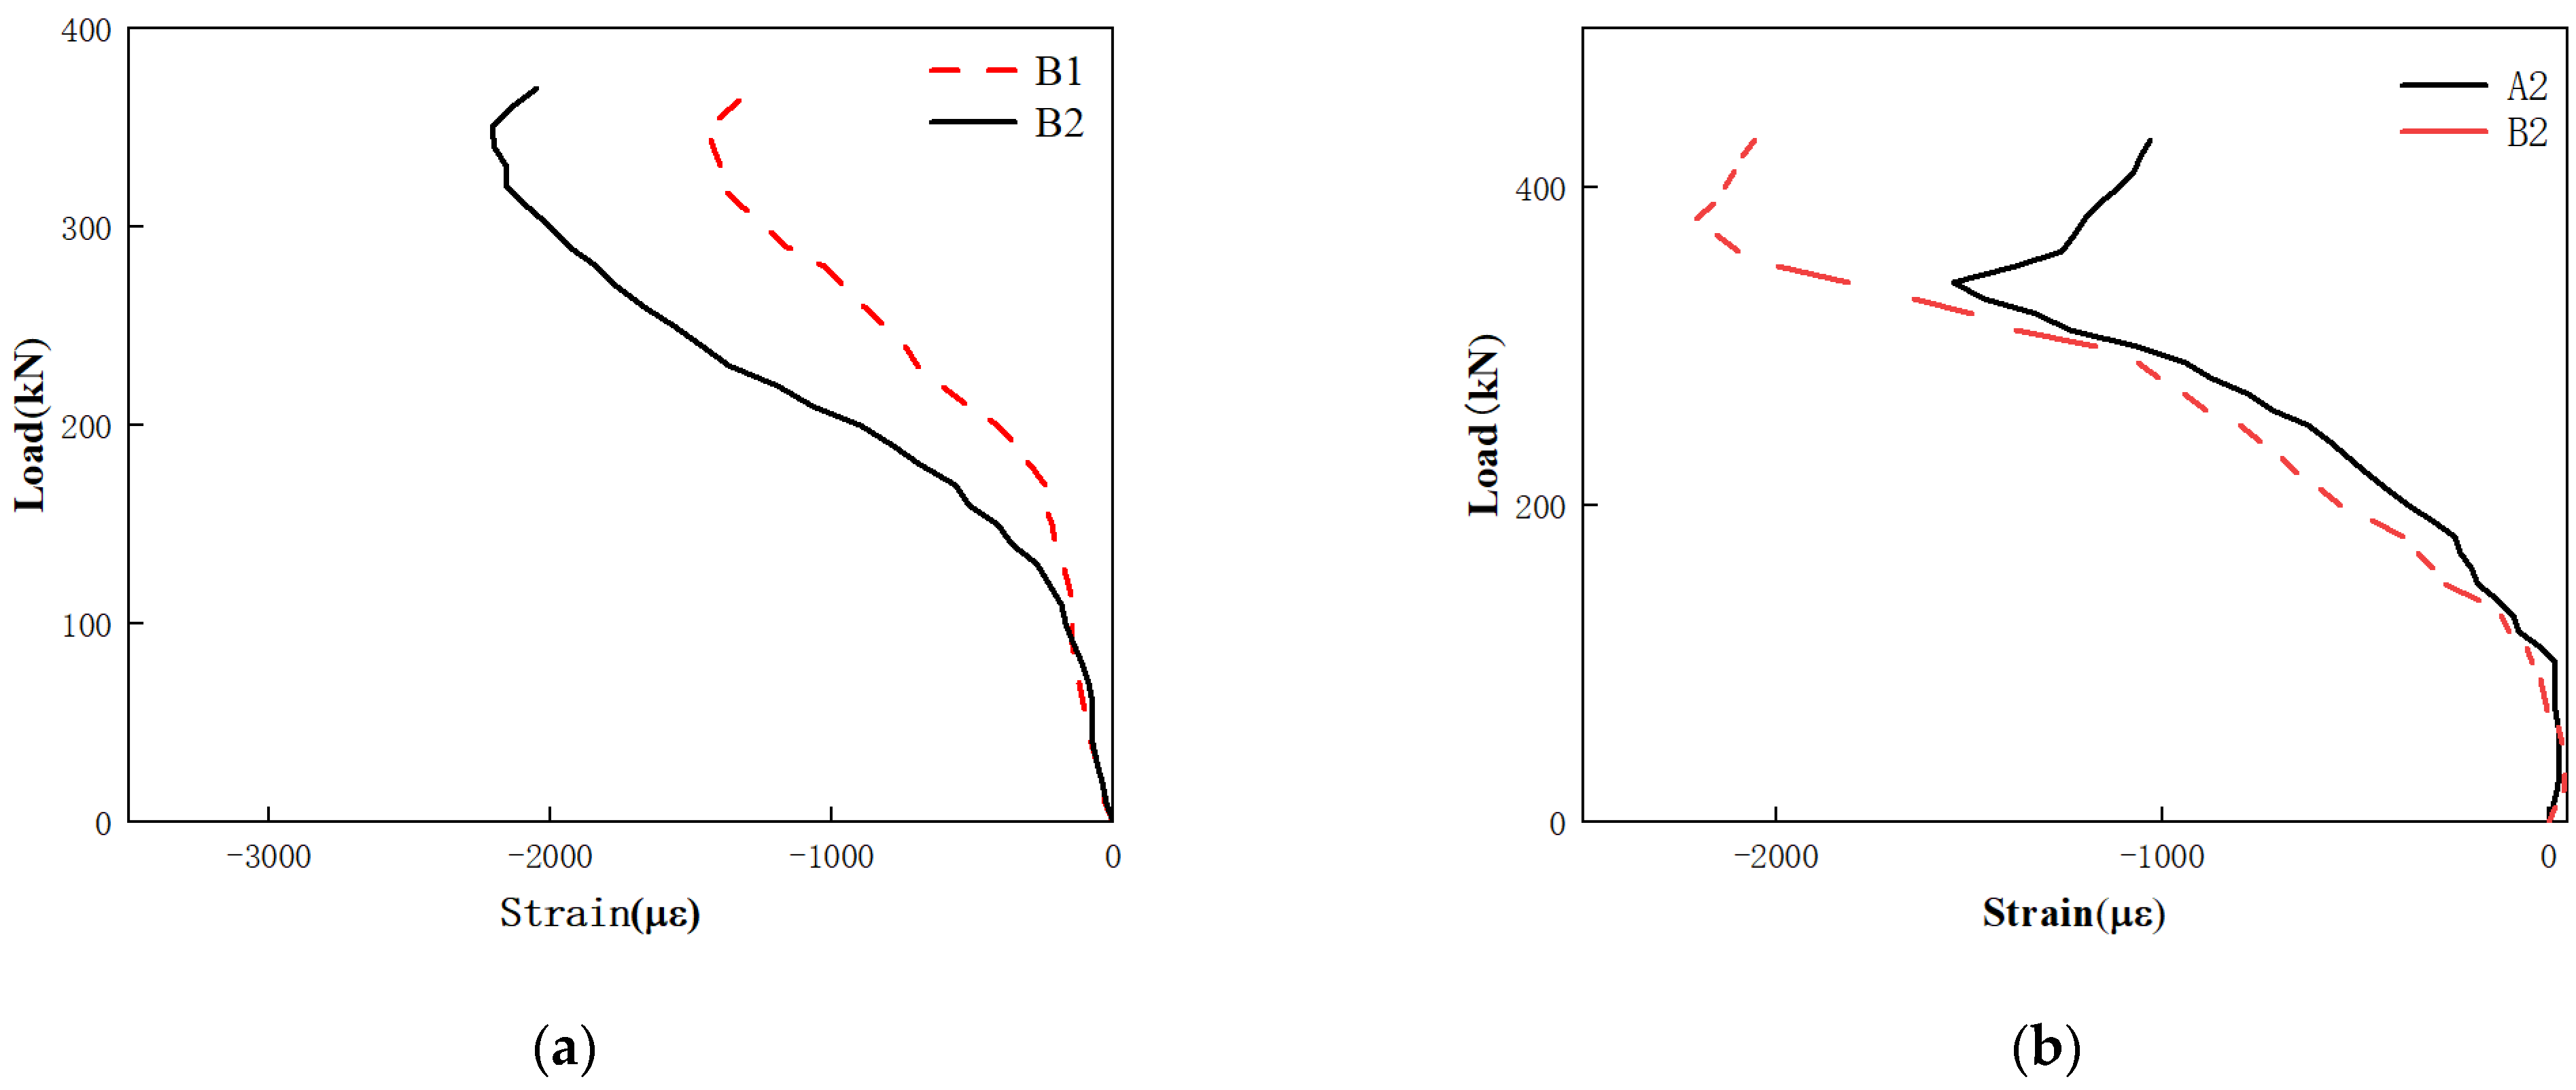
  • Transverse strain gauges were placed at the midpoints of the front faces of the upper plates of the specimens, representing position E1.
  • Longitudinal strain gauges were placed on both sides of the lower portions of the columns, near the inner edges. Two gauges were placed on each side of the lower portions of the columns.
For reference, let us designate the front face of the upper plate as position E1. Moving counterclockwise, three additional points (E2, E3, and E4) were placed on the upper plate’s front face. Correspondingly, on the inner sides of the lower portions of the columns, the first two gauges (A1 and A2) were positioned below the left side of the front face, followed by six additional gauges placed counterclockwise around the lower portions of the columns. Strain data were collected using a TDS-530 static strain testing system. For example, for the HM18 specimen model, the specific arrangement of dial indicators and strain gauges is illustrated in Figure 3.

3. Experimental Observations and Analysis

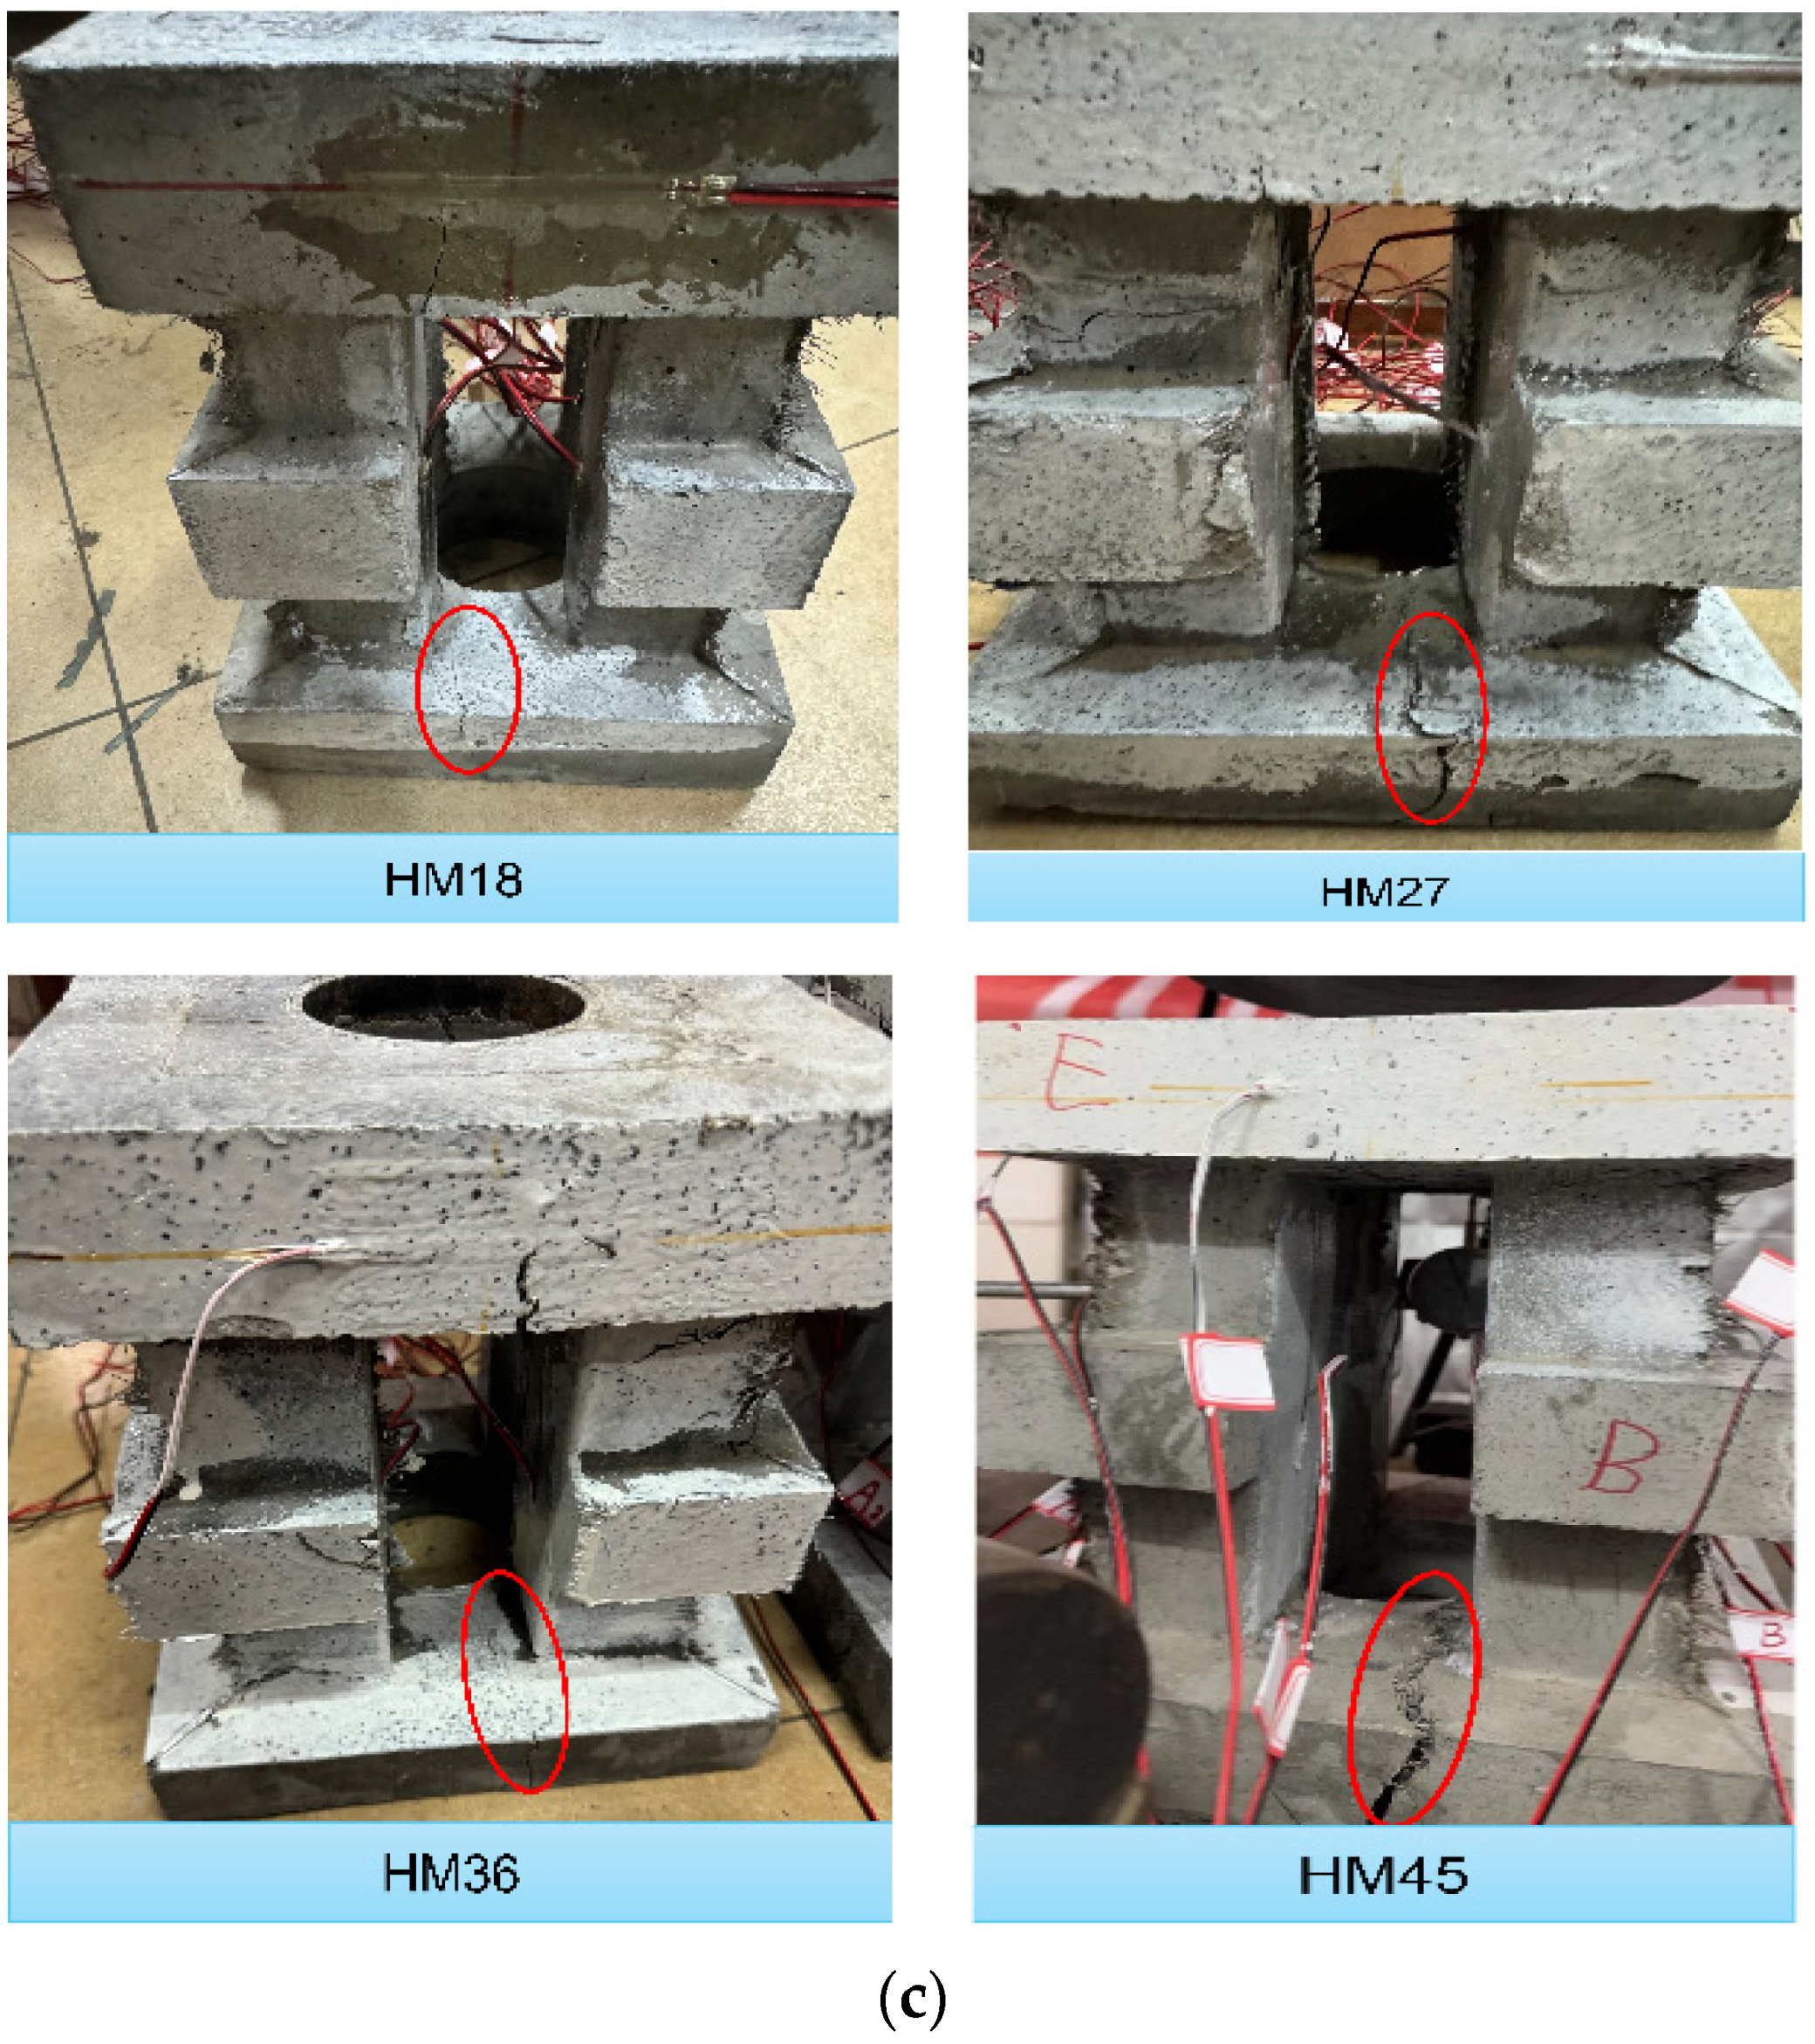
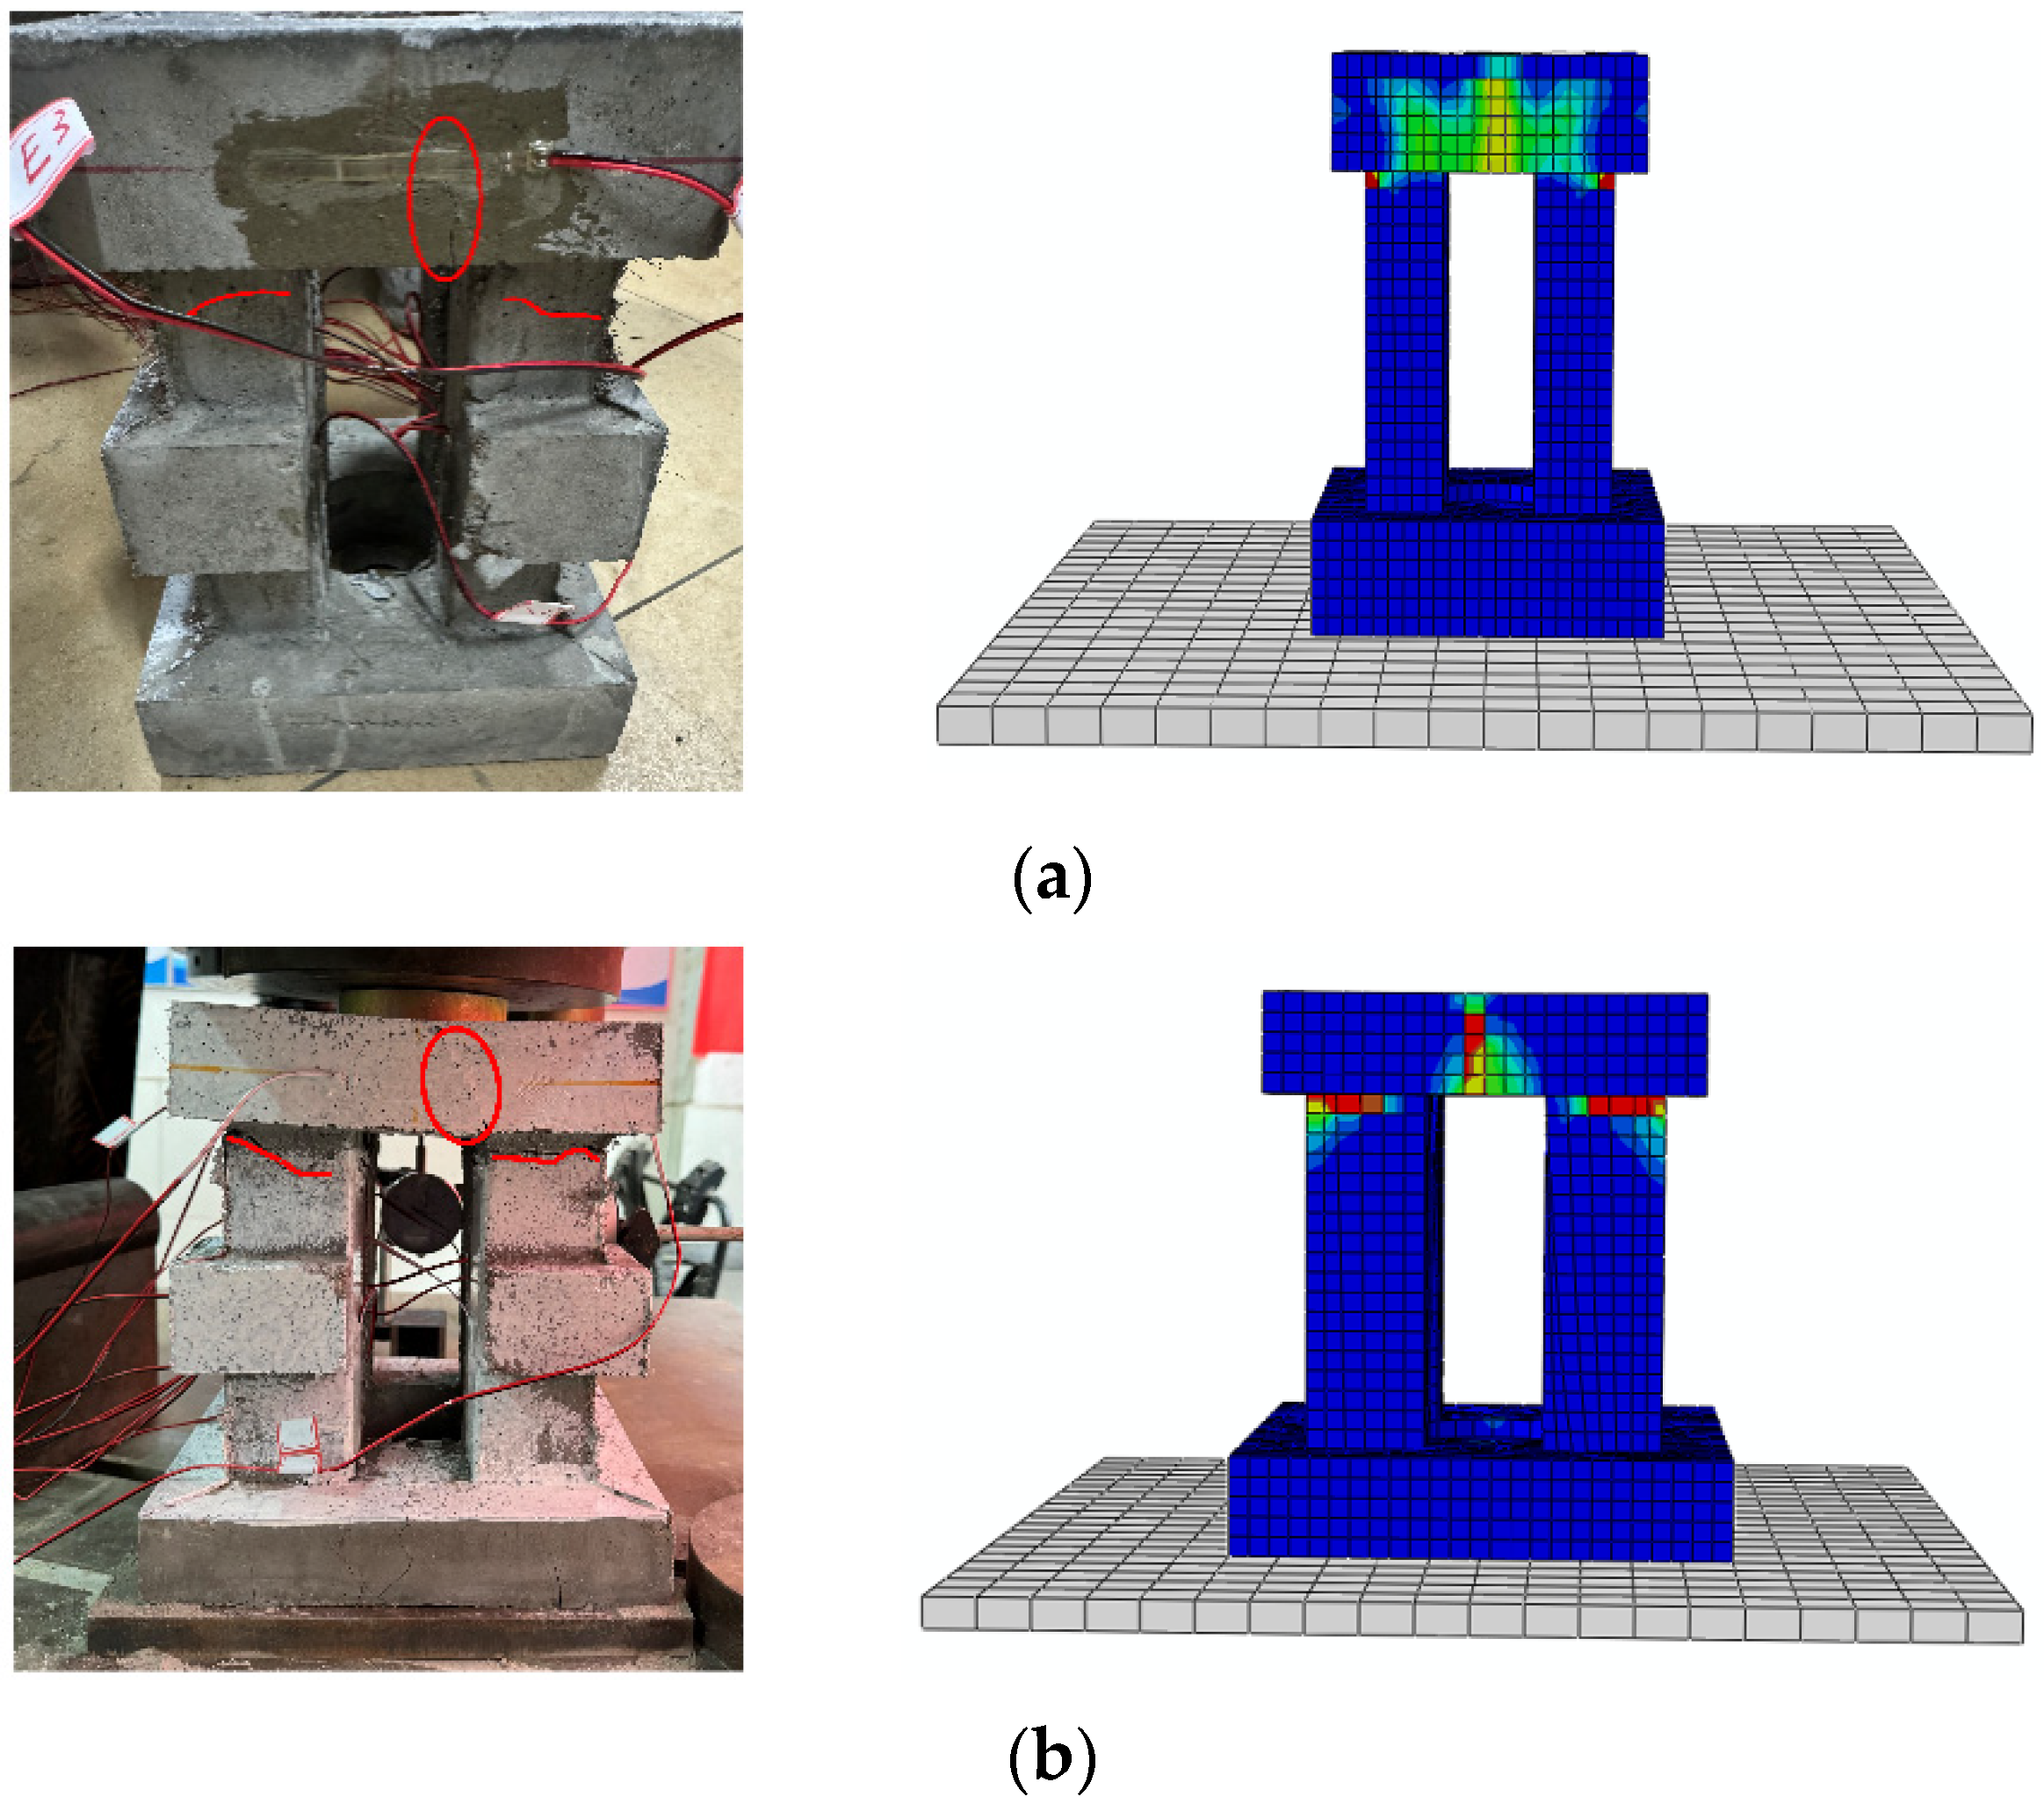
3.1. Failure Process and Characteristics

In the initial stages of the experiments, the axial load and vertical displacement increased proportionally, with minimal observable deformations in the specimens. As loading continued, with a slightly audible noise, the first microcracks appeared in the lower plate sections of the specimens, coinciding with a slight decrease in the load reading displayed by the universal testing machine after reaching the designated load. With further load increases, occasional internal noises were heard within the specimens, progressively growing louder, accompanied by the appearance of new cracks and enlargement of the existing crack gaps. As the loads approached their ultimate states, the displacement continued to increase while the rate of load increment slowed until a decrease occurred, indicating that the specimens had reached their ultimate bearing capacities. Figure 4 illustrates the final failure modes under axial pressure for the different models of the UHPC transfer device specimens. The observations revealed that the failures of the specimens predominantly manifested as flexural failures in the upper plates and oblique crushing in the short columns. Cracks originating from the undersides of the upper plates extended to approximately half of the front surfaces, while transverse cracks appeared near the connection points between the columns and the upper plates. Additionally, cracks propagated from the fronts towards the holes near the lower plates adjacent to the columns, ultimately leading to losses in load-bearing capacities. The failure modes of the specimens are depicted in Figure 4.
From Figure 4a, it can be observed that specimens of the four different models of the UHPC transfer devices experienced flexural failures at the half position of the upper plate. After analysis, we determined that the reason was that the part of the T-type anchorage embedded in the contact with the pre-embedded steel plate was ring-shaped. When the axial load was directly applied to the anchor by the universal testing machine, the force transmitted to the pre-embedded steel plate by the anchor was a ring-shaped axial pressure. Furthermore, since the upper plate was connected to the short columns on the lower surface, if each side of the upper plate was considered as a two-dimensional rectangular plane, it could be deduced that the upper edge of the rectangle experienced greater compressive stress. On the other hand, the lower edge of the rectangle, due to the constraint of the short columns, experienced greater tensile stress at the middle position between the short columns and the lower edge of the rectangle. This ultimately led to the appearance of the cracks on the positive surface of the upper plate at the half position. The specimens of the HM45 and HM36 models exhibited more obvious bending phenomena on their upper plates, while the failure modes of the HM18 model were less apparent compared to the other three models. By referencing the literature [17,18,19,20], we concluded that the reason for this was that large-sized UHPC specimens often have more internal pores and micro-cracks, with more initial defects compared to small-sized specimens, making them more susceptible to strength degradation. Therefore, the UHPC pre-stressed transfer devices of the HM45 and HM36 models were more prone to bending failures, and their cracks were also more prominent.
From Figure 4b, it can be observed that specimens of various models of the UHPC transfer devices exhibited transverse cracks near the upper ends of the short columns close to the upper plate positions. The failure modes of the short column sections were relatively consistent. The reason was that the upper and lower surfaces of the short columns were both square and not chamfered, resulting in localized stress concentrations at the connection positions between the short columns and the lower surfaces of the UHPC transfer devices’ upper plates. The locations of the stress concentrations were more prone to crack initiation. Furthermore, due to the bending failures of the upper plates of the UHPC transfer devices, the upper parts of the short columns bore a certain moment, and the bending deformations of the upper plates also resulted in uneven oblique loads on the upper parts of the short columns. This led to uneven stress distributions at the upper ends of the short columns, and combined with the above reasons, this tended to cause oblique compression failures in the upper sections of the short columns, resulting in transverse cracks developing from the inner sides to the outer sides of the short columns.
From Figure 4c, it can be observed that cracks at the lower plates of the various models of the UHPC transfer devices generally followed along the sides of certain columns, extending from the positive surfaces of the lower plates all the way to the circular holes. Our analysis suggested that as the axial loads were continuously applied, the loads were transmitted through the upper plates to the short columns. Due to the Poisson’s ratio, the short columns underwent lateral deformations when subjected to axial compression. Additionally, since all four short columns were constrained by the upper and lower plates, the lateral deformations of the short columns were constrained by the lateral deformations of the upper and lower plates. This led to lateral friction between the lower plates and the steel shims, resulting in significant tensile stress on the lower surfaces of the lower plates, causing cracks to propagate from the positive surfaces of the lower plates to the circular holes in the lower plates of the UHPC transfer devices. The crack morphology of the HM45 model of the UHPC transfer device was the most pronounced. This was because, during the preparation of the specimen, it was inherently more prone to having more pores due to its larger relative size, coupled with the inadequate surface finishing of its lower plate, leading to easier crack propagation.

3.2. The Load-Displacement Curves

The load-displacement curves for the four different types of specimens were generated based on the average readings obtained from two dial indicators as the vertical displacements of the specimens and the readings from the universal testing machine as the axial loads, as illustrated in Figure 5. The horizontal axis represents the average vertical displacement of the specimens under various levels of loading, while the vertical axis represents the axial loads applied during the loading process. Notably, the extremum points of each curve are annotated on the graph for reference.
From Figure 5, it can be observed that in the initial stages of the experiments, there were linear relationships between the loads and the displacements. Subsequently, after reaching approximately 70% to 90% of the ultimate bearing capacities, the slopes of the load-displacement curves decreased, indicating significant slowdowns in the rates of the load increments. Upon reaching the extremum points, the curves exhibited declining trends in loads while the displacements continued to increase. Table 2 presents the displacements and loads corresponding to the extremum points for the different types of specimens.
From Table 2, it is evident that compared to the designed ultimate bearing capacities of the UHPC transfer device specimens of different types, the ultimate bearing capacity of each type of specimen generally exceeded the design value. This was observed even when the design configurations were similar but the dimensions of the specimens varied. The ultimate bearing capacity of the HM45 specimen was 460 kN, exceeding the design value by 10 kN, representing a mere 2% increase. The HM36 specimen had an ultimate bearing capacity of 480 kN, surpassing the design value by 120 kN, indicating a 33% increase. The HM27 specimen exhibited an ultimate bearing capacity of 370 kN, exceeding the design value by 100 kN, showing a 37% increase. Finally, the HM18 specimen had an ultimate bearing capacity of 337 kN, surpassing the design value by 157 kN, representing an 87% increase.

3.3. Strain Analysis

In Figure 6, typical load-strain curves for the specimens are presented, with the strain gauge numbering corresponding to Figure 3. The upper plate sections experienced tensile cracking in the concrete, while the measurement points on the short columns were located in the compression zones. Concrete strain increases with increasing load; however, when the load reached approximately 75% to 90% of the ultimate bearing capacity, the strain values at the measurement points on some of the specimen columns began to decrease, indicating the unloading of the concrete strain. The maximum compressive strain values in the compression zones of the short columns for all four specimens were less than the concrete’s ultimate compressive strain of −3300 με.
From Figure 6, it can be observed that strain unloading occurred at some measuring points on the short columns of the specimens, and the times of the strain unloading at the different measuring points on the short columns of the same model specimen were relatively close. Referring to the research by Guandalini S. [21], a possible reason for the occurrence of strain unloading is that the upper ends of the short columns of the UHPC transfer devices were connected to the upper plates, and the tensile stress on the lower surfaces of the upper plates was significant, causing the short columns to experience local bending while under compression and leading to unloading and pressure reductions on the concrete surfaces of the short columns. As cracks continued to develop, the stress transfer paths changed, and factors such as damage to the concrete in the compressed areas of the short columns resulting in changes in the elastic moduli and possible stress redistributions may have contributed to the phenomenon of strain unloading.
Bending cracks appeared on the upper plates of all four specimens, extending from the circular holes near the bottoms of the plates to the front faces of the upper plates, with increases in load. The concrete’s tensile strain growth rate in the upper plate sections was relatively high, indicating a tendency for bending failures in these regions. This observation aligned well with the actual failure behaviors observed during the experiments.

4. Numerical Simulation Analysis

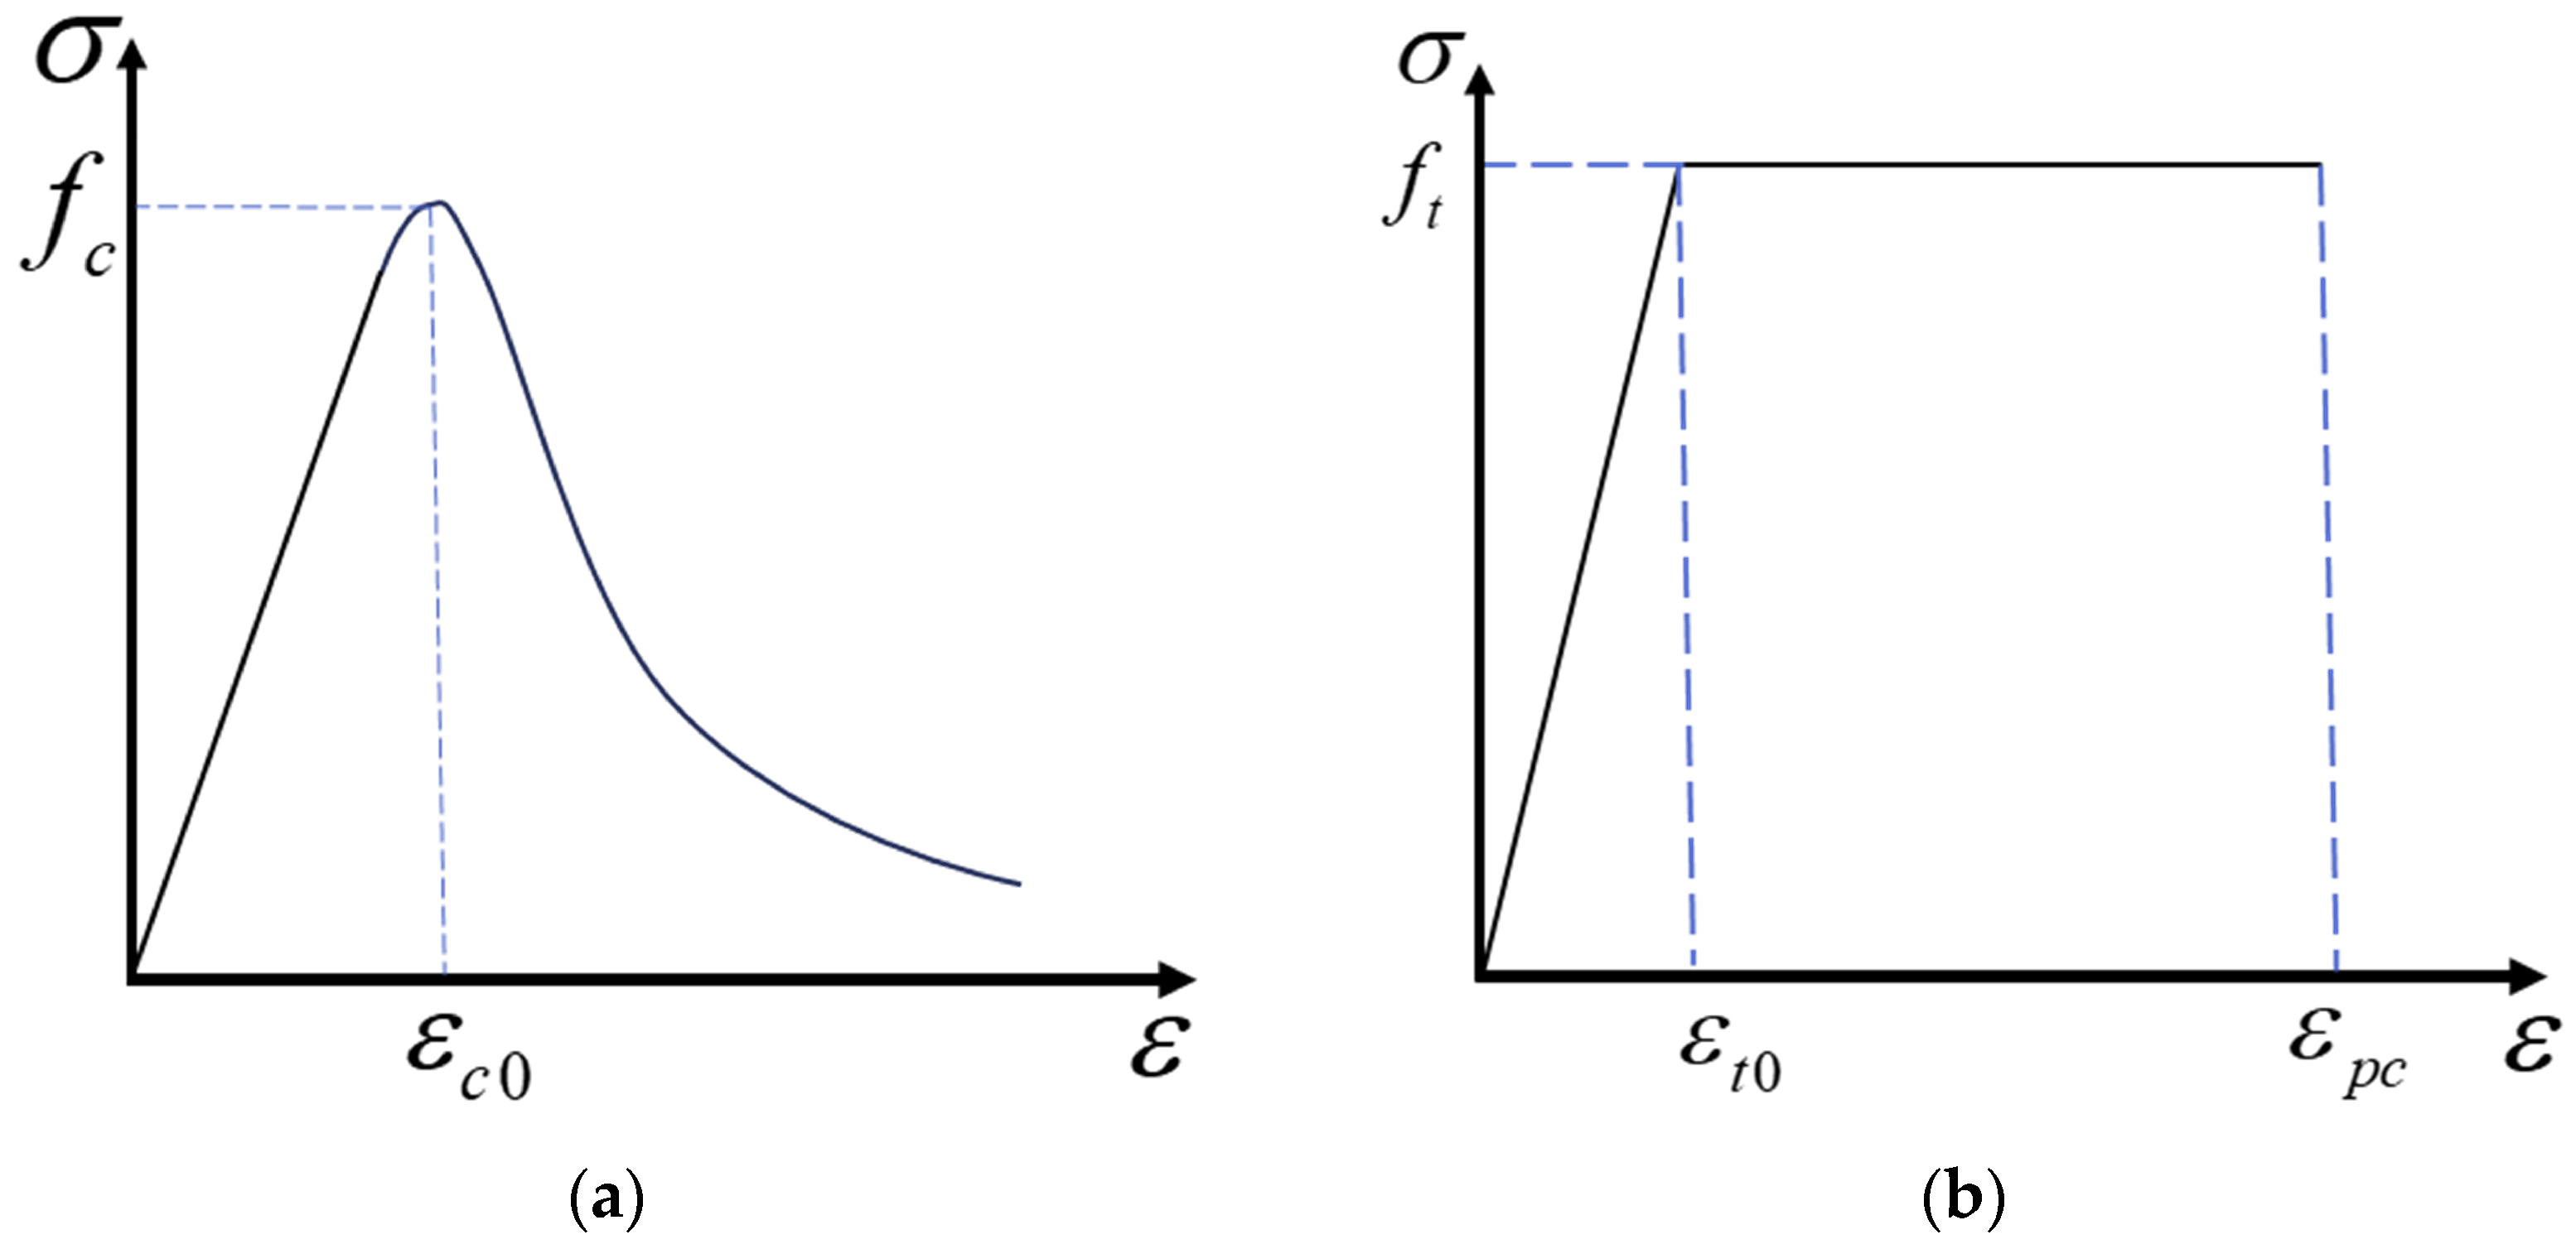
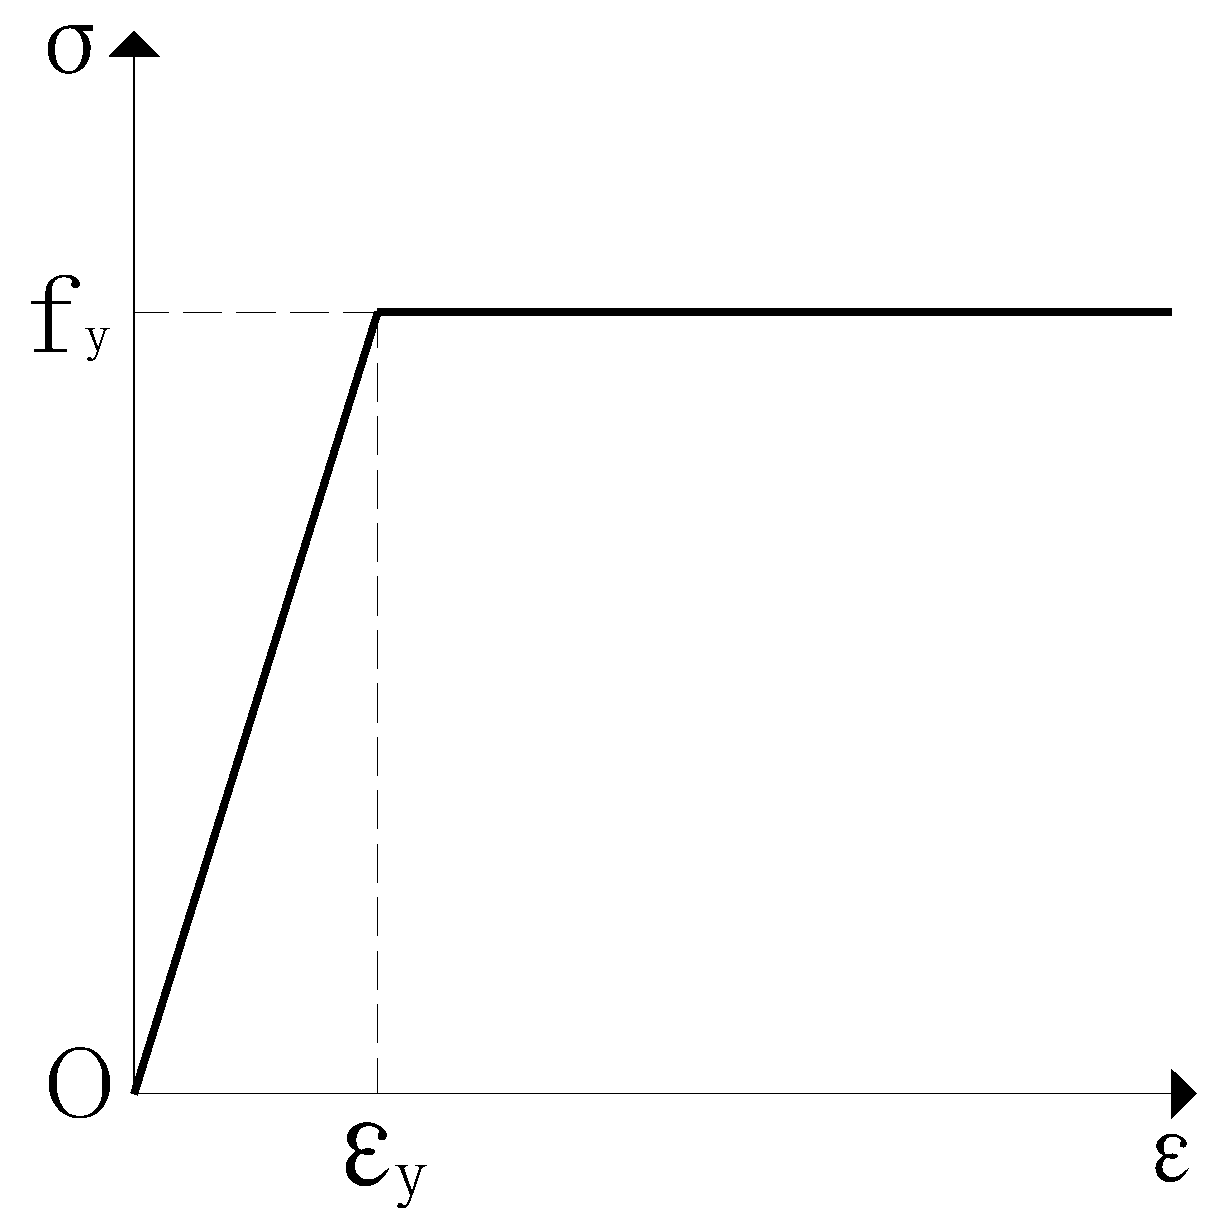
4.1. Material Constitutive Relationship

Numerous scholars, both domestically and internationally, have conducted extensive experiments on ultra-high-performance concrete (UHPC) materials. Based on these experiments, various constitutive models for the uniaxial compression of UHPC have been developed and applied in the material properties section of ABAQUS (6.14). In this study, the stress-strain relationship for UHPC under uniaxial compression in numerical simulations adopts the full curve model proposed in reference [22], as follows:
y = A x + ( 5 4 A ) x + ( 3 A 4 ) x ( 0 x 1 ) x α ( x 1 ) + x ( x 1 ) ,
where y = σ f , σ represents the compressive stress and f represents the compressive strength of the prismatic specimen, x = ε / ε , ε is the compressive strain and ε is the compressive strain at peak stress, and parameter A represents the ratio of the elastic modulus E at a zero point to the secant modulus E at a peak point. The authors determined from the experimental results that when A = 1.2 , the theoretical curve of the model fit well with the experimental results. For UHPC with a compressive strength of less than 150 MPa, the range of α should be within 6.0 α 10.0 .
Due to the inclusion of high-strength steel fibers in the UHPC, it exhibited strain-hardening characteristics under uniaxial tension. The steel fibers also provided the UHPC with good ductility and a good energy dissipation capacity under uniaxial tension. In this paper, the stress-strain relationship of the UHPC under uniaxial tension adopted a bilinear model, as proposed in reference [23], which effectively reflected the hardening behavior of the UHPC material as follows:
σ ( ε ) = f ε 0 < ε < ε f ε < ε < ε ,
where f represents the material’s tensile strength, ε denotes the initial cracking strain, and ε represents the ultimate strain.
Reference [24] and the ABAQUS user manual provide additional parameter values for UHPC in the material properties module of ABAQUS, as shown in Table 3 and Table 4.
The stress-strain relationship of the UHPC under uniaxial compression/tension introduced in this section could be used to derive the constitutive relationship curve of the UHPC, as shown in Figure 7.
The damage factor of the UHPC material was calculated using the Sidoroff energy equivalence principle. The peak strain of the UHPC material could be obtained using the calculation method in reference [25].
The Q235 steel used in the specimens is a type of carbon structural steel. The Carbon Structural Steels Standard (GB/T700-2006, 2006) [26] specifies its chemical composition, mechanical properties, and technical requirements. The physical properties of Q235 steel are provided in the Design Standard for Steel Structures (GB50017-2017, 2017) [27], as shown in Table 5. The stress-strain curve of the Q235 material generally consists of the following five stages: elastic stage, elastic-plastic stage, plastic stage, strengthening stage, and secondary plastic flow stage. For computational convenience, the isotropic hardening ideal plasticity model for steel was adopted, with the Von Mises criterion used as the yield criterion. The expression for the stress-strain curve is given by Formula (3), and the stress-strain curve is depicted in Figure 8, as follows:
σ = E ε 0 ε ε f ε > ε ,
where σ represents the compressive stress of the steel material at the tensile strain ε when E is the elastic modulus of the steel, f is the measured uniaxial tensile strength of the steel material, and ε is the yield strain of the steel when the tensile stress reaches f .

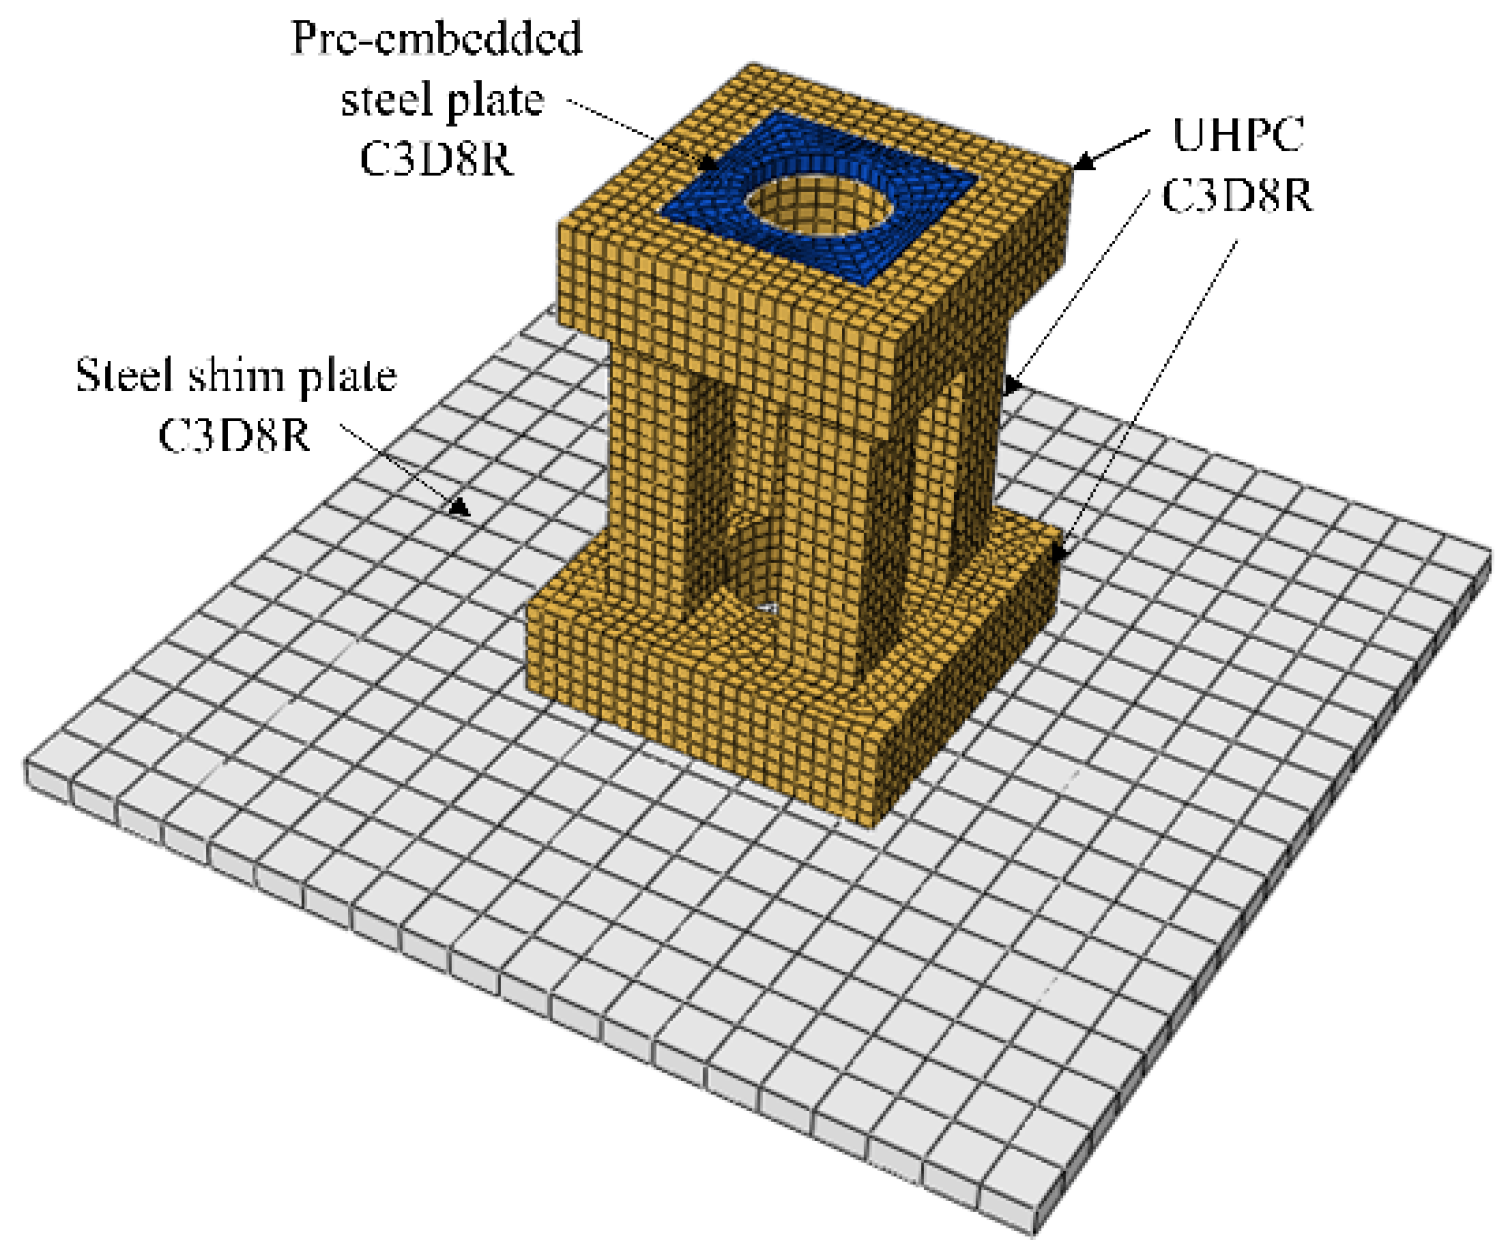
4.2. Selection of Element Type

In this study, solid elements were used to simulate the UHPC and Q235 steel plates in the model. According to the description in the ABAQUS Super User’s Manual, using hexahedral elements does not affect calculation accuracy, and they are the most cost-effective compared to tetrahedral and wedge elements. Therefore, hexahedral solid elements were used in this study. The ABAQUS (6.14) software provides several types of solid elements, including fully integrated elements, linear (fully integrated) elements, quadratic (fully integrated) elements, reduced integration elements, modified elements, non-conforming mode elements, and hybrid elements. Among them, the most commonly used element types are C3D8R, C3D20R, C3D8, and C3D20. C3D20 and C3D20R are second-order solid elements. Although they provide accurate stress calculations, they are commonly used for solving concentrated load problems and are not suitable for contact analyses. C3D8, as a lower-order solid element, is prone to shear-locking phenomena when subjected to fully integrated and bending loads, leading to an overestimation of material bending strength and a decrease in bending deformation. On the other hand, C3D8R, as a reduced integration element, provides accurate displacement solutions and is less prone to shear-locking phenomena. It is suitable for complex stress (contact) analyses, and its accuracy is not significantly affected when the mesh undergoes large deformations. Although hourglassing issues (zero energy) may occur during usage, they can be resolved by refining the mesh. Generally, when the ratio of hourglass energy to internal energy does not exceed 5%, the calculation results are reasonably accurate [28]. Based on the above considerations, C3D8R was selected as the solid element to establish the model in this study.

4.3. Mesh Generation

Mesh partitioning has a significant impact on the accuracy and convergence of a finite element analysis. Generally, a finer mesh leads to more accurate results, but excessively fine meshing increases computational costs significantly and hampers the efficiency of an analysis, which is not conducive to scientific research. Typically, hexahedral meshes are preferred for three-dimensional solid elements as they are more organized and aesthetically pleasing compared to tetrahedral meshes, and they also improve computational convergence. In this study, the UHPC section was divided into 10 mm elements, the Q235 steel plate section into 6 mm elements, and the steel cushion plate into 15 mm elements, based on the global dimensions. The finite element model is illustrated in Figure 9.

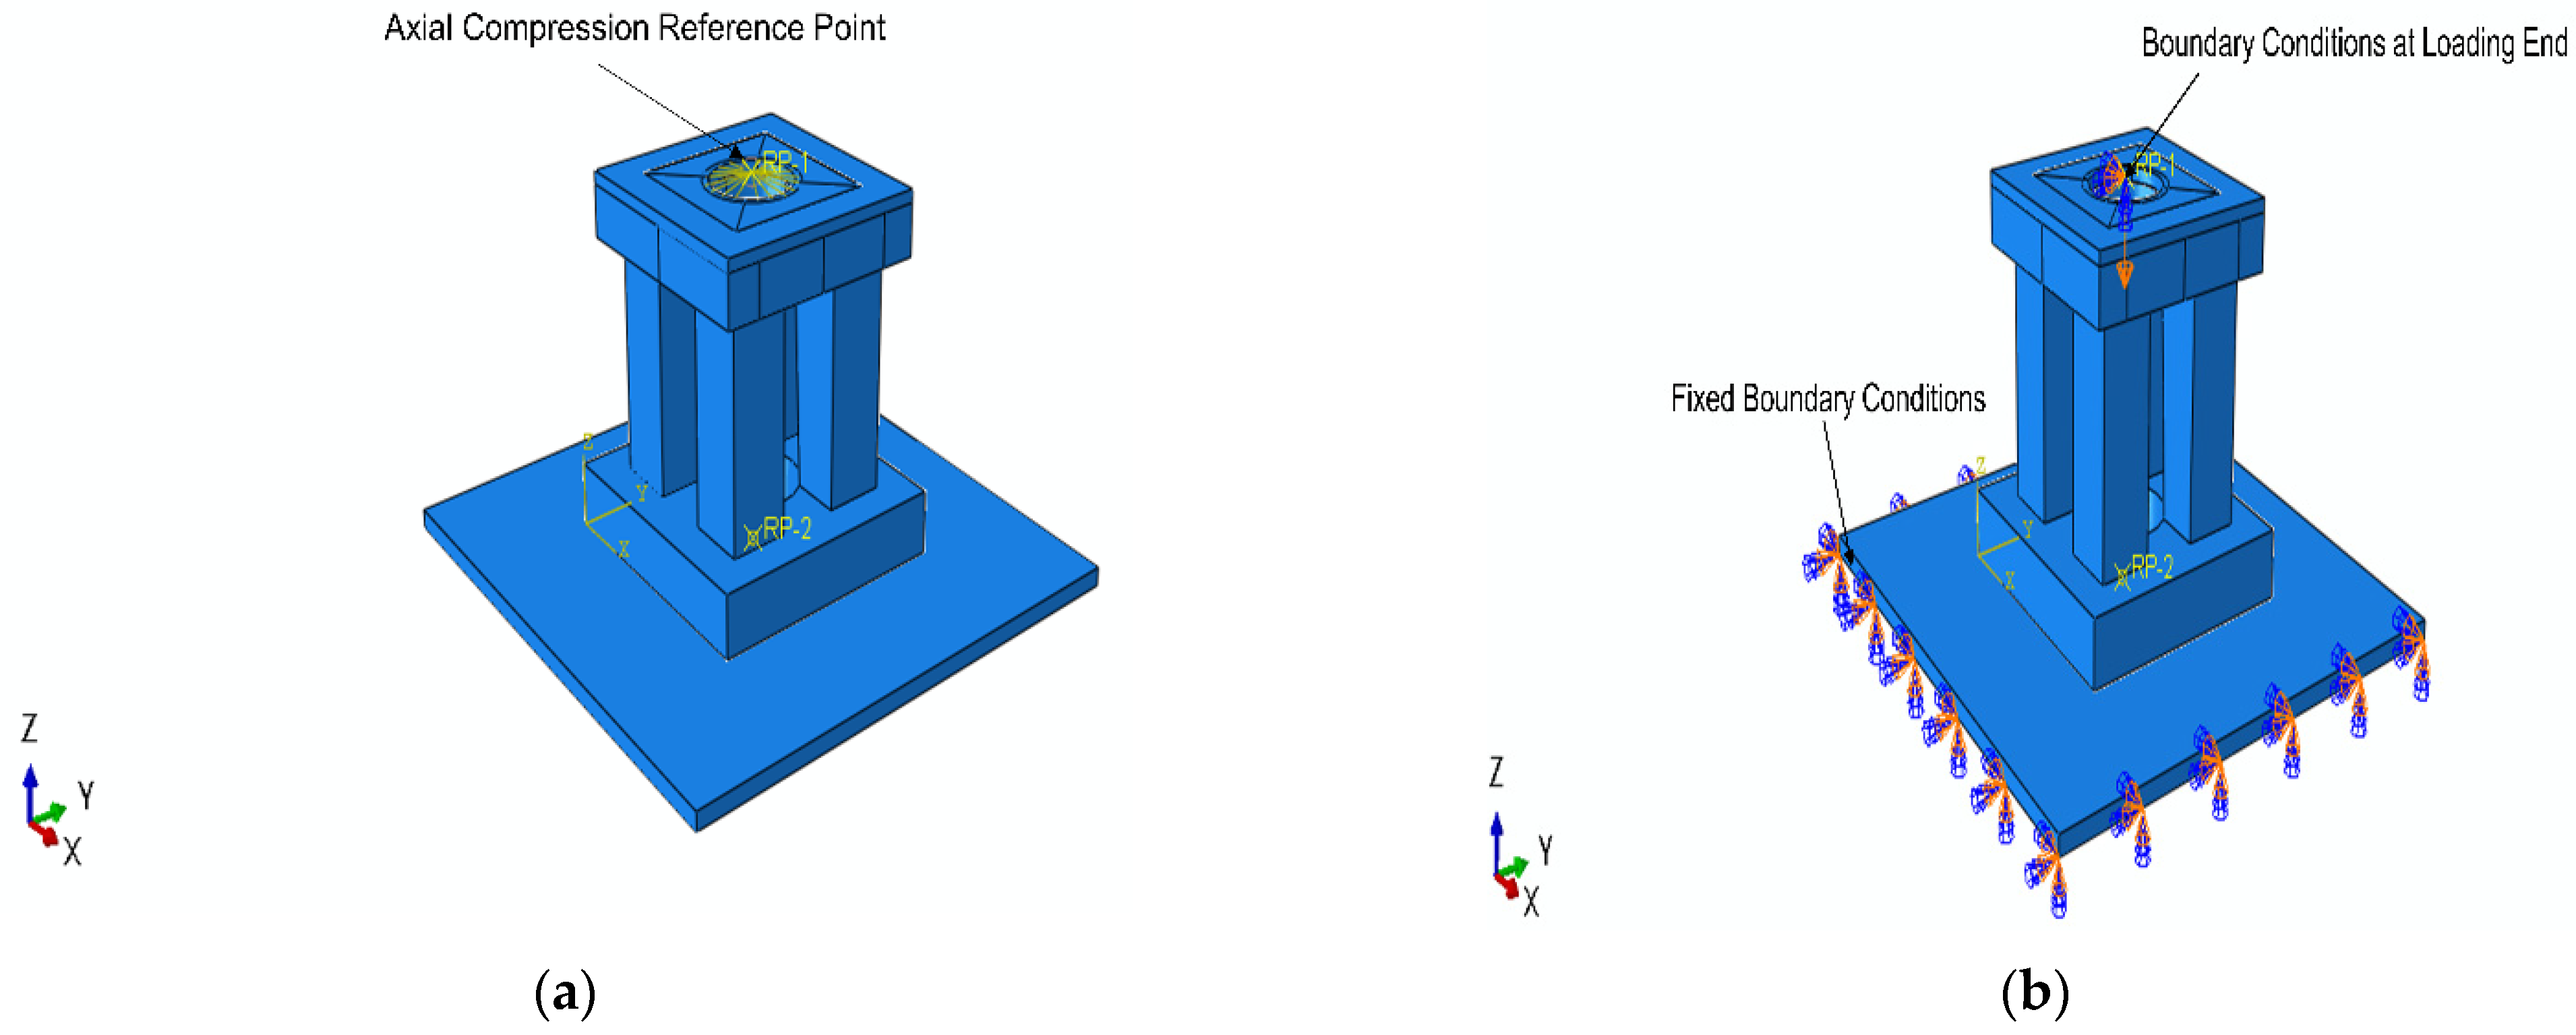
4.4. Interactions and Boundary Conditions

The study utilized the assembly module in the software to assemble the various components into a whole. Subsequently, the Interaction (Assembly) module was used to define the interactions and constraints among the different parts, primarily focusing on defining the embedding of the UHPC, Q235 steel plates, and steel cushion plate below the model. The finite element model of the HM18 type was taken, as shown in Figure 10. The UHPC section, the embedded steel plate, and the steel cushion plate were all simulated using solid element C3D8R. Considering that the embedded steel plate in the actual experiment was cast together with the UHPC and there was friction between them, the part where the embedded steel plate contacted with the UHPC was set as a face-to-face contact. The normal behavior was defined as hard contact, while the tangential behavior used a penalty function with a friction coefficient of 0.45. To facilitate the application of the displacement loads, reference points were established above the circular holes on the model and coupling constraints were applied. To mimic the experimental process as closely as possible, a face-to-face contact was also set between the bottom surface of the specimen and the steel cushion plate, with contact properties consistent with those of the embedded steel plate and the UHPC contact. Complete fixed constraints were applied to the bottom surface of the steel cushion plate, constraining all degrees of freedom (U1, U2, U3, UR1, UR2, and UR3). Only the U3 direction degree of freedom was released for the reference points on the top plate, and axial loads were applied. The actual model’s boundary conditions and loading are depicted in Figure 10.

4.5. Finite Element Verification

To validate the accuracy of the finite element model, the results obtained from the simulation were compared with the experimental data. A comparison between the experimental and finite element simulation results regarding the failure modes of the typical specimens is illustrated in Figure 11.
From Figure 11, it can be observed that the failure mode predicted by the finite element analysis also exhibited cracks extending from the bottom surface to the top surface of the upper plate, indicating a tendency for bending failure. Additionally, transverse cracks appeared near the upper plate of the column.
Comparisons of the load-displacement curves between the experimental data and the finite element analysis are shown in Figure 12. These comparisons provide insights into the correspondence between the experimental and simulated behaviors of the UHPC pre-stressing transfer devices under loading conditions. They help validate the accuracy of the finite element model by demonstrating its ability to predict the structural response in terms of the load-displacement characteristics.

5. Conclusions

(a)
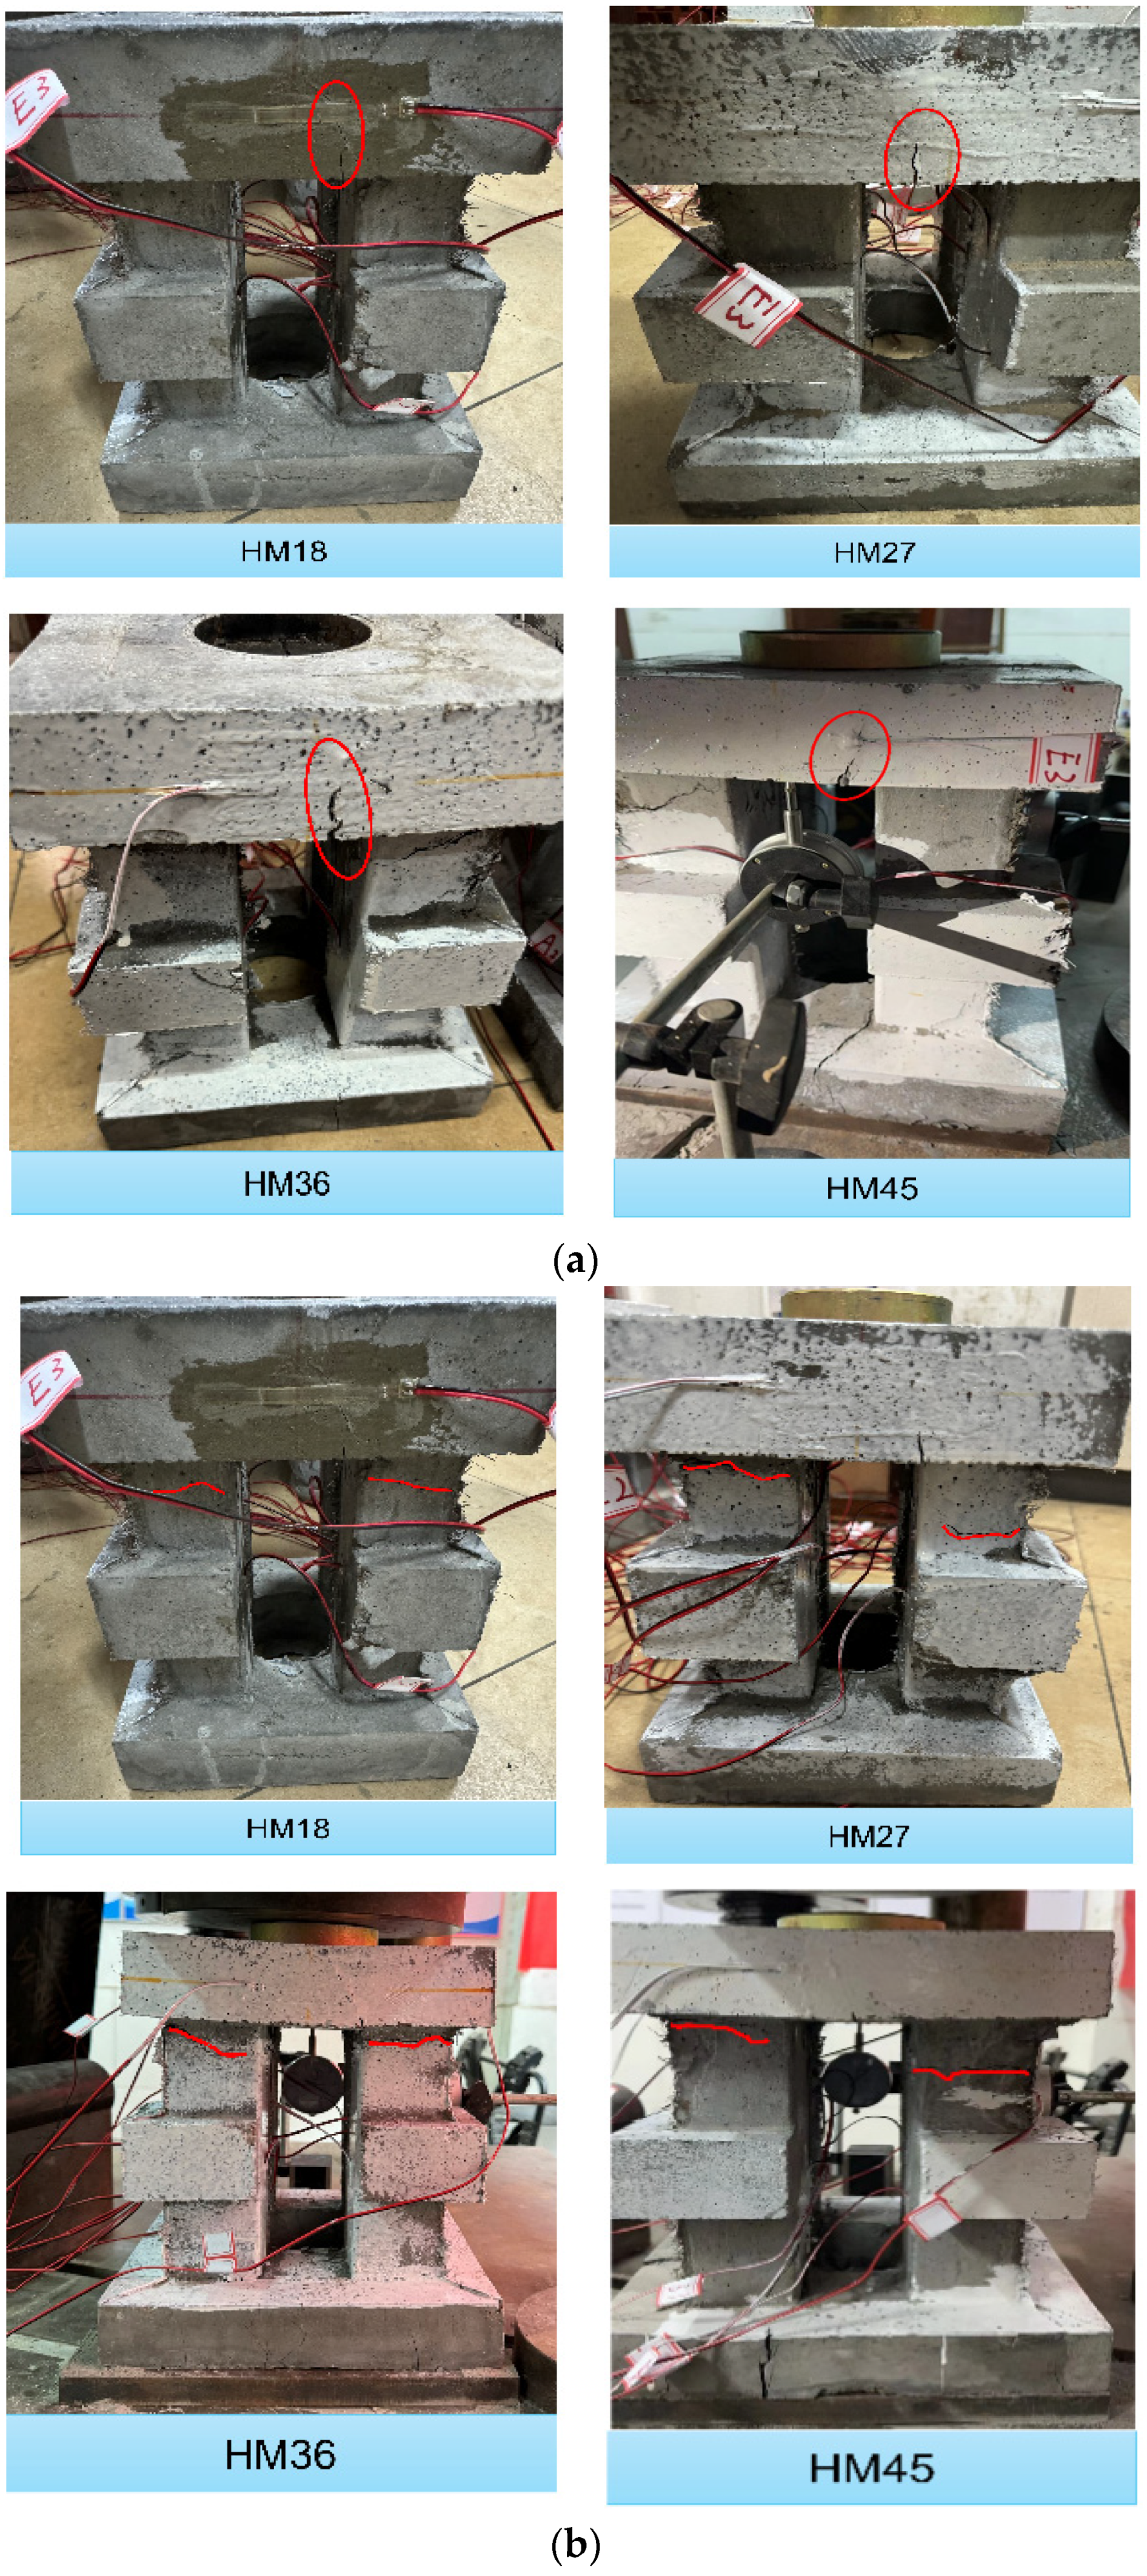
This study conducted axial compression tests on four different types of UHPC precast transfer devices and found that under the action of axial loads, the failure modes of all types of UHPC transfer device specimens were essentially consistent. They all exhibited cracks extending from the bottom edges of the circular holes to the midpoints of the upper plates’ surfaces. Additionally, transverse cracks appeared near the upper surfaces of the columns, adjacent to the undersides of the upper plates. Furthermore, cracks propagated from the fronts to the vicinity of the circular holes in the lower plates near the columns. The positions and development of the cracks indicated that the upper plate of each specimen mainly experienced bending failure, while the upper parts of the short columns tended towards inclined compression failures and the lower plates tended towards being pulled apart.
(b)
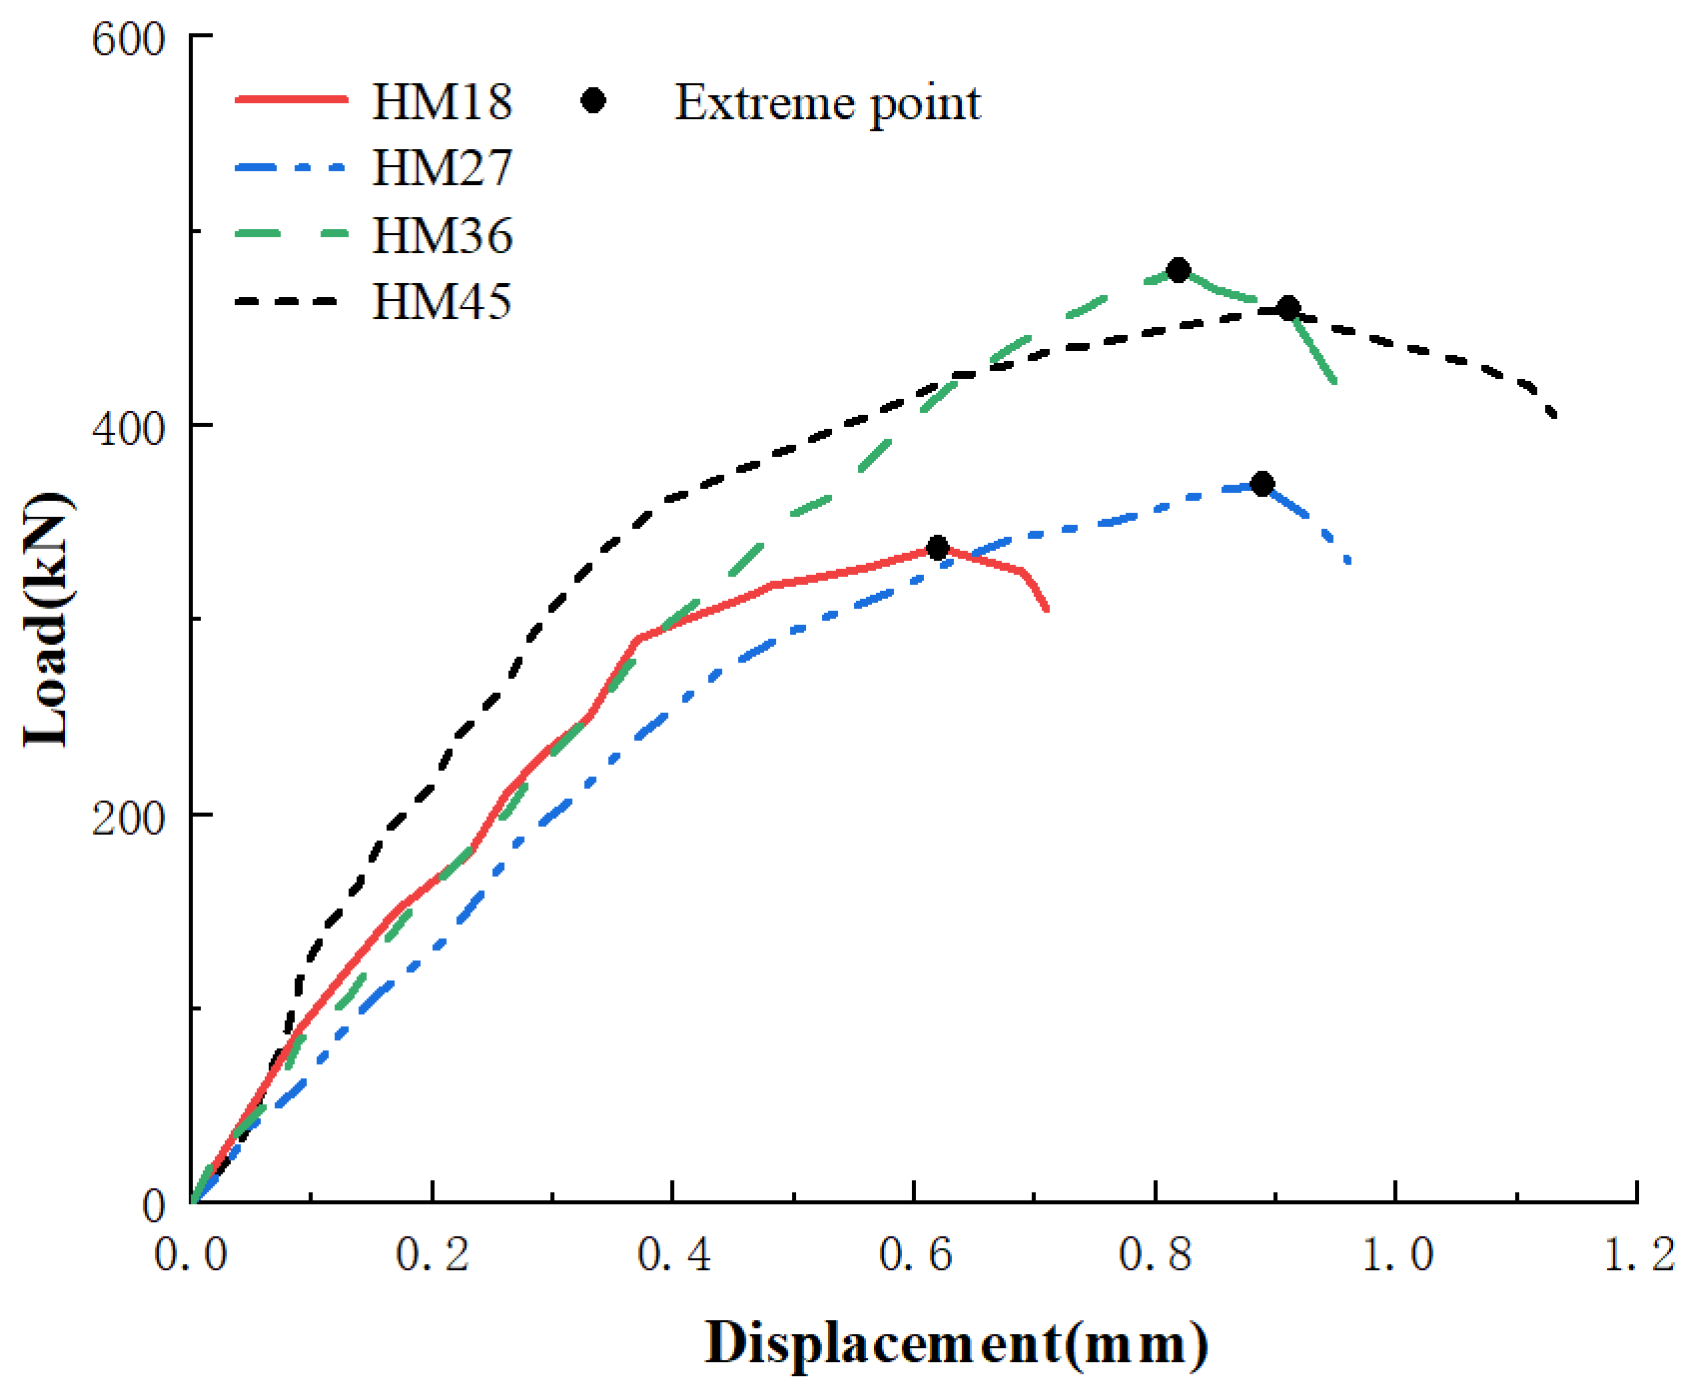
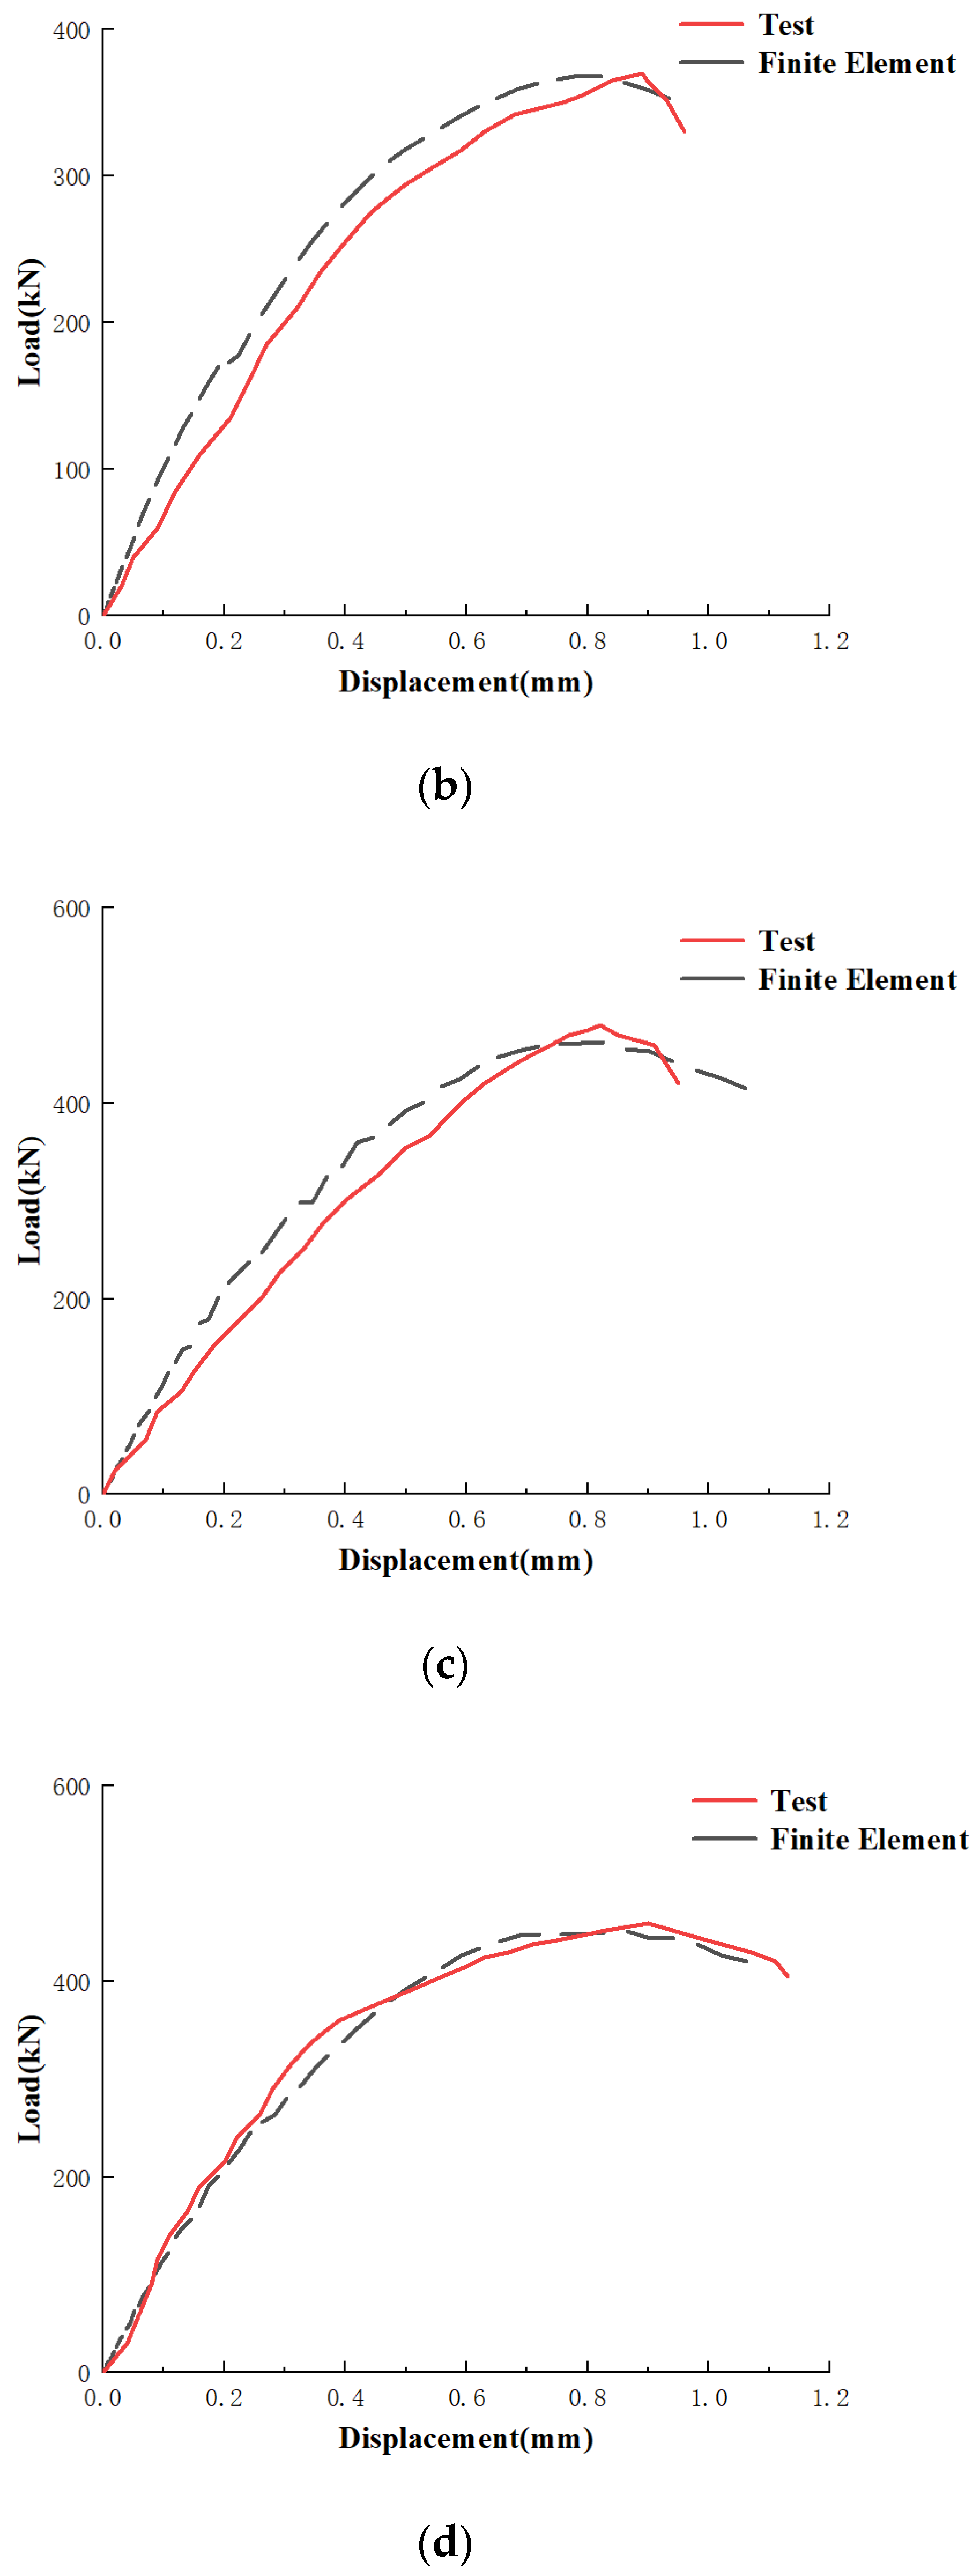
The displacement-load curves of each UHPC transfer device specimen exhibited a similar trend. Initially, they increased linearly from the beginning of loading to 70–90% of the ultimate bearing capacity. After reaching 70–90% of the ultimate bearing capacity, the relationship between load and displacement became nonlinear, with a noticeable decrease in the slope of the curve. Upon reaching the peak load, the load began to decrease, indicating failure and the cessation of working status. All types of UHPC transfer device specimens met the requirements of the designed compressive bearing capacity.
(c)
Among the four different types of UHPC transfer device specimens, under conditions where their respective compressive bearing capacity design values were met, the HM45 specimen, with the largest design dimensions, exhibited a 2% increase in ultimate bearing capacity compared to its design value. Conversely, the HM18 specimen, with the smallest design dimensions, showed an 87% increase in ultimate bearing capacity compared to its design value. When designing specimens, it is essential to consider the effects of dimensional changes.
(d)
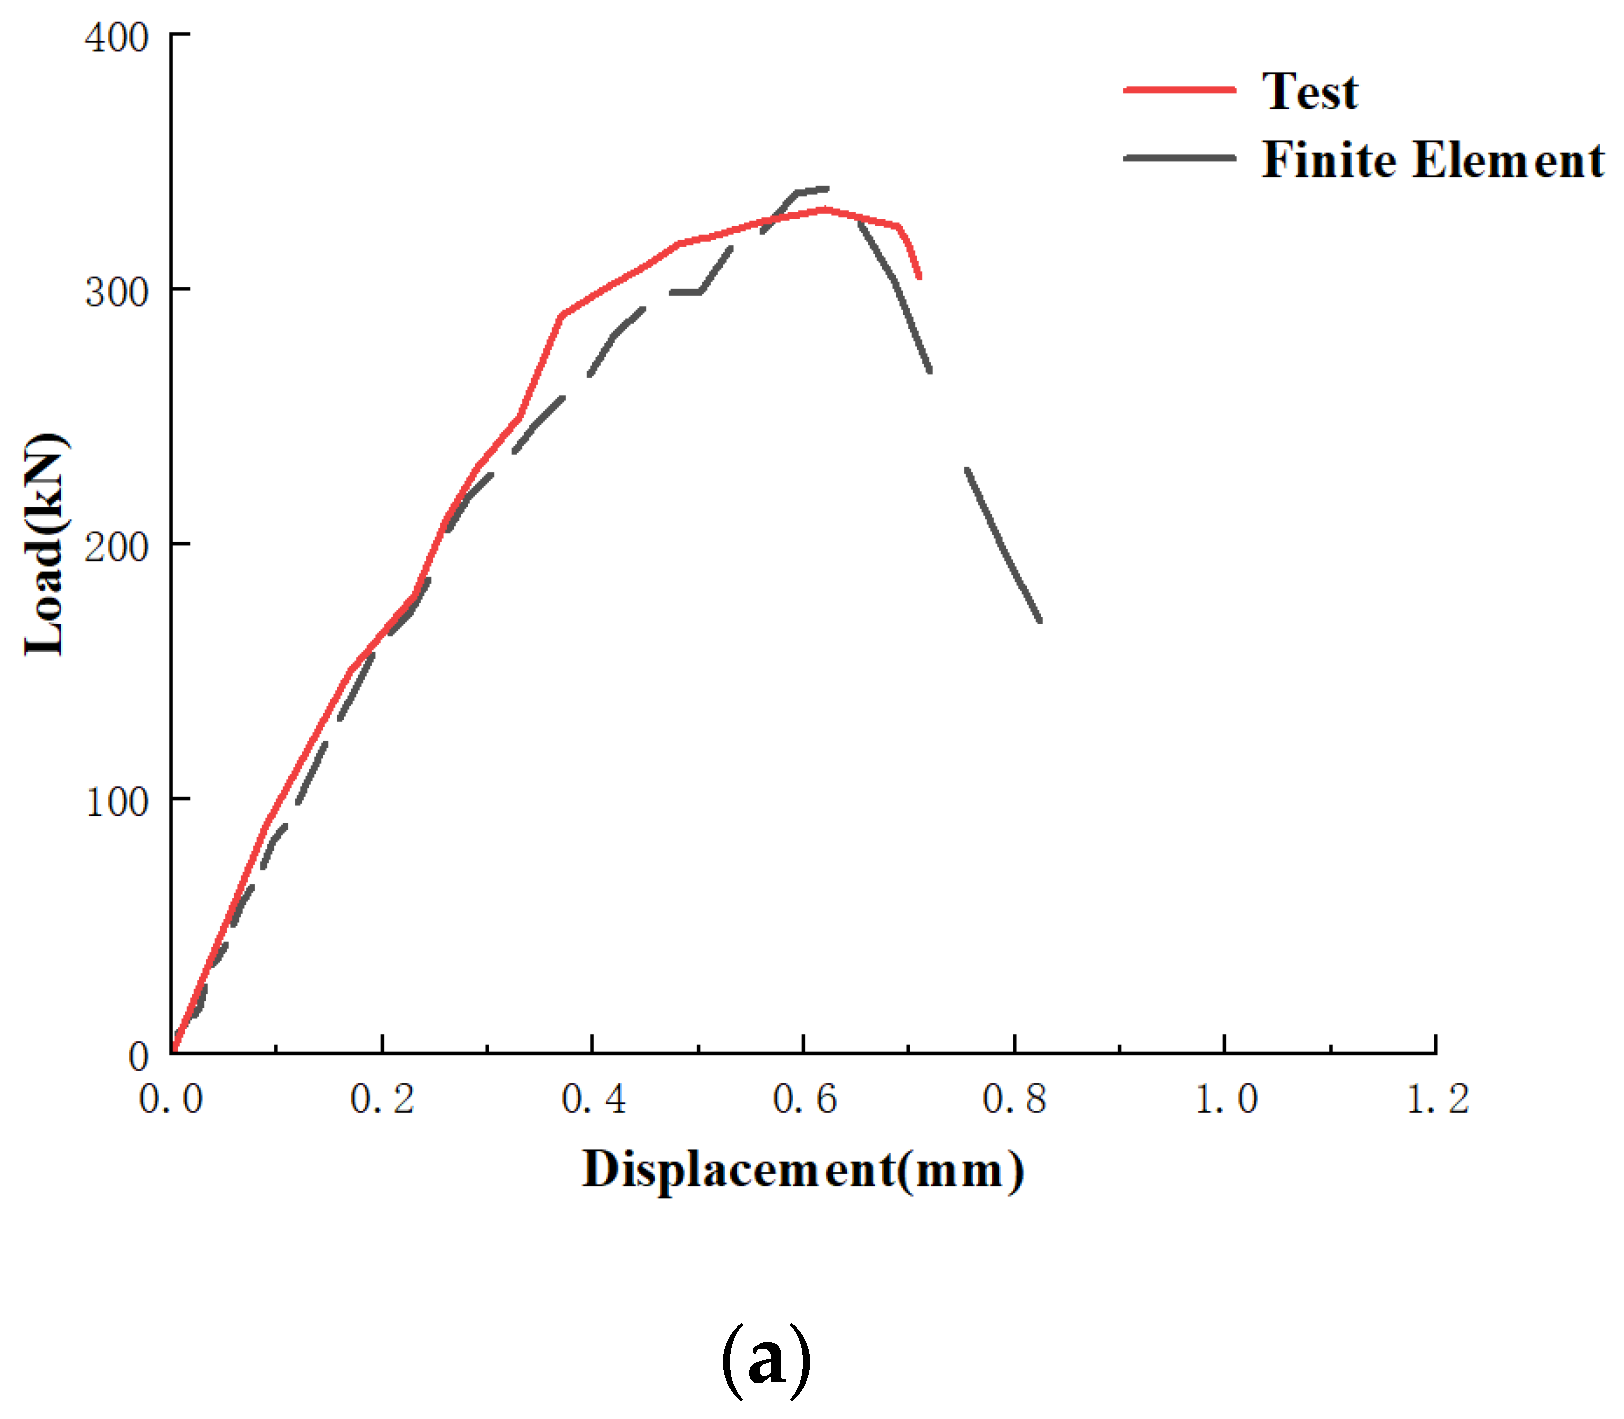
The finite element analysis conducted using ABAQUS and the comparison with the experimental results revealed that the finite element results could effectively reflect the structural performances and failure modes of the specimens. Moreover, they accurately predicted the ultimate bearing capacities of the specimens.
The conclusions above are based on the regularities observed in the results of this experiment. The design of the UHPC transfer devices, the thicknesses of the embedded steel plates, and the material strengths were all limited by the conditions of this experiment, and their applicability was within a certain range. This paper only analyzed the mechanical performances of the UHPC transfer devices under axial compression. Further research is needed to investigate the anchoring mechanism of this device in the concrete base plate.

Author Contributions

Conceptualization, writing—original draft, methodology, resources, Y.L.; software, investigation, writing—original draft, Y.Z.; writing—review and editing, supervision, Z.-X.T.; writing—review and editing, P.-L.L.; writing—review and editing, Z.Y. All authors have read and agreed to the published version of the manuscript.

Funding

This research received no external funding.

Data Availability Statement

All data are summarized in the tables.

Conflicts of Interest

Authors Zhen-Xing Tang and Pei-Lin Liu were employed by the company Hunan Hongxing Anti-Floatation Engineering Technology Co. The remaining authors declare that the research was conducted in the absence of any commercial or financial relationships that could be construed as a potential conflict of interest.

References

  1. Bai, X.Y.; Zhang, M.Y.; Yan, N. Field Comparative Experimental Study and Mechanism Analysis on Anchoring Performance of Two Different Materials Anti-Float Anchors. J. Civ. Eng. 2015, 48, 38–46+59. (In Chinese) [Google Scholar]
  2. Cheng, L.K. Current Situation and Development of Soil and Rock Anchorage. J. Civ. Eng. 2001, 7–12+34. (In Chinese) [Google Scholar]
  3. Zhang, M.Y.; Zhang, J.; Liu, J.W.; Zhao, H.F. Experimental Study on Anti-Float Anchors in Weathered Granite. Chin. J. Rock Mech. Eng. 2008, 2741–2746. (In Chinese) [Google Scholar]
  4. JGJ 476-2019; Building Engineering Anti-Float Technology Standard. China Architecture & Building Press: Beijing, China, 2019.
  5. Tan, G.Y.; Jiang, Y.H.; Fang, W.M.; Gao, M.Y.; Li, N. Design Research on Full-Length Pressure-Type Post-Tensioned Prestressed Anti-Float Anchor Structure. Build. Struct. 2021, 51, 7–10+6. (In Chinese) [Google Scholar]
  6. Larrard, D.F.; Sedran, T. Optimization of Ultrahigh-performance Concrete by the Use of a Packing Model. Cem. Concr. Res. 1994, 24, 997–1009. [Google Scholar] [CrossRef]
  7. Shao, X.D.; Qiu, M.H.; Yan, B.F.; Luo, J. Research and Application Progress of Ultra-High Performance Concrete in Bridge Engineering at Home and Abroad. Mater. Rev. 2017, 31, 33–43. (In Chinese) [Google Scholar]
  8. Chen, B.C.; Ji, T.; Huang, Q.W.; Wu, H.Z.; Ding, Q.J.; Zhan, Y.W. Review of Research on Ultra-High Performance Concrete. J. Build. Sci. Eng. 2014, 31, 1–24. (In Chinese) [Google Scholar]
  9. Nadir, W.; Ali, A.Y.; Jawdhari, A.; Kadhim, M.M.; Majdi, A. Cyclic behavior of UHPC corner beam-column joints under bi-directional bending. Structures 2024, 60, 105857. [Google Scholar] [CrossRef]
  10. Prabha, S.L.; Dattatreya, J.K.; Neelame-gam, M.; Seshagiri Rao, M.V. Study on Stress-strain of Reactive Powder Concrete Under Uniaxial Compression. Int. J. Eng. Sci. Technol. 2010, 2, 6408–6416. [Google Scholar]
  11. Graybeal, B.; Davis, M. Cylinder or Cube: Strength Testing of 80 to 200 MPa (11.6 to 29 KSI) Ultra-high Performance Fiber Reinforced Concrete. ACI Mater. J. 2008, 105, 603–609. [Google Scholar]
  12. Kamen, A.; Denarie, A.; Bruhwiler, E. Thermal Effects on Physico-mechanical Properties of Ultrahigh Performance Fiber-reinforced Concrete. ACI Mater. J. 2007, 104, 415–423. [Google Scholar]
  13. Garas, V.Y.; Kahn, L.F.; Kurtis, K.E. Short-term Tensile Creep and Shrinkage of Ultra-High Performance Concrete. Cem. Concr. Compos. 2009, 31, 147–152. [Google Scholar] [CrossRef]
  14. Graybeal, B.A. Compressive Behavior of Ultrahigh-performance Fiber-reinforced Concrete. ACI Mater. J. 2007, 104, 146–152. [Google Scholar]
  15. Haber-Zachary, B.; Graybeal-Benjamin, A. Strengthening of Steel Through-Girder Bridges Using UHPC and Post-Tensioning. J. Bridge Eng. 2024, 29, 04024004. [Google Scholar] [CrossRef]
  16. Oertel, T.; Hutter, F.; Tänzer, R.; Helbig, U.; Sextl, G. Primary particle size and agglomerate size effects of amorphous silica in ultra-high performance concrete. Cem. Concr. Compos. 2013, 37, 61–67. [Google Scholar] [CrossRef]
  17. Yoo, D.-Y.; Banthia, N.; Kang, S.-T.; Yoon, Y.-S. Size effect in ultra-high-performance concrete beams. Eng. Fract. Mech. 2016, 157, 86–106. [Google Scholar] [CrossRef]
  18. Li, Y.; Pimienta, P.; Pinoteau, N.; Tan, K.H. Effect of aggregate size and inclusion of polypropylene and steel fibers on explosive spalling and pore pressure in ultra-high-performance concrete (UHPC) at elevated temperature. Cem. Concr. Compos. 2019, 99, 62–71. [Google Scholar] [CrossRef]
  19. Rensheng, P.; Xianbin, S.; Weiwei, H.; Quin, L. Direct shear strength of UHPC considering size effect: Theoretical model and experimental verification. J. Build. Eng. 2023, 71, 106381. (In Chinese) [Google Scholar]
  20. Zhang, X.; Lu, Y.; Wu, X.; Wang, P.; Li, R.; Liu, Y.; Shen, C.; Zhang, H.; Zhang, D. Constitutive model for ultra-high performance concrete (UHPC) considering the size effect under cyclic compressive loading. Constr. Build. Mater. 2023, 368, 130499. (In Chinese) [Google Scholar] [CrossRef]
  21. Stefano, G.; Oliver, B.; Aurelio, M. Punching Tests of Slabs with Low Reinforcement Ratios discussion. ACI Struct. J. 2009, 106, 911–912. (In Chinese) [Google Scholar]
  22. Ma, Y.F. Research on Uniaxial Compressive Constitutive Relationship of Reactive Powder Concrete (RPC200). Master’s Thesis, Beijing Jiaotong University, Beijing, China, 2007. (In Chinese). [Google Scholar]
  23. Zhang, Z.; Shao, X.D.; Li, W.G.; Zhu, P.; Chen, H. Experimental Study on Tensile Performance of Ultra-High Performance Concrete. China J. Highw. Transp. 2015, 28, 50–58. (In Chinese) [Google Scholar]
  24. Lin, Z.Y. Performance Study of Partially Reinforced Prefabricated Concrete Columns with UHPC Shell. Master’s Thesis, Southeast University, Nanjing, China, 2022. (In Chinese). [Google Scholar]
  25. Guo, X.Y.; Kang, J.F.; Zhu, J.S. Constitutive relationship of ultrahigh performance concrete under uni-axial compression. J. Southeast Univ. Nat. Sci. Ed. 2017, 47, 369–376. (In Chinese) [Google Scholar]
  26. GB/T700-2006; Standard for Carbon Structural Steels, General Administration of Quality Supervision. Inspection and Quarantine of the People’s Republic of China and Standardization Administration of China: Beijing, China, 2006.
  27. GB 50017-2017; Design Code for Steel Structures. China Architecture & Building Press: Beijing, China, 2017.
  28. Hua, Y.S. Research on Performance of UHPC Reinforced Existing Bridge RC Pillar Piers. Master’s Thesis, Shanghai Institute of Technology, Shanghai, China, 2022. (In Chinese). [Google Scholar]
Figure 1. Detailed dimensional diagram of the HM18 specimen. (a) Cross-sectional diagram of HM18. (b) Planar diagram of the upper plate of HM18. (c) Planar diagram of the lower plate of HM18.
Buildings 14 01075 g001
Figure 2. Schematic diagram of the axial compression test loading for the UHPC pre-stressed transfer device. (a) Schematic diagram of the loading device. (b) Actual loading scenario.
Buildings 14 01075 g002
Figure 3. Layout of the measurement points for the axial compression test of the UHPC pre-stressed transfer device. (a) Layout of the dial indicators. (b) Arrangement of the strain gauges.
Buildings 14 01075 g003
Figure 4. Typical failure modes of the UHPC pre-stressed transfer devices. (a) The crack pattern in each specimen’s upper plate. (b) The crack pattern in each specimen’s short column. (c) The crack pattern in each specimen’s lower plate. The red circles in the figure indicate the locations of the cracks.
Buildings 14 01075 g004aBuildings 14 01075 g004b
Figure 5. Load-displacement curves of the UHPC pre-stressed transfer device specimens.
Buildings 14 01075 g005
Figure 6. Strain measurements at selected points on the short column sections of typical specimens. (a) Strain measurements at selected points on the short column sections of HM27. (b) Strain measurements at selected points on the short column sections of HM36.
Buildings 14 01075 g006
Figure 7. The UHPC’s constitutive relationship curves. (a) The UHPC’s uniaxial compression curve. (b) The UHPC’s uniaxial tensile curve.
Buildings 14 01075 g007
Figure 8. Ideal elastic-plastic stress-strain relationship of Q235 steel.
Buildings 14 01075 g008
Figure 9. Refined finite element model of the UHPC transfer device.
Buildings 14 01075 g009
Figure 10. Finite element model constraints and boundary conditions. (a) Loading end constraints. (b) Fixed and loading end boundary conditions.
Buildings 14 01075 g010
Figure 11. Comparison of the typical test specimens and finite element failure modes. (a) HM18. (b) HM36.
Buildings 14 01075 g011
Figure 12. Comparison of the load-displacement curves. (a) HM18. (b) HM27. (c) HM36. (d) HM45.
Buildings 14 01075 g012aBuildings 14 01075 g012b
Table 1. Specifications of the specimens with different models.
Specimen NumberLength × Width × Height of the Upper Plate (mm)Length × Width × Height of the Short Column (mm)Length × Width × Height of the Lower Plate (mm)Length × Width × Height of the Pre-Embedded Steel Plate
(mm)
HM18160 × 160 × 5040 × 40 × 150180 × 180 × 50100 × 100 × 10
HM27200 × 200 × 5050 × 50 × 150220 × 220 × 50120 × 120 × 10
HM36220 × 220 × 5060 × 60 × 180250 × 250 × 50150 × 150 × 10
HM45250 × 250 × 5065 × 65 × 200280 × 280 × 50150 × 150 × 10
Table 2. Results of the axial compression tests for the UHPC pre-stressed transfer devices.
Specimen NumberExtreme Point Load
(kN)
Extreme Point Displacement
(mm)
HM183370.62
HM273700.89
HM364800.85
HM454600.90
Table 3. Elastic parameters of UHPC material properties in ABAQUS.
MaterialDensity (t/mm3)Elastic Modulus (N/mm2)Poisson’s Ratio
UHPC2.65 × 10−942,0000.19
Table 4. Plastic parameters of the ABAQUS UHPC material properties.
MaterialDilation AngleEccentricity σ / σ K Viscosity Coefficient
UHPC400.11.160.66670.005
Table 5. Physical properties of Q235 steel.
Elastic Modulus (N/mm2)Shear Modulus (N/mm2)Mass Density (kg/m3)Poisson’s Ratio
206 × 10379 × 10378500.3
Disclaimer/Publisher’s Note: The statements, opinions and data contained in all publications are solely those of the individual author(s) and contributor(s) and not of MDPI and/or the editor(s). MDPI and/or the editor(s) disclaim responsibility for any injury to people or property resulting from any ideas, methods, instructions or products referred to in the content.

