Abstract
This paper presents a systematic analysis of energy savings and cost benefits associated with several options for integrating energy efficiency and renewable energy technologies. The primary goal of this study is to assess the cost-effectiveness of achieving optimal net-zero energy (NZE) designs for residential buildings in Australia. Specifically, the analysis combines a series of sensitivity analyses and multi-objective optimizations to account for a wide range of design strategies for detached homes in four cities representing different Australian climates. The results indicate that not only are NZE designs technically feasible for all the considered Australian cities, but they are also highly cost-effective. This cost-effectiveness is attributed to the lower installation costs of rooftop PV systems as well as the beneficial interactive effects of proven energy efficiency strategies. Indeed, it is found that the deployment costs of rooftop PV systems can be recovered in less than 4 years. Moreover, the addition of thermal insulation in walls and ceilings can reduce both HVAC capacities and annual energy end-use by up to 59%. Based on an optimization-based design, NZE homes in Australia can have lower construction costs and, ultimately, lower life cycle costs than dwellings built to meet current energy efficiency standards based primarily on stringent building envelope thermal performance.
1. Introduction
Australia, like several other countries, has made clear commitments to achieve net-zero greenhouse gas (GHG) emissions by 2050 as part of its pledge to address the climate change crisis. Specifically, Australia has made a commitment in 2022 to reduce its GHG emissions by 43% by 2030 from the 2005 levels before reaching a carbon-neutral economy by 2050 [1]. Aggressive deployment of both energy efficiency and renewable energy technologies is proposed to achieve zero net emissions [2]. The International Energy Agency has estimated that the average annual energy efficiency improvements in all sectors must double for Australia to reach its 2030 and 2050 targets [3]. In particular, the energy efficiency of residential buildings needs a 5% annual improvement [1].
Buildings represent 23% of the total energy demand in Australia during 2021 [1]. Of this sectorial energy consumption, 61% is the share of the residential buildings made up of over 10 million units, including individual houses (70%), townhouses (13%), and apartments (16%) [4]. Electricity was the main energy source used by the Australian building stock, representing 61%, followed by natural gas at 25% [1]. Based on 2018 data, space heating was estimated to account for 36% of the energy demand of the Australian housing stock, followed by water heating (27%), appliances (23%), cooking (5%), space cooling (5%), and lighting (4%) [1].
In Australia, energy efficiency requirements have been mandated by the National Construction Code (NCC) since 2003 for houses and 2005 for apartment buildings [5]. Initially, the NCC mandated that new houses must have at least a four-star rating using the Nationwide House Energy Rating Scheme (NatHERS) starting in 2003. Then, this mandate was increased to five-star in 2006 and six-star in 2010 [5]. NatHERS has a star rating system ranging from 0 to 10, introduced in 1993 to assess the thermal performance of the building envelope [6]. For determining the star rating, NatHERS-approved tools are generally used to model buildings to estimate their heating and/or cooling thermal loads using very specific sets of occupancy schedules and indoor temperature settings [7]. For instance, NatHERS-certified tools assume continuous space heating needs with temperature settings of 20 °C in living spaces, as well as 18 °C in the bedrooms when the occupants are awake and 15 °C when they are asleep, particularly in cool climates [8].
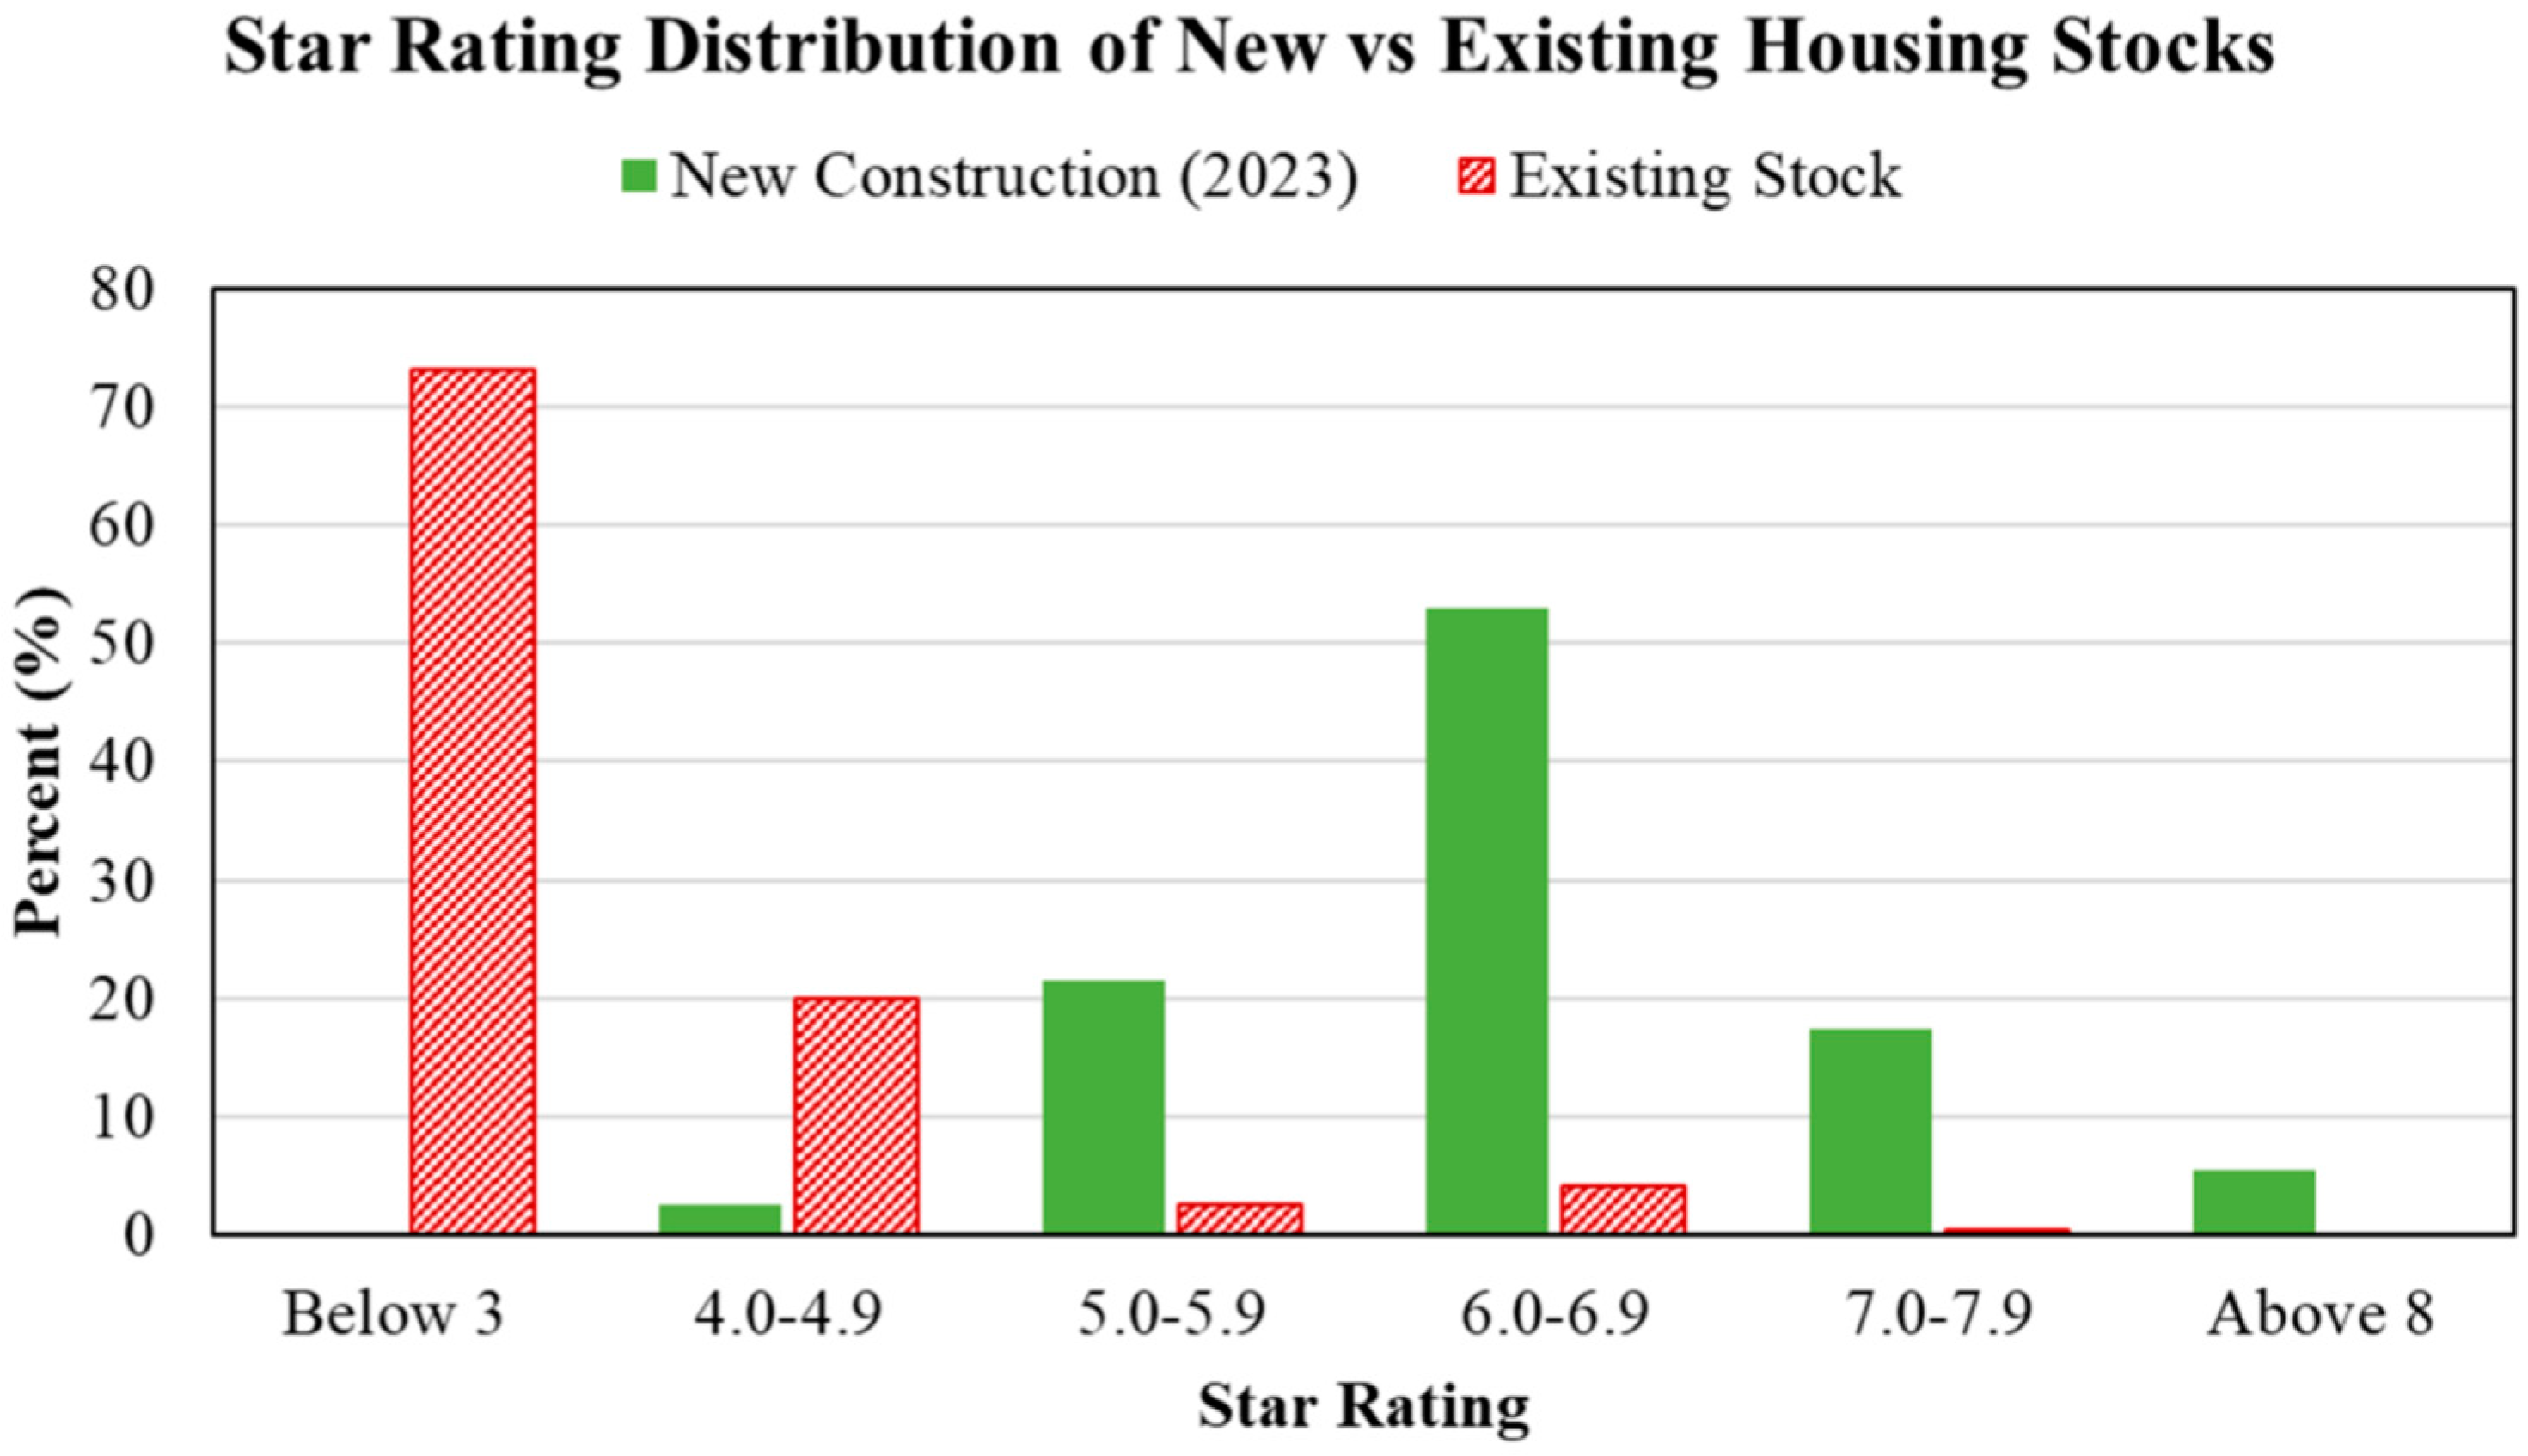
Figure 1 illustrates the star rating distributions among certified existing and new housing units in Australia [9]. As expected, the existing housing stock has, on average, significantly lower star ratings compared to newly constructed residential buildings. Indeed, most of the existing houses have a star rating below three as they were built before 2003, while newly built homes have star ratings between five and seven. Thus, there is a substantial potential to improve the energy efficiency levels of residential buildings, especially existing stocks. Even the energy efficiency levels for future constructions need to be increased to achieve carbon neutrality by 2050 [1]. To achieve this goal, the NCC has recently approved more stringent energy efficiency requirements for new houses by increasing the mandated NatHERS’ star rating to seven and imposing thresholds for the whole-home energy use budget. These requirements are set to be enforced starting 1 October 2023 in several states and territories and are expected to reduce annual energy costs for each new home by an average of 183 AUD [10]. The whole-home performance, set to be rated from 0 to 100, accounts for the annual energy consumption of the entire house, including plug loads, appliances, heating/cooling systems, lighting, and any onsite power generation and storage [5]. Thus, a net-zero energy (NZE) house receives a whole-home rating of 100. Moreover, the Australian government has recently announced a plan to provide NatHERS ratings for existing homes starting in 2025, with pilots and trials scheduled to be completed between 2023 and 2024 [11].

Figure 1.
Distributions of star rating for both existing and 2023 new construction certified in Australia.
Several countries have developed policies and roadmaps to achieve NZE buildings. Specifically, the European Union (EU) has established the energy performance of buildings directive (EPBD) to achieve nearly zero-net-energy for new buildings by 2020 [12]. Nearly zero-net energy buildings are highly energy efficient and integrate renewable energy systems [13]. The EU has further strengthened the EPDB to require zero emissions for all new public buildings from 2026 and all new buildings from 2028, gradually extending to existing buildings [14].
In the US, several states and cities have approved policies and codes to ensure that new buildings are either net zero energy or carbon [15]. Moreover, the American Society of Heating, Refrigerating, and Air-Conditioning Engineers (ASHRAE) has established a new standard for zero net energy and carbon for operating buildings in 2023 [16]. In 2022, Japan revised its energy efficiency regulations to require zero-energy performance for all new buildings by 2030 and for all existing buildings by 2050 [17]. Moreover, China has approved regulations that require all new buildings to have zero net energy by 2030 [18].
However, in Australia, no specific policies have been enacted to require NZE for new or existing buildings, even though some initiatives have been established to foster the use of renewable energy to generate clean energy, including the use of building-integrated solar systems [19]. Consequently, there are no general guidelines for optimally designing NZE in Australia [20], unlike in other countries [16,21,22,23]. The analysis provided in this paper attempts to fill this gap and develop a set of principles for designing and retrofitting residential buildings that account for Australia’s climate diversity as well as the variations in energy prices and equipment costs.
In this paper, a systematic analysis of the potential cost benefits of NZE designs for residential buildings in Australia is presented. The cost–benefit analysis accounts for both energy efficiency and renewable energy systems when deployed individually and when integrated optimally to achieve NZE designs for residential buildings in four cities representing different Australian climate zones. First, the general analysis approach is presented. Then, the cost benefits of individual design strategies are discussed. Finally, the design optimization results for NZE residential buildings are summarized for different operating conditions and various climate zones in Australia.
2. Analysis Approach
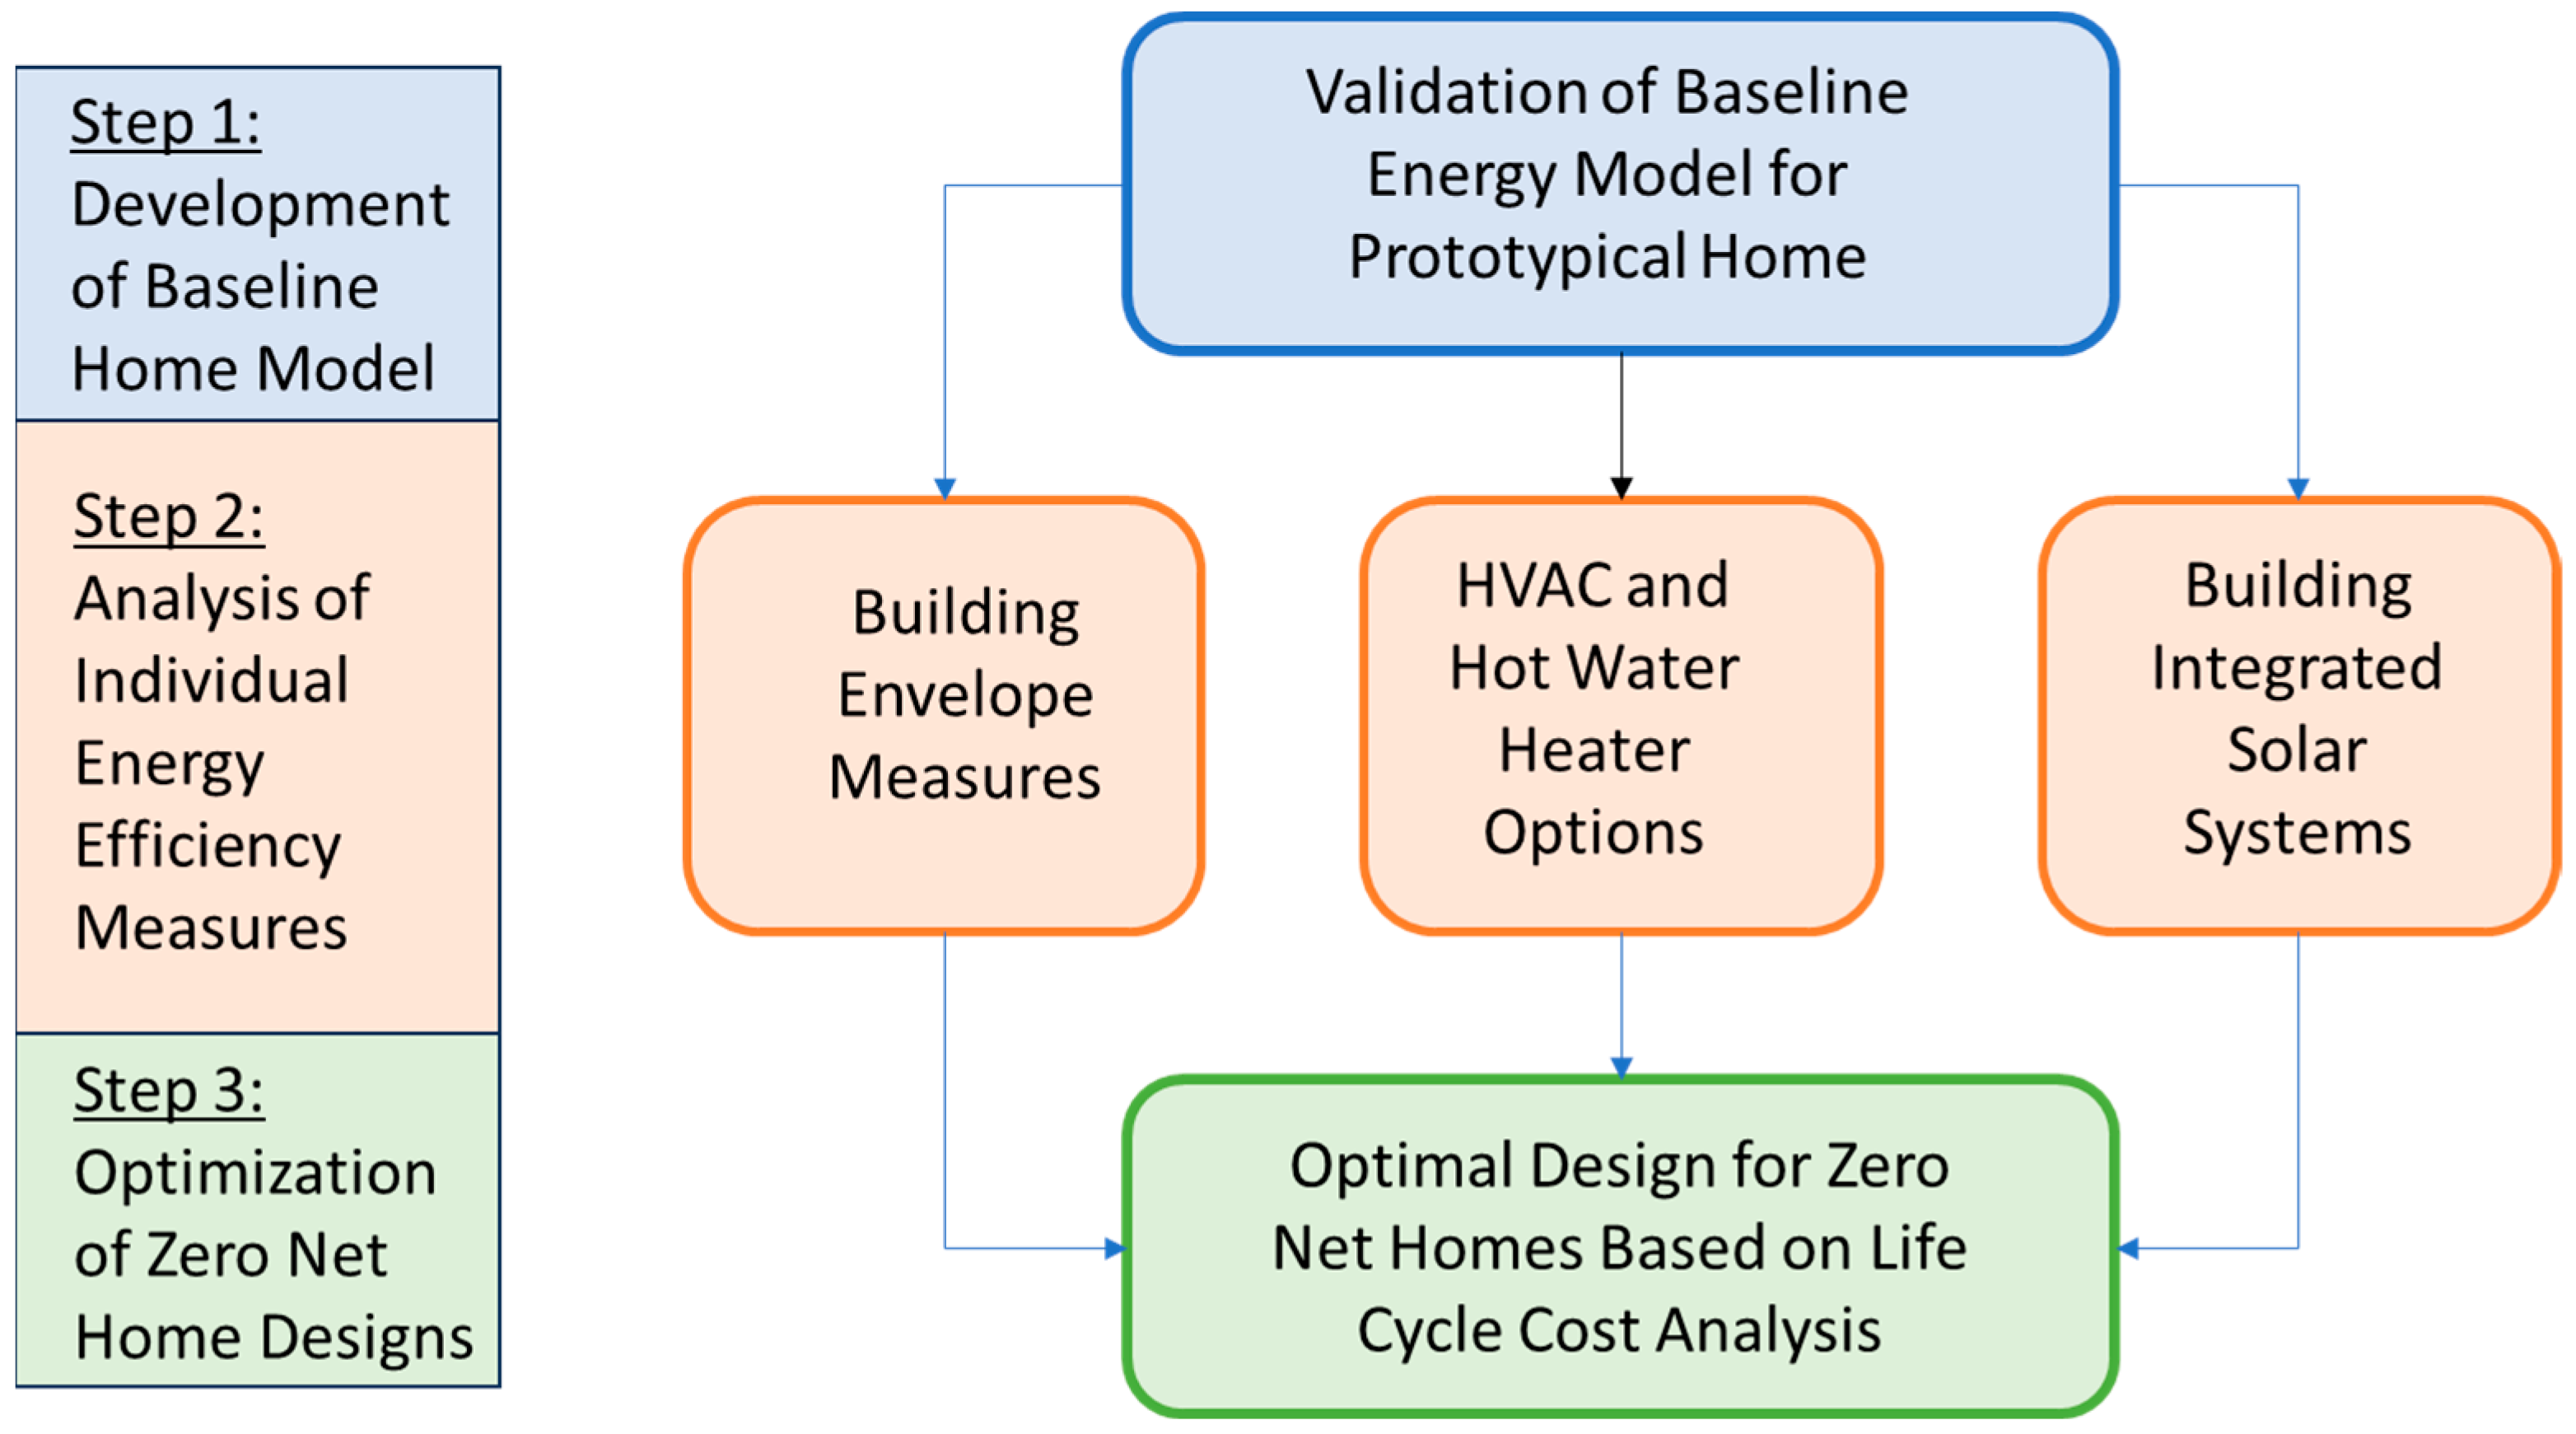
In this study, the analysis approach, summarized in Figure 2, involves three main steps:
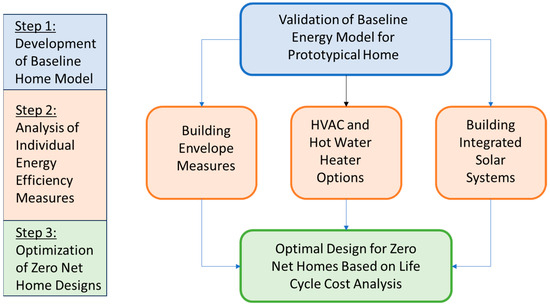
Figure 2.
Flowchart for the analysis approach to optimize the design of zero net energy homes.
- Step 1: Development of baseline home model. In this first phase of the analysis, an energy model is developed and validated using the characteristics as well as the energy usage data for an existing home designed as a demonstration of a zero-emission house [24]. The energy performance of the baseline home is assessed for four cities (i.e., Melbourne, Perth, Brisbane, and Darwin) located in different climate zones in Australia.
- Step 2: Analysis of individual energy efficiency measures. This phase involves a series of parametric analyses to assess the energy efficiency as well as the cost-effectiveness of diverse design strategies using the home energy model developed and validated in Step 1. The considered design strategies include building envelope measures (i.e., insulating the walls and ceiling, deploying alternatives for glazing options, and reducing the air leakage levels), energy-intensive systems (i.e., heating, ventilating, and air conditioning or HVAC equipment and their temperature settings as well as hot water heaters), and building integrated solar systems (i.e., rooftop PV panels, and solar water heaters).
- Step 3: Optimization of zero net home designs. Based upon the results of the sensitivity analysis completed in Step 2, a multi-objective optimization analysis is carried out to determine the cost-optimal designs for achieving NZE homes in four Australian climates considered in this study. The optimization is based on maximizing energy efficiency while maintaining acceptable indoor thermal comfort levels and minimizing the life cycle costs to account for the capital costs, operating costs, maintenance costs, and replacement costs throughout the home’s life cycle.
The development of the energy model for the baseline home, as well as the Australian climate zones considered throughout the study, is discussed in the following section. Later, the energy efficiency and renewable energy strategies considered in both the sensitivity analyses and the design optimization for the net-zero homes in Australia are presented.
2.1. Baseline Energy Model
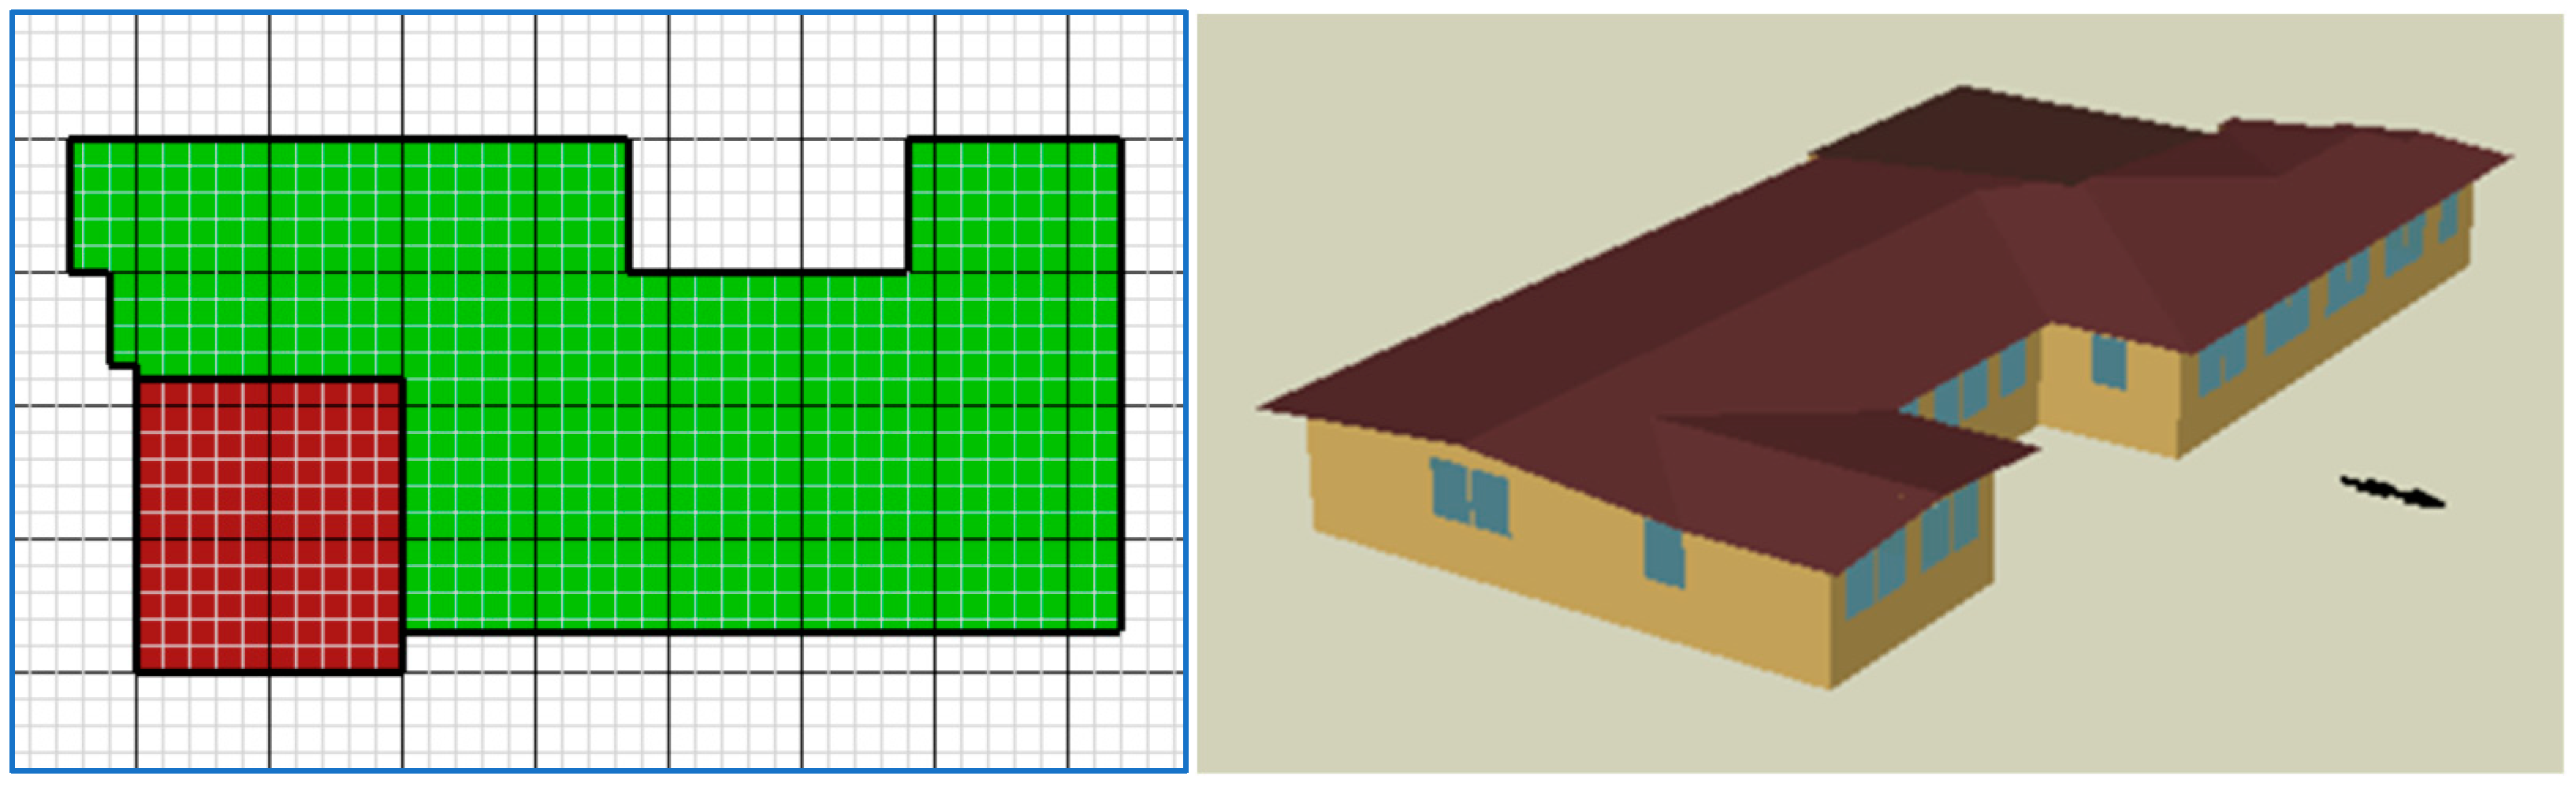
For this study, an energy model for a detached house located in Melbourne is developed and calibrated based on monitored data [24]. The house is a demonstration case study for a zero-emission house (ZEH) that was built to have building envelope components that are highly efficient to ensure a NatHERS star rating of 8. The house has 4 bedrooms in addition to a kitchen, a dining area, and a living room, with a total floor area of 240 m2, including a 40 m2 unconditioned garage. In addition to lighting, common appliances and equipment are used throughout the house. Moreover, the house is heated and cooled by a heat pump coupled with a solar water heater. Table 1 summarizes the main features of the detached home, considered as the baseline design throughout this study, while Figure 3 illustrates the floor plan and a 3-D rendering of the energy model developed for this analysis.

Table 1.
The main characteristics of the energy model for the baseline house design considered in this study.
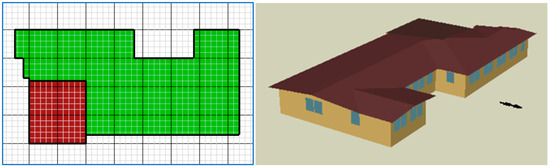
Figure 3.
Floor plan and 3-D rendering of the energy model for the single-story home.
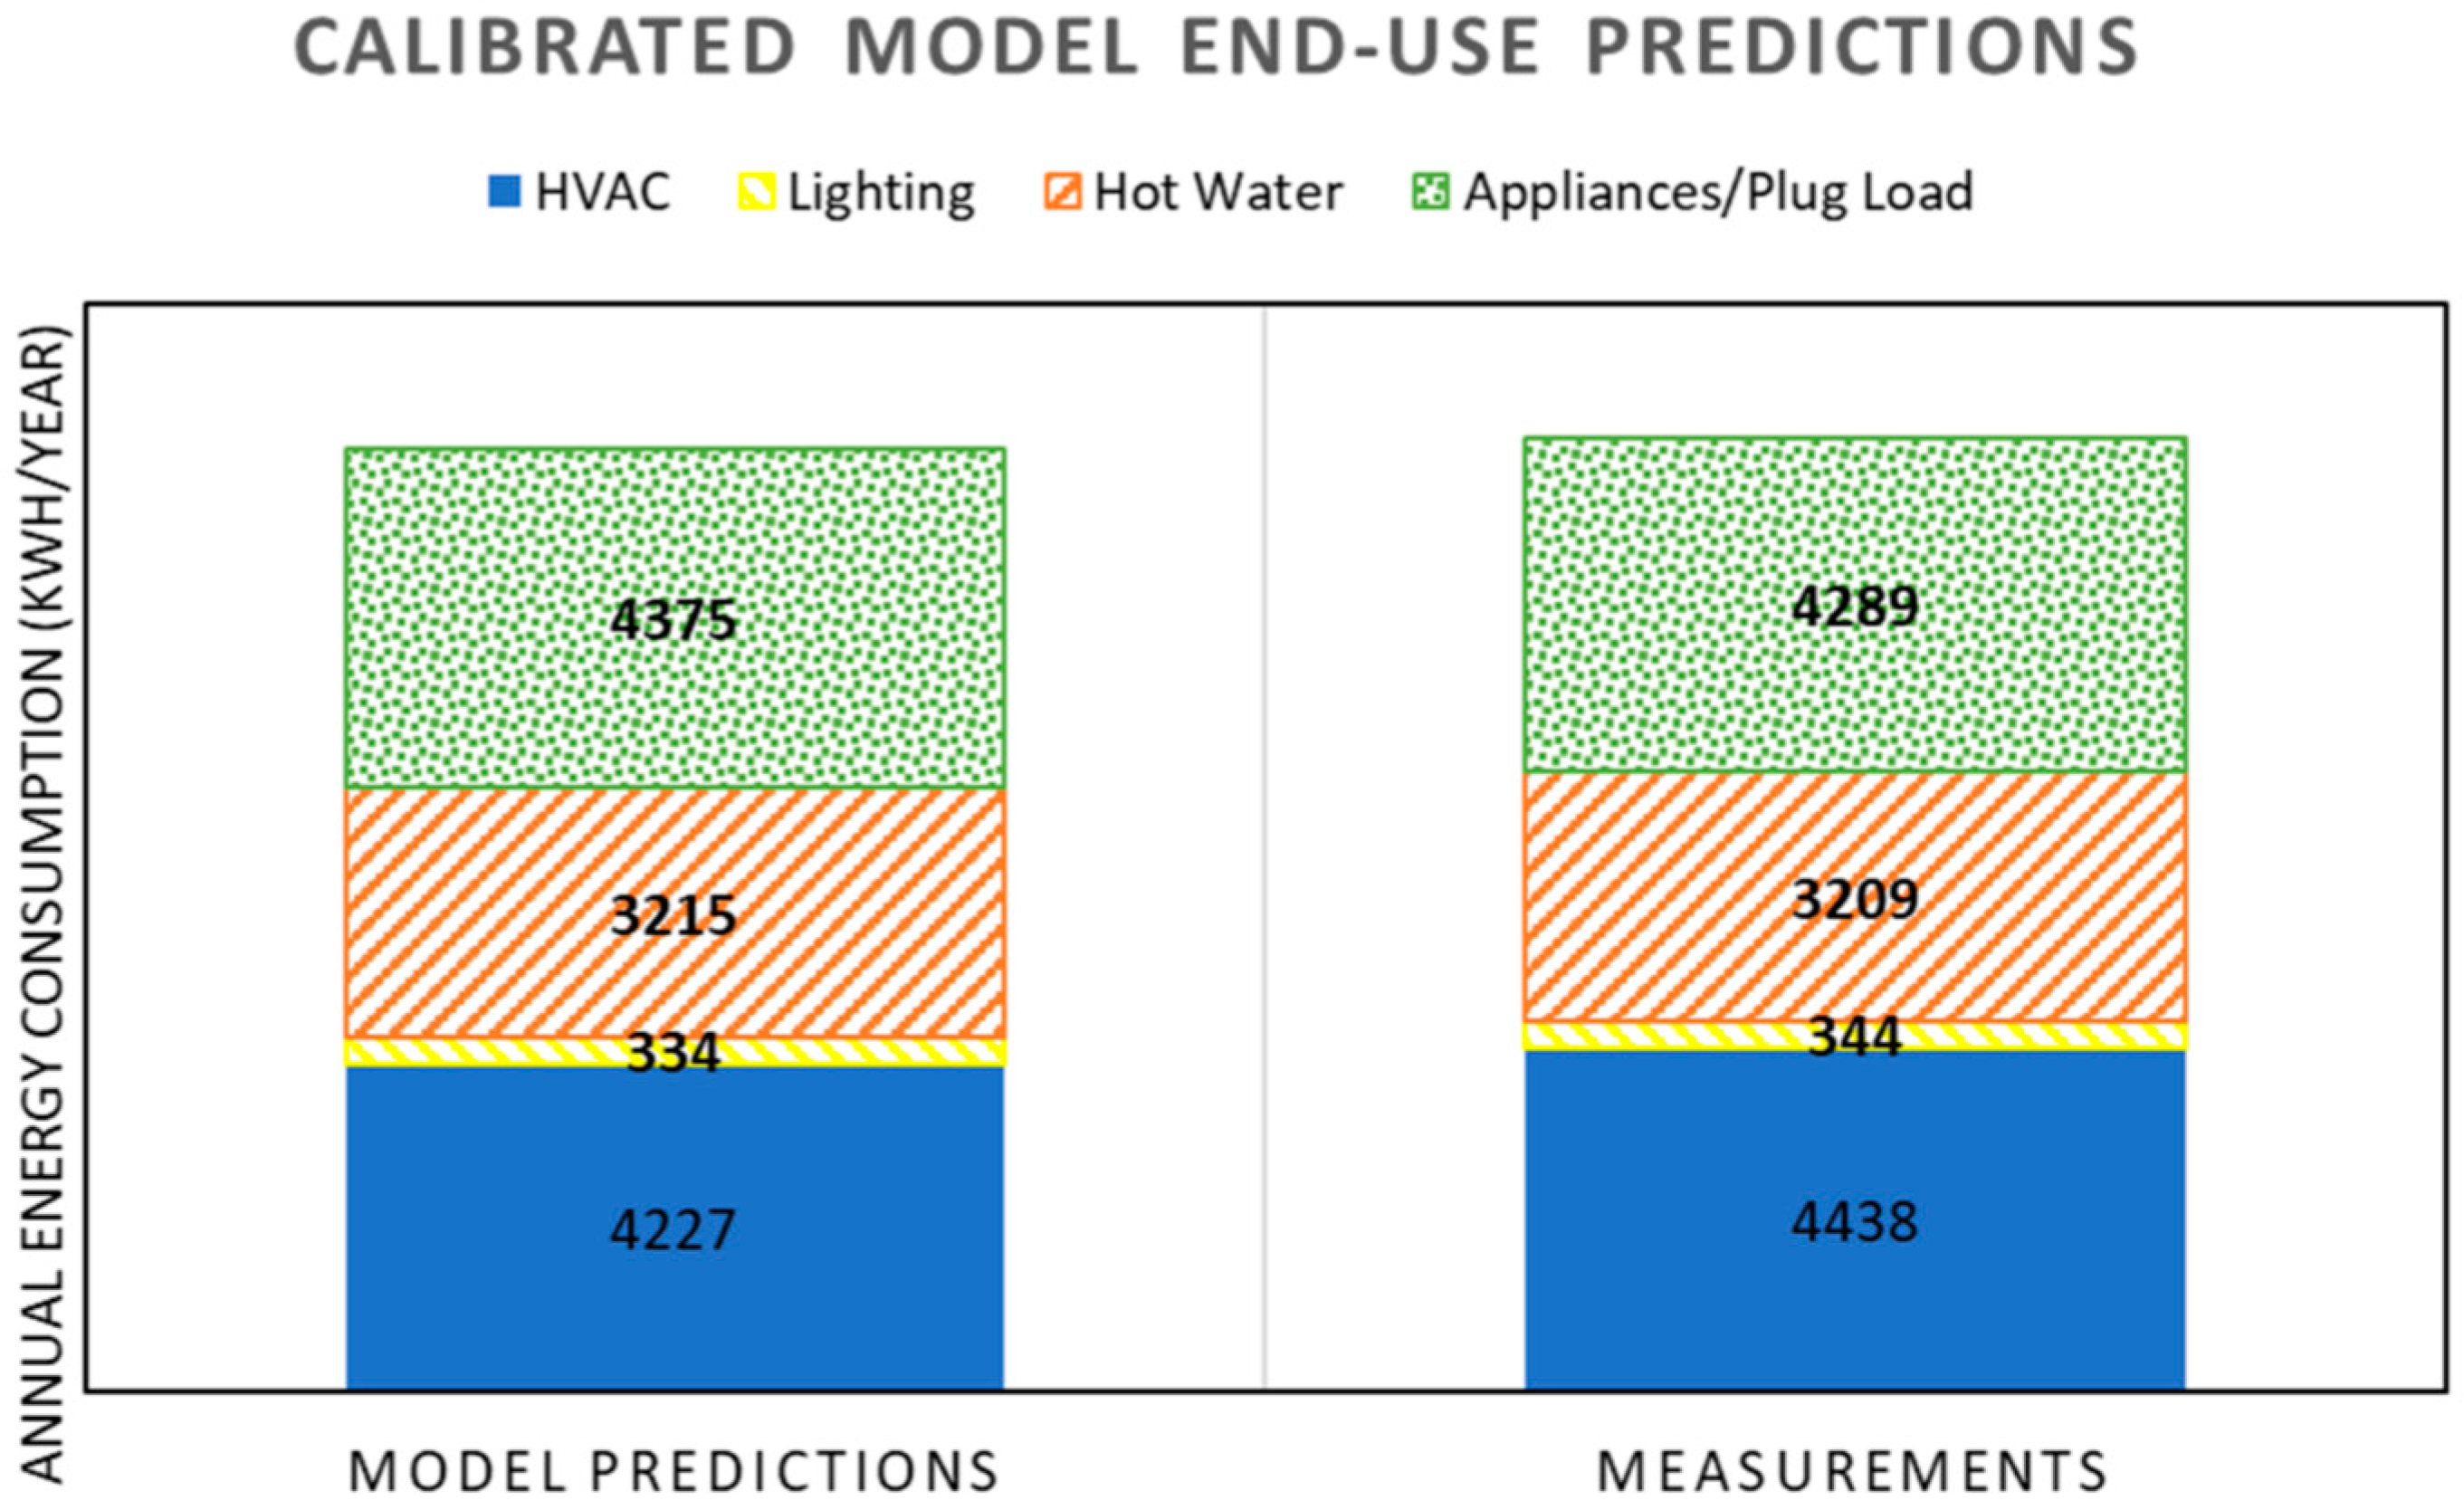
For this study, EnergyPlus simulation engine is used to develop the baseline energy model as well as conduct a wide range of sensitivity and optimization analyses [25]. EnergyPlus, a state-of-the-art whole-building energy simulation tool, is based on the application of heat balance principles both to estimate heat transfer through the building envelope surfaces as well as the thermal loads required for heating and cooling indoor spaces [25]. The model predictions for the annual energy end-uses specific to the baseline design have been compared to the monitored data collected for one year of the demonstration house [24]. Figure 4 and Table 2 summarize the comparative analysis and confirm that the house baseline model predictions agree well with the measured data for all the major end-uses, including the heating and cooling needs. The slight discrepancies between the model predictions and metered data, specifically to HVAC, lighting, and appliance energy end-uses, are primarily due to uncertainties in the actual occupancy patterns as well as specific schedules for using the various appliances and lighting fixtures. However, these differences are well within the 10% tolerances recommended by most standards for the calibration of building energy models [26,27]. As noted earlier, Melbourne has a mild climate with more dominant heating than cooling requirements (refer to Table 3). The energy model predictions for daily energy consumption illustrated in Figure 5 confirm that electricity demands increase more significantly during the winter season (i.e., June through August) than during the summer season (i.e., December through February).

Figure 4.
Comparison between Model predictions and measurements of annual energy end-uses.
Table 2.
Differences of energy end-uses between model predictions and measured data.
Table 3.
Climate zones and the annual heating and cooling degree-days for selected Australia sites.
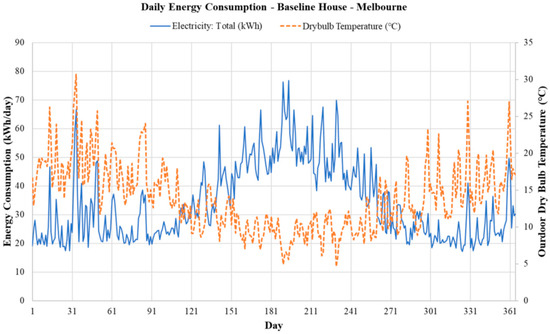
Figure 5.
Daily variations of outdoor dry bulb temperature and electricity consumption predicted by the calibrated energy model for a house in Melbourne.
2.2. Description of Selected Australian Climates
Table 3 lists the cities considered in this analysis to assess the optimal design and retrofit measures required to achieve NZE designs for homes throughout different climate zones in Australia. The selected cities represent four out of eight climate zones defined by NCC for Australia [5]; the selected climate zones are the most inhabited areas of the continent. The heating and cooling degree-days (i.e., HDD and CDD) using a balance temperature of 18 °C are determined based on weather files suitable for EnergyPlus, a state-of-the-art whole-building energy simulation engine, used in this study [25].
Based on the analysis of the typical climate data for the four cities in Australia, several strategies can be considered to maintain acceptable indoor thermal conditions during various periods of the year, as summarized in Table 4, using a convenient processing tool of the weather data [28]. These design strategies rely heavily on passive heating and cooling design alternatives (such as using evaporative cooling and natural ventilation or deploying shading and natural ventilation), supplemented with active systems (i.e., HVAC equipment). As multiple strategies can be considered during a given period, the sum of period fractions listed in Table 4 for the given sites can exceed 100%. As expected, active heating is needed in Melbourne, Perth, and Brisbane during the cold periods of the winter season, while active cooling is required in Darwin during most of the hot summer season to maintain acceptable indoor thermal comfort levels based on ASHRAE Standard 55 [29]. Instead of active cooling systems, passive and low-energy strategies can be considered to achieve acceptable indoor thermal comfort at no or low energy costs during most parts of the cooling periods. Some of these strategies include the deployment of solar shading devices (16.6% in Brisbane and 33.1% in Darwin) and evaporative cooling strategies (12.9% in Perth). It should be noted that natural ventilation can be effective when other thermal comfort criteria are considered. Indeed, when the ASHRAE adaptive comfort model is used [29], natural ventilation can be effective in maintaining acceptable indoor thermal comfort for more periods compared to those listed in Table 4, including 7.5% in Melbourne, 15.5% in Perth, 30.8% in Brisbane, and 50.7% in Darwin.
Table 4.
Periods, expressed in percent in a year, when indoor thermal comfort can be maintained using passive and active strategies for residential buildings in four Australian cities.
2.3. Energy Efficiency and Renewable Energy Strategies
Given the variations in climatic conditions within Australia, several design and operation strategies can be considered to optimize the energy performance of buildings, including homes. In this study, a specific set of design and operation alternatives are considered to assess the best combinations that can provide a balance between energy efficiency, cost-effectiveness, and indoor quality for homes in Australia. Table 5 lists the selected measures evaluated throughout the study, incorporating both sensitivity analyses and optimization-based designs. Specifically, four alternatives of hot water systems are considered in the optimization analysis, including electric tanks (Elect. Tank) consisting of a water tank with electric resistances, heat pump water heaters (HPWH), and solar water heaters (SWH) supplemented with electric tanks or heat pump water heaters.
Table 5.
List of design and operation strategies evaluated for optimizing the design of NZE homes.
The cost-effectiveness assessments conducted in this study are based on both simple payback periods as well as life cycle costs, which account for the capital costs as well as any maintenance, replacement, and operating costs [35]. These operating costs consist of the energy costs, which are estimated using the average electricity rates prevalent in the states and territories of the selected cities. Specifically, the average electricity prices used throughout the analyses include 0.2923 AUD/kWh for Melbourne, 0.3006 AUD/kWh for Perth, 0.3034 AUD/kWh for Brisbane, and 0.2737 AUD/kWh for Darwin [36].
3. Sensitivity Analysis Results
In this section, the results of a series of sensitivity analyses are briefly discussed to assess the energy efficiency and the cost benefit potentials for individual design and operation strategies. Indeed, an effective approach to optimize the design of NZE buildings is to first perform a series of sensitivity analyses to identify the most influential and cost-effective strategies that can achieve high energy savings [37]. The investigated strategies, listed in Table 5, include both energy efficiency and renewable energy measures. The implementation costs for these strategies account for both material and labor costs based on various references and sources, as indicated in Table 5.
3.1. Impact of Wall/Ceiling Insulation
3.1.1. Energy Performance Analysis
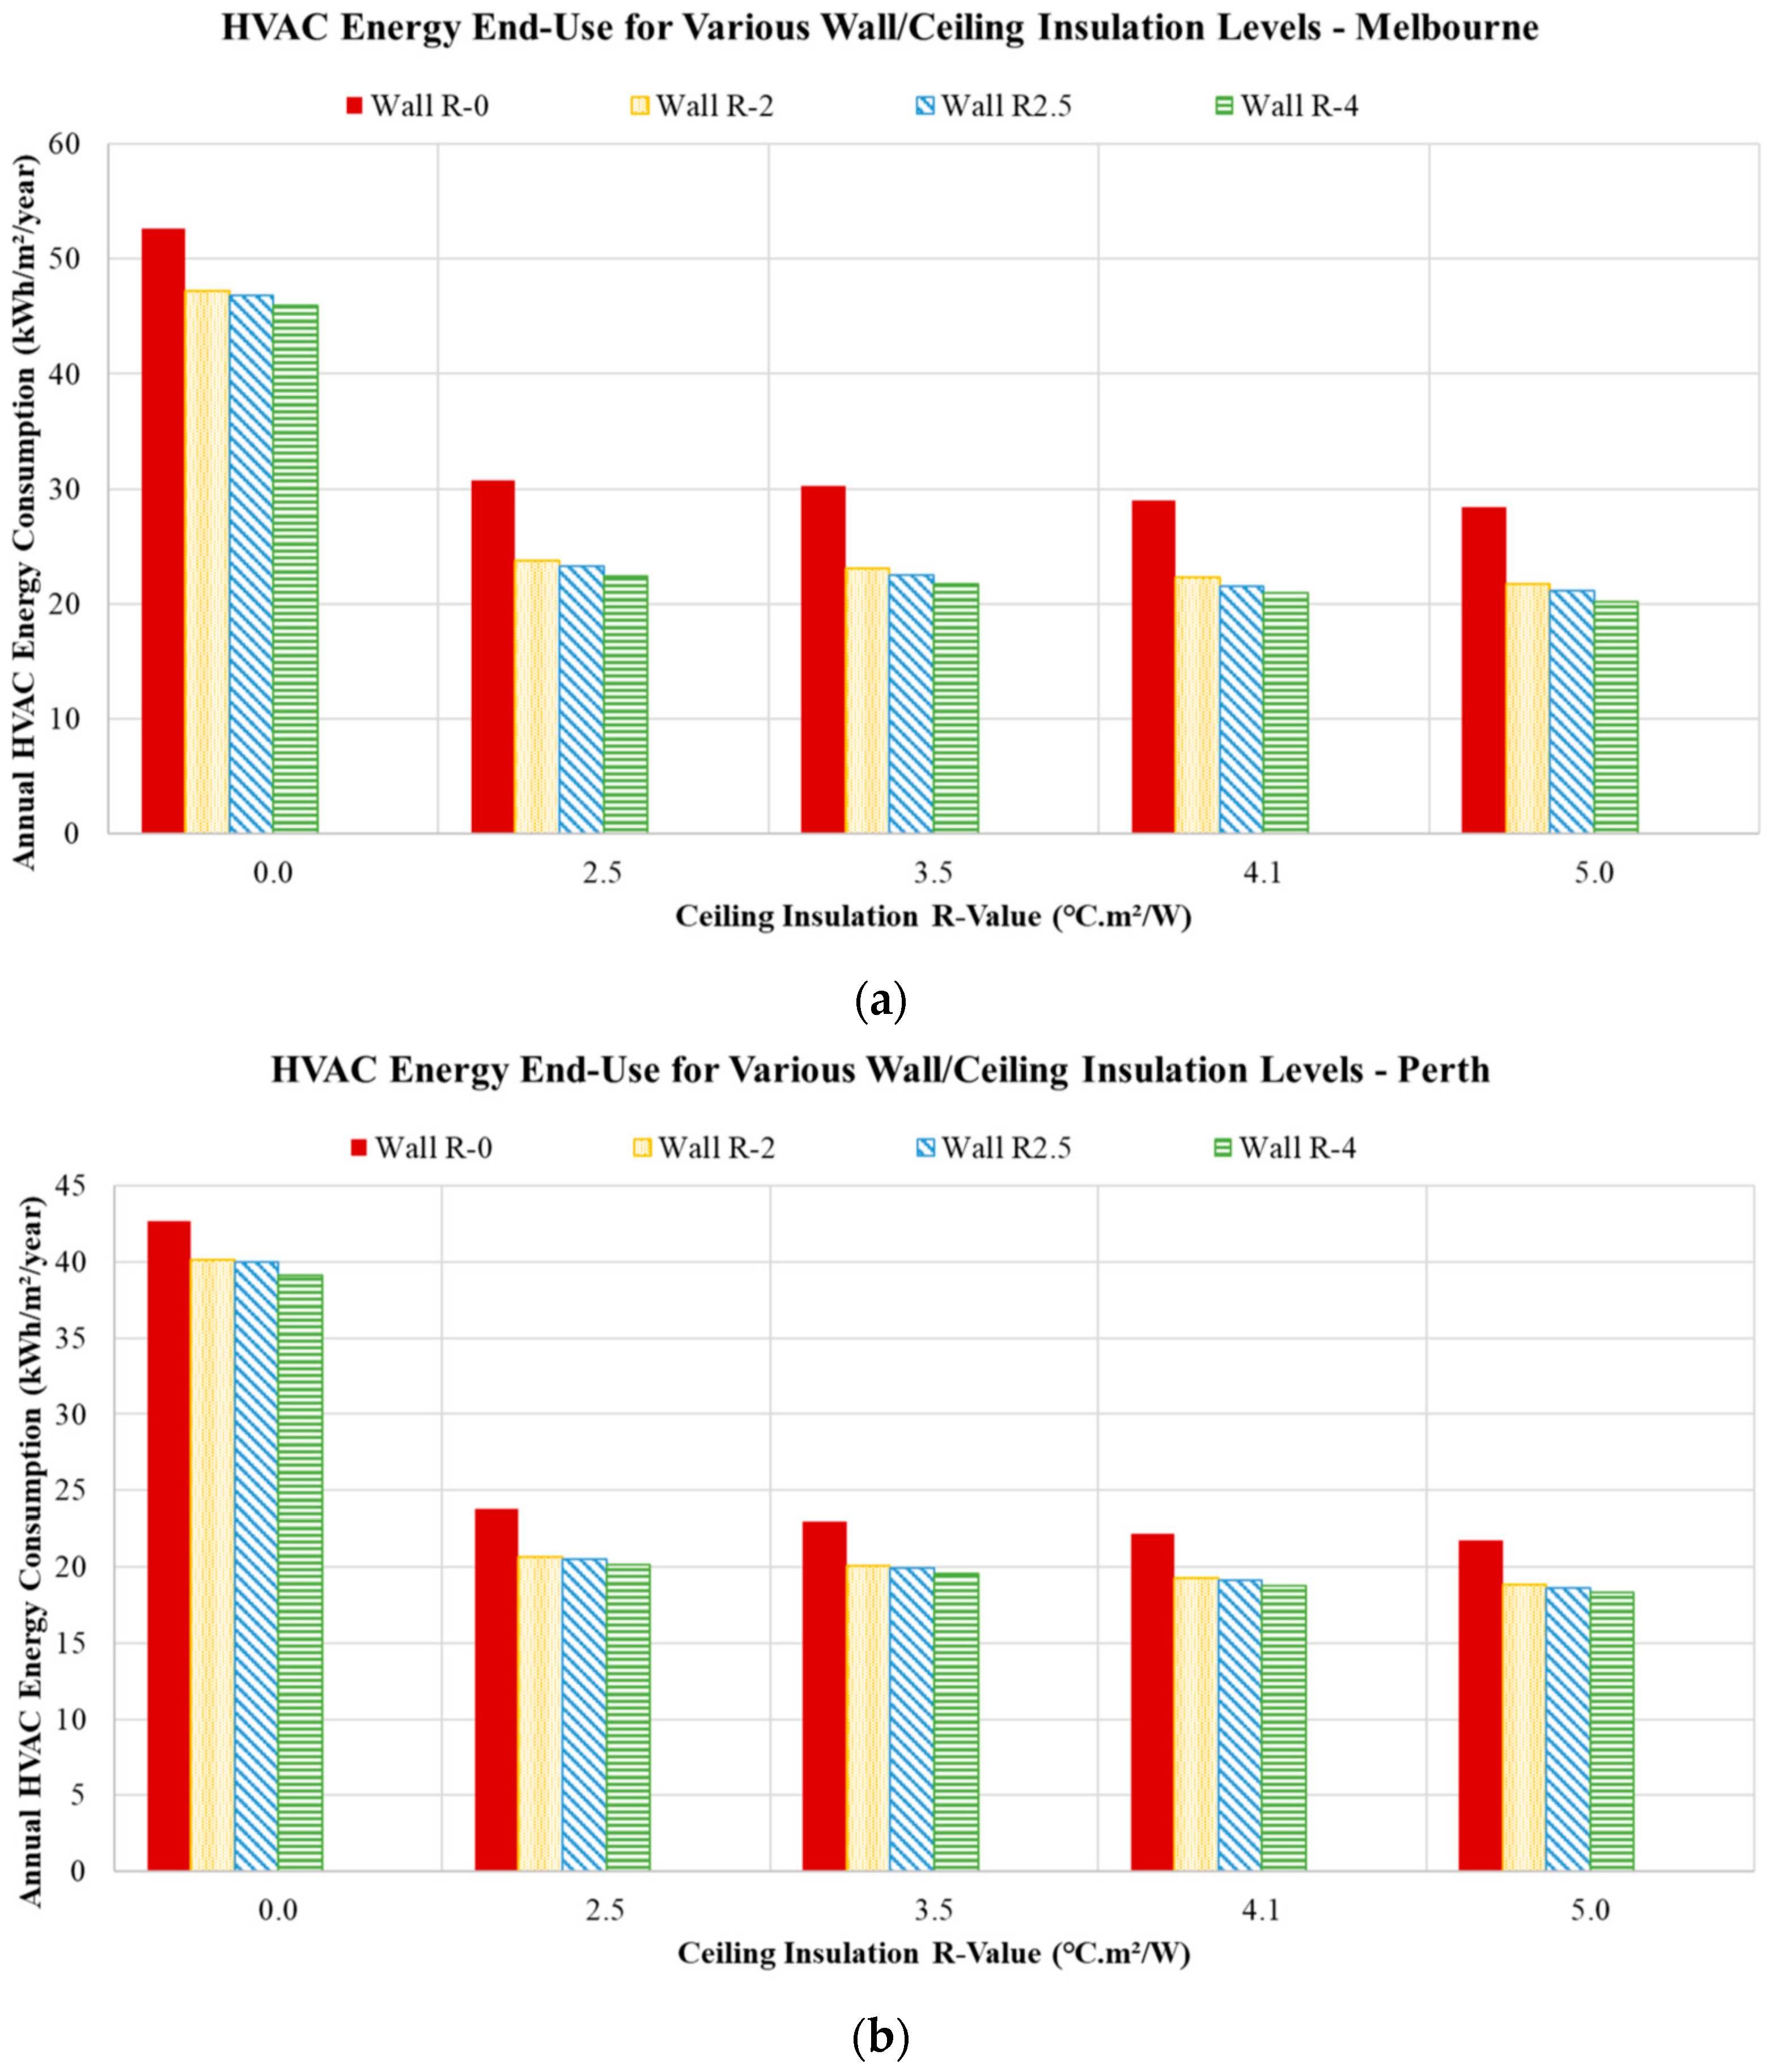
Figure 6 indicates the impact of wall and ceiling thermal insulation levels on the annual energy demands associated with both heating and cooling systems (i.e., HVAC) when the baseline house is in four Australian cities considered in this study. The effectiveness of adding thermal insulation in the walls and ceilings depends significantly on the thermal insulation R-value and the city’s climate. In general, the reduction in HVAC energy consumption follows a diminishing return trend with the R-value of both walls and ceiling regardless of the climate. Indeed, the magnitude of the incremental HVAC energy use reductions decreases substantially after the initial added thermal insulation levels. Moreover, thermal insulation provides more HVAC energy savings when added to the ceiling rather than the walls. Some observations specific to each climate can be outlined based on the analysis results summarized in Figure 6:

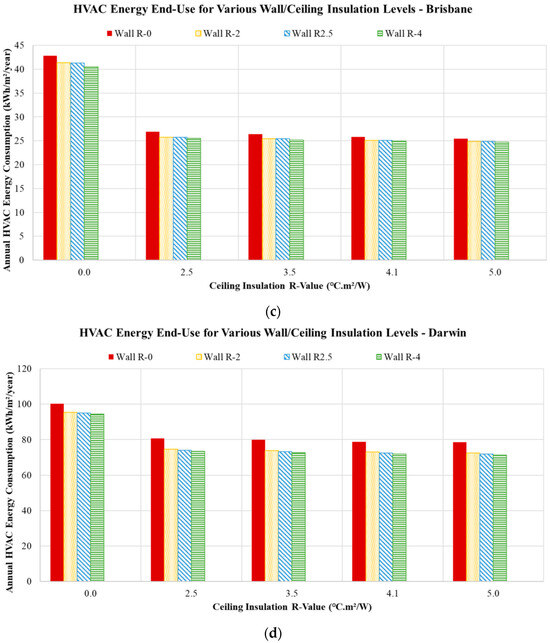
Figure 6.
Impact of walls and ceiling thermal insulation levels on annual HVAC energy end-use when the baseline house is in (a) Melbourne, (b) Perth, (c) Brisbane, and (d) Darwin.
- In Melbourne, when thermal insulation is added to an uninsulated design of the baseline house (i.e., no thermal insulation in the walls and ceiling), the heating/cooling energy end-use is reduced by 11.1% for R-2.5 in the walls only and by 41.7% for R-2.5 in the ceiling only. However, adding R-4 thermal insulation in the walls results in 12.8% savings in the annual HVAC energy use, representing an extra 1.7% reduction compared to the R-2.5 wall thermal insulation case. Similarly, doubling the ceiling thermal insulation to R-5 incurs a 46.0% reduction in the HVAC energy consumption, that is, 4.3% extra savings compared to the R-2.5 ceiling thermal insulation case.
- When the house is in Perth, the impact of the walls’ thermal insulation is even less effective than the ceiling’s insulation. Indeed, R-2.5 thermal insulation results in reductions of the annual HVAC energy end-use of 6.1% when added to the walls and 44.3% when installed in the ceiling for the uninsulated case of the baseline house.
- In Brisbane, most of the potential reductions in HVAC energy consumption associated with insulating the envelope components can be achieved by R-2.5 thermal insulation placed in the ceiling. Any higher thermal insulation levels placed in the walls and ceiling have limited impacts in decreasing further the energy demands of the HVAC system. When R-6 and R-4 thermal insulations are placed in the ceiling and walls, respectively, only a 5.4% incremental reduction in HVAC energy end-use can be achieved relative to the case of R-2.5 ceiling-only thermal insulation, which leads to 37.2% savings.
- In Darwin, which is characterized by a hot and humid climate, the addition of low levels of thermal insulation in both walls (R-2) and ceiling (R-2.5) can achieve most of the HVAC energy reduction potential estimated at 25.5%, which is higher than 19.6% attained when R-2.5 ceiling thermal insulation only is used and slightly lower than 28.8% achieved when R-6.0 ceiling and R-4.0 wall thermal insulations are considered.
3.1.2. Economic Analysis
Table 6 summarizes the simple payback periods for various combinations of thermal insulation levels for walls and ceilings when the baseline house is in four cities representing different Australian climate zones. The payback periods are estimated using the uninsulated case (i.e., R-0 for both walls and ceiling) as the reference option for determining both annual energy savings and incremental installation costs. As indicated in Table 6, installing ceiling thermal insulation has consistently lower simple payback periods than adding thermal insulation along the exterior walls. In fact, the payback periods for all the insulated wall-only cases (i.e., without any ceiling thermal insulation) are significantly higher than all other thermal insulation configurations, regardless of the climate considered in this analysis. Moreover, the shortest payback period for all the cities is specific to the case with R-2 ceiling thermal insulation without adding any thermal insulation in the walls.
Table 6.
Simple payback periods (expressed in years) for various combinations of walls and ceiling thermal insulation levels specific to houses located in four Australian cities and climate zones.
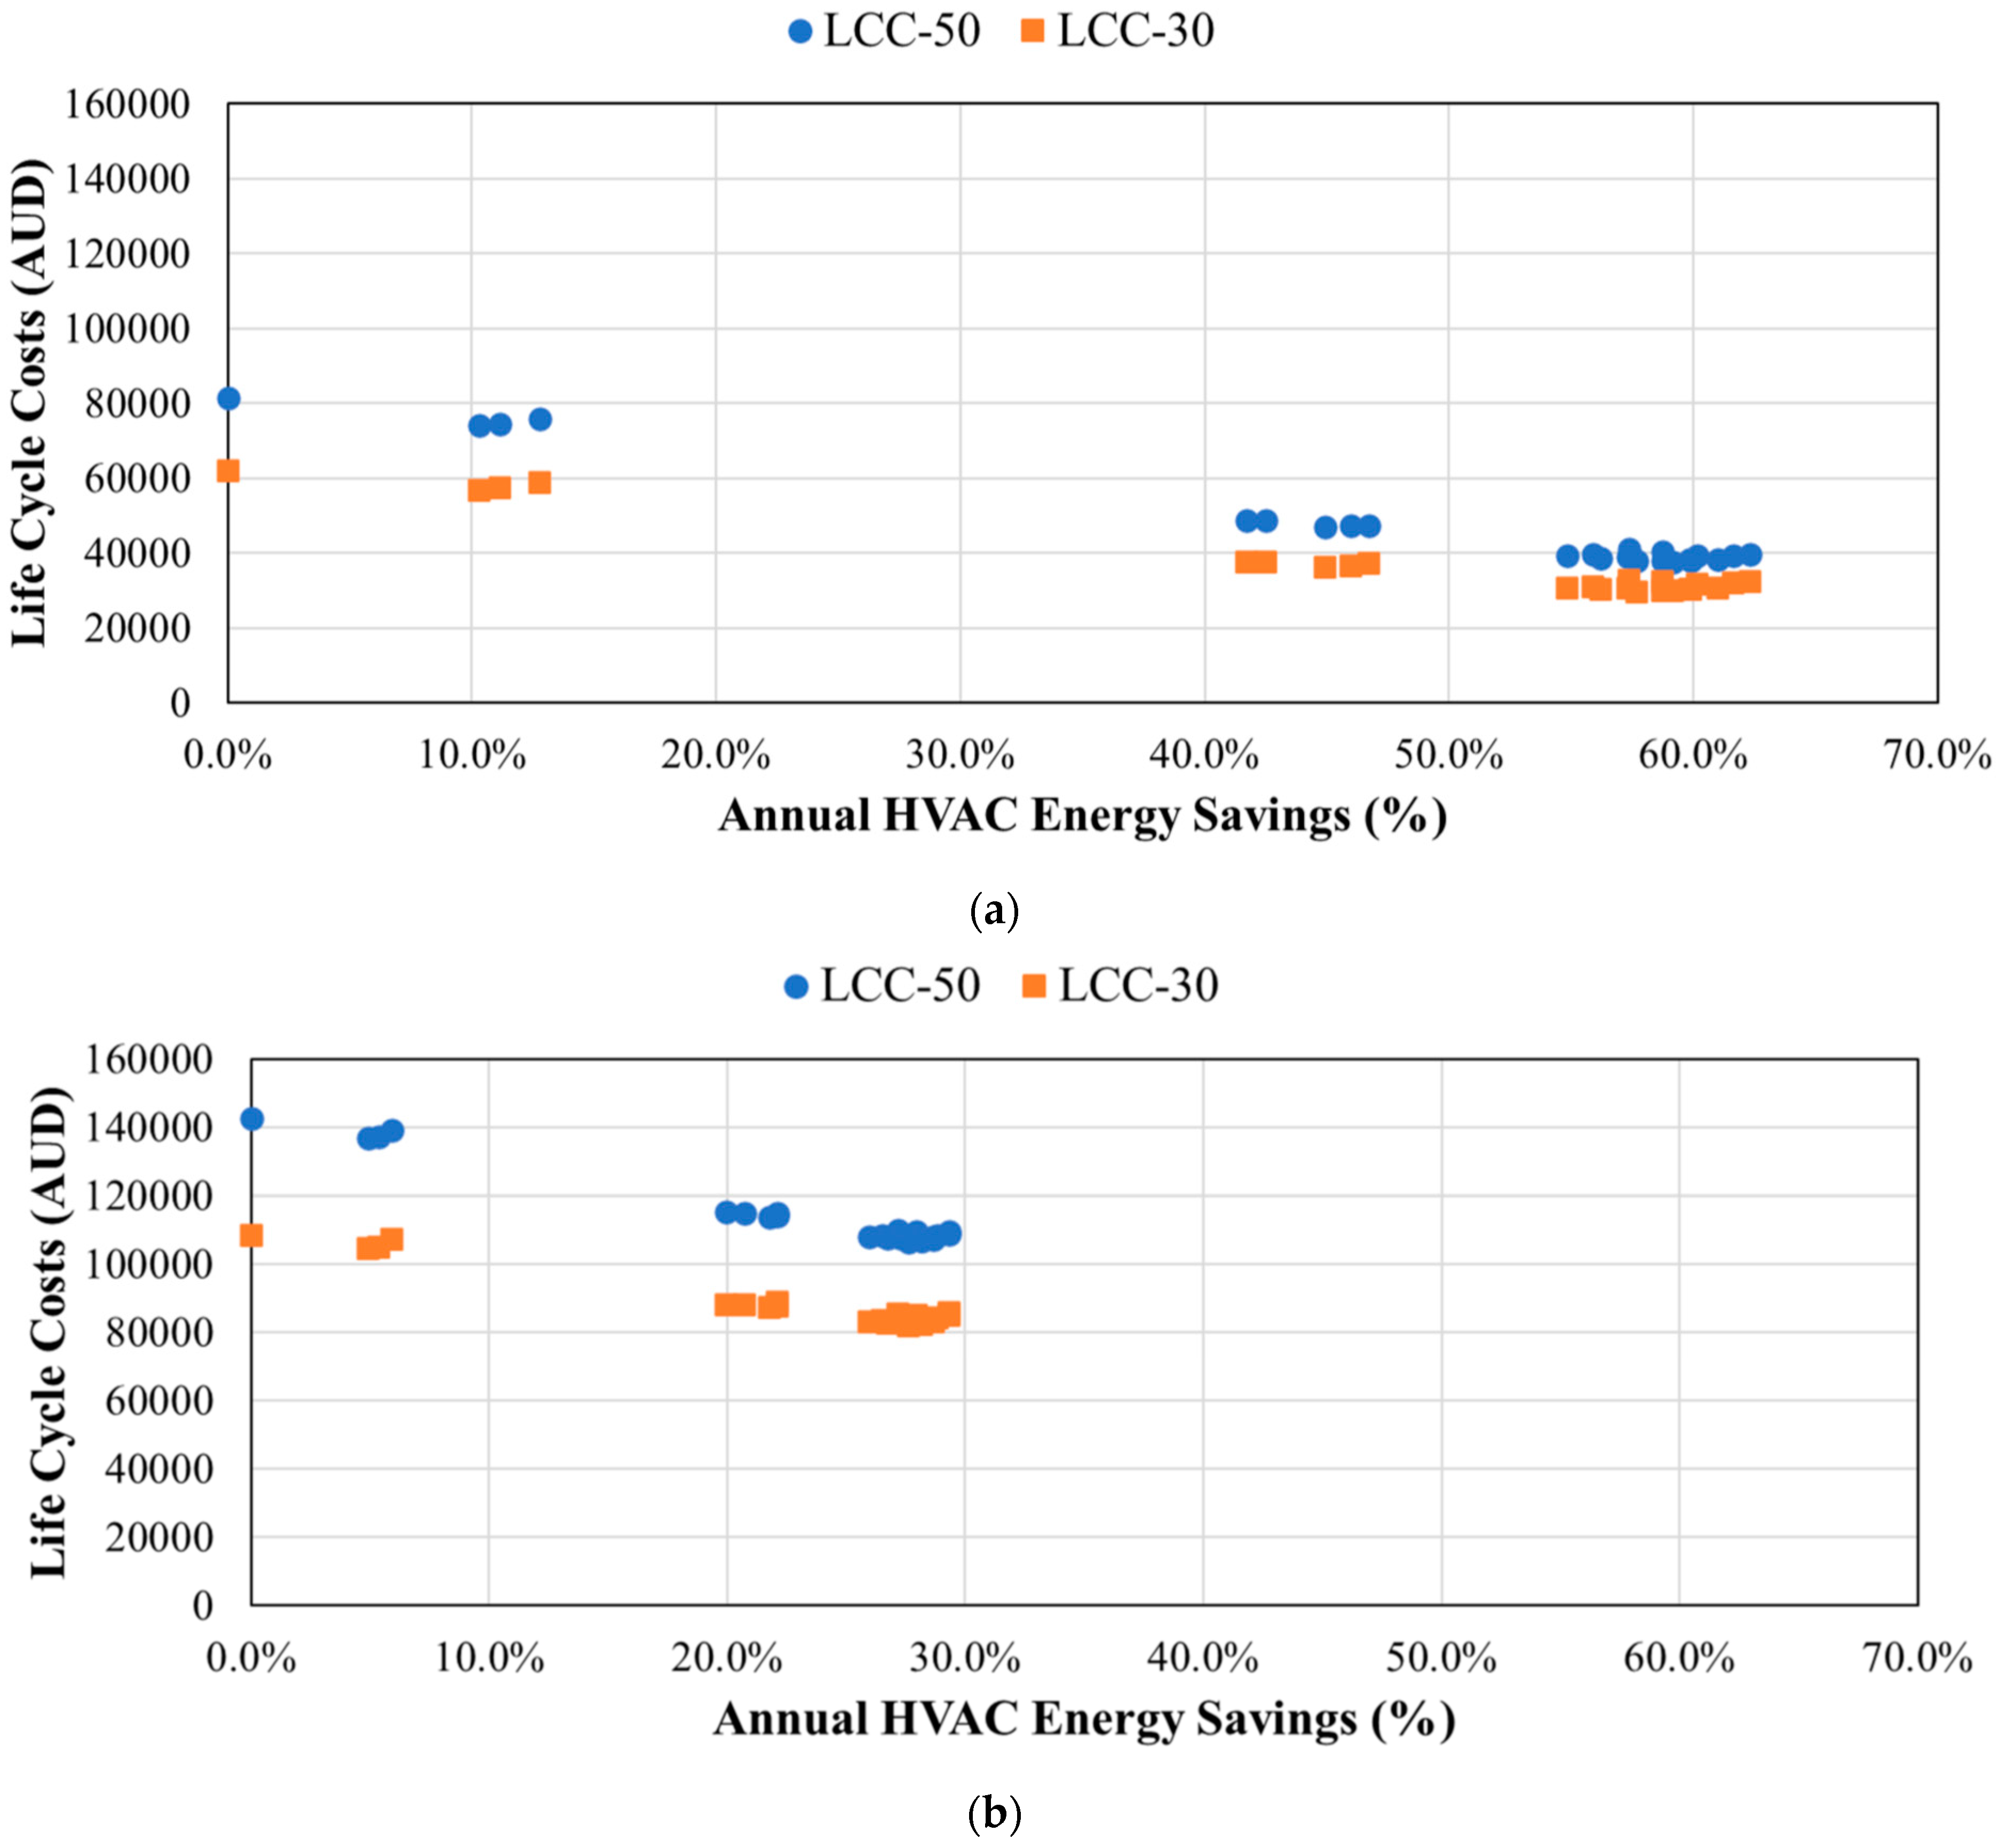
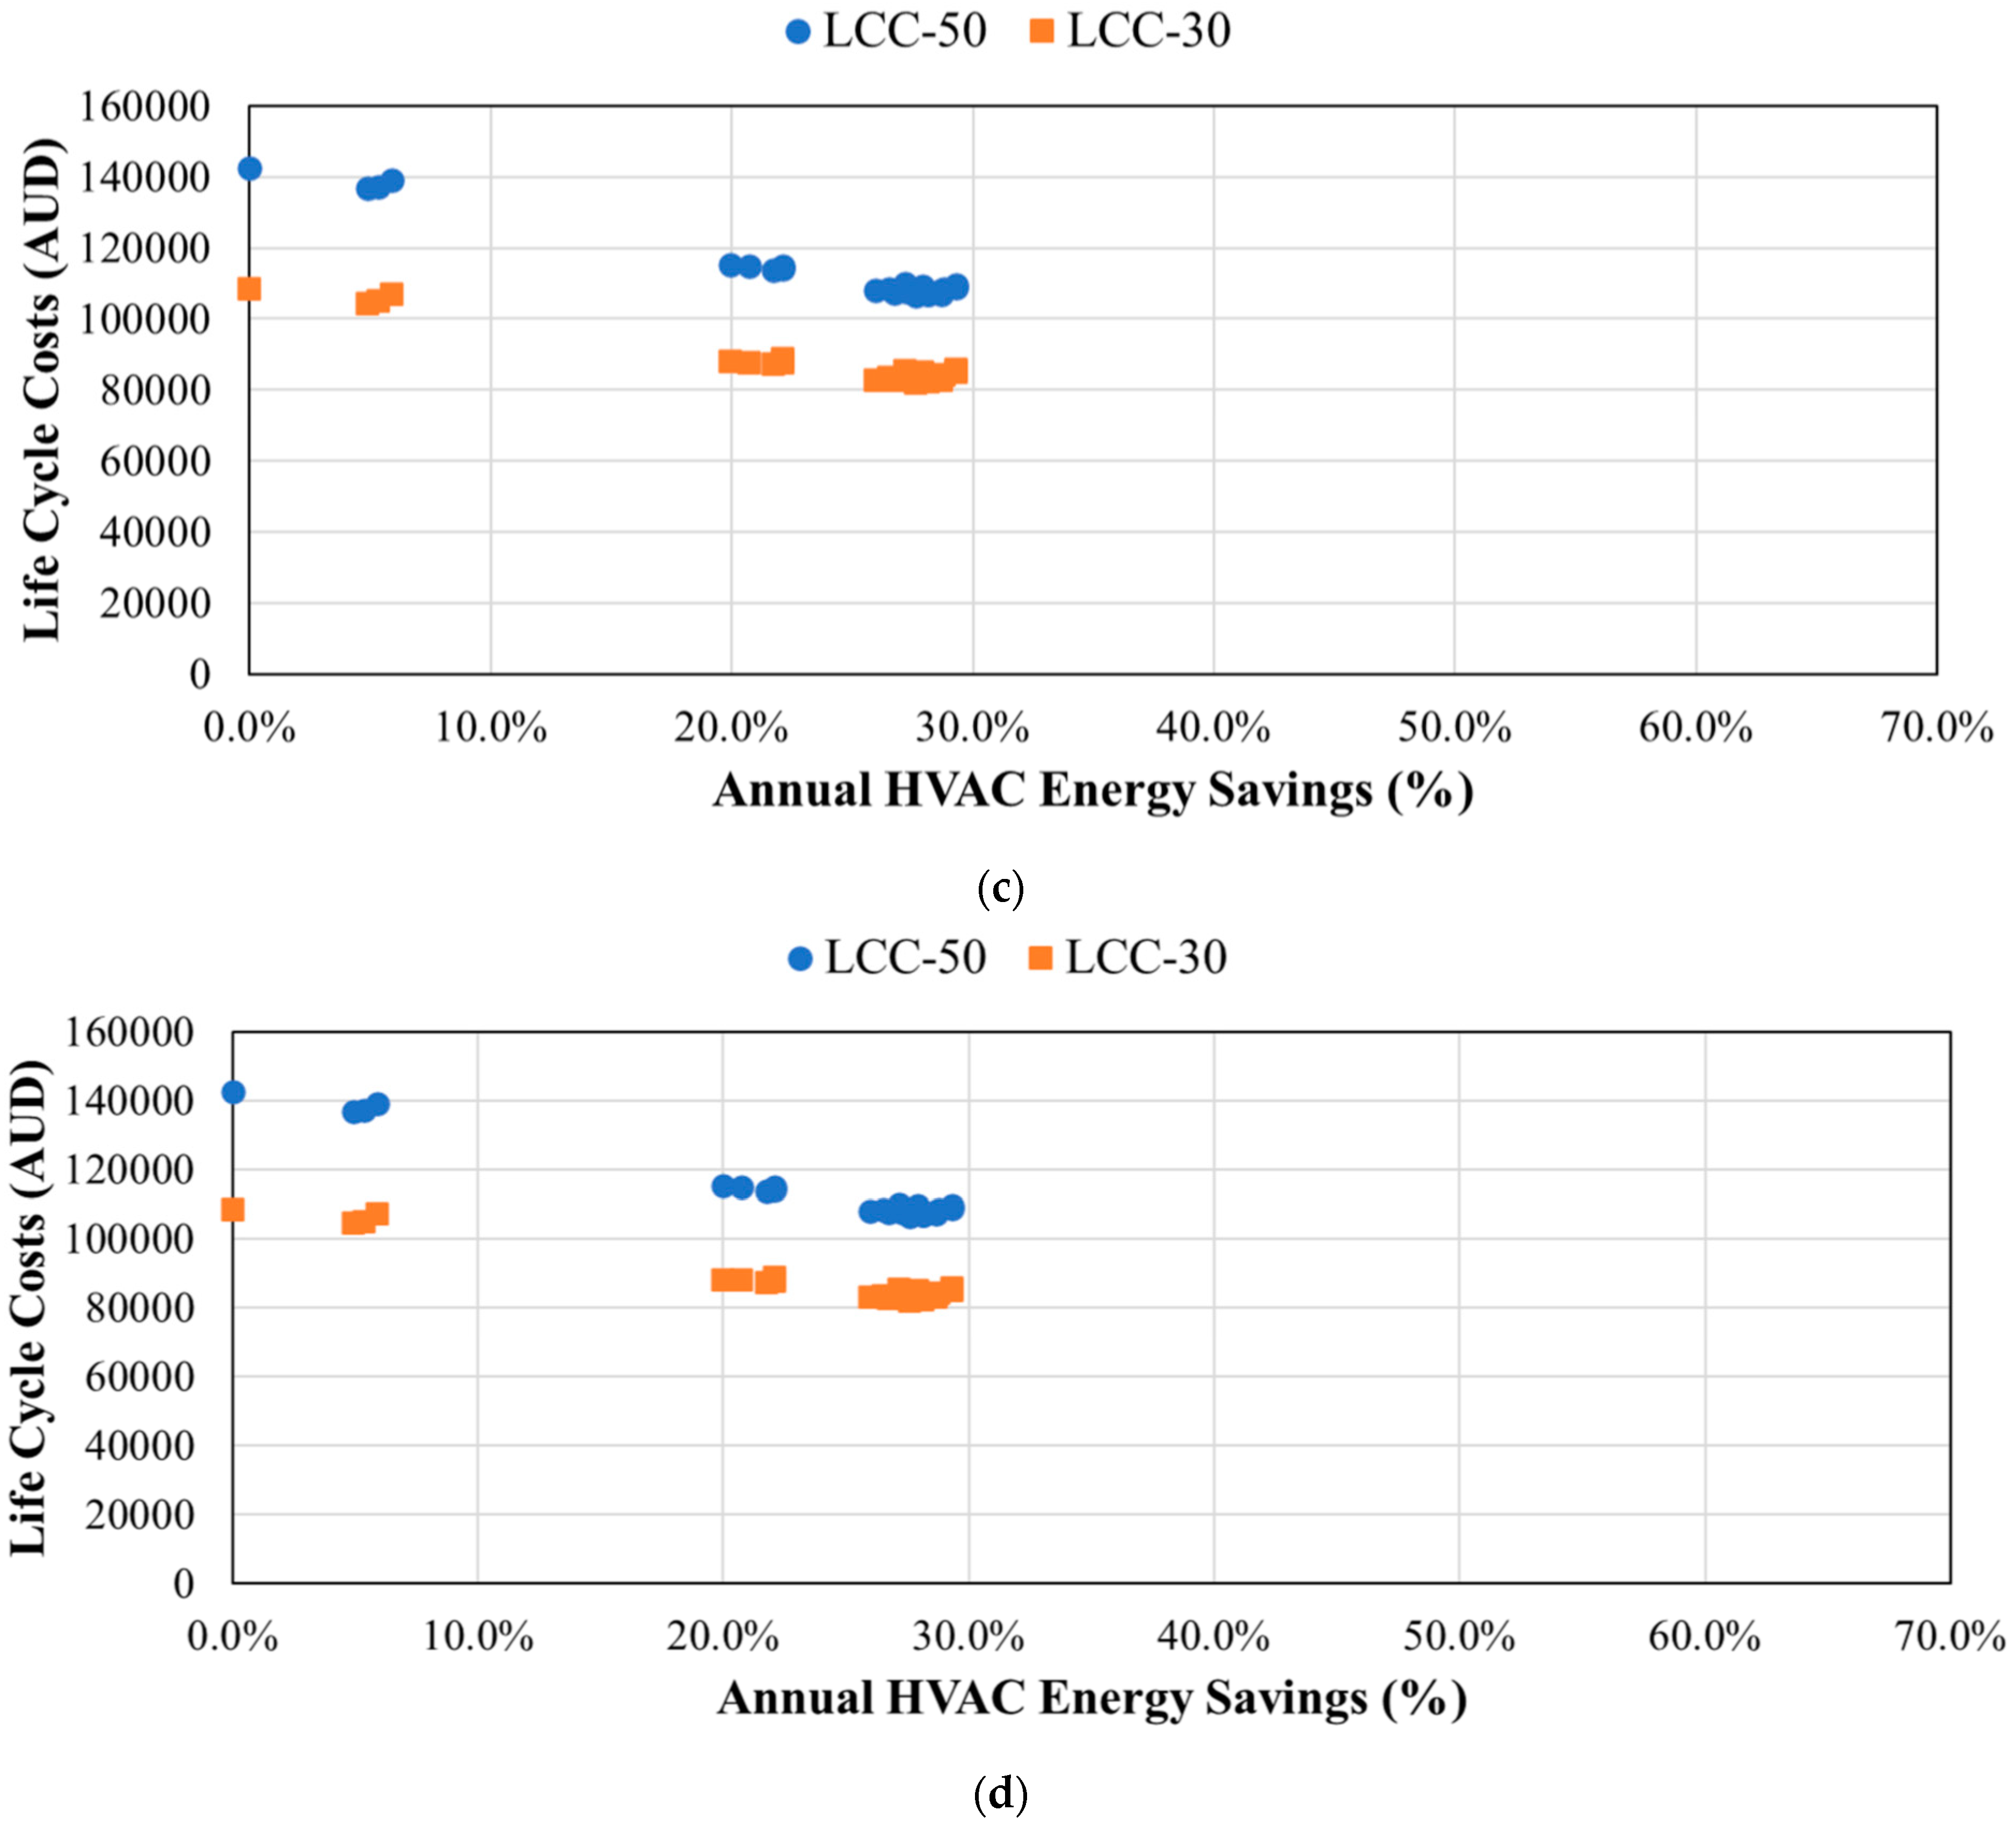
However, the analysis based on a simple payback period ignores important economic factors such as the interest rate of capital and escalation rate of energy prices, as well as the lifetime of houses. A more rigorous economic analysis is that based on life cycle cost accounting for all relevant cash flows during the lifetime of projects. The application of life cycle cost (LCC) analysis to various walls/ceiling thermal insulation combinations is summarized in Table 7 using a lifetime of 50 years and a discount rate of 3%. As highlighted in bold, the cases that minimize LCC values calls for adding thermal insulation in the ceiling (R-4.1) for Melbourne, Perth, and Darwin, as well as in the walls (R-2.0 for Perth and Darwin and R-2.5 for Melbourne). The optimal thermal insulation configuration for Brisbane consists of only placing R-4.1 in the ceiling. However, these optimal thermal insulation levels can vary depending on several factors, including the installation costs, the discount rates, and the lifetimes. Figure 7 illustrates the variation of LCC values with annual HVAC energy savings achieved by all the thermal insulation combinations considered in this analysis for two lifetimes (i.e., 30 years and 50 years). Lower lifetimes result in reduced LCC values with slightly different optimal values that achieve annual HVAC energy savings ranging from 27.6% for Darwin and 59.2% for Melbourne. The optimal thermal insulation combinations are the same for both lifetimes for all cities except for the cold climate of Melbourne, where the optimal thermal insulation combination of walls and ceiling is R-2.0/R-4.1 for a 30-year lifetime with HVAC energy savings of 57.7%, slightly lower than that achieved optimally for a 50-year lifetime for which R-2.5 and R-4.1 are needed for walls and ceiling, respectively.
Table 7.
Life cycle costs (expressed in AUD) for various combinations of walls and ceiling thermal insulation levels specific to houses located in four Australia cities and climate zones.

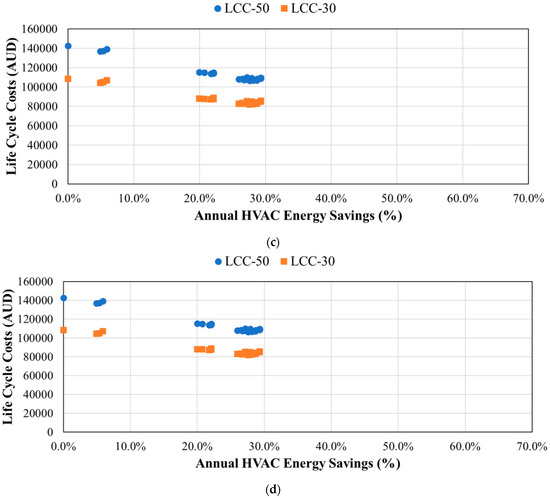
Figure 7.
Variations of life cycle costs relative to the percent savings in HVAC energy use when all combinations of walls and ceiling thermal insulation levels are considered with the house in (a) Melbourne, (b) Perth, (c) Brisbane, and (d) Darwin.
3.2. Impact of Window Glazing
3.2.1. Energy Performance Analysis
While the windows for the baseline house considered in this study have double-pane glazing filled with Aragon with timber frames, most new and existing houses in Australia are built with single-pane glazed windows as indicated by the statistics summarized in Table 8, which lists the distributions of both U-value and SHGC for windows based on data collected for NatHERS rating certificates [38].
Table 8.
Distributions of U-value and SHGC for windows in new and existing Australian housing stocks.
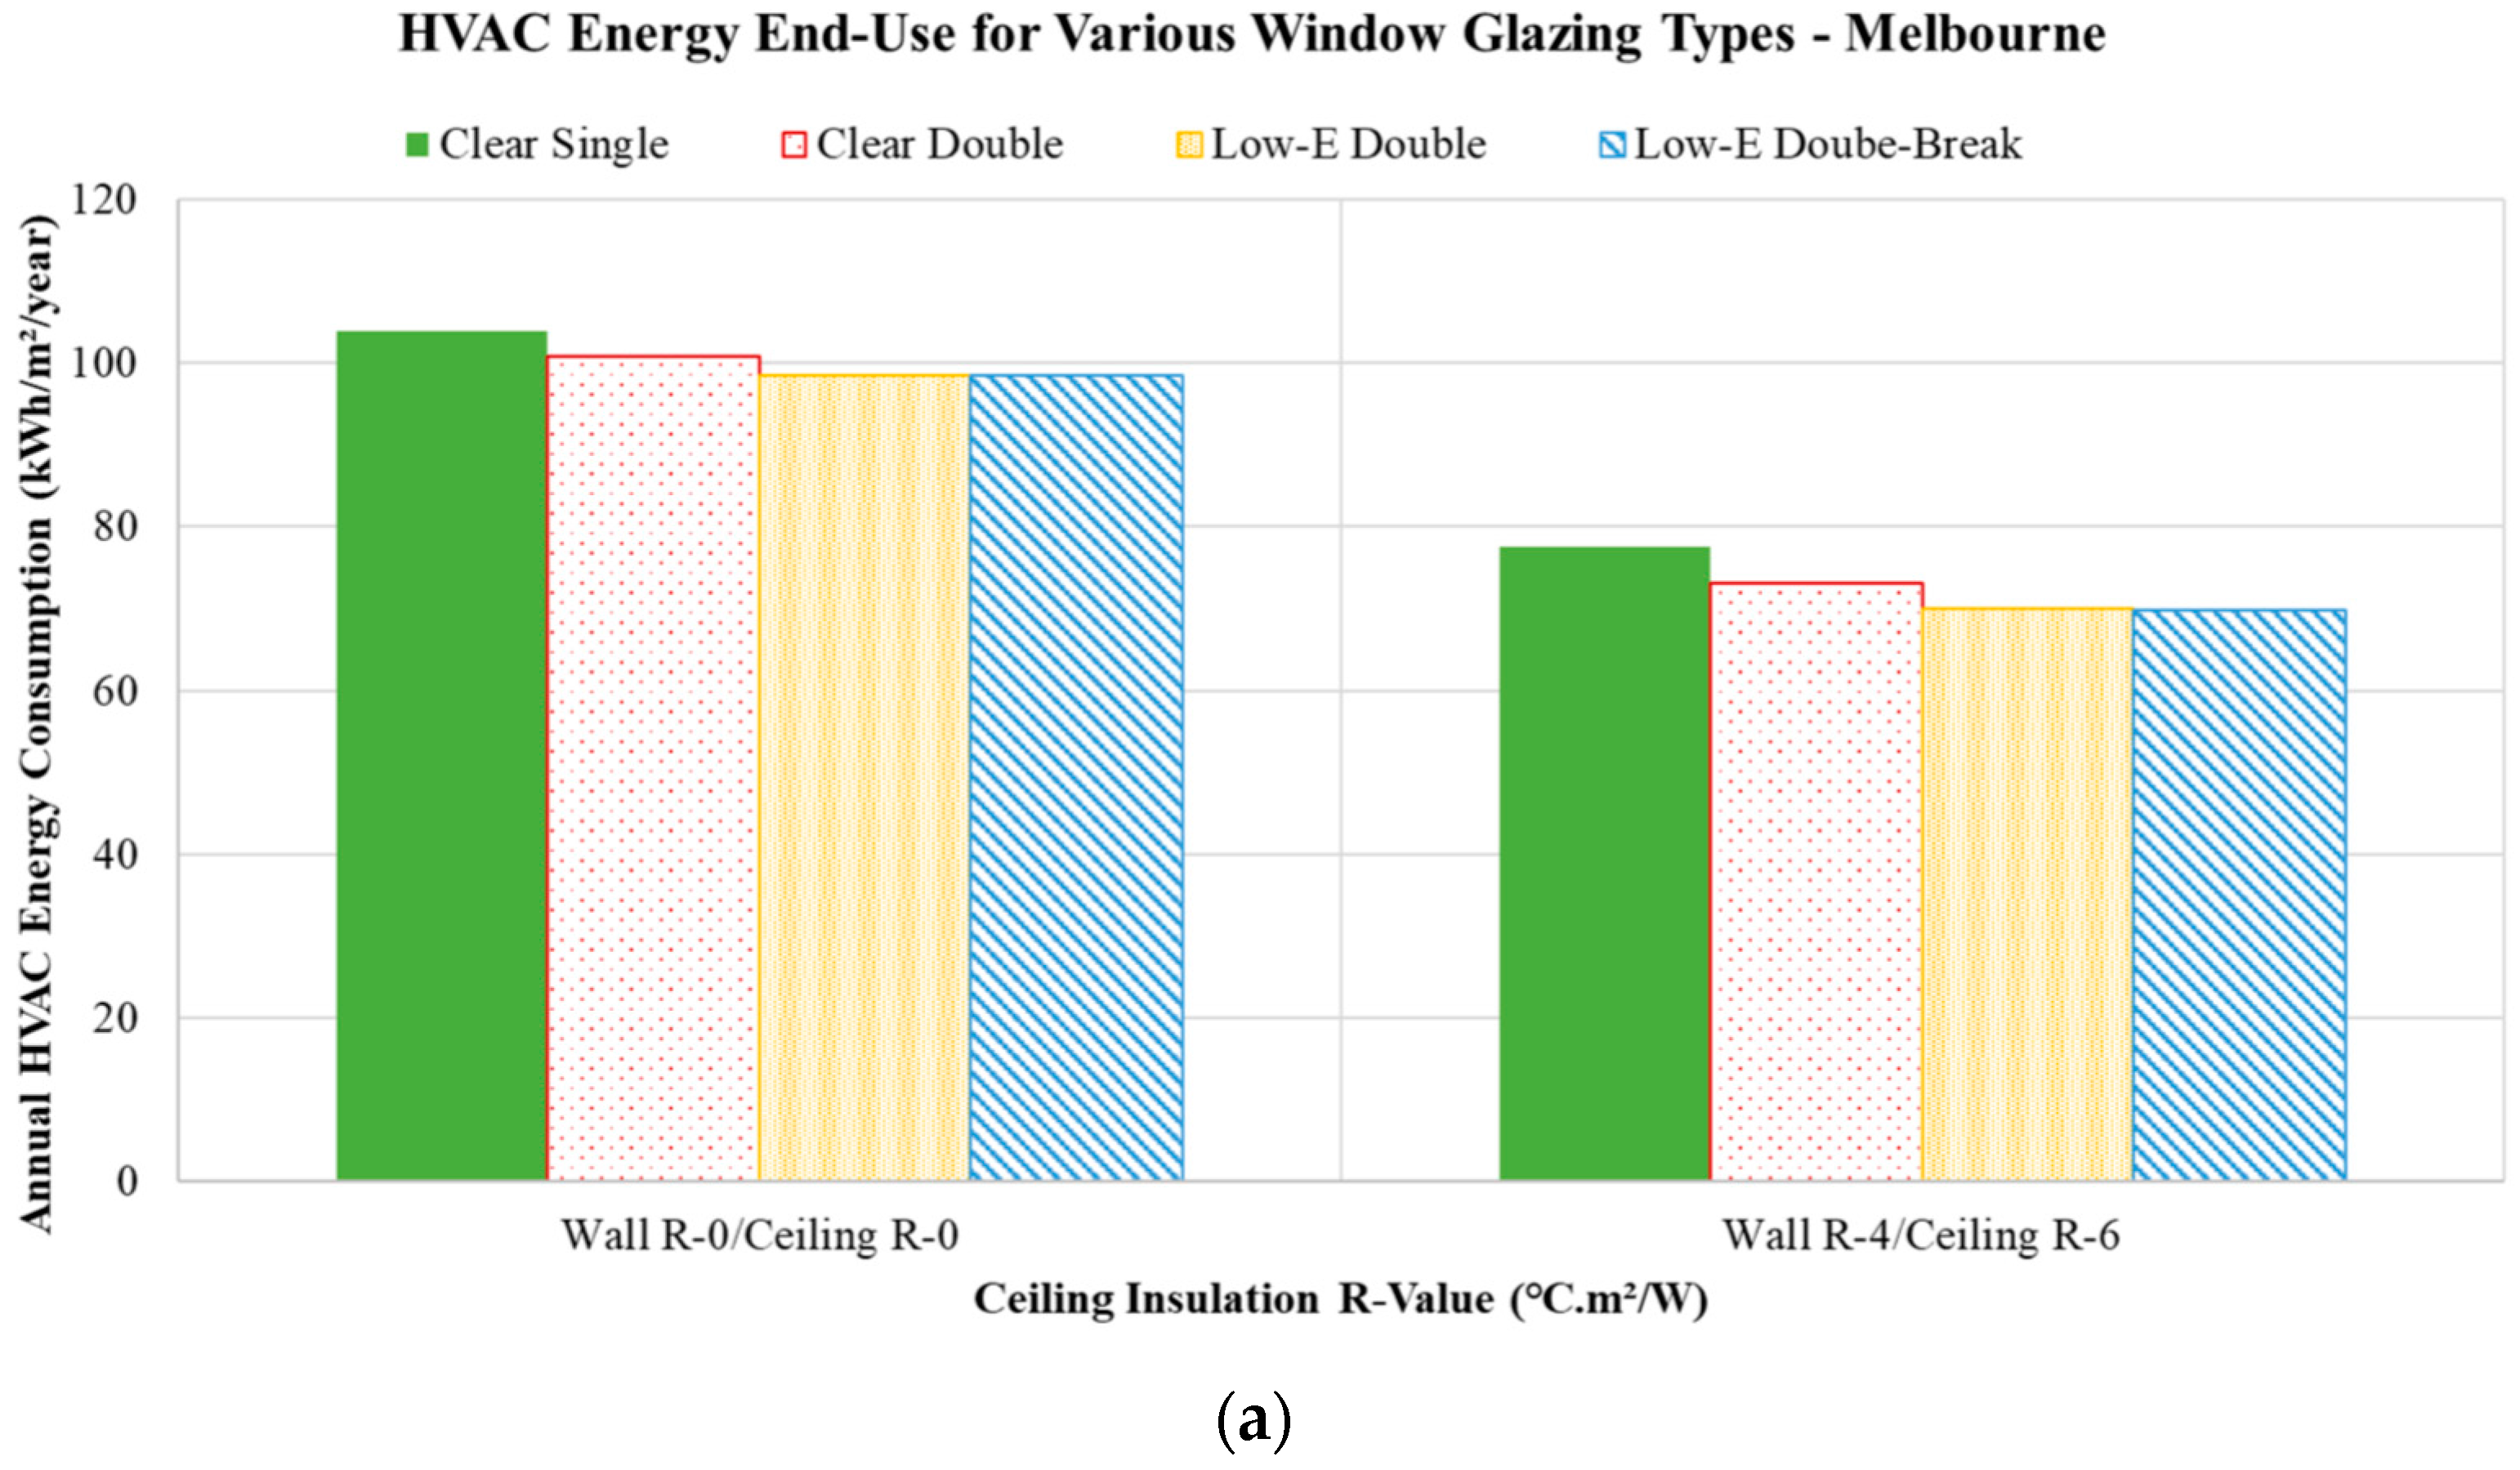
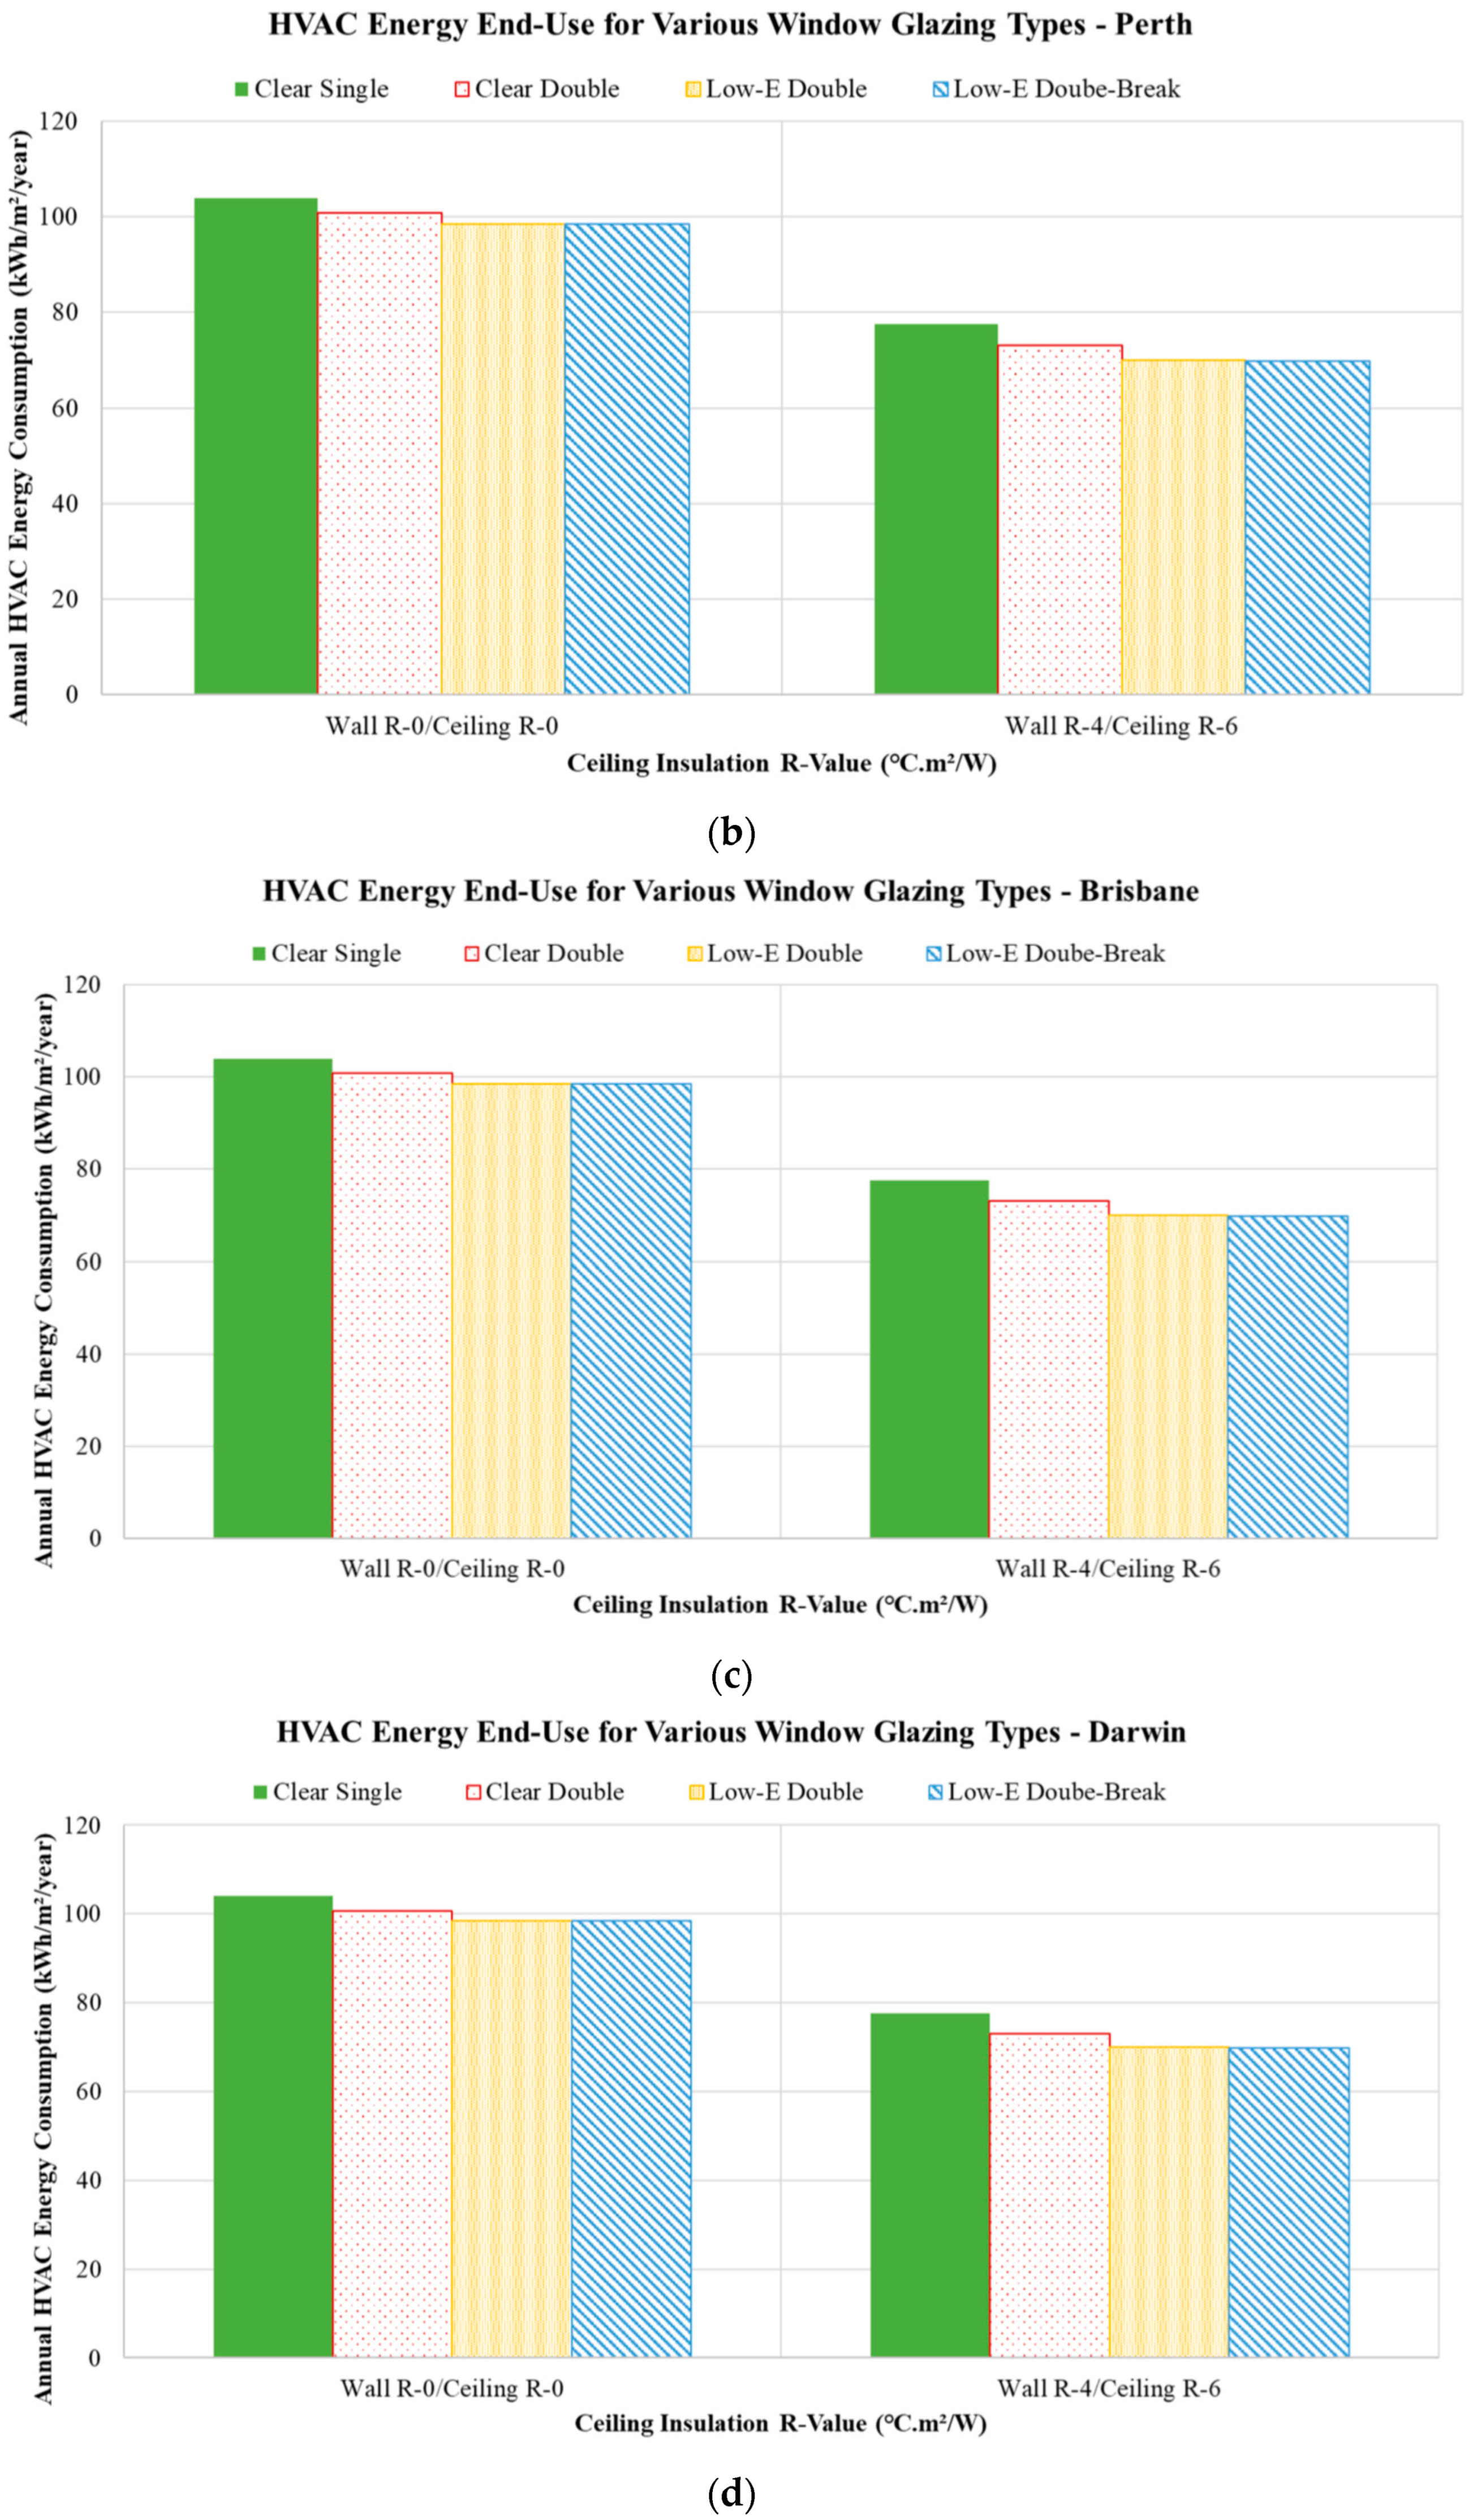
In this section, the impacts of the glazing type are determined on the annual HVAC energy end-use when the baseline house is in the four Australian cities considered in this study. Four glazing types are selected for this analysis as listed in Table 9, including their U-value and SHGC [31]. Figure 8 shows the annual HVAC energy end-use associated with the four glazing types listed in Table 9 combined with two walls/ceiling thermal insulation configurations including uninsulated case (i.e., no thermal insulation in both the walls and ceiling) and highly insulated case (i.e., R-6 for ceiling and R-4 for walls). Generally, the results indicate that the selection of the glazing type has a more significant impact on the HVAC energy demands when the walls/ceiling are insulated compared to the uninsulated case for all four climates. Indeed, when using Low-E double-pane windows with thermal breaks instead of clear single-pane windows, the annual HVAC energy use can be reduced by up to 19% for the well-insulated house but only up to 7.5% for the uninsulated case.
Table 9.
List of U-value, SHGC, and cost for four window glazing types available in Australia.
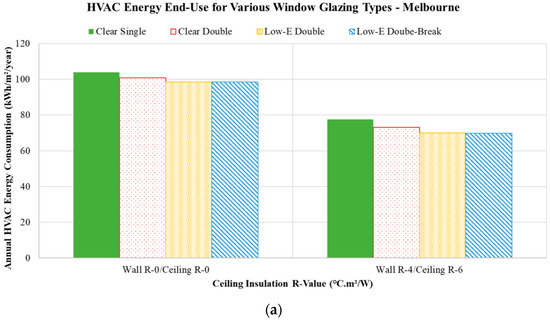
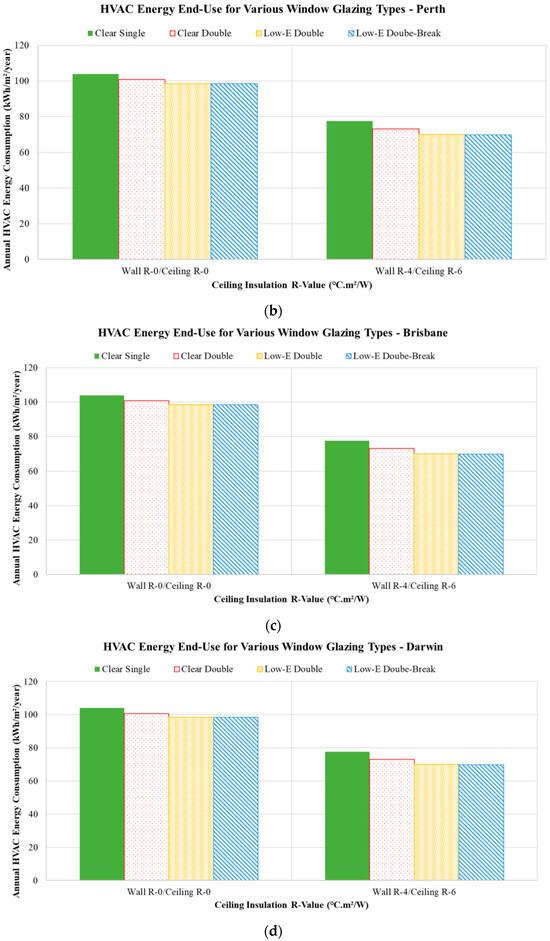
Figure 8.
Impact of window glazing types on HVAC energy end-use when the house is in (a) Melbourne, (b) Perth, (c) Brisbane, and (d) Darwin.
3.2.2. Economic Analysis
The cost-effectiveness of alternative glazing options relative to the clear single windows of the house considered in this study is summarized in Table 10 and Table 11 using, respectively, simple payback periods and LCC analysis. While the shortest payback period -as highlighted in bold in Table 10- is achieved for the clear double glazing, it is the Low-E double glazing that minimizes the LCC values for all four cities except for the case of well-insulated houses in Melbourne, where Low-E double glazing with thermal breaks is the most cost-effective option, as highlighted in bold in Table 11. However, the differences in LCC values for all double-glazing types are not significant, indicating that similar cost benefits can be achieved using double-pane windows. These results are consistent with a recently reported economic assessment of the glazing types that are suitable for residential buildings in Australia [39].
Table 10.
Simple payback periods (expressed in years) for installing three glazing types instead of clear single windows specific to houses located in four Australian cities.
Table 11.
Life cycle costs (expressed in AUD) for four glazing types for windows specific to houses located in four Australian cities.
3.3. Impact of Air Infiltration
In this section, the effect of air leakage of the building envelope on HVAC energy end-use is investigated for the four Australian cities. While the NCC does not require minimum air leakage performance of residential buildings, it recommends an infiltration rate of 10 ACH at a 50 Pa pressure difference between indoors and outdoors in its 2019 version [10]. This level remains higher than the passive house requirements of less than 1 ACH at 50 Pa.
3.3.1. Energy Performance Analysis
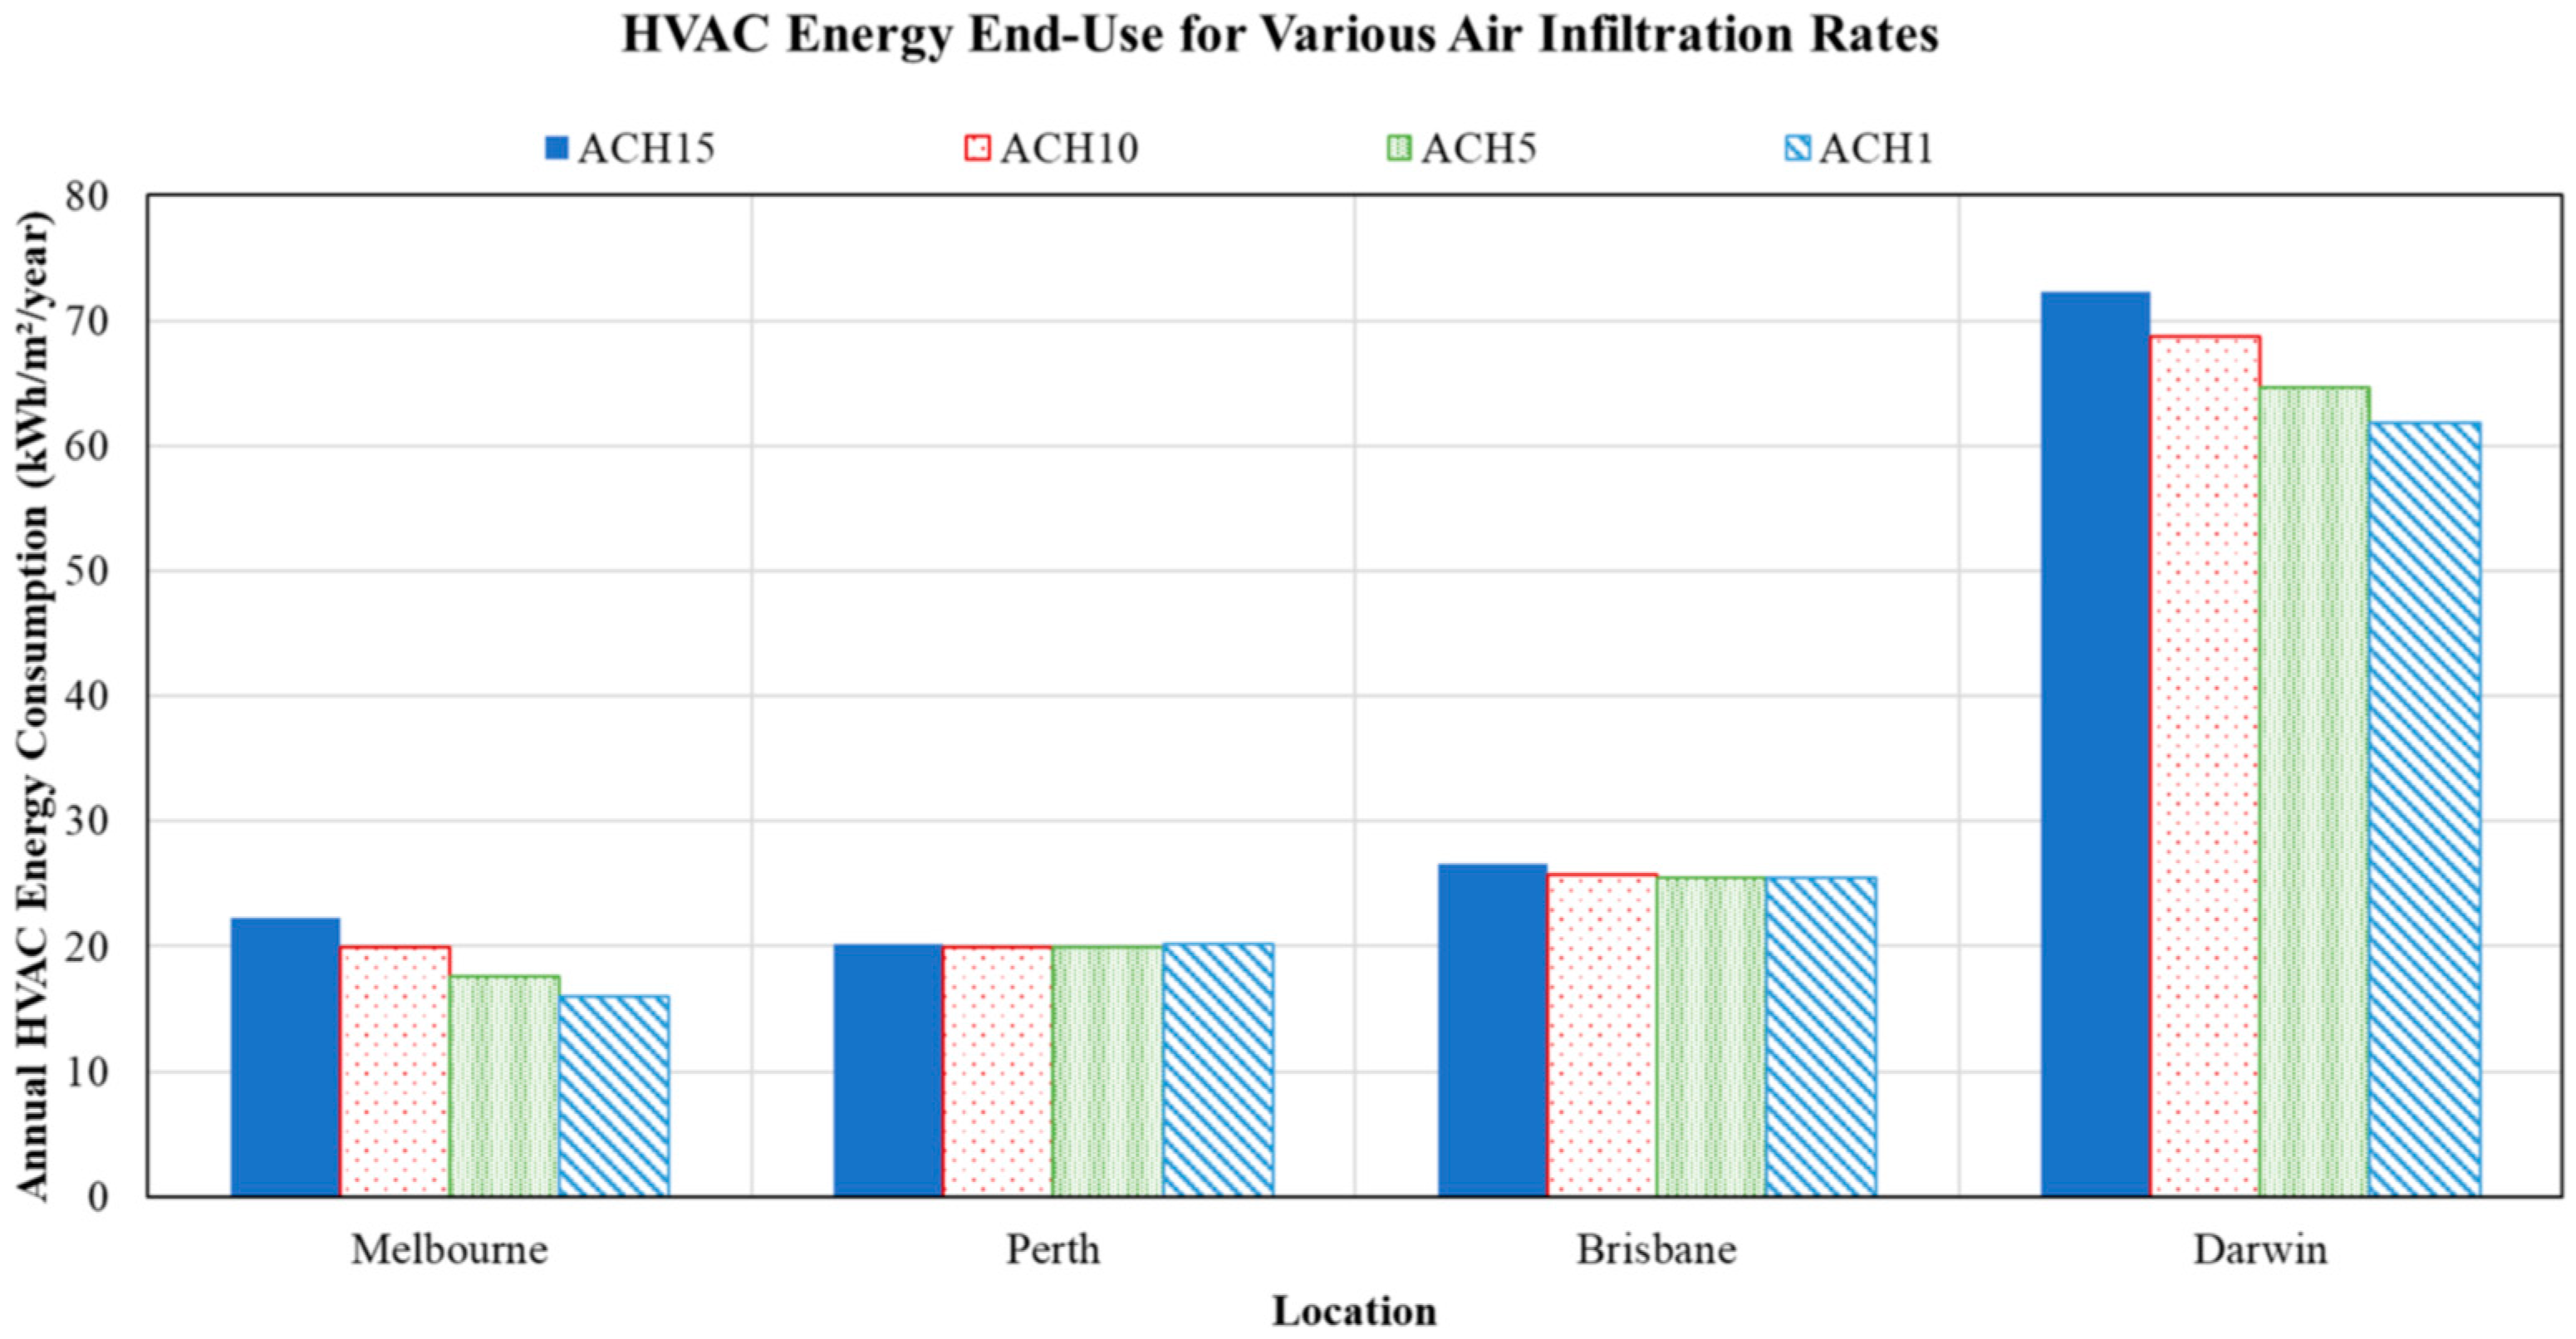
To assess the impact of air leakage on the energy performance of the case study house is investigated using four air infiltration rates, including 15 ACH, 10 ACH, 5 ACH, and 1 ACH rated at 50 Pa as depicted in Figure 9 for four Australian cities. As indicated in Figure 9, the effect of air leakage varies highly on the climate. Indeed, when the house is in Melbourne and Darwin, the air leakage noticeably affects the HVAC energy needs with lower air infiltration rates resulting in reduced energy demands. For instance, when the air infiltration rate is reduced from 15 ACH to 1 ACH, the annual HVAC energy end-use is decreased by 28% when the house is in Melbourne. However, the air infiltration rate seems to have little impact on the energy performance of the baseline house when located in Perth and Brisbane.
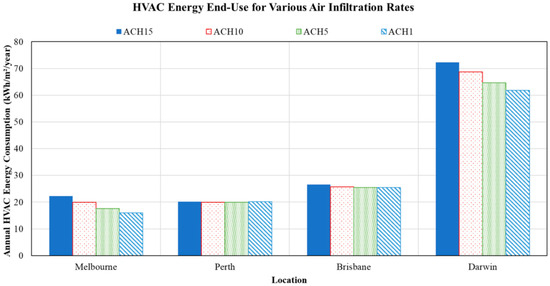
Figure 9.
Effect of air infiltration rate on annual HVAC energy end-use for four cities in Australia.
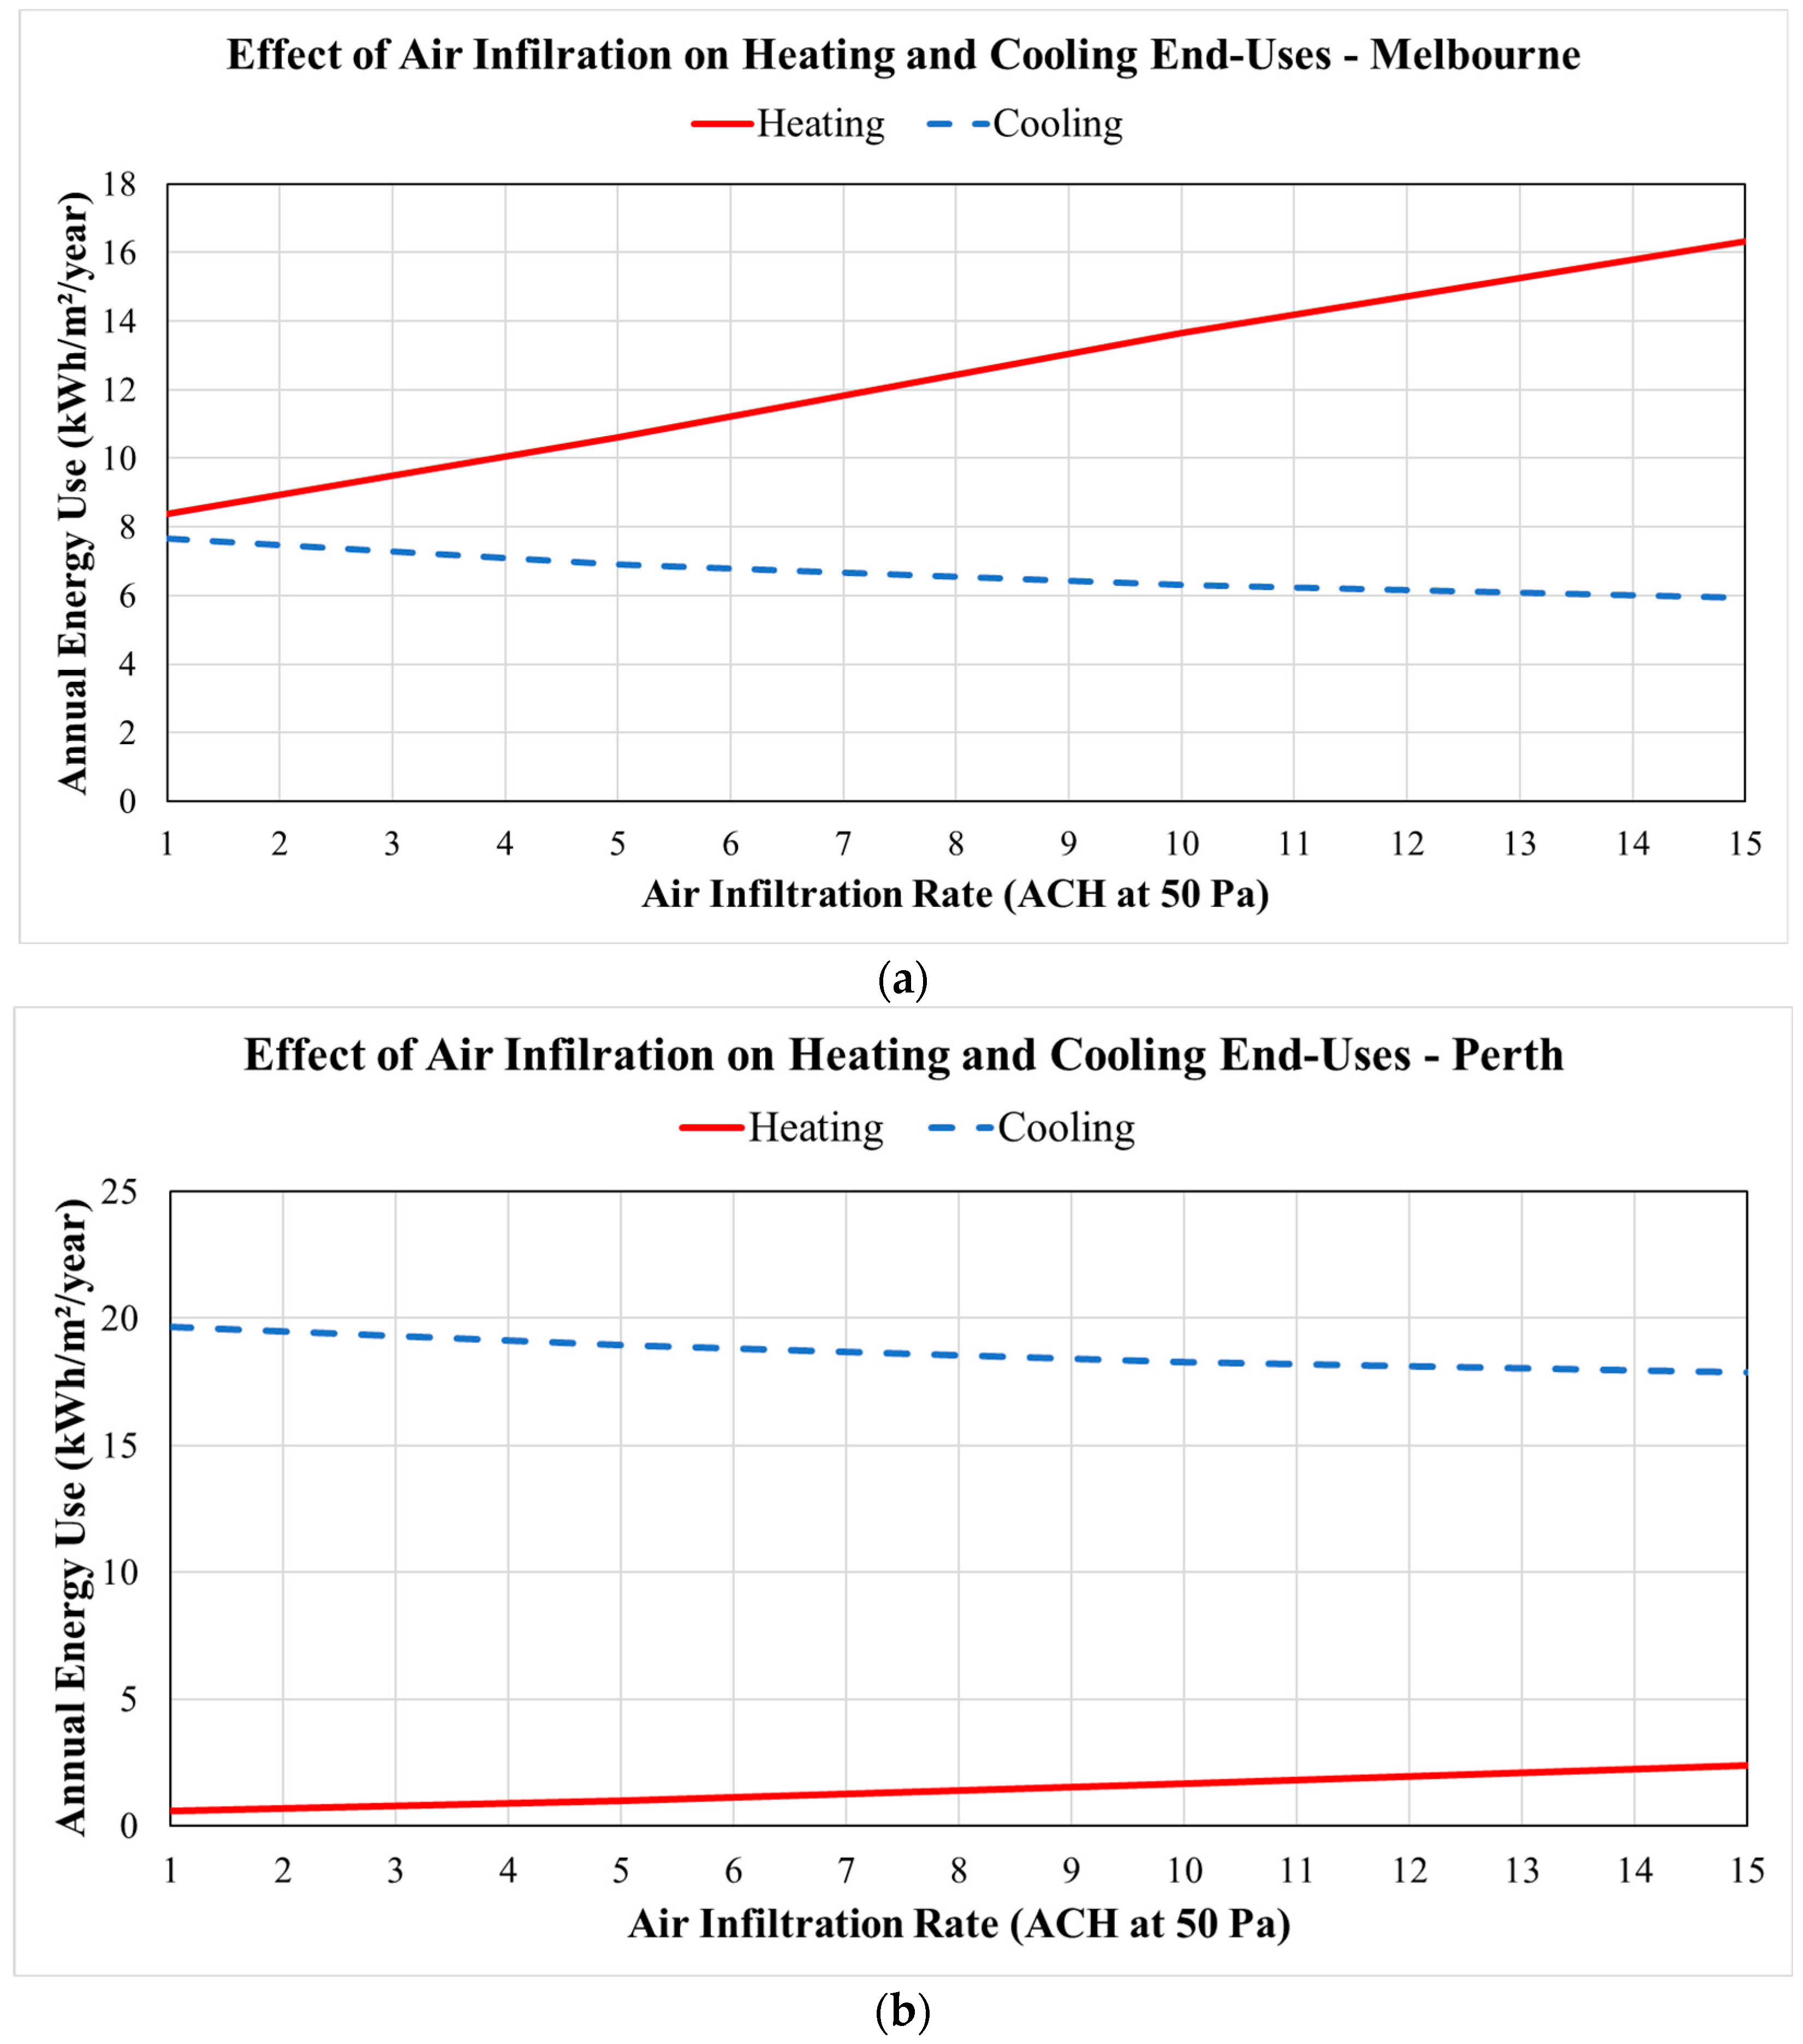
The specific effects of air leakage on both heating and cooling energy end-uses are highlighted in Figure 10 when different climate features in Melbourne and Perth characterize the house. As shown in Figure 10, air infiltration rate affects substantially both the heating and cooling energy end-uses in Melbourne as well as Perth. Indeed, lower air infiltration rate results in a significant reduction in heating and a noticeable increase in cooling energy demands. When air infiltration rate is reduced from 15 ACH to 1 ACH, the heating needs are reduced by 49% in Melbourne and 78% in Perth. However, the same reduction in air infiltration rate increases the cooling energy end-use by 30% in Melbourne and 10% in Perth. The higher cooling energy end-use is due to the loss of free cooling resulting from introducing to the house cool outdoor air, although uncontrollably, especially during the nighttime periods when ambient air temperatures are generally noticeably lower than the indoor cooling temperature setpoint even during the summer periods for both Melbourne and Perth. Since Melbourne has a heating-dominated climate, the effects of air infiltration rate on heating outweigh its impacts on cooling. For the warm temperate climate of Perth, the effects of air infiltration rate on both heating and cooling are balanced, resulting in unnoticeable effects on the overall annual HVAC energy use.
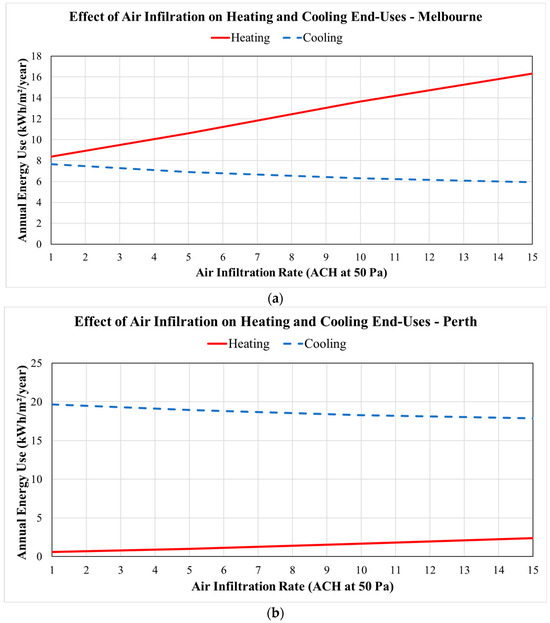
Figure 10.
Variations of heating and cooling energy end-uses with air infiltration rate when the house is in (a) Melbourne and (b) Perth.
3.3.2. Economic Analysis
Table 12 lists the life cycle costs associated with four levels of air leakage in the building envelope of the prototypical house. These costs are derived from the data in Table 5 and are applicable to achieve any level of air tightness considered in this analysis. The cost benefits of tighter homes vary significantly with the climate rather than the lifetime considered in the LCC analysis. This holds true even when factoring in the periodic weatherstripping costs needed to maintain the desired level of air tightness. The air infiltration rate that minimizes LCC is highlighted in bold for each city. As expected, airtight houses in dominantly cold or hot climates, such as in Melbourne and Darwin, are cost-effective but not in relatively mild climates like Perth and Brisbane, regardless of the considered lifetime period. In Melbourne, unlike the case of Darwin, improvements in air leakage to make homes very tight (i.e., 1 ACH) are close to being cost-beneficial, especially for longer lifetimes.
Table 12.
Life cycle costs (expressed in AUD) associated with various air leakage levels for houses located in four Australian cities.
3.4. Impact of Temperature Settings
While not design options, the temperature settings can have significant impacts on both the design specifications as well as the energy performance of buildings [40]. In this section, the energy performance of the baseline home is assessed when various temperature settings are considered. The temperature settings depend mainly on the occupant’s preferences and can be easily implemented at no cost using programmable or smart thermostats [41].
3.4.1. Effect of Cooling Temperature Settings
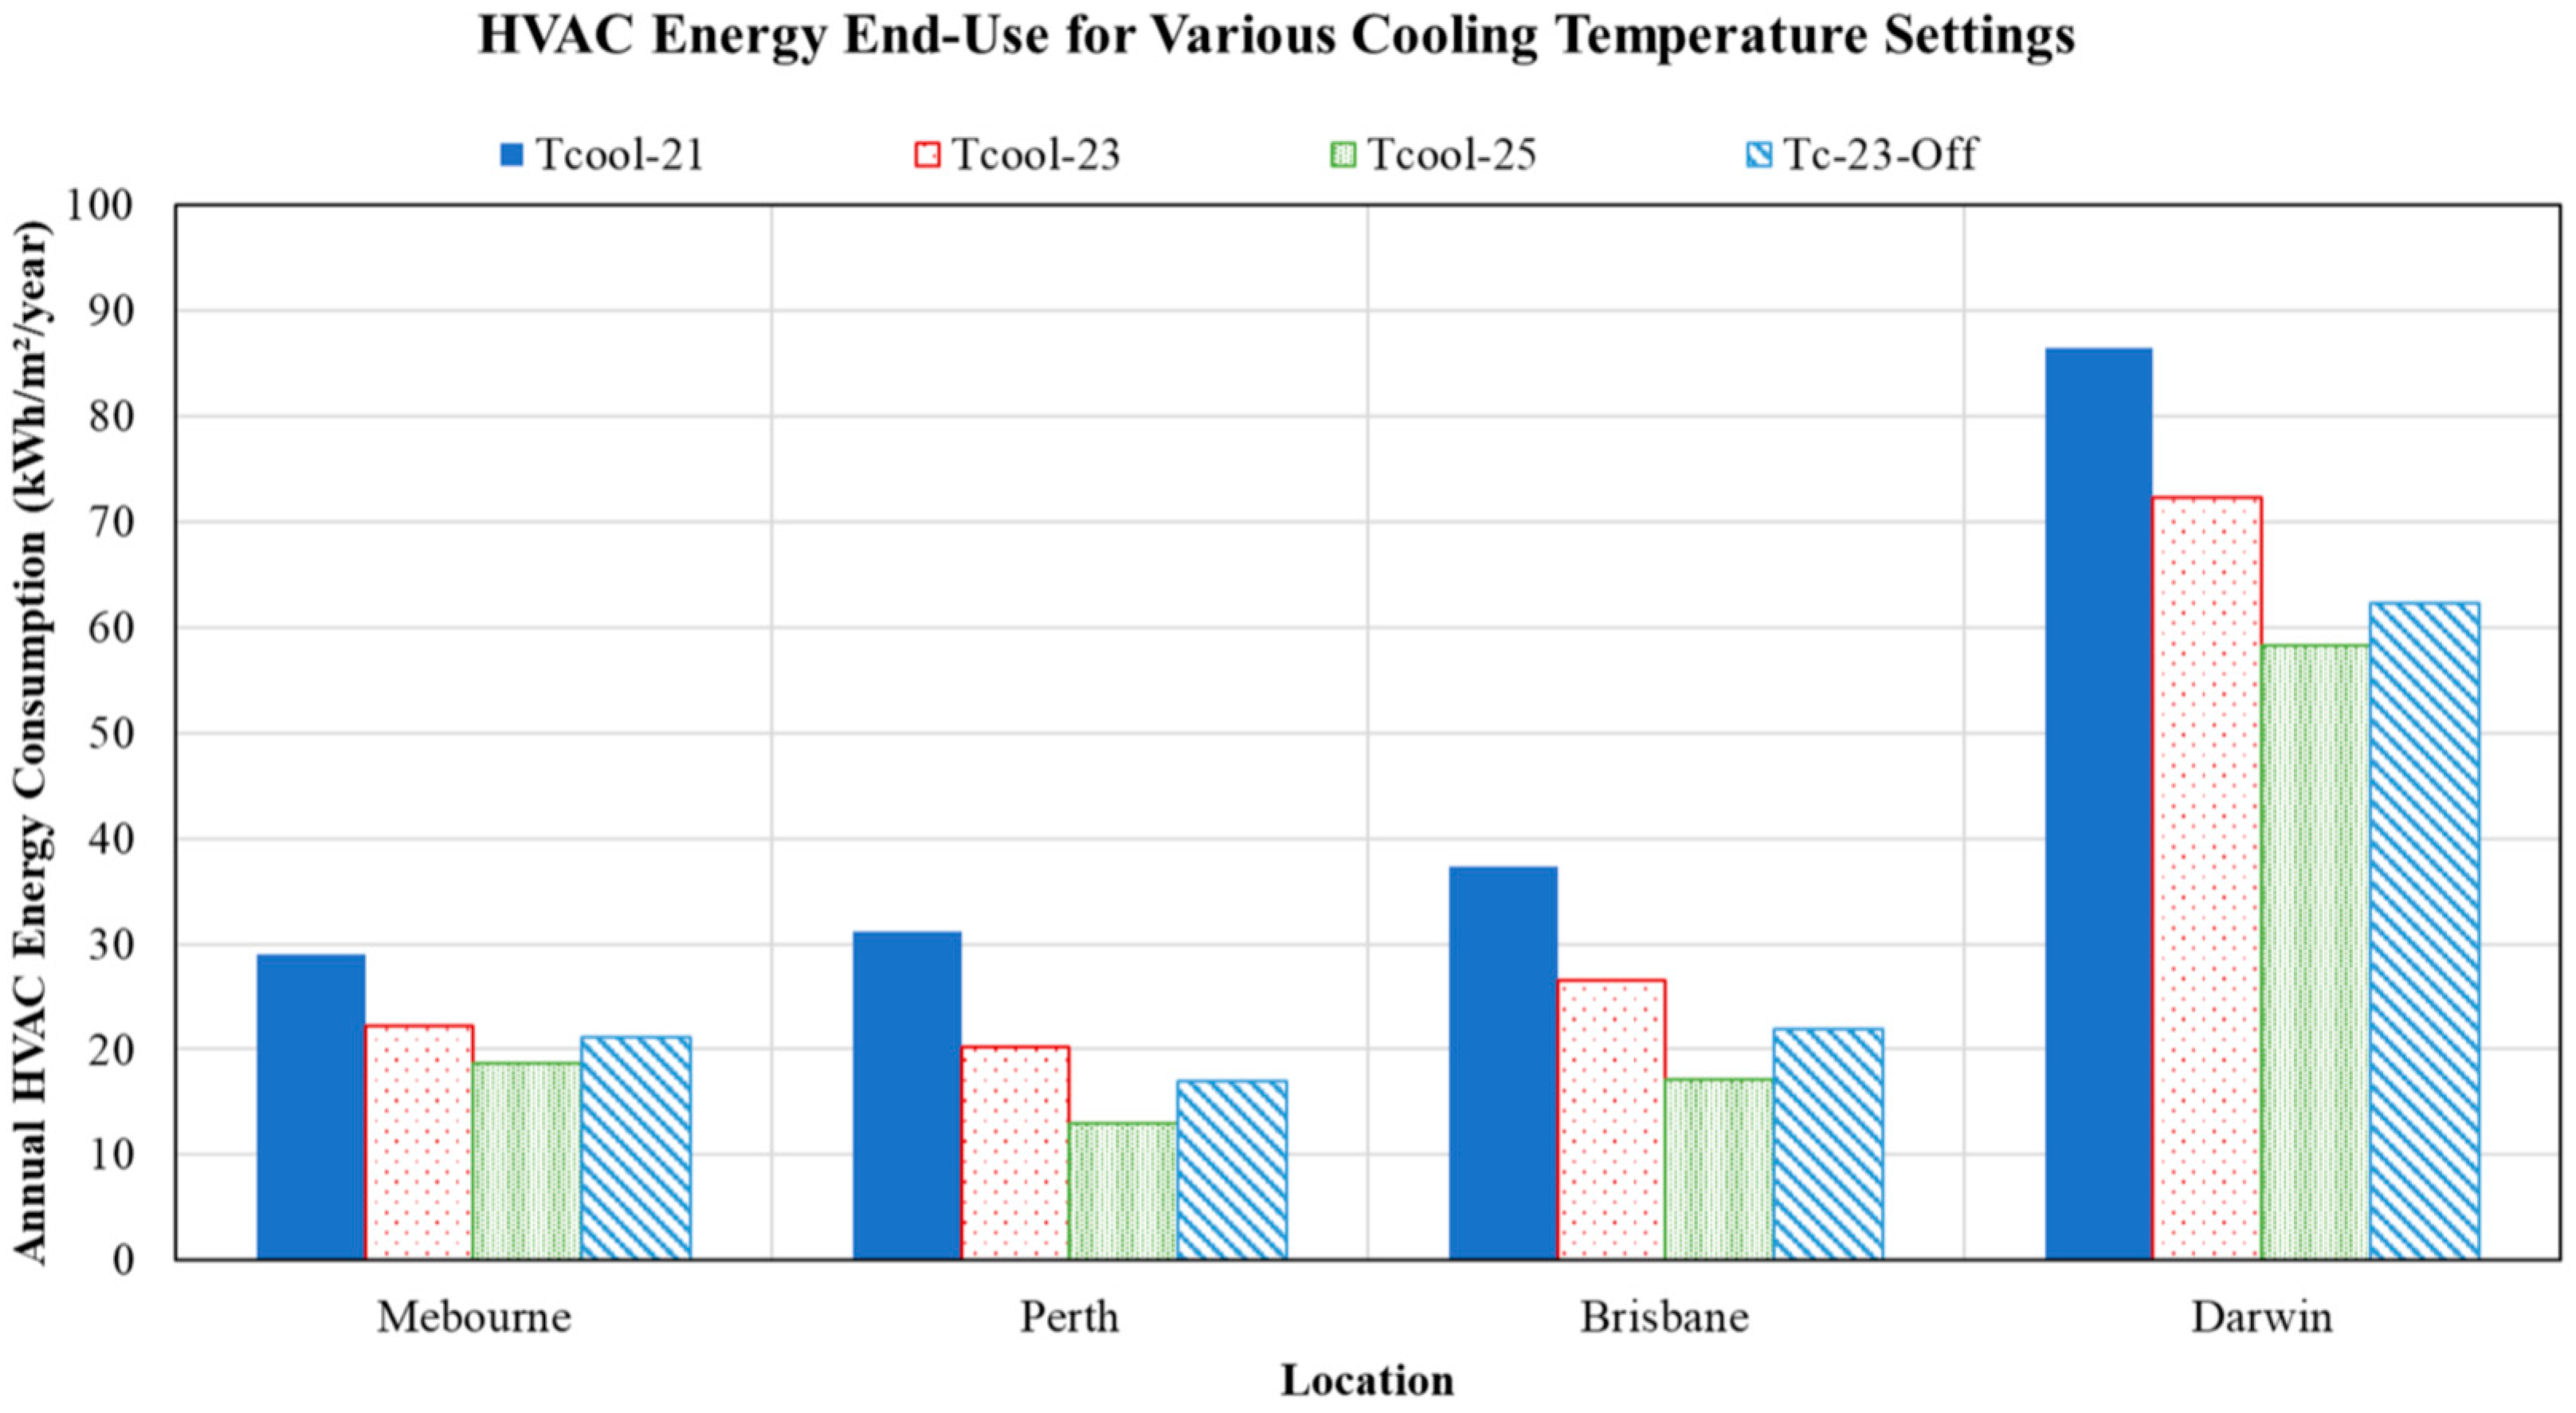
In this section, various cooling temperature settings are considered to operate the HVAC system while maintaining acceptable indoor thermal comfort levels, including three constant settings of 21 °C, 23 °C, and 25 °C and one case with the air conditioning set to be off during the daytime (i.e., 8 a.m. to 5 p.m.) when the house is assumed to be unoccupied with a temperature setpoint set at 23 °C during occupied periods. Figure 11 illustrates the impact of the cooling temperature settings on the annual HVAC energy end-use when the baseline house is in four Australian cities. As expected, the higher the cooling temperature setpoint, the lower the HVAC energy use for all climates. When the cooling temperature setpoint is increased from 21 °C to 25 °C, the annual HVAC energy demand is reduced by 58% for Perth, 54% for Brisbane, 35% for Melbourne, and 32% for Darwin. When the air conditioning is set off during unoccupied periods instead of keeping it at 23 °C during the entire day, the reduction in HVAC energy use can vary from 5% for Melbourne to 19% for Brisbane.

Figure 11.
Impact of cooling temperature settings on HVAC energy end-use for four Australian climates.
3.4.2. Effect of Heating Temperature Settings
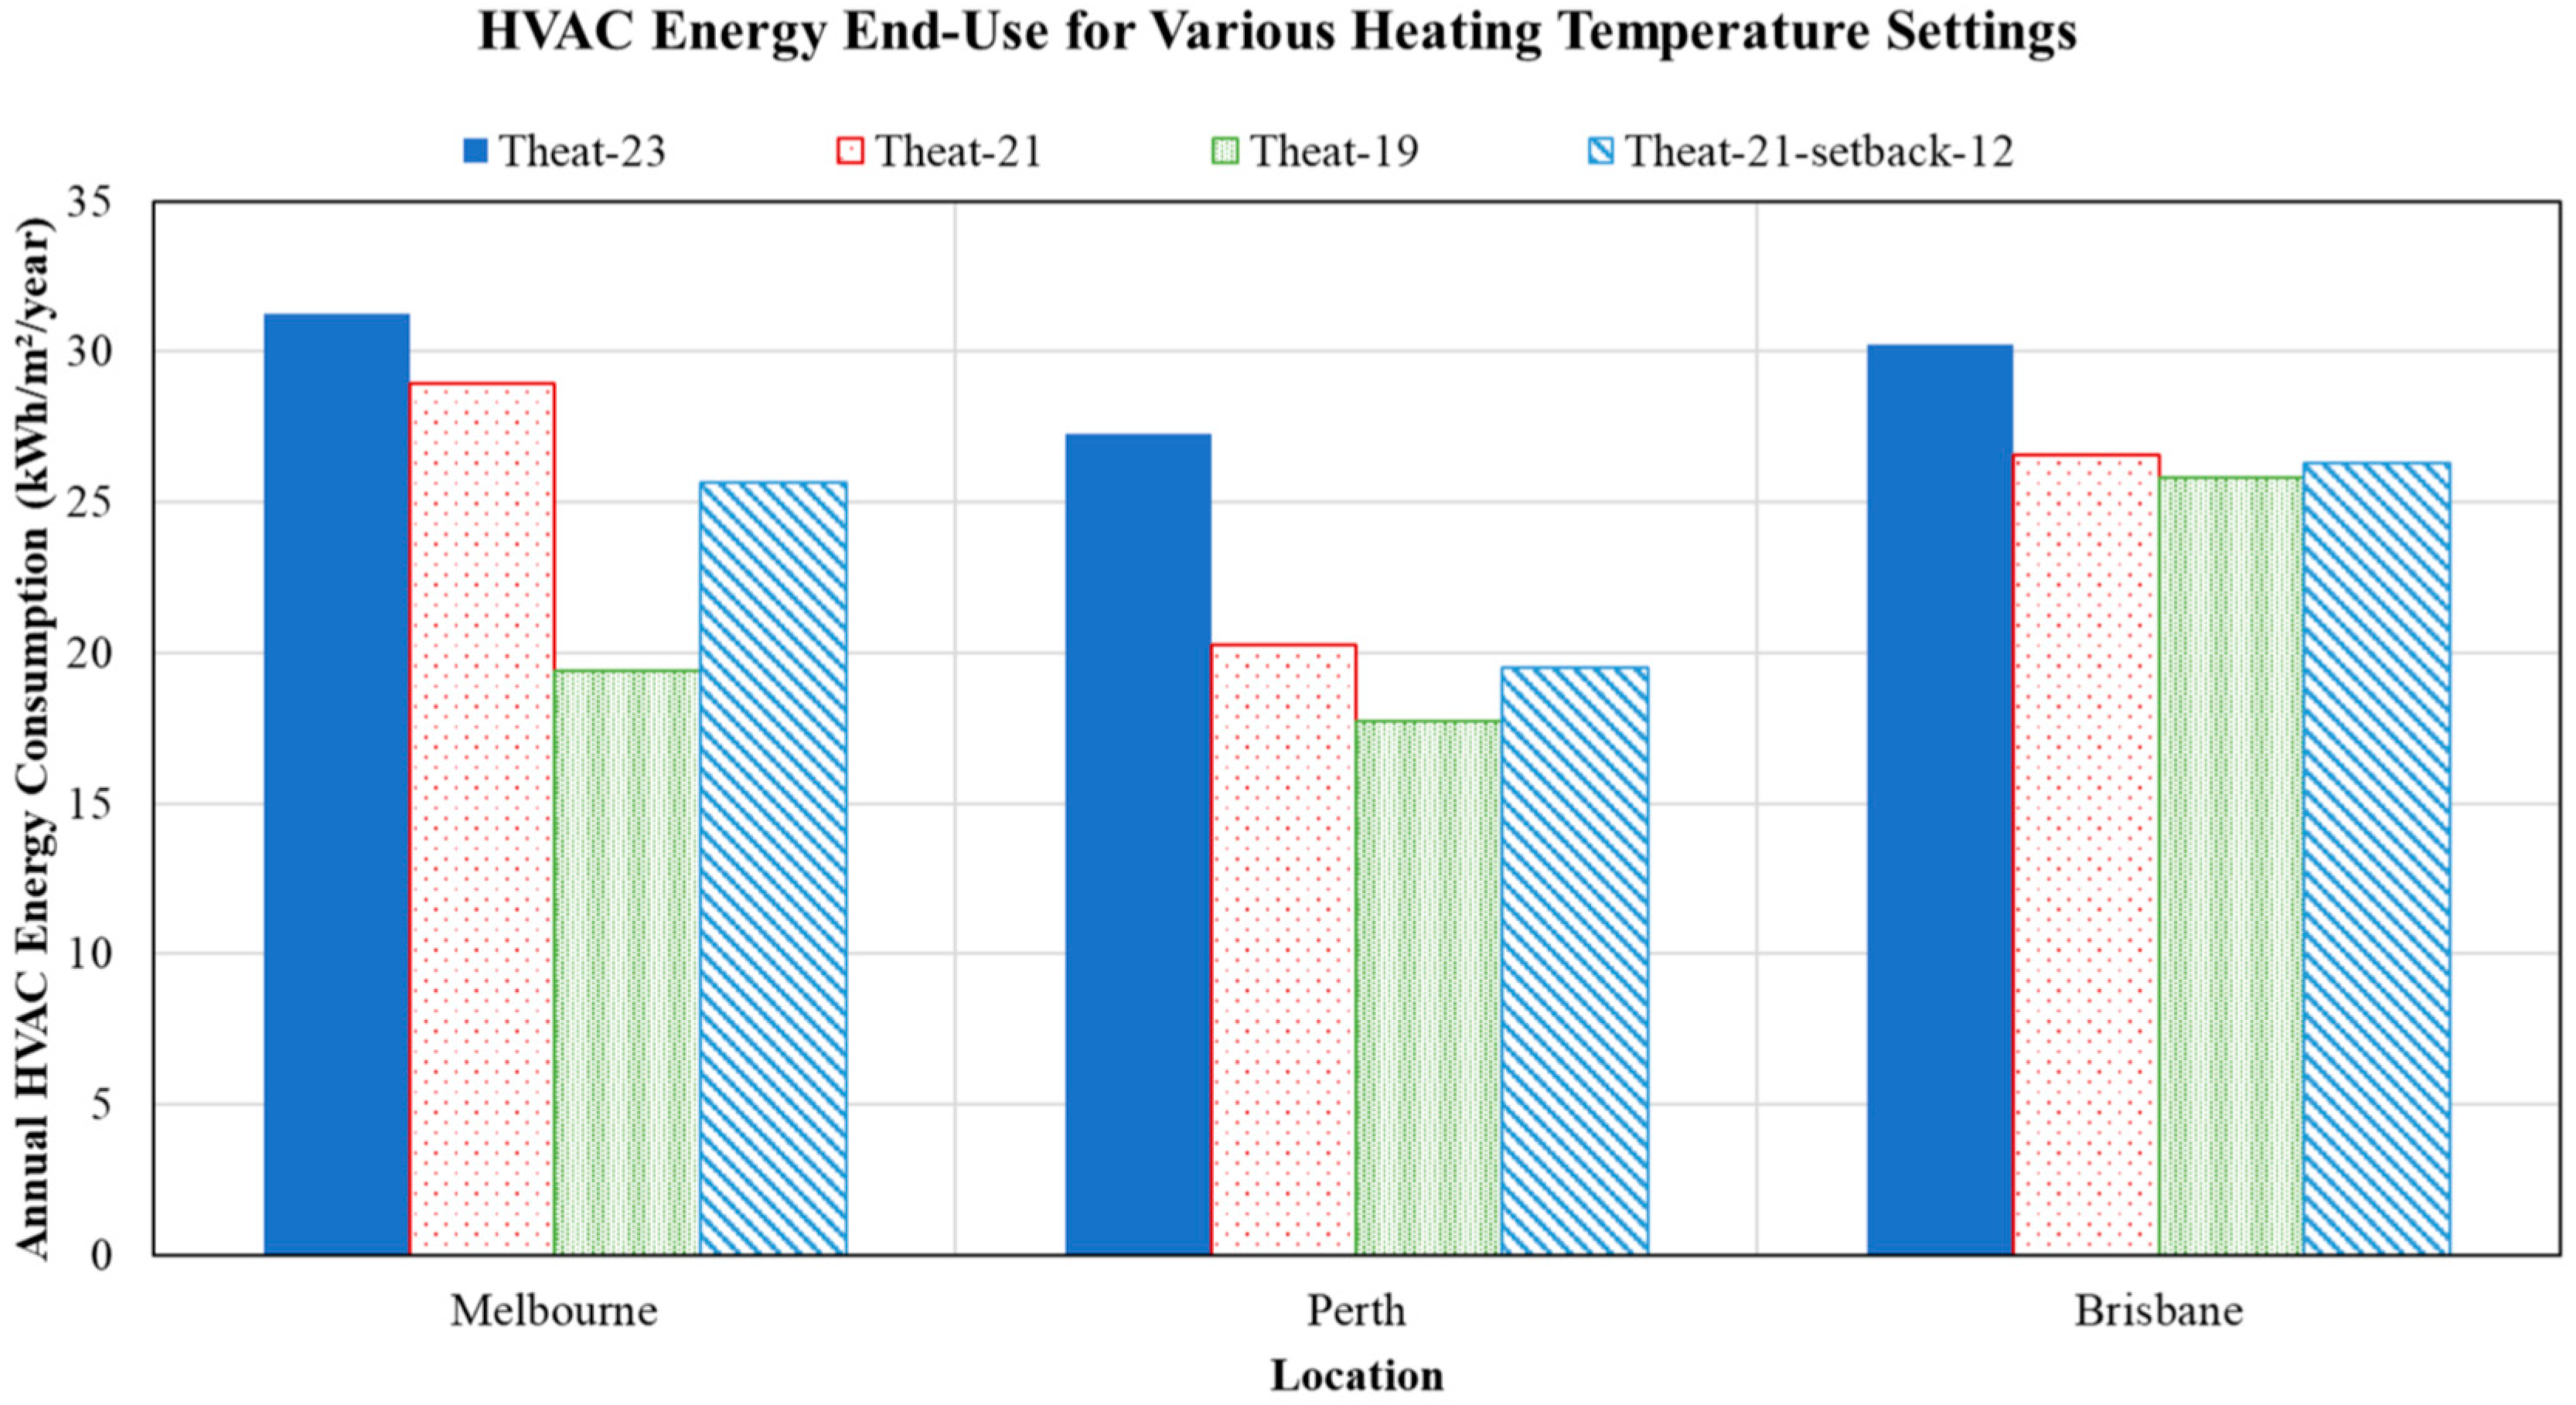
Figure 12 shows the impact of heating temperature settings on the annual HVAC energy end-use when the baseline house is in three Australian cities with heating demands (excluding Darwin, where heating is not required). Four heating temperature setting options are considered, including three cases at constant setpoints of 19 °C, 21 °C, and 23 °C and a case featuring a setback of 12 °C during unoccupied periods with a setpoint of 21 °C during occupied periods. As expected, the heating temperature settings have a more significant impact on the cold climate of Melbourne compared to the warmer climate of Brisbane. Indeed, the increase of the heating setpoint from 19 °C to 23 °C results in an increase in HVAC energy use by 61% in Melbourne, 57% in Perth, and 17% in Brisbane. The setback of the indoor temperature during unoccupied hours can lower HVAC energy demand by 11% for Melbourne, 4% in Perth, and merely 1% for Brisbane.
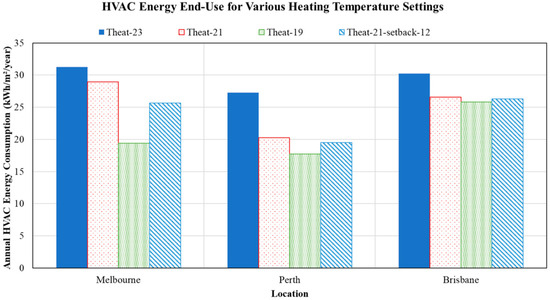
Figure 12.
Impact of heating temperature settings on HVAC energy end-use for four Australian climates.
3.4.3. Economic Analysis
The temperature settings have no capital costs, especially when programmable and smart thermostats are already specified. Thus, all the considered temperature settings that increase the setpoint during cooling mode and lower the setpoint during heat mode are cost-beneficial. The impacts of the temperature settings on the NZE designs will be discussed in Section 4.2.
3.5. Impact of HVAC Energy Efficiency
The efficiency ratings of the HVAC have a significant impact on the overall energy performance of buildings. Thus, minimum energy performance standards (MEPS) have been established for almost all systems used to heat and cool indoor spaces [42]. The distributions of the energy efficiency ratings of existing heating and cooling systems installed in the Australian housing stocks are summarized in Figure 13 [43]. Most installed HVAC systems have COP ranging between 3.0 and 3.5 for cooling and 3.5 and 4.0 for heating. Using the specifications for currently commercially available HVAC equipment, these energy efficiency ratings are considered standard, with more energy-efficient alternatives are being mandated [44].
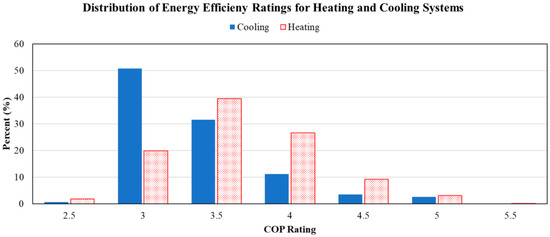
Figure 13.
Energy efficiency rating distributions for heating and cooling systems in Australia.
3.5.1. Energy Performance Analysis
Figure 14 summarizes the effects on annual HVAC energy end-use of the efficiency rating for the heat pump used to heat and cool the house in four Australian cities. Heat pumps with four efficiency ratings are considered including (i) low Efficiency level (i.e., Low-Eff) with a seasonal energy efficiency rating (SEER) = 9.5 and a heating seasonal performance factor (HSPF) = 5.5 (single stage compressor), (ii) standard efficiency level (i.e., Std-Eff) with SEER = 14.3 and HSPF = 7.5 (single stage compressor), (iii) high efficiency level (High-Eff) with SEER = 17.1 and HSPF = 8.2 (two-stage compressor), and (iv) premium efficiency level (Prem-Eff) with SEER = 20.9 and HSPF = 8.9 (variable speed compressor). Table 5 lists the installation costs for the four considered heat pump options depending on their capacities.
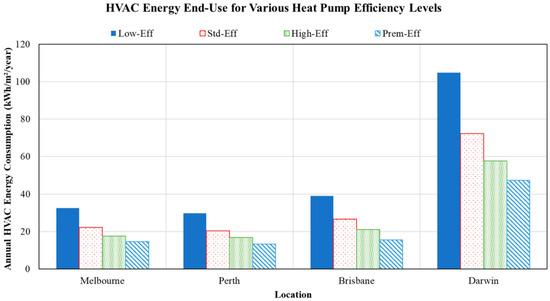
Figure 14.
Impact of HVAC efficiency rating on HVAC energy end-use when the house is in four Australian cities.
As shown in Figure 14, the selection of the heat pump has a significant effect on the annual HVAC energy end-use for all climates. Indeed, the use of premium efficiency instead of standard heat pumps can reduce the HVAC energy demands by 35% in Melbourne, Perth, and Darwin, and by 42% in Brisbane.
3.5.2. Economic Analysis
Based on the installation costs for various HVAC systems with different energy efficiency ratings, the simple payback periods related to the lowest efficiency level are listed in Table 13 for various locations considered in this analysis. The shortest payback periods are highlighted in bold for all cities. As indicated by the results of Table 13, the installation of high or premium efficiency levels is cost-effective in all the Australian cities, especially in those that feature warm or hot climates. This conclusion depends on the other costs, including maintenance and replacement needs, that a detailed life cycle cost analysis can account for. This will be considered in Section 4, when defining the optimal specifications for NZE designs. Without considering the interactive effects with other measures, it is recommended to install high energy efficiency HVAC systems for all new and existing homes in Australia.
Table 13.
Simple payback periods (expressed in years) associated with various HVAC efficiency levels for houses located in four Australian cities.
3.6. Impact of Water Heaters
As noted in the end-use distribution for the annual energy consumption in the baseline case illustrated in Figure 4 and Table 2, hot water systems are responsible for 35% of the total electricity needs of the baseline house even with the deployment of solar water heater. Thus, it is important to consider energy-efficient hot water heaters to lower the energy use of housing units in Australia.
3.6.1. Energy Performance Analysis
Figure 15 shows the combined HVAC and hot water heater energy consumption for various water heater types for the four Australian climates considered in this study. The evaluated water heaters include the standard electric water heater with a tank (Elect. Tank), solar water heater with electric boost (SWH + Elect. Tank), heat pump water heater (HPHW), and solar water heater boosted with heat pump water heater (SWH + HPHW). As expected, the use of HPHW substantially lowers the energy demands for water heating compared to the standard electric water heater for all climates, with savings specific to water heating ranging from 25% to 70%, resulting in a reduction in combined HVAC and hot water energy needs varying between 14% to 34%. Moreover, the deployment of solar water heaters with any booster type leads to significant energy savings, ranging between 15% to 46%, when both HVAC and hot water end-uses are considered.
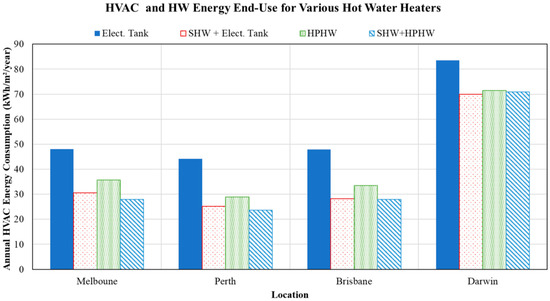
Figure 15.
Impact of hot water heater type on the combined HVAC and HW energy end-uses when the house is in four Australian cities.
3.6.2. Economic Analysis
Table 14 provides the life cycle costs for various water heater systems considered in this analysis when deployed for houses located in the specified four Australian cities using two lifetime options. For this analysis, it is assumed that the electric water heaters (i.e., Elect. Tank and HPWH) are replaced every 12 years, and the SHW can last for 30 years. The installation costs for all the heater types are provided in Table 5. The maintenance costs are set to be uniform for all heaters and are therefore not accounted in the LCC analysis. In all cases, the use of a heat pump water heater is the most cost-effective among all the options, regardless of the location and lifetime, as indicated by the lowest LCC values highlighted in bold in Table 14. It should be noted, however, that the analysis does not account for potential rebates that some households can benefit from when installing solar water heaters.
Table 14.
Life cycle costs (expressed in AUD) associated with water heater types for houses located in four Australian cities.
3.7. Benefits of PV Systems
Most sites in Australia have access to solar resources and, thus, can benefit from capturing this free renewable energy using solar hot water systems, as discussed in Section 3.6 as well as rooftop photovoltaic (PV) panels. Moreover, the costs for solar systems, especially PV panels, have been decreasing worldwide over the last decade. Table 15 lists the installation costs for various capacities of rooftop PV systems for the four Australian cities considered in this study [34].
Table 15.
Installation costs (expressed in AUD) of rooftop PV systems with various power-generating capacities for four Australian cities.
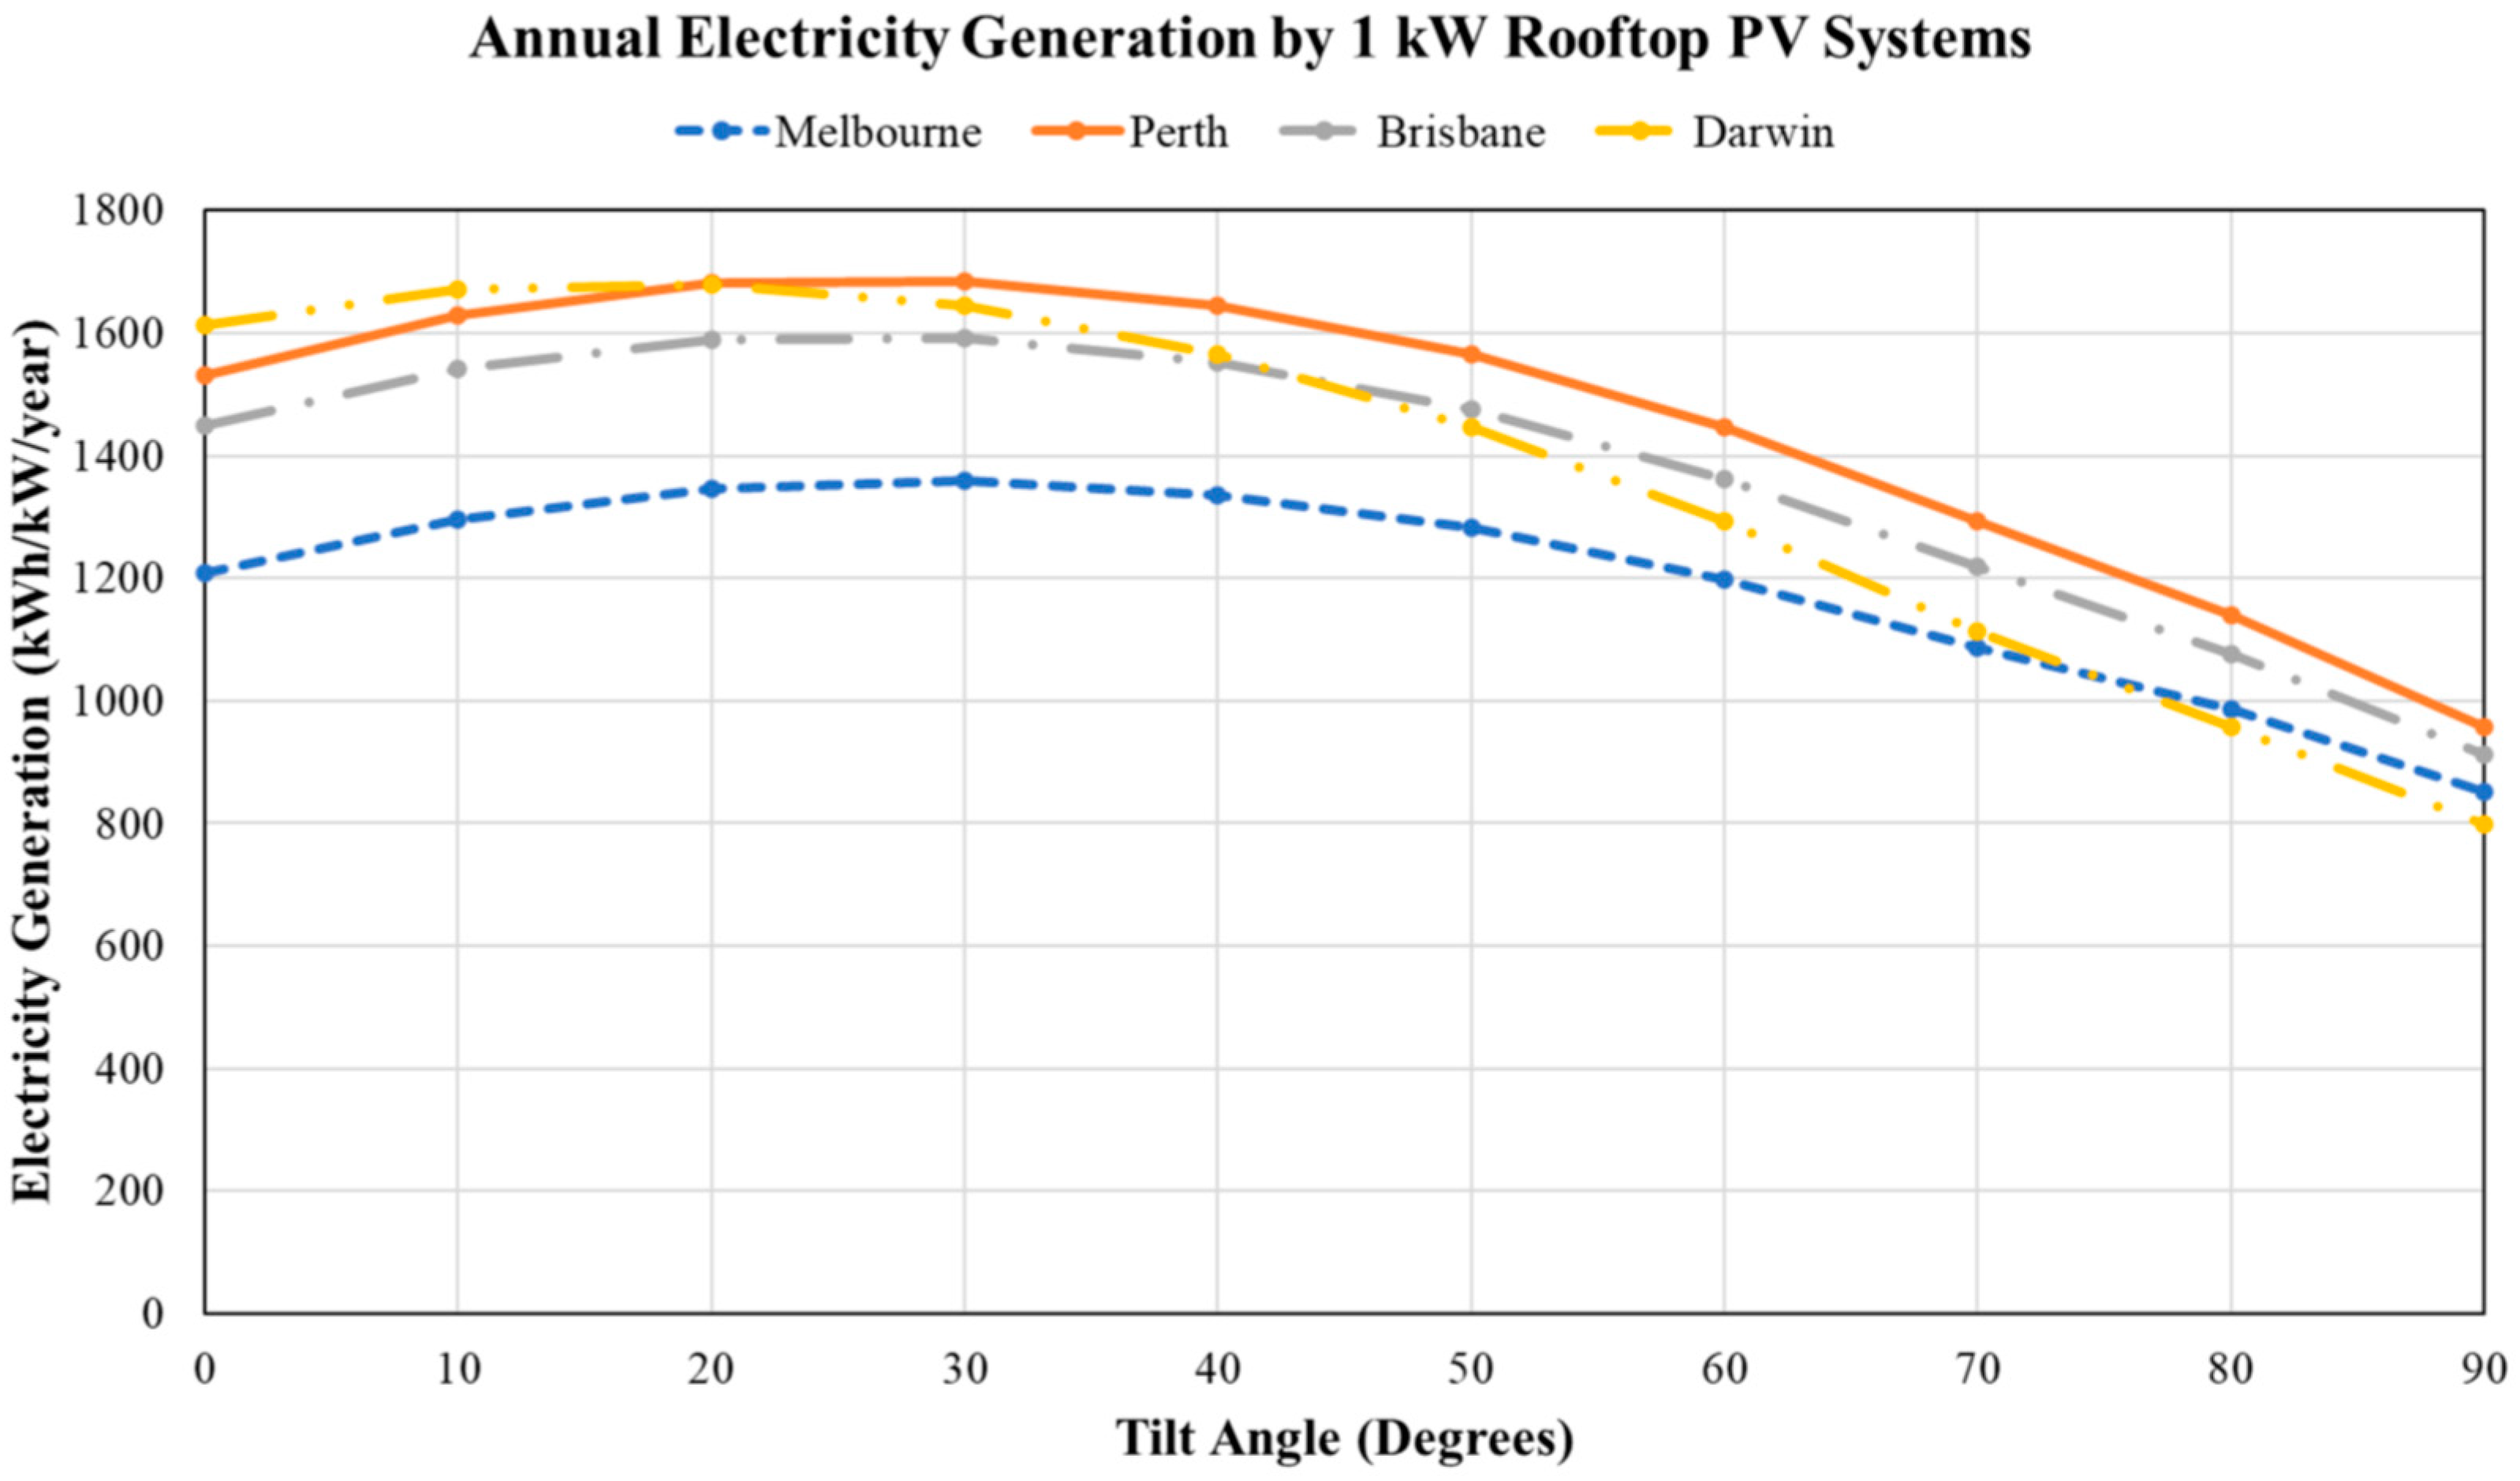
The electricity that a rooftop PV system can generate depends on several factors including panel efficiency, tilt angle, and location. Using crystalline silicon cells with a conversion efficiency of 19% and a temperature coefficient of power of −0.37%/°C [45], Figure 16 illustrates the annual electricity generated by a 1 kW rooftop system for various tilt angles with northern exposure in the four Australian cities considered in this study. As indicated in Figure 16, the optimal tilt angle to maximize the electricity generated by the PV system changes from 15° for Darwin to 30° for Melbourne. Among the four cities, Perth has the highest potential to generate electricity from rooftop PV systems followed by Brisbane, Darwin, and then Melbourne. The cost benefit for installing PV rooftop systems depends on the building’s electricity demands, as well as the purchasing and selling prices of electricity from and to the grid. Using the case of 1 kW capacity with the assumption that all the electricity generated is directly used to meet the needs of the baseline house (i.e., no excess electricity is available that could be sold to the grid at a lower rate than the purchasing price), Table 16 summarizes the simple payback periods for installing PV rooftop systems in four Australian cities. Due to their currently low installation costs, it is highly cost-beneficial to install PV rooftop systems in Australia, as indicated in Table 16, with payback periods ranging from 2.2 years in Perth, aided by its high solar resources and low installation costs, to 3.8 years in Darwin featuring relatively high installation costs. These payback periods depend on the electricity load profile for the building as well as the net-metering options available to households in each city. Based on the available roof space for the baseline house, it is expected that at least 10 kW capacity panels can be installed with northern exposure and no significant shading concerns [46].
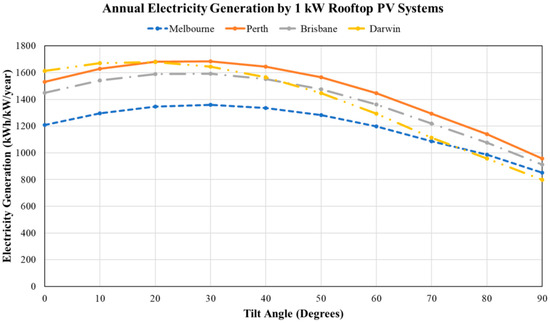
Figure 16.
Variation of electricity generated annually by 1 kW PV rooftop system with the tilt angle for four cities in Australia.
Table 16.
Simple payback periods (expressed in years) for 1-kW rooftop PV systems in four Australian cities.
4. Optimization Analysis
In this section, an optimization analysis is carried out to select the best set of energy efficiency and solar systems that minimize the life cycle costs as well as the energy consumption while maintaining acceptable indoor thermal comfort. For this analysis, the sequential search technique is used to determine the Pareto path, revealing the optimal solutions that achieve NZE designs. The sequential search technique is efficient computationally [47] and has been applied for various building energy applications, including optimally designing individual NZE housing units [48,49] and resilient residential communities [50,51], as well as retrofitting existing buildings and communities to be NZE [52,53]. For this study, NZE homes are defined as those housing units that can generate enough onsite electricity from solar panels to meet their own annual energy consumption requirements [54,55].
4.1. Energy Efficiency vs. Renewable Energy
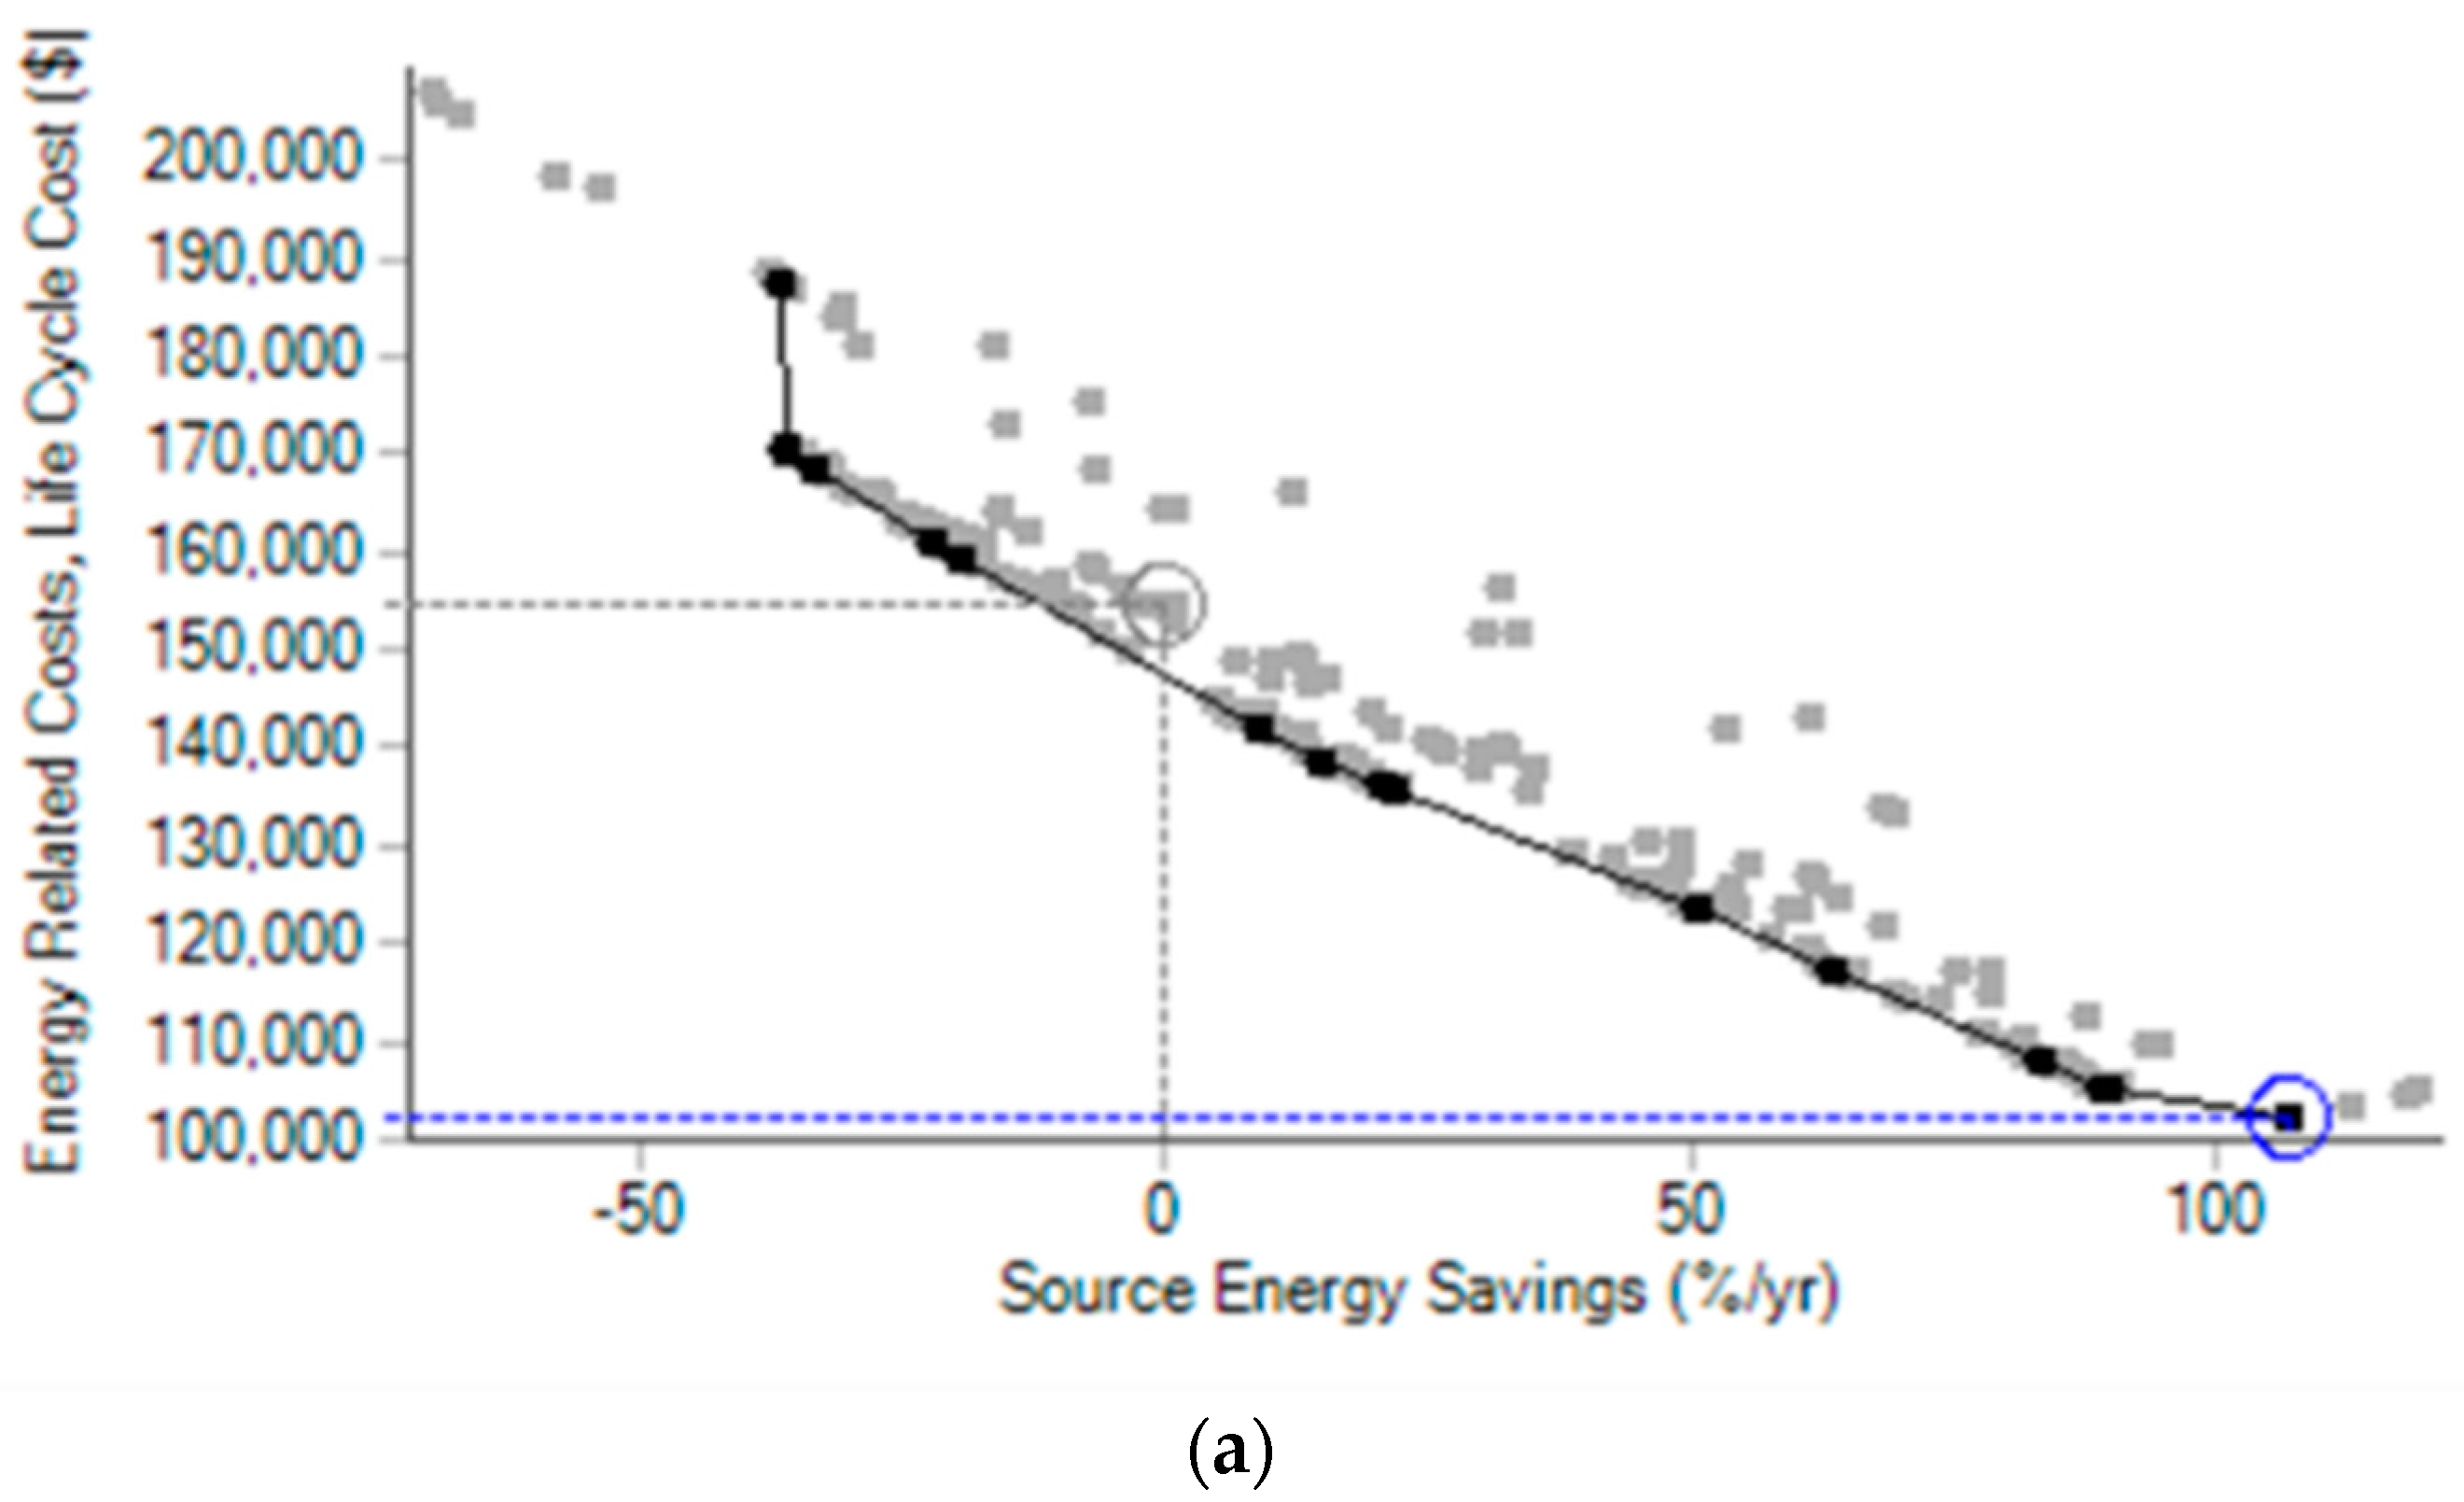
With the low cost of installing rooftop PV systems in Australia, especially Perth, as noted in Table 15, the main question is to determine the energy efficiency measures that need to be considered to optimally reduce both the energy needs as well as the PV capacity required to achieve NZE. Figure 16 compares the results of the optimization-design Pareto paths using only energy efficiency measures (EEMs) and those based on combinations of EEMs and rooftop PV systems to achieve NZE. Figure 17 pinpoints the baseline design relative to the optimal Pareto graphs in both optimization scenarios, indicating that better alternative designs than this baseline case could be considered to achieve either a lower LCC for the same energy savings or a lower energy performance for the same LCC.
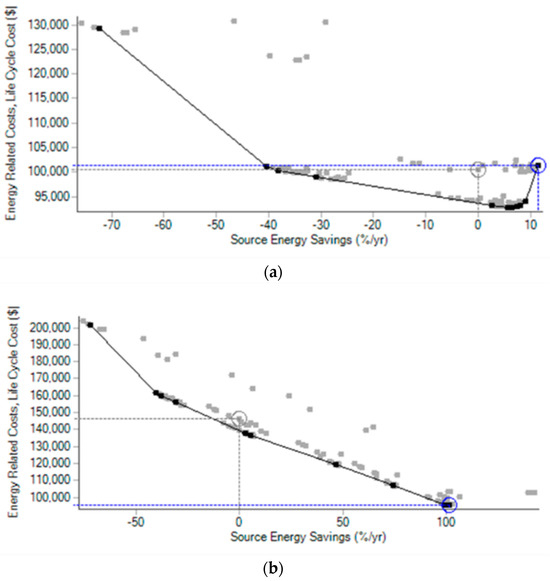
Figure 17.
Optimization results using (a) EEMs only and (b) both EEMs and PV for a house in Perth.
Table 17 lists the EEMs determined by the LCC-based optimization solutions for both scenarios as well as the PV capacities required to achieve NZE when the house is in Perth. The measures different from the baseline case required to achieve NZE designs are highlighted in bold. As indicated by the results of both Figure 17 and Table 17, NZE design can be achieved optimally using a combination of EEMs and rooftop PV panels by minimizing the LCC while reducing energy consumption by 7.5% relative to the baseline design case, which is considered highly energy efficient with a star rating of over eight [24], exceeding the new NCC requirement of seven-star [10]. However, the optimal design based on only a set of EEMs leads to higher energy savings of 32.4% using higher wall insulation, a heat pump water heater, and a premium efficiency HVAC system when compared to the baseline design. An additional advantage of this EEM-only optimal-based design is the use of a smaller rooftop PVs of 6.7 kW instead of 7 kW needed for the optimal NZE design solution obtained by considering combinations of EEMs and PV systems. The LCC for optimal NZE design, however, remains lower than those of the NZE design alternatives obtained by specifying adequate rooftop PV systems for the baseline and optimal EEMs only options.
Table 17.
List of EEMs and PV capacities for baseline, optimal EEMs only, and optimal NZE for Perth.
Due to the uncertainties and fluctuating costs of various EEM and PV systems, it is highly recommended to opt for the design approach that minimizes first the energy efficiency of the building using only EEMs and then determine the required capacity of the PV system needed to achieve NZE design. This approach is particularly suitable when the unshaded roof space with the proper orientation is limited, such as in the case of tilted roofs with obstructed solar exposure due to neighboring buildings, trees, or other objects.
4.2. Impact of Temperature Settings
The intended operation and control strategies of energy systems, including HVAC systems, can affect the optimal design of buildings [38]. In this analysis, the effects of cooling temperature setpoints on the optimal NZE designs for the baseline house in Perth are investigated. Table 18 summarizes the optimization analysis results for three cooling temperature setpoints, including 21 °C, 23 °C, and 25 °C. The results indicate that different temperature settings result in variations in the optimal NZE designs due to different EEM strategies, even though the capacity of the rooftop PV system remains unchanged. In general, all the designs call for lower thermal insulation levels for exterior walls and ceilings as well as the specification of a heat pump water heater instead of a solar water heater when compared to the baseline design. When lower space cooling temperature settings (i.e., 21 °C), the premium efficiency HVAC system is specified instead of the standard efficiency option due to higher cooling loads. For higher temperature setpoints (i.e., 23 °C and 25 °C), an air-tighter building envelope is needed to compensate for lower thermal insulation and less energy-efficient HVAC system. It is important to note that all NZE designs require lower capital costs than the baseline case, a non-NZE design, due to the lower construction costs associated with lower thermal insulation levels and the use of a heat pump water heater instead of the solar water heater. For the relatively mild climate of Perth, the use of a cooling temperature of 23 °C seems to provide the lowest energy demand, HVAC capacity, and LLC among all the evaluated operation strategies. This temperature setting allows to maintenance of acceptable thermal comfort levels [29]. However, more appropriate indicators rather than temperatures using various thermal comfort models could be considered when designing NZE buildings [52].
Table 18.
List of EEMs and PV capacities for optimal NZE designs using various cooling temperature setpoints in Perth.
4.3. Impact of Climate
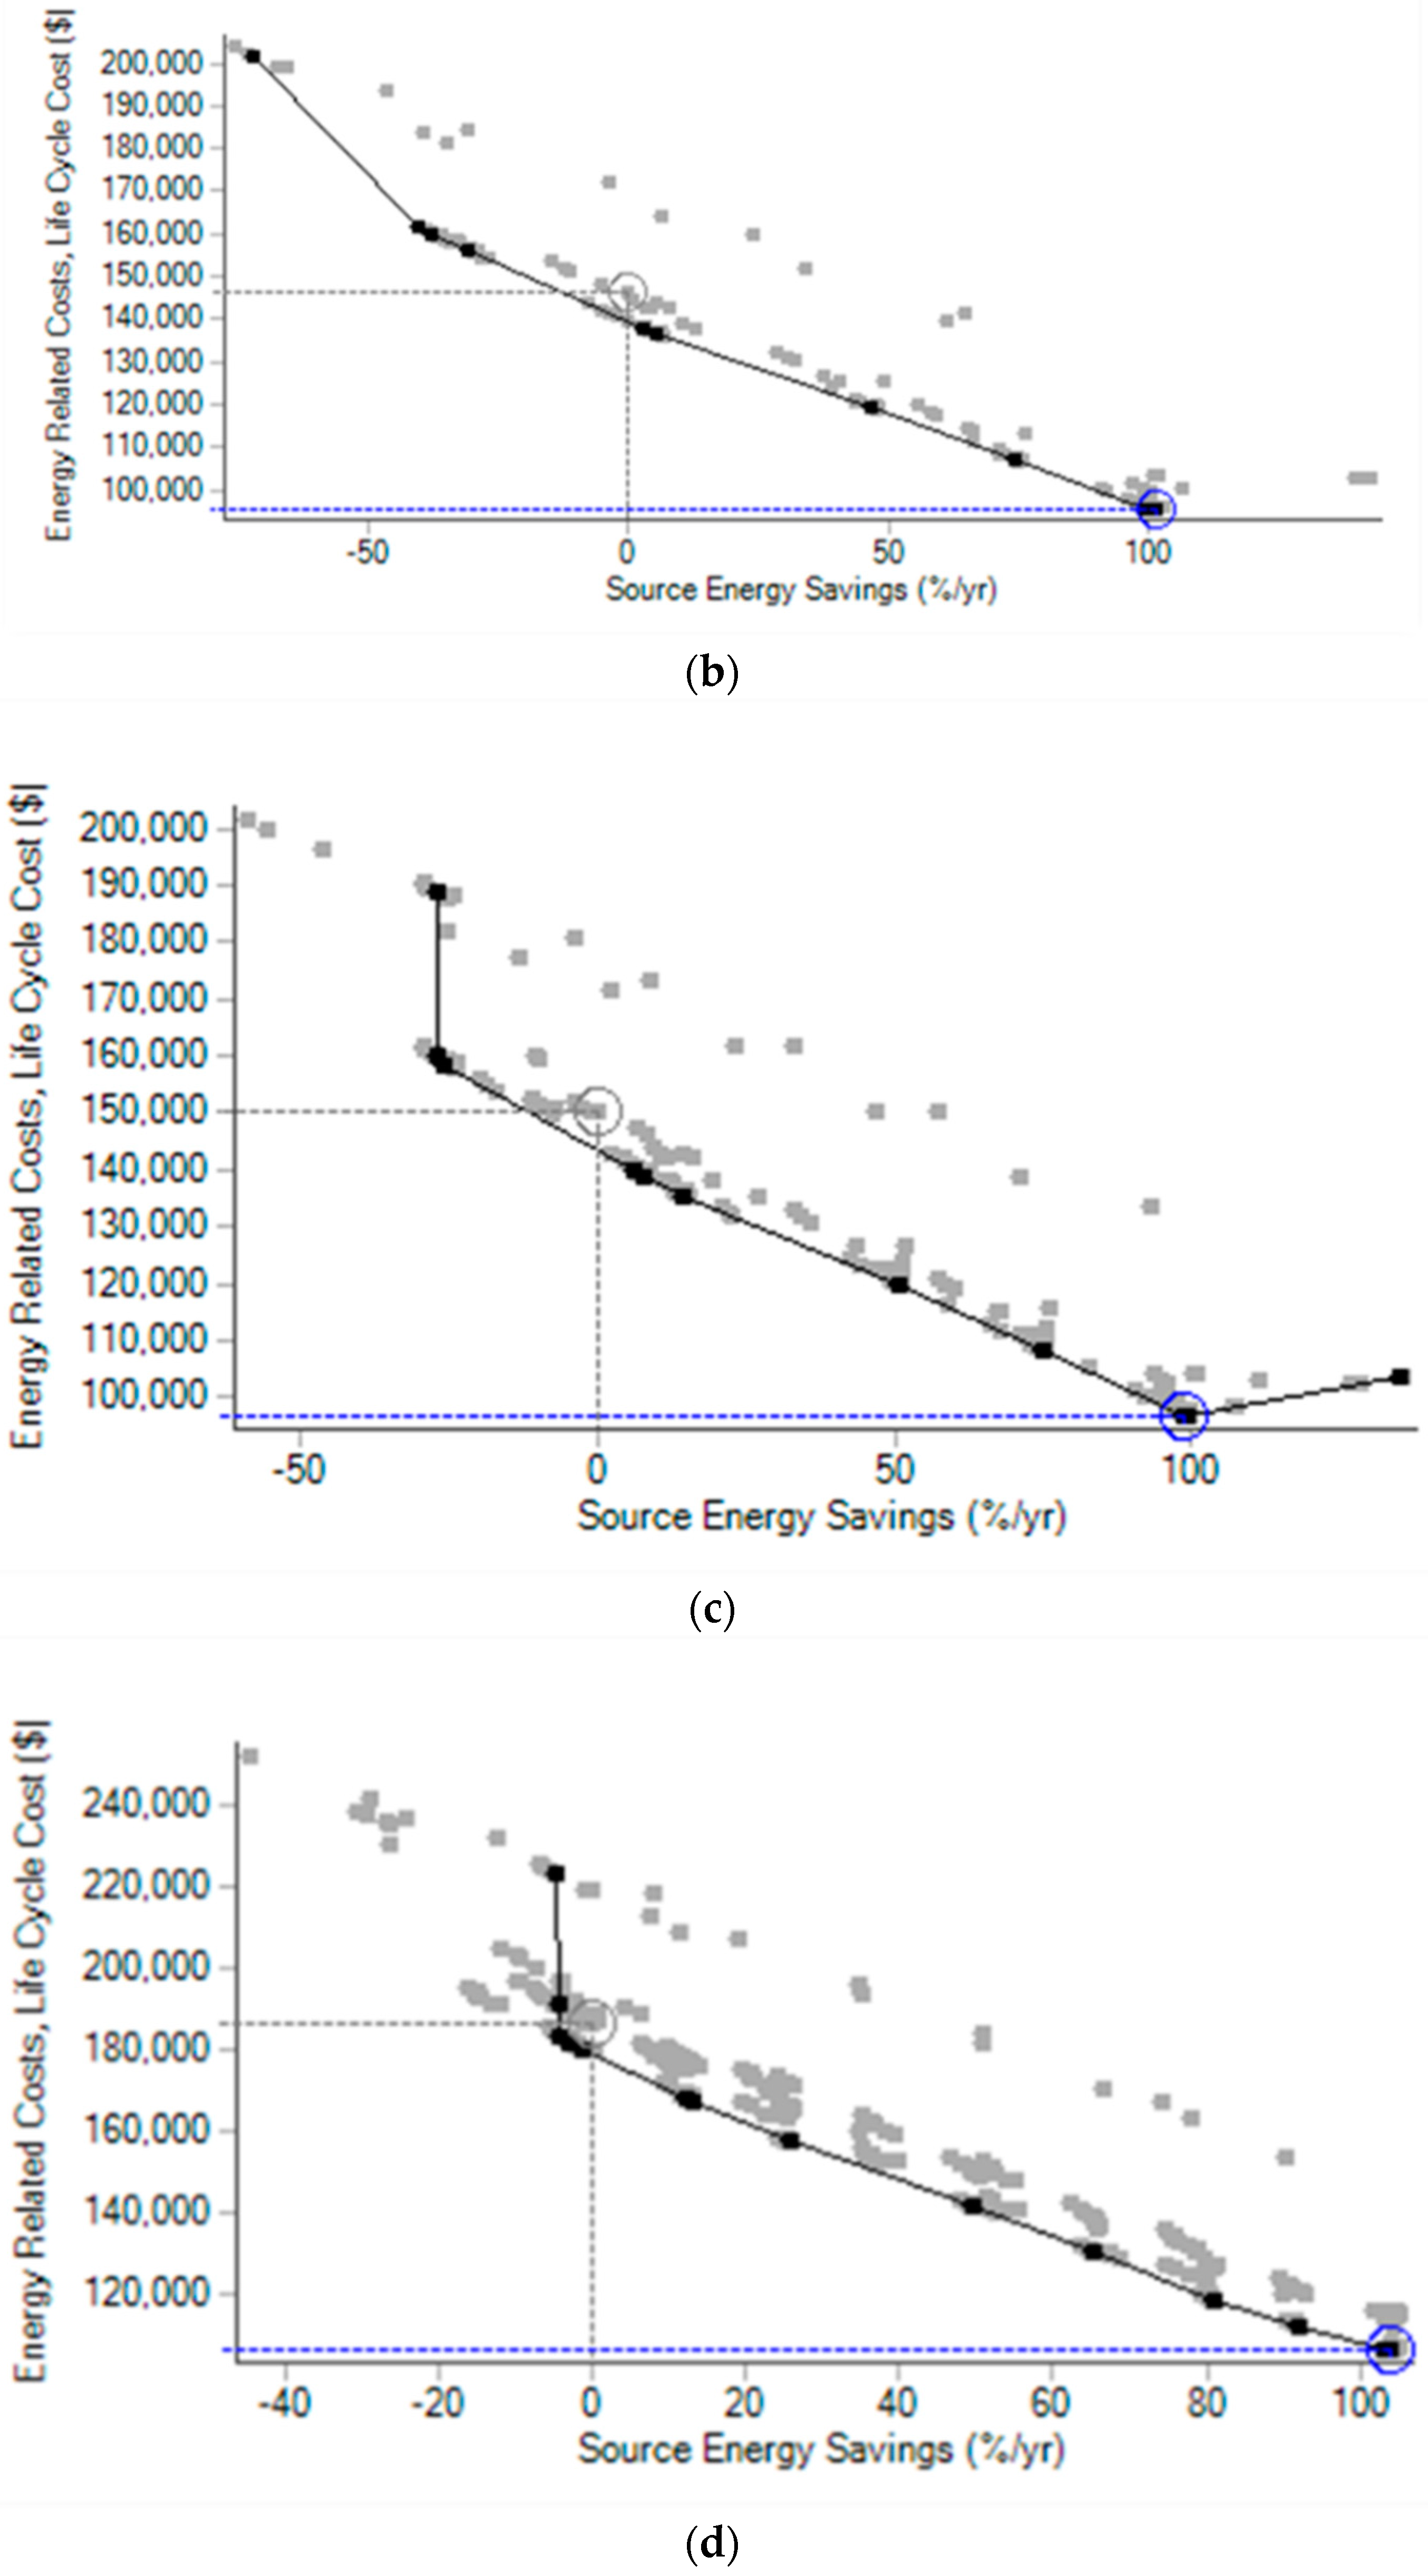
The optimal Pareto paths toward NZE designs for houses located in four Australian cities with different climate characteristics are outlined in Figure 18. These optimal paths are established using the baseline house specifications summarized in Table 2 and the alternative design strategies listed in Table 5. Both the baseline and NZE design cases indicated by the circled dots in Figure 18. The optimal EEMs and rooftop PV capacities determined to achieve NZE designs for the four cities are listed in Table 19. As indicated by the results of Table 19, both optimal EEMs and PV sizes change with the climate. The major changes in the specifications of NZE design compared to those of the baseline case include (i) the use lower thermal insulation levels, especially for the ceiling; (ii) specifying a heat pump water heater instead of solar hot water with electric tanks, (iii) replacing the standard efficiency HVAC systems with high or even premium efficiency alternatives for hot and cold climates, and (iv) installing rooftop PV systems with high solar exposure. For all climates, except that of Darwin, which requires large rooftop PV panels and premium efficiency HVAC systems, the construction costs for NZE designs are found to be lower than those of the baseline cases that call for highly insulated envelope elements. Moreover, NZE homes are more energy efficient compared to the baseline options in all climates, with annual energy use reductions ranging from 5.6% for Perth to 25.0% for Darwin.

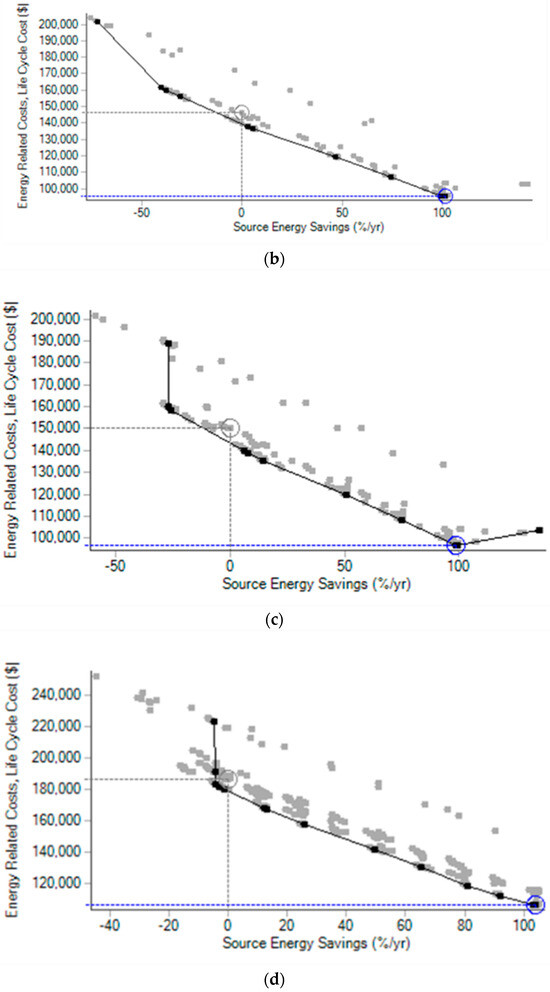
Figure 18.
Optimal Pareto paths toward NZE designs for four houses in (a) Melbourne, (b) Perth, (c) Brisbane, and (d) Darwin.
Table 19.
List of EEMs and PV capacities for optimal NZE designs for four cities in Australia.
5. Conclusions
A systematic analysis to identify the best design guidelines for residential buildings in Australia is carried out using both energy efficiency and cost benefit performance metrics. The findings of a series of parametric and optimization-based evaluations outline some general design guidelines for net zero energy (NZE) homes that can be readily applied to various climate zones of Australia. The main findings of the presented analysis include:
The selection of optimal energy efficiency measures (EEMs) to achieve NZE designs should be based on integrated analyses rather than standalone evaluations of individual measures. The integrated selection approach allows the important consideration of the interactive effects between measures and prioritizes options that enhance the overall energy efficiency of the homes. For instance, it has been found that the selection of thermal insulation levels for the envelope components should be effectively combined with the specifications of the HVAC systems to minimize life cycle costs (LCCs). Specifically, the analysis indicates thermal insulation added to walls and ceilings provides the most energy efficiency improvements for Australian homes. Indeed, adding thermal insulation has two benefits, including reducing heating and cooling thermal loads and increasing the capacities of the HVAC systems required to maintain indoor thermal comfort. The addition of R-2.0/R-4.1 thermal insulations to the walls and the ceiling of uninsulated homes reduces their annual HVAC energy use by 27% in Darwin and 59% in Melbourne.
The optimal design approach for NZE homes should consider both EEMs and PV systems to minimize the overall LCCs. However, higher energy efficiency levels can be achieved by first optimizing the selection of EEMs, followed by the selection of PV systems. This sequential approach has the advantage of lowering the capacities of the energy systems, including HVAC equipment and rooftop PV panels, even though it may lead to slightly higher LCCs. Moreover, this approach favors energy efficiency improvements and, consequently, the carbon footprint of homes rather than the deployments of large PV systems, which are becoming more cost-beneficial than several EEMs due to lower implementation costs. For instance, it is found that installing rooftop PV panels achieves simple payback periods of less than 4 years in all Australian sites. These short payback periods make PV systems more cost-effective than upgrading windows and HVAC systems.
The use of heat pump water heaters is highly recommended for all homes in Australia since they can cost-effectively reduce operating expenses for meeting domestic hot water needs. For all Australian climate zones considered in this study, these systems have been specified as part of the optimal NZE designs. While these systems can be combined with solar water heaters to further reduce energy demands, the cost benefit of these combinations is limited when considering the contributions from less capital-intensive EEMs.
In all Australian climates, NZE designs are not only technically feasible but often require less construction costs than homes with highly insulated building envelope components as mandated by the current energy efficiency regulations. However, the specific sets of EEMs and PV systems to achieve NZE designs depend highly on the specific site conditions, as well as other factors, including construction costs, economic parameters, and operational strategies.
In summary, NZE homes are recommended and could be mandated for all new Australian dwellings as they are highly cost-effective without considering their energy efficiency and carbon footprint reduction benefits. While the analysis presented in this paper provides some general design guidelines for NZE for representative Australian climates, it is crucial to make available to architects and engineers easy-to-use analysis tools adapted to the Australian residential market that can be used to identify optimal strategies to achieve NZE home designs based on multi-objective optimization analyses and specific site conditions and constraints. These tools should be flexible to address other design and retrofit alternatives and emergent technologies, such as smart appliances and building envelopes, as well as district energy systems.
Author Contributions
Conceptualization, M.K. and A.K.; methodology, M.K.; software, M.K.; validation, M.K. and A.K.; formal analysis, M.K.; investigation, M.K.; resources, A.K.; data curation, M.K.; writing—original draft preparation, M.K.; writing—review and editing, A.K.; visualization, M.K.; supervision, A.K.; project administration, A.K.; funding acquisition, A.K. All authors have read and agreed to the published version of the manuscript.
Funding
This research was funded by a Fulbright Global Scholarship awarded to M.K. by the Intitute of International Eduction under grant IIE-AY23-24.
Data Availability Statement
Data can be made available upon request. The data are not publicly available due to privacy.
Acknowledgments
The authors acknowledge the administrative support provided by the University of Western Australia during the duration of the study.
Conflicts of Interest
The funders had no role in the design of the study; in the collection, analyses, or interpretation of data; in the writing of the manuscript; or in the decision to publish the results.
Nomenclature
| ACH | air change per hour |
| ASHRAE | American Society for Heating, Refrigerating, and Air Conditioning Engineers |
| AUD | Australian Dollar |
| CDD | cooling degree-days [°C-day] |
| COP | coefficient of performance |
| EER | electric efficiency ratio |
| GHG | greenhouse gas |
| HDD | heating degree-days [°C-day] |
| HPWH | heat pump water heater |
| HSPF | heating seasonal performance factor |
| HVAC | heating, ventilating, and air conditioning |
| LCC | life cycle cost |
| NCC | national construction code |
| NZE | net zero energy |
| PV | photovoltaic |
| SEER | seasonal electric efficiency ratio |
| SWH | solar water heater |
| ZEH | zero emissions house |
References
- IEA. Energy Policy Review—Australia 2023; International Energy Agency: Paris, France, 2023; Available online: https://www.oecd-ilibrary.org/energy/australia-2023-energy-policy-review_ebff8fca-en (accessed on 10 December 2023).
- IEA. Net Zero by 2050: A Roadmap for the Global Energy Sector; International Energy Agency: Paris, France, 2021; Available online: https://www.iea.org/reports/net-zero-by-2050 (accessed on 5 December 2023).
- IEA. Tracking Clean Energy Progress; International Energy Agency: Paris, France, 2022; Available online: https://www.iea.org/topics/tracking-cleanenergy-progress (accessed on 12 December 2023).
- ABS. Housing: Census, Australian Bureau of Statistics, 2021, Canberra, Australia. Available online: https://www.abs.gov.au/statistics/people/housing/housing-census/latest-release (accessed on 15 December 2023).
- Australian Building Codes Board. NCC Volume One Energy Efficiency Provisions, 4th ed.; Australian Government and States and Territories of Australia: Canberra, Australia, 2016.
- NatHERS National Administrator NatHERS-Nationwide House Energy Rating Scheme. 2023. Available online: http://www.nathers.gov.au (accessed on 20 October 2023).
- Delsante, A. A validation of the AccuRate simulation engine using BESTEST, Report for the Australian Greenhouse Office. In CSIRO Manufacturing & Infrastructure Technology Report, CMIT-2004-152; Australian Greenhouse Office: Canberra, Australia, 2004. [Google Scholar]
- Law, T. An increasing resistance to increasing resistivity. Archit. Sci. Rev. 2023, 66, 108–121. [Google Scholar] [CrossRef]
- Commonwealth Scientific and Industrial Research Organization. Energy Rating—Australian Housing Data. 2023. Available online: https://ahd.csiro.au/dashboards/energy-rating/ (accessed on 25 October 2023).
- Australian Building Codes Board. NCC 2022 State and Territory Adoption Dates. 2023. Available online: https://www.abcb.gov.au/ncc-2022-state-and-territory-adoption-dates (accessed on 22 October 2023).
- NatHERS. Expanding NatHERS Assessments. 2023. Available online: https://www.nathers.gov.au/expansion (accessed on 22 October 2023).
- European Parliament and the Council. European Performance of Buildings Directive. 2010. Available online: http://eur-lex.europa.eu/legal-content/EN/TXT/PDF/?uri=CELEX:32010L0031&from=EN (accessed on 12 November 2023).
- D’Agostino, D.; Mazzarella, L. What is a Nearly zero energy building? overview, implementation and comparison of definitions. J. Build. Eng. 2019, 21, 200–212. [Google Scholar] [CrossRef]
- European Parliament. Energy Performance of Buildings, Directive of the European Parliament and the Council of European Union. 2022. Available online: https://www.europarl.europa.eu/doceo/document/TA-9-2023-0068_EN.pdf (accessed on 5 December 2023).
- Yu, F.; Feng, W.; Leng, J.; Wang, Y.; Bai, Y. Review of the U.S. Policies, Codes, and Standards of Zero-Carbon Buildings. Buildings 2022, 12, 2060. [Google Scholar] [CrossRef]
- Standard 228; Standard Method for Evaluating Zero Net Energy and Zero Net Carbon for Building Performance. American Society of Heating, Refrigerating and Air-Conditioning Engineers, ASHRAE: Atlanta, GA, USA, 2023.
- ECCJ. Building Energy Conservation Act (Revision), Energy Conservation Center of Japan. 2023. Available online: https://www.asiaeec-col.eccj.or.jp/policynews-202207/ (accessed on 12 October 2023).
- Ohene, E.; Chan, A.P.C.; Darko, A. Review of global research advances towards net-zero emissions buildings. Energy Build. 2022, 266, 112142. [Google Scholar] [CrossRef]
- Wells, L.; Rismanchi, B.; Aye, L. A review of Net Zero Energy Buildings with reflections on the Australian context. Energy Build. 2018, 158, 616–628. [Google Scholar] [CrossRef]
- Kwan, Y.; Guan, L. Design a Zero Energy House in Brisbane, Australia. Procedia Eng. 2015, 121, 604–611. [Google Scholar] [CrossRef]
- Nematchoua, M.K.; Marie-Reine Nishimwe, A.; Reiter, S. Towards nearly zero-energy residential neighbourhoods in the European Union: A case study. Renew. Sustain. Energy Rev. 2021, 135, 110198. [Google Scholar] [CrossRef]
- Omrany, H.; Chang, R.; Soebarto, V.; Zhang, Y.; Ghaffarianhoseini, A.; Zuo, J. A Bibliometric Review of Net Zero Energy Building Research 1995–2022. Energy Build. 2022, 262, 111996. [Google Scholar] [CrossRef]
- Wu, W.; Skye, H.M. Residential net-zero energy buildings: Review and perspective. Renew. Sustain. Energy Rev. 2021, 142, 110859. [Google Scholar] [CrossRef]
- Ren, Z.; Foliente, G.; Chan, W.Y.; Chen, D.; Ambrose, M.; Paevere, P. A model for predicting household end-use energy consumption and greenhouse gas emissions in Australia. Int. J. Sustain. Build. Technol. Urban Dev. 2013, 4, 210–228. [Google Scholar] [CrossRef]
- EnergyPlus. Weather Files for EnergyPlus, Whole-Building Energy Simulation Engine; US Department of Energy: Washington, DC, USA, 2023; Available online: https://energyplus.net/ (accessed on 24 October 2023).
- ASHRAE. ASHRAE Guideline 14-2014: Measurement of Energy and Demand Savings; American Society for Heating, Refrigerating, and Air Conditioning: Atlanta, GA, USA, 2014. [Google Scholar]
- EVO. IPMVP International Performance Measurement and Verification Protocol; Efficiency Valuation Organization: Washington, DC, USA, 2018. [Google Scholar]
- Climate Consultant. Society of Building Science Educators, Developed by Department of Architecture, 2023, University of California at Los Angeles. Available online: https://www.sbse.org/resources/climate-consultant (accessed on 20 October 2023).
- Standard 55; Thermal Environmental Conditions for Human Occupancy. American Society for Heating, Refrigerating, and Air Conditioning, ASHRAE: Atlanta, GA, USA, 2020.
- Insulation Essentials. Products: Ceiling Insulation and Wall Insulation, Craigieburn, Victoria, Australia. 2023. Available online: https://insulationessentials.com.au/store/ (accessed on 10 November 2023).
- Strategy Policy Research. Glazing for Non-Residential Buildings under NCC2019—Products, Costs, and Market Insights, Final Report, 2021, Canberra, Australia. Available online: https://www.energy.gov.au/sites/default/files/Glazing%20for%20non-residential%20buildings%20under%20NCC2019_Summary.pdf (accessed on 15 October 2023).
- BEOpt. Building Optimization Tool, Version 3.0.1, National Renewable Energy Laboratory, 2023, Golden, CO. Available online: https://www.nrel.gov/buildings/beopt.html (accessed on 27 October 2023).
- Choice. Guide for Air Conditioners. 2023. Available online: https://www.choice.com.au/home-and-living/cooling/air-conditioners/review-and-compare/large-air-conditioners (accessed on 30 October 2023).
- Solar Choice. Solar Panel Costs: Solar Choice Price Index, Written by J. Sykes. 2023. Available online: https://www.solarchoice.net.au/solar-panels/solar-power-system-prices/ (accessed on 27 October 2023).
- Turner and Townsend. Global Construction Cost Performance, International Construction Market Survey 2023. Available online: https://publications.turnerandtownsend.com/international-construction-market-survey-2023/global-construction-cost-performance#construction-cost-performance-labour-costs (accessed on 30 October 2023).
- Finder. What Is the Average (kWh) Cost of Electricity in Australia? Written by D. Crismale. 2023. Available online: https://www.finder.com.au/average-cost-of-electricity (accessed on 21 October 2023).
- Rezaee, R.; Vakilinezhad, R.; Haymaker, J. Parametric framework for a feasibility study of zero-energy residential buildings for the design stage. J. Build. Eng. 2021, 35, 101960. [Google Scholar] [CrossRef]
- Commonwealth Scientific and Industrial Research Organization. Windows—Australian Housing Data. 2023. Available online: https://ahd.csiro.au/dashboards/construction/windows/ (accessed on 20 October 2023).
- Simko, T.; Moore, T. Optimal window designs for Australian houses. Energy Build. 2021, 250, 111300. [Google Scholar] [CrossRef]
- Barber, K.; Krarti, M. A review of optimization-based tools for design and control of building energy systems. Renew. Sustain. Energy Rev. 2022, 160, 112359. [Google Scholar] [CrossRef]
- Krarti, M. Evaluation of occupancy-based temperature controls on energy performance of KSA residential buildings. Energy Build. 2020, 220, 110047. [Google Scholar] [CrossRef]
- Energy Rating. Equipment Energy Efficiency (E3) Program, Australian Government Department of Climate Change, Energy, the Environment and Water. 2023. Available online: https://www.energyrating.gov.au/ (accessed on 25 October 2023).
- Commonwealth Scientific and Industrial Research Organization. Air Conditioning—Australian Housing Data. 2023. Available online: https://ahd.csiro.au/dashboards/appliances/air-conditioning/ (accessed on 25 October 2023).
- ICC. International Energy Conservation Code, International Code Council. 2018. Available online: https://codes.iccsafe.org (accessed on 15 October 2023).
- PVWatts. PVWatts Calculator, an Online Tool Developed by the National Renewable Energy Laboratory, Golden, CO, 2023. Available online: https://pvwatts.nrel.gov/pvwatts.php (accessed on 30 October 2023).
- IEA. Technology and Innovation Pathways for Zero-Carbon-Ready Buildings by 2030; International Energy Agency: Paris, France, 2022; Available online: https://www.iea.org/reports/technology-and-innovation-pathways-for-zero-carbon-ready-buildings-by-2030 (accessed on 6 November 2023).
- Christensen, C.; Horowitz, P.; Maguire, J.; Velasco, T. BEopt-CA (Ex): A Tool for Optimal Integration of EE, DR and PV in Existing California Homes (NREL/TP-5500-61473). National Renewable Energy Laboratory; 2015. Available online: https://www.nrel.gov/docs/fy14osti/61473.pdf (accessed on 20 October 2023).
- Krarti, M.; Ihm, P. Evaluation of Net-Zero Energy Residential Buildings in the MENA Region. Sustain. Cities Soc. 2016, 22, 116–125. [Google Scholar] [CrossRef]
- AlMansour, M.; Krarti, M. Value Engineering Optimal Design Approach of High-Performance Residential Buildings: Case Study of Kuwait. Energy Build. 2022, 258, 111833. [Google Scholar] [CrossRef]
- Dafoe, S.; Krarti, M.; Baker, K. Optimal Designs of Grid-Connected Energy Efficient and Resilient Residential Communities. J. Eng. Sustain. Build. Cities 2022, 3, 011004. [Google Scholar]
- Thompson, J.; Krarti, M. Cost-Effectiveness and Resiliency Evaluation of Net-Zero Energy U.S. Residential Communities. ASME J. Eng. Sustain. Build. Cities 2021, 2, 031002. [Google Scholar] [CrossRef]
- Garriga, S.; Dabbagh, M.; Krarti, M. Optimal carbon-neutral retrofit of residential communities in Barcelona, Spain. Energy Build. 2020, 208, 109651. [Google Scholar] [CrossRef]
- Luddeni, G.; Krarti, M.; Pernigotto, G.; Gasparella, A. An analysis methodology for large-scale deep energy retrofits of existing building stocks: Case study of the Italian office building. Sustain. Cities Soc. 2018, 41, 296–311. [Google Scholar] [CrossRef]
- Moorea, T.; Ridley, I.; Strengers, Y.; Maller, C.; Horne, R. Dwelling performance and adaptive summer comfort in low-income Australian households. Build. Res. Inf. 2017, 45, 443–456. [Google Scholar] [CrossRef]
- Marszal, A.J.; Heiselberg, P.; Bourrelle, J.S.; Musall, E.; Voss, K.; Sartori, I.; Napolitano, A. Zero Energy Building—A review of definitions and calculation methodologies. Energy Build. 2011, 43, 971–979. [Google Scholar] [CrossRef]


Disclaimer/Publisher’s Note: The statements, opinions and data contained in all publications are solely those of the individual author(s) and contributor(s) and not of MDPI and/or the editor(s). MDPI and/or the editor(s) disclaim responsibility for any injury to people or property resulting from any ideas, methods, instructions or products referred to in the content. |
© 2024 by the authors. Licensee MDPI, Basel, Switzerland. This article is an open access article distributed under the terms and conditions of the Creative Commons Attribution (CC BY) license (https://creativecommons.org/licenses/by/4.0/).