Abstract
In nature, rock masses often exhibit fissures, and varying external forces lead to different rates of loading on fissured rock masses. By studying the influence of the loading rate on the mechanical properties of fractured rock mass and AE characteristic parameters, it can provide a theoretical basis for the safety and stability prediction of engineering rock mass. To investigate the influence of loading rates on fissured rock masses, this study utilizes surrogate rock specimens resembling actual rock bodies and prefabricates two fissures. By conducting uniaxial compression acoustic emission tests at different loading rates, the study explores changes in their mechanical properties and acoustic emission characteristic parameters. Research findings indicate the following: (1) Prefabricated fissures adversely affect the stability of specimens, resulting in lower strength compared to intact specimens. Under the same fissure inclination angle, peak strength, elastic modulus, and loading rate exhibit a positive correlation. When the fissure inclination angle varies from 0° to 60° under the same loading rate, the peak strength of specimens generally follows a “V”-shaped trend, decreasing initially and then increasing, with the minimum peak strength observed at α = 30°. (2) Prefabricated fissure specimens primarily develop tensile cracks during loading, gradually transitioning to shear cracks, ultimately leading to shear failure. (3) The variation patterns of AE (acoustic emission) characteristic parameters under the influence of loading rate differ: AE event count, AE energy, and cumulative AE energy show a positive correlation with loading rate, while cumulative AE event count gradually decreases with increasing loading rate. (4) AE characteristic parameters exhibit good correlation with the stress–strain curve and can be divided into four stages. The changes in AE characteristic parameters correspond to the changes in the stress–strain curve. With increasing loading rate, AE signals in the first three stages gradually stabilize, focusing more on the fourth stage, namely the post-peak stage, where the specimens typically experience maximum AE signals accompanying final failure.
1. Introduction
As the emphasis on engineering safety continues to increase, there is growing attention on the safety and stability of engineering rock masses [1]. However, in nature, rock formations commonly exhibit micro- or macroscopic fissures, which can lead to a reduction in the load-bearing capacity of rock masses [2]. The destruction of engineering rock masses is influenced by the presence of pre-existing fissures [3]; under the combined effects of natural stresses and external loads from engineering construction, original fissures and newly formed fissures gradually develop and propagate, eventually evolving into macroscopic damage, thereby resulting in instability and failure of the rock mass [4]. Moreover, the environment in which engineering rock masses are situated is often complex, influenced by construction methods, structural constraints, and other factors such as structural squeezing. This can lead to variations in the external load rate experienced by the rock mass, further complicating the development of fissures [5]. Therefore, the utilization of AE monitoring systems can effectively monitor the internal fissure development within rock masses, thus facilitating preventive measures.
In recent years, numerous researchers have conducted extensive studies on fissured rock masses, for instance, Chen W et al. [6] investigated the mechanical properties, crack evolution, failure modes, and microscopic damage mechanisms of fissured rock masses in high-moisture environments. They found that the degree of rock mass looseness increased with immersion time, and the initiation and propagation stresses of cracks were negatively correlated with immersion time, utilizing uniaxial compression tests combined with Nuclear Magnetic Resonance (NMR), Scanning Electron Microscopy (SEM), Energy Dispersive Spectroscopy (EDS), and X-ray Diffraction (XRD). H Hu et al. [7] developed the Barton–Bandis model (BB model) and combined it with the Continuous–Discontinuous Element Method (CDEM) to study the P-wave in fissured rock masses. KM Sun et al. [8] numerically simulated fissured rock mass models and proposed criteria for determining crack instability. They systematically investigated the crack propagation patterns at different orientations. M Ye et al. [9] revealed the mechanism of crack propagation induced by the combined action of triaxial stress and pre-existing fissures through triaxial compression tests. H Zhou et al. [10] conducted static three-point bending tests on sandstone specimens with prefabricated fissures. They combined Digital Image Correlation (DIC) and Finite Element Software ANSYS to study the distribution curve of stress intensity factors and their temporal variations, exploring the distribution patterns of stress intensity factors and fracture characteristics over time. B Li et al. [11] studied the damage evolution characteristics of fissured rock masses at different angles based on similarity simulation theory. They proposed that with increasing fissure inclination angle, the infrared radiation temperature of the specimen surface initially decreased and then increased, with a significant mutation near the peak stress. The damage evolution process of the rock mass was divided into three stages: initial, stable, and accelerated damage. X Sun et al. [12] conducted numerical simulation experiments on sandstone specimens with prefabricated fissures at different angles using PFC2D for uniaxial compression. They concluded that the peak stress, elastic modulus, and initiation stress of the specimens were controlled by the fissure angle and pointed out a significant correlation between AE activity level and fissure angle variation. Yujing Guo et al. [13] conducted similar simulation experiments and numerical simulation studies on specimens with prefabricated fissures, explaining the damage process of deep-seated fissured rock masses under dynamic disturbances. Yu C et al. [14] utilized AE monitoring counts and Scanning Electron Microscopy (SEM) to investigate the fracture failure process of sandstone under uniaxial compression cyclic loading–unloading tests in freeze–thaw conditions. They explored the influence of freeze–thaw conditions on internal microcracks in sandstone through analysis of AE ring-down counts. Zhang W et al. [15] pointed out that the localization results of AE events could effectively reflect the location and mode of fracture within rocks. They indicated that during initial failure, the events were small and dispersed, whereas during later failure, they were large and concentrated.
Most of the above scholars’ research studies are focused on the influence of fissure angle on the mechanical properties of prefabricated fissure specimens; however, in the actual engineering, the engineering rock body is affected by a variety of external factors, such as construction methods, geostress, and other external factors, which lead to changes in the rate of the external load it is subjected to, and there are fewer research studies on the influence of loading rate on the mechanical properties of rocks in the past studies. Against this background, the present paper is based on the study of the mechanical properties of prefabricated fissures. In this context, this paper takes prefabricated fissures as the research object, through the use of a prefabricated fissure inclination angle in the range of 0°~60°, and uses an RYL-600 shear rheometer and AMSY-6 32-channel equipment monitoring system on the prefabricated fissure specimen for uniaxial compression acoustic emission tests at different loading rates to explore the effect of the different loading rates and fissure inclination angle on the class of the mechanical properties of the rock specimen changes. We investigate the mechanical property changes of rock specimens and the evolution of AE parameters under the influence of different loading rates and different fracture inclination angles, in order to provide corresponding parameters and theoretical support for the improvement of safety and stability prediction of engineering rock bodies in actual projects.
2. Test Program
2.1. Test Material and Specimen Preparation
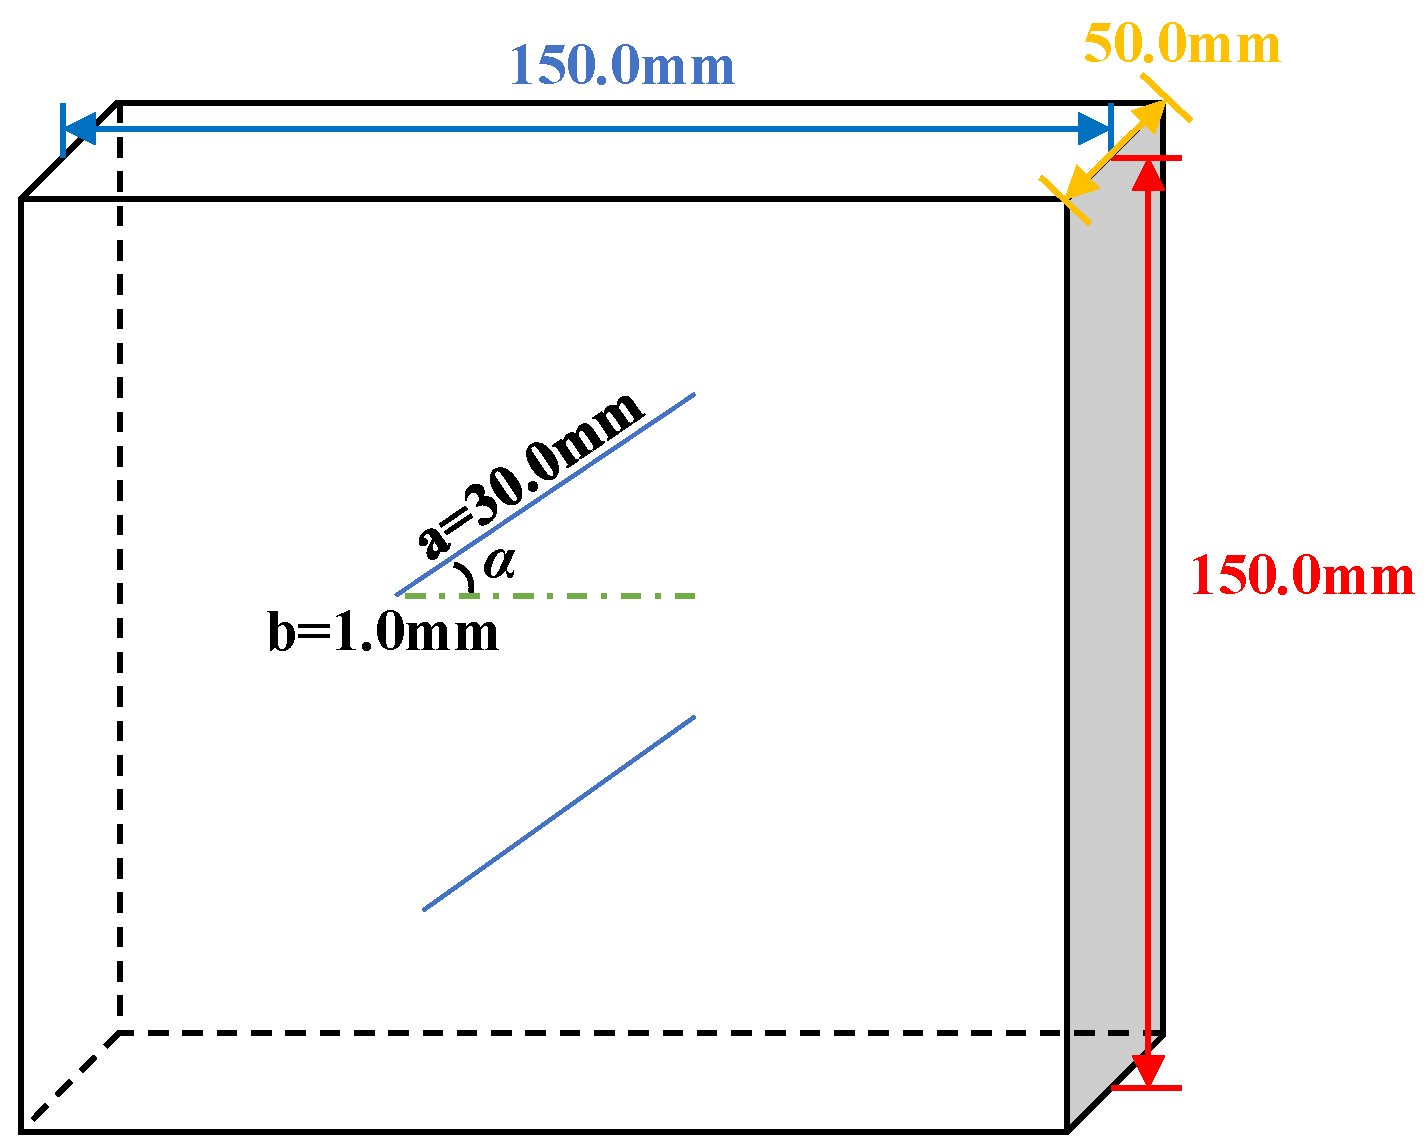
To make the experiment more representative of the actual engineering scenarios of fissured rock mass failure, surrogate rock specimens are prepared according to a cement–sand–water ratio of 3.9:3.7:1.5 by mass. In order to better observe the crack propagation, the specimen size is set to 150 mm·150 mm·50 mm [16]. To create the desired prefabricated fissure specimens, the model material is thoroughly mixed and then placed in a steel mold with internal dimensions of 150 mm·150 mm·50 mm. The material is uniformly compacted using a vibrating table. Subsequently, the specimens are horizontally left to settle at room temperature for 3 h. Afterward, 0.1 mm thick mica sheets are inserted into designated positions, and the specimens are left to settle horizontally for approximately 3 h. Once the specimens are confirmed to have partially solidified, the mica sheets are removed along the insertion direction, and the specimens are left to settle horizontally for about 6 h. Upon complete solidification confirmation, the molds are removed. To mitigate the influence of surface irregularities on the test results, any uneven portions of the specimen surface are polished and inspected to ensure the prefabricated fissures are fully formed. Subsequently, the specimens undergo a curing stage for 24 days to ensure strength, as depicted in Figure 1.
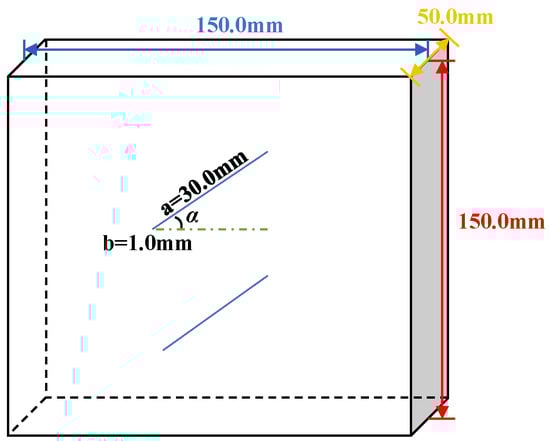
Figure 1.
Sample openings.
The two prefabricated fissures are characterized by parameters including the fissure-to-boundary angle α, fissure length a, and fissure width b. In past studies, it can be seen that the fracture dip angle will have a significant impact on the mechanical properties of the rock, and the effects of different fracture dip angles are not consistent. At the same time, the scale of the fracture will also affect the reliability and accuracy of the test results. In order to ensure that the test can effectively reflect the mechanical behavior of fractured rock masses with different fracture dip angles, the fracture dip angles α = 0°, 30°, 45°, and 60° were selected in this experiment. The fissure length is a = 30.0 mm, and the fissure width is b = 1.0 mm. Additionally, a reference group is established comprising intact surrogate rock specimens without fissures. The prepared specimens are numbered according to the following format: D-Fissure Angle-Loading Rate. The table of specimen numbering is provided as Table 1.

Table 1.
Specimen number table.
2.2. Test Program
The experiment was conducted at the Key Laboratory of Mine Safety and Efficient Mining Technology in Hunan Province, Hunan University of Science and Technology. A shear rheometer (RYL-600) produced by Changchun Chaoyang Instrument Co., Ltd. (Changchun, China) was used to conduct uniaxial compression tests on the specimens with displacement control loading. The loading mode selected was displacement-controlled loading, with loading rates set at 0.5 mm/min, 1.0 mm/min, 3.0 mm/min, and 5.0 mm/min. To mitigate the effects of end effects, lubricating oil was applied to the end faces of the specimens in contact with the platens before loading. Additionally, a Vallen AMSY-6 type 32-channel monitoring system for acoustic emission was installed to monitor the acoustic emission signals during the specimen failure process. A schematic diagram of the experimental setup is shown in Figure 2.
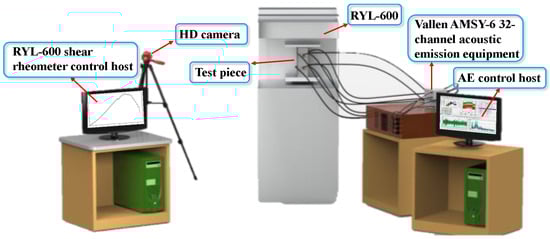
Figure 2.
Diagram of test equipment.
3. The Effect of Loading Rate Changes in Rock-like Materials
3.1. Effect of Different Loading Rates on the Deformation Strength Characteristics of Rock-like Rocks
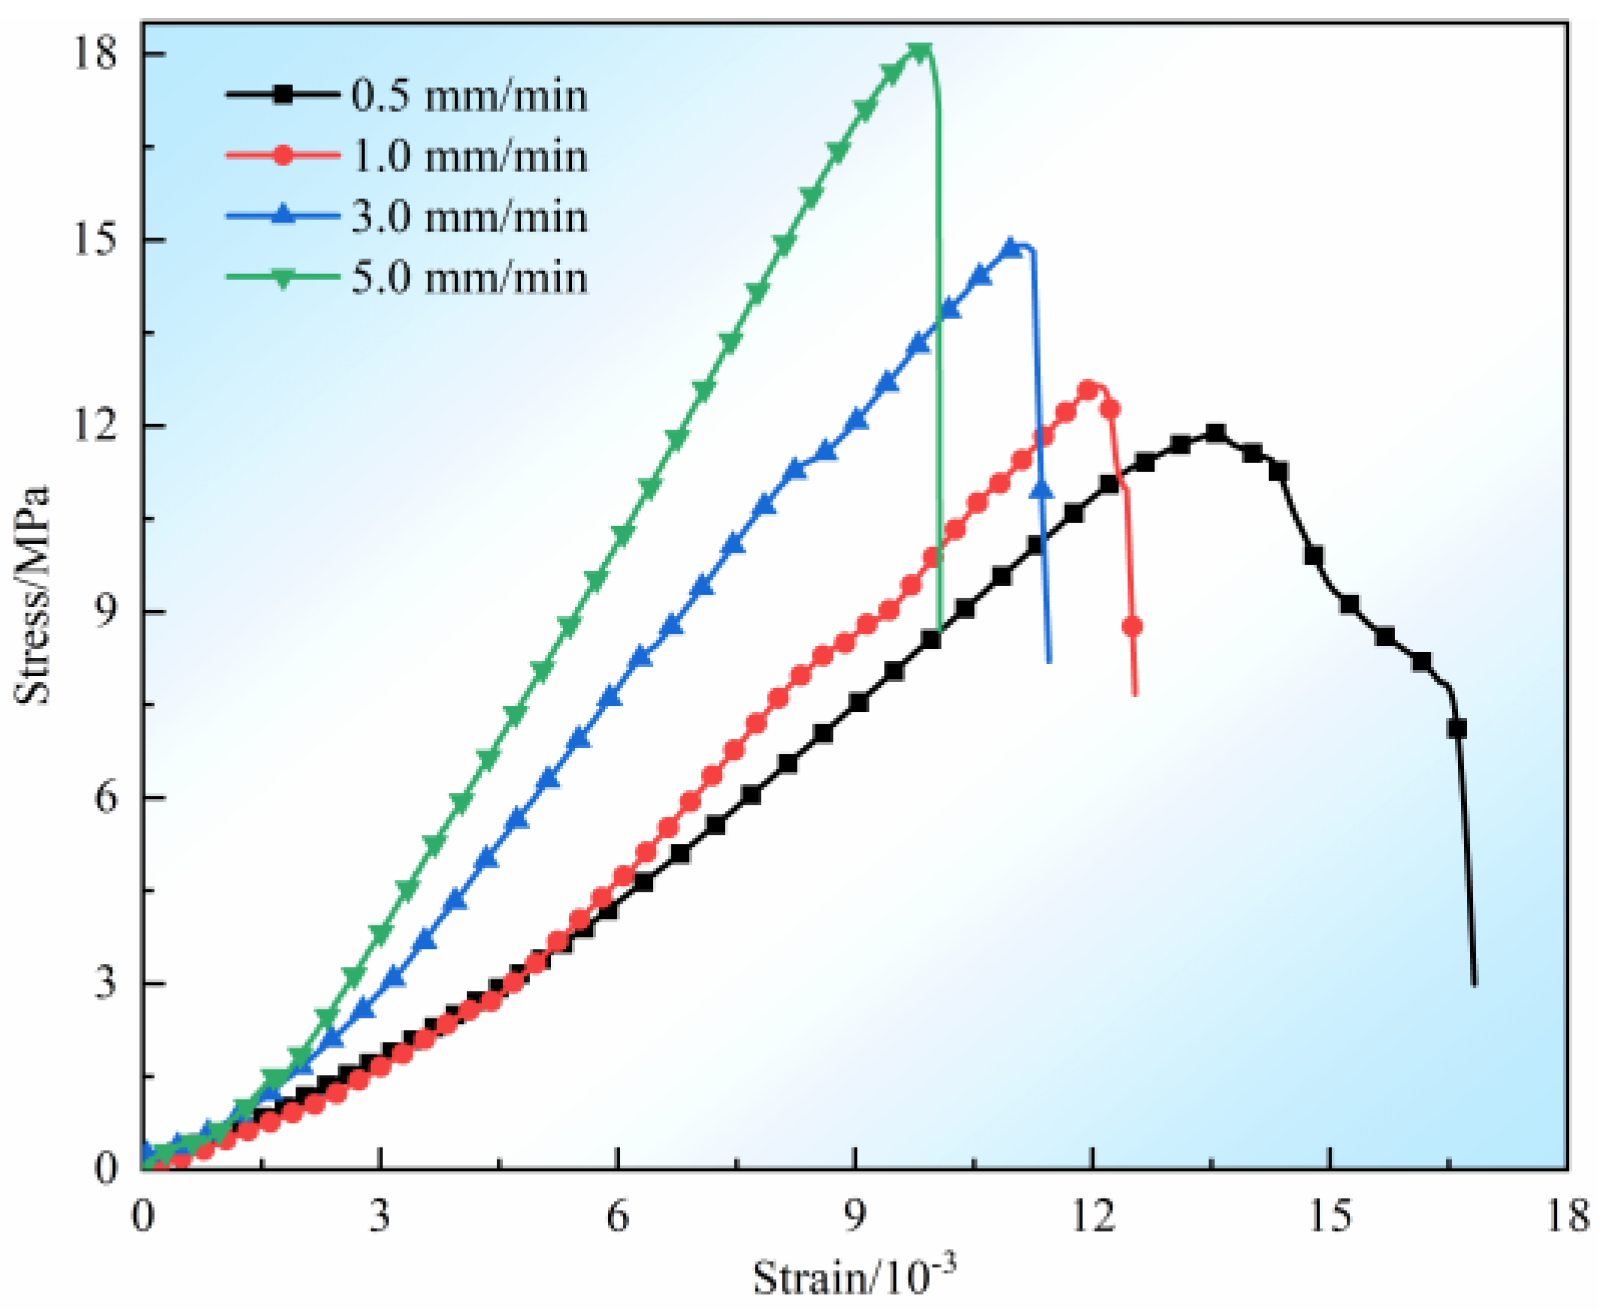
After subjecting the intact specimens to uniaxial compression at different loading rates, the stress–strain curves obtained are depicted in Figure 3. Analysis reveals a positive correlation between the slope of the stress–strain curve and the loading rate. When the loading rate v = 0.5 mm/min, during the post-peak failure stage, the stress–strain curve exhibits a gradual decrease, indicating a certain degree of plastic failure. However, with the increase in the loading rate, during the post-peak failure stage, the stress–strain curve sharply decreases, indicating brittle failure.
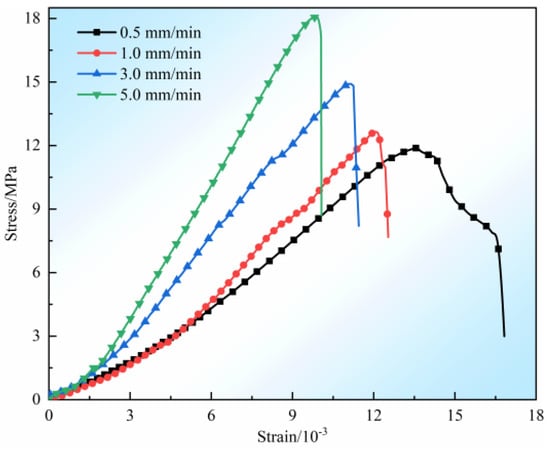
Figure 3.
Complete rock-like stress–strain curves under different loading rates.
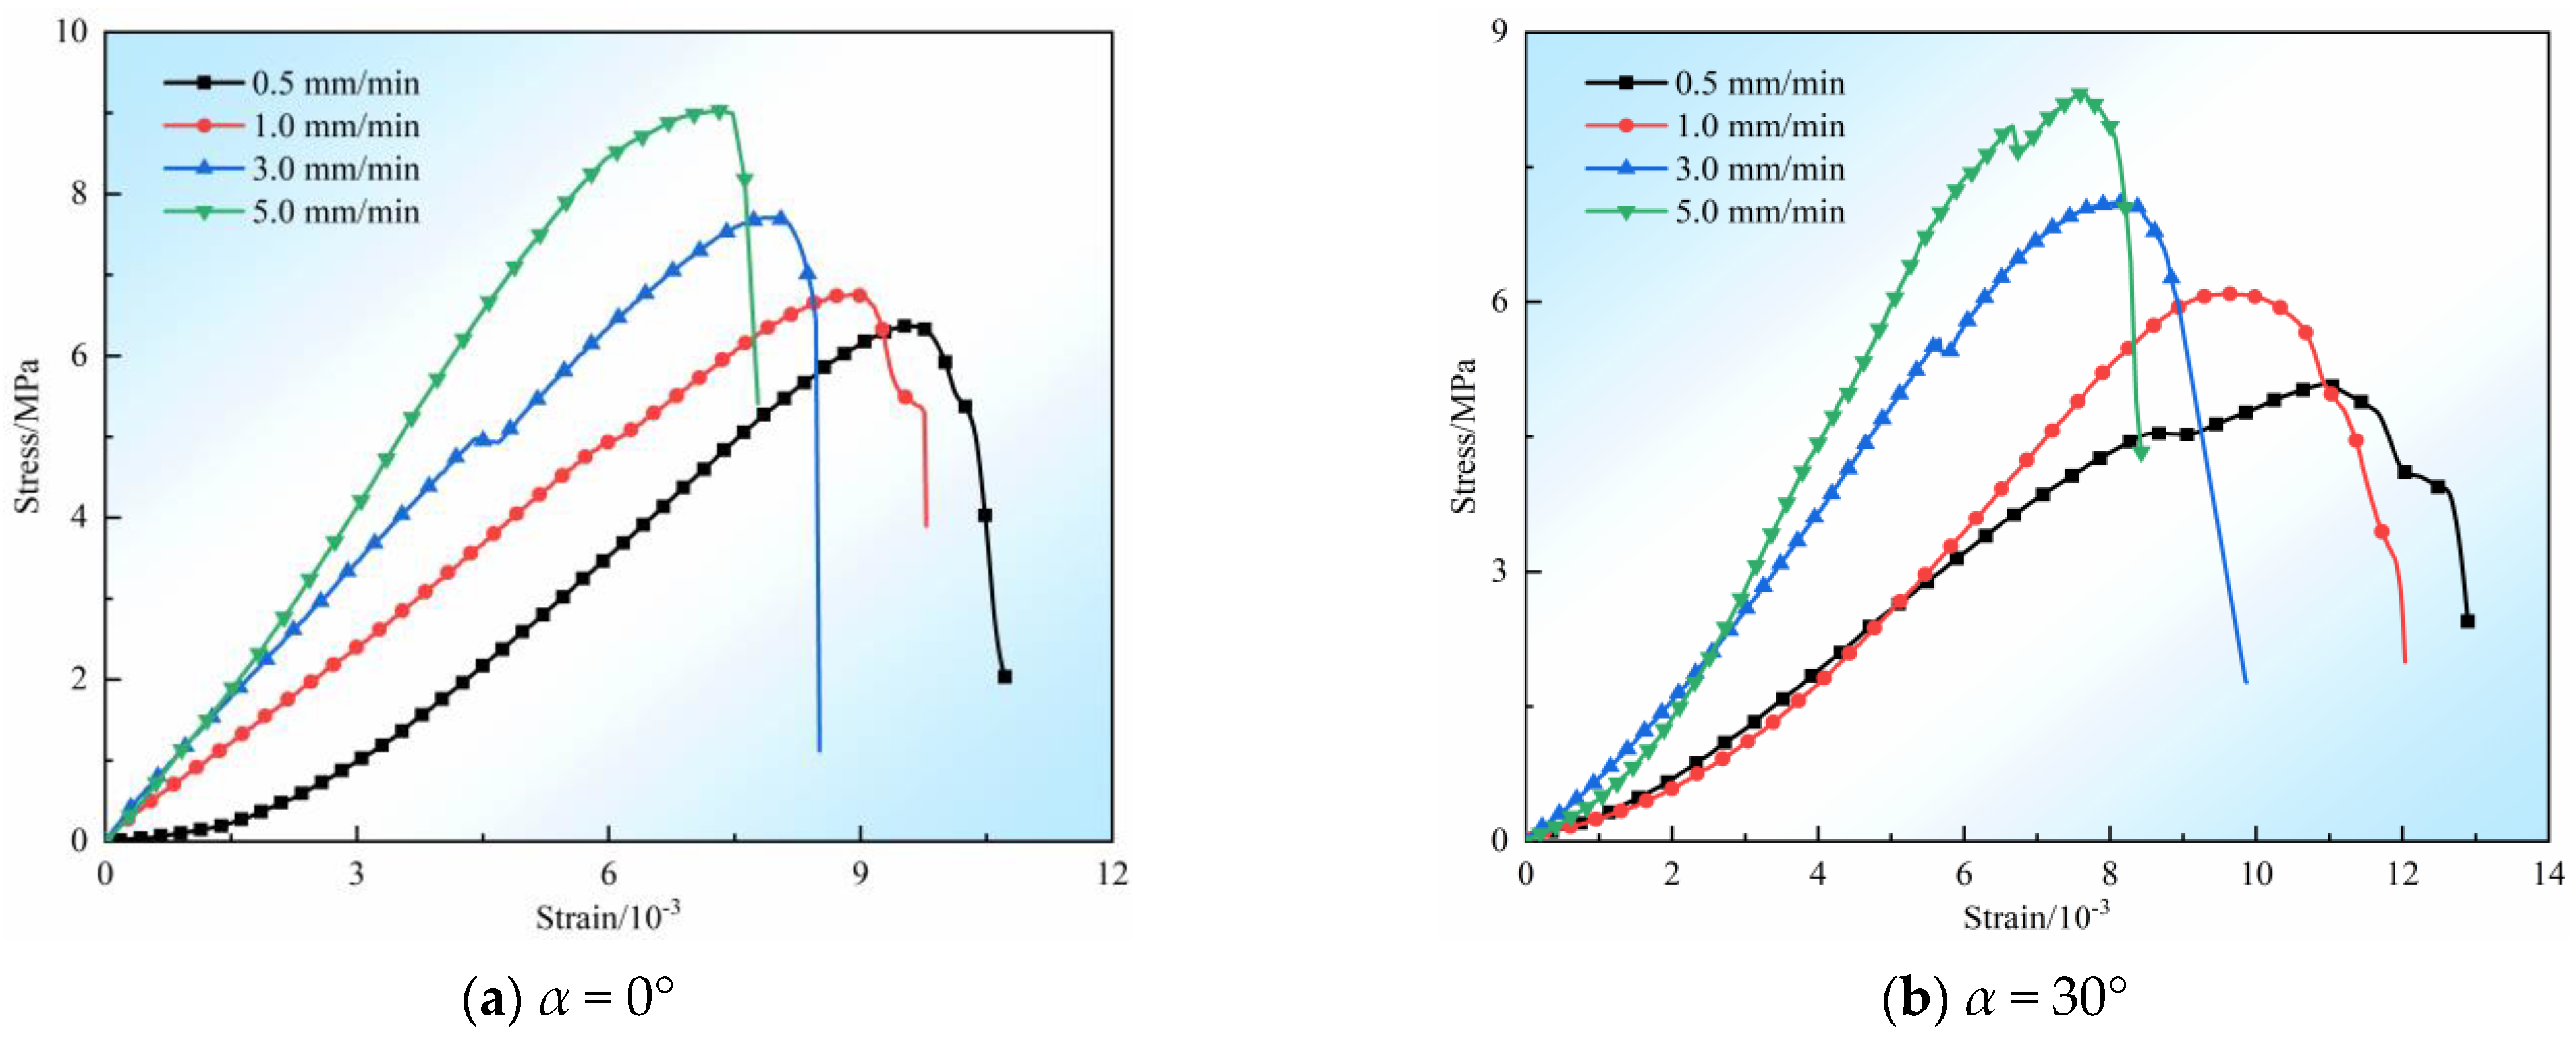
Similarly, uniaxial compression tests at four different loading rates were conducted on surrogate rock specimens with different prefabricated fissure angles. Based on the results, stress–strain curves were plotted for each prefabricated fissure angle, as depicted in Figure 4.
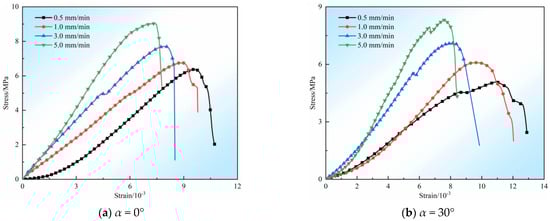
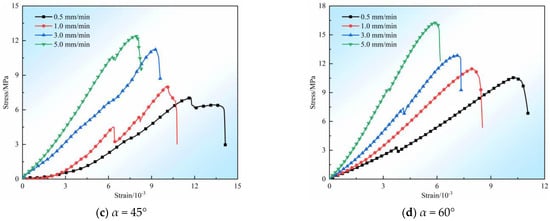
Figure 4.
The stress–strain curves of rock-like materials with different crack dip angles under different loading rates.
From Figure 4, it is evident that the stress–strain curve distribution pattern of the prefabricated fissure specimens is similar to that of the intact specimens. Both exhibit four distinct stages: (I) initial crack closure stage, (II) elastic deformation to micro-elastic crack stability development stage, (III) unstable crack propagation stage, and (IV) post-peak failure stage [1,17].
In Figure 4a, when the loading rates are 0.5 mm/min and 1.0 mm/min, the stress–strain curves exhibit a relatively gradual decrease during the post-peak failure stage (Stage IV), indicating plastic failure characteristics. However, as the loading rates increase to 3.0 mm/min and 5.0 mm/min, the specimens display brittle failure characteristics. In Figure 4b, after reaching the peak stress, the downward trend of the stress–strain curve is relatively gradual, and with an increase in the loading rate, the failure mode transitions noticeably from plastic to brittle. In Figure 4c, for specimens loaded at 0.5 mm/min, the stress–strain curve is relatively gentle compared to the other specimens, showing an overall plastic failure pattern. After reaching peak strength, the stress–strain curve decreases gradually. For specimens loaded at 1.0 mm/min and 5.0 mm/min, there are significant fluctuations during the stage of elastic deformation to micro-elastic crack stability development, caused by the compression of pre-existing fissures within the specimen during loading, resulting in apparent stress drops in the stress–strain curve. In Figure 4d, after reaching peak strength, the stress–strain curve sharply decreases, indicating overall elastic failure. The fluctuations observed during loading are due to the compression of inherent fissures within the rock sample.
Based on the stress–strain curves of prefabricated fissure specimens under different loading rates as depicted above, we record the peak strength qc and the corresponding strain Σc in Table 2. A comparison reveals that the peak strength of prefabricated fissure specimens is consistently lower than that of intact specimens, albeit with inconsistent differences. This indicates that prefabricated fissures lead to varying degrees of strength degradation in the specimens [18]. Analysis reveals that when the fissure angle α is constant, the variations in peak strength and corresponding strain between prefabricated fissure specimens and intact specimens are similar: the peak strength of specimens increases proportionally with the increase in the loading rate, while the corresponding strain decreases inversely. However, when the loading rate v is constant, the peak strength of prefabricated fissure specimens shows a trend of initially decreasing and then increasing with the increase in the fissure angle, whereas the corresponding strain shows a trend of initially increasing and then decreasing.
Table 2.
Peak strength and strain of rock-like materials with different fracture angles under uniaxial conditions.
Under the same fissure angle conditions, taking α = 45° as an example, the peak strength increases from 7.05 MPa (0.5 mm/min) to 12.37 MPa (5.0 mm/min), representing a 75.5% increase. Meanwhile, the corresponding strain decreases from 11.68·10−3 to 7.94·10−3, indicating a reduction of 32.0%.
Under the same loading rate conditions, taking v = 3.0 mm/min as an example, as the fissure angle α increases, the peak strength decreases from 7.61 MPa (α = 0°) to 7.10 MPa (α = 30°), representing a decrease of 6.70%. Then, it increases to 12.87 MPa (α = 60°), indicating an increase of 69.1%, The corresponding strain of peak strength also varies: It first increases from 7.87·10−3 (α = 0°) to 9.17·10−3 (α = 45°), showing an increase of 16.5%. Then, it decreases to 7.11·10−3 (α = 60°), decreasing by 22.5%.
3.2. Deterioration Analysis of Class Rock Specimens
To quantitatively analyze the degradation pattern of the mechanical properties of the rock-like specimens with different fissure angles α under various loading rates, let us define the degradation index of uniaxial compressive strength as Q(1) and Q(2). These indices will be used to quantitatively compare the degradation levels of uniaxial compressive strength for specimens with different α angles under the same loading rate and for specimens with the same α angle under different loading rates. Taking v = 3.0 mm/min and α = 45° as an example, the expressions for Q(1) and Q(2) are Equations (1) and (2), respectively [19]:
In the experiment, σ1 represents the uniaxial compressive strength of the intact specimen, measured in MPa; σ1(α) denotes the uniaxial compressive strength of specimens with different fissure angles α, also measured in MPa; and σ1(v) represents the uniaxial compressive strength of specimens under different loading rates, measured in MPa.
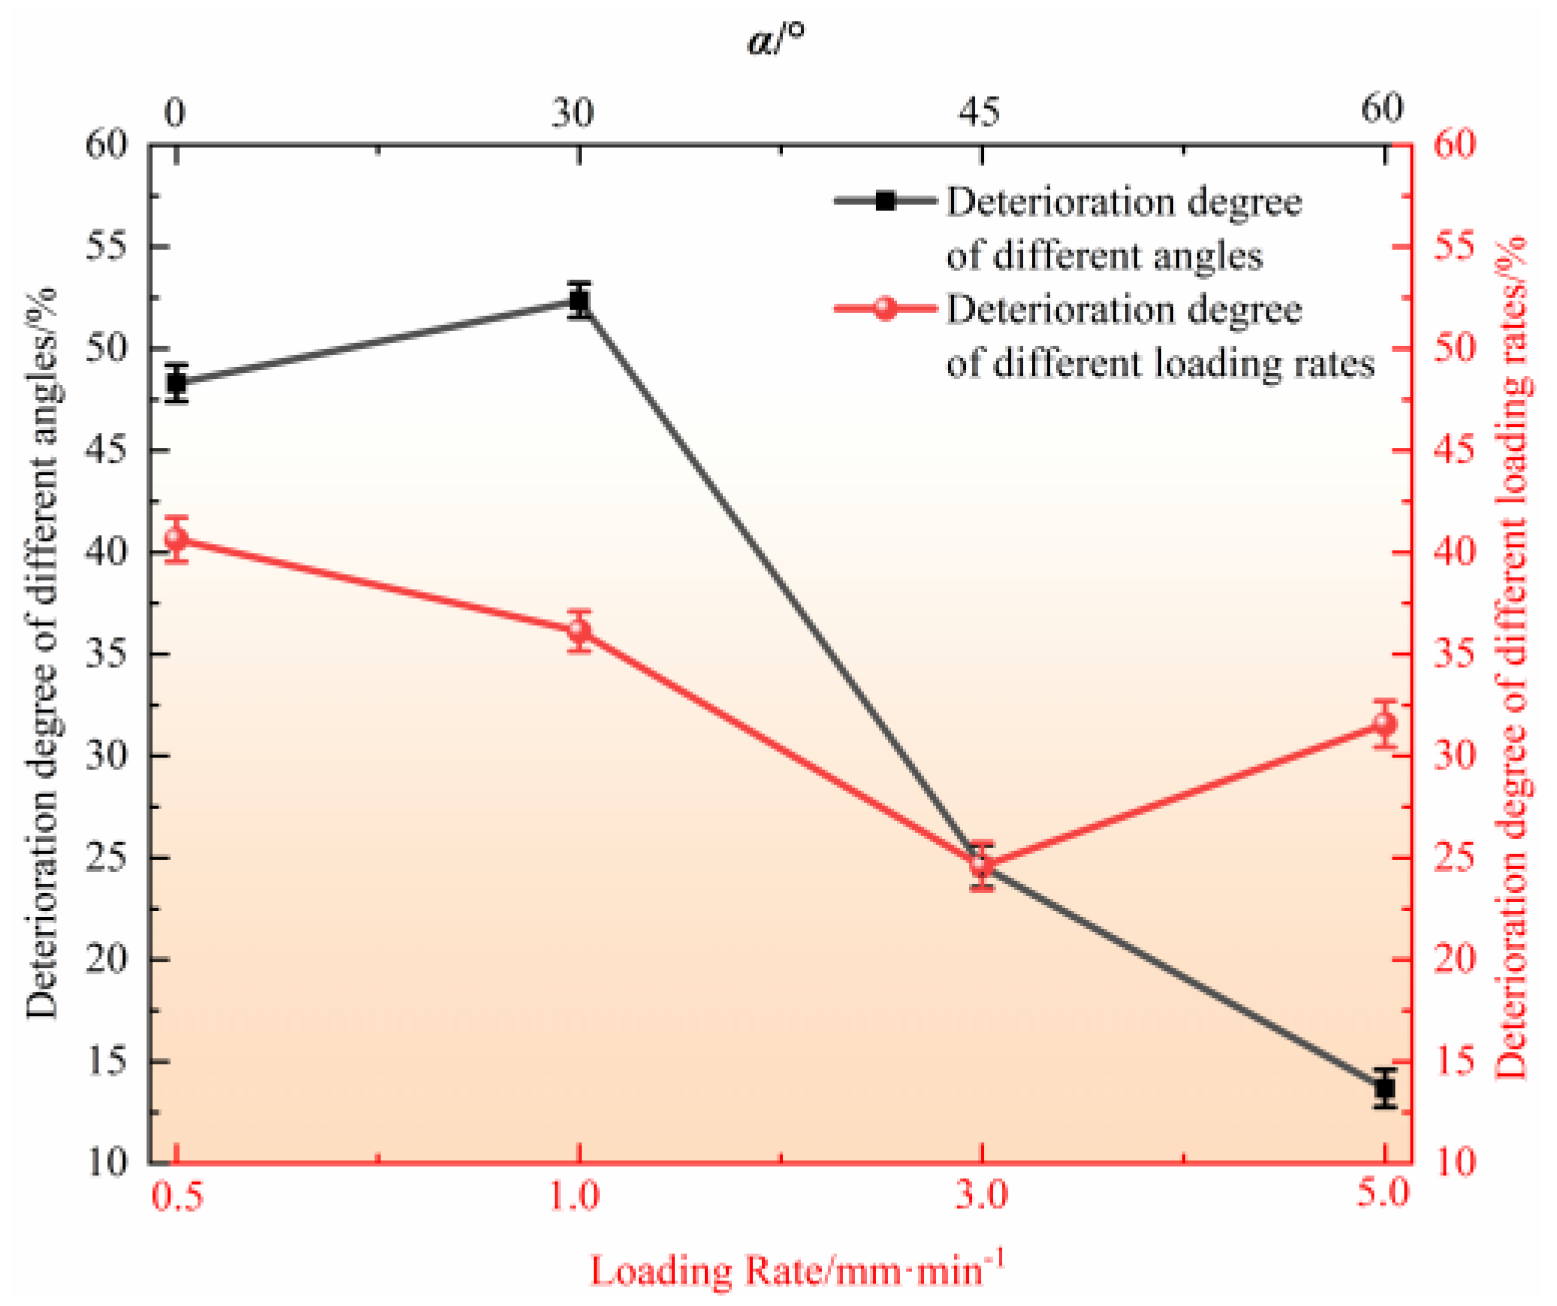
As shown in Figure 5, the degradation indices of uniaxial compressive strength for specimens with different loading rates and fissure angles are presented. When the loading rate remains constant, the overall degradation exhibits an “N”-shaped trend, with the degradation reaching its maximum at α = 30°. As shown in Figure 5, the degradation indices of uniaxial compressive strength for specimens with different loading rates and fissure angles are presented. When the loading rate remains constant, the overall degradation exhibits an “N”-shaped trend, with the degradation reaching its maximum at α = 30°, experiencing the most significant degradation, indicating the most severe mechanical property damage. Conversely, when the pre-fissure angle remains constant, a loading rate of v = 3.0 mm/min results in the least degradation, indicating minimal mechanical property damage.
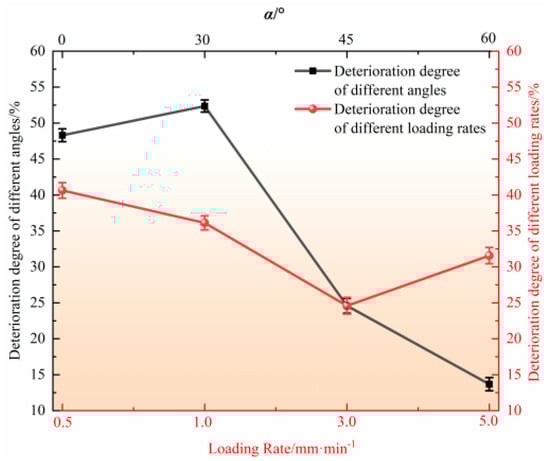
Figure 5.
Deterioration degree of uniaxial compressive strength of specimens with different loading rates and different slit angles.
3.3. Effect of Loading Rate on Strain as Well as Modulus of Elasticity of Fractured Rock Bodies
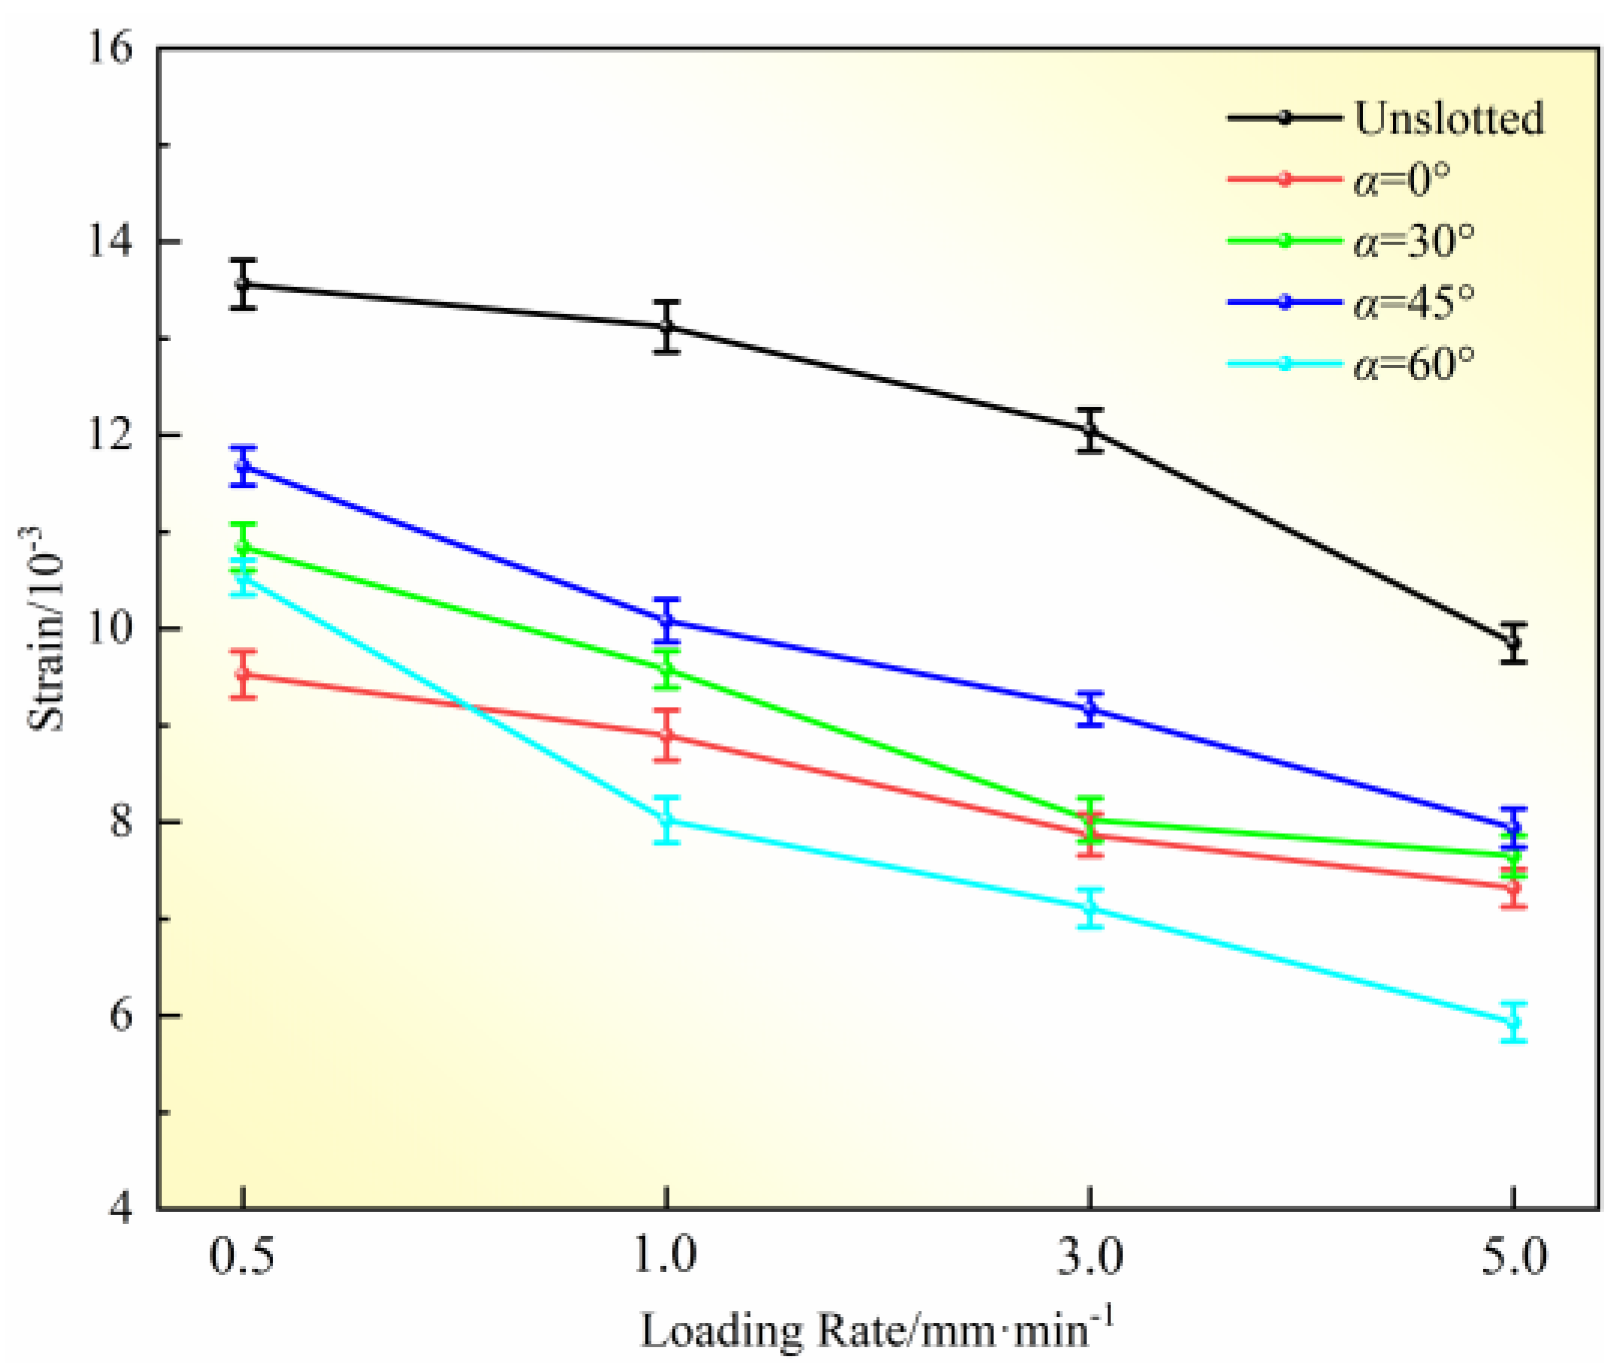
The peak stress corresponding to strain values for specimens under different loading rates are plotted in Figure 6. Analysis reveals that compared to intact specimens, those with pre-existing fissures exhibit lower peak stress corresponding to strain values. Furthermore, it is observed that these values vary with the fissure angle α, although there is some degree of dispersion in the results. Overall, there is a decreasing trend in the peak stress corresponding to strain values with the gradual increase in the loading rate [20].
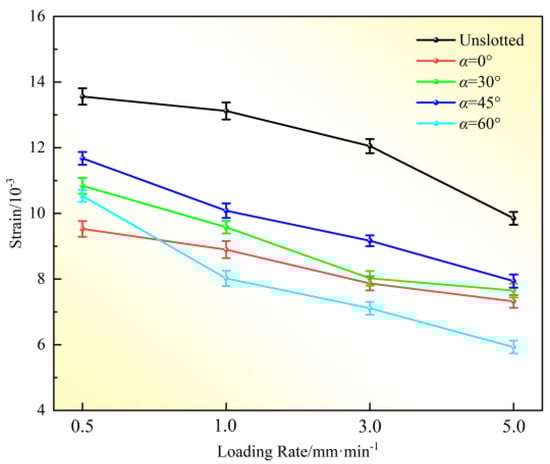
Figure 6.
The influence of loading rate on the strain corresponding to the peak stress of rock-like materials.
To explore the influence of loading rate on the elastic modulus of the specimens, the elastic modulus E of the specimens can be determined using Equation (3):
In the experiment, σ1 and σ2 correspond to the stress values at the approximate linear segments’ start and end points on the stress–strain curve of the specimen, measured in MPa; and ε1 and ε2 represent the strain values at the beginning and end points of the nearly linear segments on the stress–strain curve of the specimen.
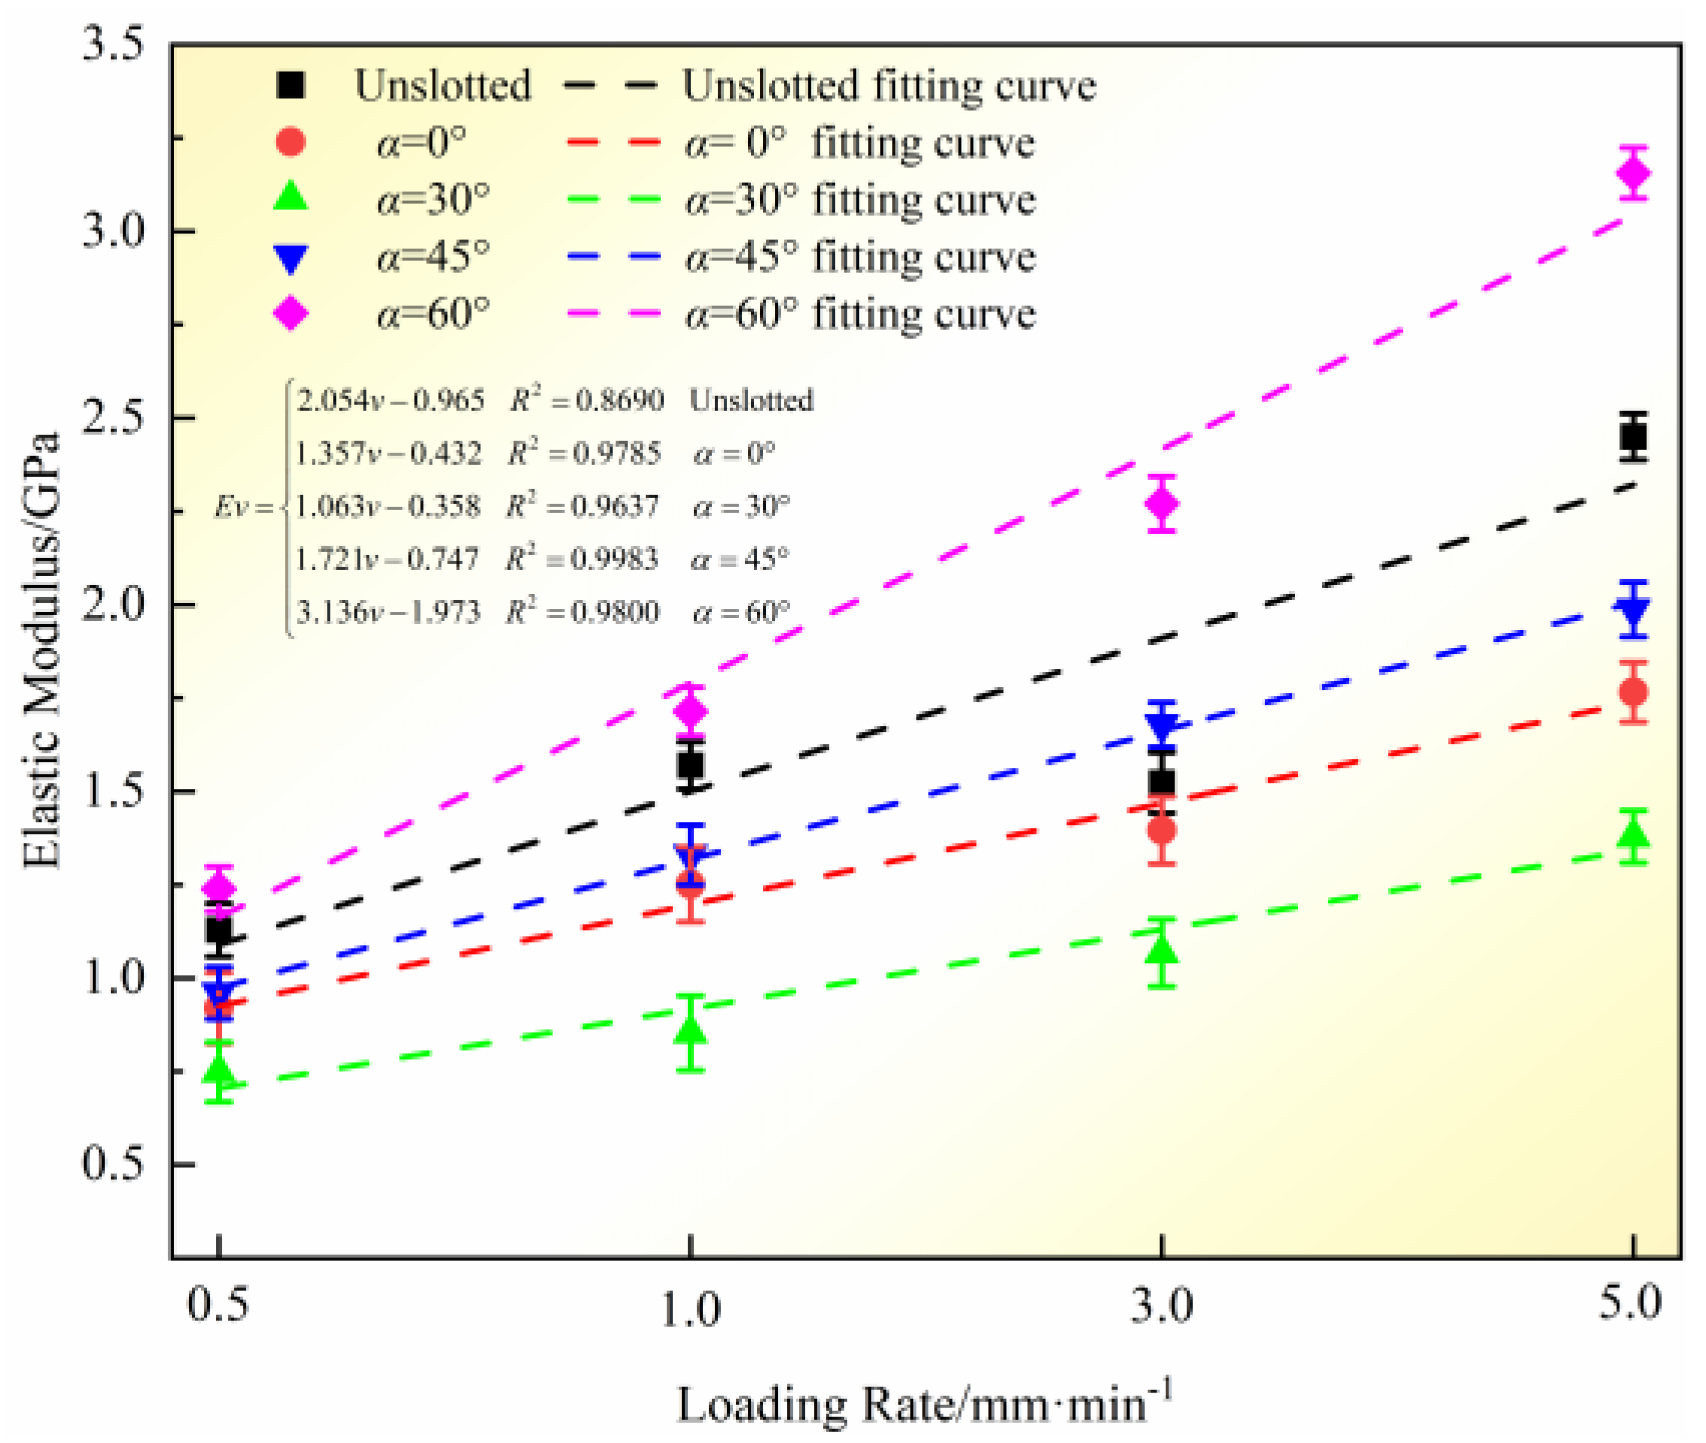
The relationship between the elastic modulus of the specimen and the loading rate is plotted in Figure 7. Analysis reveals that the elastic modulus of the specimen is positively correlated with the loading rate, and the growth pattern of the elastic modulus approximates linearity. The fitted curve is represented by Equation (4). The slope of the fitted curve for the elastic modulus of the intact specimen is 2.054. However, in the case of the specimens with pre-existing fissures, as the fissure angle α increases from 0° to 60°, and the slopes of the fitted curves for the elastic modulus are 1.357, 1.063, 1.721, and 3.136. This indicates that with the gradual increase in the fissure angle α, the acceleration of the specimen’s elastic modulus exhibits a “V”-shaped feature, being lowest at α = 30° and highest at α = 60°. Compared with the slope of the fitted curve for the elastic modulus of the intact specimen, it is evident that pre-existing fissures also have an impact on the elastic modulus of the specimen.
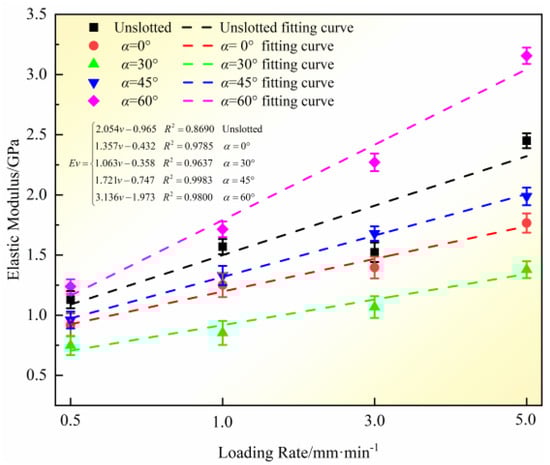
Figure 7.
Effect of loading rate on elastic modulus of rock-like materials.
3.4. Effects of Loading Rate and Fissure Inclination Angle on Specimen Initiation Stress and Penetration Stress
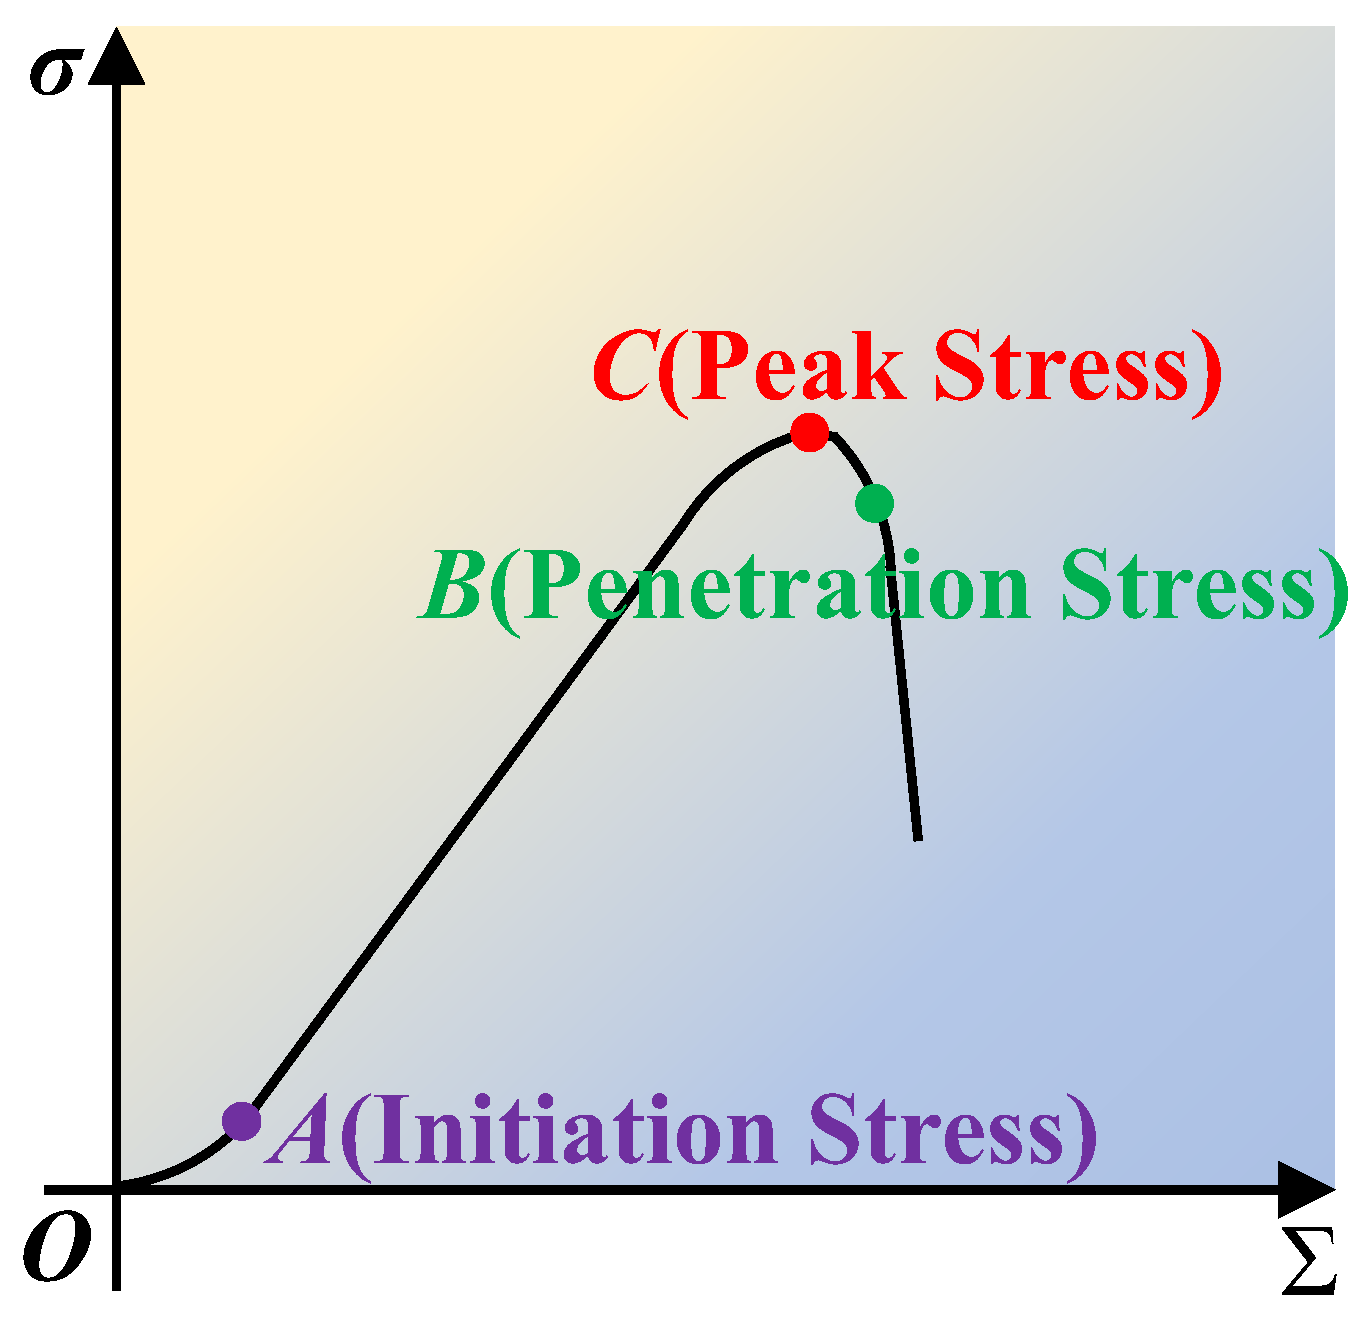
In order to investigate the loading rate and the crack inclination angle on the specimen crack initiation stress and penetration stress, the initiation stress is defined as the stress corresponding to the appearance of the first crack in the specimen, and the penetration stress is the stress corresponding to the penetration between the two prefabricated cracks [17], which is located in the distribution of the stress–strain curve shown in Figure 8.

Figure 8.
The distribution of crack initiation stress, peak stress, and penetration stress.
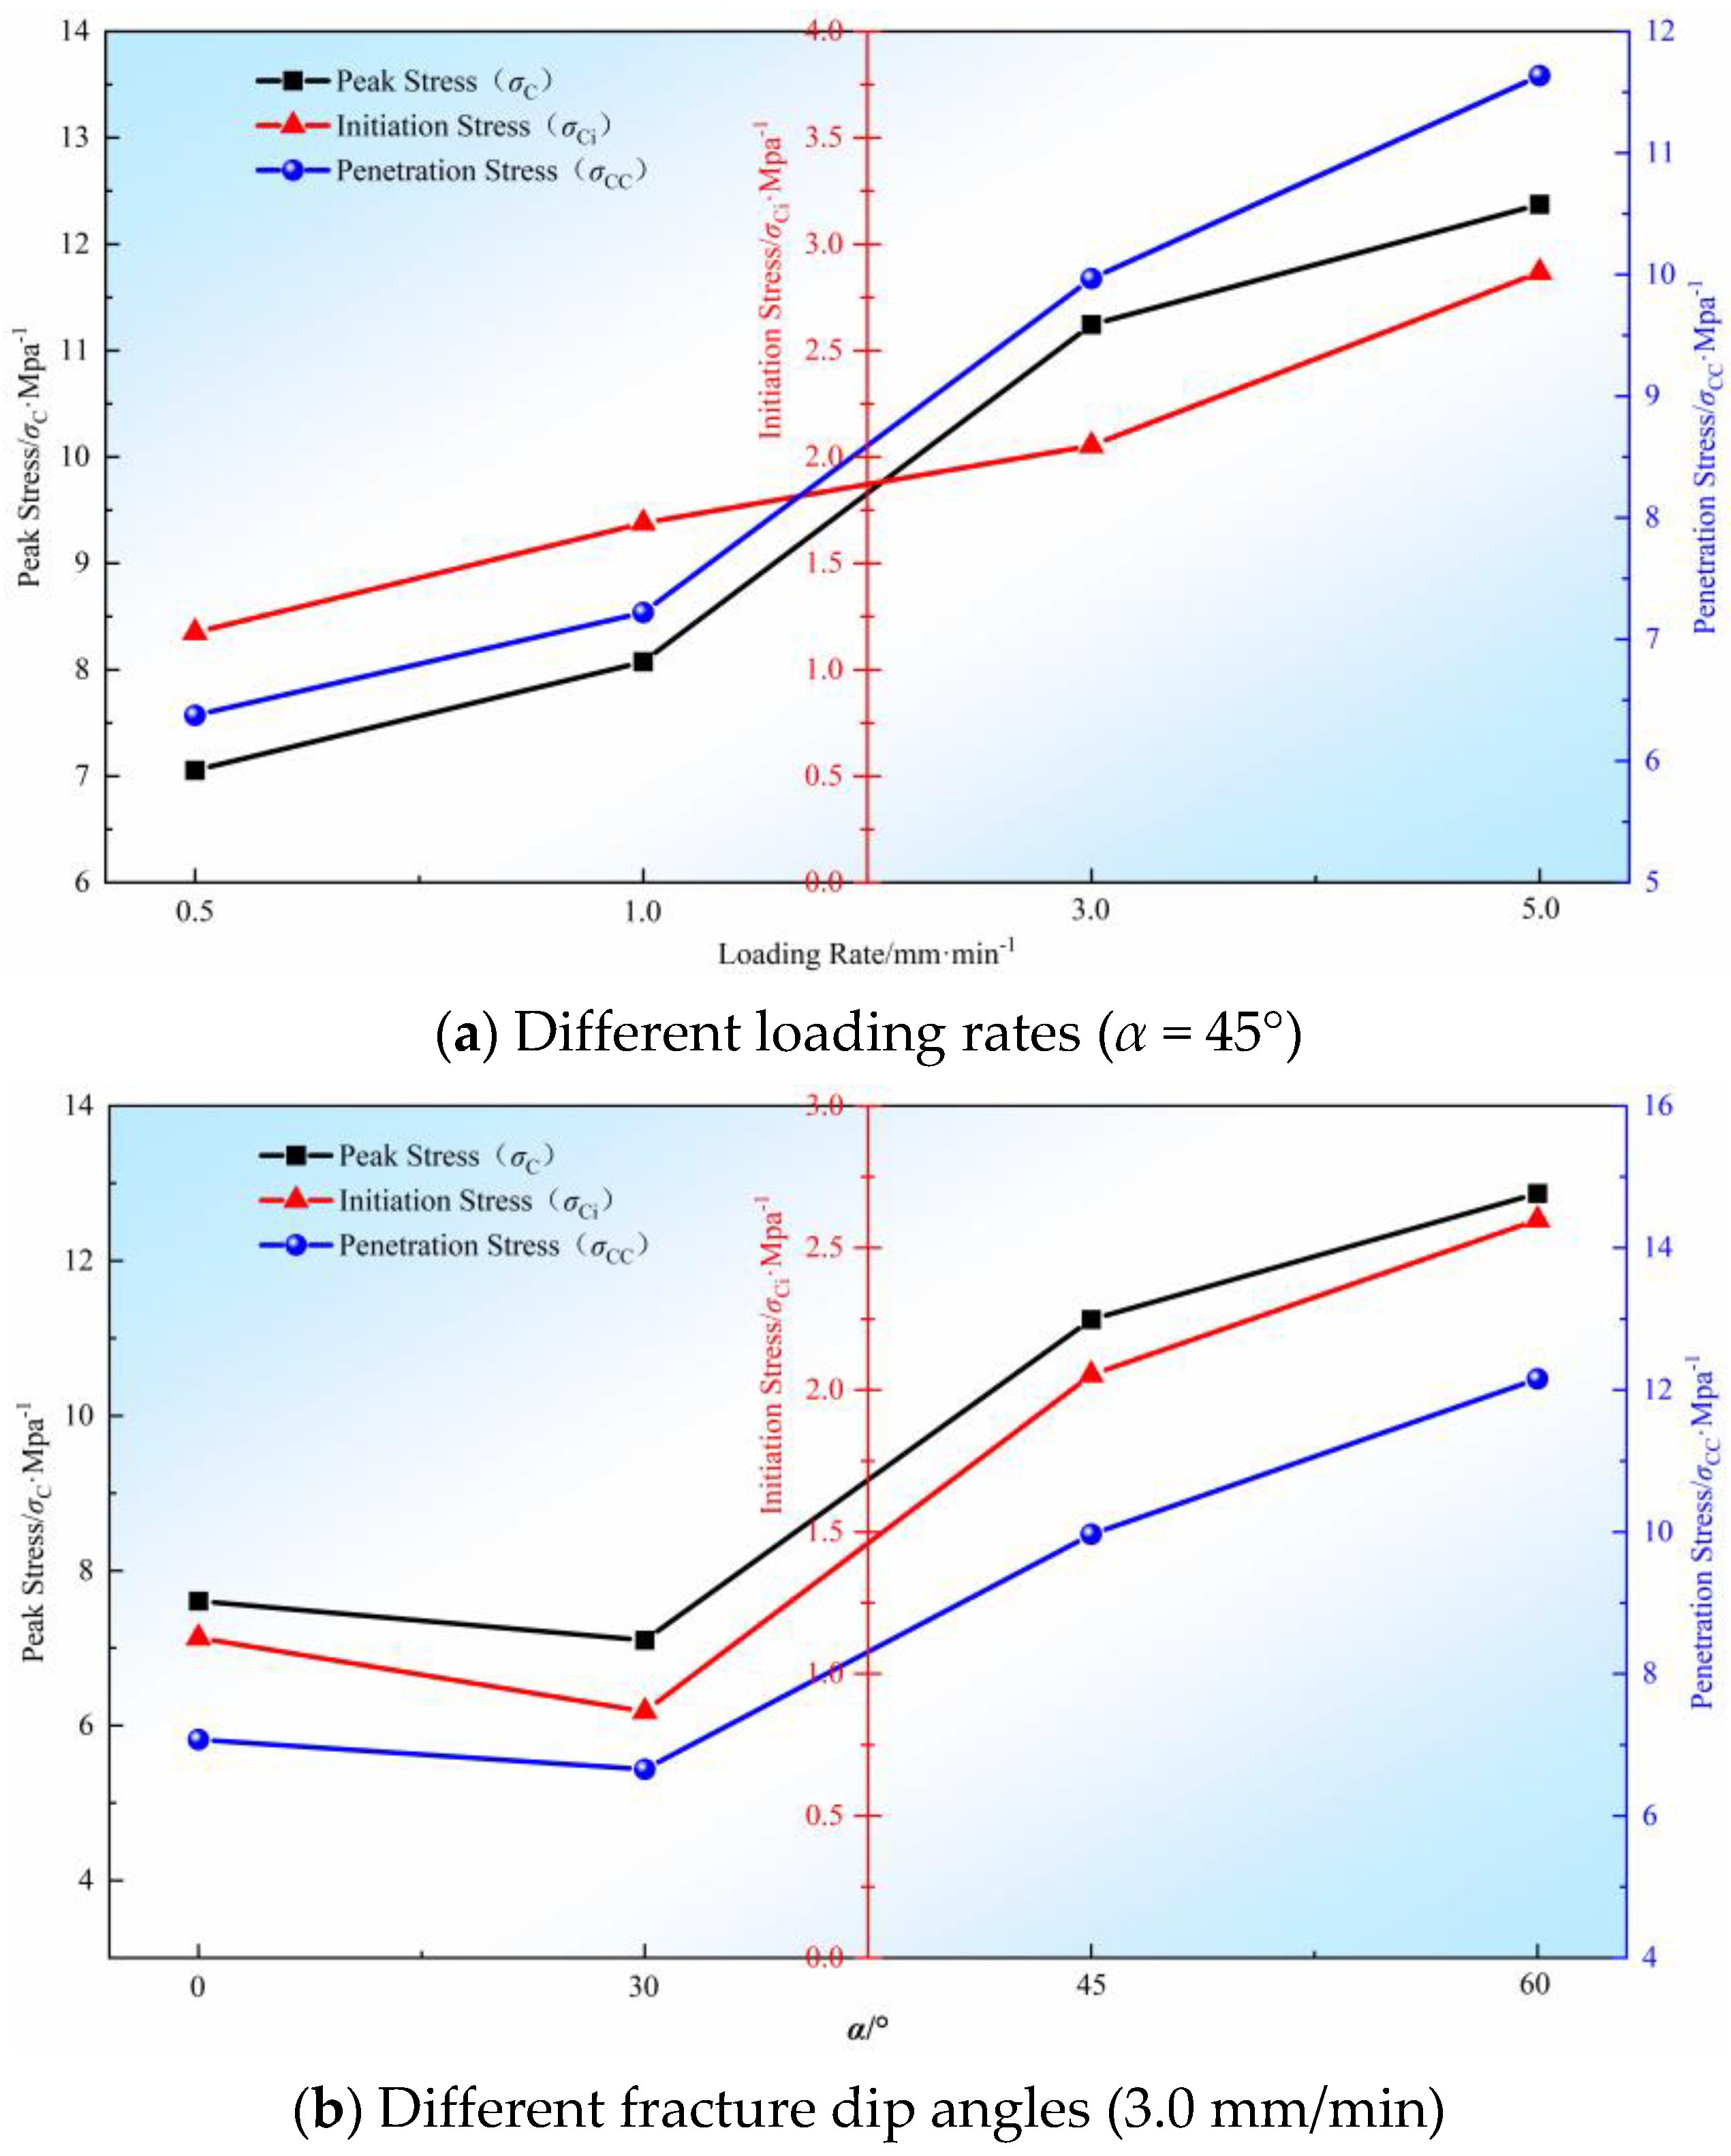
Figure 9a shows the effect of loading rate v on the peak stress σC, crack initiation stress σCi, and penetration stress σCC of the prefabricated slit specimen (α = 45°). The corresponding values are listed in Table 3 and it can be analyzed in Table 3 and Figure 9a that the peak stress, crack initiation stress, and penetration stress of the specimen show a gradual increasing trend with the increase in the loading rate. The peak stress increased from 7.05 MPa (0.5 mm/min) to 12.37 MPa (5.0 mm/min) by 75.5%, the crack initiation stress increased from 1.17 MPa (0.5 mm/min) to 2.87 MPa (5.0 mm/min) by 145.3%, and the penetration stress increased from 6.38 MPa (0.5 mm/min to 5.0 mm/min) to 11.64 MPa (5.0 mm/min) by 82.4%, and the penetration stress increased from 6.38 MPa (0.5 mm/min) to 2.87 MPa (5.0 mm/min) by 145.3%. It is evident that the higher the loading rate, the greater the impact on the peak stress, initiation stress, and breakthrough stress of the rock samples.
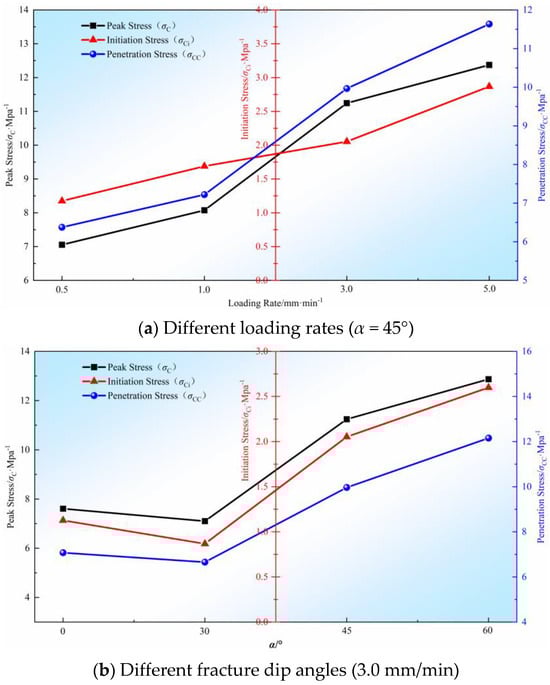
Figure 9.
The influence curves of loading rate, crack dip angle, crack initiation stress, and penetration stress of specimens.
Table 3.
Peak stress, crack initiation stress, and penetration stress at α = 45°.
Figure 9b shows the effect of crack inclination angle α on the peak stress σC, crack initiation stress σCi, and penetration stress σCC of the prefabricated crack specimen (v = 3.0 mm/min). The corresponding values are listed in Table 4. Analysis from Table 4 and Figure 9b indicates that at the same loading rate, there exists a “V”-shaped pattern in the peak stress, initiation stress, and breakthrough stress of the fissured specimens with increasing fissure angle. When α = 0°, the peak stress, initiation stress, and breakthrough stress are 7.61 MPa, 1.13 MPa, and 7.07 MPa respectively. However, when α = 30°, they decrease to 7.10 MPa, 0.87 MPa, and 6.66 MPa respectively, representing reductions of 6.64%, 23.0%, and 5.93% respectively. When α = 60°, they increase to 12.87 MPa, 2.60 MPa, and 12.16 MPa respectively, showing increments of 81.2%, 199.7%, and 82.7% respectively. This indicates that different fissure angles have varying degrees of influence on the peak stress, initiation stress, and breakthrough stress of the specimens, but overall, they follow a pattern of decrease followed by increase.
Table 4.
Peak stress, crack initiation stress, and penetration stress at v = 3.0 mm/min.
4. Analysis of Fracture Modes and Crack Expansion Mechanisms
4.1. Crack Damage Mode
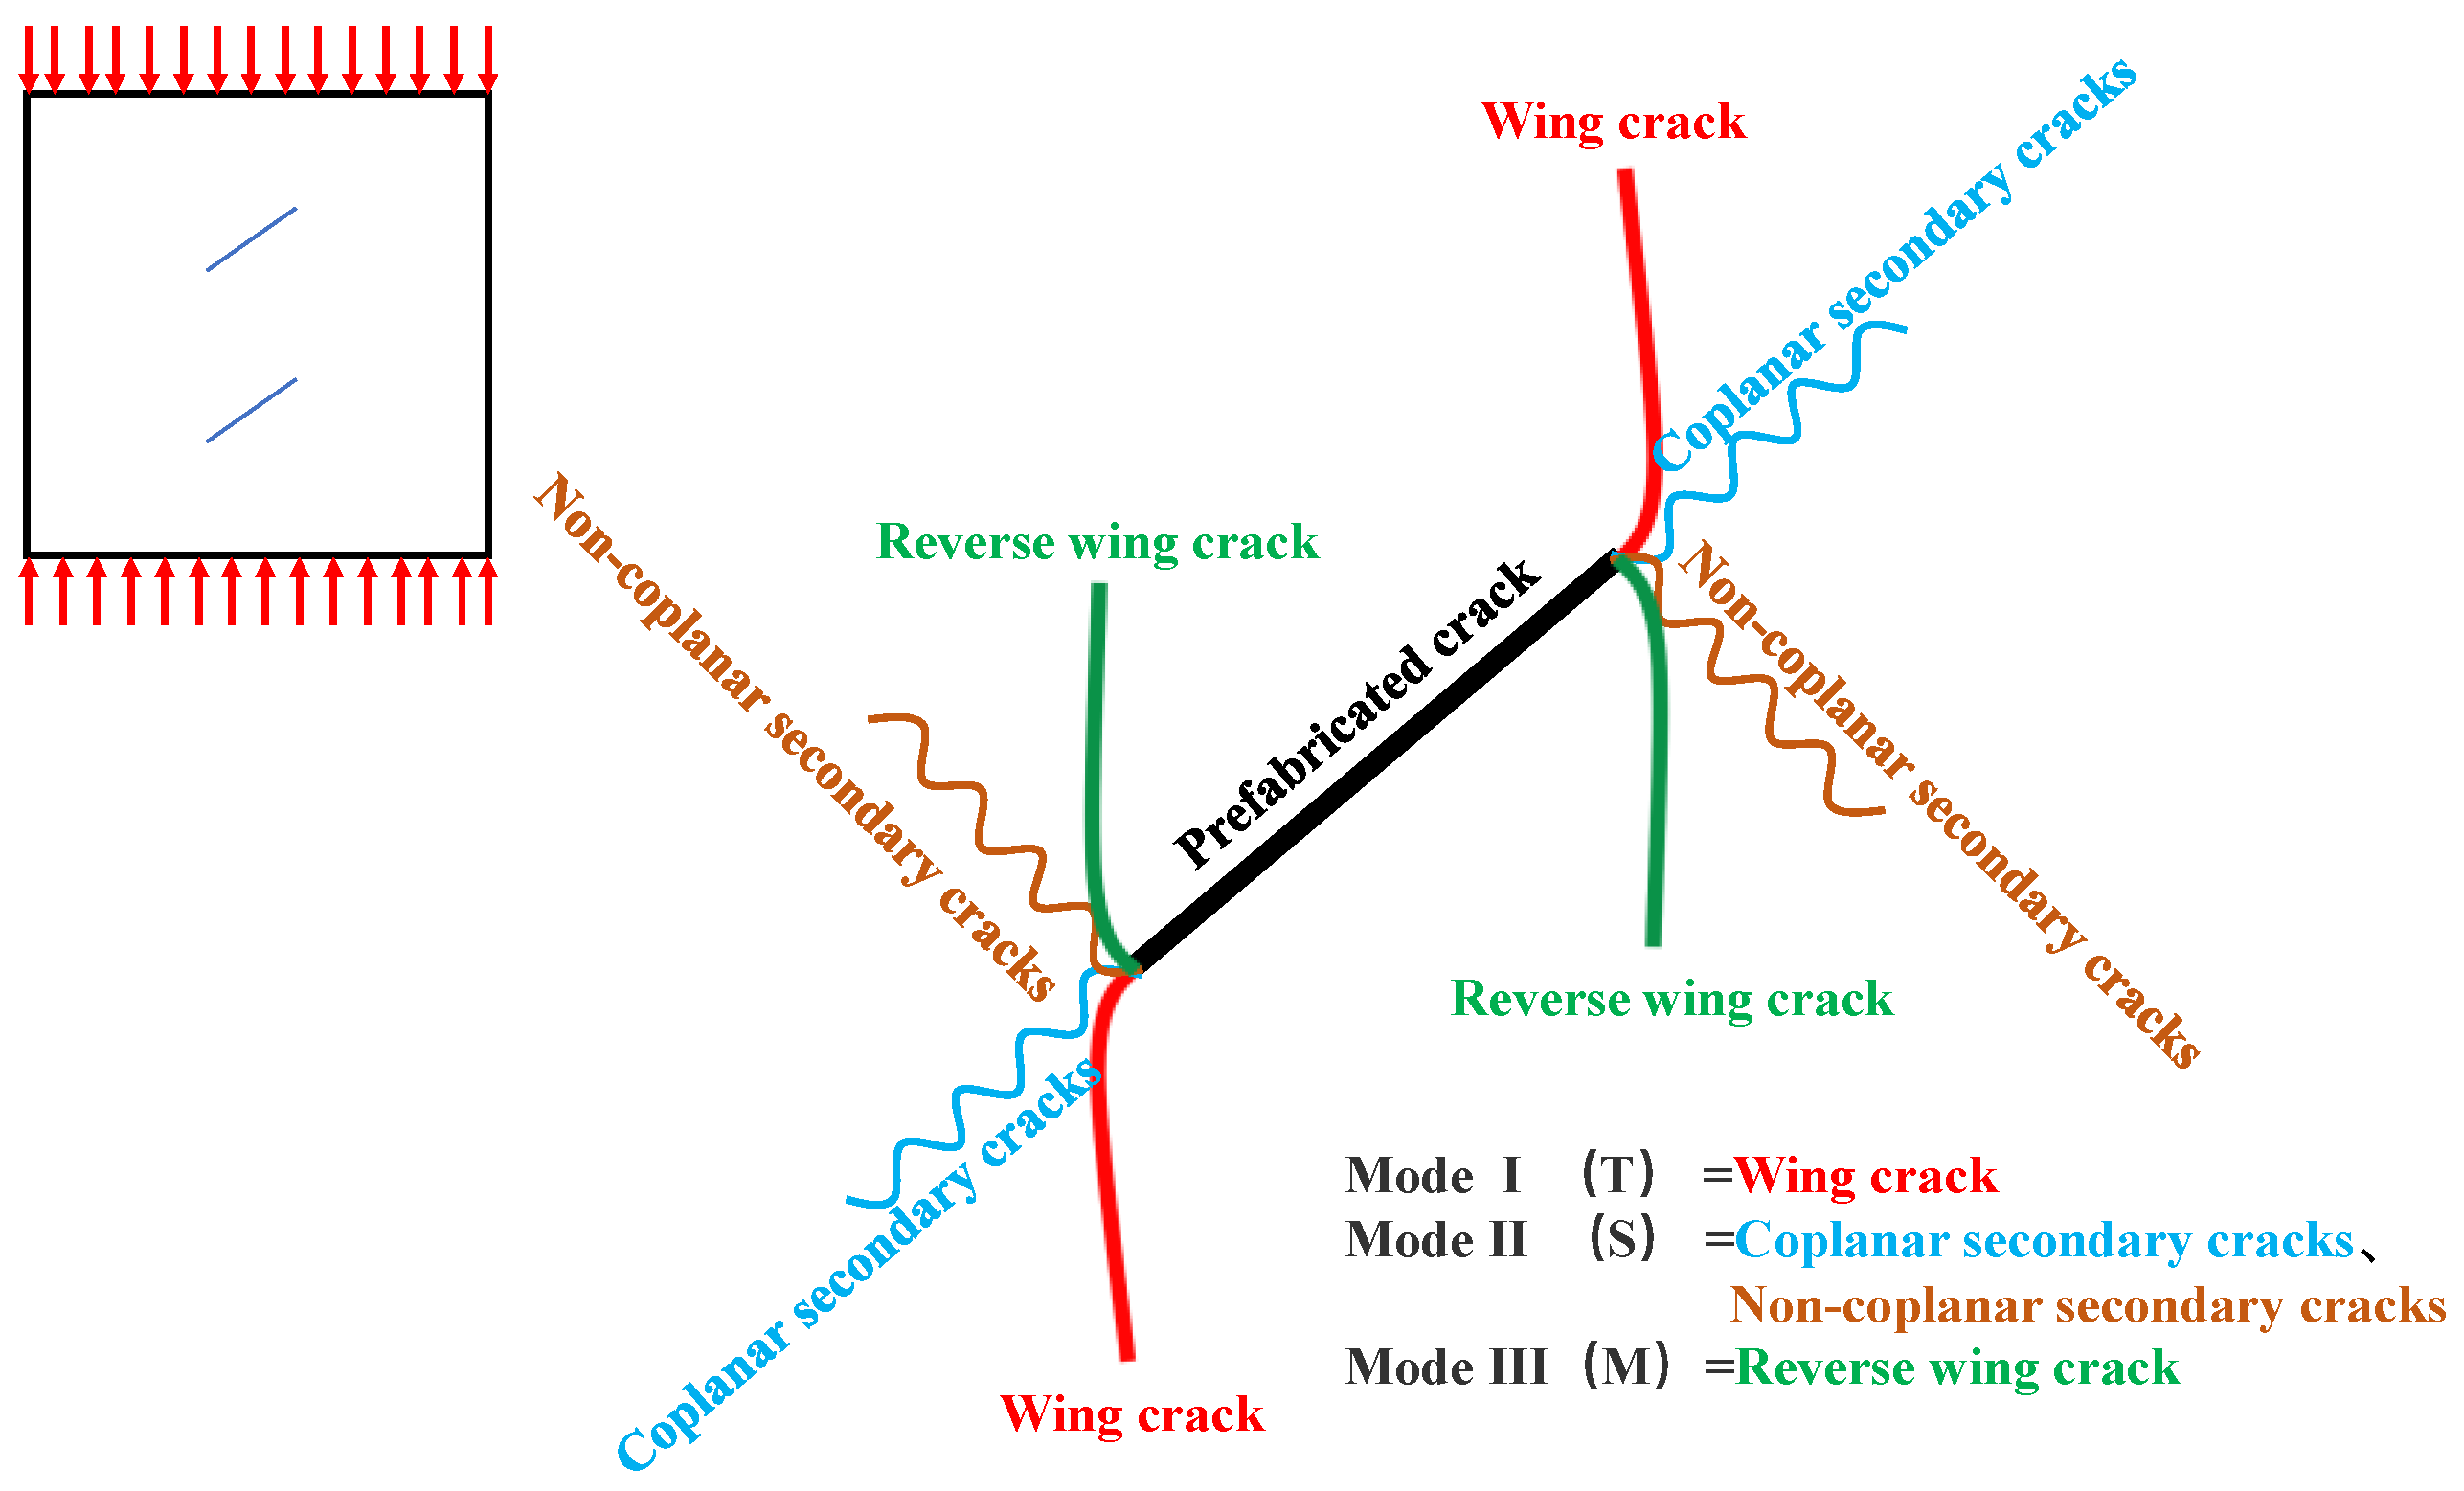
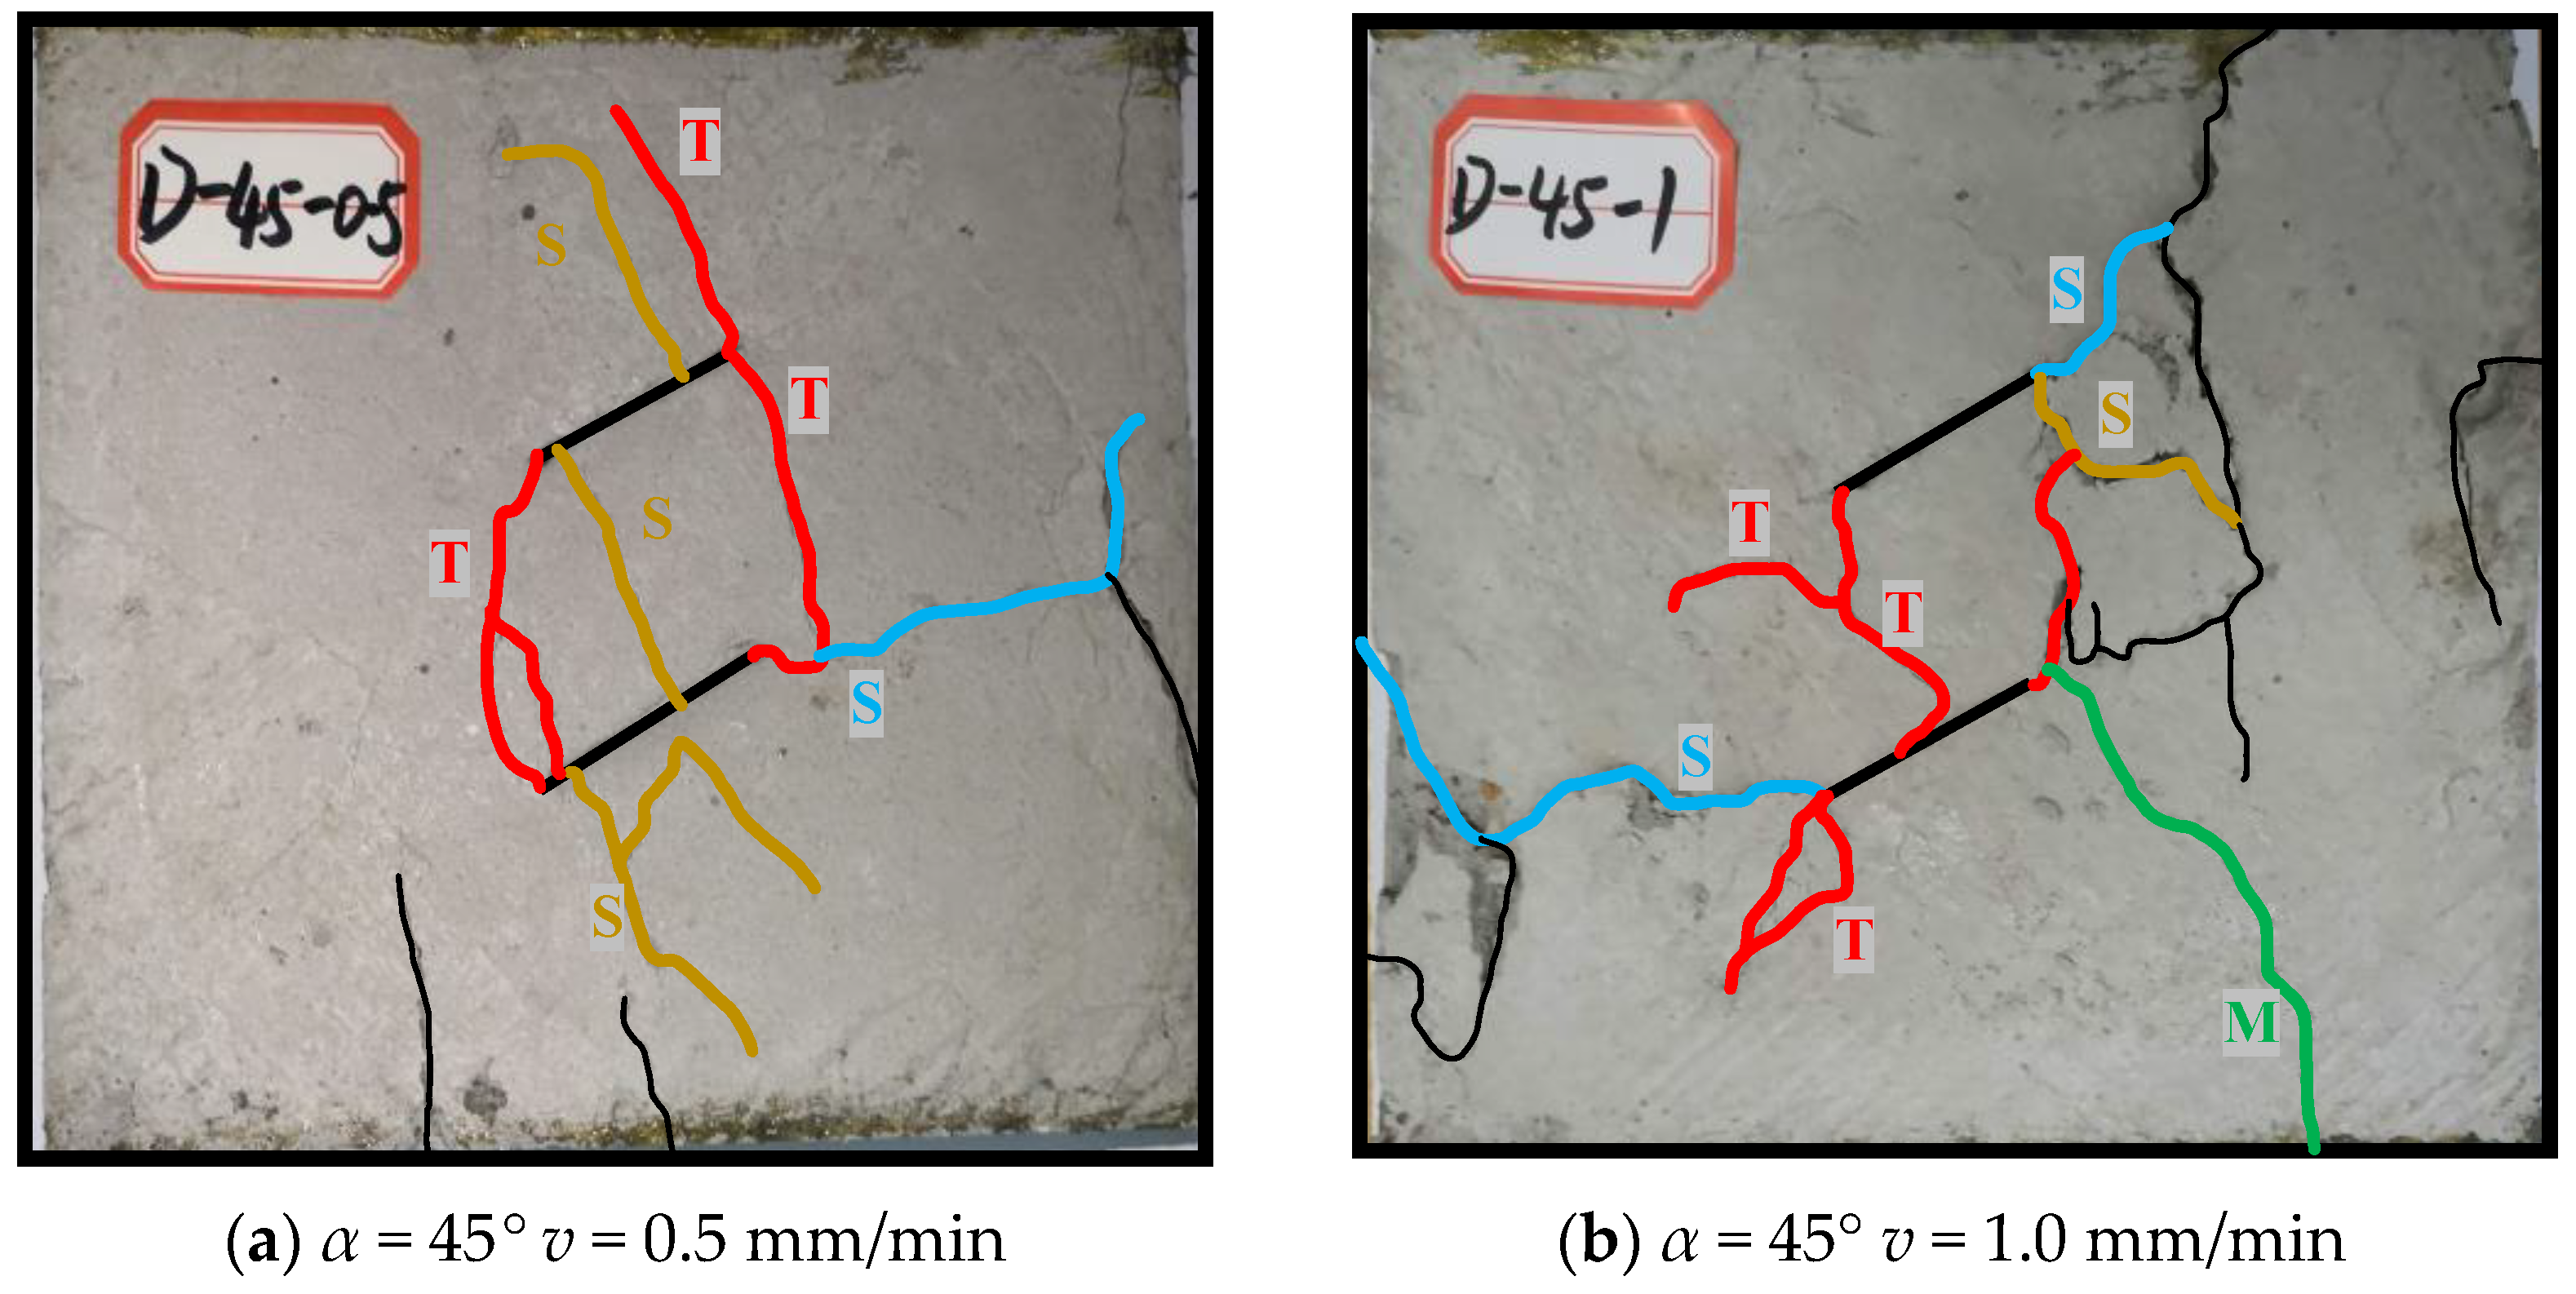
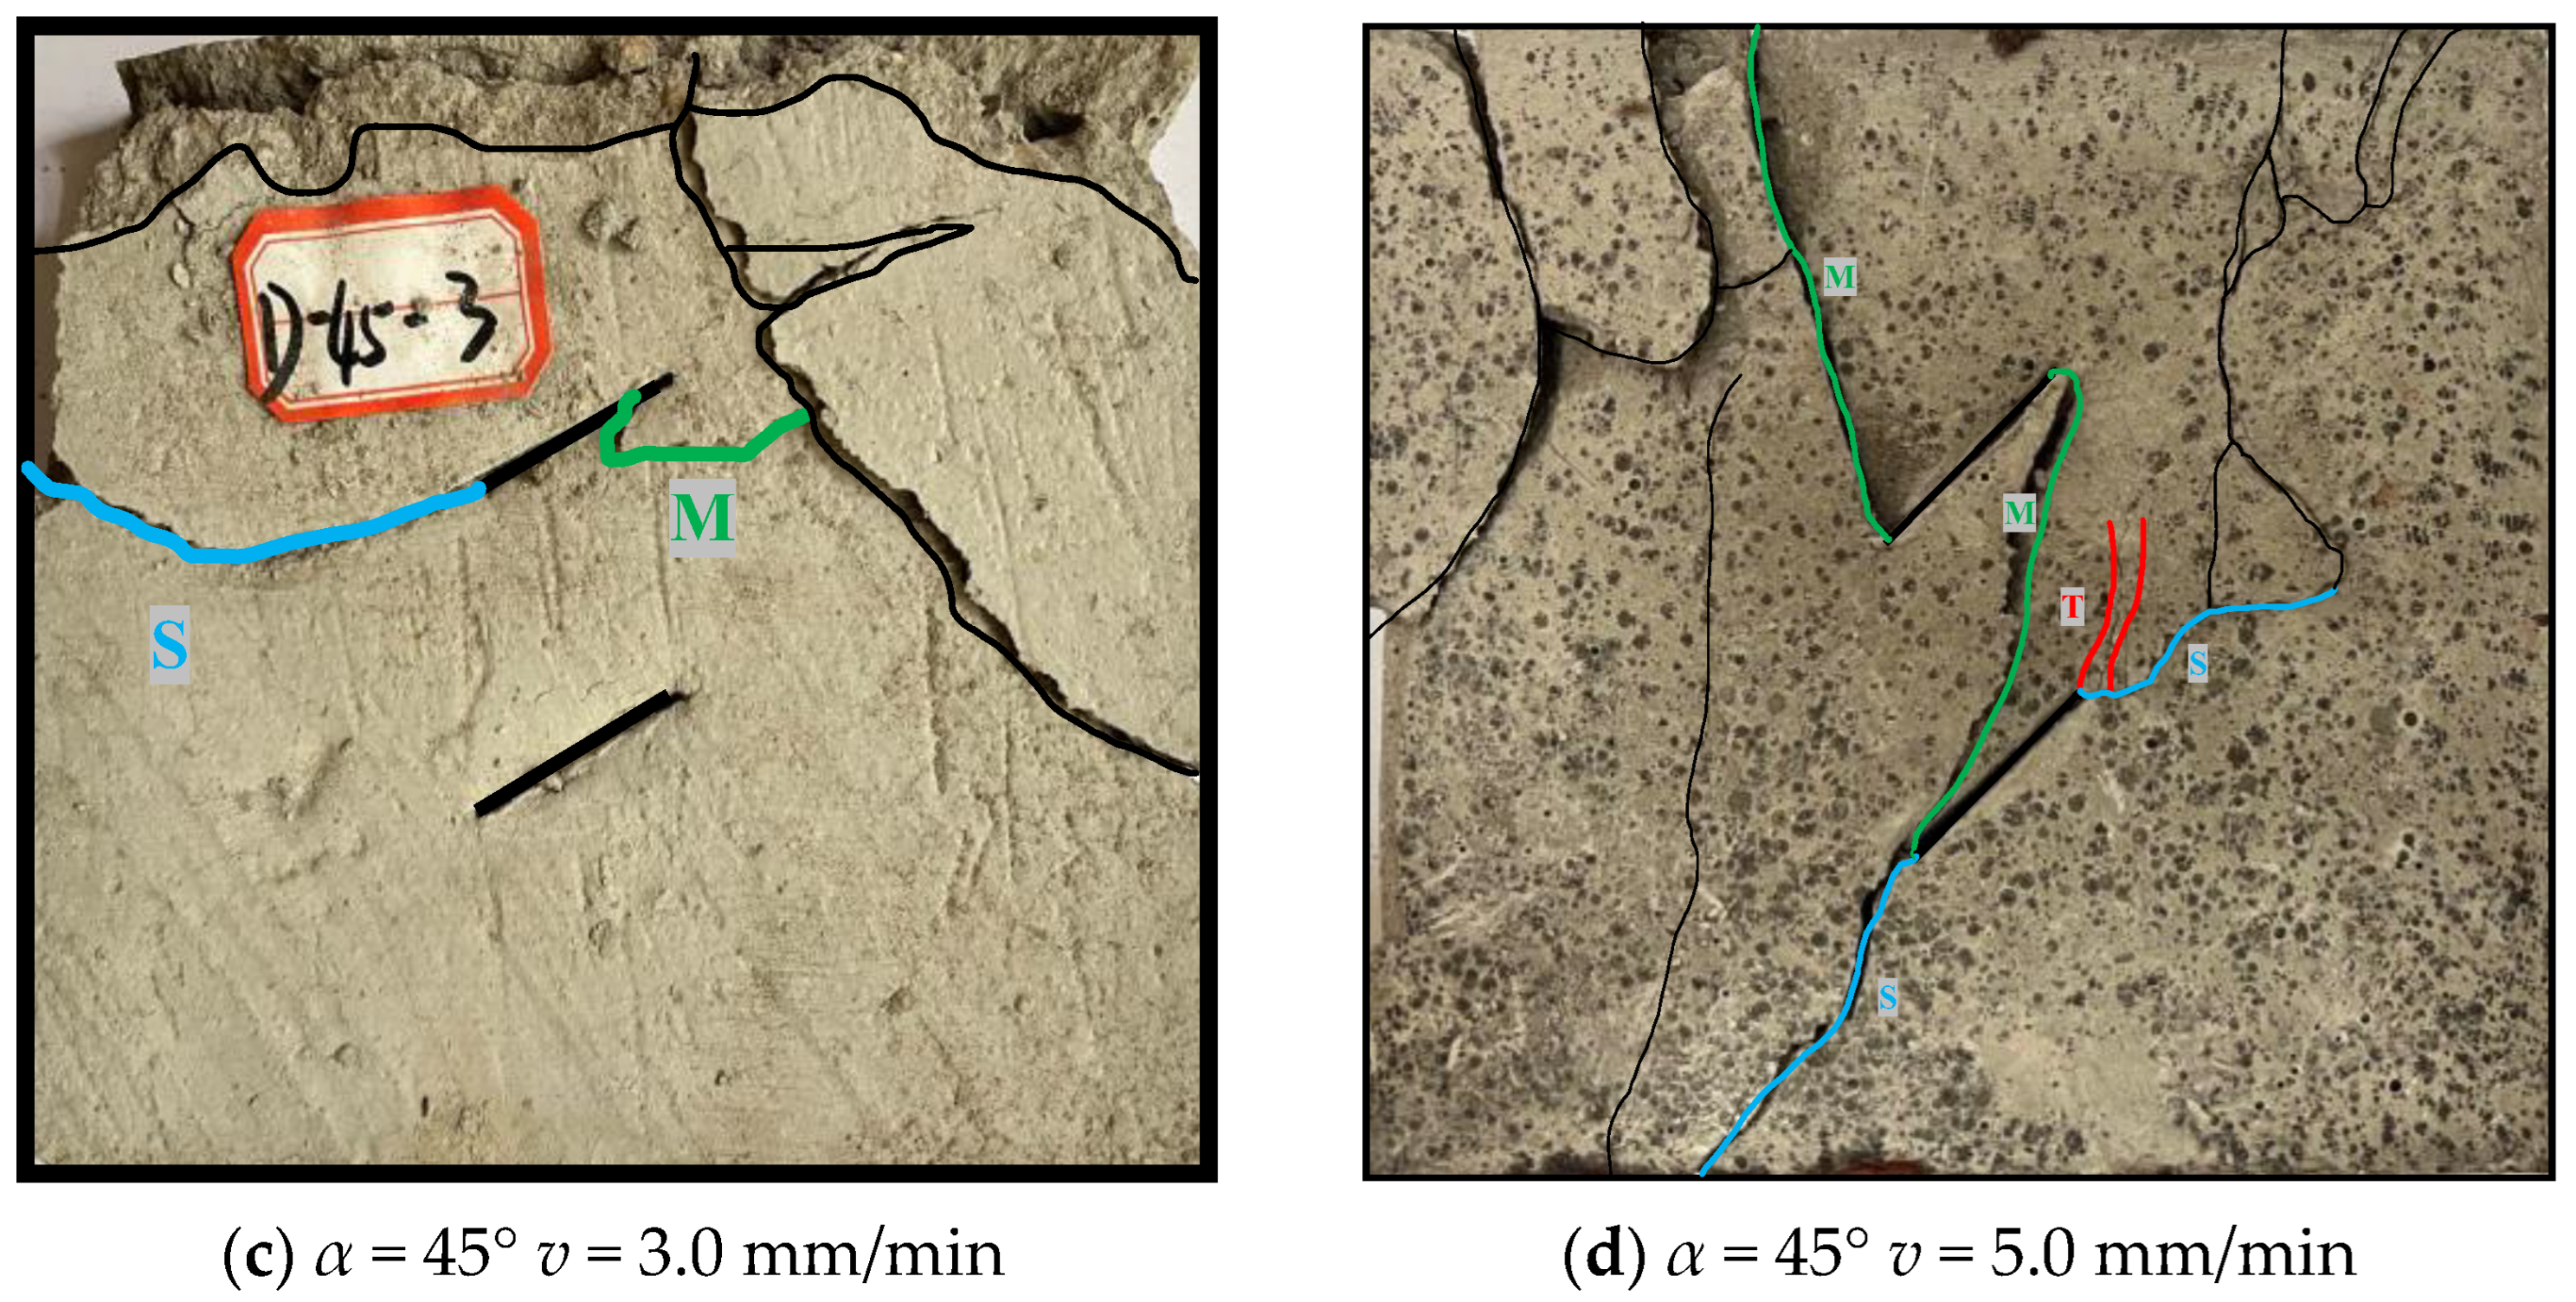
Under external loading conditions, as energy accumulates, cracks within the rock are eventually released. Essentially, the final crack pattern determines the ultimate failure mode of the specimen [21,22,23]. The main crack patterns include tensile or wing cracks and shear or secondary cracks. According to the different properties of cracks, they can be classified into three types: Mode I (T), Mode II (S), and Mode III (M). In this experiment, observations of specimens with a fissure angle of α = 45° revealed four types of cracks: wing cracks (T), anti-wing cracks (M), coplanar secondary cracks (S), and non-coplanar cracks (S). The schematic diagram for crack discrimination is shown in Figure 10.
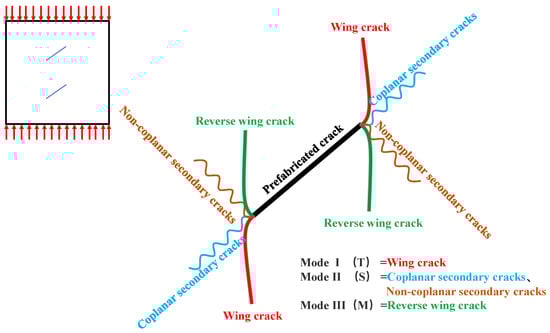
Figure 10.
The diagram of crack discrimination.
The specimen damage pattern is shown in Figure 11.
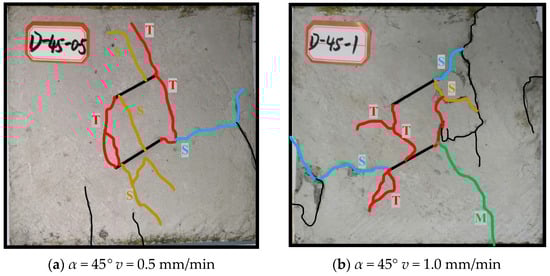
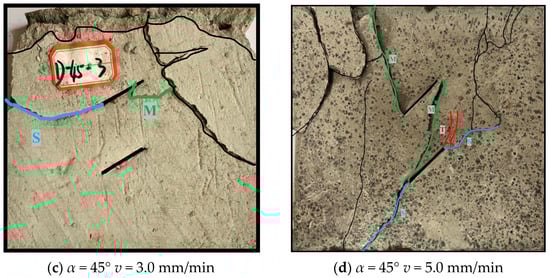
Figure 11.
The failure mode of the specimen and its macroscopic crack.
An analysis of Figure 11 reveals that there are multiple types of cracks in the rock specimens. For instance, in the D-45-0.5 specimen, after failure, the crack types include primary cracks, wing cracks, and secondary cracks, among others, with the final failure mode being shear failure. Based on the experimental results, it can be inferred that among all rock specimens with different fissure angles, tensile cracks generally appear first, with wing cracks being their main macroscopic manifestation. However, the ultimate failure of the rock specimen is not determined by the appearance of the initial cracks. For example, in the D-45-0.5 specimen, during loading, wing cracks appear first, followed by the development of secondary cracks, ultimately resulting in shear failure of the specimen. There is a special type of crack among the crack types, known as anti-wing cracks, which generally appear alongside wing cracks in rock specimens undergoing tensile failure, such as D-45-1 and D-45-5. Coplanar secondary cracks are the main manifestation of rock specimens undergoing shear failure, especially evident in the purely shear failure specimen D-45-3. Non-coplanar secondary cracks are more prevalent in D-45-0.5.
4.2. Crack Expansion Mechanism
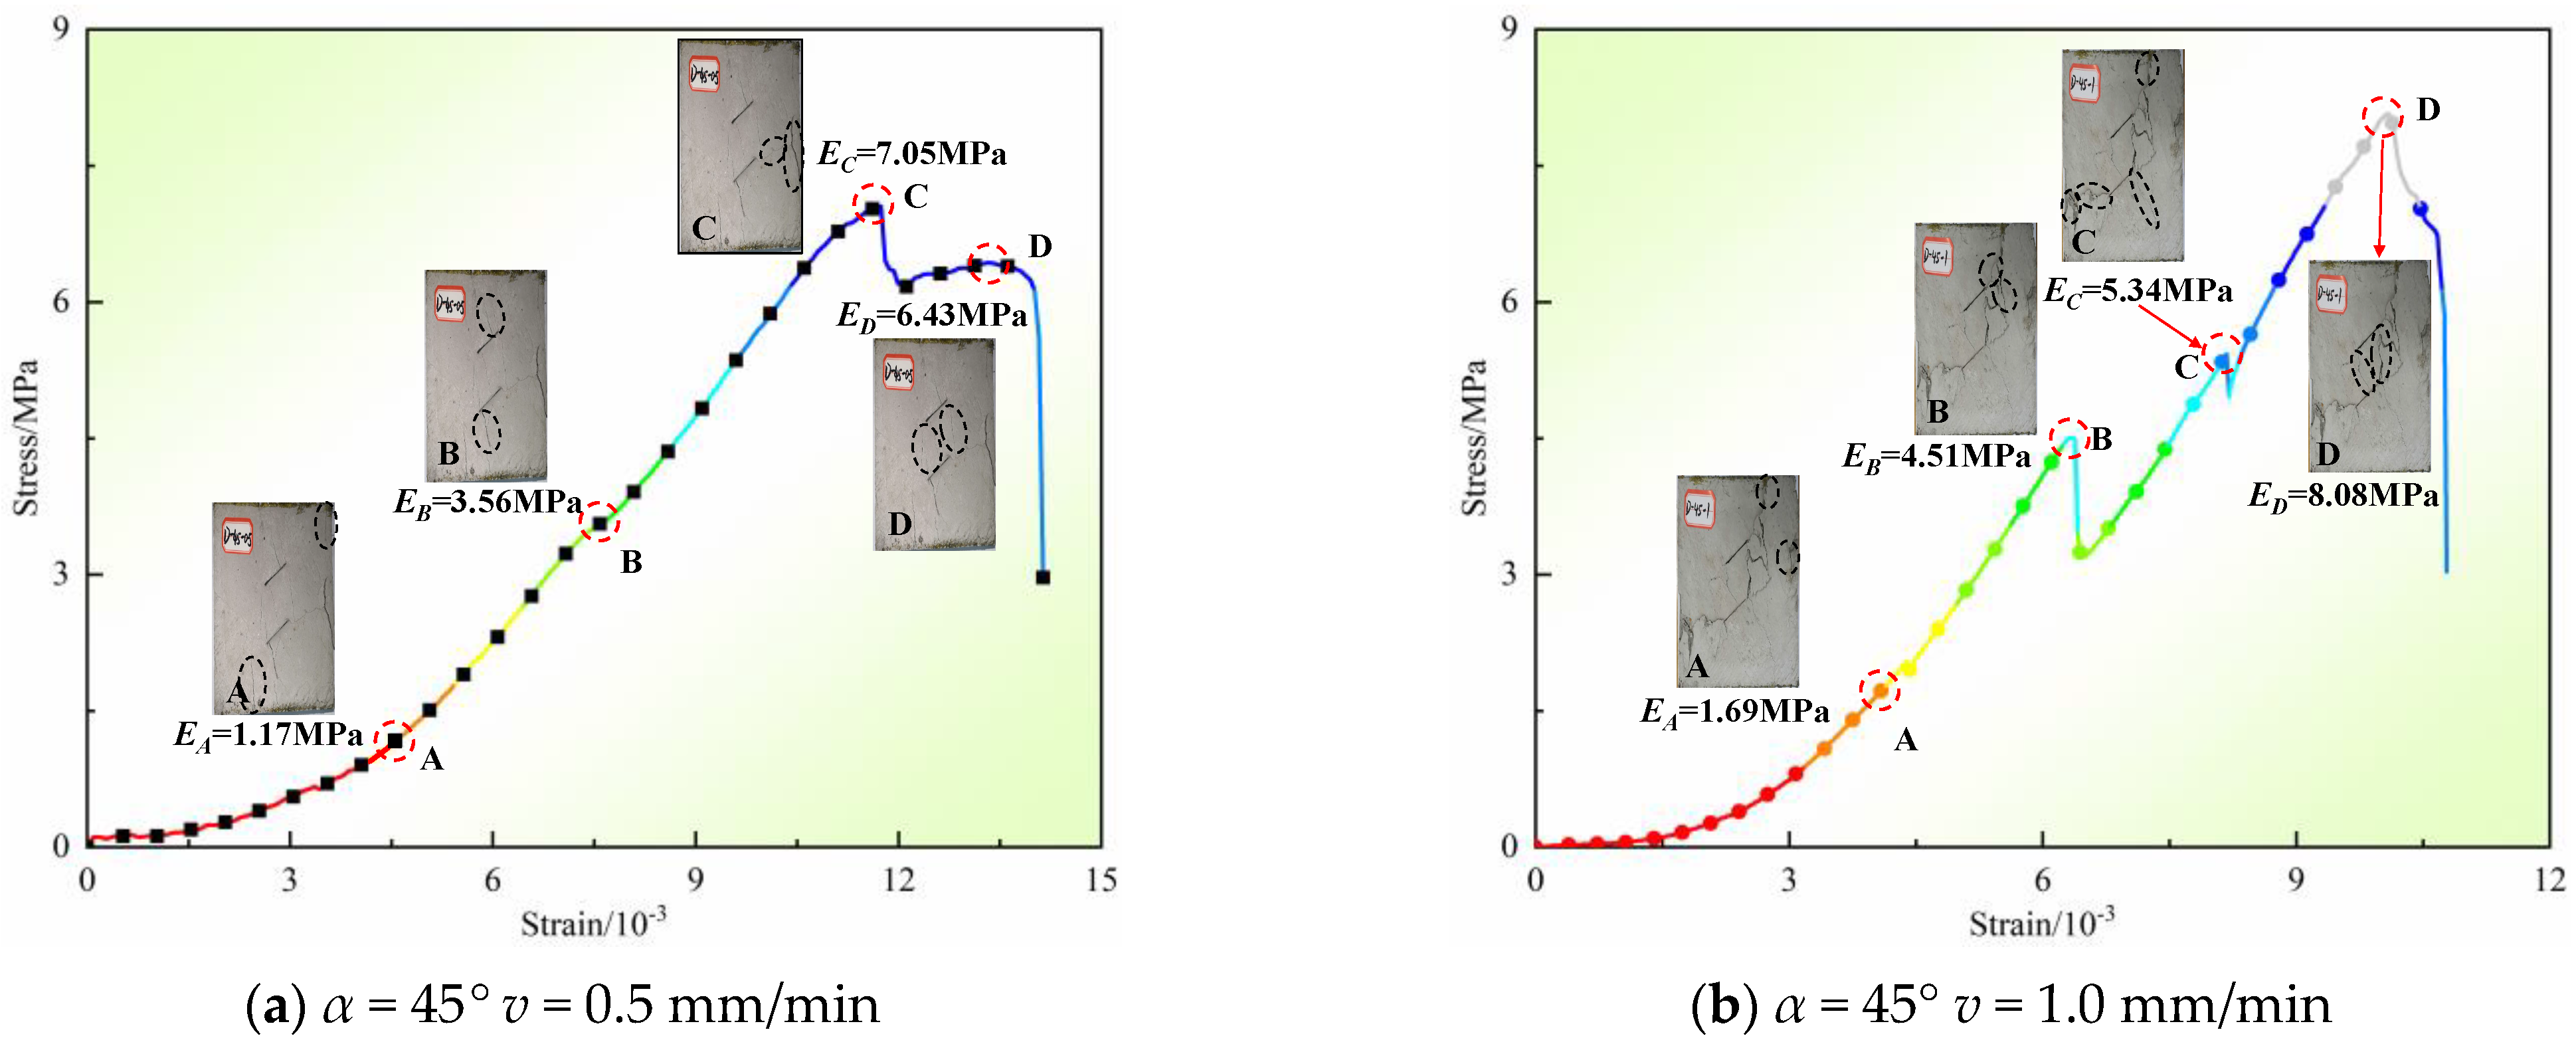
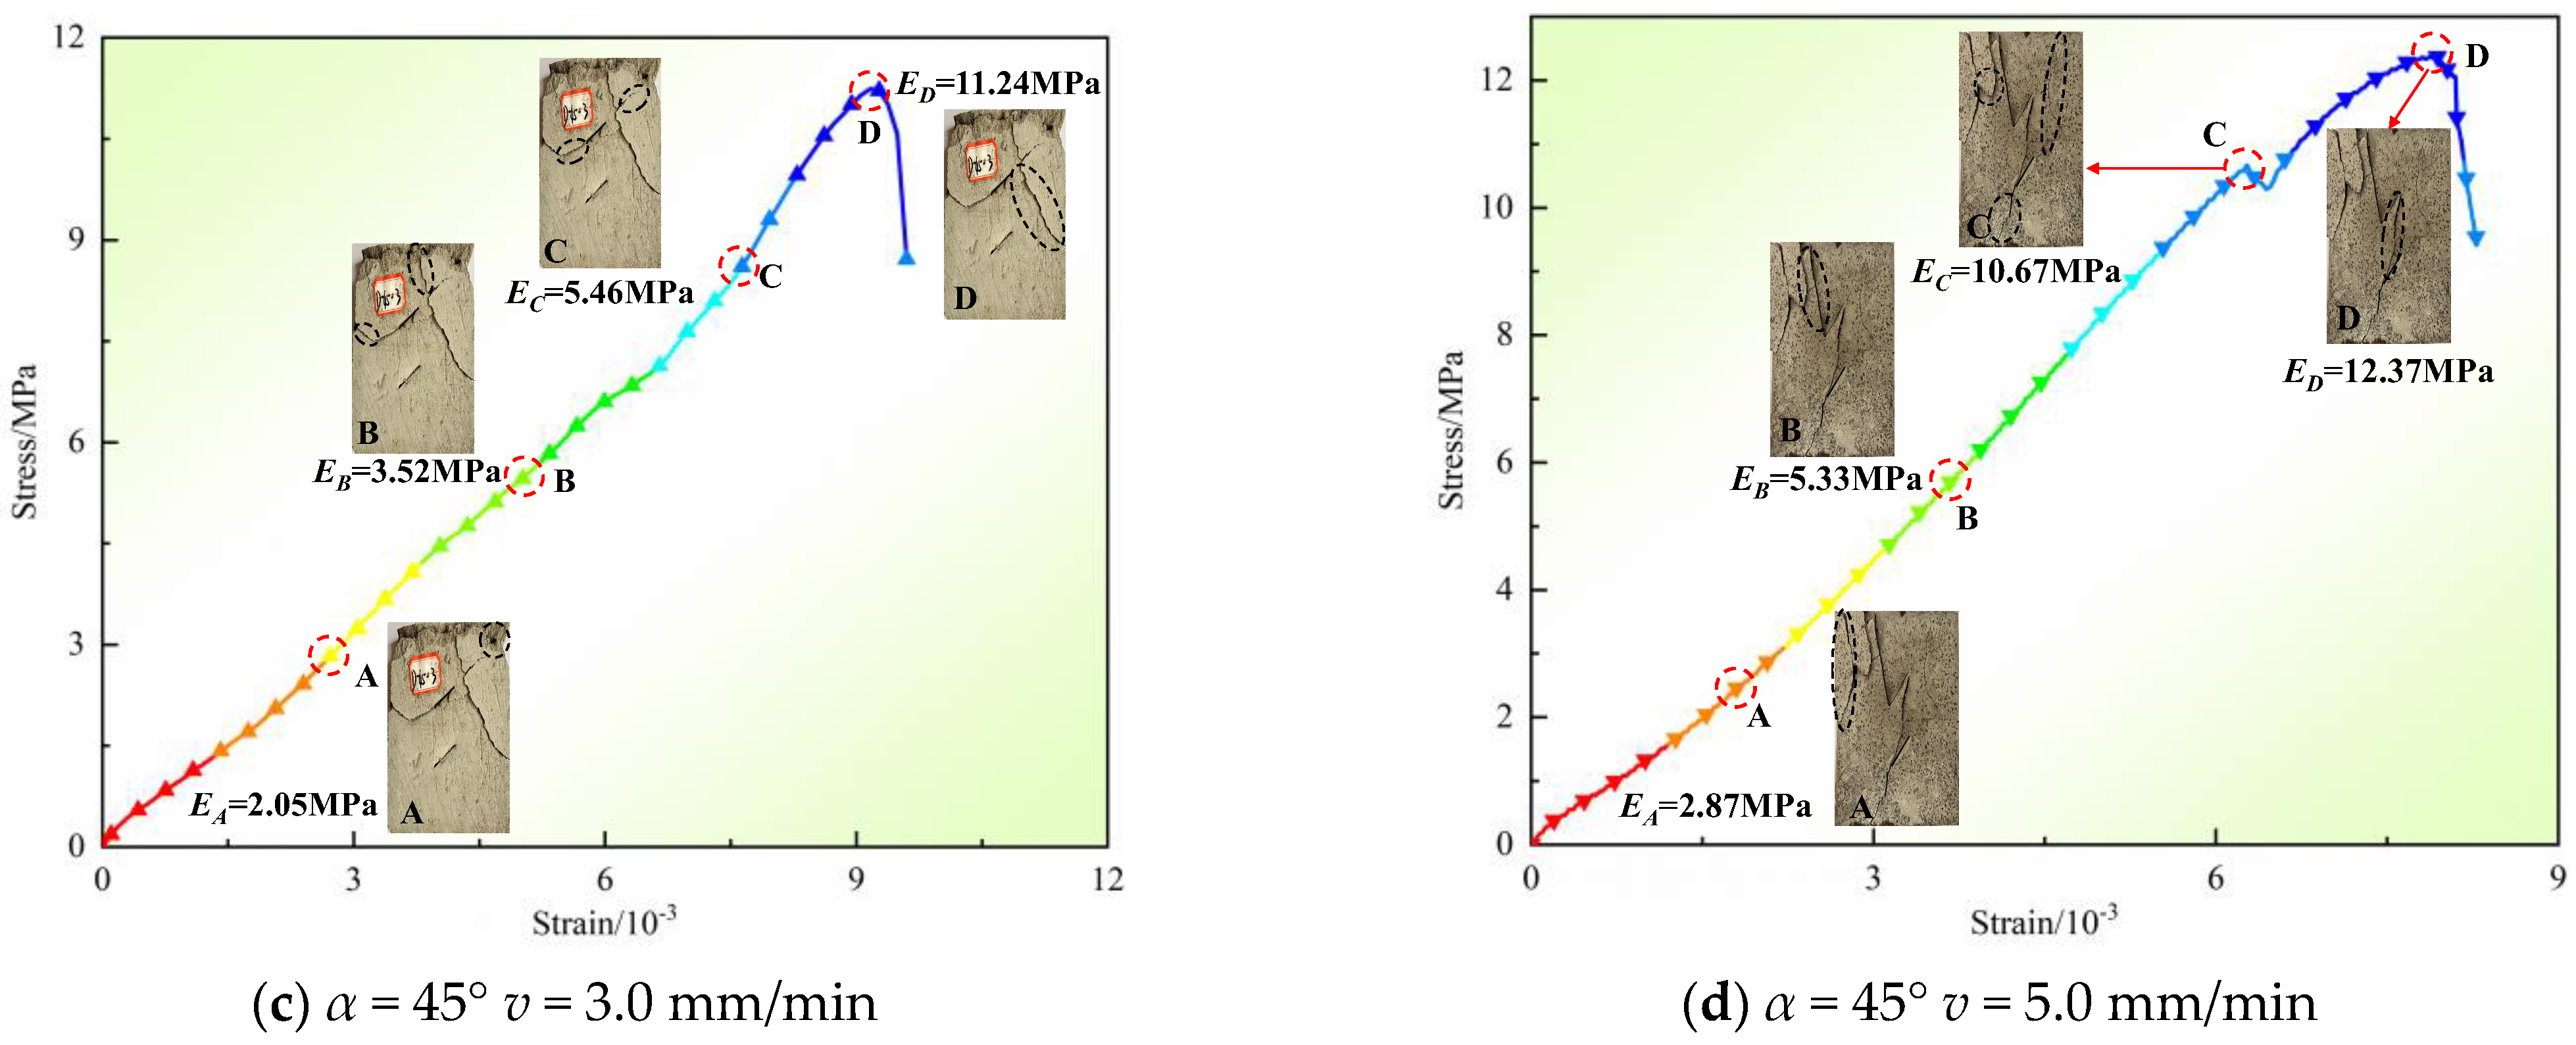
The correspondence between the crack expansion and the stress–strain curve of the prefabricated crack specimen (with α = 45° as an example) is shown in Figure 12. When the stress–strain curve of the specimen produces the first slope change (point A), it is generally the edge of the specimen that produces the primary crack as shown in Figure 12b, with EA = 1.69 GPa being the first slope change, and at this time, the edge of the specimen produces the primary crack. When the specimen stress–strain curve produces the second slope change (point B), for the crack from the prefabricated crack end of the crack as in Figure 12c, with EB = 3.52 GPa, the specimen prefabricated crack end produces coplanar secondary cracks as well as reverse wing cracks, and when the crack produced at the end of the crack is gradually expanded to the connection of primary cracks as in Figure 12a, with EC = 7.05 GPa, it produces the third slope change (point C). When the prefabricated wing cracks are generated between them and connected through ED = 12.37 GPa (point D), it produces the fourth change as in Figure 12d, and at this time, the stress–strain curve ushers in a steep decline. However, as shown in Figure 12b, there are several times where the steep decrease appearing before the stress–strain curve reaches the peak value, which is due to the coplanar secondary cracks generated by the prefabricated cracks connecting through the primary cracks.
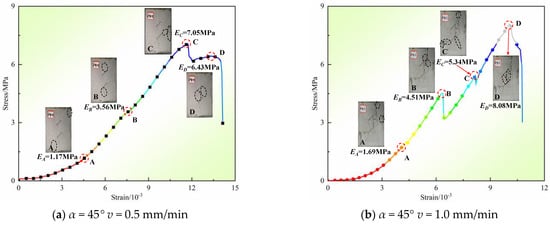
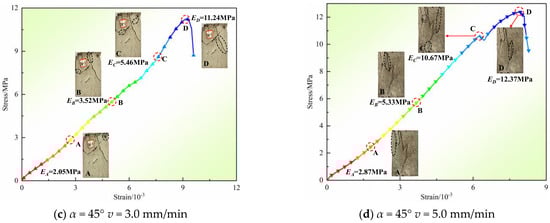
Figure 12.
The corresponding relationship between crack propagation and stress–strain curve.
5. Characterization of Rock-like Acoustic Emission Parameters
5.1. Characterization of the Evolution of AE Ringer Counts
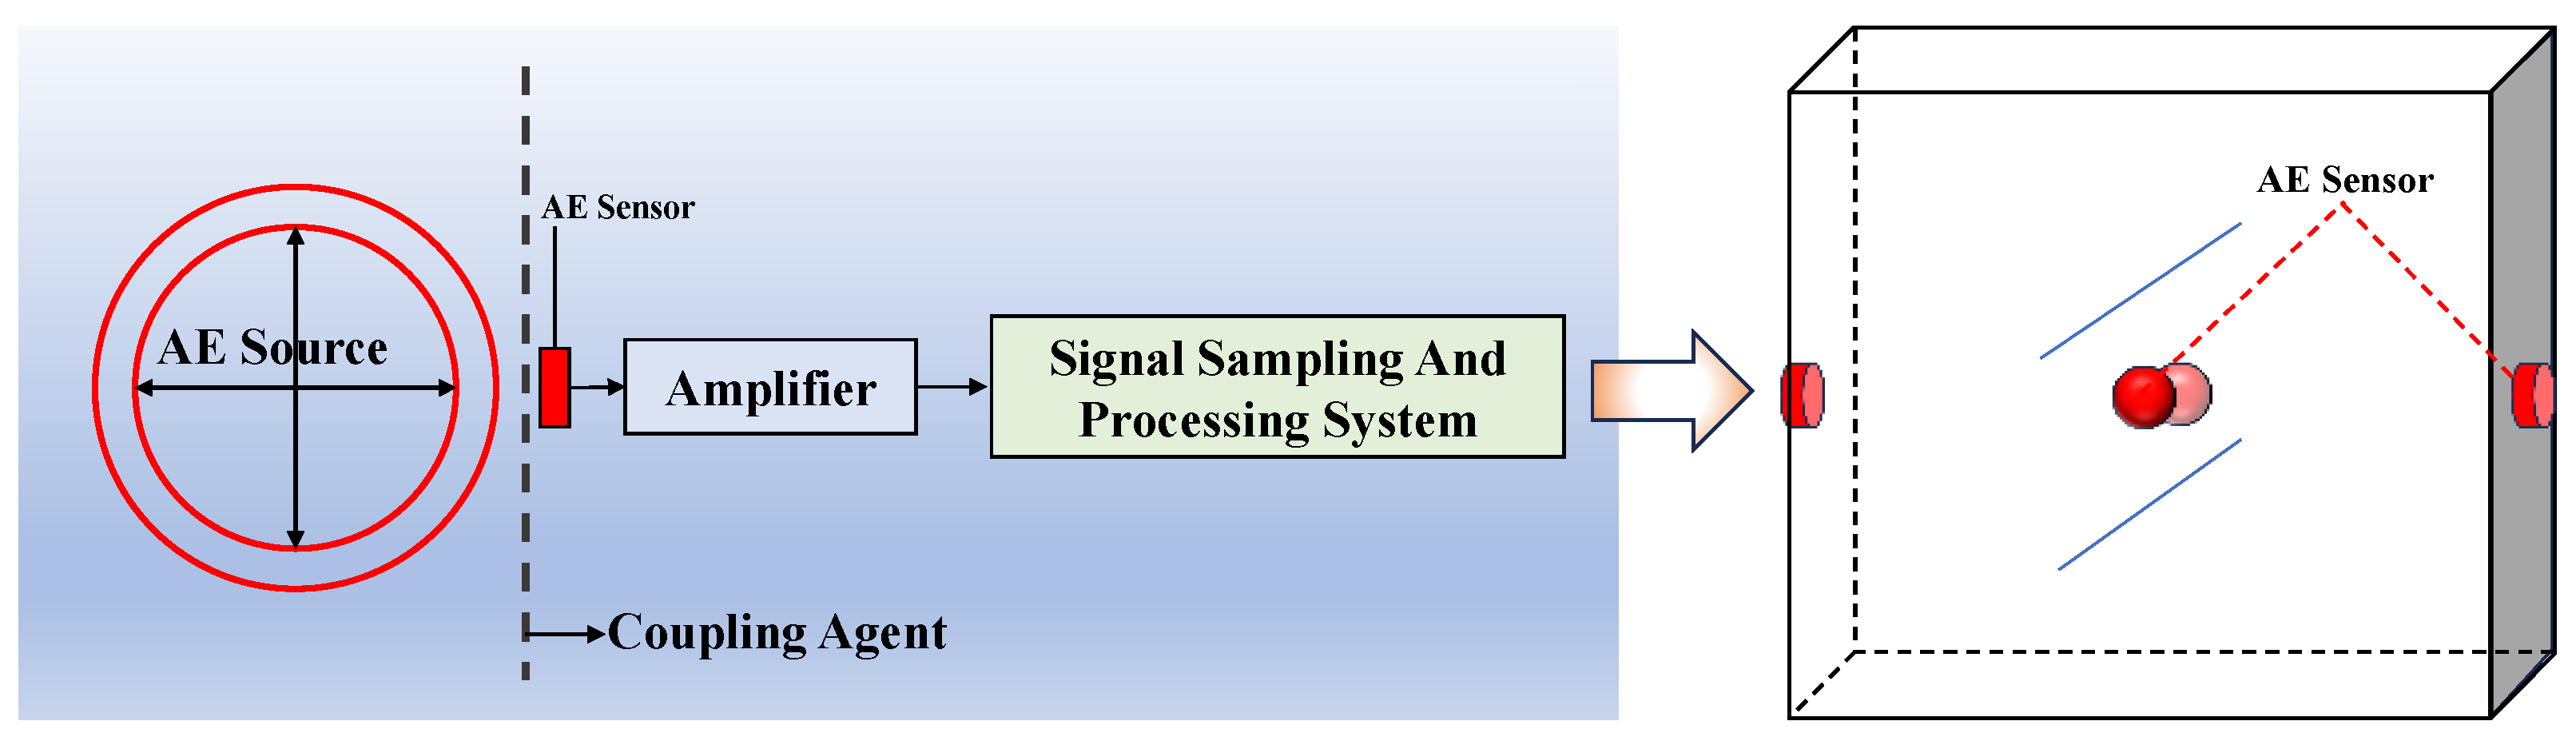
Under external loading, rocks develop microcracks internally, which gradually propagate into macroscopic fractures. The energy accumulated in these fractures is partially released in the form of elastic waves, resulting in acoustic emissions. Therefore, acoustic emission signals can intuitively reflect the microcracking characteristics inside the rock. Hence, acoustic emission is widely used in the detection and research of rock fracture states [24,25,26]. In this study, the Vallen AMSY-6 type 32-channel monitoring system is employed for acoustic emission testing. The relevant parameter settings of AE monitoring equipment are shown in Table 5. The monitoring principle and probe layout schematic are illustrated in Figure 13.
Table 5.
AE monitoring equipment parameters.
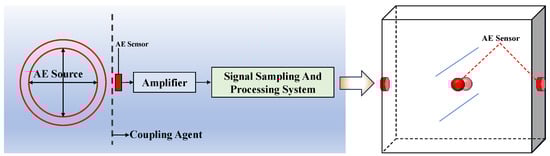
Figure 13.
AE monitoring principle and probe layout diagram.
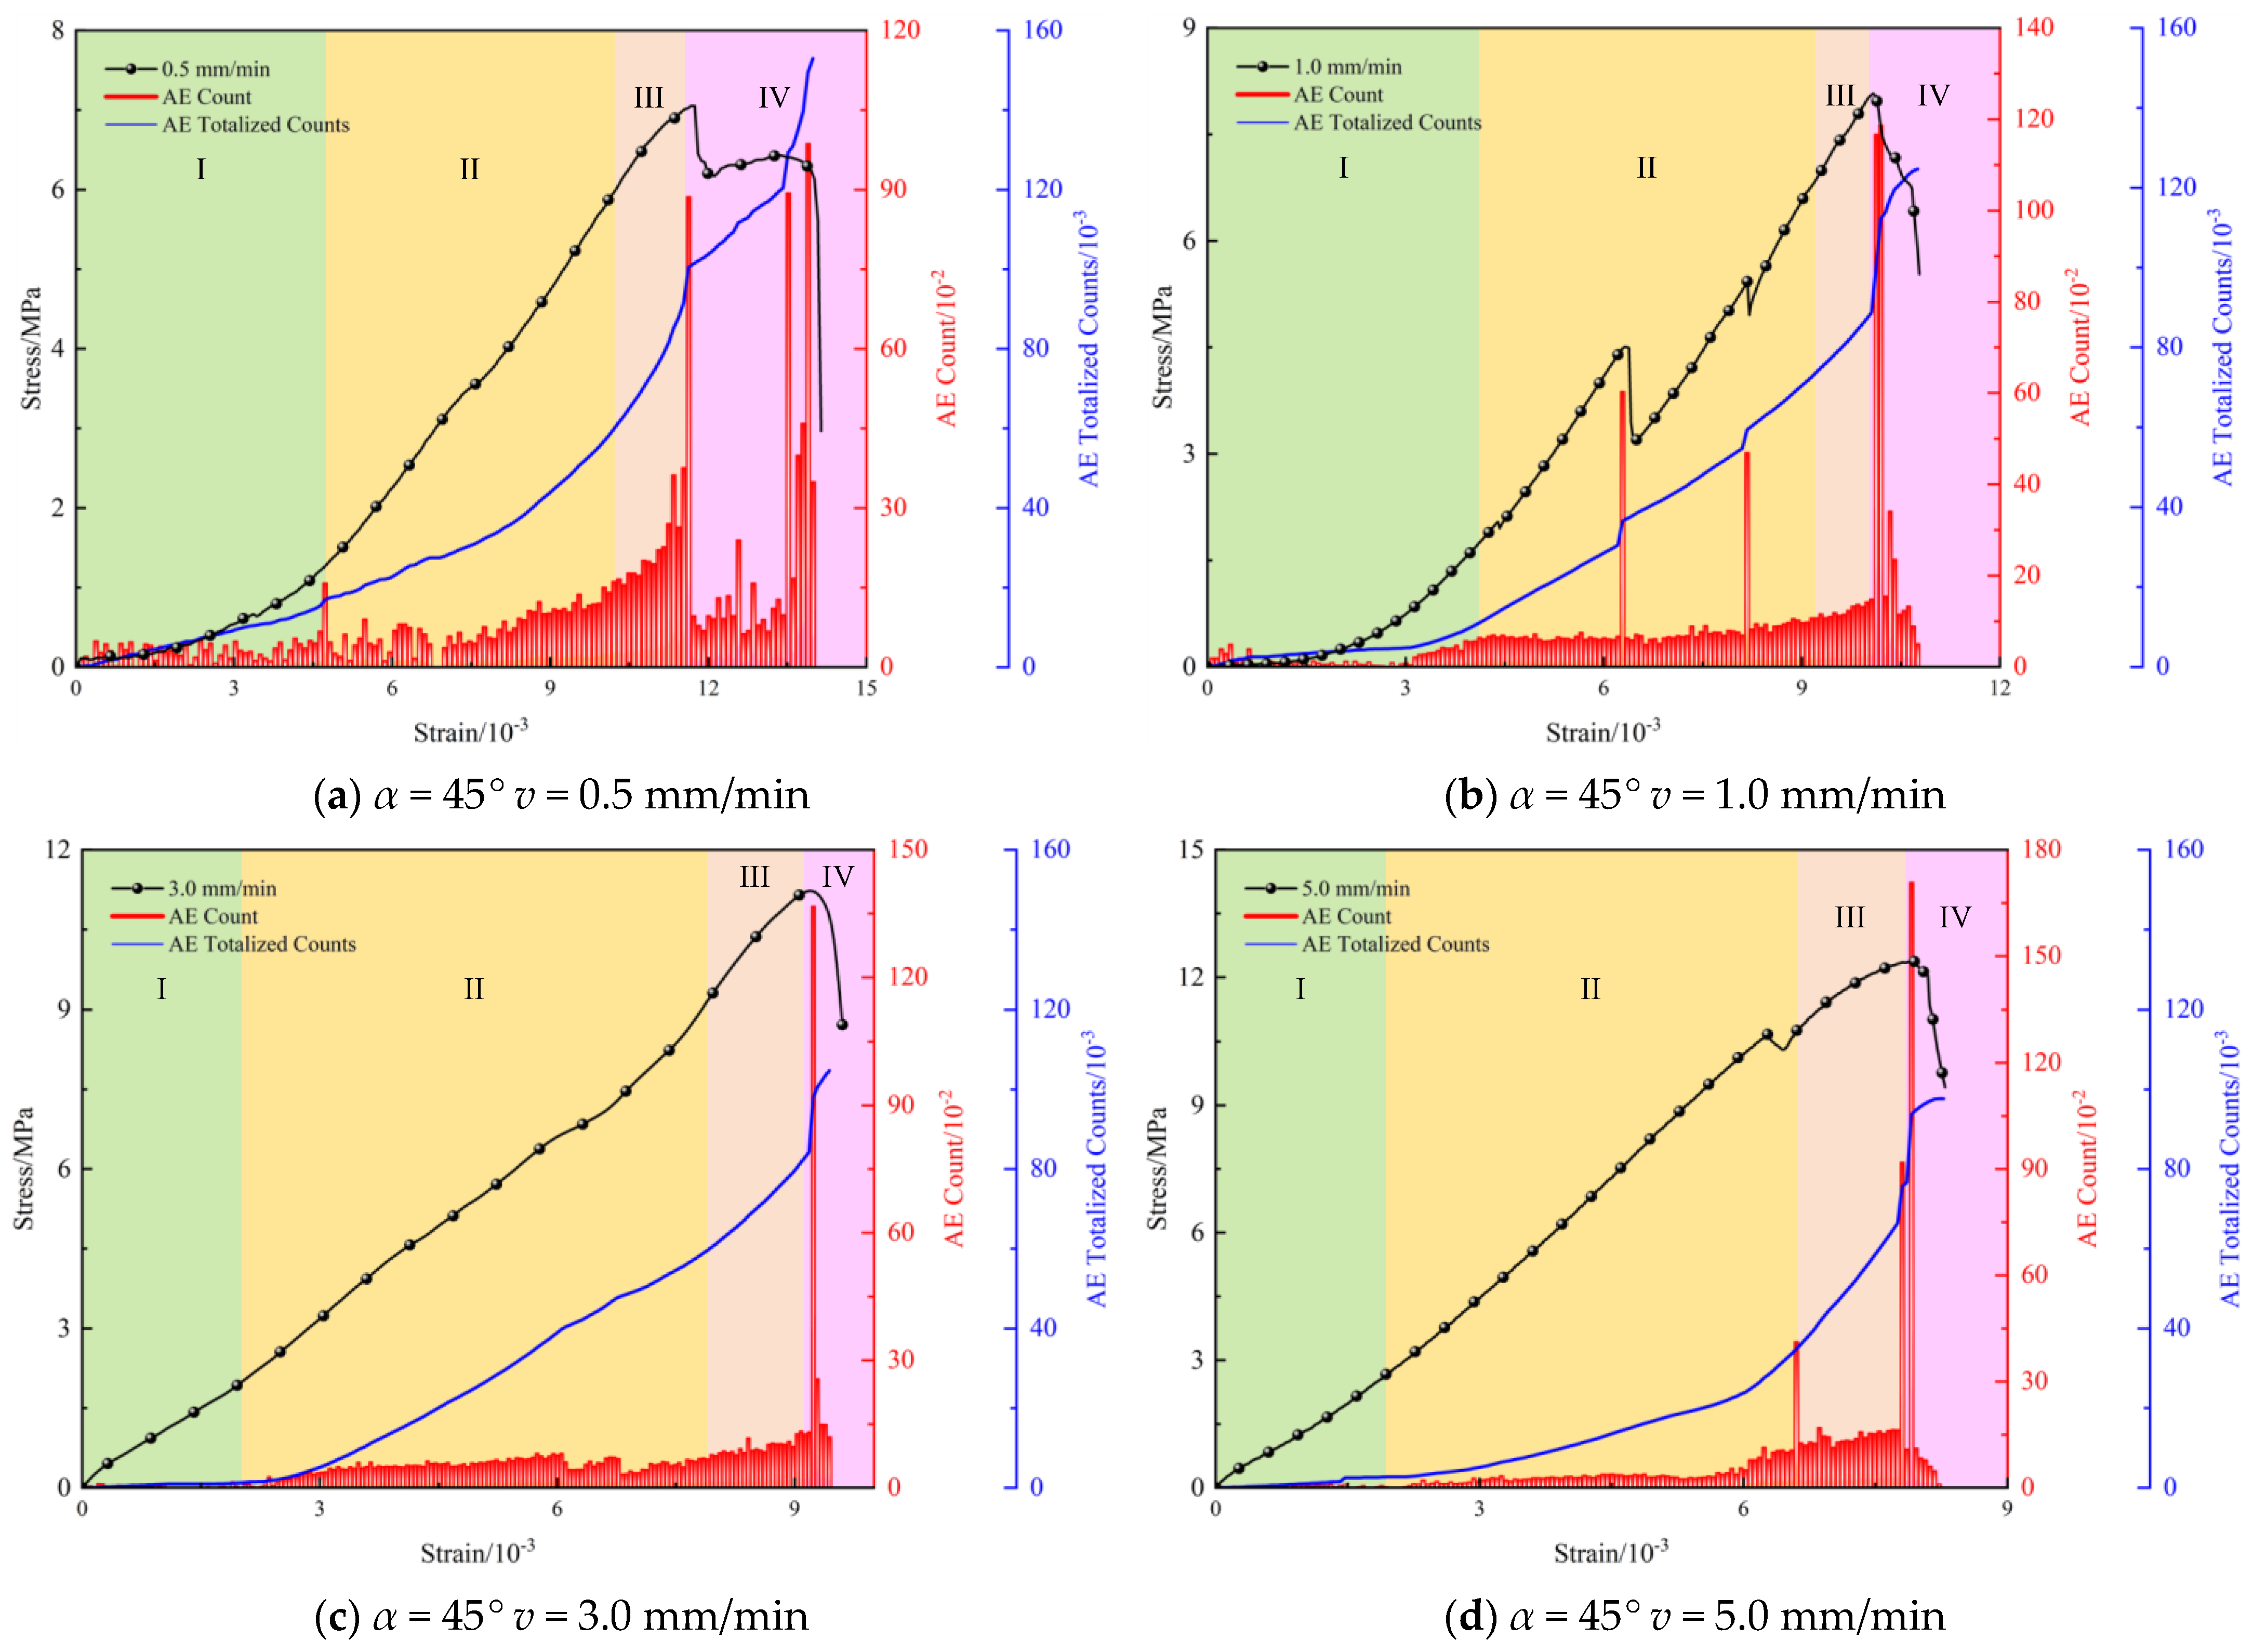
In this section, taking the specimen with a fissure angle of α = 45° as an example, the acoustic emission (AE) signal monitoring equipment is used to collect the AE ring count and cumulative ring count of the specimen under different loading rates during the compression process. This aims to explore the evolution characteristics of the AE ring count of the specimen under the influence of loading rates. The features of the specimen’s AE ring count and cumulative ring count are illustrated in Figure 14.
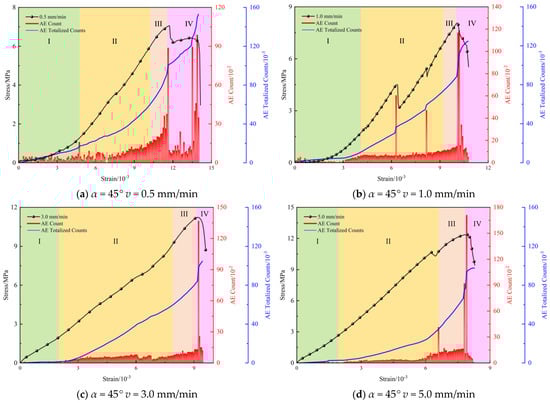
Figure 14.
Acoustic emission counting characteristics of prefabricated crack specimen.
Analysis of Figure 14 reveals that during the uniaxial compression process of the specimen, there is a certain correlation between its AE ring count and the different stages of the stress–strain curve. When the stress–strain curve exhibits stress drops, the AE ring count tends to show a noticeable increase. Similarly, the variation in acoustic emission counts over time during the deformation process of the specimen can be roughly divided into four stages [27,28]:
(1) Initial compaction stage (Stage I): In the early stages of loading, the original fissures inside the specimen gradually close as the loading process progresses. During this stage, there are relatively few AE signals generated. However, as shown in Figure 14a, there is a sudden increase in AE counts during Stage I, which is caused by the development of original fissures in the specimen during loading. Moreover, it is observed that with an increase in the loading rate, the AE signals tend to become calm during this stage.
(2) Elastic deformation stage (Stage II): After the compaction of the original fissures inside the specimen, external loads are not sufficient to generate new cracks in the specimen. During this stage, the internal damage behavior of the specimen mainly involves sliding along the original cracks, with internal pore pressure resisting external pressure, resulting in slight deformation of the matrix. Therefore, there is a slight increase in AE ringing counts during this stage, as shown in Figure 14b. The peak magnitude and ringing counts are relatively stable, with occasional higher responses, mainly due to the development of localized cracks inside the specimen after the compaction of microfissures gradually expanding.
(3) Non-stable fracture development stage (Stage III): During this stage, AE ringing counts are more active. This is because when external loads reach 80% to 90% of the peak stress, the specimen enters the plastic deformation stage. At this stage, internal cracks rapidly expand and develop, resulting in the irreversible plastic deformation of the specimen. The passage of cracks leads to the appearance of macroscopic damage, further increasing the AE ringing counts in this stage. As shown in Figure 14c, the AE ringing counts during this stage are higher than the first two stages and show a significant increasing trend with the increase in strain.
(4) Post-peak failure stage (Stage IV): After reaching the peak strength, the specimen gradually fails. As macroscopic failure of the specimen occurs, the rate of change in AE counts during this stage is very high, accompanied by a sudden drop in the stress–strain curve as shown in Figure 14d. There is a significant sudden increase in AE ringing counts during this stage, and the maximum AE ringing count often occurs during this stage.
To further explore the effect of loading rate on the AE ringing counts of the prefabricated crack specimens, the AE ringing counts and cumulative ringing counts of the specimens are recorded as shown in Table 6.
Table 6.
AE ringing count and cumulative ringing count of α = 45° prefabricated crack specimens.
Analysis reveals that with the gradual increase in the loading rate, the AE ringing count of the specimen shows a tendency to increase gradually, rising from 98.66·10−2 to 165.83·10−2, an increase of 68.08%. Meanwhile, the cumulative ringing count shows a gradual decrease from 152.99·10−3 to 72.04·10−3, representing a decrease of 52.91%. This is because with the increasing loading rate, the peak compressive strength of the specimen gradually increases. Hence, the AE ringing count increases gradually upon failure. However, at the same time, due to the insufficient friction and sliding of microcracks inside the specimen for rupture behavior, as also depicted in Figure 14, the AE signals of the specimen gradually tend towards a stable state with the increase in the loading rate. Consequently, the cumulative ringing count exhibits a downward trend over time.
5.2. Characterization of AE Energy Evolution
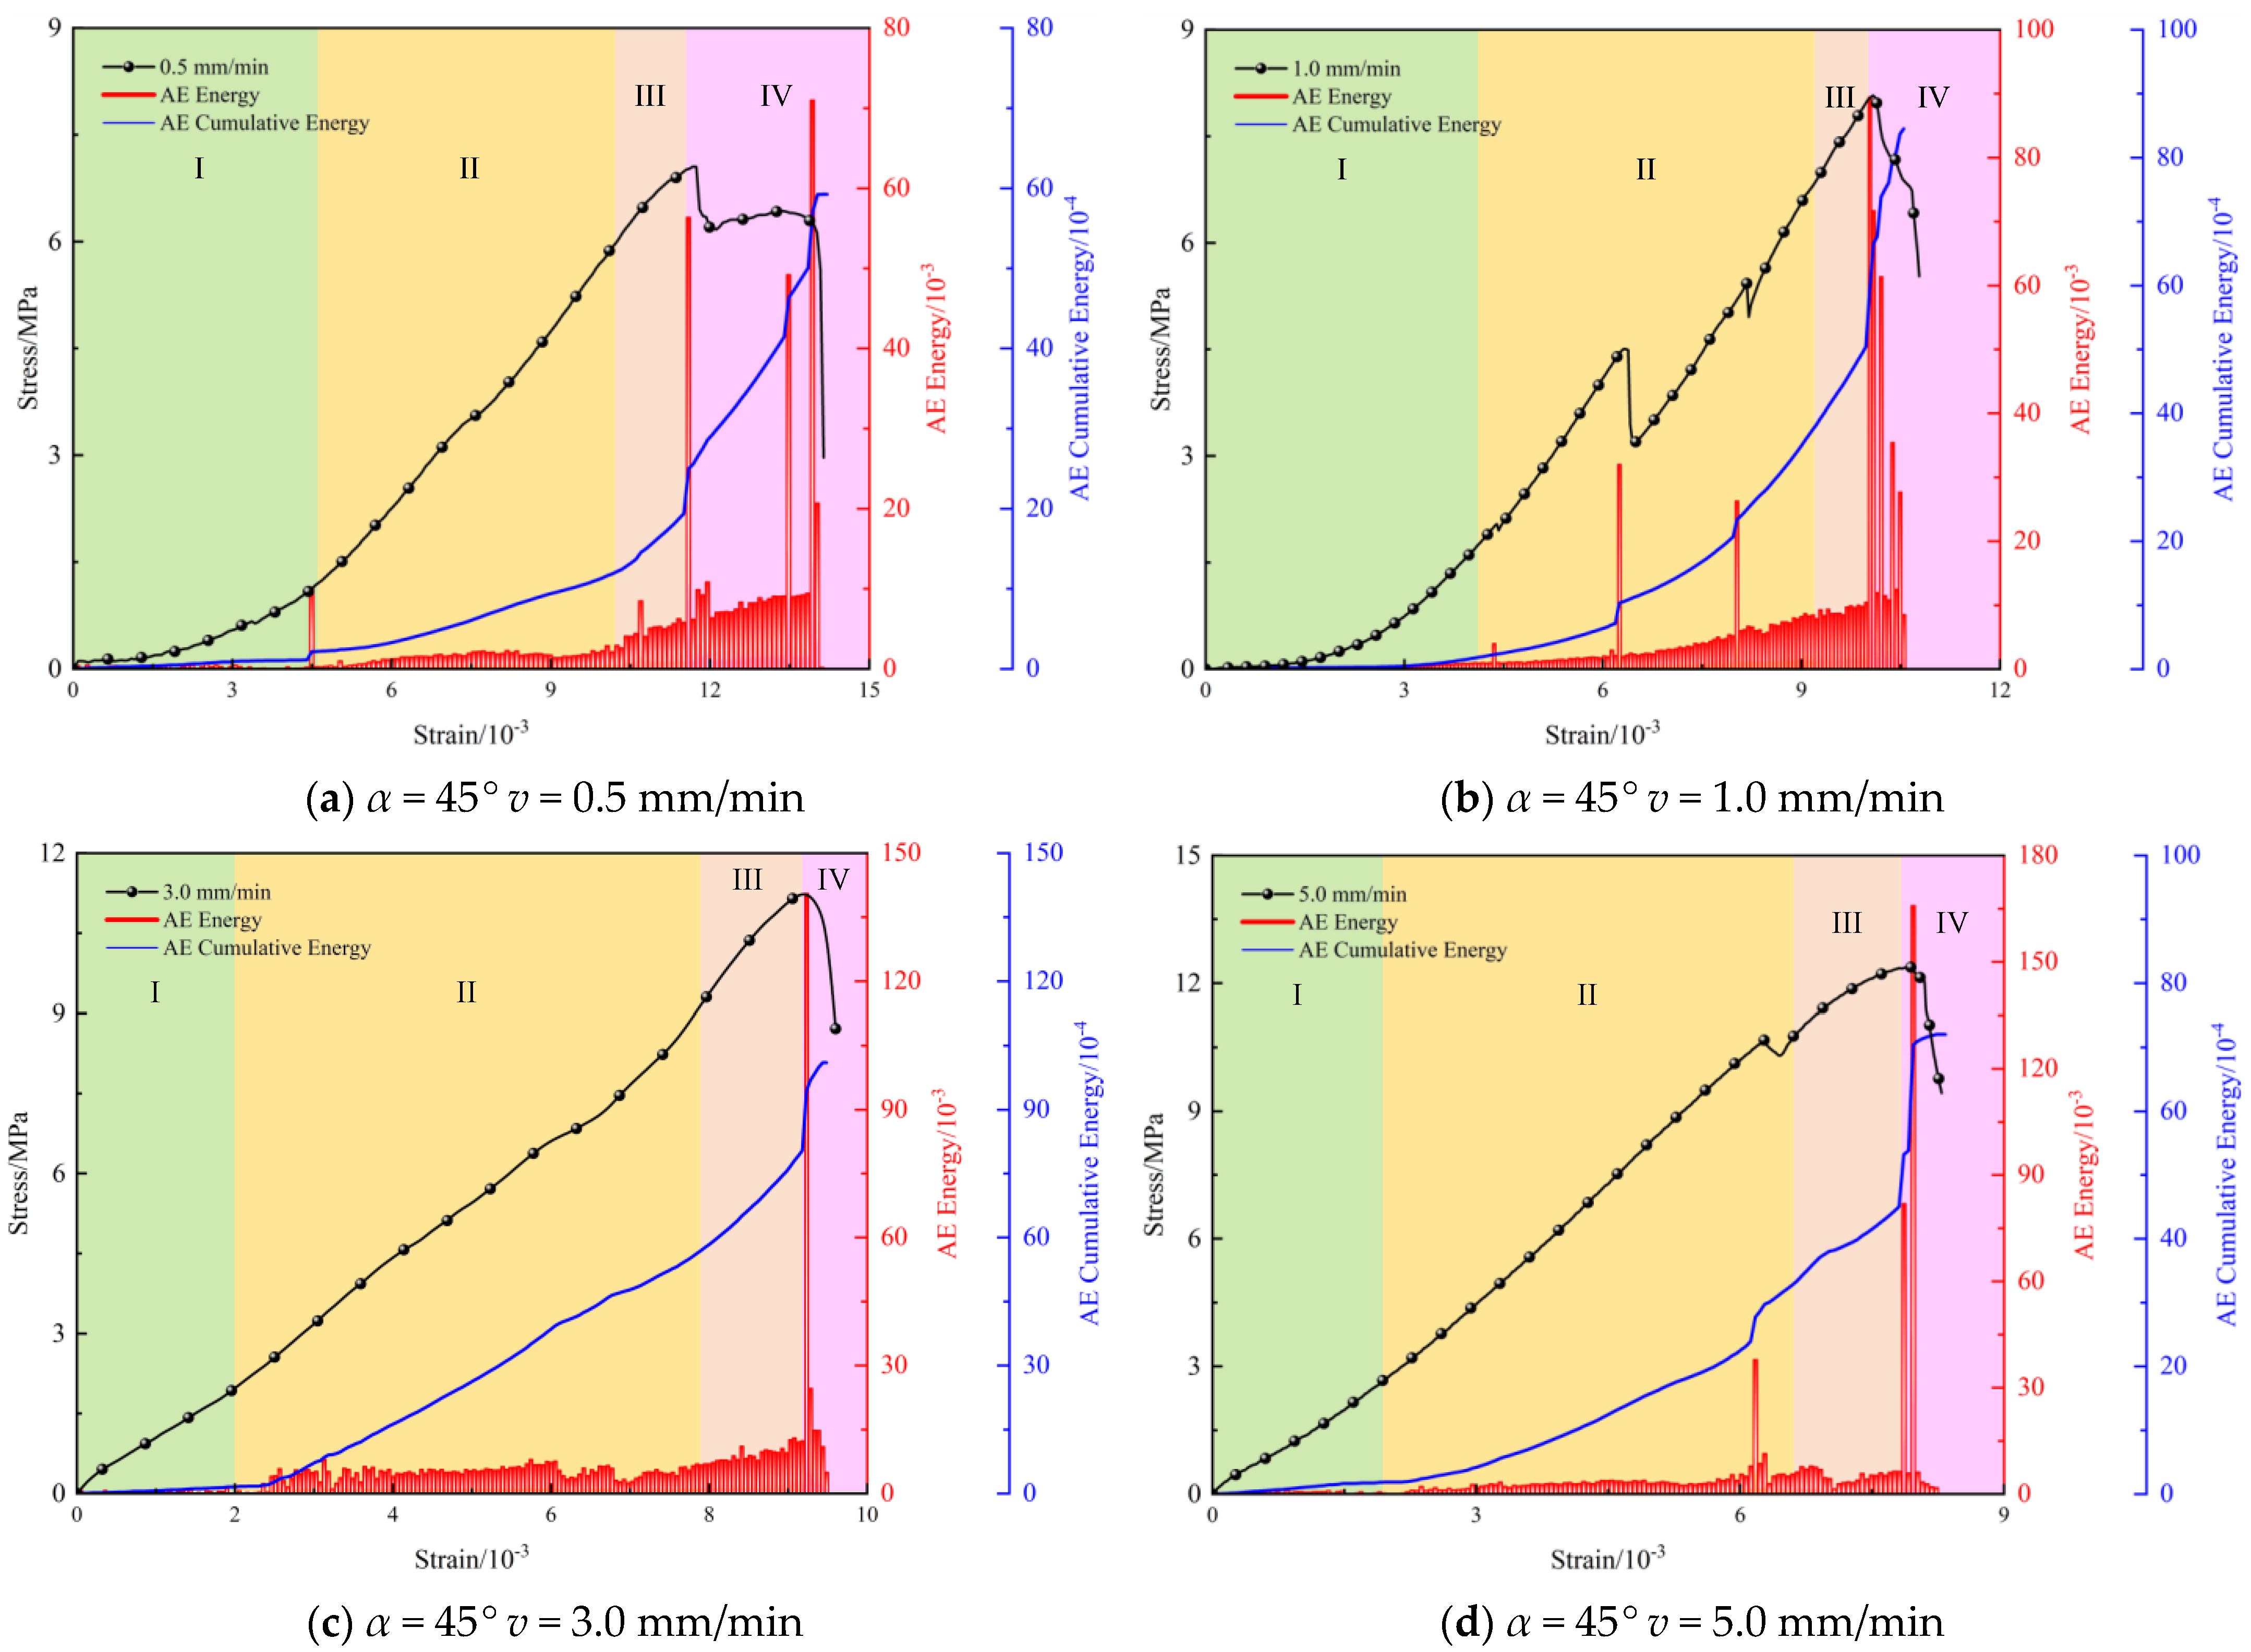
The energy change of the pre-cracked specimen during the loading process is plotted in Figure 15, illustrating the AE energy and cumulative energy variation.
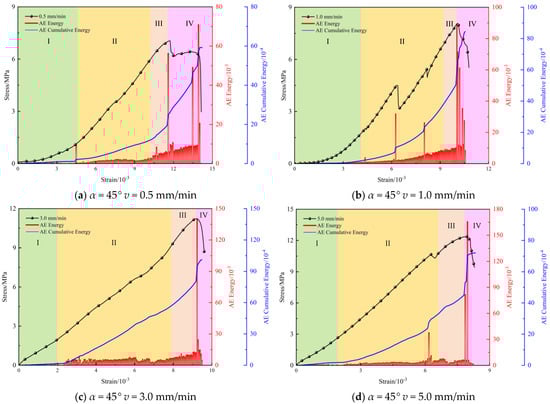
Figure 15.
AE energy characteristics of prefabricated crack specimen.
Analysis reveals that the pattern of acoustic emission (AE) energy during the loading process of the specimen follows a similar trend to the four stages observed in the ringing count: during the initial densification stage, there is minimal energy, and while transitioning into the linear elastic deformation stage, energy shows gradual and stable growth. As the plastic deformation stage is entered, irreversible deformation and failure occur, leading to a noticeable increase in AE energy. This energy peaks during the final failure stage, or post-peak failure stage. Moreover, throughout the loading process, a sudden rise in energy often accompanies stress drops observed in the stress–strain curve [29].
The AE energy and cumulative energy of the specimens are shown in Table 7.
Table 7.
AE energy and cumulative energy of prefabricated crack specimens with α = 45°.
Analysis reveals that with the increase in the loading rate, the AE energy and cumulative AE energy of the prefabricated fissure specimens exhibit a gradual increase during the loading process. The AE energy increases from 71.03·10−3 to 139.63·10−3, marking a rise of 96.58%, while the cumulative AE energy rises from 59.24·10−4 to 109.41·10−4, reflecting an increase of 84.69%.
It is evident that the variation trend of AE energy aligns with that of AE ring count, both showing a proportional relationship with loading rate. However, the trend of cumulative AE energy does not correspond with that of cumulative AE ring count. This discrepancy arises because as the loading rate escalates, the time required for micro-cracks within the specimen to absorb a unit of energy decreases. Consequently, a significant amount of energy is absorbed in a shorter time, accelerating the expansion of cracks, thereby leading to an increase in cumulative AE energy.
5.3. Characterization of AE Spatio-Temporal Evolution
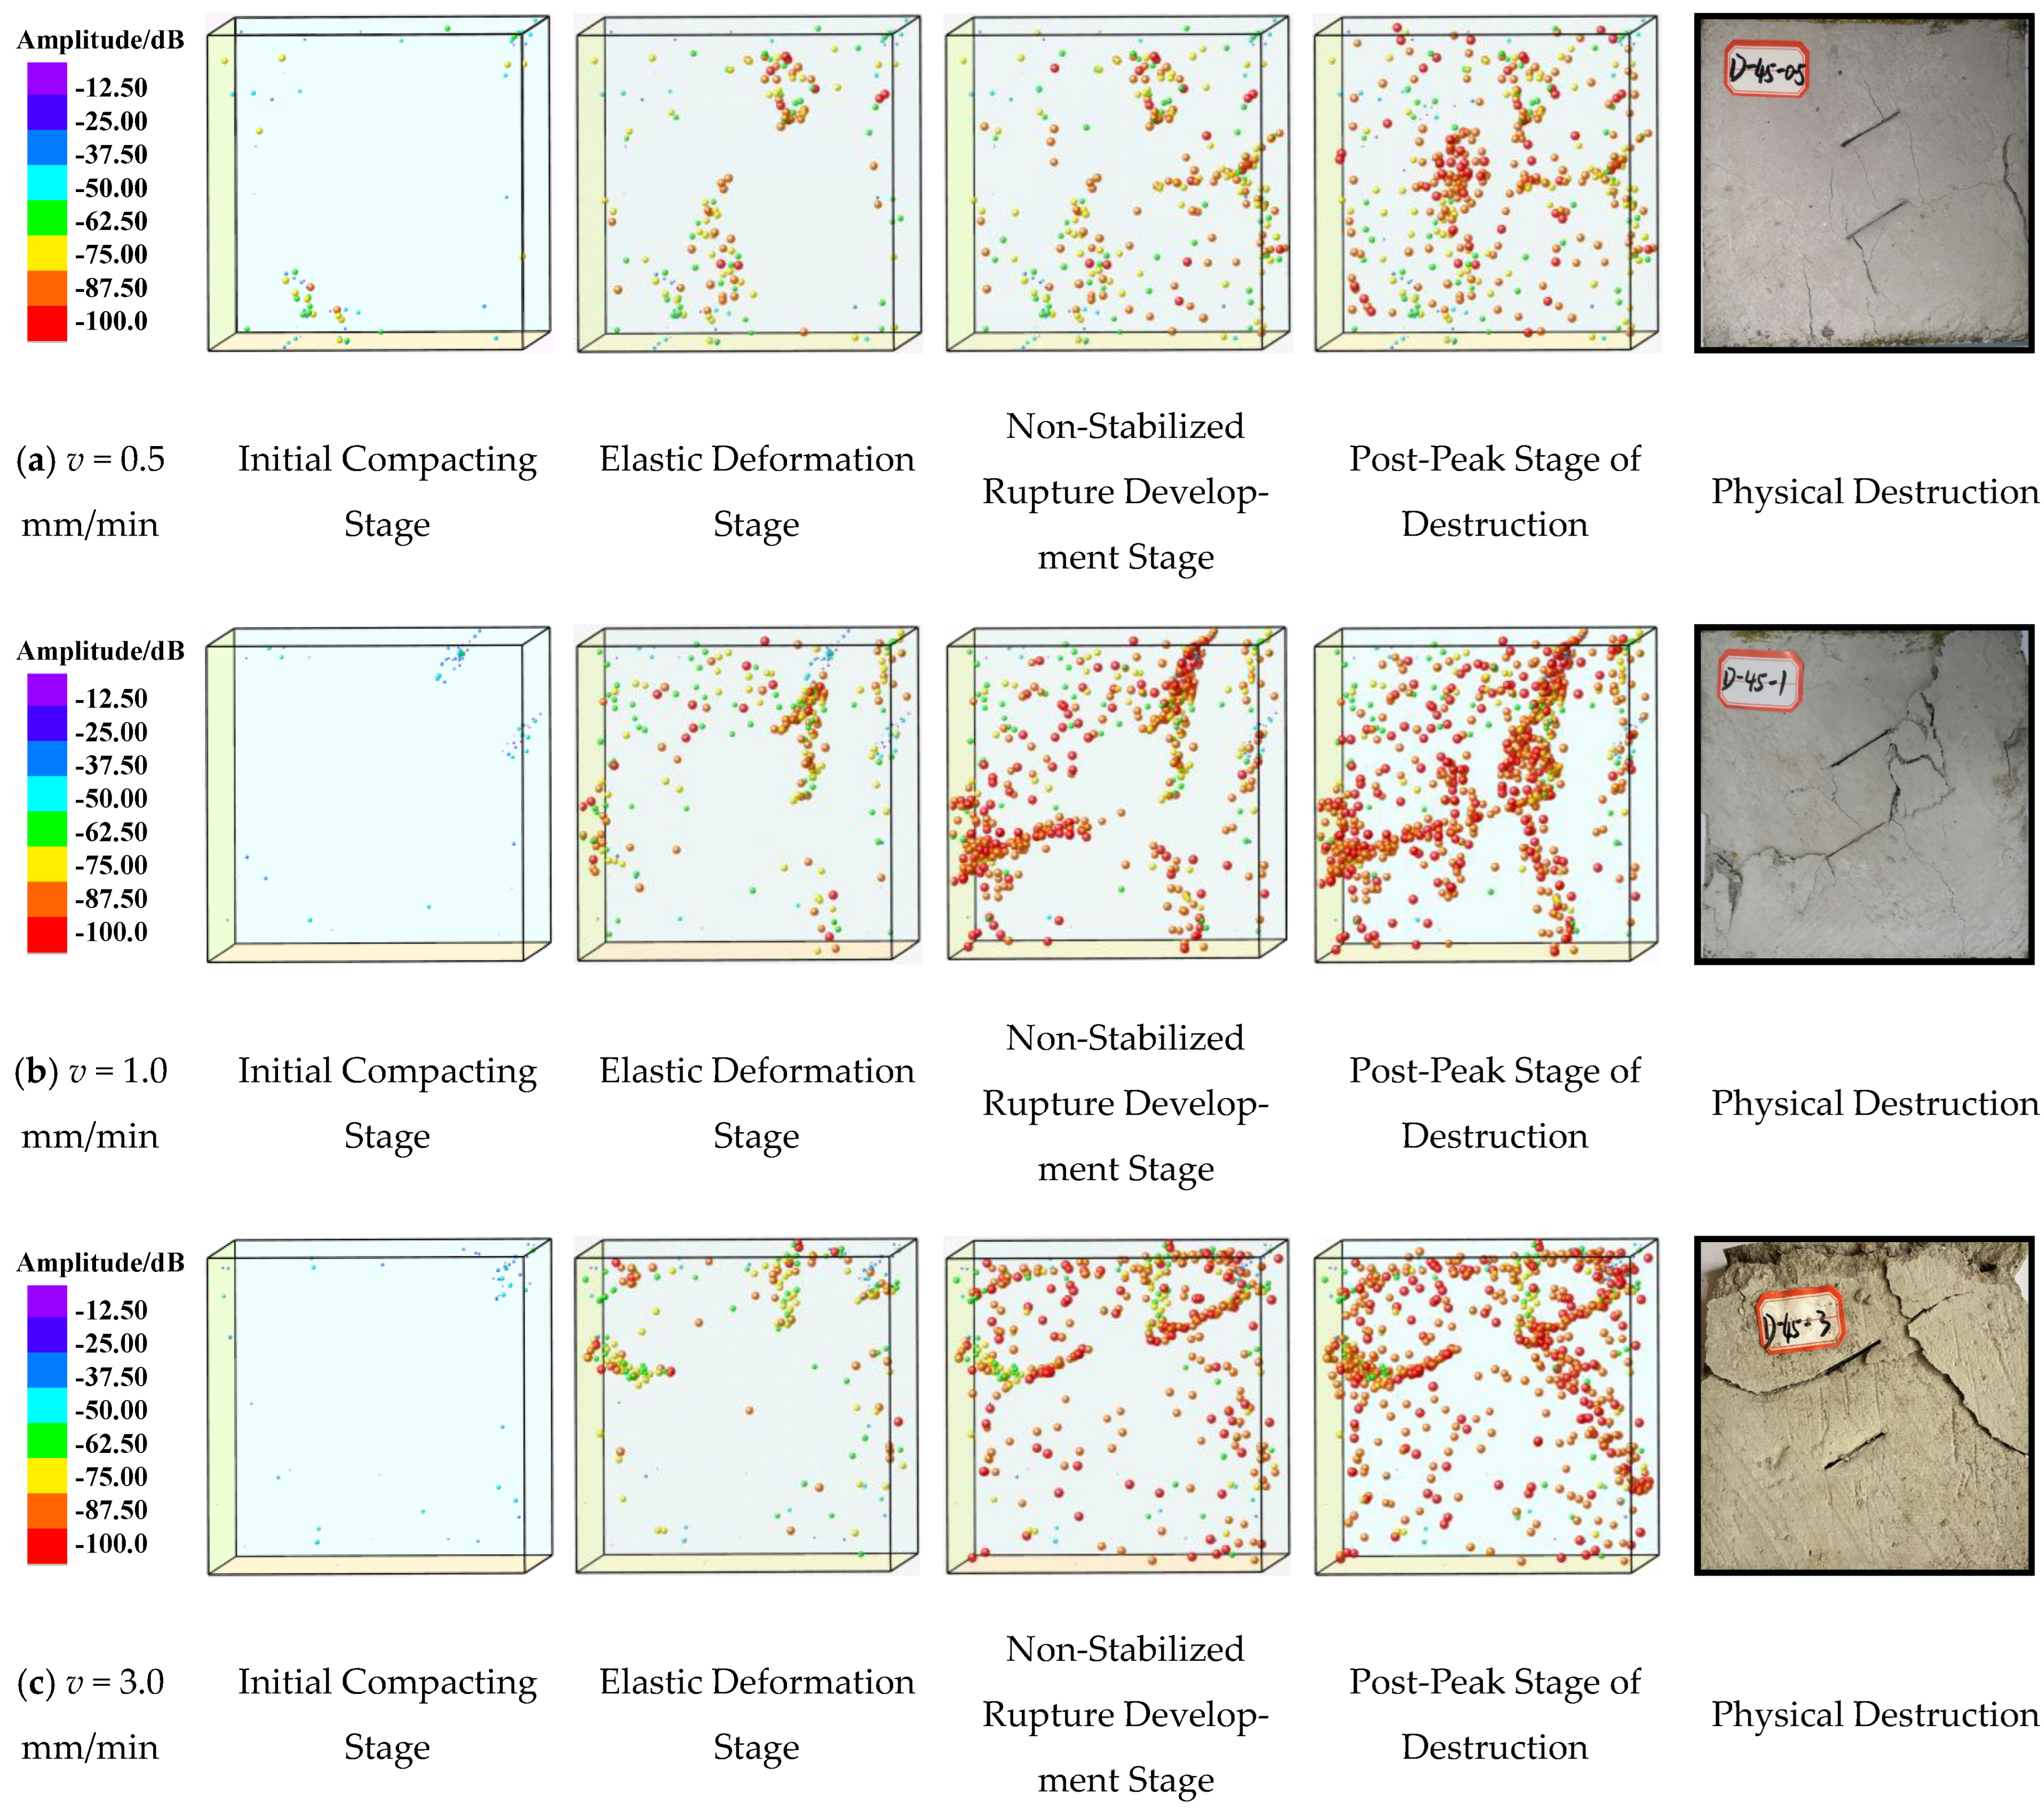
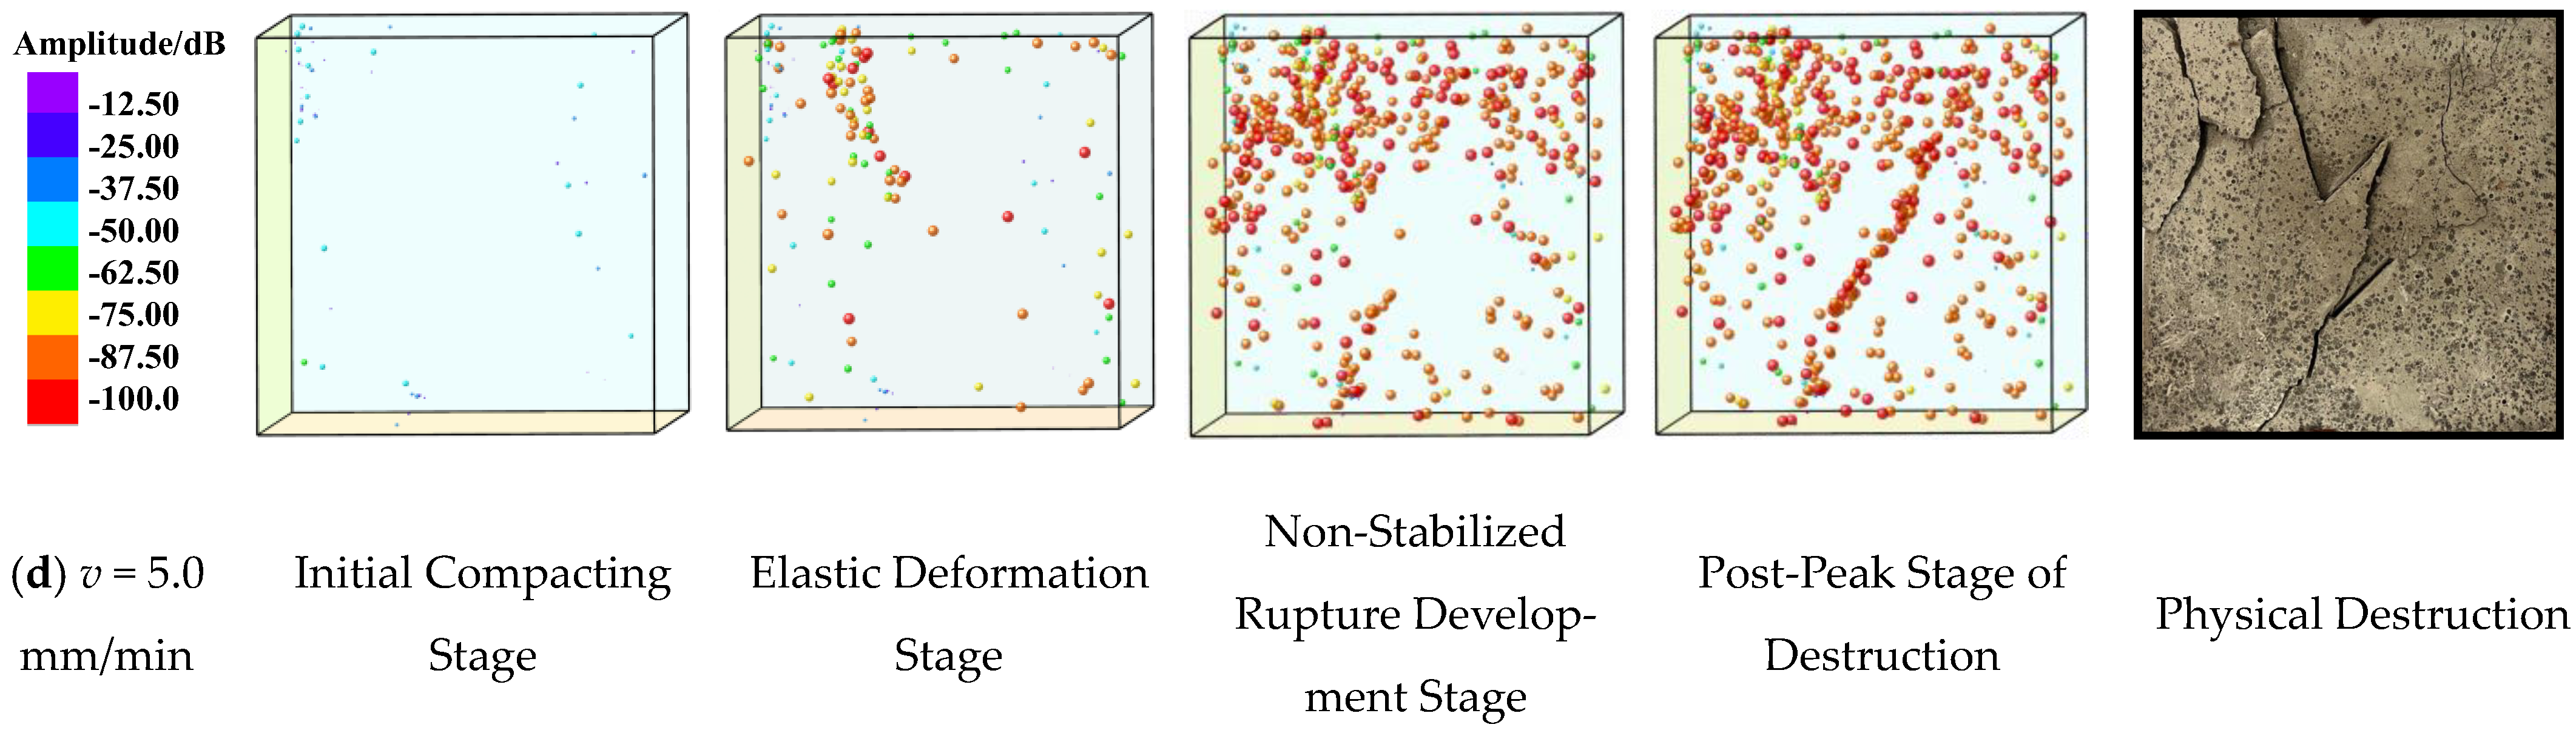
To further explore the progressive damage and failure characteristics within the specimen as loading rate varies, acoustic emission (AE) localization techniques can provide effective characterization [30]. As an example with α = 45°, the acoustic emission (AE) event localization maps for the pre-cracked specimens at different stress stages are depicted in Figure 16.
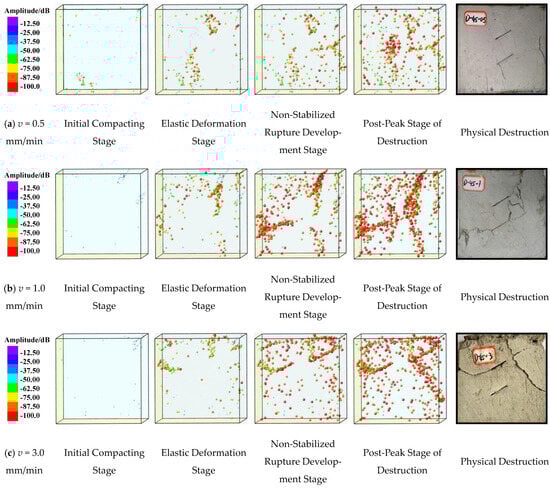
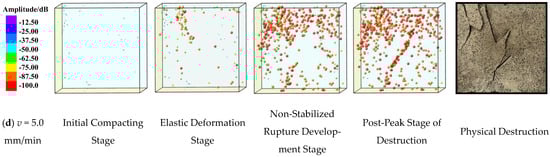
Figure 16.
AE acoustic emission event location map.
Analysis reveals that during the compaction stage, the number of acoustic emission (AE) events generated within the specimen is minimal and can be disregarded. However, as the specimen enters the stage of linear deformation, the formation of internal microcracks within the specimen leads to a slight increase in AE events. During the stage of non-stable fracture development, or the elastoplastic stage, internal cracks, predominantly within the coal body, rapidly propagate and intersect, resulting in a significant increase in AE events. Subsequently, as the stress on the specimen reaches its peak stress, or during the post-peak fracture stage, macroscopic failure of the specimen occurs, with connectivity established between the two pre-existing fissures, leading to a substantial generation of AE signals, often peaking at this moment.
6. Conclusions
(1) The pre-existing fissures deteriorate the strength of the specimen itself, and by analyzing the test results, it can be seen that the loading rate has obvious influence on the mechanical properties of fractured rock mass, which can provide a reliable coefficient for engineering design. The specific influence is as follows: as the loading rate increases, the peak strength of the specimen gradually increases, while the strain corresponding to the peak strength exhibits a negative correlation with the loading rate. Additionally, different fissure angles have varying effects on the mechanical properties of the specimen. Specifically, as the fissure angle increases, the peak strength and elastic modulus of the specimen show a pattern of initial decrease followed by an increase, with the minimum values observed at α = 30°. On the other hand, the strain corresponding to peak strength follows a pattern of initial increase followed by a decrease, reaching its maximum at α = 45°.
(2) The failure of the specimen is primarily due to the expansion of cracks, leading to the overall instability of the specimen. However, the initial appearance of cracks often does not ultimately lead to the instability of the specimen. Cracks typically first appear in a tensile nature before transitioning to shear cracks, and the ultimate failure mode is predominantly shear failure.
(3) The research on the evolution law of AE characteristic parameters can provide an important basis for engineering monitoring and can predict the stability of engineering rock mass. The variation patterns of AE characteristic parameters under the influence of loading rate differ slightly. The AE ring-down count, AE energy, and AE cumulative energy all gradually increase with the increase in the loading rate. However, the AE cumulative ring-down count decreases gradually with the increase in the loading rate.
(4) The characteristic parameters of AE signals of the specimen correspond quite consistently with the stress–strain curve and can similarly be divided into four stages. With the increase in the loading rate, the AE signals in the first three stages gradually stabilize. However, accompanying the appearance of stress drop, the AE signals exhibit a sudden increase. In the fourth stage, namely the post-peak failure stage, the AE signals of the specimen significantly increase, and the final failure of the specimen often coincides with the occurrence of the maximum AE signal.
Author Contributions
Writing—original draft preparation, G.L.; writing—review and editing, W.W. and X.L.; project administration, W.C.; data curation, Y.Z., Y.W., and S.R. All authors have read and agreed to the published version of the manuscript.
Funding
This research was funded by the Scientific Research Foundation of Hunan Provincial Education Department (22B0737 and 22B0732) and the Natural Science Foundation of Hunan Province (2023JJ40212 and 2023JJ30191).
Data Availability Statement
The data presented in this study are available on request from the corresponding author.
Conflicts of Interest
The authors declare no conflicts of interest.
References
- Chen, W.; Wan, W.; He, H.; Liao, D.; Liu, J. Temperature Field Distribution and Numerical Simulation of Improved Freezing Scheme for Shafts in Loose and Soft Stratum. Rock Mech. Rock Eng. 2024, 57, 2695–2725. [Google Scholar] [CrossRef]
- Gao, H.; Jiang, B.; Ma, F.; Wang, Q.; Cai, S.; Zhai, D.; Wu, W. Detection methods for strength deterioration and structural characteristics of fractured rock based on digital drilling. Measurement 2024, 233, 114779. [Google Scholar] [CrossRef]
- Liu, K.; Liu, H.; Zhou, Y.; Liang, G.; Xue, L. Experimental study on the dynamic mechanical and progressive fracture behavior of multi-jointed rock mass under repetitive impact loading. Theor. Appl. Fract. Mech. 2024, 131, 104416. [Google Scholar] [CrossRef]
- Gang, W.; Wenhao, L.; Feng, J.; Peng, H.; Na, H.; Zhiyong, X.; Chengcheng, Z. Shear damage mechanisms of jointed rock mass: A macroscopic and mesoscopic study. Sci. Rep. 2024, 14, 8619. [Google Scholar]
- Hu, J.; Pan, H.; Li, L.; Liu, Q.; Liu, H.; Zhang, Y.; Wang, X. Experimental and Numerical Study of Joint Persistence Effect on the Non-persistent Jointed Rock Mass’ Tension Failure Behavior. Rock Mech. Rock Eng. 2023, 56, 9121–9134. [Google Scholar] [CrossRef]
- Chen, W.; Wan, W.; Zhao, Y.; He, H.; Wu, Q.; Zhou, Y.; Xie, S. Mechanical damage evolution and mechanism of sandstone with prefabricated parallel double fissures under high-humidity condition. Bull. Eng. Geol. Environ. 2022, 81, 245. [Google Scholar] [CrossRef]
- Hu, H.; Yang, L.; Feng, C.; Zhu, X.; Zhou, J.; Liu, X. Development of BB model and investigation of P-wave propagation across jointed rock masses using CDEM. Comput. Geotech. 2024, 165, 105910. [Google Scholar] [CrossRef]
- Sun, K.M.; Cui, H.; Lee, C.Q. Numerical simulation of propagation of oriented crack prefabricated in hydraulic fracturing. J. Liaoning Tech. Univ. 2006, 25, 176–179. [Google Scholar]
- Ye, M.; Lu, Y.; Ge, Z.; Deng, Q.; Zhou, Z.; Gong, S.J.E. Study on crack propagation mechanism of coal under the different orientation between prefabricated slots and true triaxial stress. Energy 2024, 298, 130988. [Google Scholar] [CrossRef]
- Zhou, H.; Guo, W.; Zhou, Y. Investigation on stress intensity factor and fracture characteristics of SCB sandstone containing prefabricated cracks. Theor. Appl. Fract. Mech. 2023, 124, 103754. [Google Scholar] [CrossRef]
- Li, B.; He, Y.; Li, L.; Zhang, J.; Shi, Z.; Zhang, Y. Damage evolution of rock containing prefabricated cracks based on infrared radiation and energy dissipation. Theor. Appl. Fract. Mech. 2023, 125, 103853. [Google Scholar] [CrossRef]
- Sun, X.; Li, W.; Zhang, C.; Zhang, G.; Xia, Z. Mechanical Behaviors and Fracture Characteristics of Sandstone Combinations with Different Pre-crack Angles. KSCE J. Civ. Eng. 2023, 27, 5388–5400. [Google Scholar] [CrossRef]
- Guo, Y.; Xiong, Z.; Li, Z.; Yan, F.; Cheng, X.; Zhang, J. Damage Behavior Study of Specimens with Double-Prefabricated Cracks under Dynamic–Static Coupling Loads. Buildings 2023, 13, 2793. [Google Scholar] [CrossRef]
- Yu, C.; Huang, S.; Li, J.; Wu, X.; Tian, Y.; Bao, X. Study on the Failure Process and Acoustic Emission Characteristics of Freeze–Thawed Sandstone under Cyclic Loading and Unloading. Buildings 2024, 14, 1264. [Google Scholar] [CrossRef]
- Zhang, W.; Yu, J.; Xu, X.; Ren, J.; Liu, K.; Shi, H. Waveform Complexity and Positioning Analysis of Acoustic Emission Events during the Compression Failure Process of a Rock Burst Prone Sample. Buildings 2024, 14, 1331. [Google Scholar] [CrossRef]
- Huang, X.; Wan, W.; Wang, M.; Zhou, Y.; Liu, J.; Chen, W. Study on Crack Propagation of Rock Bridge in Rock-like Material with Fractures under Compression Loading with Sudden Change Rate. Appl. Sci. 2023, 13, 4354. [Google Scholar] [CrossRef]
- Yuan, Y.; Zhao, S. Analysis of Microwave-Induced Damage in Granite Aggregates Influenced by Mineral Texture. Buildings 2024, 14, 1348. [Google Scholar] [CrossRef]
- Luo, Y.; Liao, P.; Pan, R.; Zou, J.; Zhou, X. Effect of bar diameter on bond performance of helically ribbed GFRP bar to UHPC. J. Build. Eng. 2024, 91, 109577. [Google Scholar] [CrossRef]
- Chen, W.; Liu, J.; Peng, W.; Zhao, Y.; Luo, S.; Wan, W.; Wu, Q.; Wang, Y.; Li, S.; Tang, X.; et al. Aging deterioration of mechanical properties on coal-rock combinations considering hydro-chemical corrosion. Energy 2023, 282, 128770. [Google Scholar] [CrossRef]
- Chen, W.; Liu, J.; Liu, W.; Peng, W.; Zhao, Y.; Wu, Q.; Wang, Y.; Wan, W.; Li, S.; Peng, H.; et al. Lateral deformation and acoustic emission characteristics of dam bedrock under various river flow scouring rates. J. Mater. Res. Technol. 2023, 26, 3245–3271. [Google Scholar] [CrossRef]
- Luo, Y.; Liu, X.; Chen, F.; Zhang, H.; Xiao, X. Numerical Simulation on Crack–Inclusion Interaction for Rib-to-Deck Welded Joints in Orthotropic Steel Deck. Metals 2023, 13, 1402. [Google Scholar] [CrossRef]
- Guo, Y.; Huang, D.; Cen, D. Crack Propagation and Coalescence Mechanism of a Rock Bridge between a Parallel Fissure Pair in a Direct Shear Test with Unloading Normal Stress. Int. J. Geomech. 2024, 24, 04023258. [Google Scholar] [CrossRef]
- Li, Y.; Zhang, Q.; Jiang, B. Numerical investigation on the fracture and mechanical behaviors of marble containing two parallel fissures under triaxial compression conditions using FDEM. Theor. Appl. Fract. Mech. 2024, 131, 104408. [Google Scholar] [CrossRef]
- Li, K.S.; Luan, Y.Q.; Zhang, J.P.; Liu, C.X. Experimental study on mechanical behavior, AE response and energy evolution of fissure-filled sandstone from mine roadway under conventional triaxial compression. Theor. Appl. Fract. Mech. 2024, 130, 104334. [Google Scholar] [CrossRef]
- Li, Z.; Li, X.; Yin, S.; Lei, Y.; Tian, H.; Niu, Y. Deformation failure and acoustic emission response characteristics of water-containing concrete under impact load. Constr. Build. Mater. 2024, 412, 134729. [Google Scholar] [CrossRef]
- Liu, H.; Liu, C.; Yue, X.; Wang, J. Study on mechanical properties and acoustic emission characteristics of mudstone-clay composites under uniaxial compression. Eng. Geol. 2024, 332, 107478. [Google Scholar] [CrossRef]
- Wang, H.; Fall, M.; Miao, S. Characteristics of fracture changes and fatigue failure signals for siltstone under cyclic loading. Int. J. Rock Mech. Min. Sci. 2024, 174, 105645. [Google Scholar] [CrossRef]
- Xu, C.; Xue, L.; Cui, Y.; Jiang, T.; Zhai, M.; Bu, F. Staged Damage Behavior and Acoustic Emission Characteristics of Rock-Like Materials under the Coupled Effects of Clay Mineral Content and Uniaxial Loading. J. Mater. Civ. Eng. 2024, 36, 04023499. [Google Scholar] [CrossRef]
- Song, H.; Zhao, Y.; Wu, Y.; Li, X.; Gong, Z.; Sun, Z.; Jiang, Y.; Guo, Z. Effect of water on the damage and energy dissipation feature of coal under uniaxial cyclic loading–unloading condition. Energy Sci. Eng. 2023, 11, 4092–4107. [Google Scholar] [CrossRef]
- Chai, Y.; Dou, L.; Cai, W.; Małkowski, P.; Li, X.; Gong, S.; Bai, J.; Cao, J. Experimental investigation into damage and failure process of coal-rock composite structures with different roof lithologies under mining-induced stress loading International. J. Rock Mech. Min. Sci. 2023, 170, 105479. [Google Scholar] [CrossRef]


Disclaimer/Publisher’s Note: The statements, opinions and data contained in all publications are solely those of the individual author(s) and contributor(s) and not of MDPI and/or the editor(s). MDPI and/or the editor(s) disclaim responsibility for any injury to people or property resulting from any ideas, methods, instructions or products referred to in the content. |
© 2024 by the authors. Licensee MDPI, Basel, Switzerland. This article is an open access article distributed under the terms and conditions of the Creative Commons Attribution (CC BY) license (https://creativecommons.org/licenses/by/4.0/).