Article

Research on the Characteristics of Jacks Used to Rectify Tilted Buildings

by
Krzysztof Gromysz
1,*,
Mateusz Smolana
1 and
Marian Drusa
2
1
Department of Building Structures, Silesian University of Technology, 44-100 Gliwice, Poland
2
Department of Geotechnics, University of Žilina, 010 26 Žilina, Slovakia
*
Author to whom correspondence should be addressed.
Buildings 2024, 14(6), 1581; https://doi.org/10.3390/buildings14061581
Submission received: 11 April 2024 / Revised: 7 May 2024 / Accepted: 27 May 2024 / Published: 30 May 2024

Abstract

:
One method of rectifying tilted buildings is by lifting them unevenly using hydraulic jacks. These jacks are loaded both monotonically and cyclically during the rectification process. It has been shown that the change in jack length is the sum of the change in the piston slide out and the change in the jack’s cylinder length, which is supported by a parallelepiped element. Laboratory tests were conducted to investigate the piston slide out and the change in the jack’s cylinder length under both monotonically and cyclically loaded conditions. The results indicated that the piston slide out forms a hysteresis loop. In contrast, the change in the jack’s cylinder length does not exhibit a hysteresis loop and is a non-linear function of the load. A structural model of the jack was proposed, consisting of three components: a linearly elastic component connected in parallel to the component where the frictional force occurs, and a component with non-linear elastic characteristics connected in series with them. Displacements of the linear elastic component, characterized by a constant stiffness, occur as long as the external load exceeds the internal frictional force. The value of the frictional force in this model increases with the load. The stiffness of the non-linear elastic component increases proportionally to the load.

1. Introduction

The tilt of structures from the vertical is a common phenomenon observed worldwide [1,2,3,4]. It can affect various types of objects, including residential buildings [5,6], industrial structures [7], historic towers [8,9,10], chimneys [11], churches [12], tanks [13], transmission towers [14], grain elevators [15], tall buildings [16], bridge supports [17], piles [18], high-voltage poles [19], and oil platforms [20] under construction. The most common causes of building deflection are uneven settlement of the deformable subsoil [21,22] and the uneven lowering of the ground surface due to underground mining [23,24]. Tilt can lead to damage to buildings [25] and even construction disasters [26].
A significant number of tilted buildings are stabilized by reinforcing the foundations with various types of piles, such as pressed-in micro piles [27], steel piles [28], and reinforced concrete piles [29], or through soil reinforcement [8]. If individual structural elements become deflected, they are then stabilized in a new position [30]. In some cases, the decision is made to demolish the structure. In special cases, tilting objects can be rectified by returning them to a vertical position. Occasionally, it may be necessary to move the object before rectifying it [31].
Rectification through uneven lifting is achieved using hydraulic jacks that are built into the building structure (Figure 1a). Once all the jacks are installed, a force denoted as Qmean is stabilized in each jack. During the rectification process, each jack can operate as either an active or passive jack. In an active jack, the piston extension (uext) is forced, resulting in displacement of the object and a change in the force values in the jack (Figure 1c). In a passive jack, as a result of this forcing there is a change in the force value by ΔQ, relative to the Qmean value. Additionally, there is a piston slide out (upist) relative to the initial position and a change in the length of the jack body (Δlcyl). It is often necessary to expand the working range of the jacks during rectification [32], which is achieved by placing stacks of parallelepiped elements beneath the jacks (Figure 1b). To embed these stacks, the jacks are unloaded in a monotonically decreasing manner until they reach zero force. Subsequently, after embedding the stacks, they are loaded in a monotonically increasing manner up to Qmax. Therefore, the jacks are subjected to both monotonic and cyclic loading during the rectification process.
The study of jacks as supports for rectifying buildings has not been extensively researched to date. A preliminary, ad hoc study was carried out on-site during the experimental rectification of a five-story residential building [33]. However, there have been studies conducted on stacks of parallelepiped steel elements with imperfections [34]. Understanding the characteristics of jacks, when supported by parallelepiped steel elements, is crucial for the design and implementation of building rectification. The parallelepiped elements used in the rectification process have imperfections that impact the rigidity of the jacks’ support and the change in their length during rectification. Therefore, laboratory tests were conducted to simulate the actual behavior of the jack. The tests were designed for both monotonic loading and cyclical loading. Monotonic loading involves gradually increasing the load value (Q) from zero to Qmax and then decreasing it back to zero. Cyclical loading, on the other hand, involves alternating between decreasing and increasing the force in the support by a value of ΔQ, with Qmean being the average force.
During the tests, a jack was used that had the capability to mechanically block the movement of the piston. This feature is crucial for ensuring the safety of rectified structures in the event of an unexpected and unmeasured drop in cylinder oil pressure.
The main objectives of this research were to propose a mathematical model for the jack under cyclic loading and to define an algorithm for calibrating the parameters of the model. The model presented in this paper has been specifically developed for the purpose of building rectification design, which is a pioneering approach within the field of civil engineering. One of the major strengths of this model lies in its universal applicability, as it can be easily adapted for use with other types of jacks.

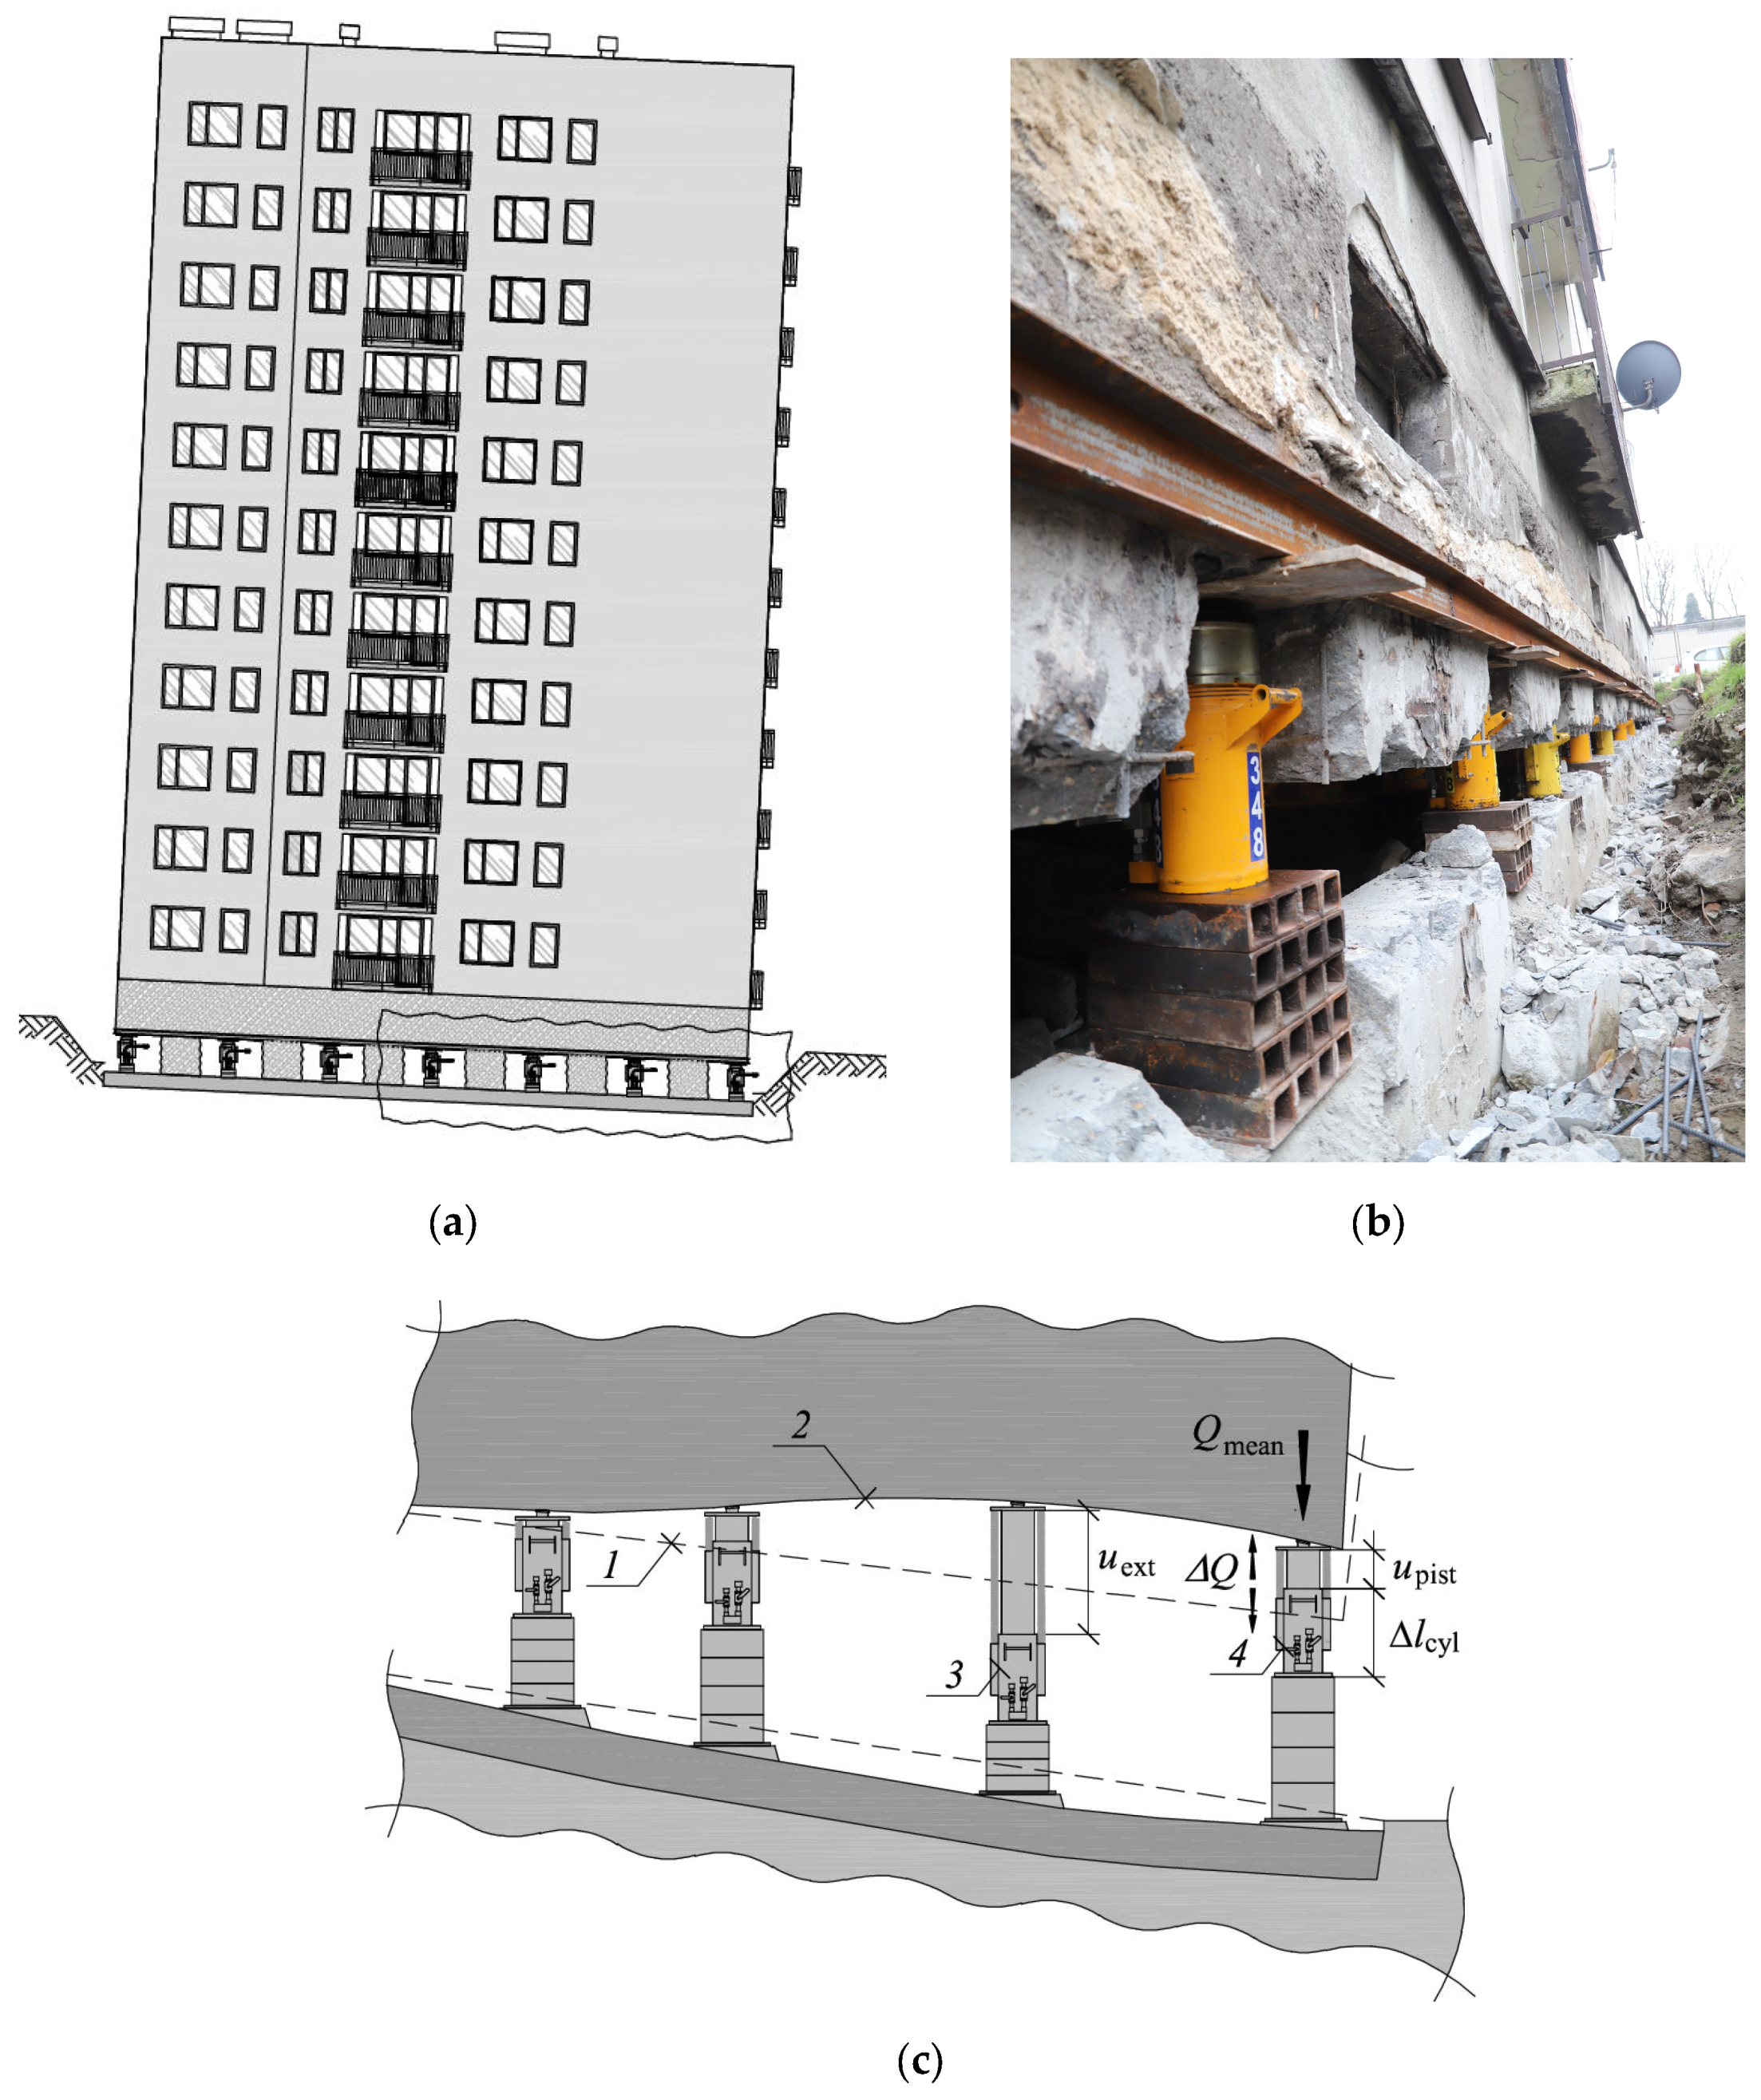
2. Materials and Methods
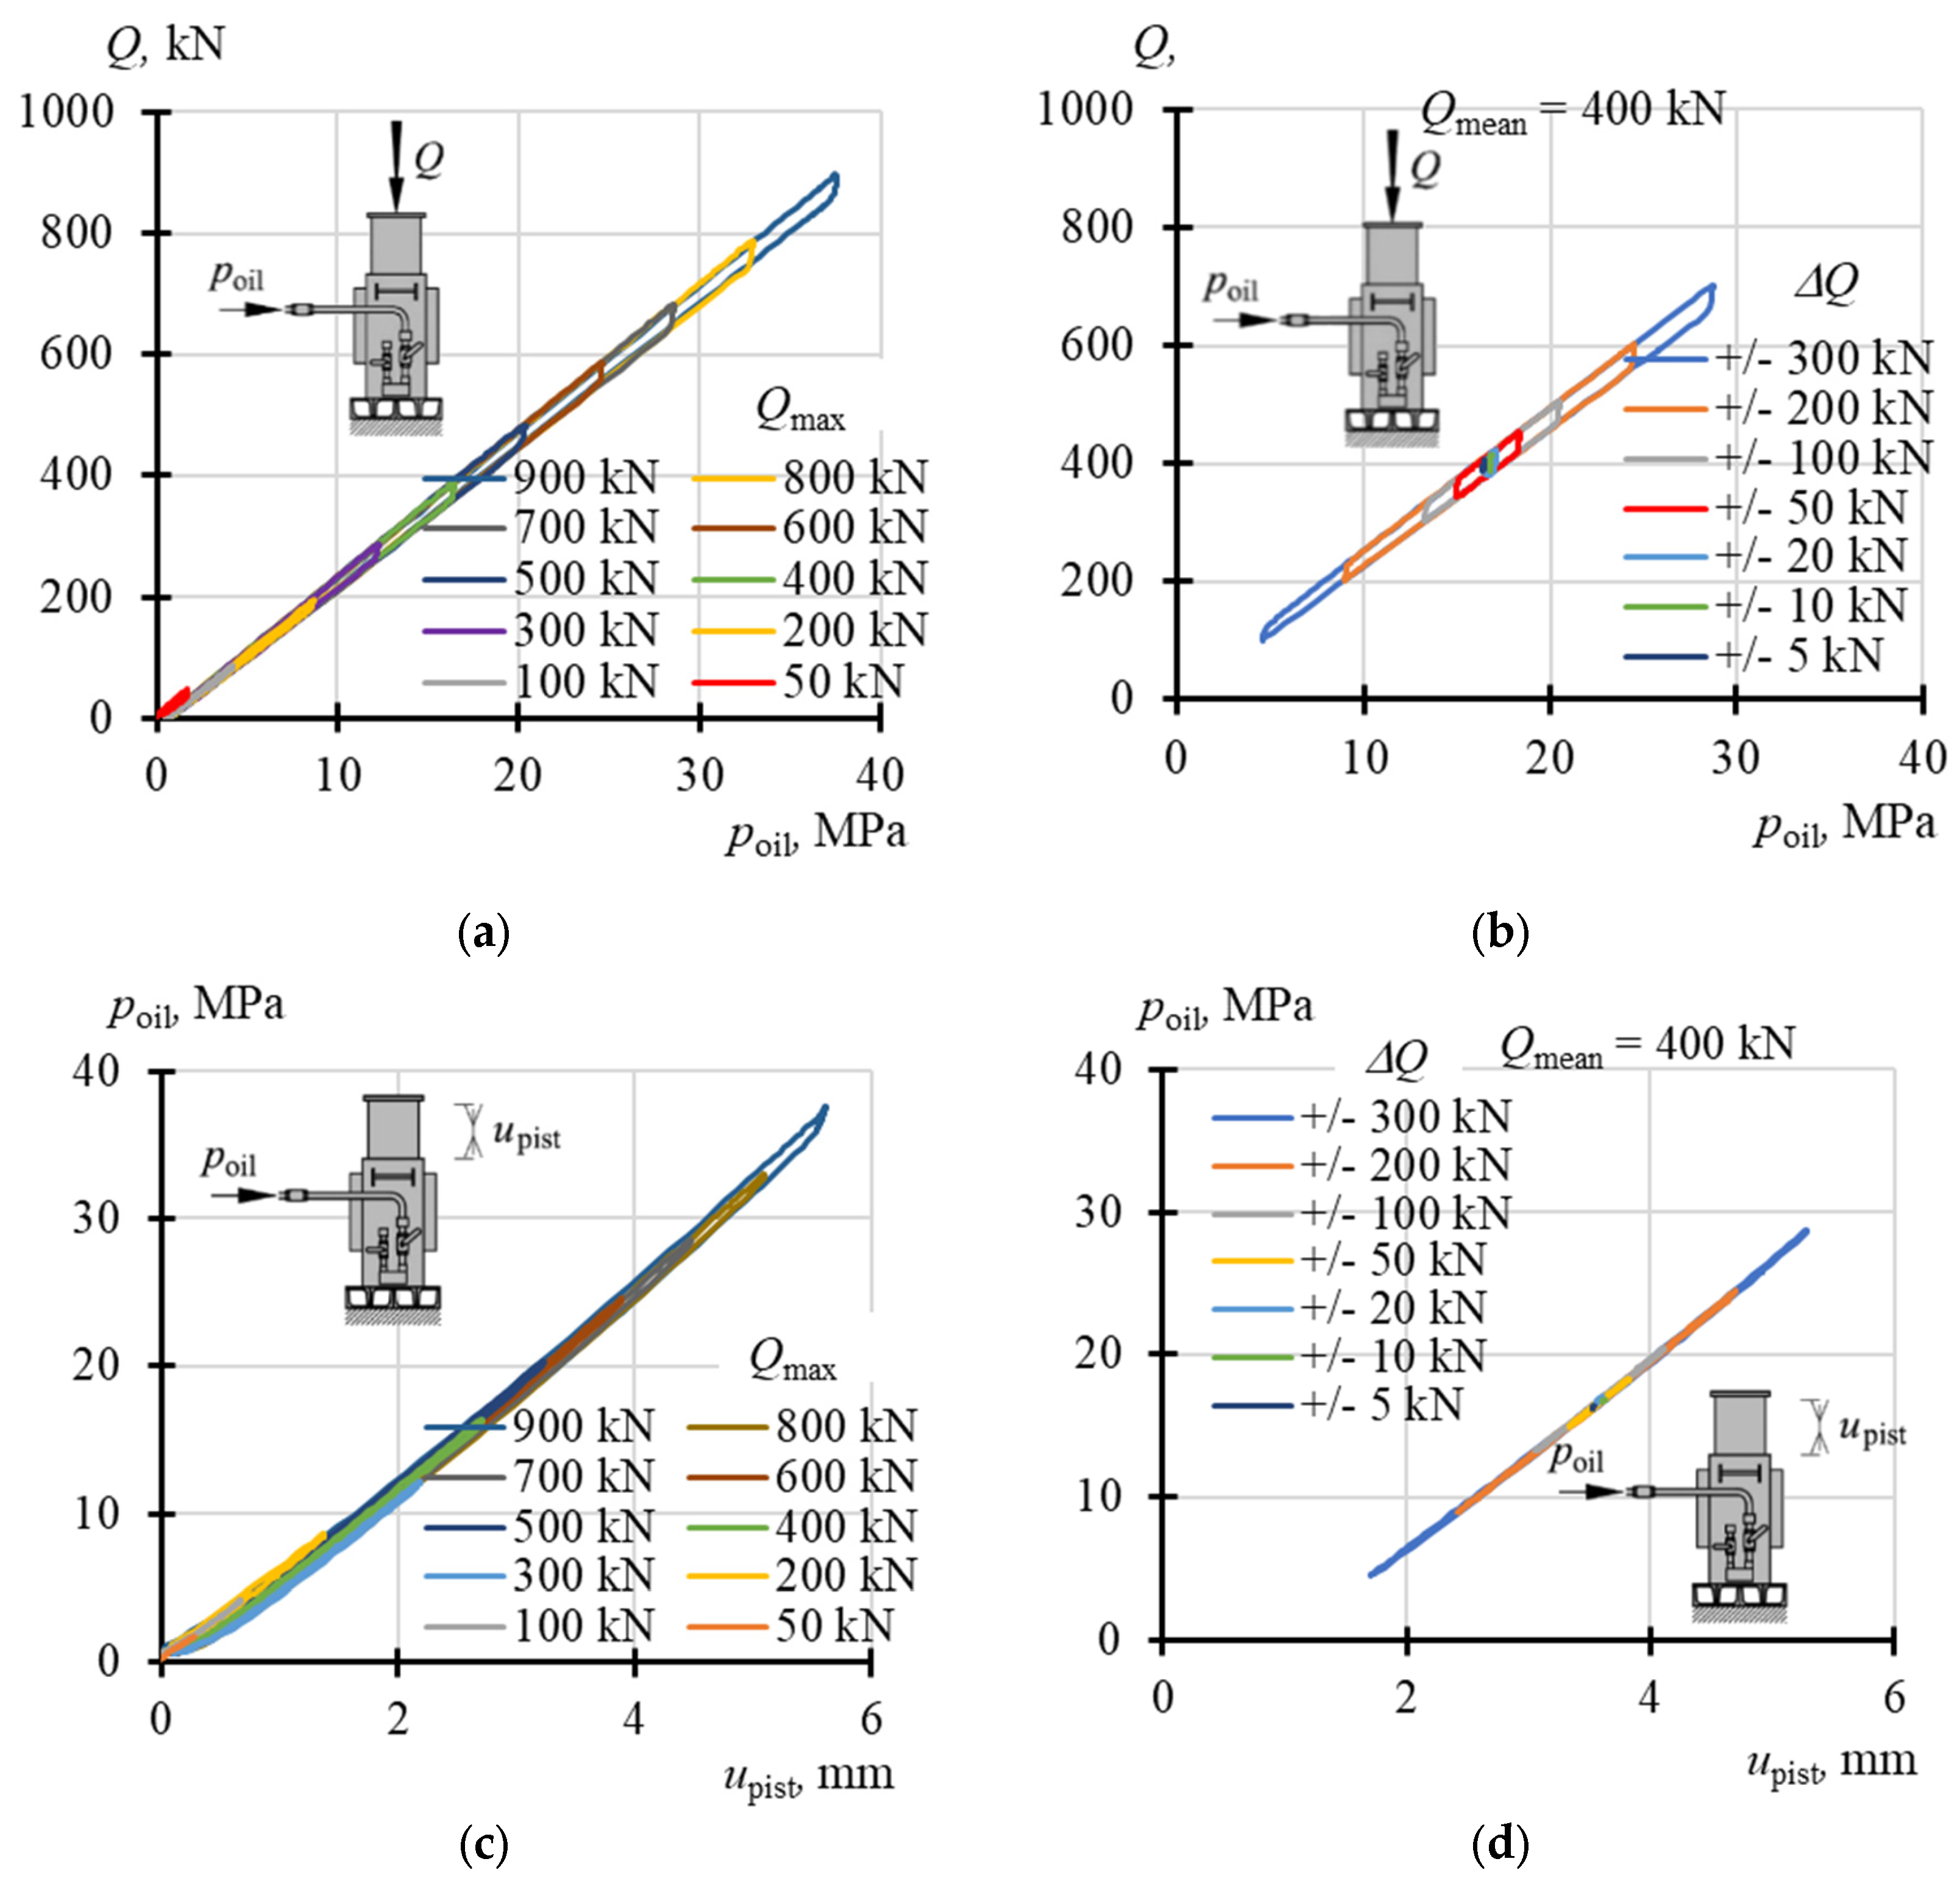
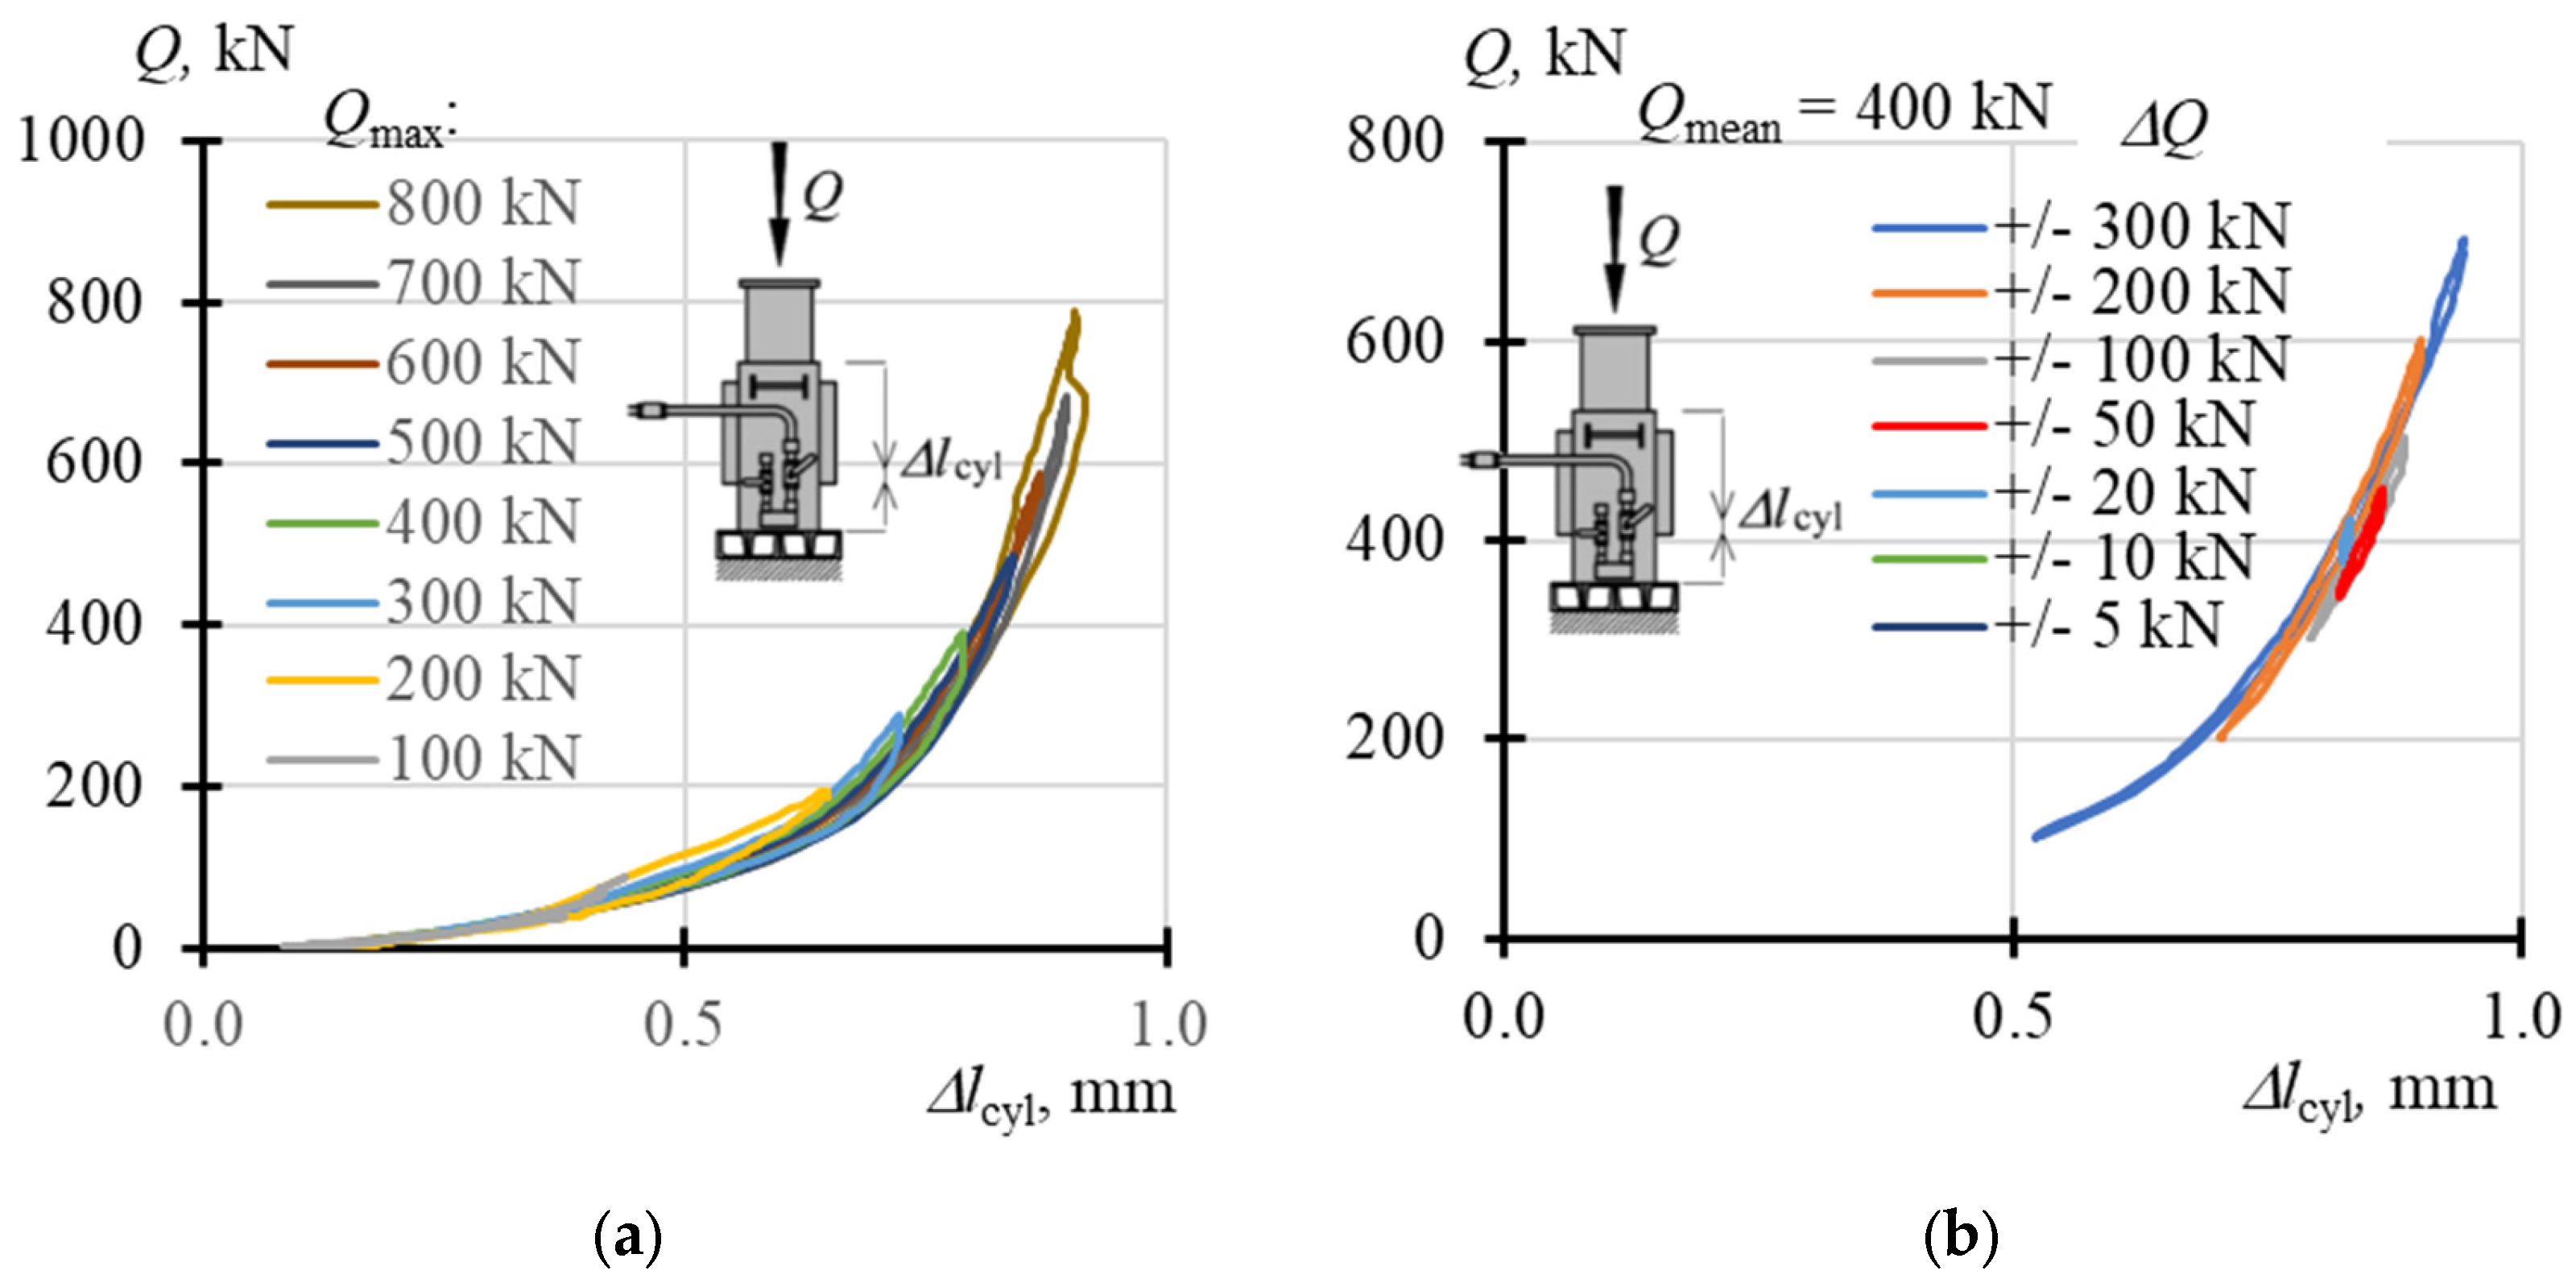
The hydraulic jack (Figure 2a) is supplied with oil from an external pump. It consists of a body (1) that rests on a parallelepiped element (2), a piston (3), and a valve system. The jack is supplied with oil, under poil pressure from the external pump. A pressure sensor is located in the control box, between the pump and the jack valves, to measure the oil pressure (poil) during testing (Figure 2b). The jack body has an outer diameter of 209 mm and a height of 440 mm. The piston, with a diameter of 169 mm, has a nominal extension of 200 mm. During testing, the piston was extended to a length of 100 mm. The arrangement shown in Figure 2b replicates a real-world scenario where the jack is placed on a stack of parallelepiped elements, and the parallelepiped element is characterized by geometric imperfection.
Under the influence of an external load change (Q), the jack piston slides out relative to its initial position, causing a change in the upstroke of the piston (upist). Additionally, the length of the jack body that rests on the parallelepiped element (Δlcyl) also changes. This change refers to the distance between the upper edge of the jack body and the surface of the parallelepiped element. It takes into account any deformations that occur at the interface between the jack body and the parallelepiped element. These deformations primarily occur because of imperfections within the parallelepiped element. The change in the length of the jack (Δljack) is the sum of the change in piston slide out (upist) and the change in body length (Δlcyl).
The force transmitted by the press to the jack (Q) was measured using an electro-resistance dynamometer positioned between the press and the jack piston (Figure 2a). The change in piston slide out (upist) was determined by averaging the measurements from two Peltron LVDT displacement transducers (upist,r and upist,l) positioned on opposite sides of the piston. Similarly, the change in Δlcyl was determined by averaging the measurements from two linear LVDT displacement transducers (Δlcyl,r and Δlcyl,l) mounted on opposite sides of the jack’s body. The LVDT sensors had a measurement range of 10 mm and an error of less than 0.5%. The oil pressure in the jack (poil) was measured using a WIKA A-10 electronic pressure sensor with a measurement range of 1000 bar and an error of less than 0.5%. The sensor was mounted in the control box at the exit of the oil supply hose to the jack. The sensor readings were recorded at a frequency of 2 Hz using an HBM QuantumX MX840A measurement amplifier, which included 24-bit analog-to-digital cards.
Tests were conducted on the jack, involving both monotonic and cyclic press loading. Monotonic loading consisted of gradually increasing the load from Q = 0 to Q = Qmax at a speed of 10 kN/s, and then relieving the load back to Q = 0 at the same speed. The tests were carried out for Qmax values of 50 kN, 100 kN, 200 kN, 300 kN, 400 kN, 500 kN, 600 kN, 700 kN, 800 kN, and 900 kN. Each 0-Qmax-0 loading cycle was repeated three times.
The cyclic tests involved increasing and decreasing the load by ΔQ relative to the Qmean value at a rate of 10 kN/s. The Qmean values were 100 kN, 200 kN, …, 800 kN, and the ΔQ values were 5 kN, 10 kN, 20 kN, 50 kN, 100 kN, 200 kN, and 300 kN. Similar to the monotonic load, each cyclic load on the jack was repeated three times.

3. Results

The research yielded extensive results, and some of them are presented below. Figure 3a shows the Qpoil relationships obtained by monotonically loading the jack from zero to Qmax, and then monotonically unloading it back to zero. From the analysis of the figure, it is evident that each monotonical loading process, in (Q, poil) coordinates, is represented by a line that originates at the coordinate system’s origin. However, each monotonical unloading process is represented by two segments in this figure: the first one is vertical and parallel to the Q axis, while the second one points towards point (0, 0). The sections representing the second phase of unloading also form a straight line, but with a smaller inclination angle compared to the line representing loading. Consequently, the Qpoil relationships form hysteresis loops that share a common apex at point (0, 0).
Figure 3b illustrates the Qpoil relationships obtained during cyclic loading of the jack. The load is varied between (QmeanΔQ) and (Qmean + ΔQ) for Qmean equal to 400 kN and different values of ΔQ equal to 5 kN, 10 kN, 20 kN, 50 kN, 100 kN, 200 kN and 300 kN. For small ΔQ values (5 kN and 10 kN), the load change cycle is represented by a vertical straight line. At other ΔQ values, hysteresis loops are formed in the (poil, Q) coordinates. Both the loading and unloading processes are divided into two sections. In the first loading phase, the Qpoil line is vertically oriented and equidistant from the Q axis. Further loading is represented by an inclined line (second phase of loading). In the first phase of unloading, the Qpoil line is vertical, and in the second phase, it is inclined. The sections of the hysteresis loop that represent the second phase of loading, with different values of ΔQ, are all found on a single straight line. Similarly, the sections of the hysteresis loop that represent the second phase of unloading, corresponding to different values of ΔQ, are also located on a single straight line.
Figure 3c displays the poil-upist relationships obtained by loading the jack monotonically from zero to Qmax, and then unloading it monotonically back to zero. Similar to the previous figure (Figure 3a), each monotonic loading process, in the coordinate system (poil, upist), is represented by a line that originates from the coordinate system’s origin. The monotonic unloading process can be divided into two parts: the first segment is vertical and parallel to the poil axis, while the second segment reaches the point (0, 0). On the other hand, the poil-upist relationship shown in Figure 3d was obtained through cyclic loading of the jack. In this case, the relationship, just like in Figure 3b, is represented by four segments: two under increasing load and two during load reduction.
Figure 4a,b show the relationships between Q and upist for the same load changes as illustrated in Figure 3a,b. The hysteresis loops in Figure 4a,b have the same shapes as the corresponding loops in Figure 3a,b. Specifically, when the load increases monotonically from zero to a value of Qmax and then decreases back to zero, the hysteresis loop is characterized by the fact that the upist value is also zero when Q is zero. In contrast, for the cyclic loading ranging from (QmeanΔQ) to (Qmean + ΔQ), closed hysteresis loops were observed. These loops are characterized by two sections representing the loading and unloading cycles: vertical in the first loading and unloading phase and inclined to the axis in the second phase. The similarities between the Qupist and Qpoil diagrams described here indicate that the oil pressure, poil, is linearly correlated with the change in upist of the piston slide out.
In contrast, the QΔlcyl lines in Figure 5, which represent the change in Δlcyl length of the jack body supported by a parallelepiped, have a different shape. When a monotonic load varies from zero to Qmax and then decreases to zero, the lines representing load and relief do not perfectly coincide. As a result, the hysteresis loop formed has a much smaller area compared to the loops in Figure 3a and Figure 4a. Unlike all the lines in Figure 3 and Figure 4, the lines in Figure 5a do not start as straight lines. Instead, they have a shape similar to that of an exponential function graph. In the case of cyclic loading varying from (QmeanΔQ) to (Qmean + ΔQ), the line representing loading (in approximation) coincides with the line representing unloading (Figure 5b).

4. Discussion

To analyze the obtained results, the jack model was first defined. Then, the characteristics of the model were adopted, and subsequently, the values of these characteristics were determined.

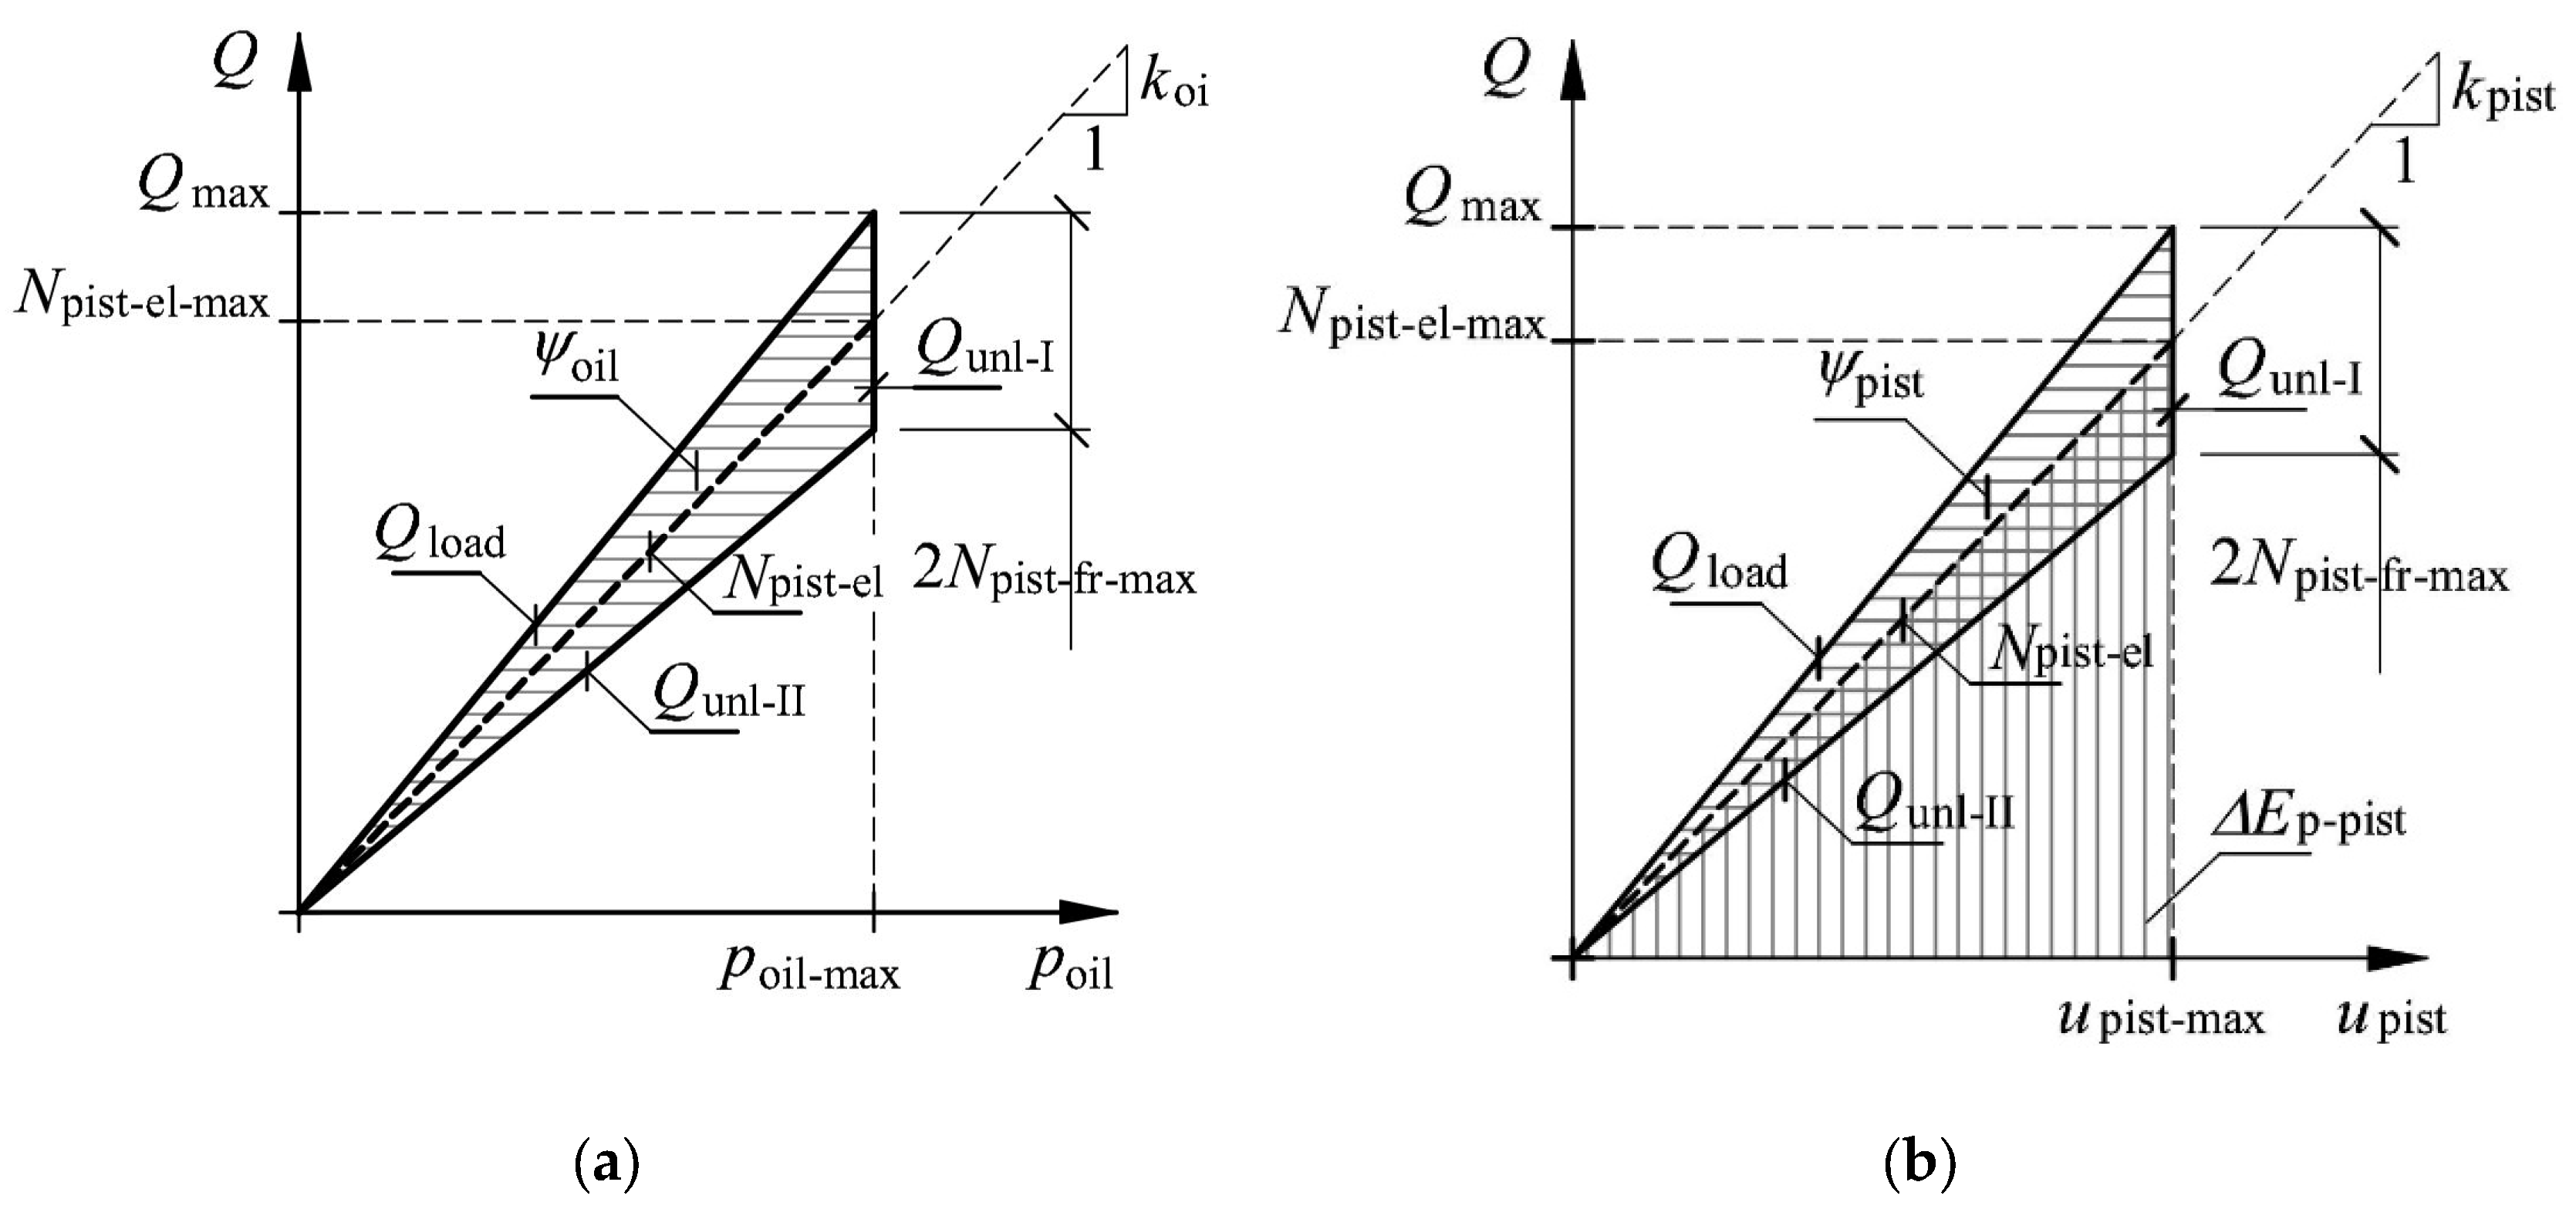
4.1. Model of the Jack

When explaining the deformation of the jack caused by the load Q, we assumed that the change in its length (Δljack) is a result of the extension of the piston (upist) and the changes in the length of the jack body supported by parallelepiped steel elements (Δlcyl)—as shown in Figure 6a. Therefore, the jack model consists of elements connected in series, representing the piston and the body supported by a parallelepiped element. The piston is represented by two elements connected in parallel: a linear-elastic element and an element with friction. On the other hand, the body supported by the parallelepiped is represented by a non-linear elastic element (Figure 6b).
We considered the mechanism for the piston sliding out (upist) and the changes in the length of the jack body supported by the parallelepiped (Δlcyl) separately. We took this approach to ensure clarity and flow in the analysis.
We assumed that the quasi-static external load Q is balanced by two internal forces acting on the piston in the jack: Npist-el resulting from the oil pressure (poil) and the internal friction force Npist-fr (Figure 6c). The value of the force Npist-el is calculated as the product of the oil pressure (poil) and the piston area (koil)
N p i s t e l = p o i l k o i l .
The sense of the internal friction force is opposite to the sense of the change in piston slide (Figure 6c), indicating that it has the opposite sign as the function sign (upist).
N p i s t f r = s g n u p i s t · N p i s t f r .
Tests conducted on a jack that is loaded monotonically show (see Figure 3a and Figure 4a) that the piston returns to its original position after being unloaded. This means that when Npist-el is zero, the internal friction force (Npist-fr) is also zero.
As the load Q increases, the oil pressure in the piston also increases, causing the internal forces Npist-el and Npist-fr to act in an upward direction (see Figure 6c). This phase of loading is referred to as Qload (see Figure 7a). The value of Q during this phase is
Q l o a d = N p i s t e l + N p i s t f r .
When the external load reaches its maximum value of Qmax, there is a maximum oil pressure, poil-max, in the jack resulting in a force of Npist-el-max, along with an internal friction of Npist-fr-max. At the beginning of the load-reducing process, the piston remains stationary and there is still a poil-max oil pressure present. This phase, represented by the line Qunl-I (Figure 7a), is characterized by a vertical direction of the Qpoil line. A change in the piston slide can only occur after the static friction force has been overcome and its maximum value has been surpassed. Further reduction in load is accompanied by an upward movement of the piston and a downward movement of the internal friction force. In Figure 7a, this phase of the cycle is shown by the line Qunl-II, while the load value is
Q u n l I I = N p i s t e l N p i s t f r .
The Qpoil diagram forms a hysteresis loop with an area called ψoil. Within this area, the internal frictional force Npist-fr performs work on the sections Qload and Qunl-II. The maximum value of this force, corresponding to poil-max, was determined from the relationship defining the area ψoil
N p i s t f r m a x = ψ o i l p o i l m a x .
The koil constant, which is equal to the surface area of the piston, has been identified
k o i l = Q m a x N p i s t f r m a x p o i l m a x .
In the adopted model, the Qupist relationship is represented by three lines on the graph (Figure 7b): Qload for the load path, while Qunl-I and Qunl-II for the unload path. These lines form a hysteresis loop with an area of ψpist. The loop is formed due to the work done by the internal frictional force Npist-fr, which changes from Npist-fr-max to its opposite value on the vertical section Qunl-I.
The internal elastic force Npist-el is calculated by multiplying the piston’s stiffness kpist with the change in its extension upist, as shown in equation
k p i s t = N p i s t e l u p i s t .
The maximum value of the internal elastic force, Npist-el-max, is related to the maximum internal friction force, Npist-fr-max, and the maximum load, Qmax, according to the following:
Q m a x = N p i s t e l m a x + N p i s t f r m a x .
By substituting the maximum values of Npist-el and upist into Equation (7), we can determine the stiffness of the piston, kpist. The energy absorption coefficient, χpist, is defined as the ratio of the energy ψpist absorbed during one cycle (represented by the horizontally hatched area in Figure 7b) to the change in potential energy ΔEp-pist (represented by the vertically hatched area) as shown in equation
χ p i s t = ψ p i s t Δ E p p i s t ,
where
Δ E p p i s t = k p i s t u p i s t 2 2 .
In addition, the secant stiffness of the piston, k ¯ p i s t , was defined. This stiffness is calculated by dividing the change in load force by the change in extension. The value of this stiffness can be determined using relation (11), which is derived from the designations in Figure 8
k ¯ p i s t = k p i s t Δ Q Δ Q N p i s t f r ,       g d y   Δ Q > N p i s t f r .
Relation (11) is applicable when the change in load surpasses the friction force.
In order to describe the second component of the change in the jack length, which is the change in the body length based on a parallelepiped element (Δlcyl), it is observed that the relationship QΔlcyl is not linear (Figure 5a,b). However, the lines representing loading and unloading almost coincide, allowing us to disregard inelastic forces. As a result, the load and internal elastic force are considered equal (Ncyl-el = Q). However, the internal elastic force Ncyl-el does not vary linearly with Δlcyl. The stiffness of the jack body, based on a parallelepiped element, increases. This increase is mainly due to an increase in the contact area between the jack base and the element on which the jack rests. The increase in contact area with increasing load is a result of imperfections in the parallelepiped element. Based on these assumptions, it is presumed that the stiffness kcyl increases linearly with the value of the internal elastic force Ncyl-el
k c y l = β c y l N c y l e l ,
where βcyl is the proportionality factor. Therefore, the change in length Δlcyl,max, caused by the load varying from zero to Qmax, is given by the integral.
Δ l c y l m a x = 0 N c y l e l m a x d N c y l e l β c y l N c y l e l .
Using Equation (13), the value of βcyl is determined as
β c y l = l n N c y l e l m a x Δ l c y l m a x .
The secant stiffness of the jack, k ¯ j a c k , which is the combination of the body stiffness connected in series with the jack stiffness, is calculated as
k ¯ j a c k = k ¯ p i s t k c y l k ¯ p i s t + k c y l .

4.2. Estimating the Characteristic Values of the Jack Model

In the upcoming sections, we will determine the values of the jack characteristics that were defined in Section 4.1.

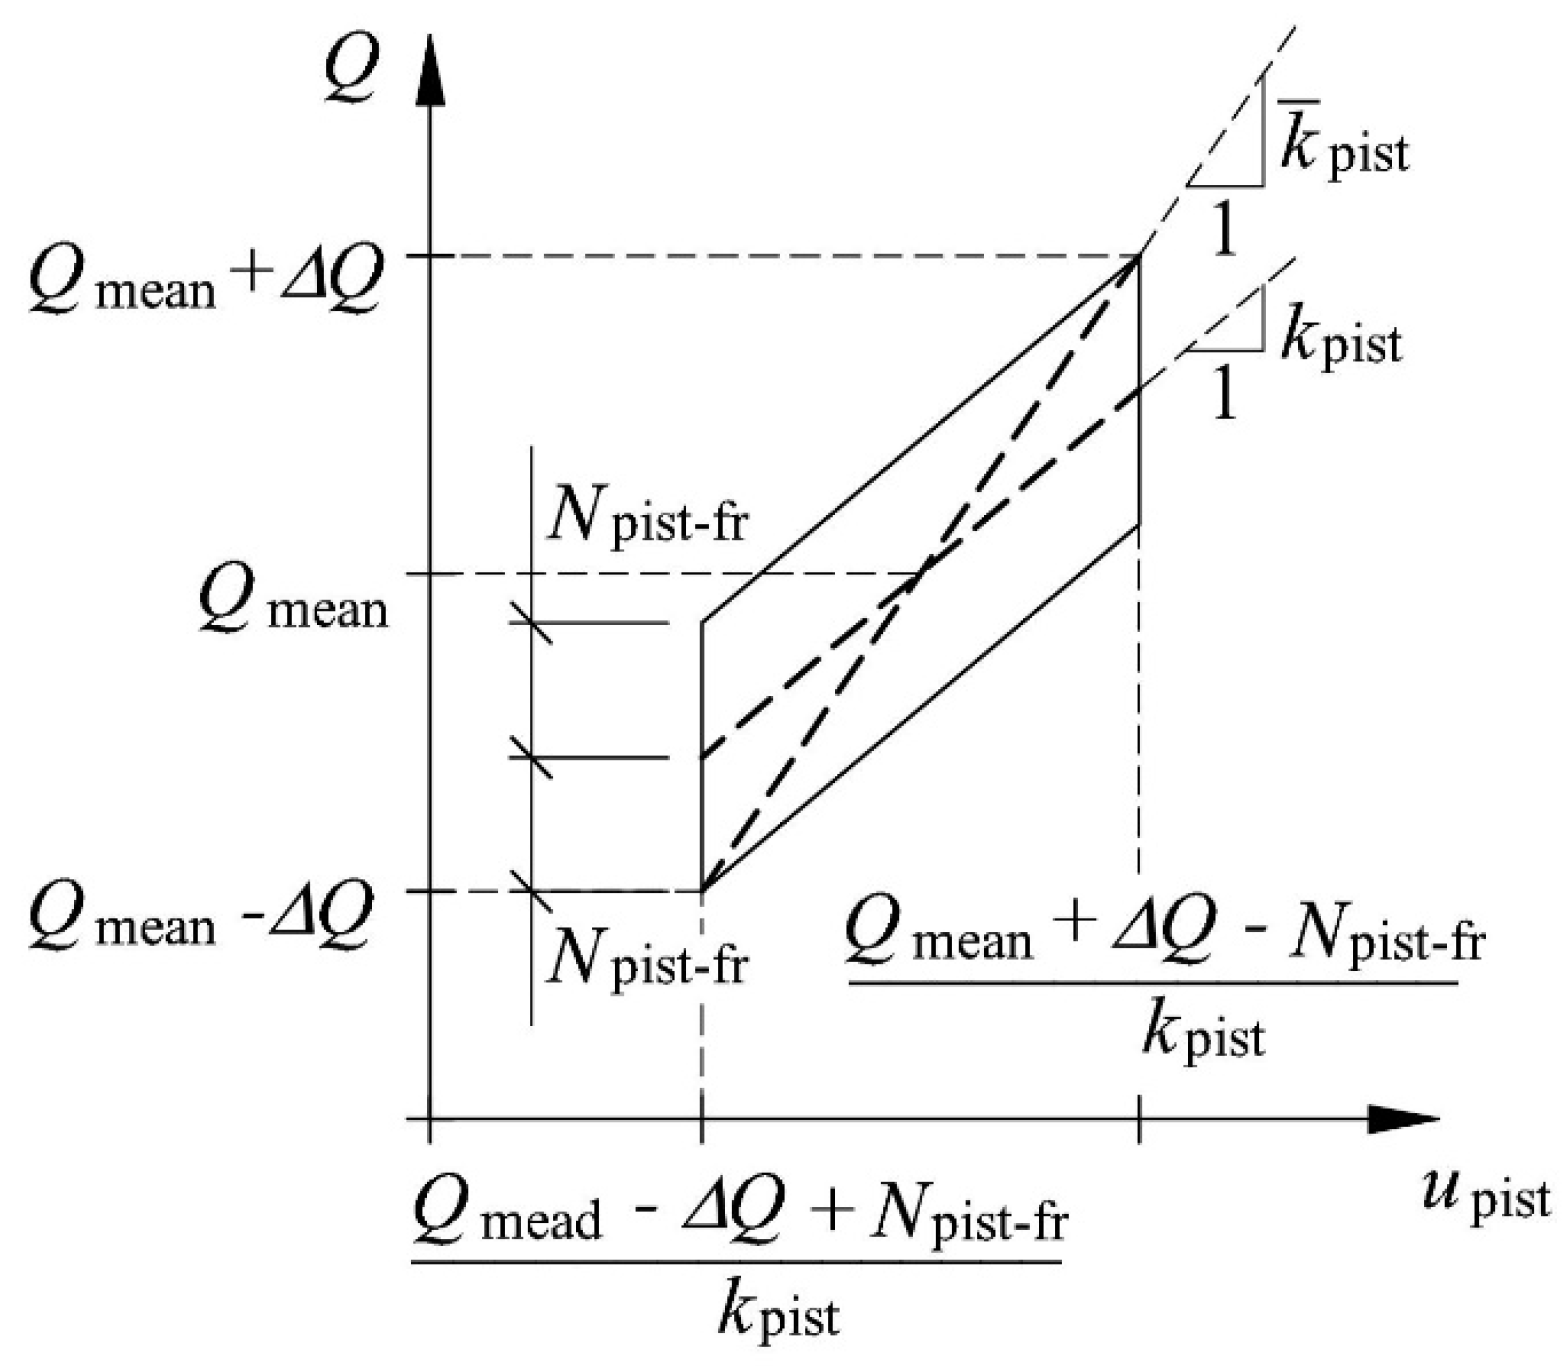
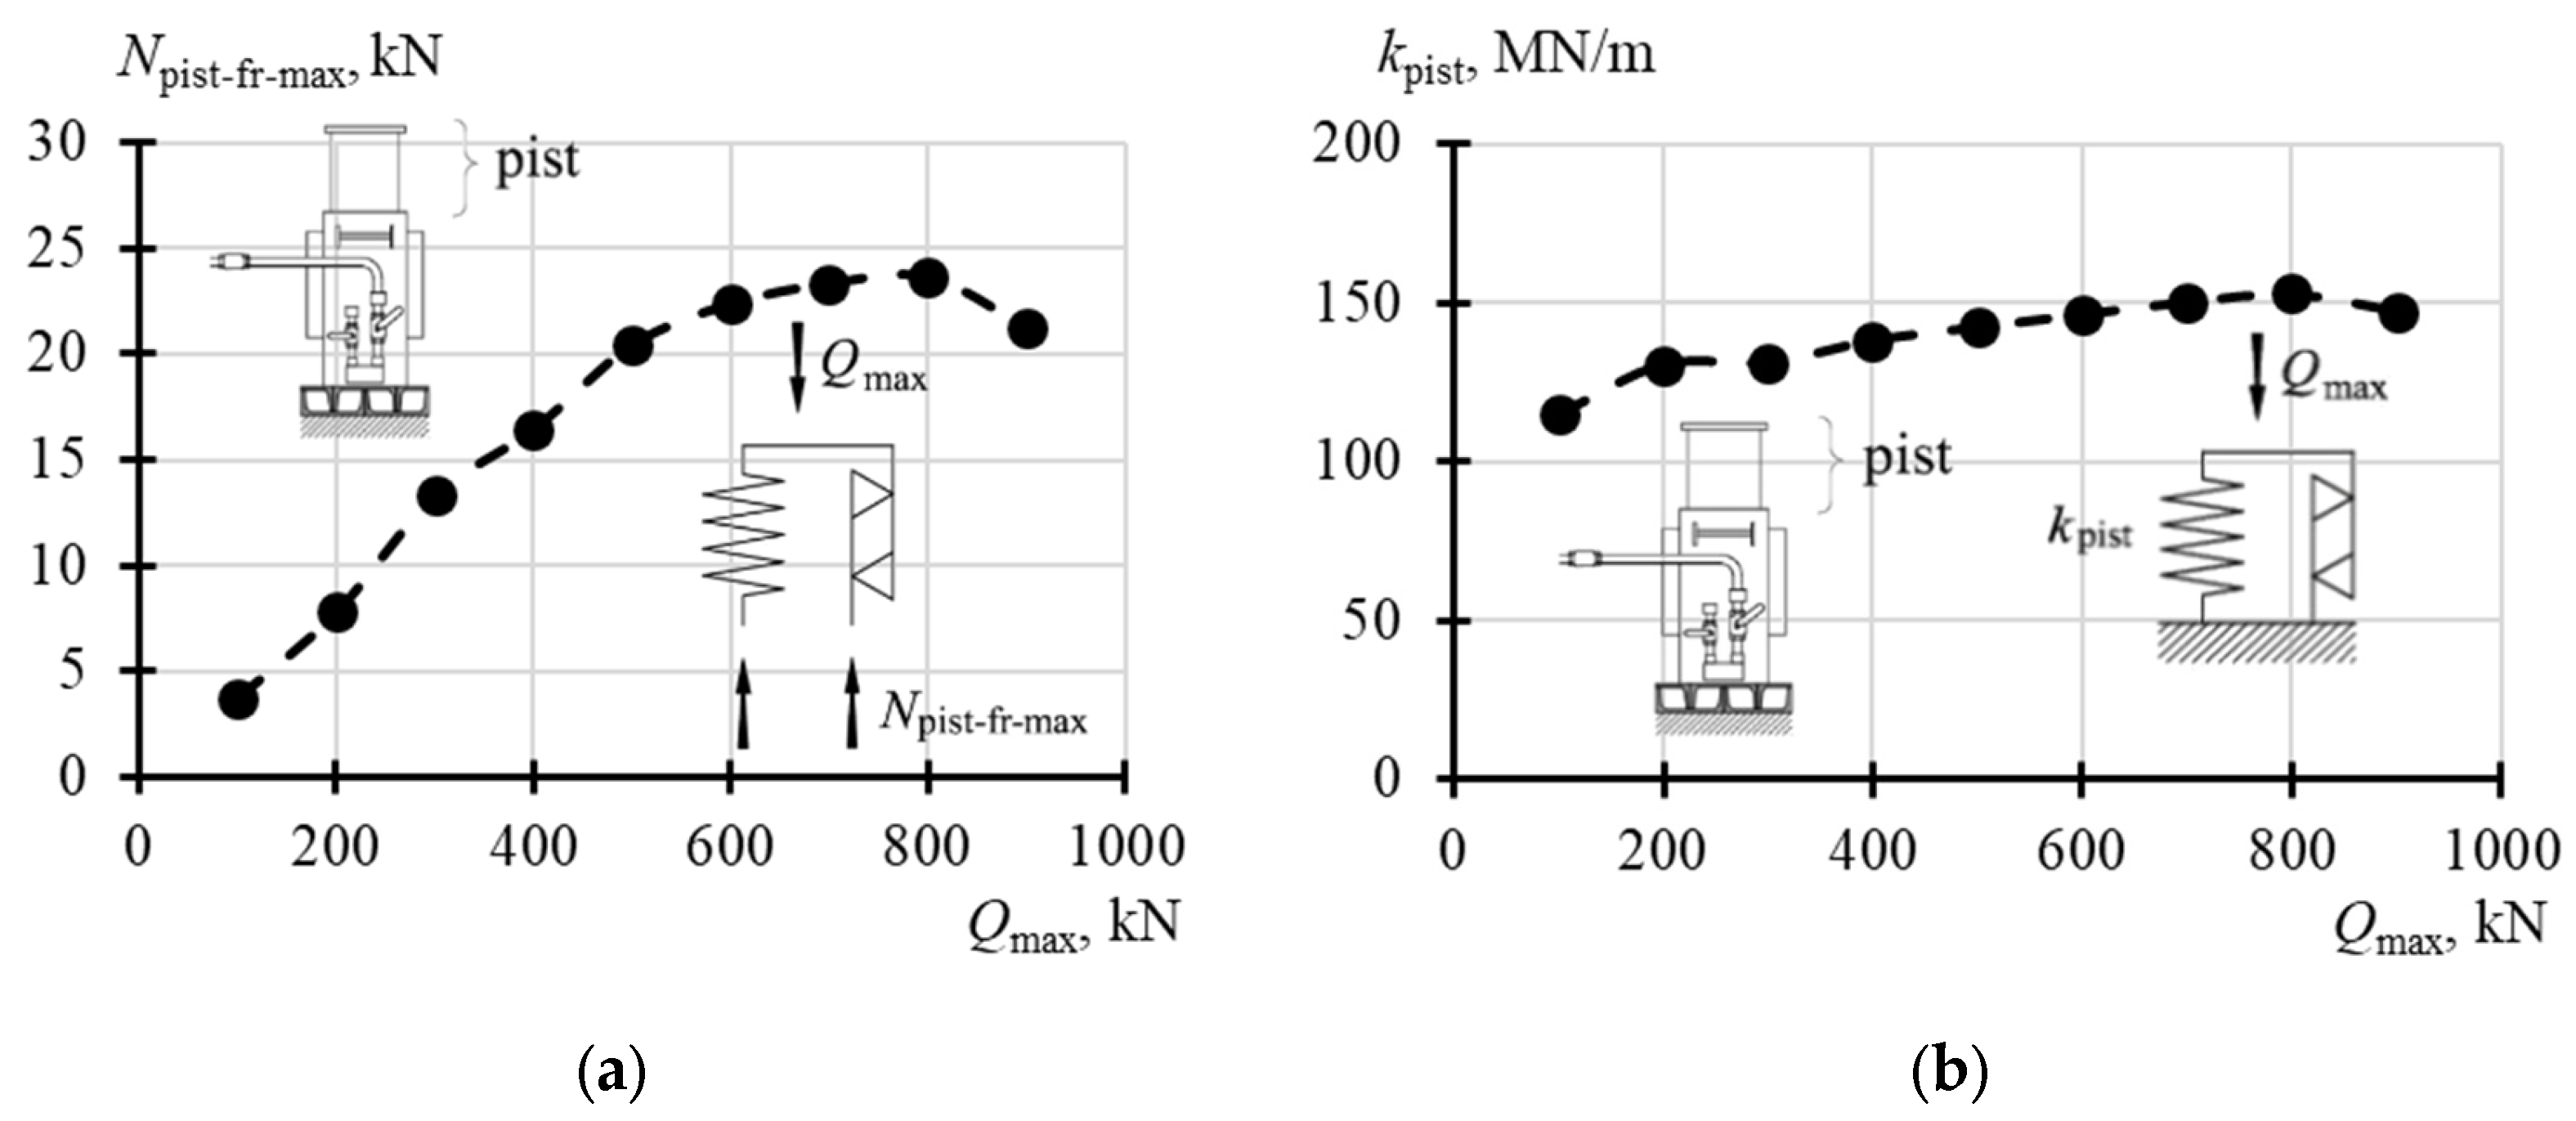
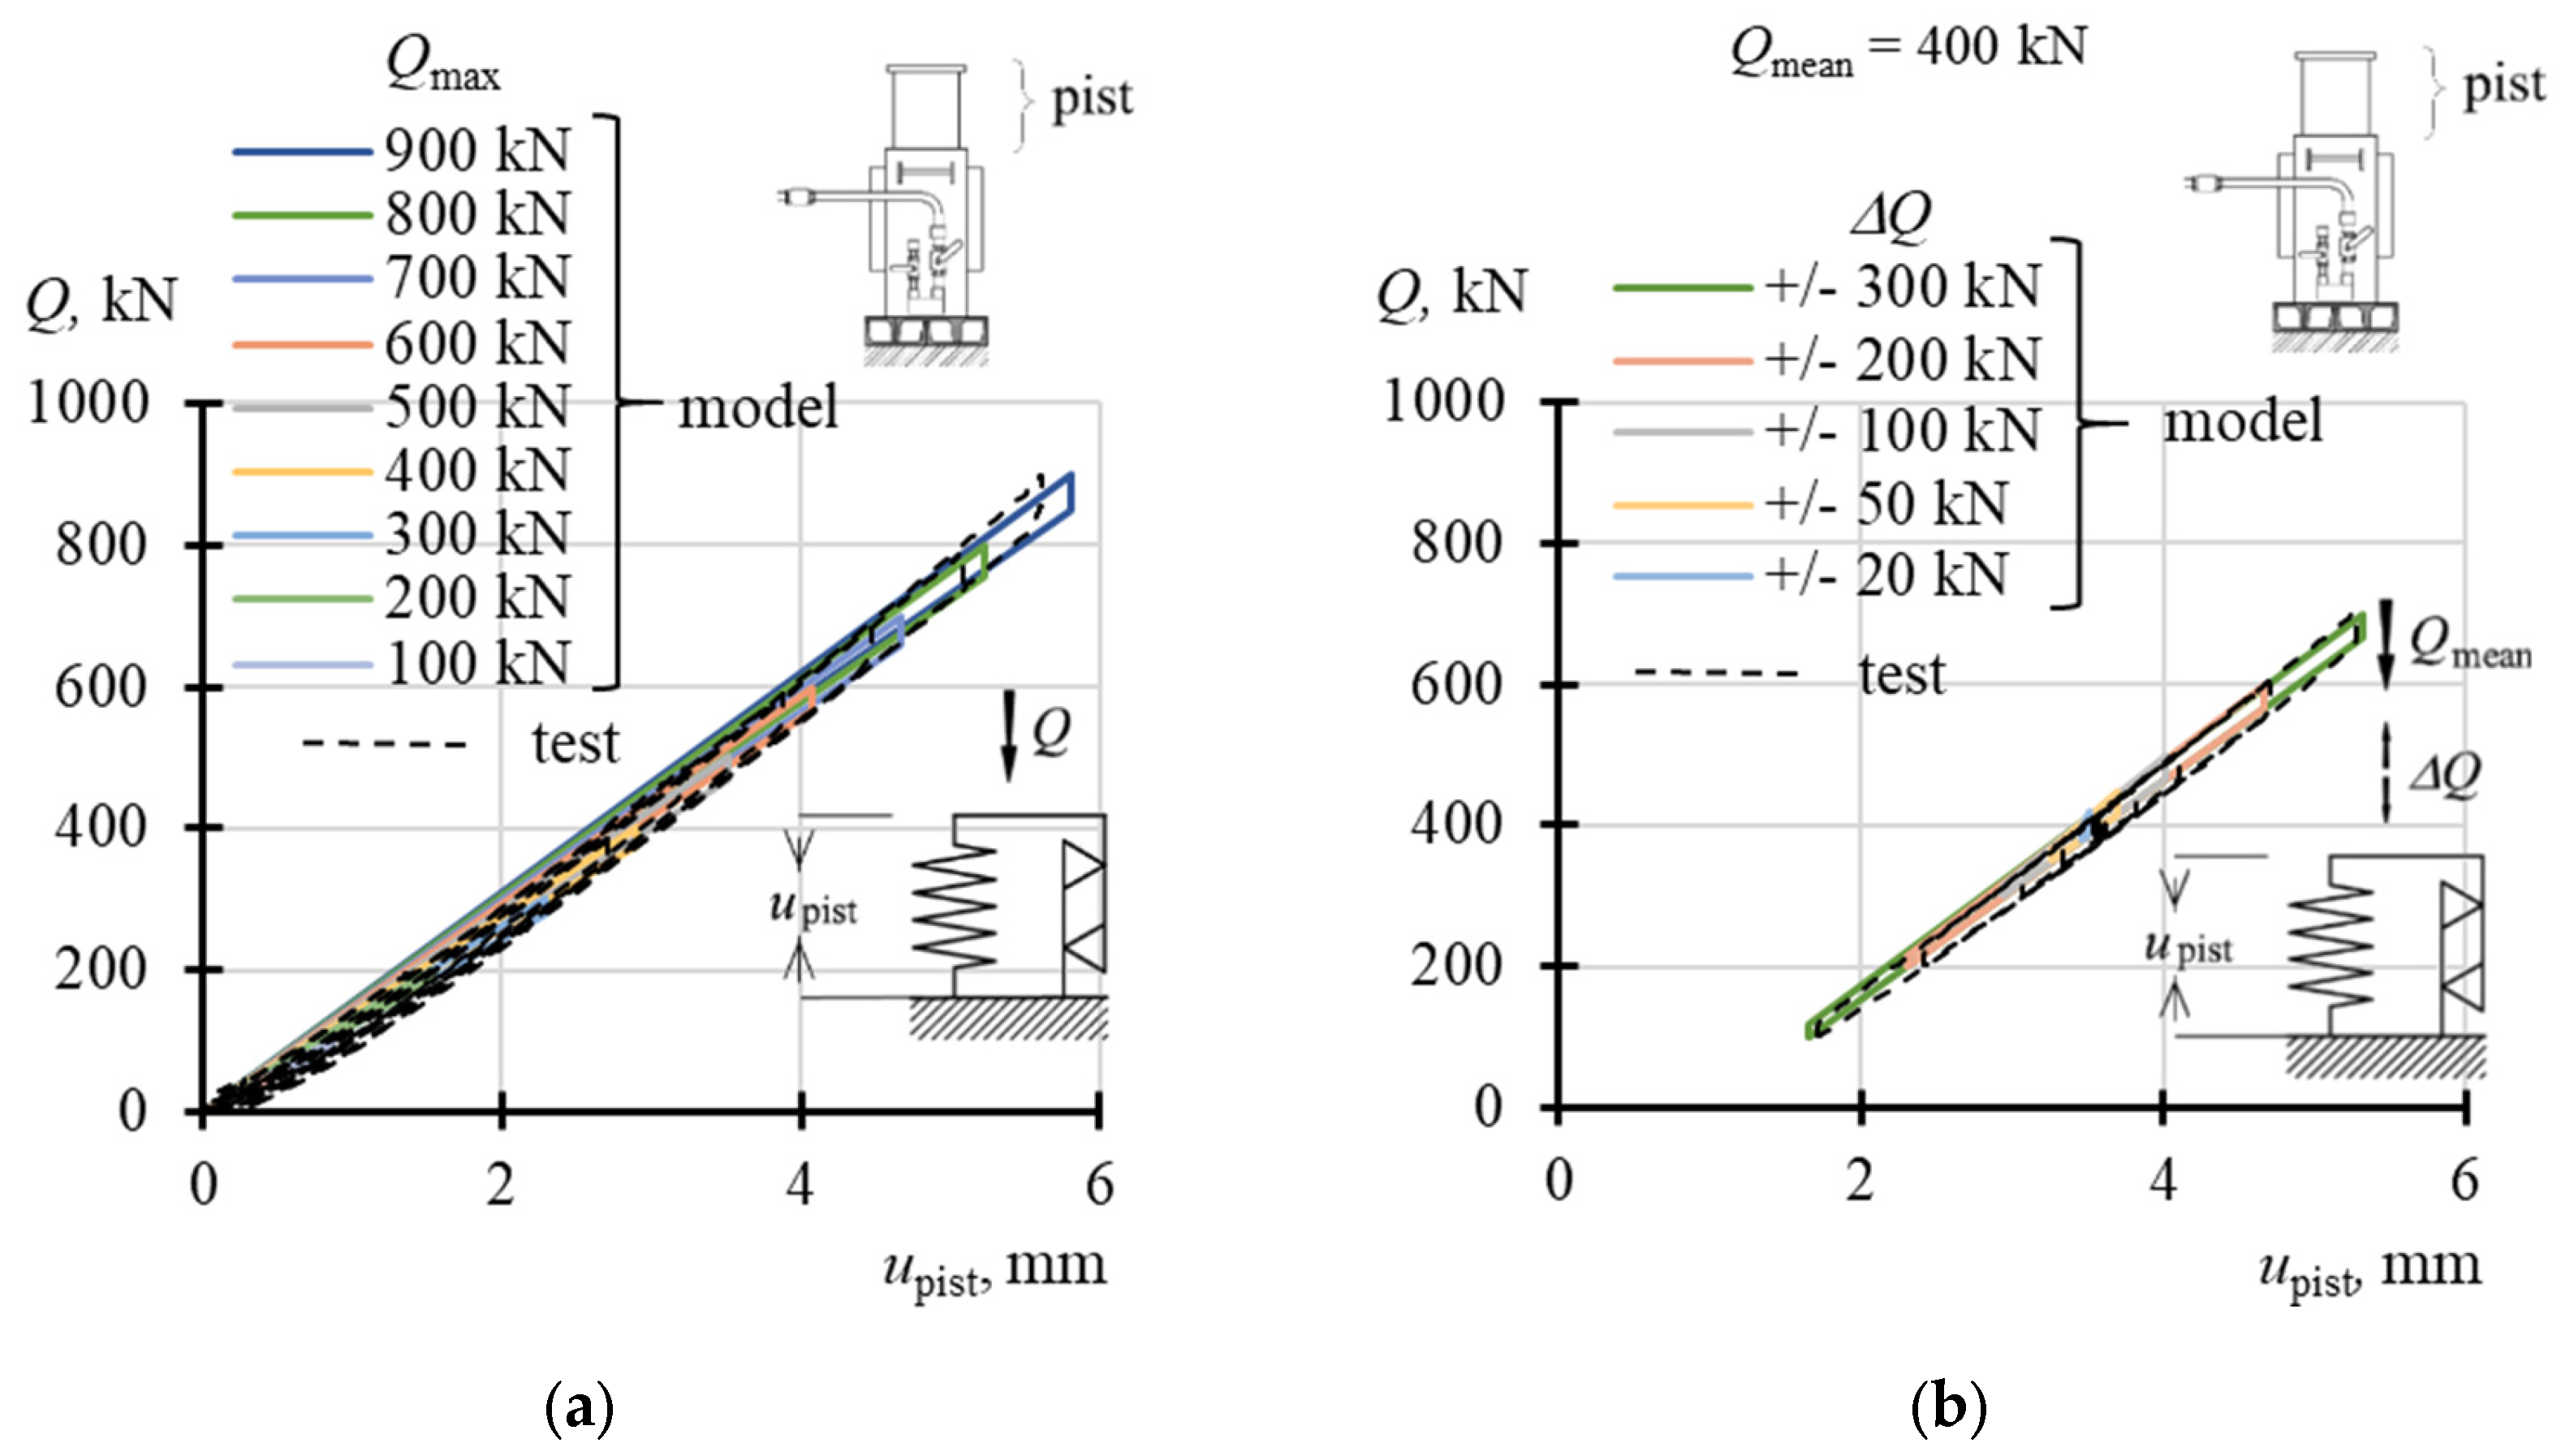
4.2.1. Stiffness kpist and Energy Dissipation Caused by Piston Slide Out

Based on tests of jacks loaded with a monotonically increasing force Q that varies from zero to Qmax and then monotonically decreases to zero, the following values were recorded for each loading process: Qmax, poil-max, upist-max, and Δlcyl-max. These values are summarized in Table 1. The hysteresis loop area (ψoil) was subsequently determined based on the recorded Qpoil relations using the following relationship
ψ o i l = 1 2 i Q i p o i l , i + 1 p o i l , i 1 .
Then, the following values were determined: Npist-fr-max from Equation (5), koil from Equation (6), Npist-el-max from Equation (8), and kpist from Equation (7). These values are shown in Table 1.
Figure 9a illustrates the maximum values of the internal friction force acting on the piston (Npist-fr-max) as a function of the maximum load value (Qmax). The value of Npist-fr-max increases as Qmax increases. For Qmax equal to 100 kN, the value of Npist-fr-max is 3.75 kN, and for Qmax = 800 kN, it is 23.69 kN.
The internal frictional force, Npist-fr, represents approximately 3.0% to 6.4% of the external load (Q). The stiffness, kpist, remains relatively constant regardless of changes in Q, ranging from 115 MN/m for Qmax = 100 kN to 153 MN/m for Qmax = 800 kN (Figure 9b). The average stiffness of kpist, for a load Q between 100 kN and 800 kN, is 138 MN/m.
Based on the determined parameter values, graphs can be drawn to illustrate the changes in the piston slide out. Figure 10a shows the hysteresis loop of the model, depicting the change in upist under a monotonically varying load from zero to Qmax. In the (Q, upist) coordinate system, the relationships corresponding to different values of Qmax are plotted with solid lines. When the load increases monotonically from zero to a value of Qmax, the Qupist relationship is described by Equation (3). When the load decreases from Qmax to a value of Qmax − 2⋅Npist-fr-max, the Qupist relationship is represented by straight lines parallel to the Q axis. For load values less than Qmax − 2⋅Npist-fr-max, Equation (4) applies. In Figure 10a, the dotted lines show the corresponding relationships obtained from the tests and derived from Figure 4a. This demonstrates the correspondence between the developed model and the test results.
In contrast, Figure 10b shows the hysteresis loop of the model, depicting the change in upist in the case of the cyclic load for Qmean = 400 kN and different values of ΔQ. It is important to note that the piston slide out does not occur if the change in ΔQ is small. This is because there are internal frictional forces that need to be overcome for the piston to slide out. The magnitude of these forces increases as the value of Qmean increases. In Figure 10b, the dotted line shows the corresponding relationships obtained from the tests and derived from Figure 4b. Again, the correspondence between the developed model and the test results can be observed.

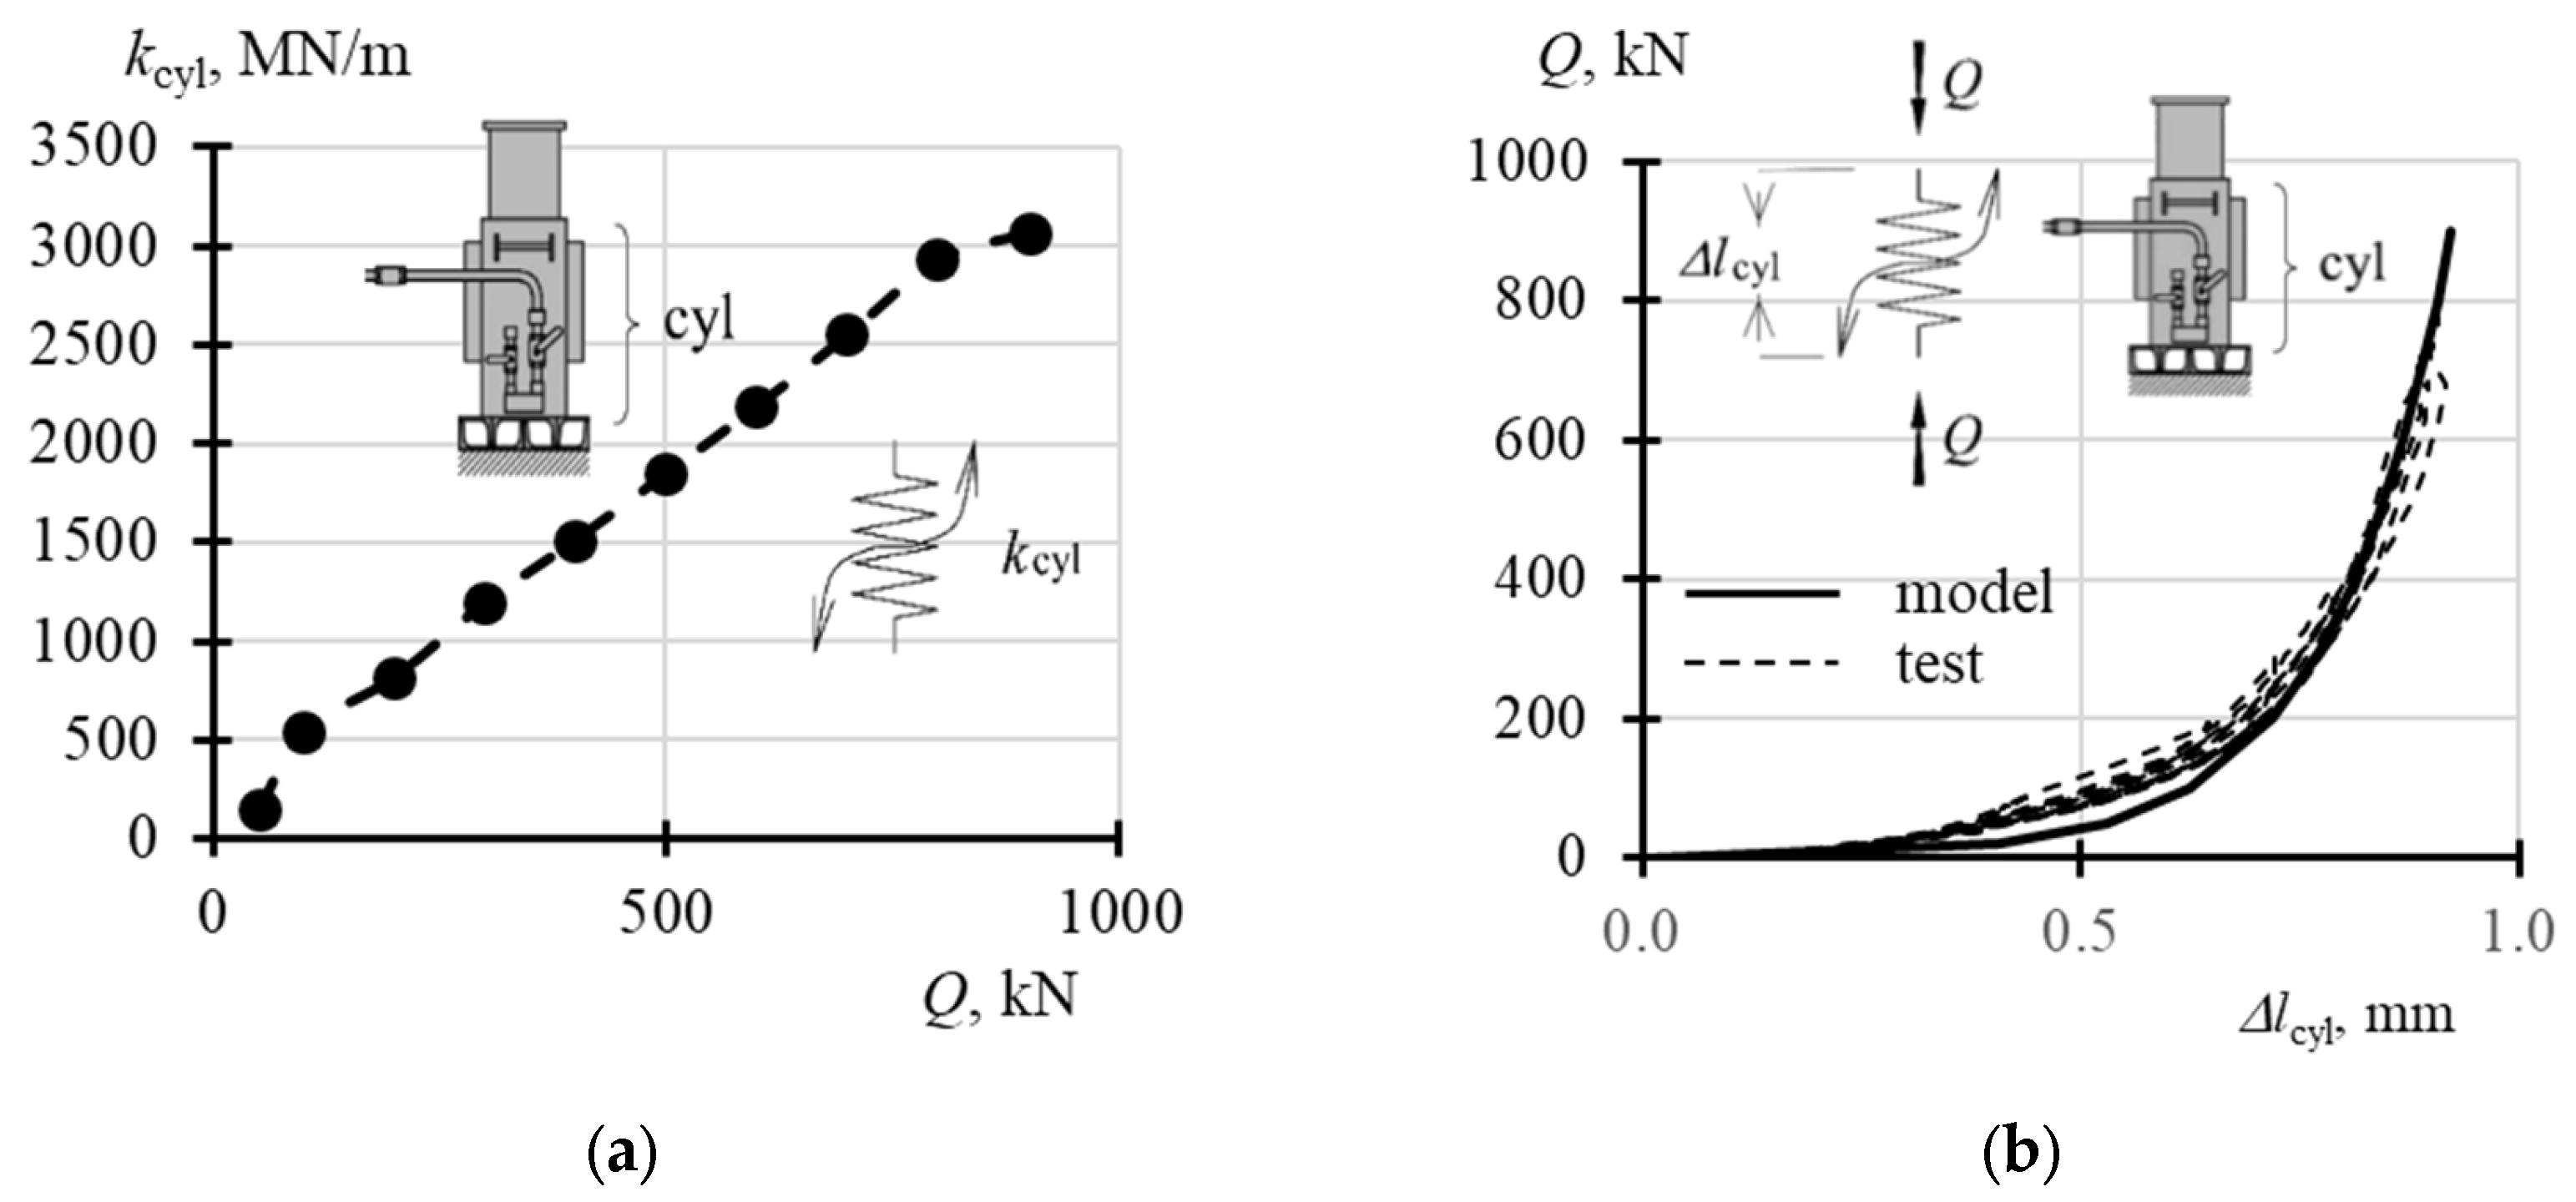
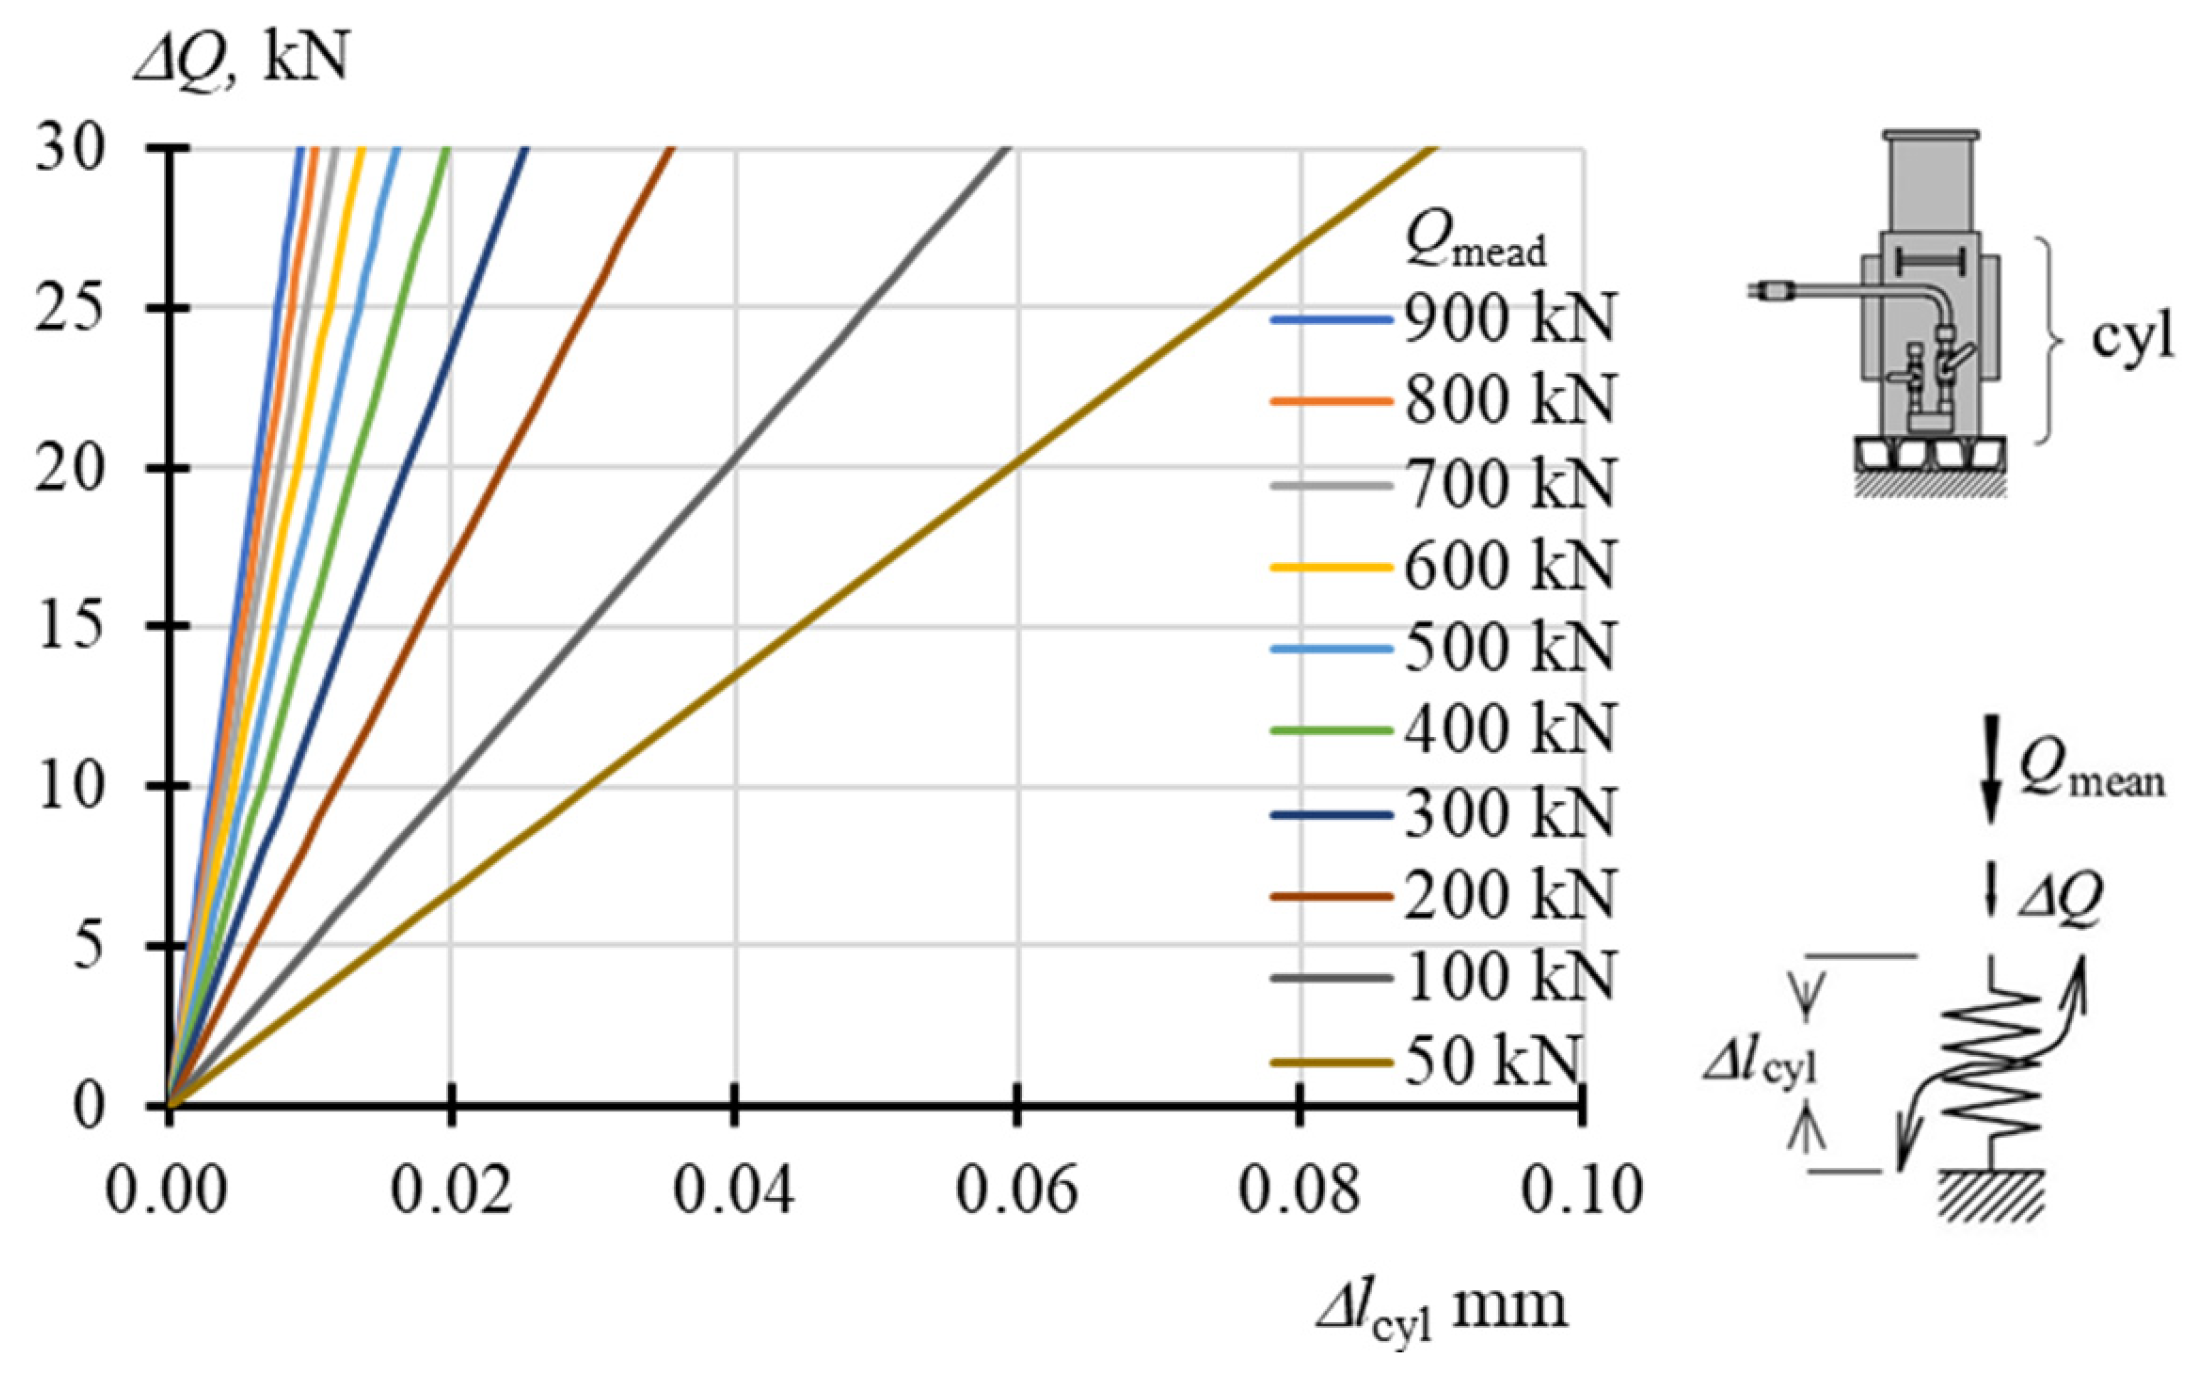
4.2.2. Stiffness kcyl

The stiffness of the jack body resting on a parallelepiped element, kcyl, is determined by multiplying βcyl by the internal elastic force, Ncyl-el (12). In our model, we assume that the value of Ncyl-el is equal to the load, Q, as there are no frictional forces acting in the direction of the load where the jack is supported. The values of βcyl and kcyl, calculated using Equations (12) and (14), are summarized in Table 2. The value of βcyl remains relatively constant regardless of the load, with an average value of 3.85. On the other hand, the stiffness of kcyl depends on the load. For a load of Q = 100 kN, the value of kcyl is 546 MN/m, while for a load of Q = 800 kN, the value of kcyl is 2930 MN/m. This shows that the stiffness of kcyl increases as the force loading the jack increases (Figure 11a). Since βcyl remains approximately constant, the increase in kcyl stiffness is a linear function of the load, Q. The change in length, Δlcyl, as a function of Q and using the determined characteristics, was calculated according to Equation (13) by assuming Ncyl-el-max = Qmax and medium value βcyl equal to 3.85. The result is graphically presented in Figure 11b. In the same figure, the results of the QΔlcyl relationship obtained from tests and derived from Figure 5a are plotted. We can observe slight differences between the results of the model calculations and the test results in this figure. These differences can be attributed to the use of the mean value as βcyl.
In Figure 12, the change in Δlcyl for Qmean values of 50, 100, 200, …, 900 kN and various load changes, ΔQ, is illustrated. It is clear that as the Qmean value increases, the corresponding change in length, Δlcyl, decreases for the same value of ΔQ.

4.2.3. Jack Stiffnesses kjack

Above, in Section 4.1, we defined the structural model of the jack as a combination of piston and body models based on a parallelepiped element (Figure 6b). Therefore, the change in jack length (Δljack) is the sum of the change in piston slide out (upist) and the change in body length (Δlcyl). Figure 13a illustrates the Δljack changes induced by different values of ΔQ for various Qmean values. In each of the plotted relations in Figure 13a, two phases can be observed. In the first phase, when the Δljack length changes are up to approximately 0.01 mm–0.02 mm, only the jack body resting on the parallel-walled element is deformed. Piston extension does not occur due to the internal friction forces not being overcome. Hence, the lines ΔljackΔQ have a steep slope, with a greater slope corresponding to larger Qmean values. In the second phase, when the piston stroke has already occurred, the slope of the lines in Figure 13a becomes smaller and almost identical for all Qmean values. The secant stiffnesses k ¯ p i s t , determined according to (11), are included in Figure 13b.
The graph illustrates that when there is a slight change in the force value in the jack (ΔQNpist-fr), the secant stiffness k ¯ p i s t becomes extremely high. However, as the force value increases by about 60 kN, the k ¯ p i s t values approach the stiffness values of kpist. The secant stiffnesses of the jacks ( k ¯ j a c k ), determined according to Equation (14), are shown in Figure 14. The change in these stiffnesses follows a similar pattern as the change in the secant stiffness k ¯ p i s t , except that for ΔQNpist-fr, the k ¯ j a c k value is not unlimited and takes on the value of kcyl. Based on this information, we can conclude that the stiffness of the jacks used for rectification is primarily influenced by the stiffness of the piston, which extends due to the external load Q. The piston extension is only possible if the change in the jack load exceeds the value of the internal friction force.
When defining the model of the jack subjected to cyclic loading, we considered its actual structure. This allowed for a physical interpretation of the elastic and inelastic internal forces. However, in some cases, it is not possible to take this approach. In those situations, rheological material models [35,36,37] and numerical models [38,39] are used to describe the internal forces.

5. Conclusions

The change in length of the hydraulic jack used to rectify buildings tilted from vertical is determined by two factors: the slide out of the piston and the change in length of the jack’s body resting on parallelepiped steel elements. During the rectification process, this jack is subjected to both monotonic and cyclic loading. Monotonic loading refers to the gradual increase in the load from zero to its maximum value, and then a subsequent decrease back to zero. On the other hand, cyclic loading involves the fluctuation of the load relative to a constant load value. The constant load value results from the weight of the building, while the change in load is caused by the impact of neighboring jacks during the rectification process.
Based on laboratory tests, it was determined that under monotonic loading, the relationship between load and piston slide can be divided into three segments. The load phase, represented in the load force—piston slide out coordinates—begins at the origin of the coordinate system. On the other hand, the unloading process consists of two segments: the first segment is vertical and parallel to the vertical load axis, while the second segment tends toward the origin of the coordinate system. The shape of the hysteresis loop remains the same, regardless of the maximum load value.
During cyclic loading, which occurs in a constant force environment, hysteresis loops are also formed in the load–unload relationships. The loading and unloading processes are represented by two sections. The first loading phase and the first unloading phase are represented by vertical sections. Subsequent loading and unloading are represented by segments inclined with respect to the axis of the coordinate system. The segments of the hysteresis loop that represent the second loading phase and the second unloading phase are parallel to each other.
In contrast, the lines depicting load–jack body length changes have a different shape. Regardless of the type of load, these lines resemble the graph of an exponential function. With monotonic loading, these curves originate from the origin of the coordinate system.
A structural model of the jack, composed of three elements, has been proposed. It consists of a linearly elastic element connected in parallel with a frictional force element, as well as a nonlinear elastic element connected in series with them. Displacements of the linear elastic element occur when the external load surpasses the frictional force, while displacements of the nonlinear elastic element occur regardless of the external load value.
The stiffness of the linear elastic element, which changes in length to represent the piston’s slide out, remains approximately constant with an average of 137 MN/m. The value of the friction force varies depending on the load, ranging from 9.78 kN at a load of 50 kN to 21.31 kN at a load of 900 kN. The stiffness of the non-linear elastic element also varies with the load, ranging from 152 MN/m at a load of 100 kN to 3065 MN/m at a load of 900 kN.
This defined structural model of the jack serves as the basis for further research and the development of a method to rectify vertically tilted buildings by unevenly lifting them with jacks. One of the major strengths of this model lies in its universal applicability, as it can be easily adapted for use with other types of jacks.

Author Contributions

Conceptualization, K.G.; methodology, K.G.; software, K.G., M.S. and M.D.; validation, K.G. and M.S.; formal analysis, M.D.; investigation, K.G. and M.S.; writing—original draft preparation, K.G.; writing—review and editing, K.G., M.S. and M.D.; visualization, K.G., M.S. and M.D.; funding acquisition, K.G. and M.D. All authors have read and agreed to the published version of the manuscript.

Funding

Publication supported by—the Initiative of Excellence—Research University program implemented at the Silesian University of Technology, year 2023, grant number 03/020/SDU/10-21-01. This article has been produced as part of an international cooperation project funded by the Polish National Agency for Academic Exchange (NAWA), under Decision No. BWS/BIL/2022/1/00275/DEC/I/1.

Data Availability Statement

The original contributions presented in the study are included in the article, further inquiries can be directed to the corresponding author.

Conflicts of Interest

The authors declare no conflicts of interest.

References

  1. Zaretskii, Y.K.; Kapustin, V.K.; Lushnikov, V.V.; Sukanov, V.I. Predicting the Stability of the Nev’yansk Tower. Soil. Mech. Found. Eng. 1981, 18, 242–247. [Google Scholar] [CrossRef]
  2. Burland, J.B.; Jamiolkowski, M.; Viggiani, C. The Stabilisation of the Leaning Tower of Pisa. Soils Found. 2003, 43, 63–80. [Google Scholar] [CrossRef]
  3. Burland, J.; Jamiolkowski, M.; Viggiani, C. Preserving Pisa’s Treasure. Civil Eng. 2002, 72, 42–49. [Google Scholar]
  4. Abruzzese, D.; Miccoli, L.; Yuan, J. Mechanical Behavior of Leaning Masonry Huzhu Pagoda. J. Cult. Herit. 2009, 10, 480–486. [Google Scholar] [CrossRef]
  5. Yonglin, S.; Lixin, W.; Zhi, W. Identification of Inclined Buildings from Aerial LIDAR Data for Disaster Management. In Proceedings of the 2010 18th International Conference on Geoinformatics, Beijing, China, 18–20 June 2010; IEEE: New York, NY, USA, 2010; pp. 1–5. [Google Scholar]
  6. Tokimatsu, K.; Hino, K.; Suzuki, H.; Ohno, K.; Tamura, S.; Suzuki, Y. Liquefaction-Induced Settlement and Tilting of Buildings with Shallow Foundations Based on Field and Laboratory Observation. Soil. Dyn. Earthq. Eng. 2019, 124, 268–279. [Google Scholar] [CrossRef]
  7. Dudek, M.; Rusek, J.; Tajduś, K.; Słowik, L. Analysis of Steel Industrial Portal Frame Building Subjected to Loads Resulting from Land Surface Uplift Following the Closure of Underground Mine. Arch. Civil Eng. 2021, LXVII, 283–298. [Google Scholar] [CrossRef]
  8. Macchi, G. Stabilization of the Leaning Tower of Pisa. In Proceedings of the Structures Congress 2005, New York, NY, USA, 20–24 April 2005; American Society of Civil Engineers: New York, NY, USA, 2005; pp. 1–11. [Google Scholar]
  9. Gromysz, K. Revitalisation of a Vertically Deflected Historical 16th Century Bell Tower. IOP Conf. Ser. Mater. Sci. Eng. 2019, 471, 052025. [Google Scholar] [CrossRef]
  10. Zhang, X.; Shan, R.; Lu, M. Rectification of Jacking Method for Brick-Wooden Buildings in Deformation Analysis with CFST Reinforcement. Struct. Des. Tall Spec. Build. 2018, 27, e1439. [Google Scholar] [CrossRef]
  11. Kaszowska, O.; Gruchlik, P.; Mika, W. Industrial Chimney Monitoring-Contemporary Methods. E3S Web Conf. 2018, 36, 01005. [Google Scholar] [CrossRef]
  12. Pellegrinelli, A.; Furini, A.; Russo, P. Earthquakes and Ancient Leaning Towers: Geodetic Monitoring of the Bell Tower of San Benedetto Church in Ferrara (Italy). J. Cult. Herit. 2014, 15, 687–691. [Google Scholar] [CrossRef]
  13. Gromysz, K. Analysis of Parameters of a Rectified Tank on the Basis of In-Situ Tests. Materials 2021, 14, 3881. [Google Scholar] [CrossRef] [PubMed]
  14. Liu, Y.; Liu, Z. Study on Stabilization and Rectification Technology for Inclined Transmission Tower. Rock. Soil. Mech. 2008, 29, 173–176. [Google Scholar]
  15. Baracous, A. The Foundation Failure of the Transcona Grain Elevator. Eng. J. 1957, 40, 973–977. [Google Scholar]
  16. Maffei, C.E.M.; Gonçalves, H.H.S. Innovative Techniques Used to Plumb Two 57 m Height Concrete Buildings Leaning 3.8 and 3.1%. Innov. Infrastruct. Solut. 2016, 1, 33. [Google Scholar] [CrossRef]
  17. Shi, M.L.; Zhang, H.; Zhang, R.K. The Inclination of Bridge Pier Due to Neighboring Embankment Construction and Its Rectification Technique. Appl. Mech. Mater. 2013, 353–356, 79–83. [Google Scholar] [CrossRef]
  18. Peng, C. The Application of Dynamic Replacement Method in Deviation Rectification of Support Pile. IOP Conf. Ser. Earth Environ. Sci. 2017, 61, 012099. [Google Scholar] [CrossRef]
  19. Yuan, G.; Shu, Q.; Zhang, Y.; Liu, T.; Ji, Y.; Xu, G. Model Experiment on Anti-Deformation Performance of a Self-Supporting Transmission Tower in a Subsidence Area. Int. J. Min. Sci. Technol. 2012, 22, 57–61. [Google Scholar] [CrossRef]
  20. Rapoport, V.; Alford, J. Preloading of Independent Leg Units at Locations with Difficult Seabed Conditions. Mar. Struct. 1989, 2, 451–462. [Google Scholar] [CrossRef]
  21. Terracina, F. Foundations of the Tower of Pisa. Géotechnique 1962, 12, 336–339. [Google Scholar] [CrossRef]
  22. Pesci, A.; Casula, G.; Boschi, E. Laser Scanning the Garisenda and Asinelli Towers in Bologna (Italy): Detailed Deformation Patterns of Two Ancient Leaning Buildings. J. Cult. Herit. 2011, 12, 117–127. [Google Scholar] [CrossRef]
  23. Kratzsch, H. Mining Subsidence Engineeting; Springer: Berlin/Heiderberg, Germany; New York, NY, USA, 1983. [Google Scholar]
  24. Orwat, J. Influence of Discontinuous Linear Deformation on the Values of Continuous Deformations of a Mining Area and a Building Induced by an Exploitation of Hard Coal Seam. Appl. Sci. 2023, 13, 3549. [Google Scholar] [CrossRef]
  25. Yilmaz, I.; Marschalko, M. A Leaning Historical Monument Formed by Underground Mining Effect: An Example from Czech Republic. Eng. Geol. 2012, 133–134, 43–48. [Google Scholar] [CrossRef]
  26. Peck, R.B.; Bryant, F.G. The Bearing-Capacity Failure of the Transcona Elevator. Géotechnique 1953, 3, 201–208. [Google Scholar] [CrossRef]
  27. Squeglia, N.; Stacul, S.; Abed, A.A.; Benz, T.; Leoni, M. M-PISE: A Novel Numerical Procedure for Pile Installation and Soil Extraction. Application to the Case of Leaning Tower of Pisa. Comput. Geotech. 2018, 102, 206–215. [Google Scholar] [CrossRef]
  28. Yin, H.P.; Li, C.L.; Xie, Z.Y. Analysis on Deviation Rectification and Reinforcement of Buildings. Adv. Mater. Res. 2011, 255–260, 59–64. [Google Scholar] [CrossRef]
  29. Elsawwaf, A.; El Sawwaf, M.; Farouk, A.; Aamer, F.; El Naggar, H. Restoration of Tilted Buildings via Micropile Underpinning: A Case Study of a Multistory Building Supported by a Raft Foundation. Buildings 2023, 13, 422. [Google Scholar] [CrossRef]
  30. Gromysz, K.; Szoblik, Ł.; Cyrulik, E.; Tanistra-Różanowska, A.; Drabczyk, Z.; Jancia, S. Analysis of Stabilisation Method of Gable Walls of a Barrack Located at the Section BI of the Former KL Auschwitz II-Birkenau. MATEC Web Conf. 2019, 284, 08004. [Google Scholar] [CrossRef]
  31. Gromysz, K. Moving and Straightening the Building Segment. IOP Conf. Ser. Mater. Sci. Eng. 2019, 471, 052026. [Google Scholar] [CrossRef]
  32. Gromysz, K. A Bar Model of a Temporary Wooden Support Used to Remove Deflections of Buildings. J. Phys. Conf. Ser. 2021, 1781, 012024. [Google Scholar] [CrossRef]
  33. Gromysz, K. In Situ Experimental Study on the Active Support Used for Building Rectification. Materials 2020, 13, 2015. [Google Scholar] [CrossRef]
  34. Smolana, M.; Gromysz, K. Effect of Eccentricity of Applied Force and Geometrical Imperfections on Stiffness of Stack of Cuboidal Steel Elements. Materials 2020, 13, 3174. [Google Scholar] [CrossRef] [PubMed]
  35. Pichler, F.; Witteveen, W.; Fischer, P. A Complete Strategy for Efficient and Accurate Multibody Dynamics of Flexible Structures with Large Lap Joints Considering Contact and Friction. Multibody Syst. Dyn. 2017, 40, 407–436. [Google Scholar] [CrossRef]
  36. Zhang, D.; Scarpa, F.; Ma, Y.; Boba, K.; Hong, J.; Lu, H. Compression Mechanics of Nickel-Based Superalloy Metal Rubber. Mater. Sci. Eng. A 2013, 580, 305–312. [Google Scholar] [CrossRef]
  37. Beck, J.L.; Pei, J.-S. Demonstrating the Power of Extended Masing Models for Hysteresis through Model Equivalencies and Numerical Investigation. Nonlinear Dyn. 2022, 108, 827–856. [Google Scholar] [CrossRef]
  38. Nogueiro, P.; Silva, L.S.; Bento, R.; Simões, R. Calibration of Model Parameters for the Cyclic Response of End-Plate Beamto-Column Steel-Concrete Composite Joints. Steel Compos. Struct. 2009, 9, 39–58. [Google Scholar] [CrossRef]
  39. Wojewoda, J.; Stefański, A.; Wiercigroch, M.; Kapitaniak, T. Hysteretic Effects of Dry Friction: Modelling and Experimental Studies. Phil. Trans. R. Soc. A 2008, 366, 747–765. [Google Scholar] [CrossRef]
Figure 1. Rectification of a building using jacks: (a) scheme of the building resting on jacks; (b) the building during rectification; (c) building deformation during rectification: 1—edge of the building before rectification, 2—edge of the building during rectification, 3—active jack, and 4—passive jack.
Buildings 14 01581 g001
Figure 2. Jack used for building rectification during laboratory tests: (a) test scheme and measured quantities (upist—piston slide out, Δlcyl—change in length of the jack cylinder resting on the parallelepiped element, poil—oil pressure in the jack); (b) jack installed in the press during tests; visible control box; (c) displacement transducers measuring change in piston slide out (upist); and length of the jack body that rests on the parallelepiped element (Δlcyl); 1—jack cylinder, 2—contact of the cylinder with a stuck of parallelepiped elements, 3—jack piston, and 4—dynamometer.
Buildings 14 01581 g002
Figure 3. Hysteresis loops obtained during tests: (a) loop Qpoil—monotonic loads; (b) loop Qpoil—cyclic loads, (c) loop poilupist—monotonic loads; and (d) loop poilupist—cyclic loads.
Buildings 14 01581 g003
Figure 4. Hysteresis loops Qupist obtained during tests: (a) monotonic loads; (b) cyclic loads.
Buildings 14 01581 g004
Figure 5. Hysteresis loops QΔlcyl obtained during tests: (a) loop in the load range 0–Qmax–0; (b) loop in the load range (QmeanΔQ)–(Qmean + ΔQ) at Qmean = 400 kN.
Buildings 14 01581 g005
Figure 6. Model of the hydraulic jack: (a) changes in the length of the jack elements; (b) elements of the model; and (c) senses of the internal forces acting on the piston when reducing and increasing the piston’s slide out (upist).
Buildings 14 01581 g006
Figure 7. Hysteresis loops for the jack model: (a) relationship Qpoil; (b) relationship Qupist.
Buildings 14 01581 g007
Figure 8. Stiffness kpist and secant stiffness k ¯ p i s t presented on the graph of relationship Qupist.
Buildings 14 01581 g008
Figure 9. Values of characteristics of the „jack-01” model: (a) Npist-fr-max; (b) kpist.
Buildings 14 01581 g009
Figure 10. Piston’s slide out upist of the jack model: (a) monotonic loads; (b) cyclic loads.
Buildings 14 01581 g010
Figure 11. Characteristics of the jack cylinder and contact of cylinder with support: (a) values kcyl, (b) relation QΔlcyl.
Buildings 14 01581 g011
Figure 12. The influence of changes in the load value (ΔQ) at different values of the average load (Qmean) on the change in the length of the jack cylinder and contact of cylinder with support (Δlcyl).
Buildings 14 01581 g012
Figure 13. The influence of changes in the load value (ΔQ) at different values of the average load (Qmean) on (a) the change in the length of the jack (Δljack) and (b) secant stiffnesses kpist resulting from the piston’s slide out (upist).
Buildings 14 01581 g013
Figure 14. Secant stiffnesses k ¯ j a c k of jack model.
Buildings 14 01581 g014
Table 1. The characteristic values of the jack model.
Hysteresis LoopQmax,
kN
Δlpist-max, mmψoil,
MPa·mm
poil-max,
MPa
Npist-fr-max,
kN
koil
10−3·m2
Npist-el-max,
kN
kpist,
MN/m
ψpist,
kN·mm
χpist,
-
50 kN48.430.33616.851.799.7822.4338.651152.9320.376
100 kN87.350.72815.863.703.7519.7883.601153.5060.095
200 kN194.671.43067.618.137.8121.58186.8613112.6150.089
300 kN288.042.093163.6111.7113.3422.39274.7113130.5620.101
400 kN389.772.699270.8415.8816.4722.70373.3013847.5600.094
500 kN484.473.257416.5119.7720.4622.79464.0114270.5100.096
600 kN587.733.857551.7324.0122.4122.96565.3114790.6000.088
700 kN683.324.386668.1528.0123.3723.09659.95150106.9950.080
800 kN788.815.002780.5732.3623.6923.22765.12153122.6800.071
900 kN896.755.935801.3537.0721.3123.28875.44148130.1600.053
Table 2. Values for the parameter βcyl and the stiffness kcyl.
Load RangeNcyl-el,max, kNΔlcyl,max, mmβcyl, 1/mmkcyl, MN/m
0–50–048.430.5533.05152
0–100–087.350.3565.46546
0–200–0194.670.5574.11822
0–300–0288.040.6164.001199
0–400–0389.770.6843.791516
0–500–0484.470.7253.711853
0–600–0587.730.7583.652192
0–700–0683.320.7773.652553
0–800–0788.810.7913.662930
0–900–0896.750.8673.413065
Disclaimer/Publisher’s Note: The statements, opinions and data contained in all publications are solely those of the individual author(s) and contributor(s) and not of MDPI and/or the editor(s). MDPI and/or the editor(s) disclaim responsibility for any injury to people or property resulting from any ideas, methods, instructions or products referred to in the content.

