Article

New Design Criteria for Long, Large-Diameter Bored Piles in Near-Shore Interbedded Geomaterials: Insights from Static and Dynamic Test Analysis

1
Department of Structural Engineering, Faculty of Engineering, Zagazig University, Zagazig 44519, Egypt
2
Housing and Building National Research Center (HBRC), Cairo 1770, Egypt
*
Author to whom correspondence should be addressed.
Buildings 2024, 14(8), 2268; https://doi.org/10.3390/buildings14082268
Submission received: 27 March 2024 / Revised: 23 May 2024 / Accepted: 27 May 2024 / Published: 23 July 2024

Abstract

:
This paper presents an analysis of long, large-diameter bored piles’ behavior under static and dynamic load tests for a megaproject located in El Alamein, on the northern shoreline of Egypt. Site investigations depict an abundance of limestone fragments and weak argillaceous limestone interlaid with gravelly, silty sands and silty, gravelly clay layers. These layers are classified as intermediate geomaterials, IGMs, and soil layers. The project consists of high-rise buildings founded on long bored piles of 1200 mm and 800 mm in diameter. Forty-four (44) static and dynamic compression load tests were performed in this study. During the pile testing, it was recognized that the pile load–settlement behavior is very conservative. Settlement did not exceed 1.6% of the pile diameter at twice the design load. This indicates that the available design manual does not provide reasonable parameters for IGM layers. The study was performed to investigate the efficiency of different approaches for determining the design load of bored piles in IGMs. These approaches are statistical, predictions from static pile load tests, numerical, and dynamic wave analysis via a case pile wave analysis program, CAPWAP, a method that calculates friction stresses along the pile shaft. The predicted ultimate capacities range from 5.5 to 10.0 times the pile design capacity. Settlement analysis indicates that the large-diameter pile behaves as a friction pile. The dynamic pile load test results were calibrated relative to the static pile load test. The dynamic load test could be used to validate the pile capacity. Settlement from the dynamic load test has been shown to be about 25% higher than that from the static load test. This can be attributed to the possible development of high pore water pressure in cohesive IGMs. The case study analysis and the parametric study indicate that AASHTO LRFD is conservative in estimating skin friction, tip, and load test resistance factors in IGMs. A new load–settlement response equation for 600 mm to 2000 mm diameter piles and new recommendations for resistance factors φ qp, φ qs, and φ load were proposed to be 0.65, 0.70, and 0.80, respectively.

1. Introduction

Piles are mainly used to transfer high loads from super-structures to relatively deep layers to achieve the allowable limits of settlement and differential settlement. Bored piles are commonly used foundation systems for high-rise buildings in North Africa due to their equipment availability, constructability, and economic benefits. In the current decade, many megaprojects have been developed in New El Alamein city, which is located near the north coast of Egypt. Here, the shallow soil layer has been classified as a soft layer, and the deep layers are weak and highly weathered rock interlaid with clayey and sandy layers. Refs. [1,2,3], who separated IGMs into two categories: cohesive IGMs and cohesionless IGMs. Cohesive IGMs are clay shales and mudstone with a cohesion of 0.25 to 2.50 MPa [4]. Cohesionless granular IGMs are sand with fractured limestone and SPT-N60 > 50 [5,6,7,8,9,10]. Due to complex geological processes, IGMs need detailed investigations to achieve an acceptable understanding of their pile-resistance response [10,11,12,13,14]. The deep layers were classified as intermediate geomaterials, IGMs, in reference to the site investigation program results. IGMs are a classification between ordinary soil and rock, according to [14,15,16,17,18]. Cohesive IGMs are clay shales and mudstone with a cohesion of 0.25 to 2.50 MPa [19,20,21].
There is a lack of data and relevant research work on pile load tests through IGMs [18,22]. This leads to further increases in the gap between the actual pile responses and the recommended design capacities of bored piles in IGMs [23,24,25,26,27,28,29].
Selecting the properties of IGMs requires detailed site investigation tests. This introduces many challenges to proposing an economic design capacity for the construction of piles through IGMs [30,31,32,33,34,35,36]. Due to the lack of research and field tests of piles in IGMs, adequate studies are limited to evaluating the design methodologies and calibrating load and resistance factor design procedures [37,38,39,40,41,42,43]. The most important tests to define IGMs are the field standard penetration test, SPT-N, and the laboratory unconfined compressive strength, UCS [26].
Many researchers have studied and developed many approaches for designing piles in rock [8,18,19,25,27,31,33,34,35,44,45,46,47,48,49,50,51], presented a detailed review of different approaches.
In the El Almaien project, the load and resistance factor design, LRFD, approach was considered for the pile design. Ref. [36], propos the LRFD method for computing frictional and end-bearing capacities for piles in cohesive and cohesionless IGMs using the following equations:
R R = ϕ q p R P + ϕ q s R S
R P = q p A p
R S = q s A s
where
Rp = nominal shaft tip resistance; Rs = nominal shaft side resistance; φ qp = resistance factor for tip resistance; φ qs = resistance factor for shaft side resistance; qp = unit tip resistance; qs = unit side resistance; Ap = area of shaft tip; and As = area of the shaft side surface.
The assignment of resistance factors can be appraised by thoroughly investigating the intermediate geomaterials, IGMs, of not only the project site but also other related sites, according to [36]. Refs. [1,6,38,52], recommended 0.60 and 0.55 for the shaft side resistance factor, φ qs, and the tip resistance factor, φ qp, respectively, for bored piles. Moreover, Refs. [53,54,55,56,57,58] indicated that AASHTO recommendations for driven pile capacity in IGMs are conservative due to a lack of knowledge about static analysis methods and inadequate LRFD recommendations for piles through IGMs.
These factors can be increased depending on the number of pile load tests and site variability. Comparatively, Ref. [13] recommended a reduction factor of 0.7 to 0.75 for drilled shafts in IGMs.
As concluded by several researchers, with frictional materials, such as cohesionless IGMs, the load transferred by friction depends on the rearrangement of the particles’ locations rather than the deformation of the grains, as suggested by several researchers [59,60]. So, simulations of the rough surface between the pile and IGMs can be conducted by elastic models based on Hertz contact theory [61,62].
The following equations could be used to determine the bearing and friction ultimate capacity, qp, and qs, respectively.
For cohesionless IGM layers,
q p = 0.59 N 60   P a σ v 0.8 σ v
q s = k o i σ v i tan φ i
For cohesive IGM layers,
q p = N c S u
q s = Σ α i S u i
where
N60 = average SPT blow count (corrected only for hammer efficiency) in the design zone under consideration; Pa = atmospheric pressure; σ v = vertical effective stress at the tip elevation of the shaft (MPa); σ v i = effective overburden pressure for the ith layer; Koi = design value of earth pressure at rest for the ith layer; Sui = unconfined compressive strength at ith layer; Su = unconfined compressive strength at the pile tip; αι = adhesion factor at ith layer; Nc = bearing factor, as per the following equation.
N c = 6 1 + 0.2 z D 9
where z = depth of the pile tip, and D = pile diameter.
Ref. [1], acknowledges that there are currently no acceptable approaches to differentiate between soft and hard rocks for the design of driven piles. Local experience with driving piles on soft rocks is utilized to define the rock quality. However, limited test results are available to describe the characteristics and engineering properties of IGMs [2].
Ref. [54], evaluated the performance of two piles with diameters of 1.50 m based on pile load test results. The lengths of the two piles were 66.5 m (without toe grouting) and 58.3 m (with toe grouting), respectively. The socket lengths in the IGM were 20 m and 13 m, respectively. The results indicated that the grouting at the pile toe enhanced both the end-bearing capacity and frictional resistance of the bored pile in IGM soil.
Ref. [59], studied the bearing capacity of drilled shafts in IGM layers using pile load tests, which were carried out on a pile of 800 mm in diameter and a total length of 18 m. The cocked length through IGM was 5.6 m. The results indicated that the finite element, FE, could be a potential method for calculating and estimating the bearing capacity of bored piles in the IGM layer.
Ref. [63], created a data base of five bored pile load tests in layers classified as IGMs in Dubai. The piles were executed through strata of 17.0 m thick overburden soil deposits, such as beach sand and sabkha, followed by 23.0 m of sandstone and 20.0 m of siltstone, mudstone, and claystone. The piles were 1200 mm in diameter and had total lengths of 27.6, 39.5, 15.4, 26.6, and 21.3 m for piles P5-C, P9-A, P17-B, P19-A, and P19-B, respectively. The results indicate that the piles behaved as friction piles.
Ref. [25], performed seven static load tests on driven H piles with lengths of 20.0 m to compare the results with capacities determined with the Wisconsin Department of Transportation’s, WisDOT’s, driving formula and with the pile driving analyzer, PDA, and CAPWAP. The results indicate that CAPWAP’s predicted capacities were less than those measured from the static load test, at 15%.
Ref. [48], proposed a settlement equation for the working load range of a single pile, considering the properties of both the soil and the foundation.
Δ t = Δ c + Δ b b + Δ b s
Δ c = ( Q 0.5 Q ms ) L E A s h a f t
Δ b b = C p ( Q m b D q max )
Δ b s = ( 0.93 + 0.16 L D ) C p ( Q m s L q max )
where
Δ t, Δ c, Δ bb, and Δ bc is the total settlement of the pile head, the elastic compression of the pile shaft, the settlement of the pile tip due to the load transferred by bearing, and the settlement of the base due to the load transferred by friction, respectively. Q, Qms, Qmb, and qmax are the load at the pile head, the mobilized side resistance, the load transferred to the shaft base, and the nominal unit base resistance, respectively. Cp is the soil characteristics factor, which is considered to be 0.09 and 0.03 for very dense sand and stiff clay, respectively.
This study aims to provide a new equation for the load–settlement response in the elastic settlement of the single bored pile through IGM layers using field pile load tests and the finite element, FE, method. A parametric study was developed considering the main factors affecting the bored pile behavior for the compression axial load as well as the thickness of the top weak layer, the soil pile stiffness, the mechanical properties of the IGM layer, and the pile configuration. The proposed equation was compared with existing methods, and field load tests were used to validate the proposed method.
The pore water pressure increases the strength of the IGM layers [50]. On the other hand, with the slow removal of pore water by decreasing the groundwater table, the strength of IGM layers will decrease by about 40% [58].

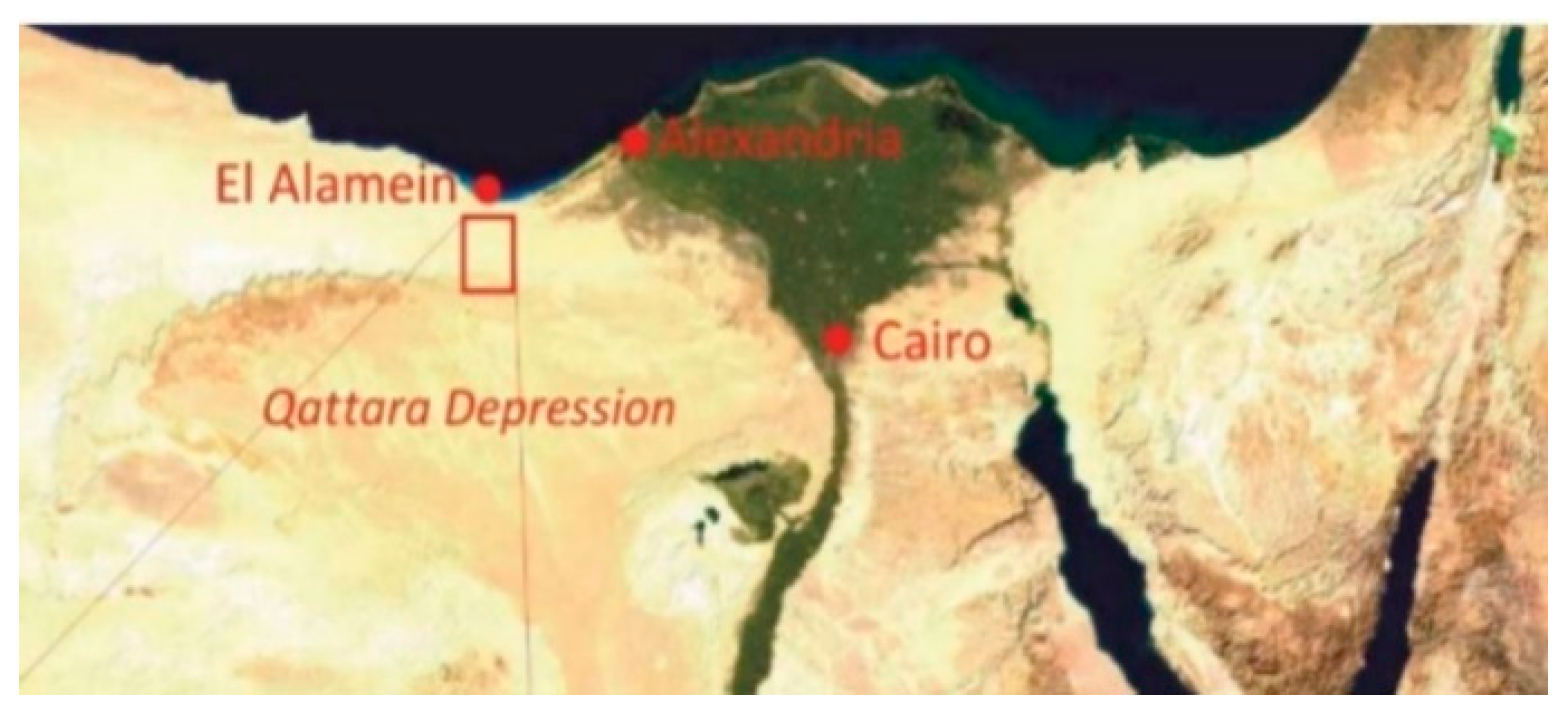
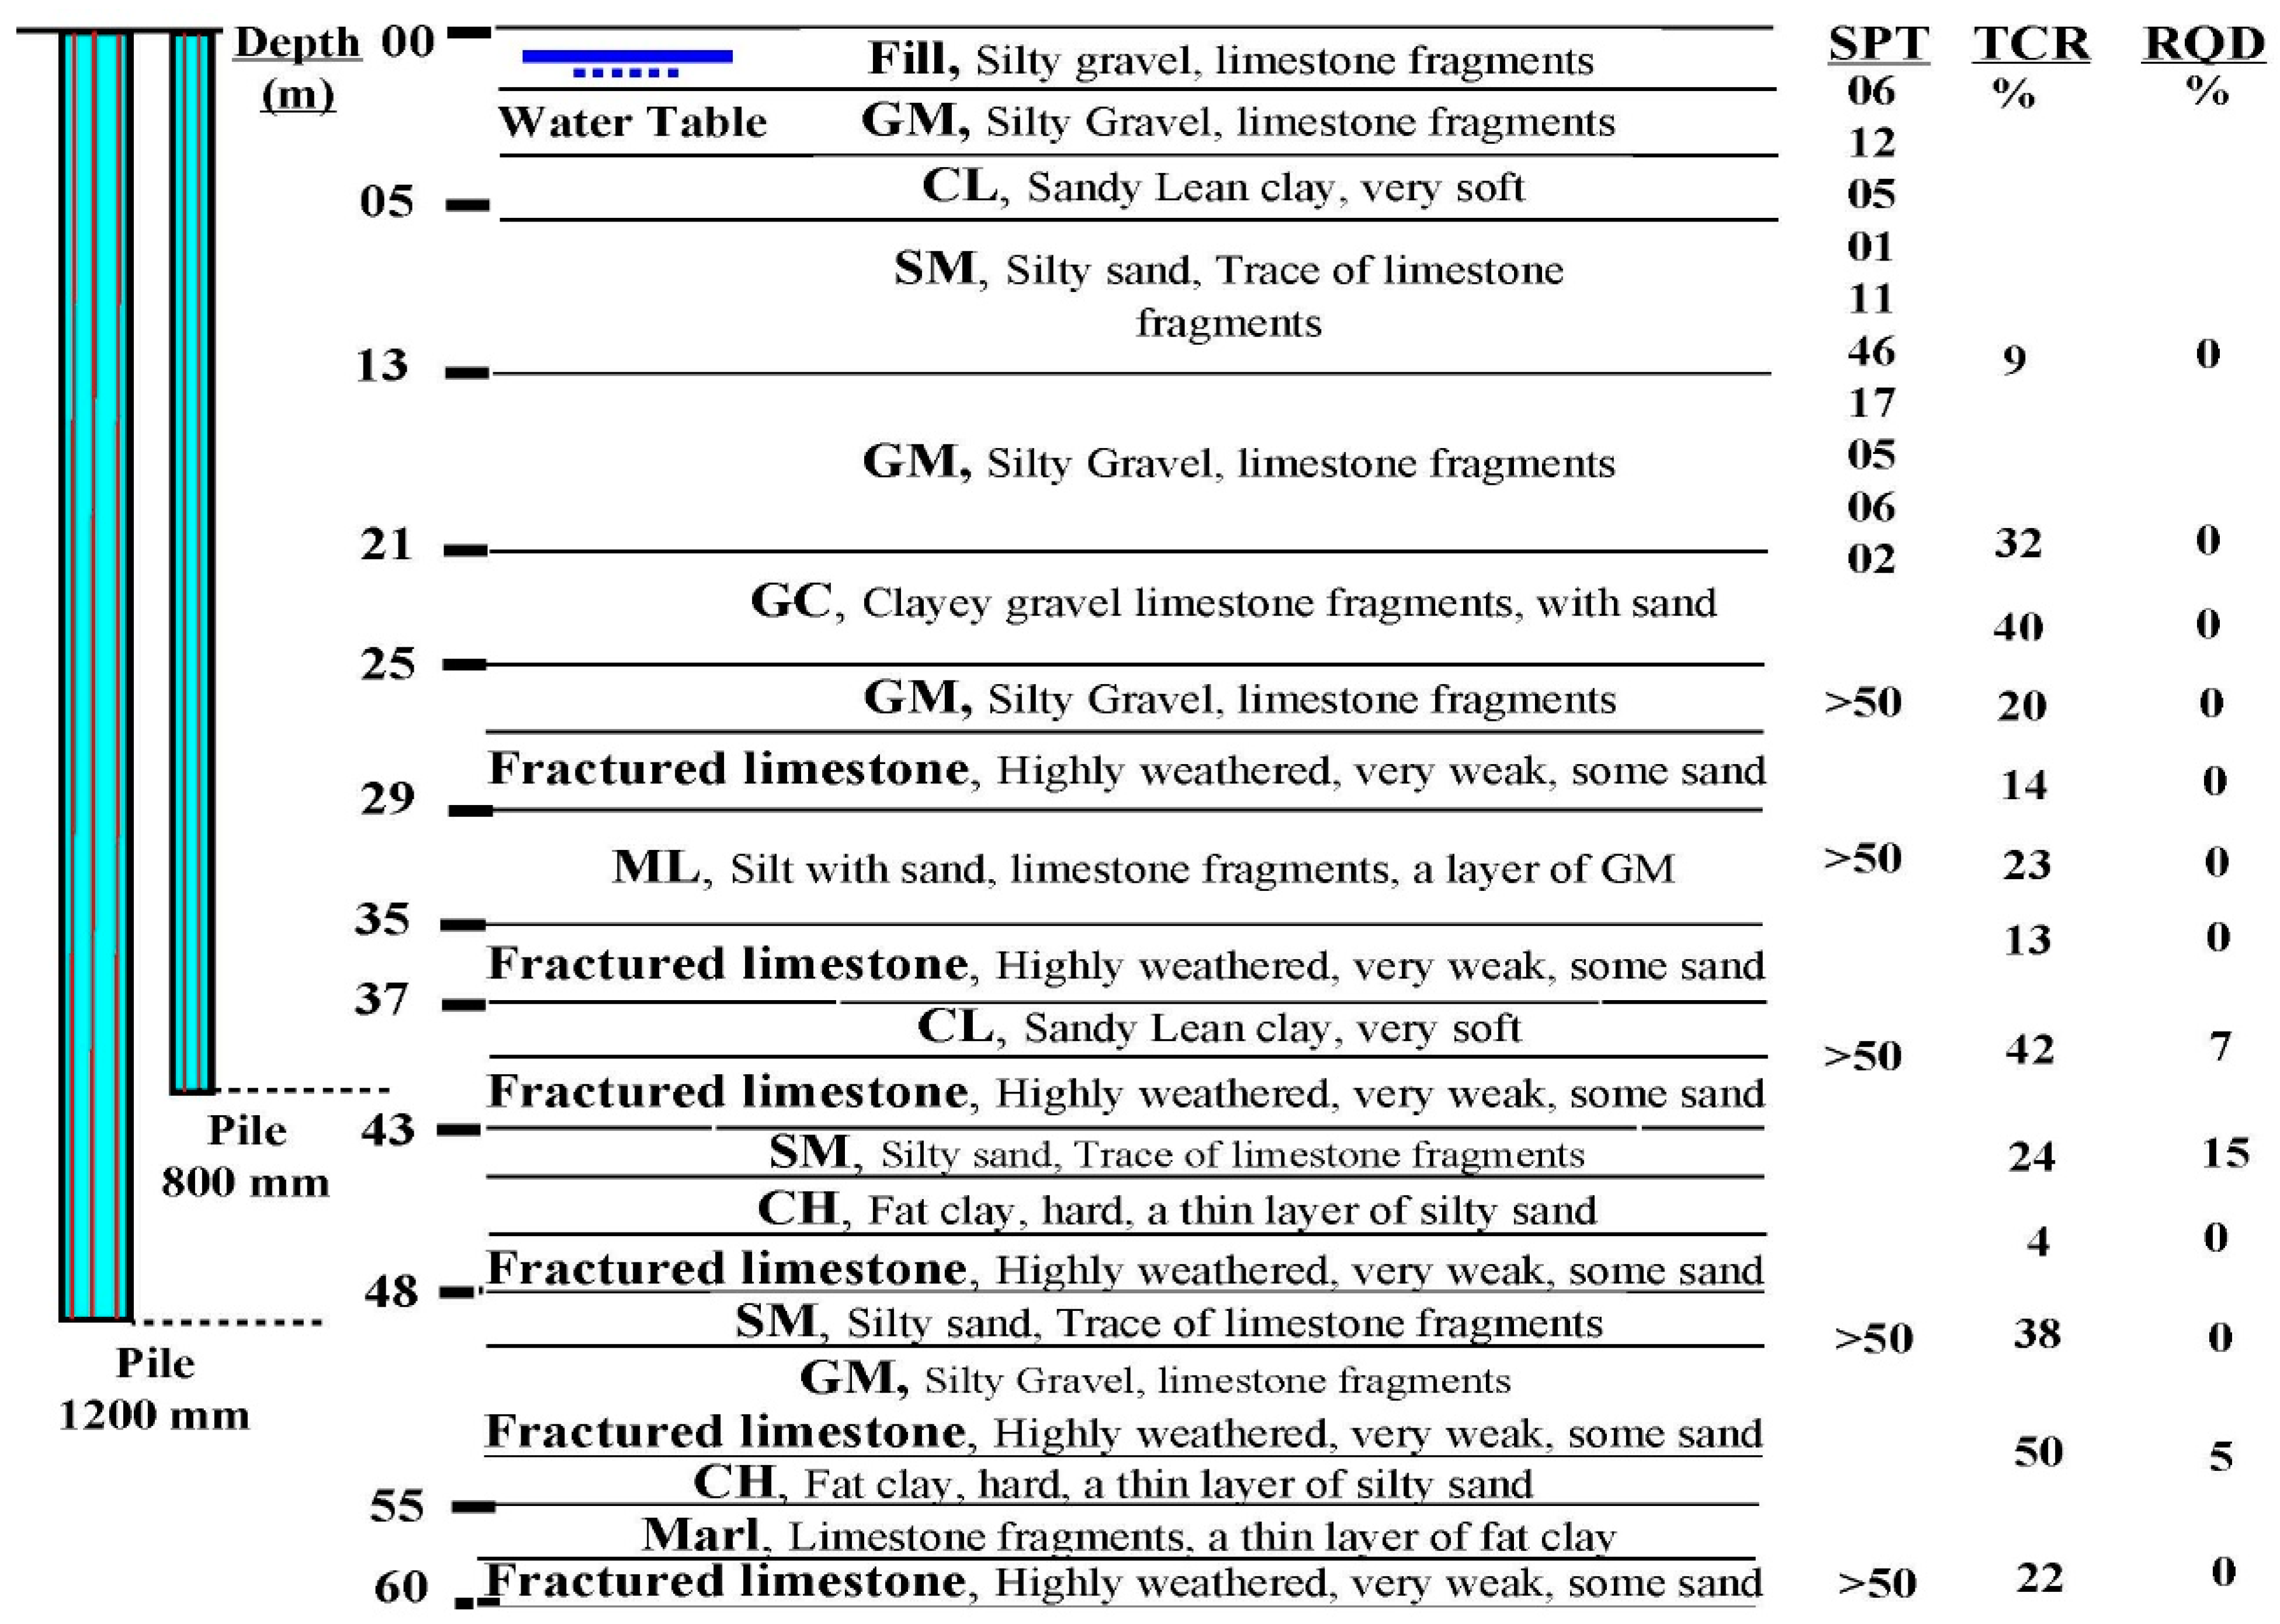
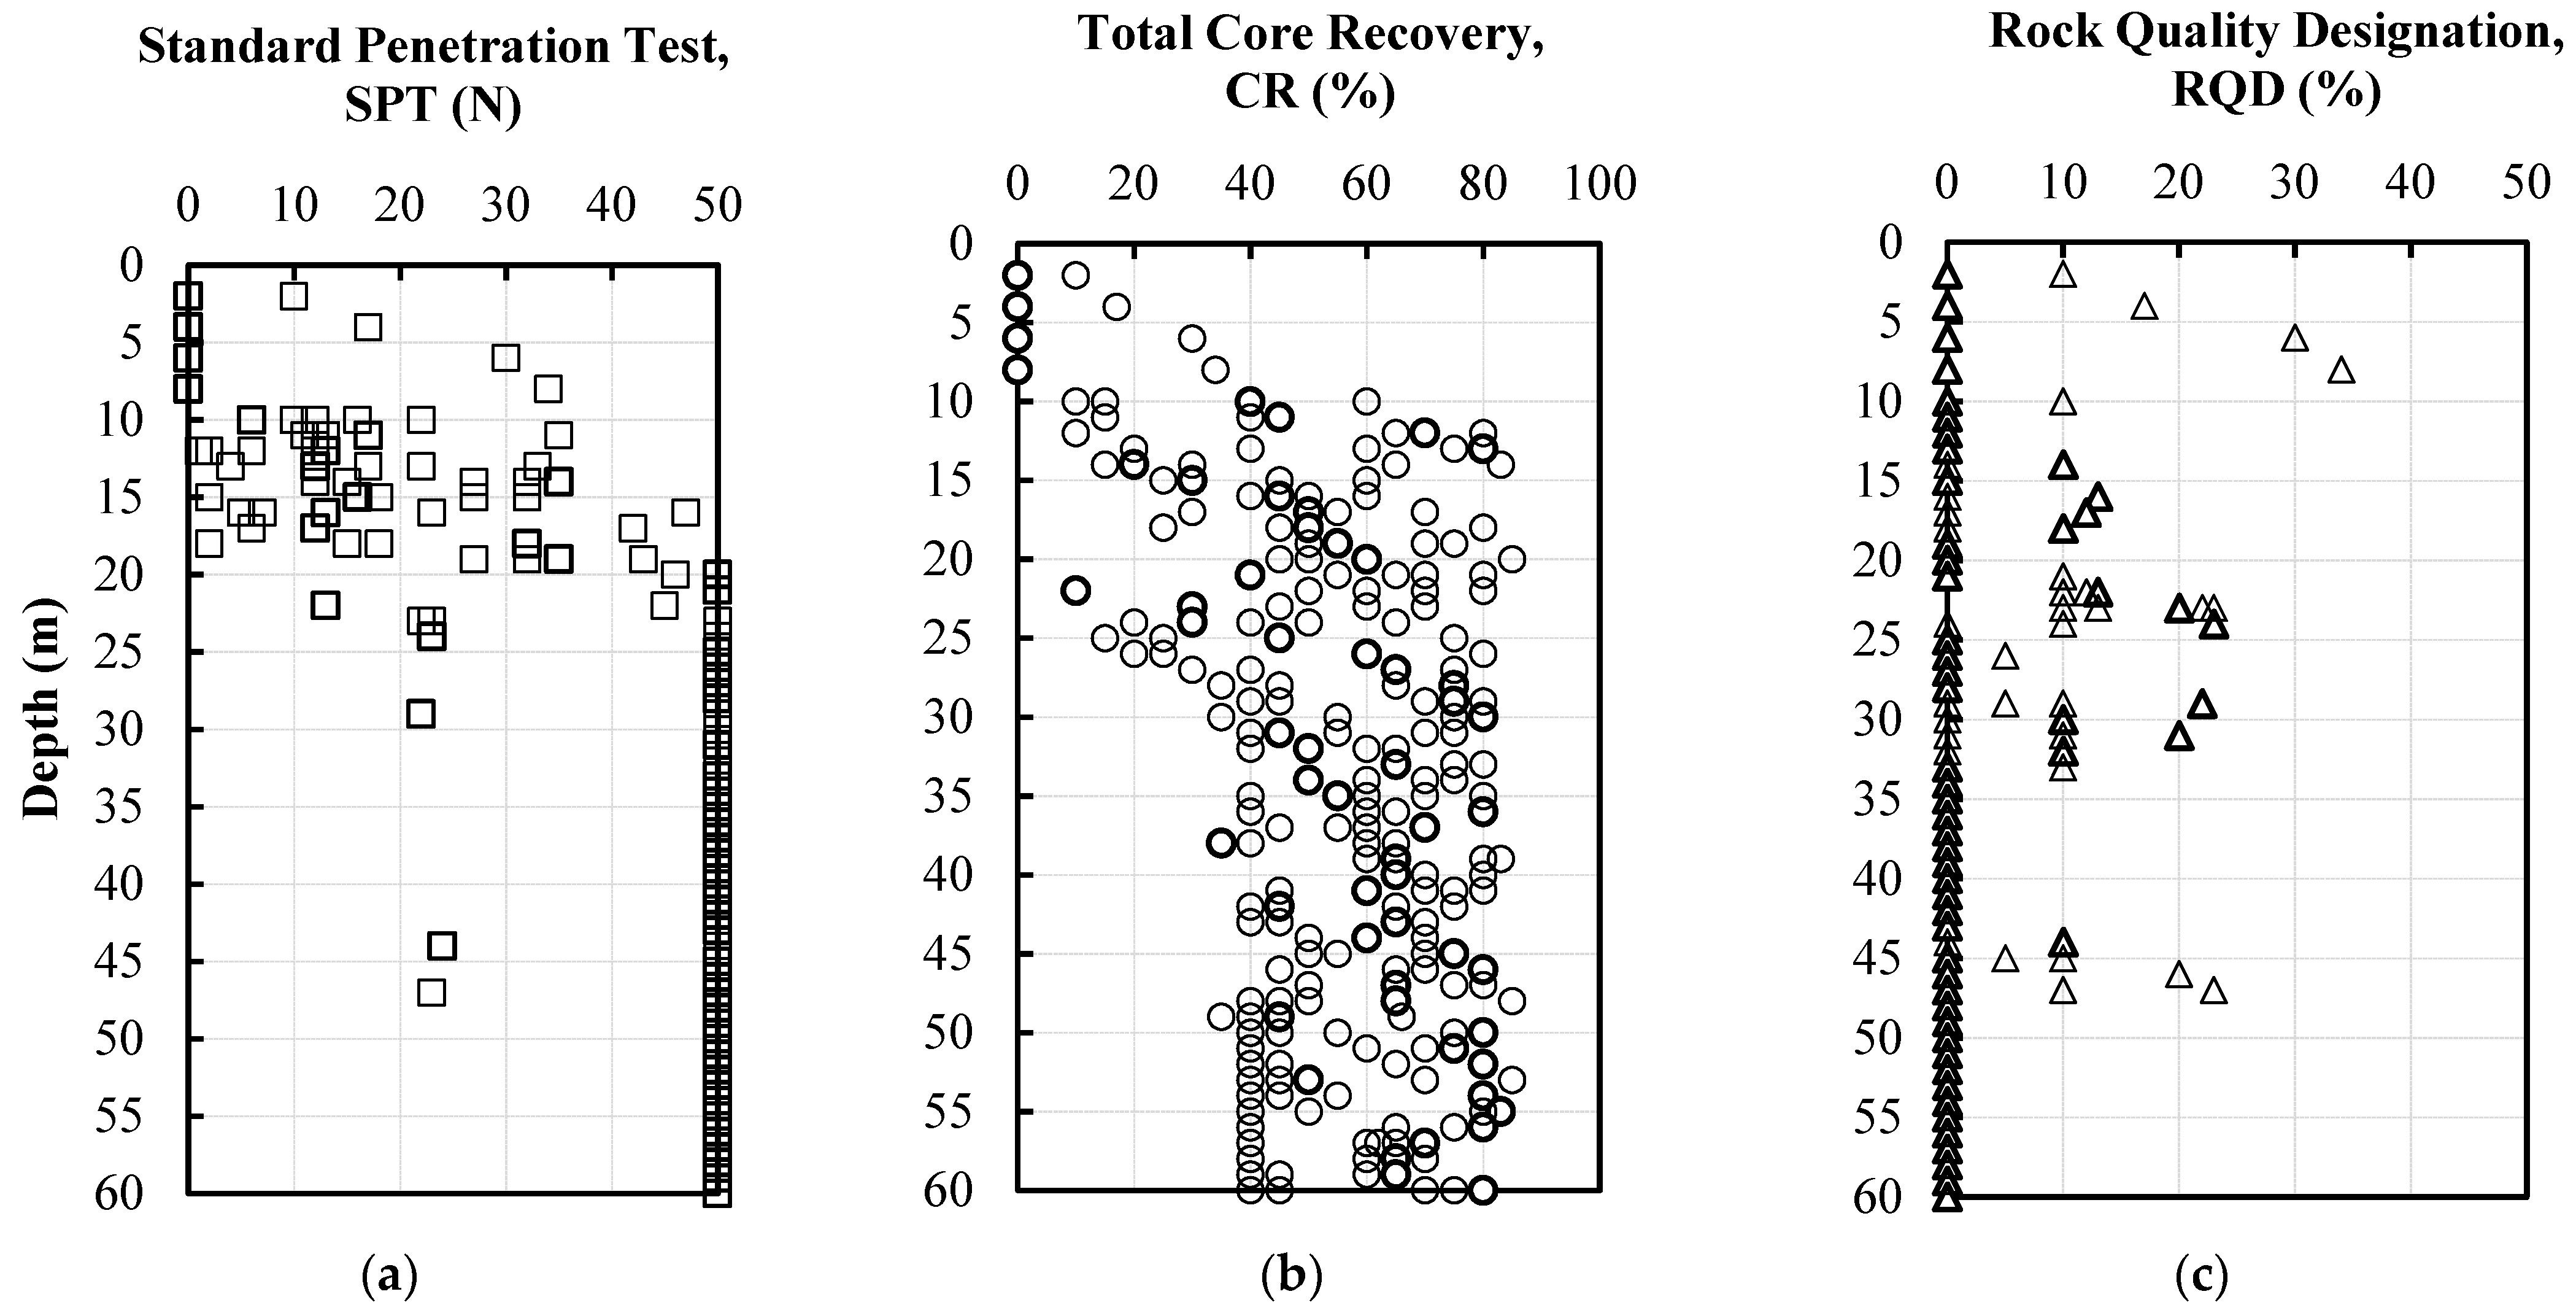
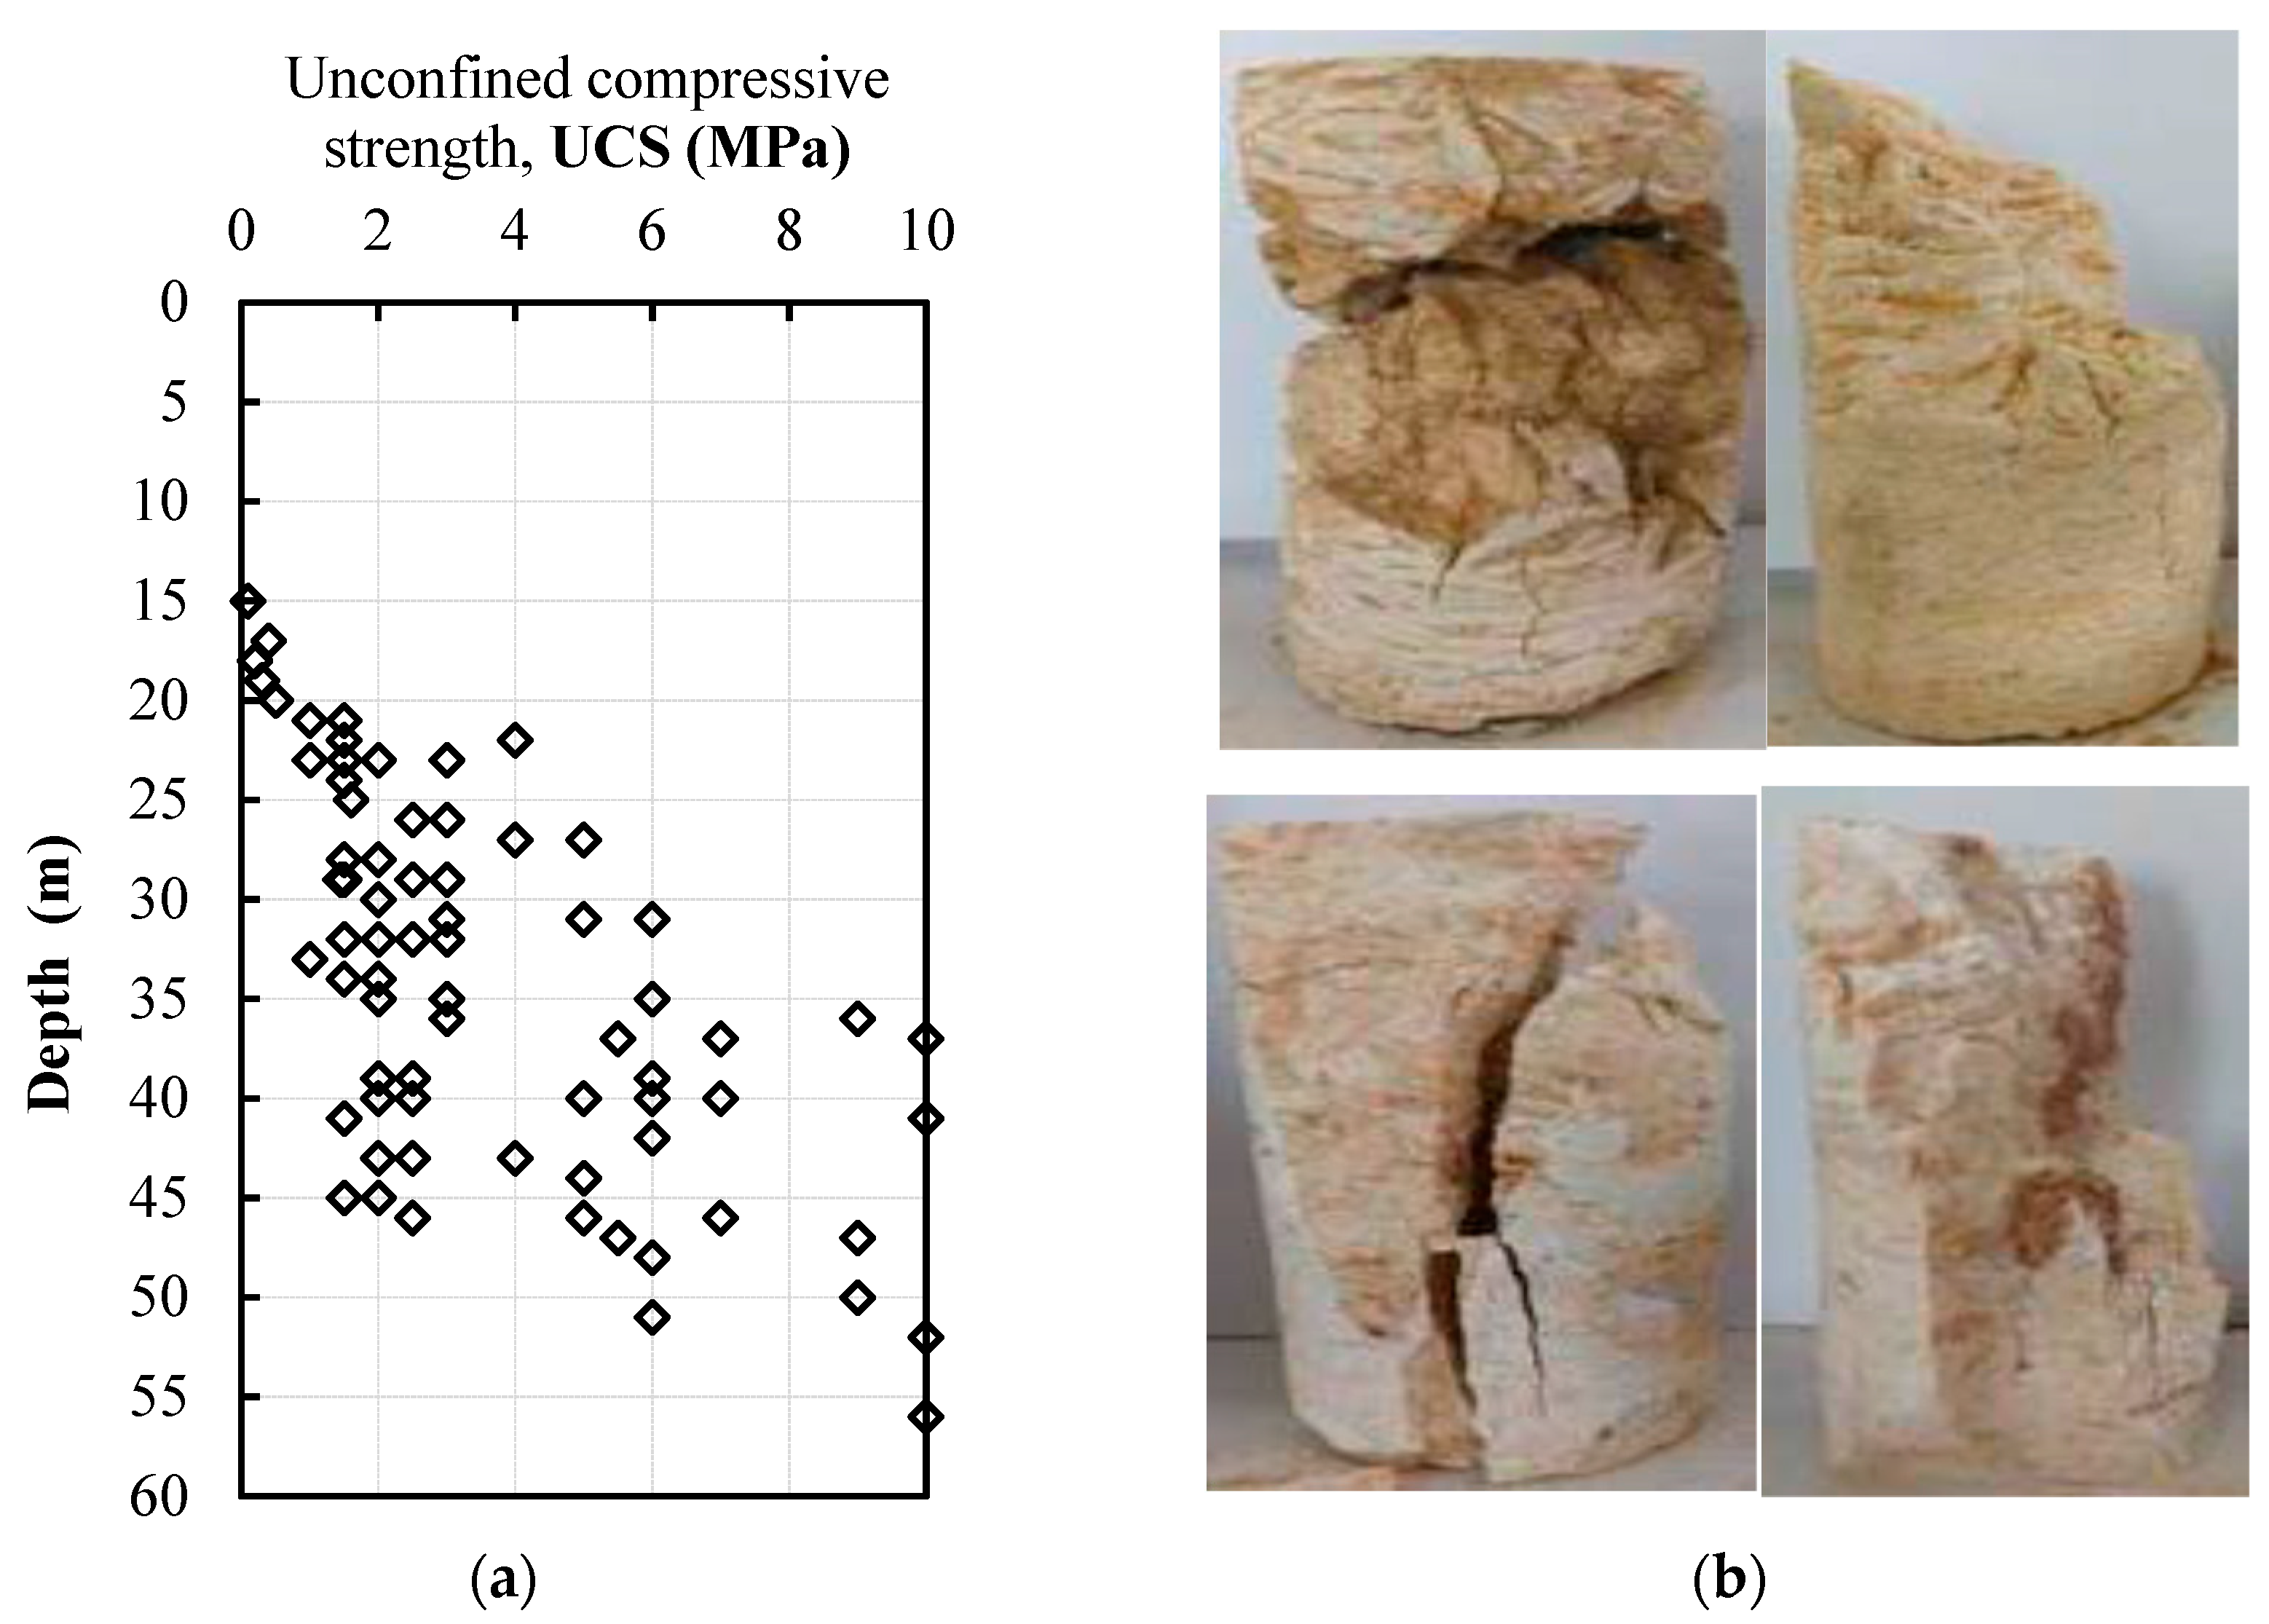
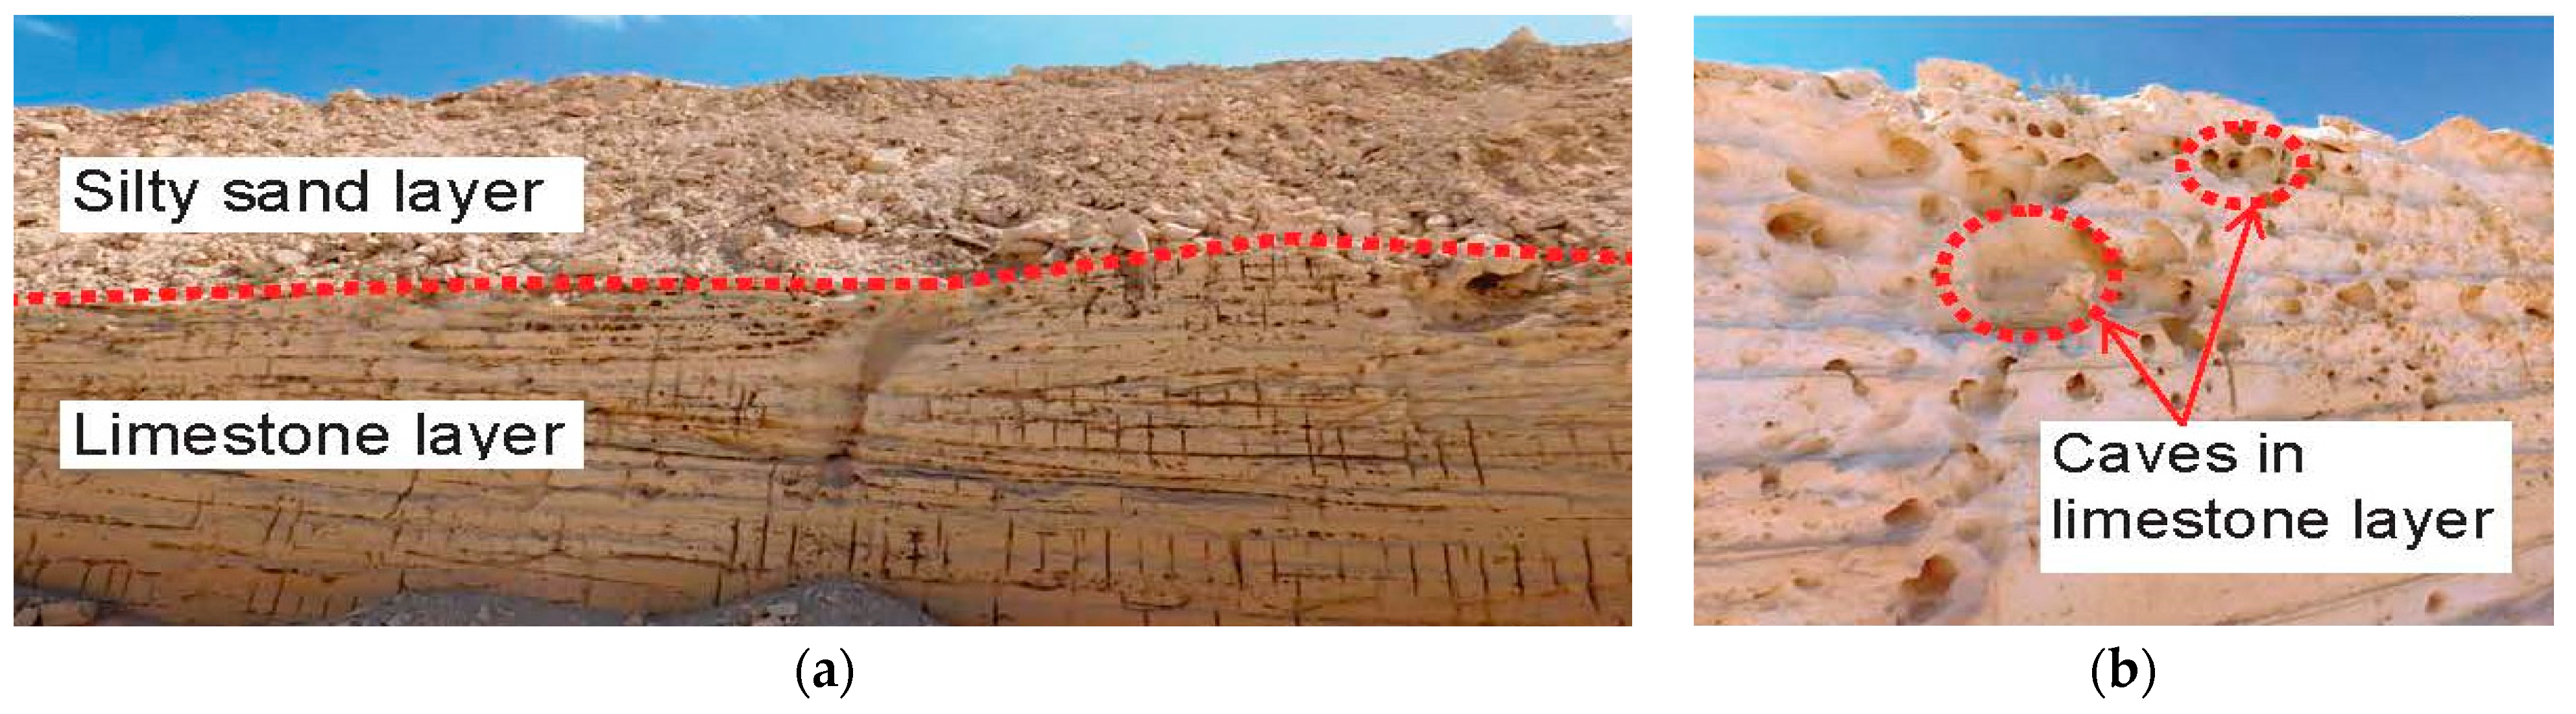
2. Field Study and Site Investigation

New El Alamein city is located on the north coast of Matrouh governorate, Egypt. The location of El Alamein city is shown in Figure 1. The project consists of seven complexes of high-rise buildings along the north coast shoreline with footprint areas, FPAs, varying from 30,000 to 50,000 m2.
Geotechnical field and laboratory investigation programs were carried out to select the subsurface characteristics using fifty-five boreholes up to 60.0 m depth. The borehole locations are shown in Figure 2. The lithology of typical soil layers that are encountered in borehole logs and field tests is shown in Figure 3. The water depth was encountered at 1.0 m from the ground surface. The results of standard penetration tests, SPT, rock quality designation, RQD, and total core recovery ratio, CR, versus depth are shown in Figure 4. RQD is the percentage of the sum of core lengths greater than 0.1 m in a 1.0 m core length, whereas CR is the percentage ratio of the sum of the total length of the core recovered to the depth of the drilling performed. Figure 3 shows that the stratification is fill followed by repeated interchangeable layers of silty gravel, sandy lean clay, silty sand, argillaceous limestone, poorly graded gravel, lean clay, clayey gravel, gypsum powder, and marl. Figure 4 and Figure 5 show that SPT-N reaches refusal (N = 50) or closer, whereas RQD is around zero at depths below 20 m. This indicates that these layers could be classified as intermediate geomaterials, or IGM layers.
IGMs reside at the center of a continuum between soil and rock, according to [21]. That is, the shear strength of IGMs is less than that of intact rock but greater than that of soil. Generally, the top surface layers of intermediate geomaterials, IGMs, are compressible and have a low shear strength. Refs. [3,36,43], defined IGMs as comprising two categories: cohesive IGMs and cohesionless IGMs. Cohesive IGMs, such as clay shales and mudstone, have a cohesion of 0.25 to 2.50 MPa. The unconfined compressive strength, qu, will be determined from uniaxial compressive tests, and the values of the rock quality designation, RQD, of the rock core will be determined from the site investigation. Cohesionless granular IGMs, such as sand with fractured limestone, have an SPT-N60 > 50. Figure 5 shows the results of unconfined compressive strength, UCS, tests versus depth, and photos for some samples. The test results could classify the soil as IGM layers, especially the soil from 15.0 m depth below the natural ground level.
Geophysical investigations were carried out on the project site to analyze and classify the stratification. The geophysical study shows that the main formation can be divided into three main units. The first unit is limestone intercalated with gypsum, silty sand, and silty clay. The second unit is hard clay marl. The third unit is classified as intermixed layers of marl, mudstone, clay, gypsum, limestone, and sandstone. An open excavation was carried out by a geophysical study team near the plot to investigate the top layers. Figure 5 shows the soil layers’ classification as per the geophysical study and features of chemical weathering in layers of limestone at the site As shown in Figure 6.

3. Case Study and Pile Load Test Data

The most important purpose of the existing study was to inspect the field’s static and dynamic pile load test behavior under compression loads. The field tests of this research were carried out over three years (from 2019 to the end of 2022).

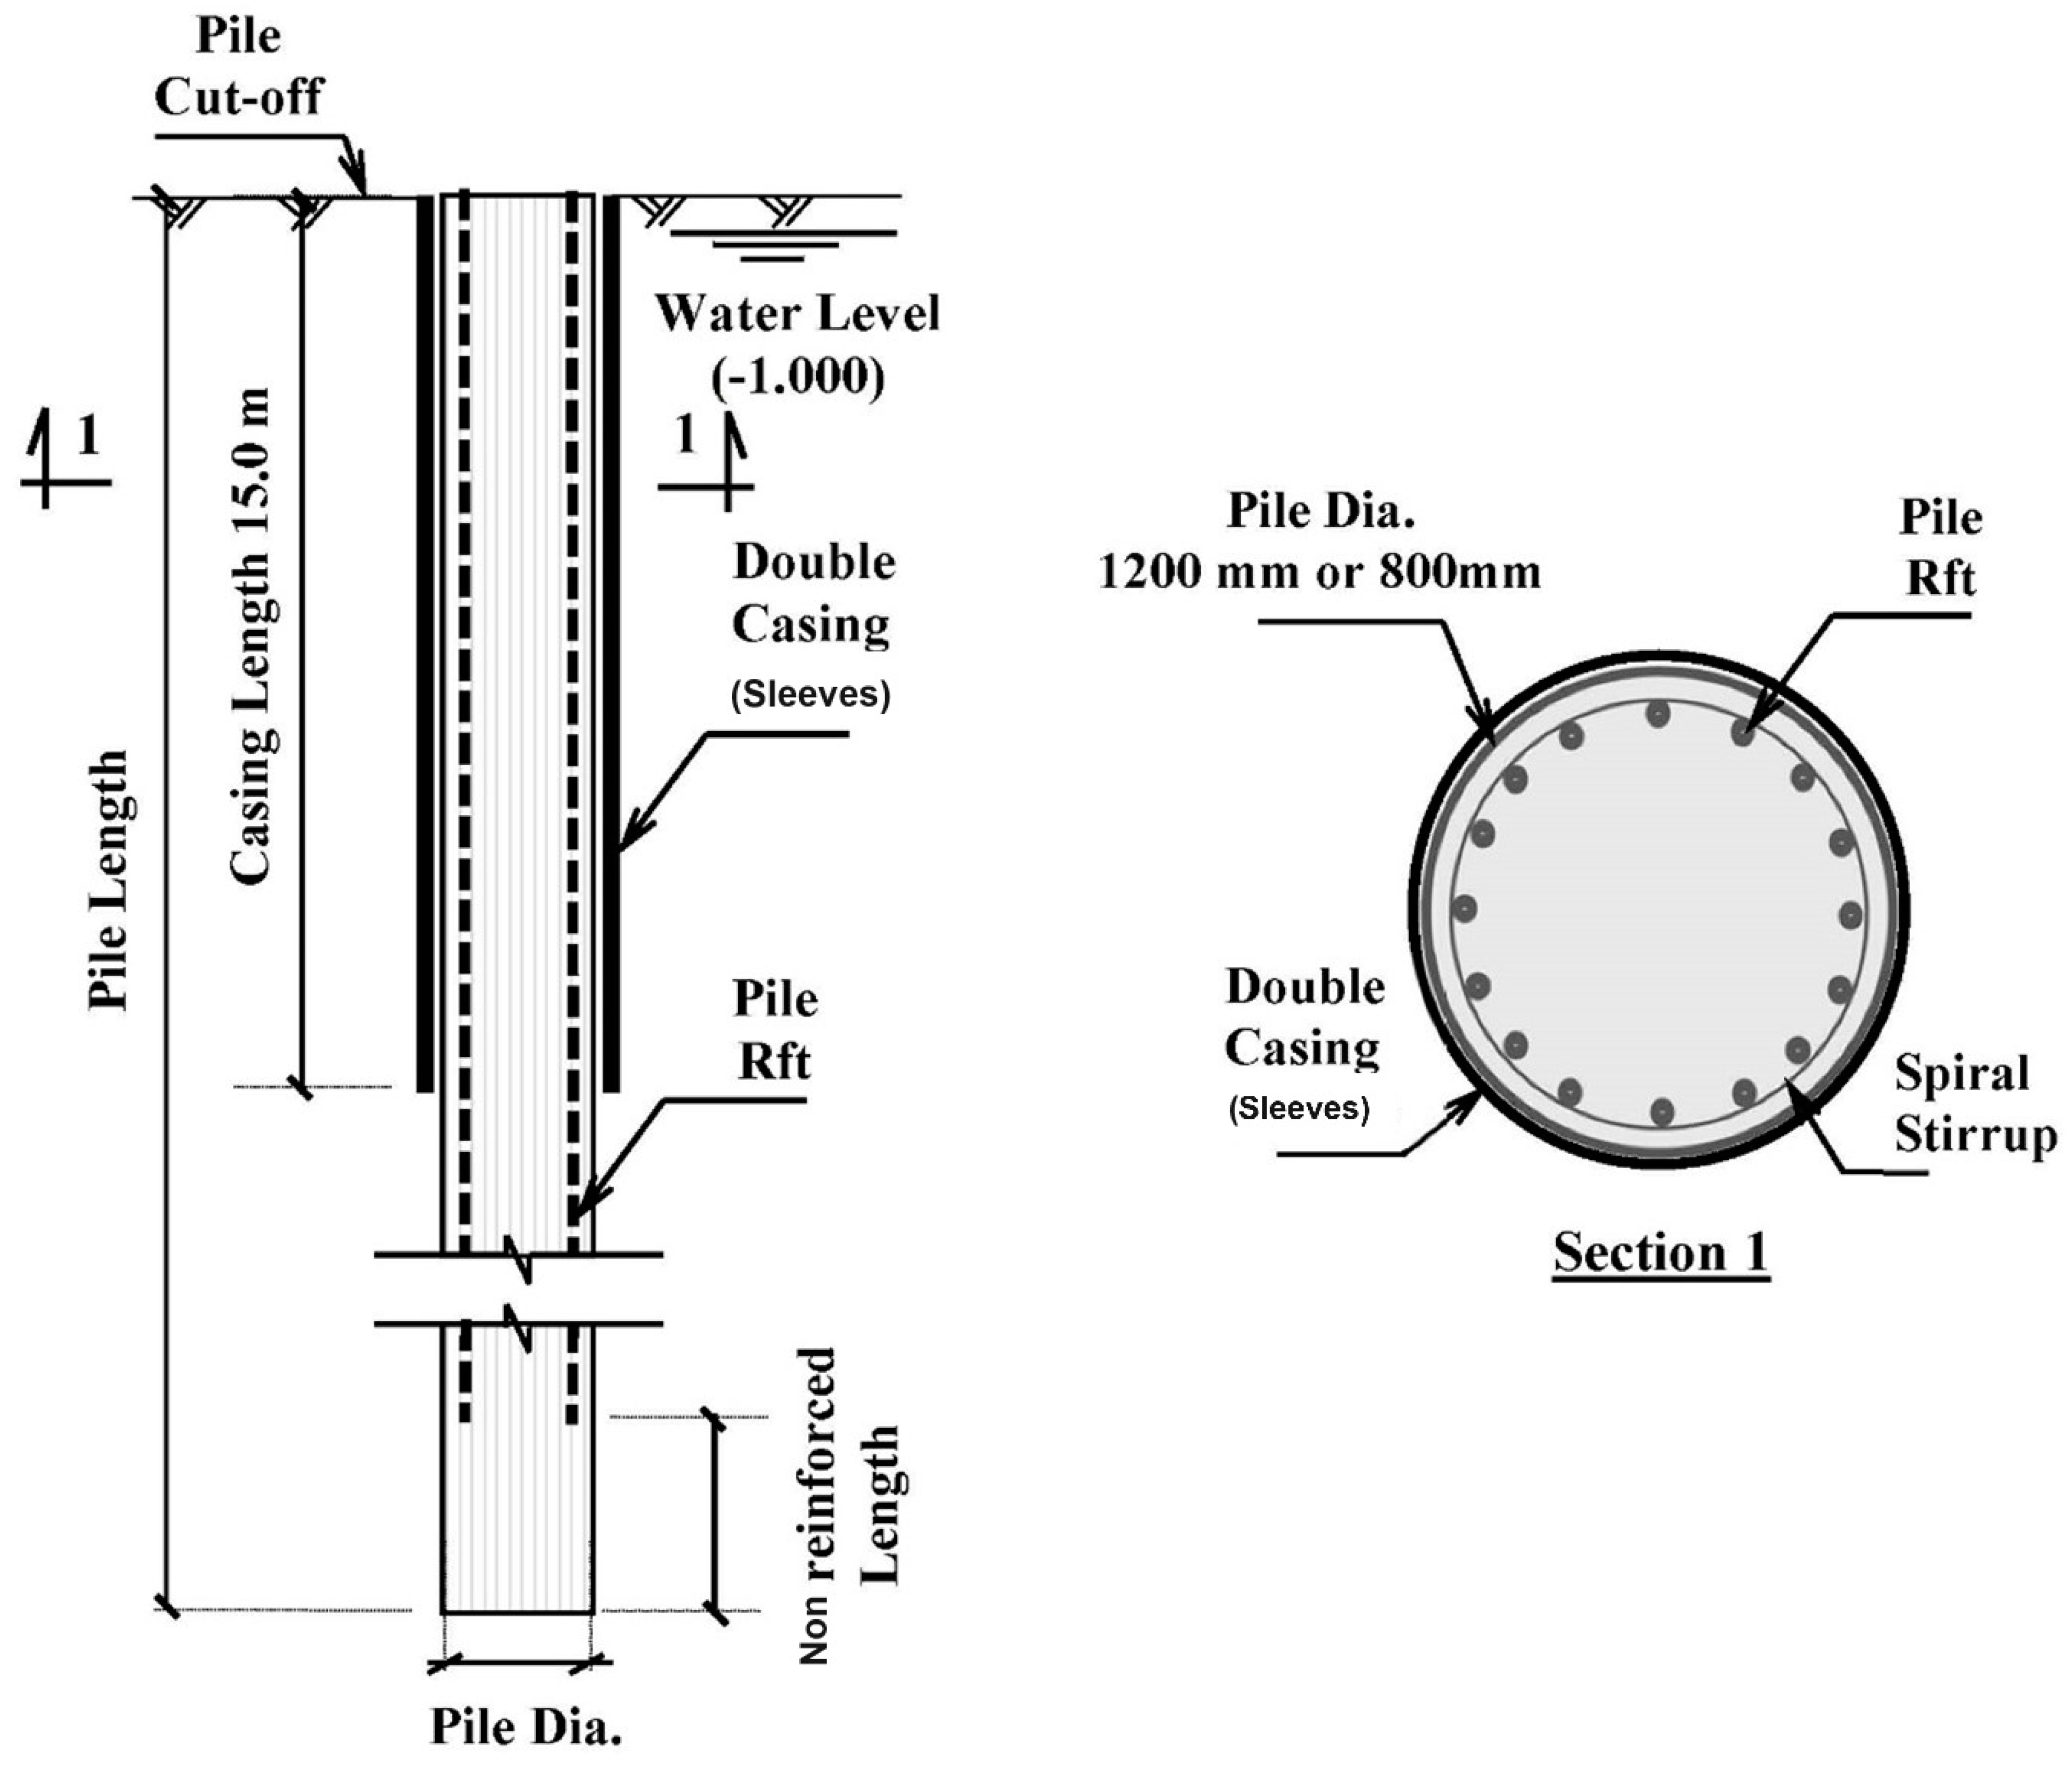
3.1. Pile Foundation for the Project

The project consisted of seven towers. Each tower rested on rafts and piles. Deep foundation systems consisted of large-diameter piles with diameters of 1.20 m and 0.80 m and penetration lengths of 50.0 m and 40.0 m, respectively. A pile of diameter 1.20 m was designed, employing Equations (1)–(8) from [1], to resist 10 MN of vertical (compression) load. A pile diameter of 0.80 m was designed to resist 3.50 MN. The reinforcement length was 35.0 and 30.0 m for piles with diameters of 1.20 m and 0.80, respectively. The reinforcement of the piles was 34T32 and 12T25 for piles with diameters of 1200 mm and 800 mm, respectively. The reinforcement of the piles ensured that no structural failure occurred during the non-working tests. Table 1 illustrates the piles’ details. Figure 7 depicts the piles’ configuration and sections’ details.
Piles in IGMs are sensitive to installation methods [44]. The pile construction method was cast-in-situ bored piles. Temporary casing was used for a depth of about 15.0 m, a thickness of 15 mm, and an inner diameter equal to the pile diameter plus 25 mm to solve the problem of the wall protection and drilling of the rotary rig in the complex sand layer, fluid plastic silt layer, backfill layer, and pebble layers at the top surface.
Since the groundwater table, GWT, was at 1.0 m depth from the ground surface, GS, the bentonite slurry was used during pile installation to satisfy the hole stability during construction. The bentonite density was 10.5 kN/m3. It was poured in intervals during the hole drilling until the concrete was cast. As is well known, the use of bentonite slurry would cause the formation of bentonite cake at the pile surface area, resulting in a smooth surface condition. As a result, skin friction should be reduced by 20–30% [6].
After pile construction, integrity and cross-hole sonic tests were carried out to ensure the quality of construction along the pile length. Figure 8 and Figure 9 show typical cross-hole sonic locations and results and typical pile integrity test results, respectively. In Figure 9, the blue line is the wave speed through the pile length, and the green line is the acceptable limit of the wave hazard. In general, about the top two meters of the pile have insignificant increases in wave speed. These increases may be accepted due to the poor quality of concrete. After the top two meters, the wave speed was found to be inside the limit until the pile tip. This indicates that the pile length and the diameter match the theoretical dimensions and that there are no major defects (e.g., separation in concrete) along the pile length. After checking the quality of construction and shaft integrity, the pile load tests started.

3.2. Pile Load Tests

To develop a design approach for piles in IGMs, more research with pile load test data is needed. Until an accurate design method becomes available, the dynamic load tests should be conducted for a single pile or group to confirm the available design approach [17].
Practice codes demand implementing two main types of pile load tests: the preliminary pile test and the working pile test [4,7,12,20]. A preliminary pile test is performed on non-working piles before the piling works begin, while the working pile test is carried out when substantial piling works have been completed. The non-working and working pile tests allow designers to adopt a higher resistance factor ( φ ) due to increased reliability [1,39].
Significantly, the pile load static and dynamic tests can investigate IGMs’ behavior due to changes in properties that can be difficult to measure and predict [16].
The number of working pile load tests was selected to cover one test for 200 piles. One non-working pile load test for each building was considered. Forty-four (44) static and dynamic compression load tests were performed 28 days after the construction of the working and non-working piles. Non-working piles were constructed under the same conditions as the working piles.
Figure 10 shows the static compression pile load test at the site. The test procedure has been performed in accordance with [4,44,45]. For the non-working piles, the loading was carried out until it reached about 200% of the design load. Then, unloading took place until it returned to zero.
For the working piles, the loading was carried out until it reached 150% of the design load, then it was unloaded to 0%. A two-cycle test was conducted on pile 5NTS-D, where loading was carried out until reaching the design load amount. Then, unloading took place to return to zero. In the second cycle, the loading reached about 200% of the design load, followed by unloading to 0%.
Table 2 and Table 3 show the static compression loading procedure for working and non-working piles, respectively. The load is a percentage of the design pile capacity.
Static pile load testing is expensive and time-consuming, especially for huge projects, according to [6]. Ref. [5], recommended that the dynamic test be used to predict pile behavior. Dynamic load testing has benefits in that it is a relatively fast test with a quick set-up time. For loads above 10 MN, the testing rate is normally two piles per day [28]. The time savings and simple equipment result in test costs being two orders of magnitude lower than equivalent static tests, according to [53].
However, it is not intended to replace static load tests. Thus, it is recommended to calibrate the results of the dynamic test with static tests for a specific location to check the accuracy of the dynamic versus the static pile load test. Several researchers have compared the results of dynamic and static pile load tests [22,24,25,32,38,40,46,57]. In most of the research, there has been clear controversy over the relationship between dynamic and static pile load tests. Therefore, calibration of the load–settlement response of piles from dynamic testing with the measurements from static pile tests for each project site is crucial.
In this project, high-strain dynamic pile testing was carried out on twenty-one working and non-working piles, as depicted in Table 2.
For the high-strain dynamic pile testing, four sensors and four transducers were fixed on the pile perimeter to monitor the dynamic response. According to the American Standard Test Method for High-Strain Dynamic Testing of Deep Foundation, Ref. [5], transducers and sensors were always near the pile top (within 1.5 to 3 times the pile diameter), as shown in Figure 11. This precaution is to avoid including cracks between the strain transducer attachment points and the pile, which could induce serious errors.
During the impact, the generated stress wave traveled down to the pile toe and back up again to the top of the pile. The pile driving analyzer, PDA, recorded force and velocity measurements from the sensors and transducers.
The test procedure was performed in accordance with the Standard Test Method for High-Strain Dynamic Testing of Piles [5]. For high-strain dynamic load testing, the load was applied using a falling weight, which was about 1–2% of the test load. To attain the target load, three blows by the impact hammer, weighing 180 kN, were dropped from a height of 1.0 m for the 800 mm diameter pile and from a height of 3.0 m for the 1200 mm diameter pile. The target load was the same as in the static load test (150% of the design load for the working pile and 200% of the design load for the non-working pile). The pile head was protected from the dynamic strains by a 50 mm plywood cushion. The dynamic pile load test configuration, crane, and weight of the dynamic test are shown in Figure 12.
The tests were analyzed via the Case Pile Wave Analysis Program (CAPWAP). This calculates friction stresses along the pile shaft and end-bearing stresses at the pile tip. Based on the CAPWAP, the load–displacement response curve was inferred for each pile. The analysis is based on closed-form algorithms for the propagation of compression waves in a one-dimensional rod. Ref. [15], stated that there are uncertainties associated with the application of the algorithms due to the complexity of the test. Several variables influence the accuracy of the interpreted pile load displacement, which includes pile type, dimensions, and subsurface ground conditions. Hence, it is important that the method be first calibrated against a static pile test.
During the pile testing, it was recognized that the pile load–settlement behavior was very conservative. Settlement did not exceed 1.6% of the pile diameter at twice the design load. This finding agrees considerably with the published literature addressed in previous sections. The literature recommends a reconsideration of the resistance factors of the AASHTO LRFD, particularly for IGM sites. The following section is devoted to investigating the efficiency of different approaches for determining the allowable (nominal) and ultimate capacities of bored piles. The piles are located in multiple layers of IGM soil at the Alamein site in Egypt. The efficiency is conducted with respect to the statistical one of AASHTO LRFD [1]. These approaches are the prediction from static pile load tests, numerical analysis, and dynamic wave analysis.

4. Pile Load Test Results and Discussions

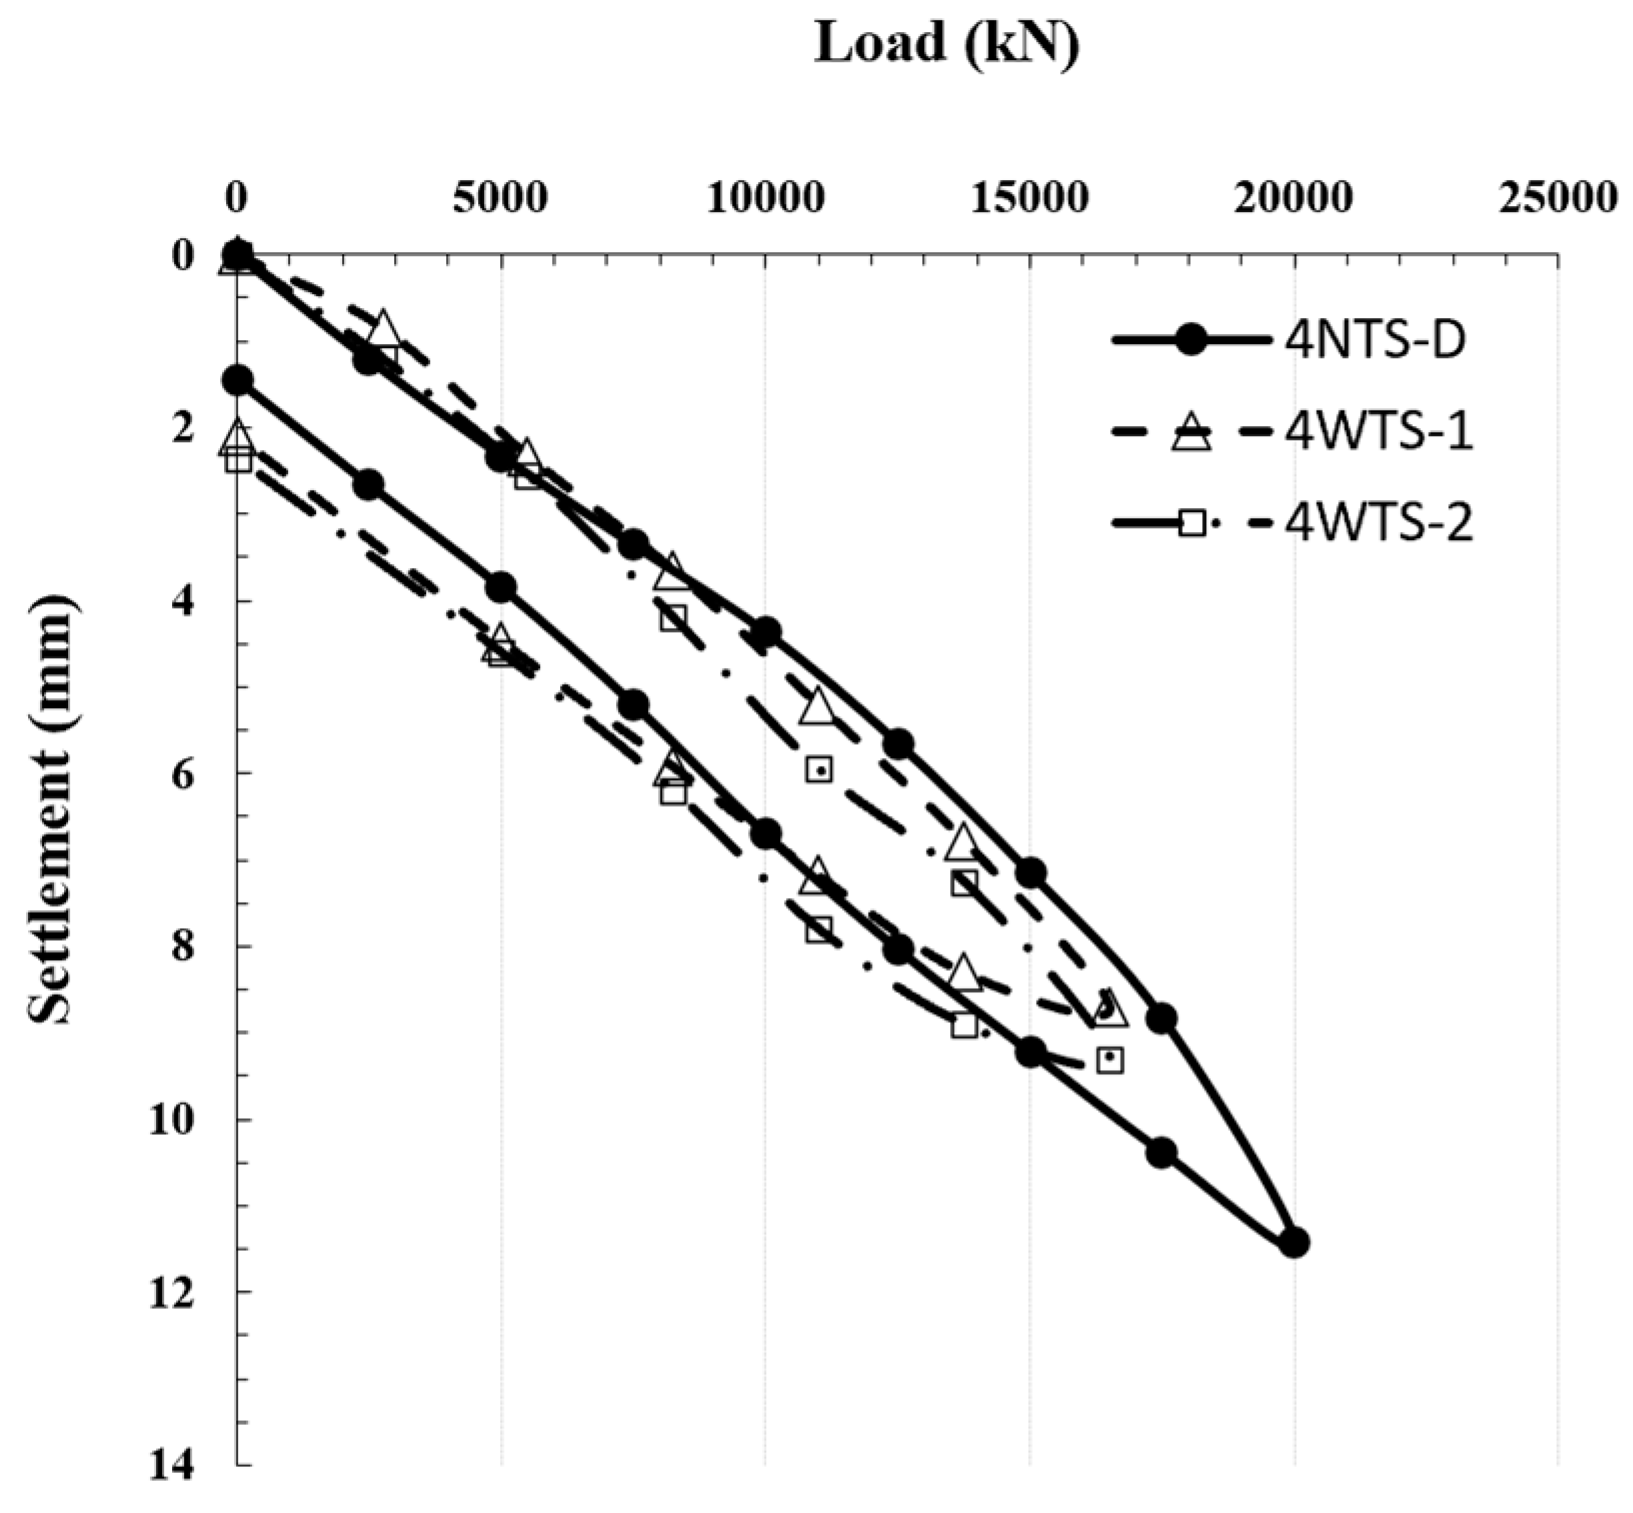
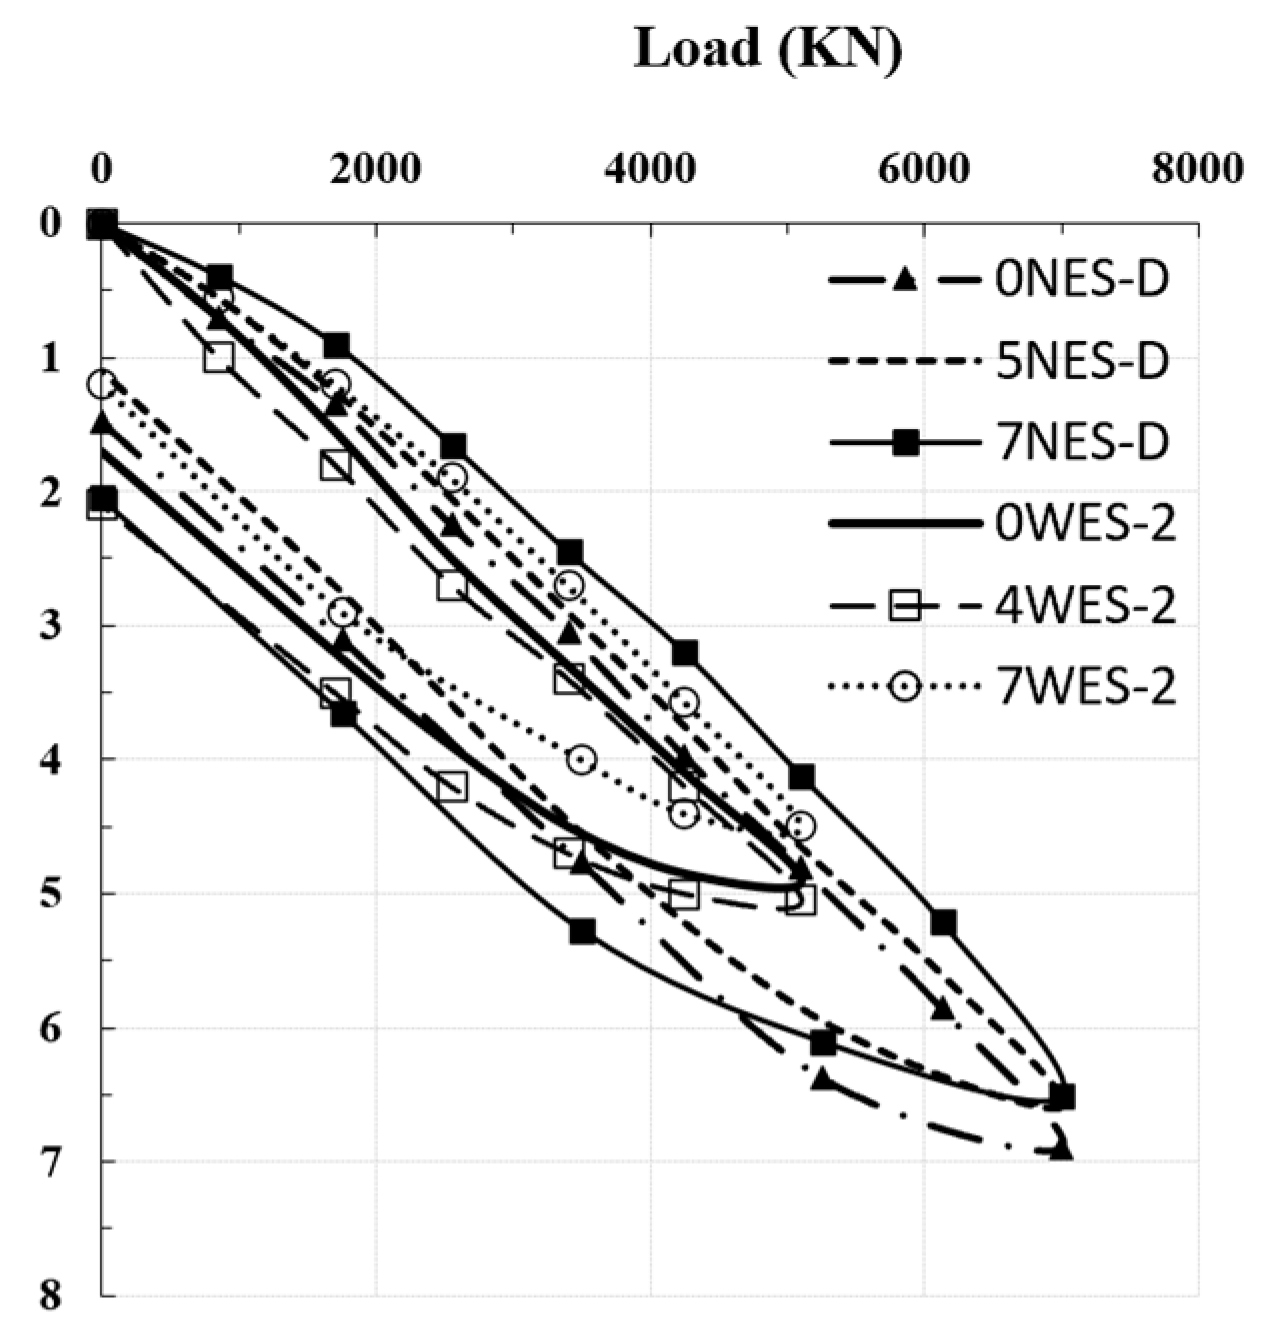
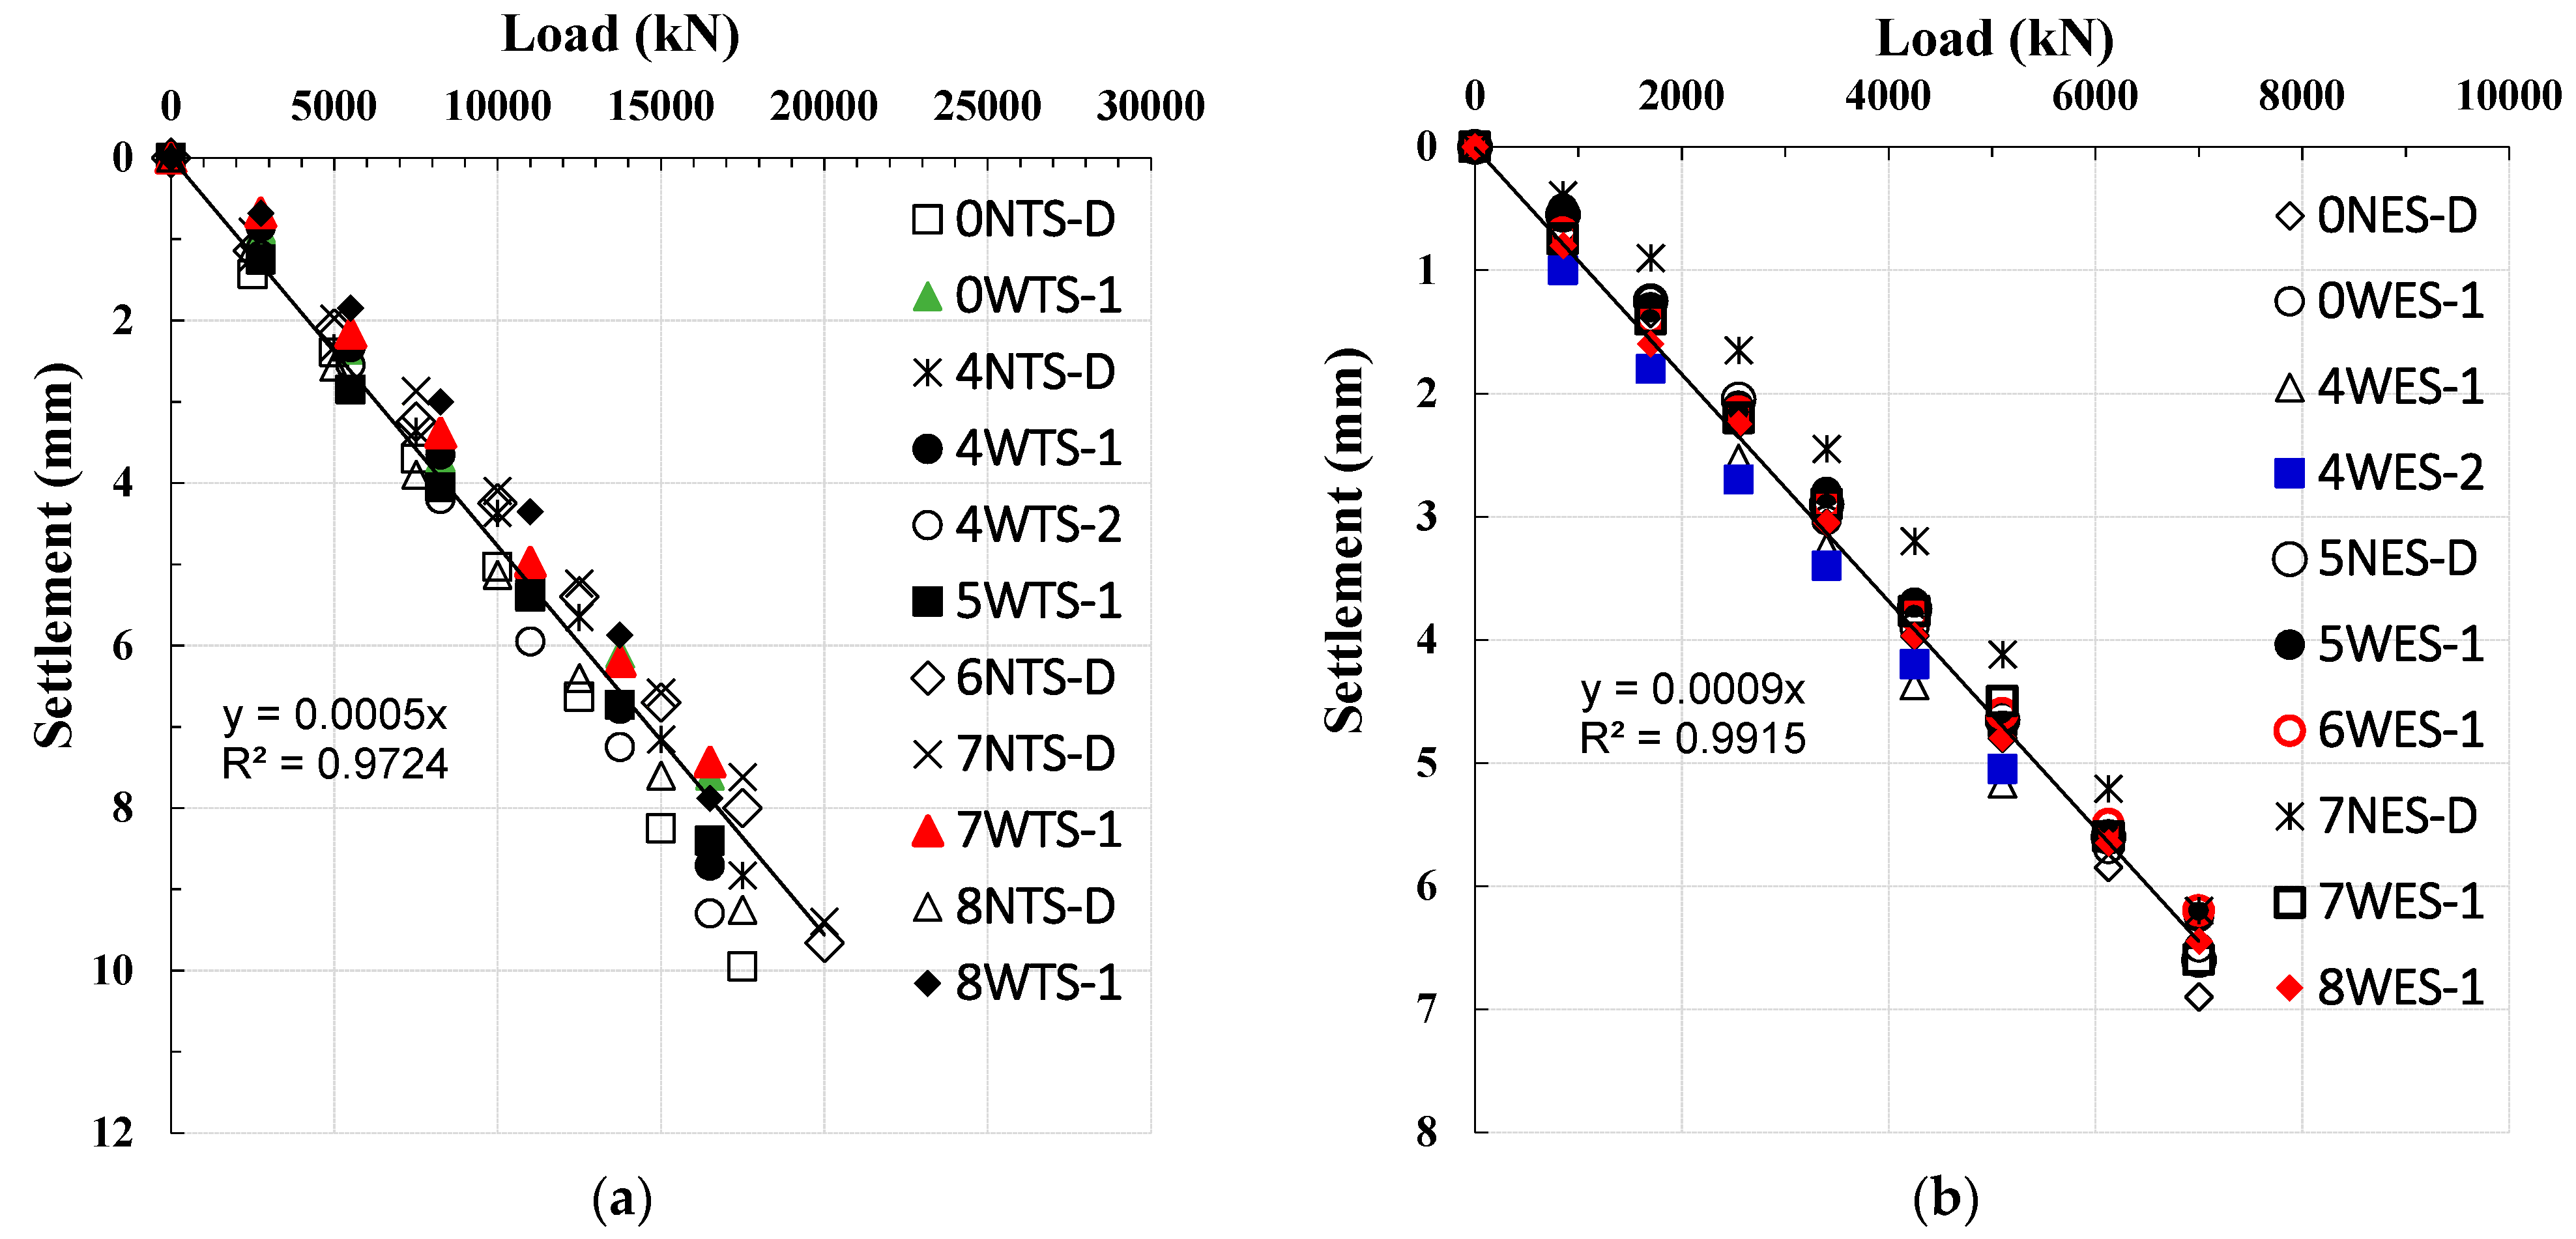
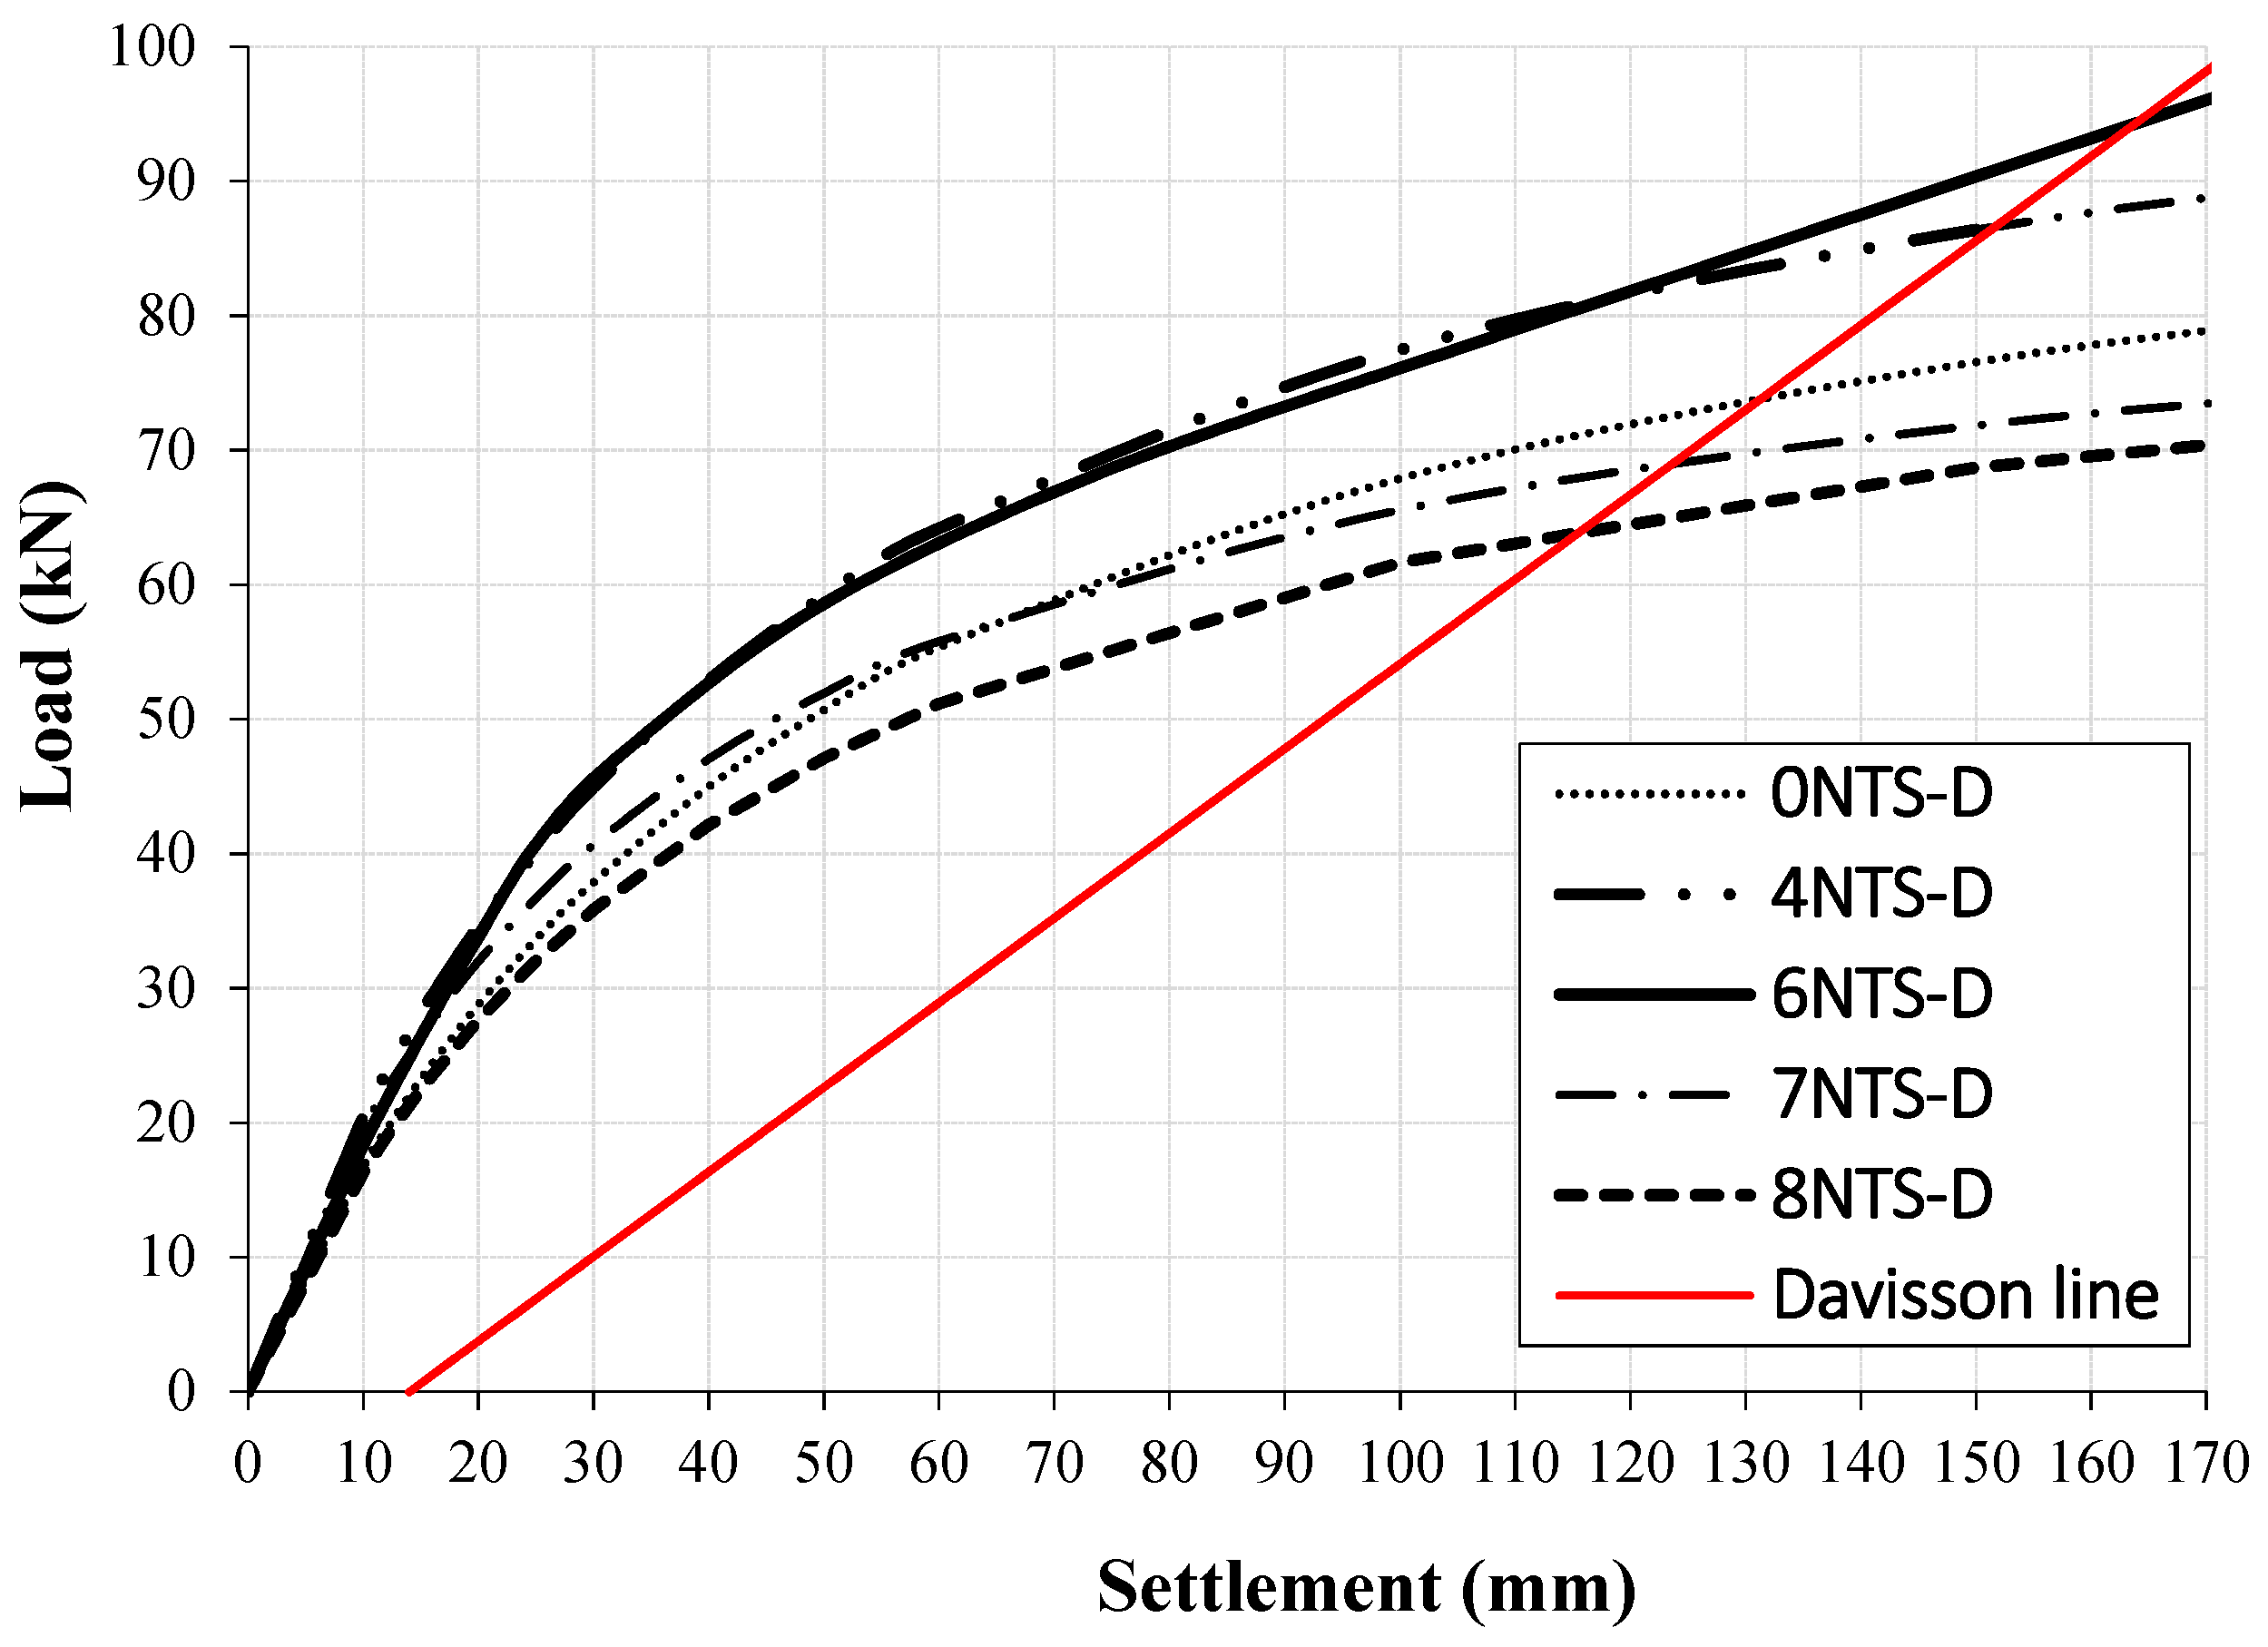
4.1. Load–Settlement Behavior from Static Pile Load Test

Static pile load tests were carried out on working and model piles with diameters of 1200 mm and 800 mm. Figure 13 depicts the typical load–settlement behavior of working and non-working pile load tests. From Figure 13, it can be seen that the working and non-working piles have the same behavior under static compression load tests. Also, the maximum settlement is around 12.0 mm. This is equivalent to 1% of the pile’s diameter. That is, the piles under one cycle of loading and unloading behave like friction piles since the 5 to 10% pile diameter needed to mobilize end-bearing resistance had not been attained, according to [37]. The pile behaves under the static test as a friction pile from the pile load test by [13] when using a pile with a diameter of 1200 mm and a total length of 40.0 m.
A two-cycle test was conducted on pile 5NTS-D, where loading was carried out until reaching the design load. Then, unloading took place until it returned to zero. In the second cycle, the loading reached about 200% of the design load, followed by unloading to 0%. Figure 14 presents the load–settlement behavior of one- and two-cycle pile load tests on 8NTS-D and 5NTS-D, respectively. Figure 15 depicts the load–settlement relationships of load tests on non-working and working 800 mm diameter piles. As shown in Figure 15, the maximum settlement at about 200% of the design capacity was about 7.0 mm (1% of the pile diameter), which also indicates that the piles behave as friction piles. Also, none of the piles reached the ultimate or failure condition.
As seen from Figure 16, at first, the two piles behave similarly. Sc1 is the settlement of pile 5NTS-D at the end of the first cycle, at the design load of 10 MN, Sc1 = 8 mm, whereas Sc2 is the settlement of the pile at the design load of the second cycle, Sc2 = 10 mm. That is, SC2 = 1.25 SC1. That is, settlement at the design load of the second cycle increased by about 25% of the settlement at the same stage of loading in the first cycle.
SMax. (8NTS-D) and SMax. (STN 12) are the maximum settlement of piles 8NTS-D and 5NTS-D, respectively, after 20 MN loading. Smax (8NTS-D) = 12.5 mm, while Smax (ST N12) = 19 mm. That is, Smax STN12 = 1.50 Smax (8NTS-D). In other words, cyclic loading, until the ultimate, increases settlement considerably, even though an Smax STN12 of 19 mm is equivalent to a 1.6% pile diameter. That is, the piles under one or two cycles of loading and unloading behave as friction piles.

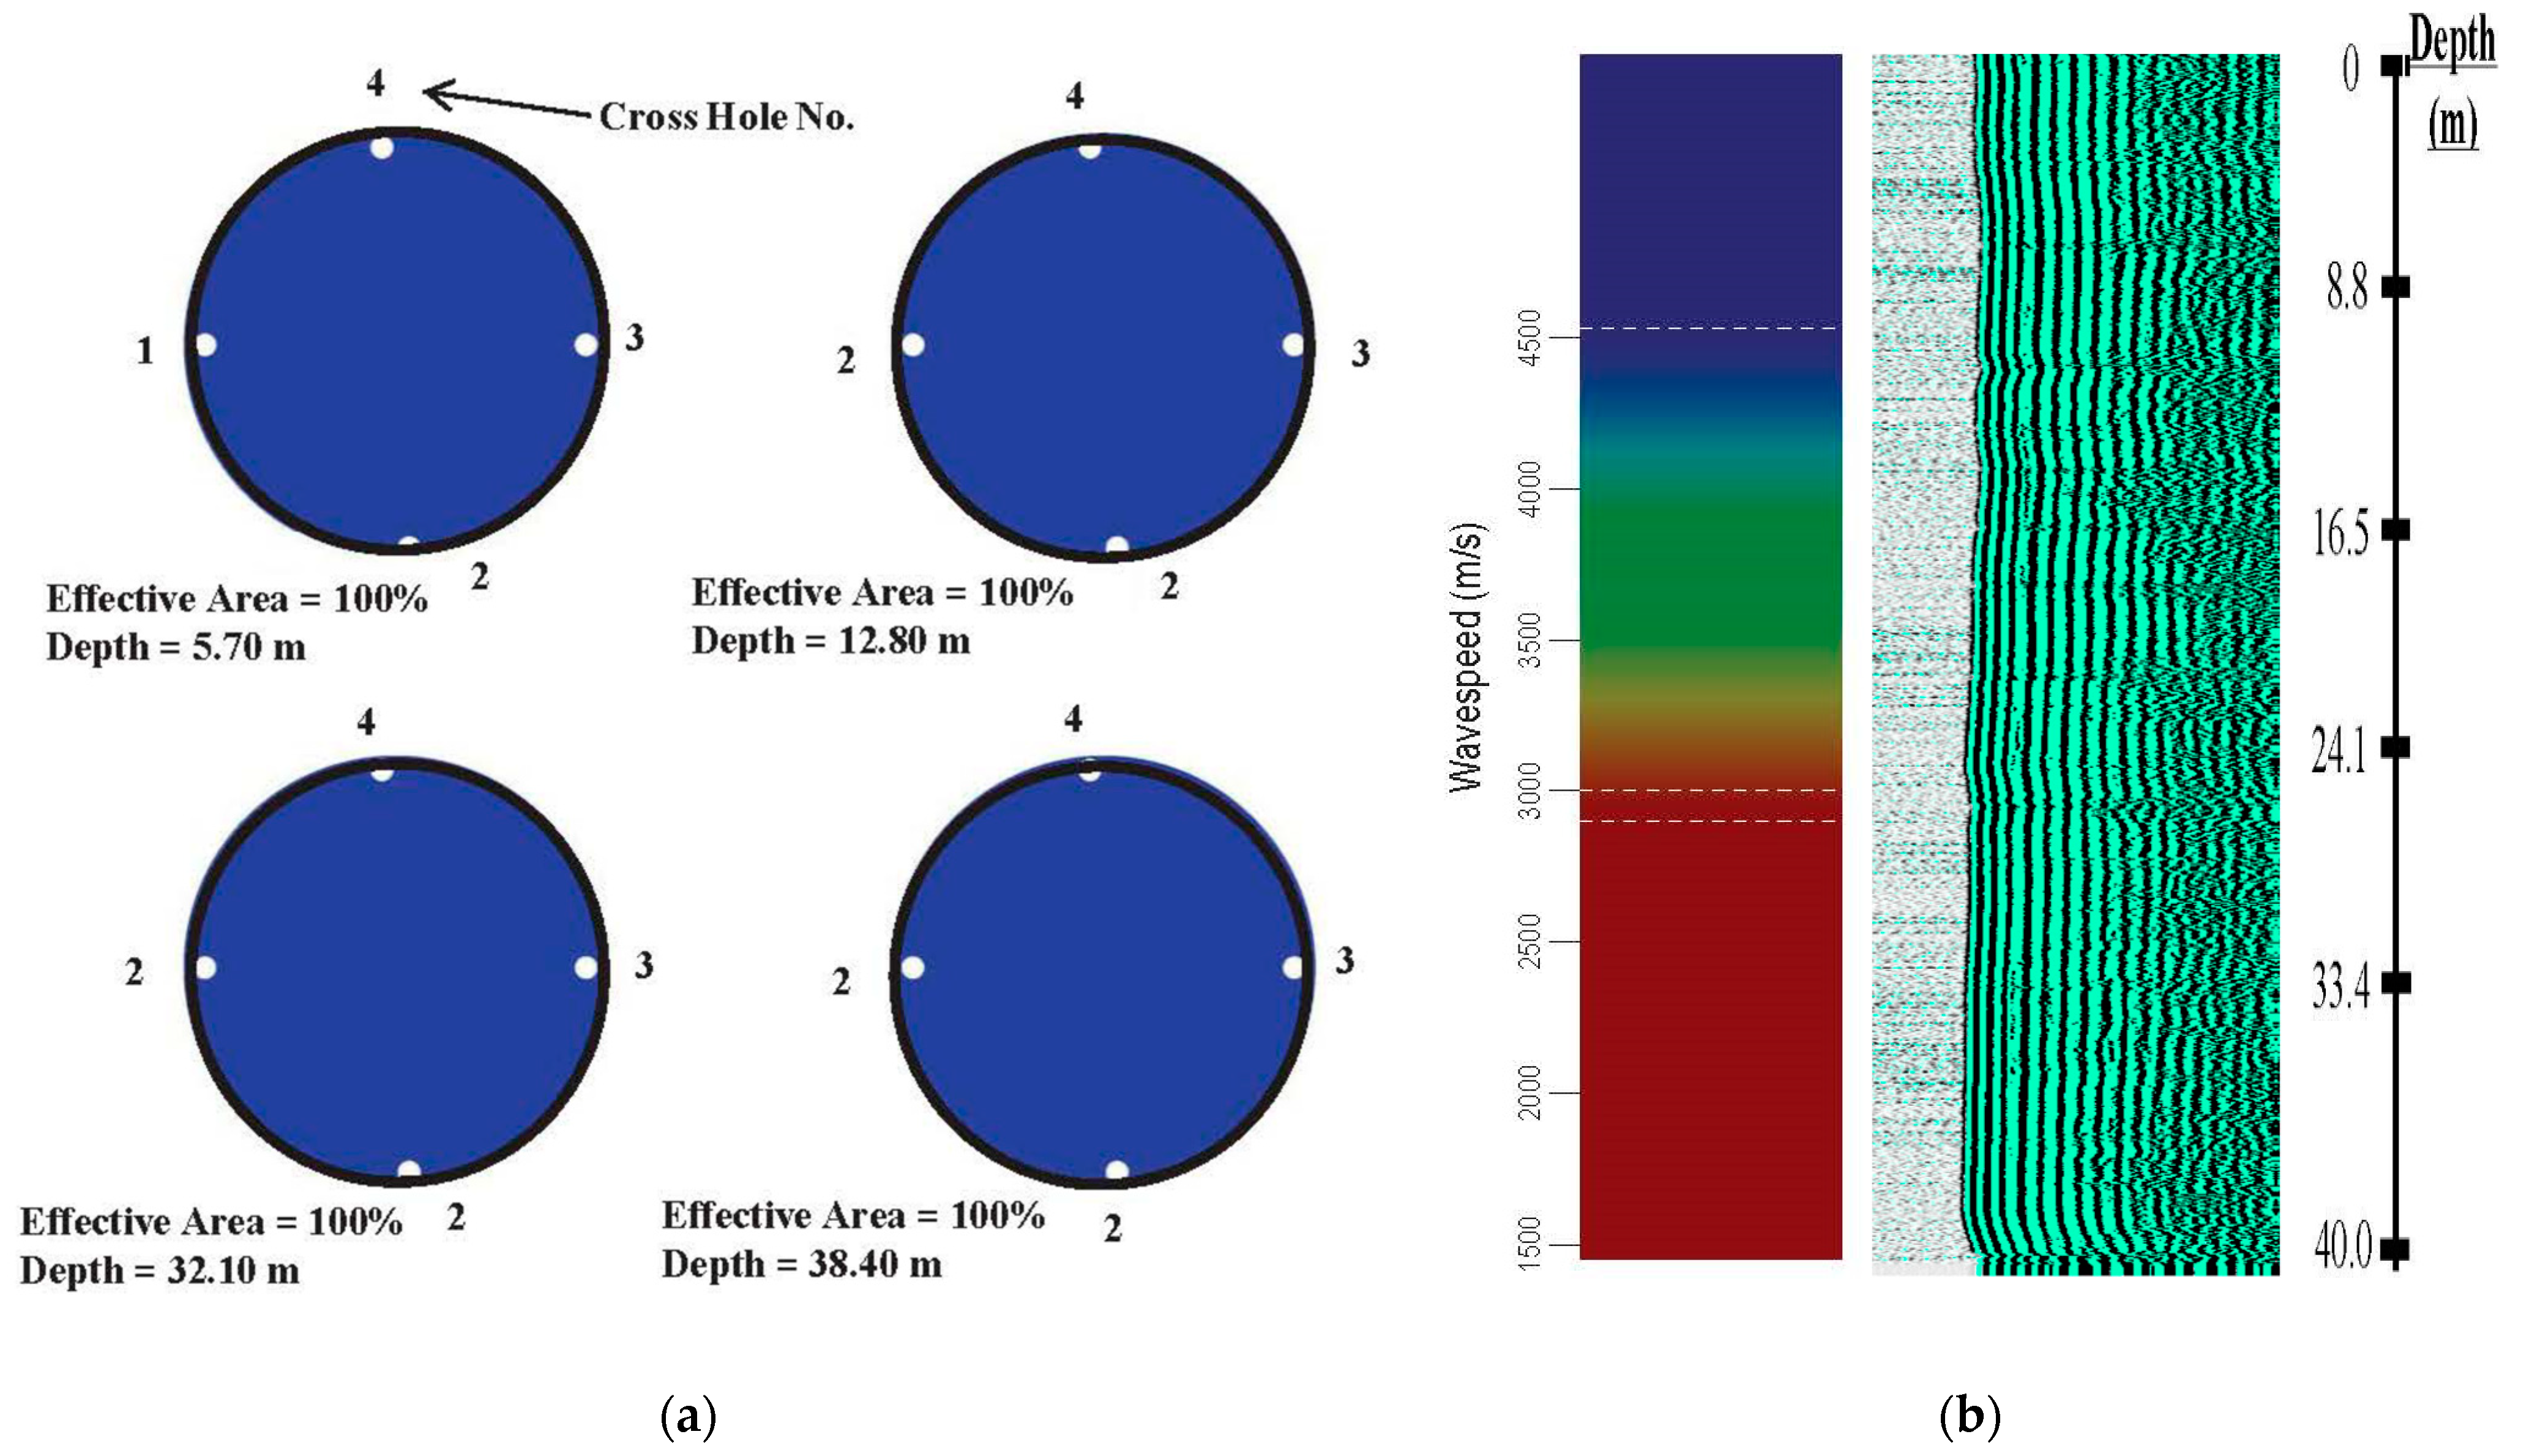
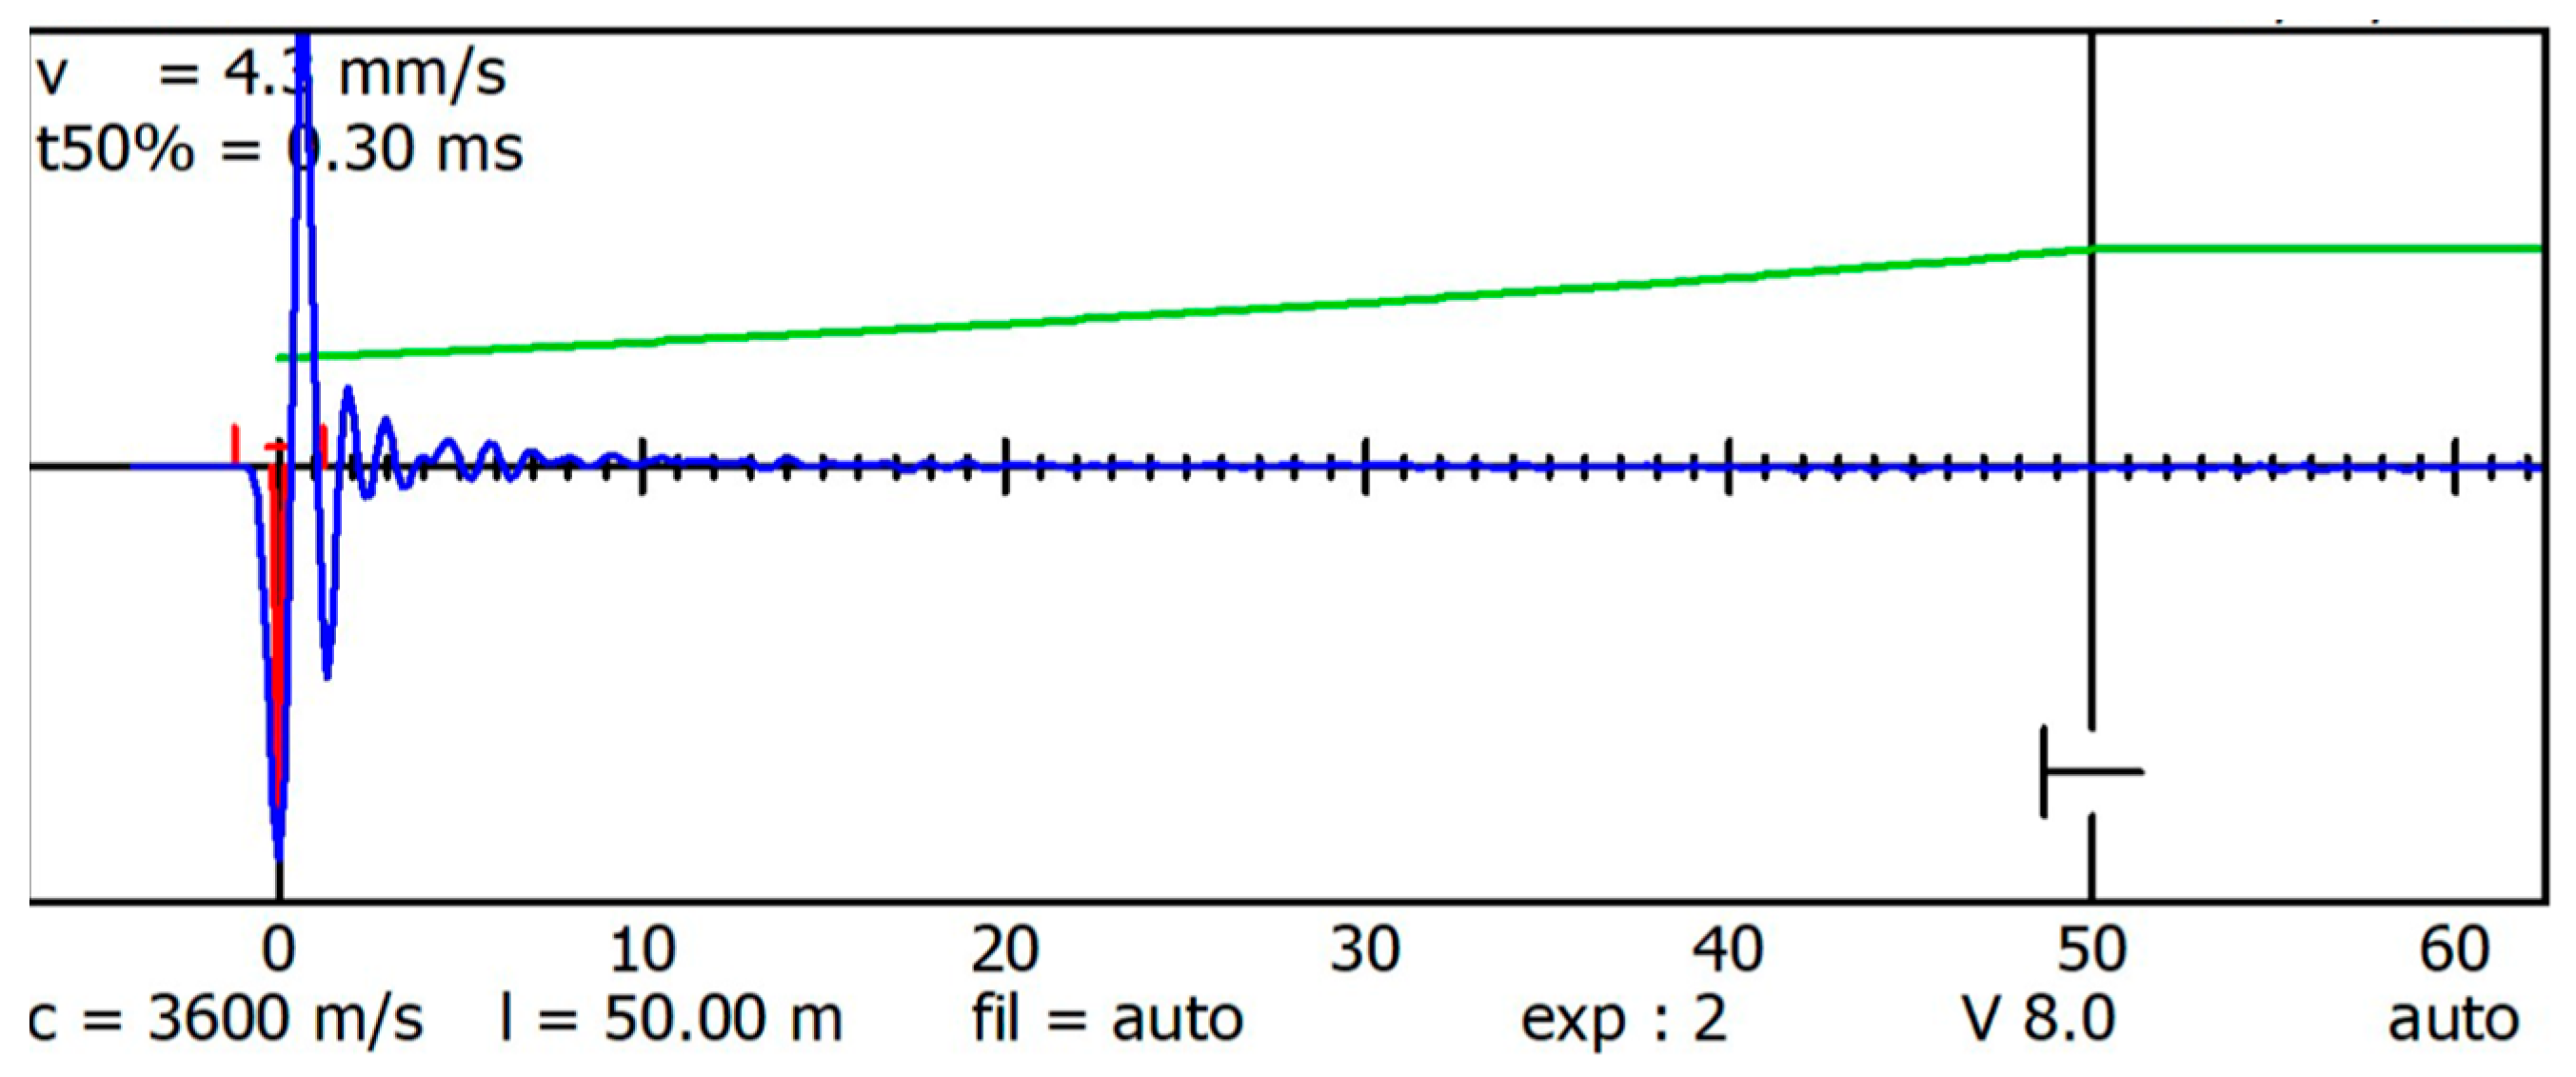
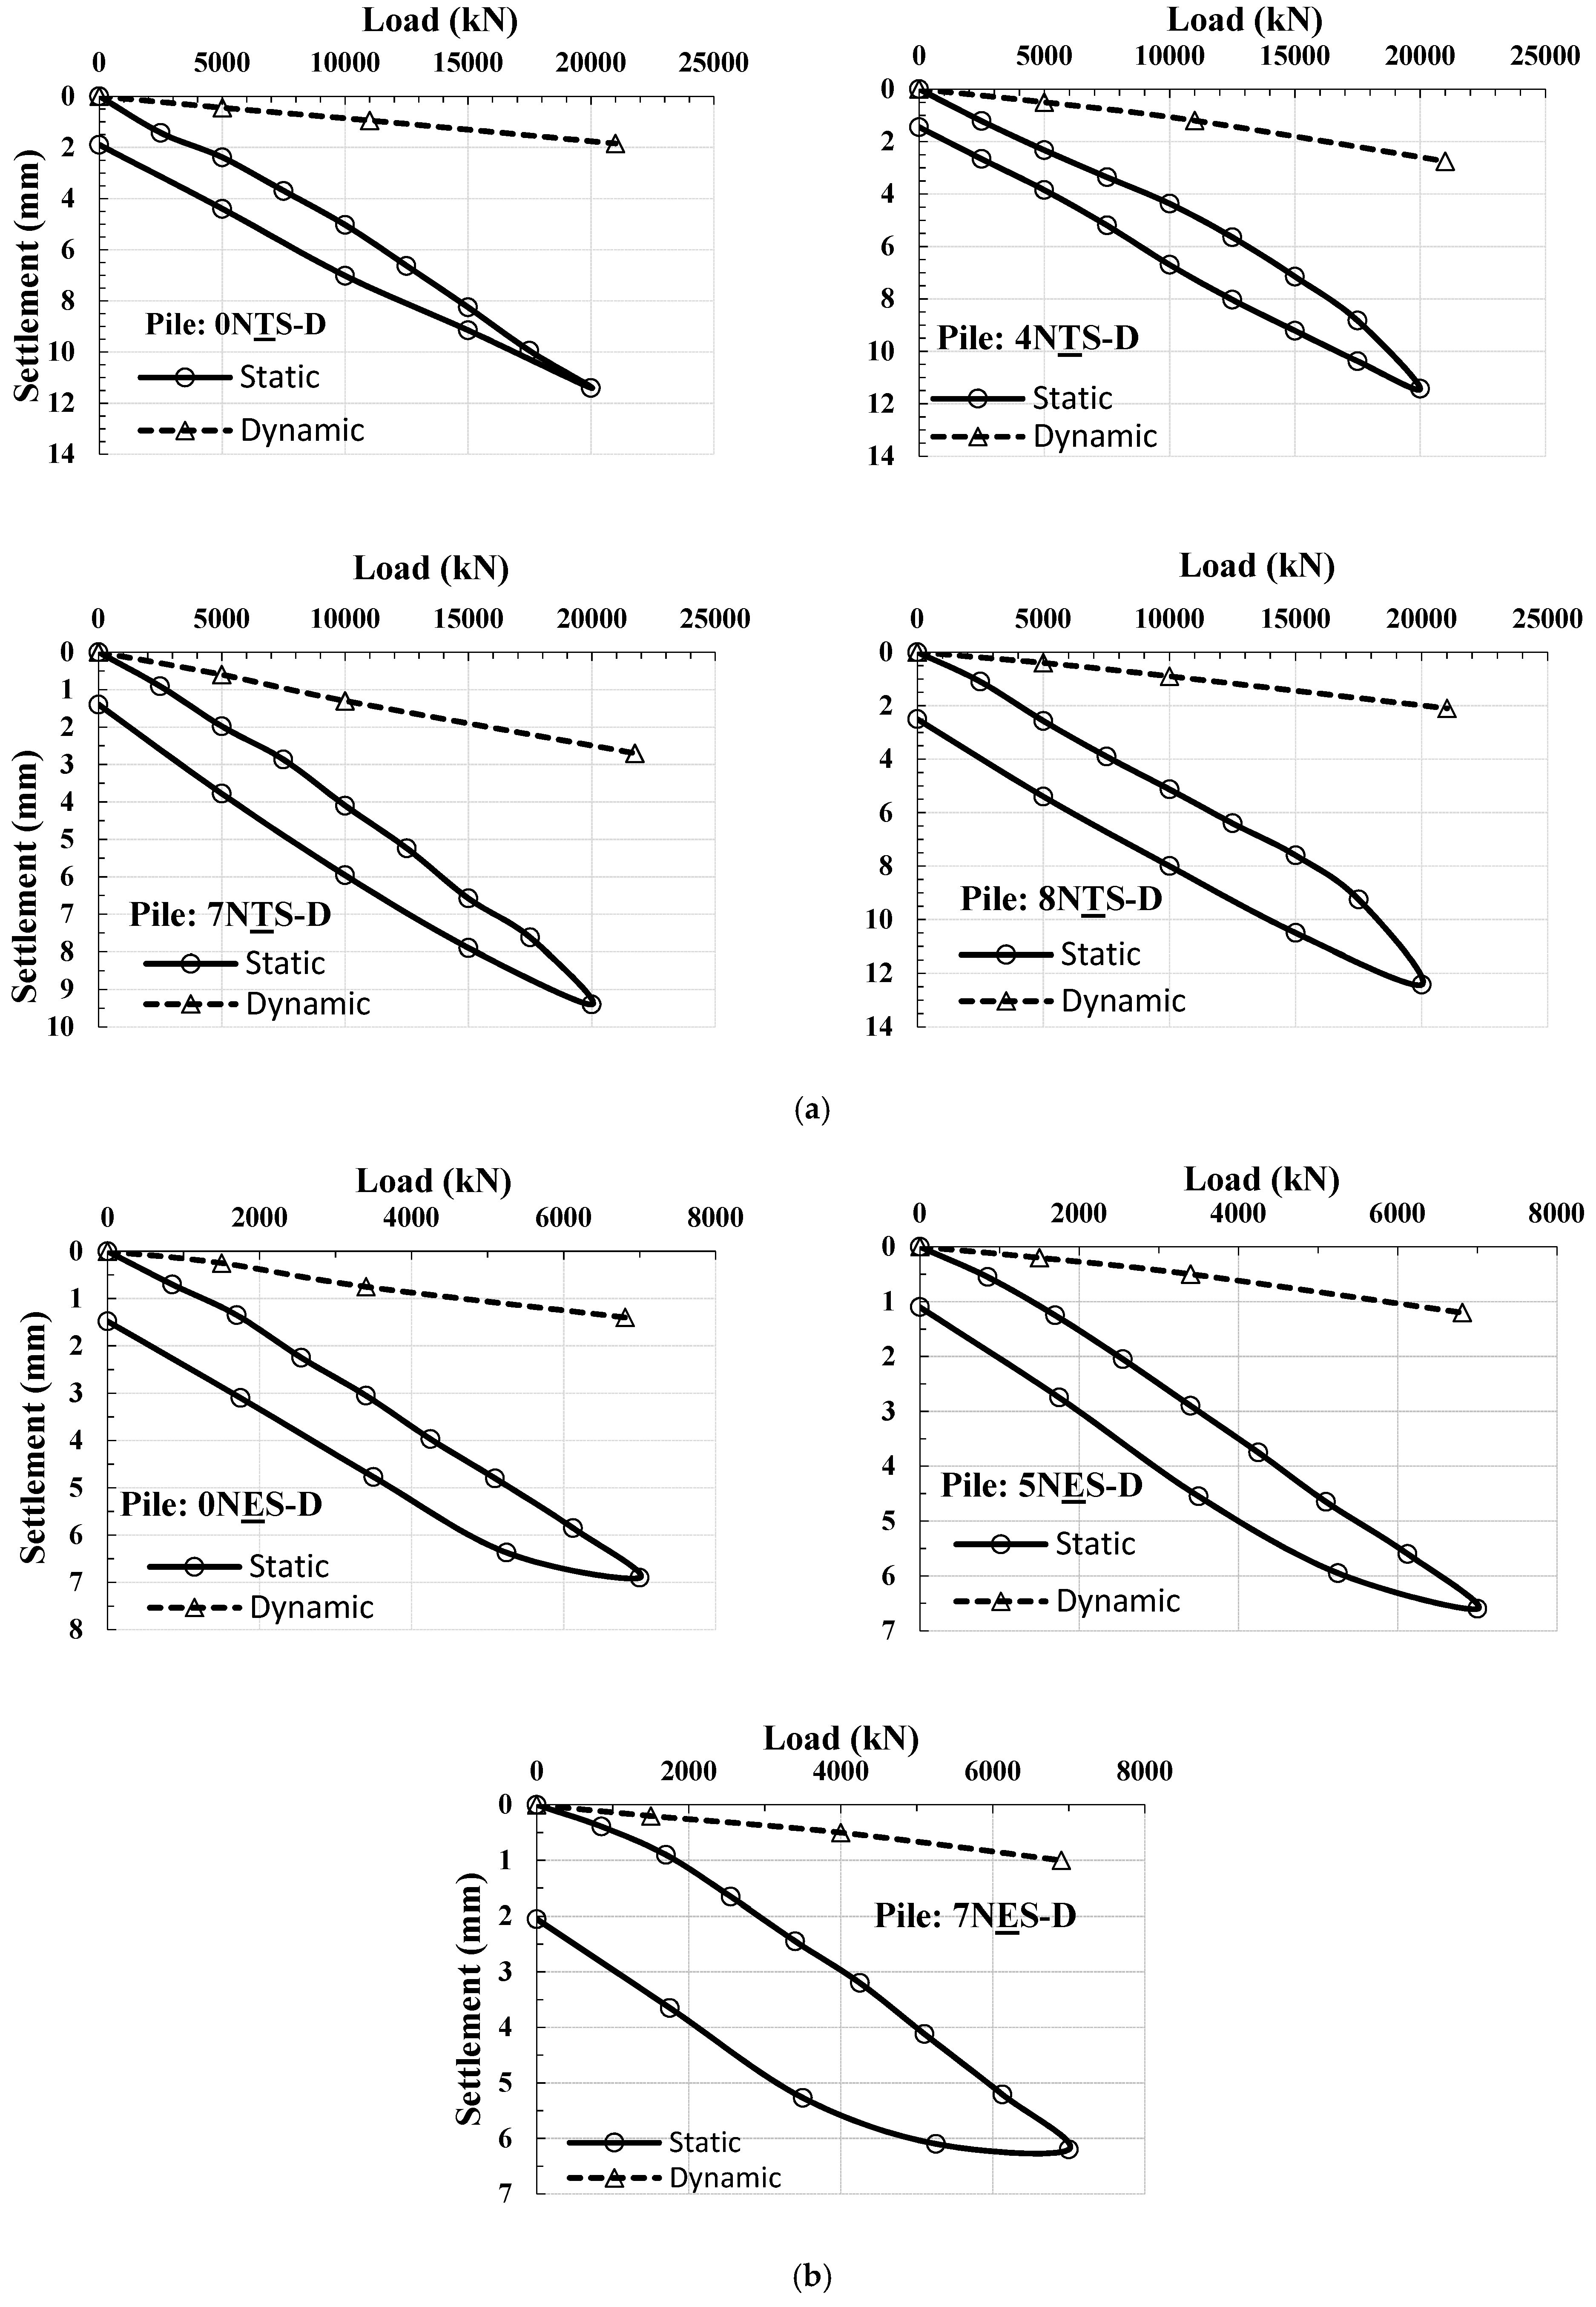
4.2. Behavior Analysis Based on Dynamic Load Tests

It is remarkable that the tested piles resisted the acting loads without any type of failure during the test. This indicates the reliability of the high-strain dynamic load test as a safe method of testing the working and non-working piles.
As explained in Section 4.1 there are many uncertainties associated with the pile-driving analysis. Thus, it is important that the method is first calibrated against a static pile load test. The load–settlement responses from static and dynamic load tests that were carried out on the same non-working piles were analyzed for calibration. The dynamic load test piles are illustrated in Table 2. The time between the two tests was 30 days. The pile head level was measured and found to be almost at the same level from the end of the static test to the beginning of the dynamic one. For the 1200 mm diameter piles, the static and dynamic behaviors are shown in Figure 16a. For the 800 mm diameter piles, the static and dynamic behaviors are shown in Figure 16b.
As shown in Figure 16a,b, the load–settlement response induced by the dynamic load test is almost a straight line. It was manageable to achieve the designated loading within three blows for each pile diameter. However, the settlement from the static load test was about 4.0 to 5.0 times that of the settlement from the dynamic load test. This indicates that the time period of loading has a significant effect on the pile’s behavior. The quick-loading procedure of the dynamic test builds up a high pore water pressure in low-permeable media, such as cohesive soils, soft or weathered rocks, and cohesive IGMs. Moreover, the settlement calibration is illustrated in Table 4.
From Table 4, the induced settlement from the dynamic test is about 20% of the final settlement from the static test for pile diameters of 800 and 1200 mm, which indicates the behavior of the piles as friction piles. Dynamic load tests were carried out on the site, considering the calibration analysis. That is, settlement should not exceed 2.8 mm for 1200 mm diameter piles and 1.2 mm for 800 mm diameter piles.
Dynamic pile load tests were carried out on working and non-working piles with diameters of 1200 mm and 800 mm. The tests were analyzed via the Case Pile Wave Analysis Program (CAPWAP). This calculates friction stresses along the pile shaft, end-bearing stresses at the pile tip, and pile top displacement at the activated capacity. Based on the CAPWAP, the load–displacement response is inferred for each pile. The results of the dynamic load tests are summarized in Table 5, which shows that the load transferred by friction is about 90% of the acting load, and the remaining load percentage was transferred by the bearing. This indicates, matching the static load test results, that the piles behave as friction piles.

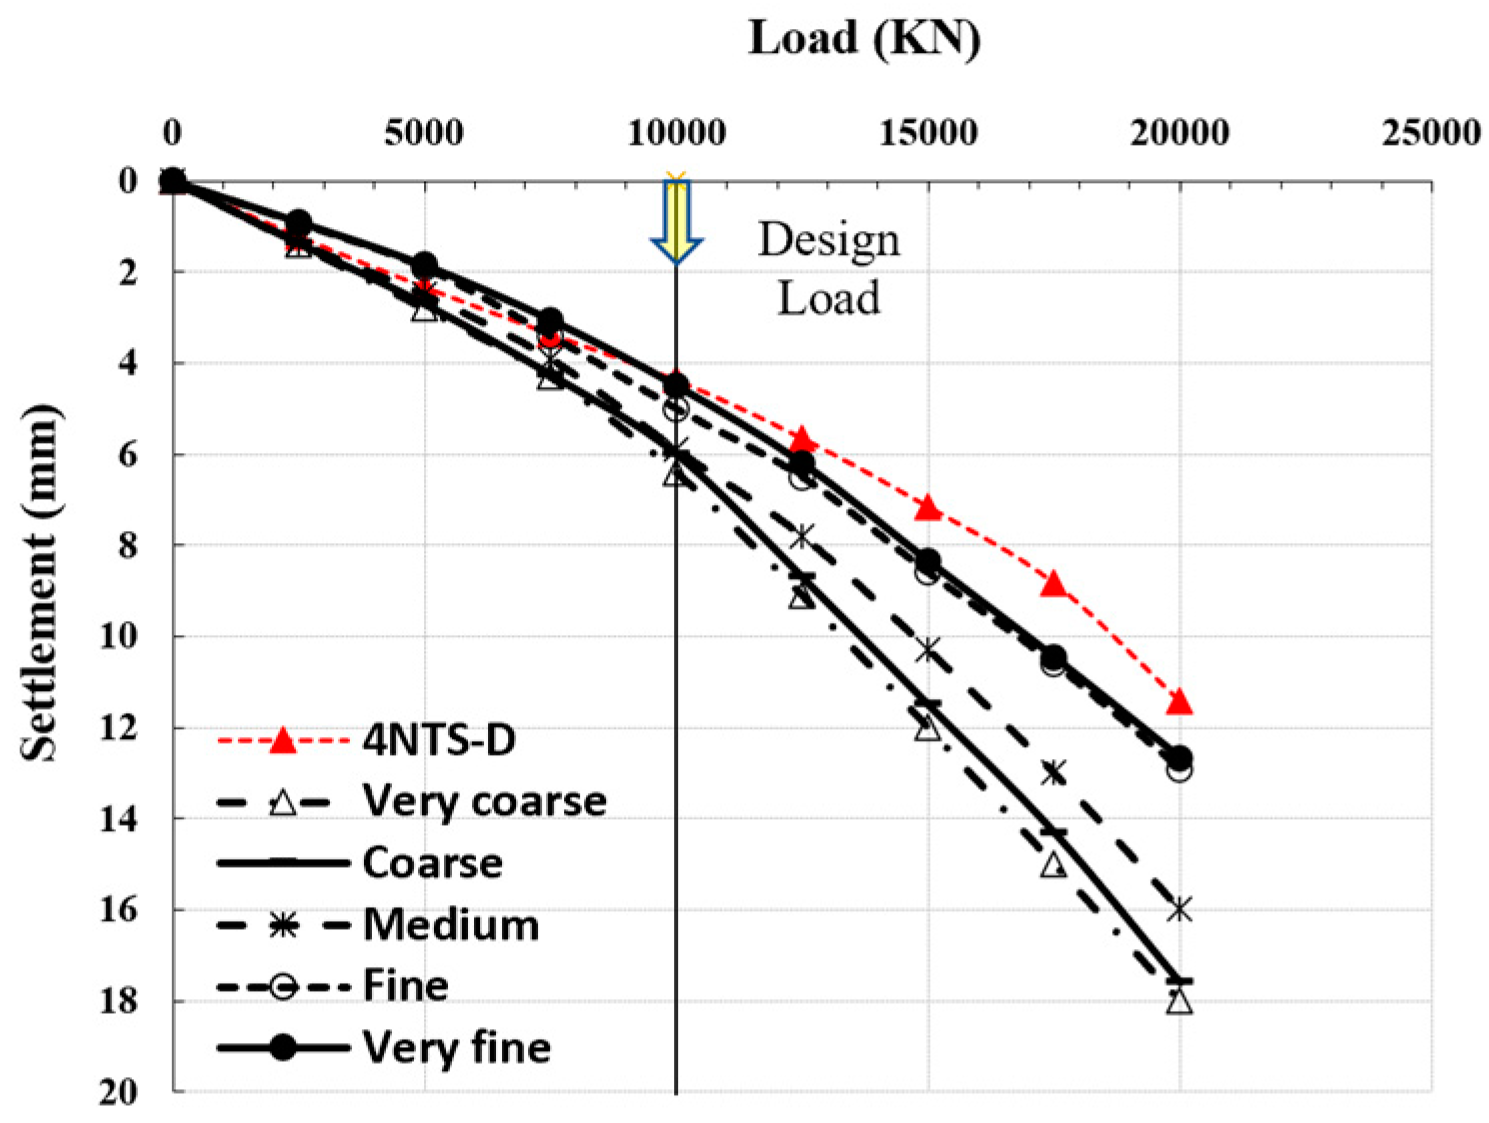
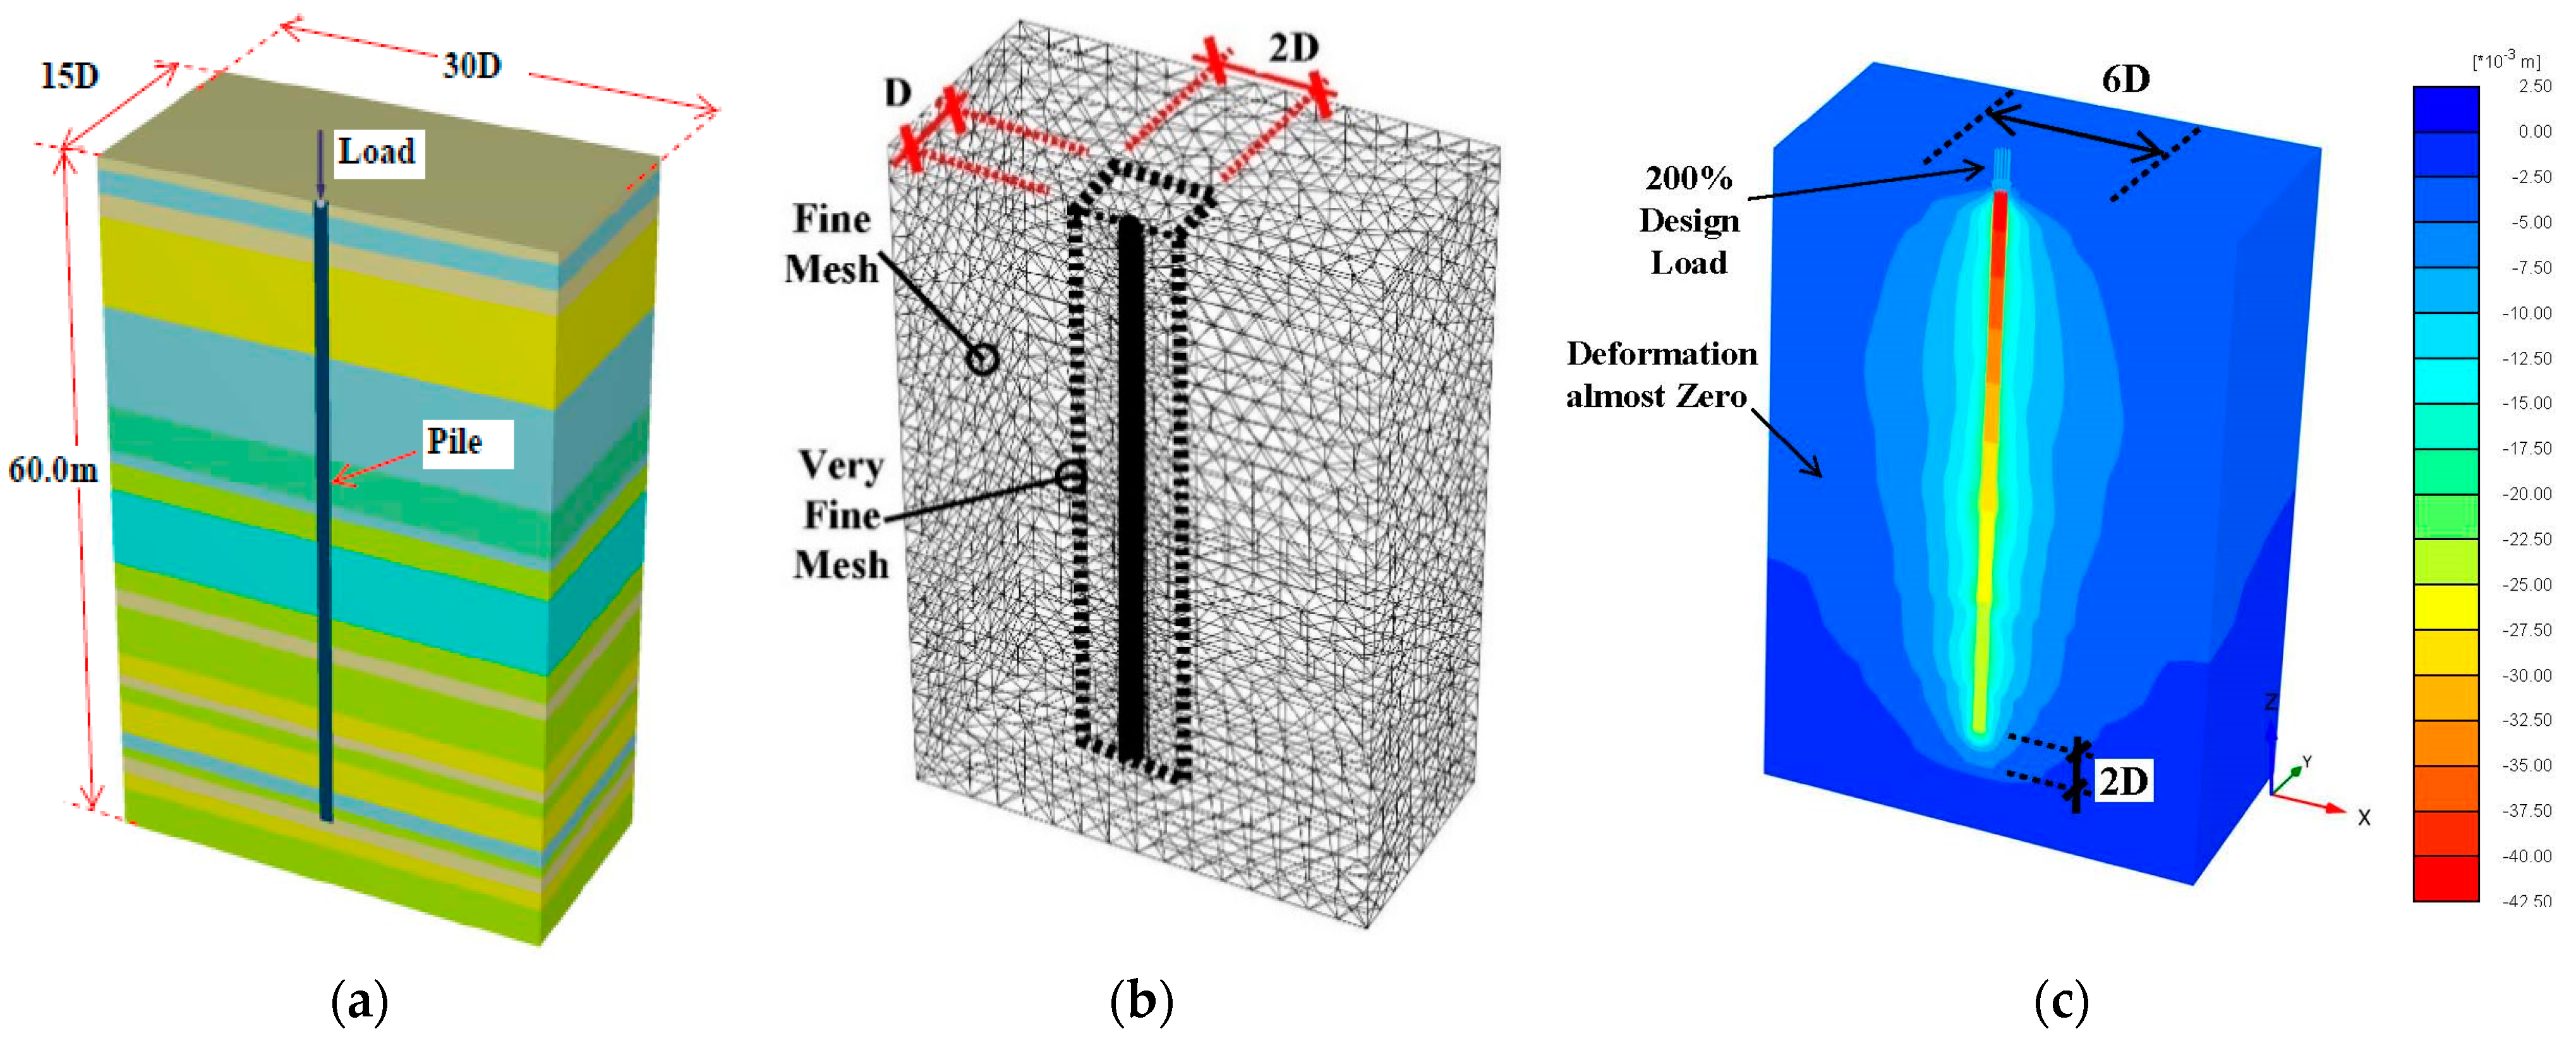
5. Numerical Modeling

Numerical analysis by PLAXIS 3D (2020) [42], was utilized to simulate the static compression pile load test and then analyze the behavior of a large-diameter long pile. The pile model was simulated using two constitutive soil models, the Mohr–Coulomb, MC, model and the hardening soil, HS, model. The MC and HS models were used to select the model that better matches the measured behavior from the pile load test. The HS model is an isotropic hardening plasticity model capable of simulating the behavior of IGM soil layers and accounts for the increase in stiffness with effective stress [52]. MC parameters are soil bulk unit weight (γ); friction angle (ϕ); secant modulus, Es; and cohesion, C. HS modeling has the same parameters as MC, in addition to unload/reload and an oedometer moduli. The properties of IGMs and soil layers using MC and HS models are presented in Table 6 and Table 7. The properties were provided by the geotechnical investigation program. The concrete pile material was simulated using a linear elastic model using Young’s modulus relative to the characteristic strength of the concrete of 40 MPa.
The model’s width and length were selected at 30 and 15 times the pile diameter, respectively, to ensure that the stress zone was covered. The mesh size was a variety of very coarse, coarse, medium, fine, and very fine [64]. The size of the mesh was evaluated to select the most proper option to provide a good match to the pile load test results. Figure 17 shows the pile load–settlement response considering all of the available mesh sizes. It can be seen from Figure 17 that insignificant changes were found between considering the global mesh coarseness as fine and very fine. When considering the very fine option in the zone equal to the pile diameter around the pile and a fine size for the whole model, the load–settlement response had the same result when selecting the very fine mesh size for the whole model. So, a fine mesh option was selected for global coarseness. A very fine mesh option was selected for a spacing equal to the pile diameter around the pile. Figure 18 shows the model configuration and the mesh size generation around the pile and for the whole model and the deformation results of the FE model.
The interface element, Rinter, represents the friction between soil layers and pile material, which ranges from 0.6 to 1.0 according to the pile material. The Rinter of 0.67 was considered as recommended by [3] and many other researchers. The water level at 1.0 m depth was considered in the flow condition in the PLAXIS model. The water density of 10.3 kN/m3 was taken to simulate the seawater condition. The load test on the non-working pile 4NTS-D was adapted for the verification of the PLAXIS modeling. Figure 18 shows the load–settlement behavior for the finite element, FE, model using the HS and MC models and the non-working load test of pile 4NTS-D.
As shown in Figure 19, the FE modeling simulates the behavior reasonably well. The MC and HS models match settlement until 0.5 of the design loads. However, the HS model provides better modeling to the end of the loading–settlement curve at twice the design load. Therefore, the HS model was selected to simulate the behavior of IGMs and soil layers in the parametric study.

6. Specific Analysis for Alamein Site

6.1. Site-Specific Equations for the Load–Settlement Response

The data points of loading behavior in the pile load tests for 1200 mm and 800 mm diameters are presented in Figure 20a,b, respectively. As seen from Figure 20a,b, the load–settlement behavior follows a linear trend until twice the estimated design capacity. The best fit of the linear trend of settlements for both groups is presented in Figure 20a,b. The equations of the two lines for 1200 mm and 800 mm diameter piles are as follows, respectively:
S 800 = 0.0009   P
S 1200 = 0.0005   P
where S800 and S1200 are the pile settlements (mm) for piles with diameters of 800 and 1200 mm, respectively, at load P (kN).
The coefficients of determination, R2, were 0.97 and 0.99 and were provided for the two equations proposed for the 1200 mm and 800 mm diameter piles, respectively. This indicates an acceptable level of accuracy for the equations compared with the pile load test results.
The equation of the pile that was 800 mm in diameter was compared with the pile load test results of [60]. Figure 21 shows the comparison between the proposed equation and the other pile load test results and the method by Visic 1977 [48]. This shows an acceptable level of movement compared with the pile load test in the other location, which indicates that the proposed equation is valid for the other pile of 800 mm in diameter in the other project’s plot area.
The equation of the pile of 1200 mm in diameter was compared with the pile load test results of [63]. Figure 22 shows the comparison between the proposed equation and other pile load test results. The figure shows an acceptable level of movement compared with the pile load test in the other location, which indicates that the proposed equation is valid for the other pile of 1200 mm in diameter in the other project’s plot area. The proposed equation provides the load–settlement results compared with another equation.
The proposed equation gives more accurate values for the predicted displacement compared with the Visic 1977 equations [48], which provide displacement values on the conservative side, as shown in Figure 21 and Figure 22, respectively.

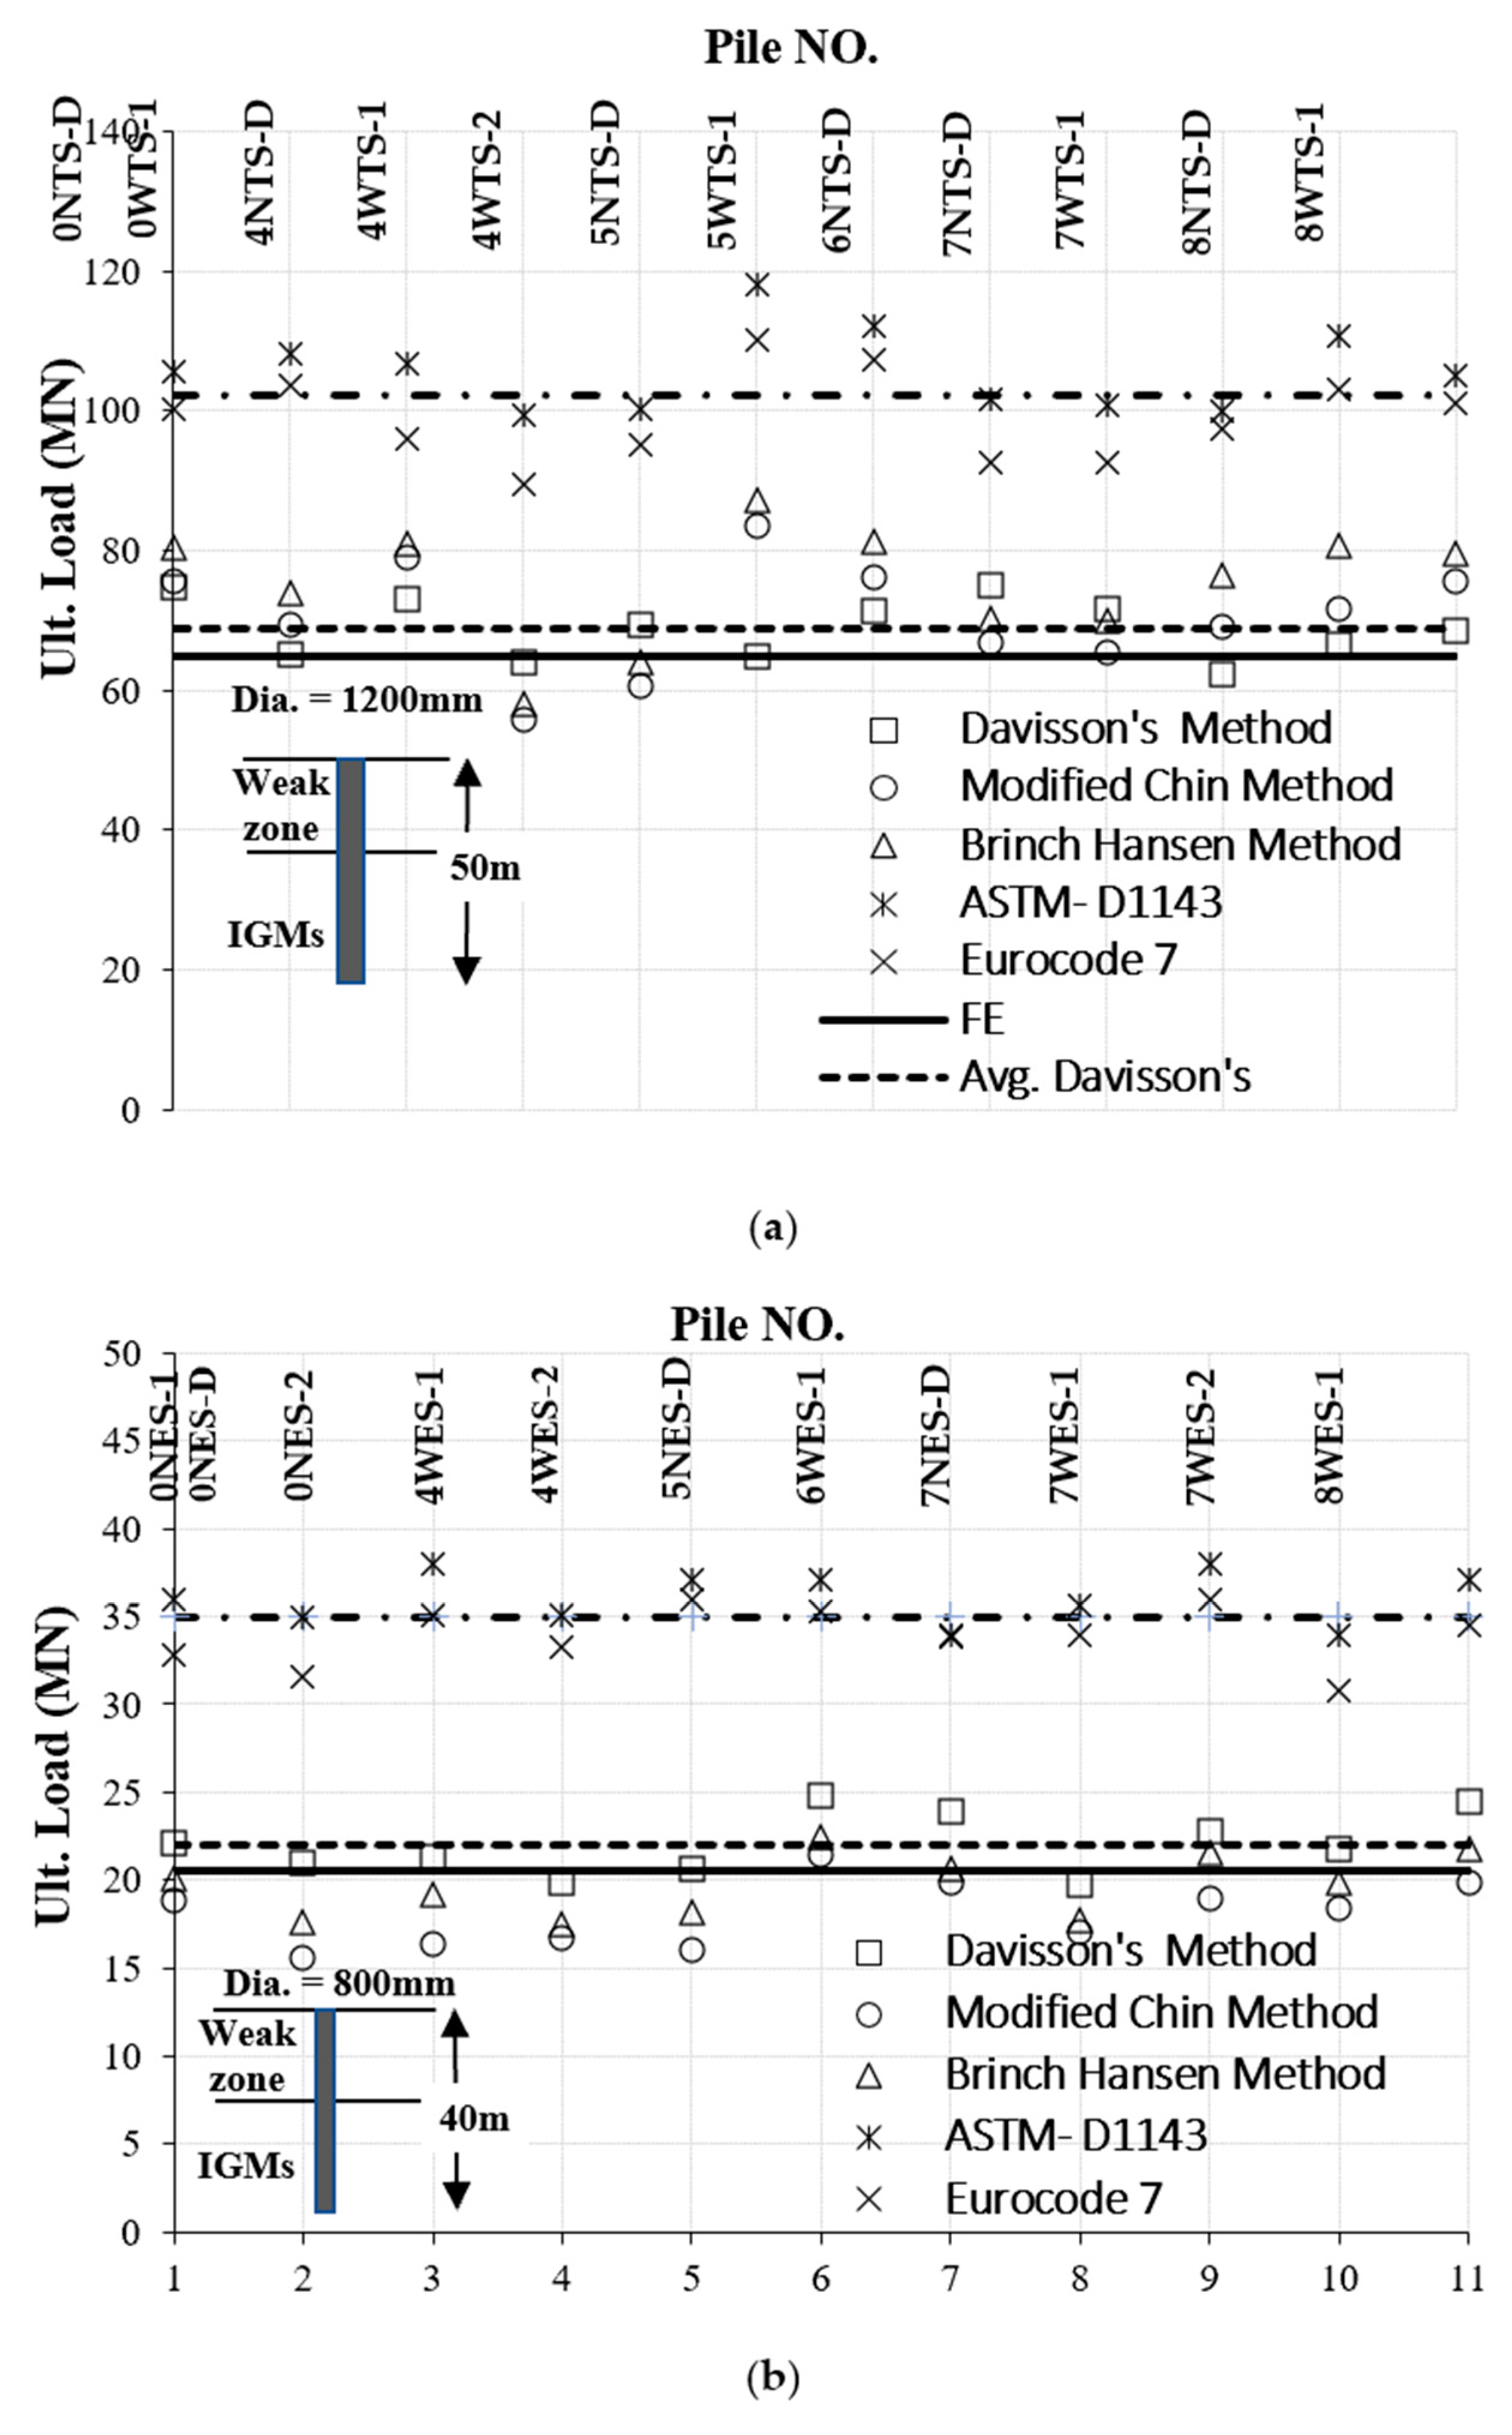
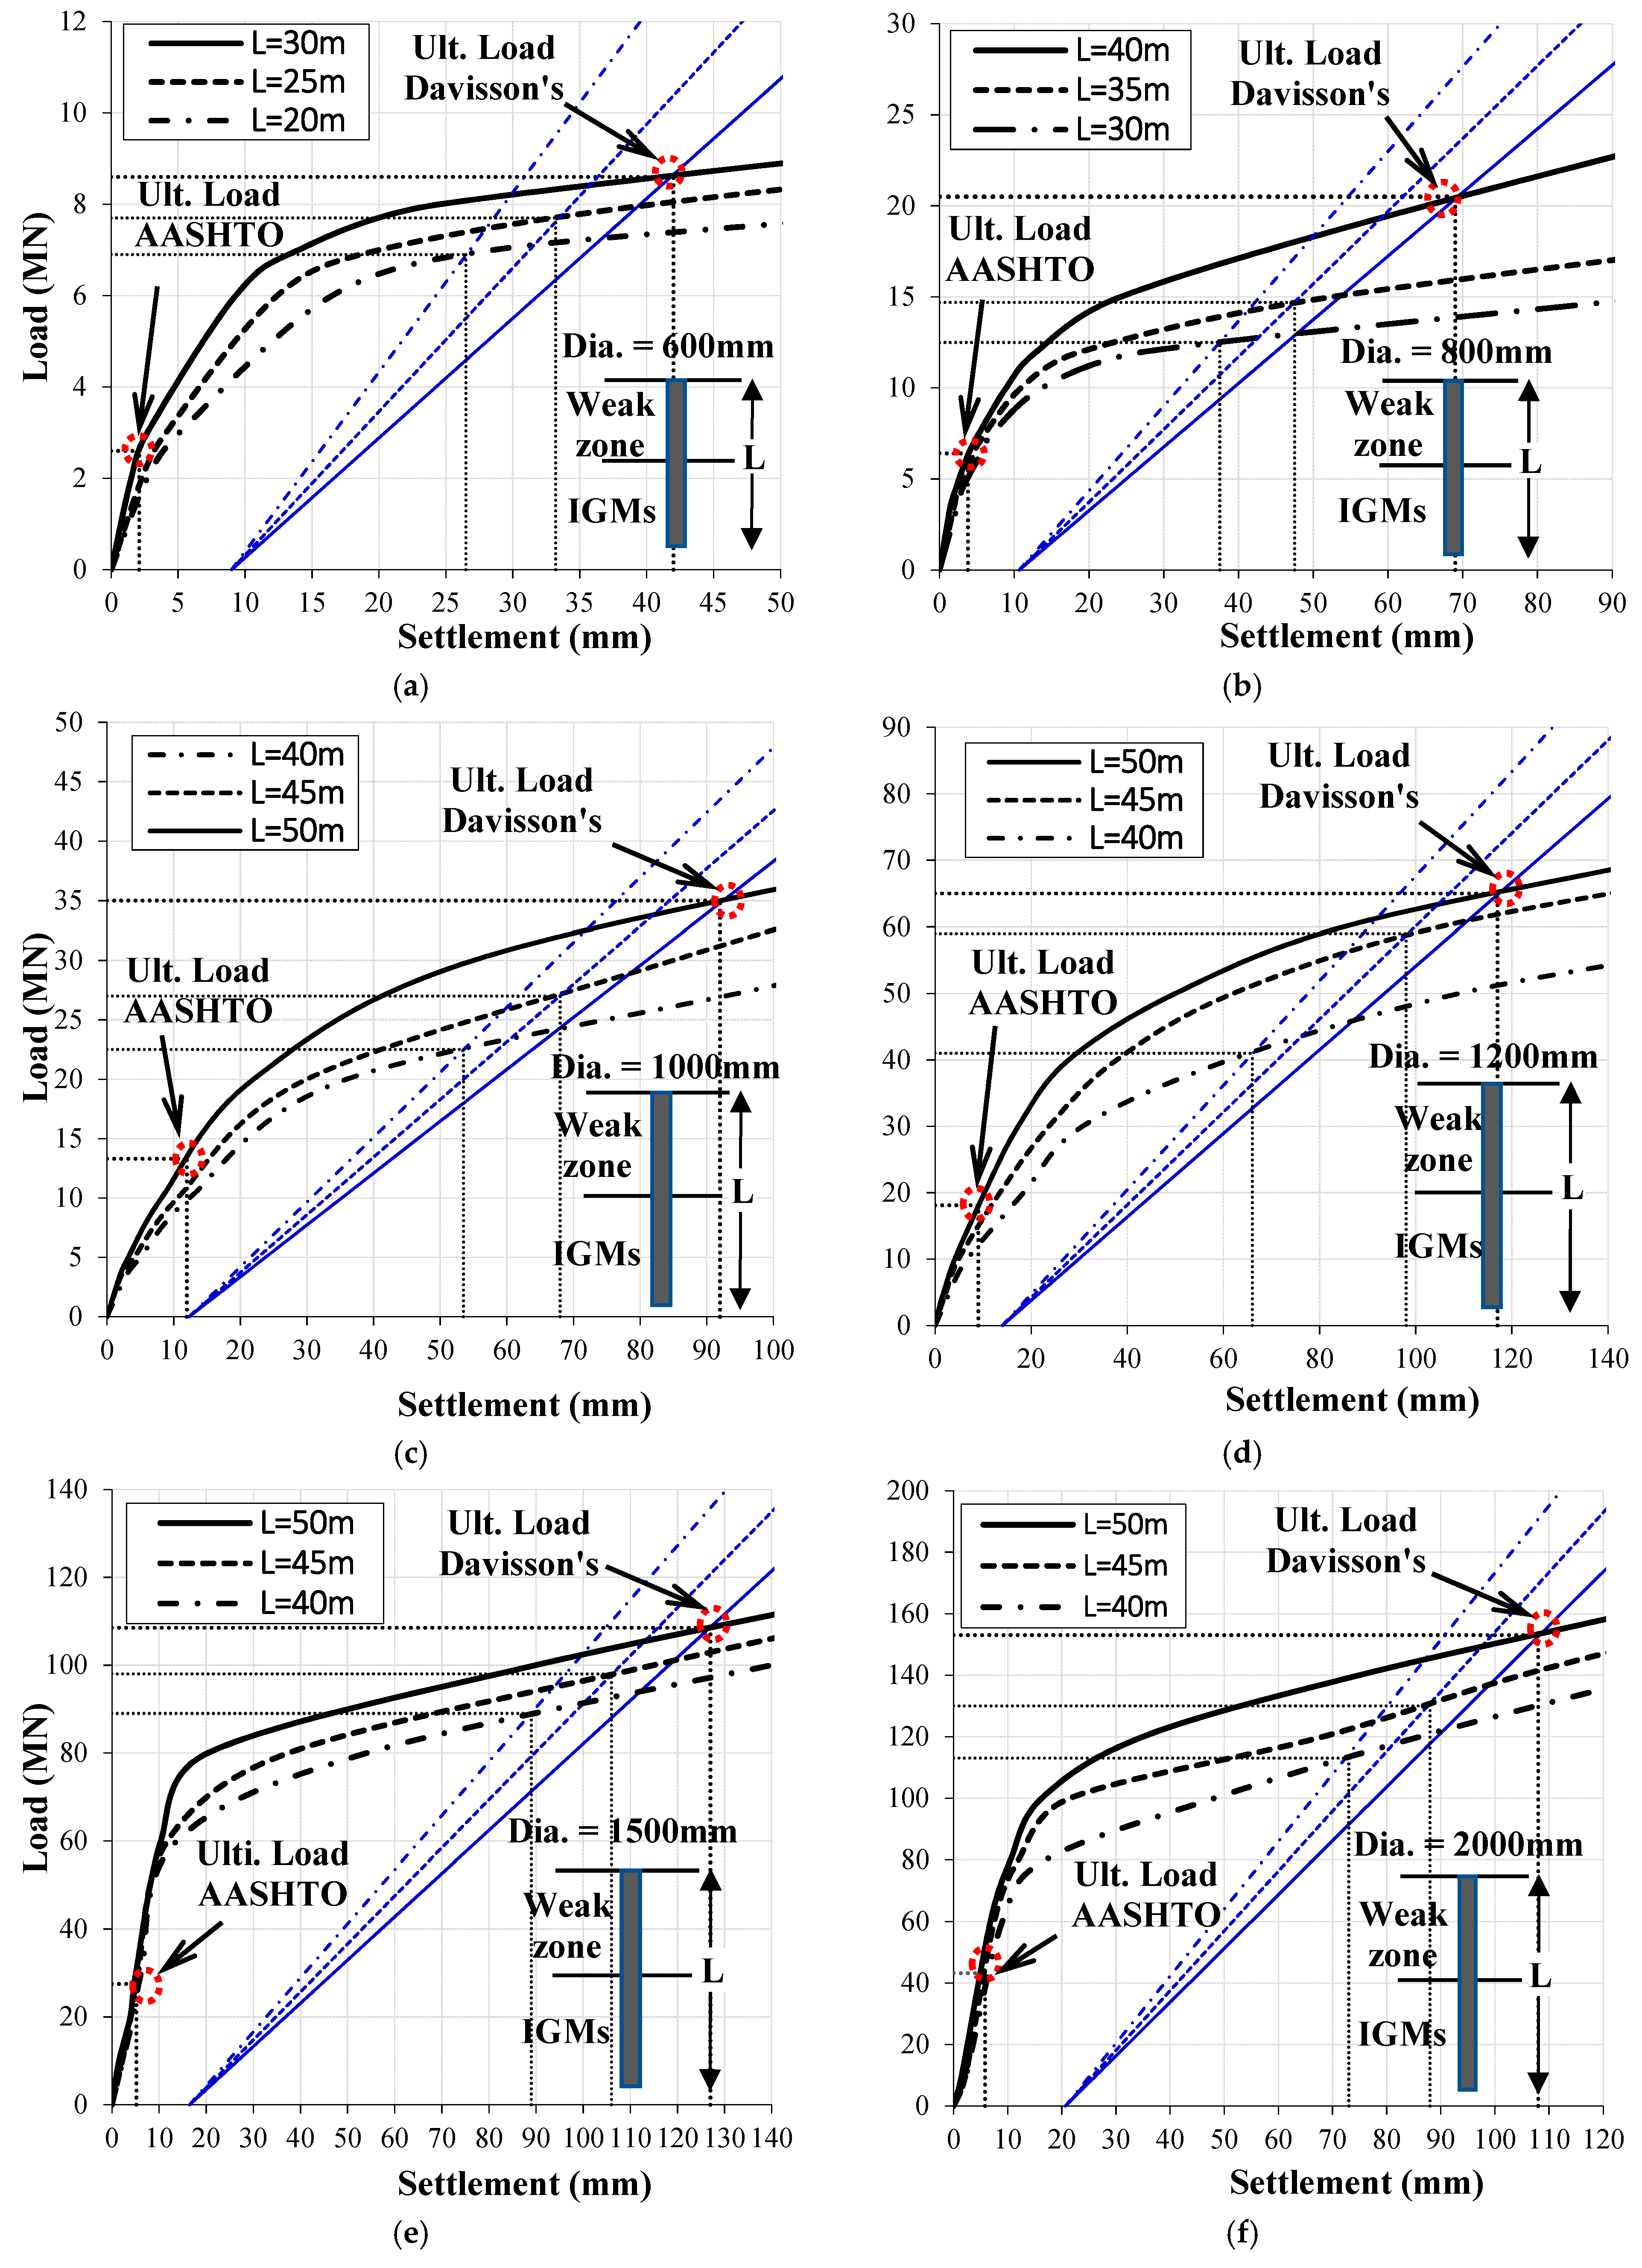
6.2. Ultimate Load Prediction

Several methods have been proposed to predict the ultimate load of piles from the results of static pile load tests. In this study, five methods have been employed to predict the ultimate pile capacity of twelve and eleven tested piles with diameters of 1200 mm and 800 mm, respectively. These methods are modified Chin (Chin, (1970)), Brinch Hansen 90% Criterion (ECSMDEF 202/4, (2001)), Davisson Offset Limit (Davisson, (1972)), ASTM-D1143, (2007), and Eurocode 72004 [4,9,11,12,14]. Herein, Davisson’s method is highlighted. Davisson (1972) proposed a method for determining the ultimate load based on the offset limit load. The method is easy to apply. The ultimate load of the pile is the intersection between the extrapolated load–settlement curve and Davisson’s line. The line equation is
Δ = o f f s e t + P L E A
where
o f f s e t = 4 + d 120 ( d in mm )
Figure 23 shows extrapolated load–settlement curves for five non-working static pile load tests with diameters of 1200 mm. Figure 23 illustrates the determination of the ultimate resistance from pile load tests using Davisson’s method. Davisson’s line intersects with load–settlement curves from the pile load tests at the ultimate load. The ultimate load varies from 65 to 95 MN.
The predicted ultimate capacities by the six methods of modified Chin, Brinch Hansen Davisson Offset Limit, DOL, ASTM-D1143, Eurocode 7, and FE are illustrated in Figure 23. As can be seen from Figure 24, the predicted ultimate capacity using the modified Chin method, Brinch Hansen method, and Davisson’s method provide values matched with the FE results, whereas ASTM-D1143 and Eurocode give overestimated capacities. In general, the predicted ultimate capacities based on Davisson and FE are 6.5 and 2.2 MPa for pile diameters of 1200 and 800 mm, respectively (6.5 times the pile design capacity of 1.00 and 0.35). This confirms that the resistance factors recommended by AASHTO are conservative and should be re-evaluated.

6.3. Specific Resistance Factors for IGMs in El Alamein City

Refs. [29,43], state that the AASHTO design approach for IGMs is conservative due to a lack of information and load test results. The results of static pile load tests confirm this. A parametric study was conducted using the calibrated numerical model to investigate the behavior of long piles through IGM soil layers and propose specific load resistance factors for the side and tip resistances. Diameters of 0.60, 0.80, 1.00, 1.20, 1.50, and 2.00 m were selected. Three lengths were selected for each diameter. The length of the pile was selected to cover a range from 5 m, as the socket length in IGM layers, to 35.0 m. The thickness of the weak layer was considered to be 15.0 m below the natural ground level. Figure 25 shows the typical result of the FE analysis. Davisson’s method was utilized to determine the ultimate pile capacity, as shown in Figure 24. The design pile capacity was determined by employing [1].
Figure 26 shows that, considering the residence factor of the load test φ load (0.70) recommended by AASHTO and the proposed increase of φ load to (0.80), the increase in settlement values shows an insignificant effect on the pile behavior as a friction pile.
From Figure 26, it can be seen that (ult. Ld.)AASHTO is about 15% to 40% of (Ult. Ld.)Davisson. This indicates that AASHTO LRFD is very conservative for a pile design at the Alamein site. Table 8 depicts the comparison between the ultimate load from the AASHTO and FE models using Davisson’s line. The AA SHTO ultimate load is, on average, 30% of the ultimate load from Davisson’s method. This indicates that φqs, φqp could be increased by 15% to be 0.70 and 0.65, respectively, without significant changes in the related settlement. The ultimate load using AASHTO will remain underestimated, and no changes in the pile behavior as a friction pile will occur.

7. Conclusions

A total of forty-four static and dynamic pile load tests were performed to investigate the behavior of long, large-diameter bored piles through multilayer IGM layers in a project on high-rise buildings in El Alamein, Egypt. During pile testing, it was recognized that the pile load–settlement behavior was very conservative. Based on the analysis of the pile load test results, the parametric study, and the FE models, the following conclusions can be derived:
  • The pile load testing of a drilled shaft that carried out static and dynamic methods in El Alamein revealed larger resistance than anticipated in soils classified as IGMs and weak limestone. Results of the static tests, dynamic tests, and finite element analysis confirm that the long, large-diameter piles in El Alamein IGM layers behave as friction piles.
  • In general, the predicted ultimate capacities by different methods indicate that AASHTO LRFD is conservative in estimating the ultimate resistance of large-diameter piles in IGMs, which is due to using underestimates of resistance factors for the friction, bearing, and load tests. The recommended values of the shaft side resistance factor, φ qs (0.60), tip resistance factor, φ qp (0.55), and load test resistance factor, φ load (0.70), could be increased, especially for Alamein City. The recommended values may be φ qs (0.70), φ qp (0.65), and φ load (0.80) without any significant effect on the pile behavior as a friction pile.
  • Although bentonite slurry was used during the pile construction, it did not affect the actual friction capacity, and still, the theoretical capacity given by AASHTO is underestimated.
  • The load-settlement response for the static pile load tests behaves as a straight line until 2.0 design loads. The site-specific settlement equations for 800 mm and 1200 mm diameter piles for bored piles through IGMs are as follows, respectively.
  • The settlement from the static load test was about 4.0 to 5.0 times the settlement from the dynamic load test. This indicates that the time period of loading has a significant effect on the pile’s behavior. The quick-loading procedure of the dynamic test builds up high pore water pressure in low-permeable media.
  • Dynamic load tests were carried out on the site as a reliable alternative to compression static pile load tests, considering the calibration analysis. That is, settlement should not exceed 12 mm for 1200 mm diameter piles and 8 mm for 800 mm diameter piles.
  • The high pore water pressure could result in increased shaft resistance in cohesive layers.
  • Acceptable matching was found between the FE results and the static pile load test results. Therefore, the FE method could be a potential method for calculating and estimating the bearing capacity of the bored piles in the IGM layer. This method was also valid for predicting the ultimate load of the single pile.
  • There is a need for further work, such as studying the behavior of the pile groups through IGM multilayers, the investigation of the single-pile response with the lateral load, and the prediction of the ultimate capacity using the dynamic pile load test results.

Author Contributions

Conceptualization, N.E., K.M.E. and M.N.; Methodology, N.E., K.M.E. and M.N.; Software, E.I. and K.M.E.; Validation, N.E., K.M.E. and M.N.; Formal analysis, E.I.; Resources, E.I.; Data curation, E.I.; Writing—original draft, E.I.; Writing—review & editing, N.E. and M.N.; Supervision, N.E., K.M.E. and M.N.; Project administration, M.N. All authors have read and agreed to the published version of the manuscript.

Funding

This research received no external funding.

Data Availability Statement

The data presented in this study are available on request from the corresponding author.

Acknowledgments

The authors would like to express their gratitude to the Engineering Consulting Group’s supervision and construction teams for supporting this research.

Conflicts of Interest

The authors declare no conflict of interest.

References

  1. American Association of State Highway and Transportation Officials AASHTO LRFD. Bridge Design Specifications, 9th ed.; American Association of State Highway and Transportation Officials AASHTO LRFD: Washington, DC, USA, 2022. [Google Scholar]
  2. Adhikari, P.; Ng, K.W.; Gebreslasie, Z.Y.; Wulff, S.S.; Sullivan, T. Geomaterial Classification Criteria for Design and Construction of Driven Steel H-Piles. Can. Geotech. J. 2019, 57, 616–621. [Google Scholar] [CrossRef]
  3. Asem, P. Base resistance of drilled shafts in soft rock using in situ load tests: A limit state approach. Soils Found 2019, 59, 1639–1658. [Google Scholar] [CrossRef]
  4. ASTM-D 1143-81; Standard Test Method for Piles under Static Axial Compressive Load. American Society for Testing and Materials: West Conshohocken, PA, USA, 2019.
  5. ASTM-D 4945-00; Standard Test Method for Piles under Dynamic Axial Compressive Load. American Society for Testing and Materials: West Conshohocken, PA, USA, 2017.
  6. Brown, D.A.; Turner, J.P.; Castelli, R.J. Construction Procedures and LRFD Design Methods; NHI Course No. 132014; U.S. Department of Transportation Federal Highway Administration: Washington, DC, USA, 2010; 972p.
  7. BS 8004:2015; Code of Practice for Foundations. British Standards Institute: London, UK, 2014.
  8. Carter, J.; Kulhawy, F.H. Analysis and Design of Drilled Shaft Foundations Socketed into Rock; Electric Power Research Institute, Cornell University, Geotechnical Engineering Group: Ithaca, NY, USA, 1988. [Google Scholar]
  9. Chin, F. Estimation of the Ultimate Load of Pile not Carried to Failure. In Proceedings of the 2nd Southeast Asian Conference on Soil Engineering, Singapore, 11–15 June 1970; pp. 81–90. [Google Scholar]
  10. Lan, C.N.; Nguyen, M.H.; Thanh, B.T.; Long, N.N.; Tiena, L.D.; Ho, L.S. Bearing capacity of drilled shaft in intermediate geomaterials. Mag. Civ. Eng. 2020, 99, 9908. [Google Scholar]
  11. Davisson, M. High-Capacity Piles. In Proceedings of the Lecture Series on Innovations in Foundation Construction, American Society of Civil Engineers, ASCE, Illinois Section, Chicago, IL, USA, 22 March 1972; Illinois Institute of Technology: Chicago, IL, USA, 1973; pp. 81–112. [Google Scholar]
  12. ECSMDEF 202/4; Egyptian Code of Practice for Soil Mechanics and Foundations, Part IV: Deep Foundations. Housing and Building National Research Center, Ministry of Housing, Utilities and Urban Communities: Cairo, Egypt, 2001. (In Arabic)
  13. Sharif, E.Y.; Sidhu, H. An Approach for Optimization of Drilled Shaft Design in Dubai; Springer Nature: Basel, Switzerland, 2019. [Google Scholar]
  14. Eurocode 7. Designing Bases, Foundations, and Underground Structures. 2004. Available online: https://ngm2016.com/uploads/2/1/7/9/21790806/eurocode_7_-_geotechnical_designen.1997.1.2004.pdf (accessed on 23 April 2004).
  15. Fleming, W.G.F.; Weltman, A.J.; Randolph, M.F.; Elson, W.K. Piling Engineering, 3rd ed.; Taylor & Francis: Abingdon, UK, 1992. [Google Scholar]
  16. Masterton, G.; Gannon, J.A.; Wallace, W.A.; Muir Wood, D. Piled Foundations in Weak Rock; CIRIA: London, UK, 1999. [Google Scholar]
  17. Brooks, H.; Mokwa, R.L. Axial Capacity of Piles Founded in Intermediate Geomaterials: A State-of-the-Practice Review; EG & GE Symposium: Boise, ID, USA, 2005; pp. 9–11. [Google Scholar]
  18. Hooley, P.; Lefroy, S.R. The ultimate shaft frictional resistance mobilized by bored piles in over-consolidated clays and socketed into weak and weathered rock. In The Engineering Geology of Weak Rock; Cripps, J.C., Ed.; Balkema: Rotterdam, The Netherland, 1993; pp. 447–455. [Google Scholar]
  19. Horvath, R.; Kenney, T.; Kozicki, P. Methods of improving the performance of drilled piers in weak rock. Can. Geotech. J. 1983, 20, 758–772. [Google Scholar] [CrossRef]
  20. Institution of Civil Engineers (ICE). Specification for Piling and Embedded Retaining Walls, 1st ed.; Thomas Telford Publishing: London, UK, 1997. [Google Scholar]
  21. Johnston, I.W.; Novello, E.A. Soft Rocks in the Geotechnical Spectrum. In Geotechnical Engineering of Hard Soils-Soft Rocks: Proceedings of an International Symposium for ISSMFE, IAEG, and ISRM, Athens, Greece, 20–23 September 1993; A. A. Balkema: Athens, Greece, 1993. [Google Scholar]
  22. Likins, G.E.; Rausche, F. Correlation of CAPWAP with Static Load Tests. In Proceedings of the Seventh International Conference on the Application of Stress Wave Theory to Piles, Petaling Jaya, Selangor, Malaysia, 12 May 2004; pp. 153–165. [Google Scholar]
  23. Long, J.; Horsfall, J. Static Pile Load Tests on Driven Piles in Intermediate Geomaterials; Project 0092-12-08, Research Brief, Wisconsin Highway Research Program; Department of Civil Engineering, University of Illinois at Urbana-Champaign: Madison, WI, USA, 2017. [Google Scholar]
  24. Long, M. Comparing dynamic and static test results of bored piles. Proc. Inst. Civ. Eng. Geotech. Eng. 2007, 160, 43–49. [Google Scholar] [CrossRef]
  25. Long, J. Static Pile Load Tests on Driven Piles into Intermediate Geomaterials Final Report WHRP 0092-12-08; Wisconsin Department of Transportation: Madison, WI, USA, 2016.
  26. Mayne; Harris. Design for Axial Capacity in Cohesive IGM and Jointed Rock; Analysis and Design of Deep Foundations: New York, NY, USA, 1993; pp. 345–362. [Google Scholar]
  27. Mcvay, M.; Townsend, F.; Williams, R. Design of socketed Drilled shafts in limestone. J. Geotech. Eng. 1992, 118, 1626–1637. [Google Scholar] [CrossRef]
  28. Middendorp, P.; Ginneken, G.V.; Foeken, R.V. The advantages and disadvantages of dynamic load testing and Statnamic load testing. In Proceedings of the 6th International Conference on the Application of Stress Wave Theory to Piles, Sao Paulo, Brazil, 11–13 September 2020; Niyama, S., Beim, J., Eds.; A.A. Balkema: Rotterdam, The Netherlands, 2000; pp. 625–632. [Google Scholar]
  29. Nafis, B.M.; Tyler, J.; Shaun, S.W. Driven Piles in Fine Grained Soil-Based Intermediate Geomaterials; ASCE: Reston, VA, USA, 2022; Volume 27. [Google Scholar]
  30. Ng, C.W.; Yau, T.L.; Li, J.H.; Tang, W.H. Side resistance of large diameter bored piles socketed into decomposed rocks. J. Geotech. Geoenviron. Eng. 2001, 127, 642–657. [Google Scholar] [CrossRef]
  31. Ng, K.; Nafis, M.; Oluwatuyi, O.; Wulff, S. Development of LRFD Recommendations of Driven Piles on Intermediate Geomaterials; Mountain-Plains Consortium, North Dakota State University, US DOT: Fargo, ND, USA, 2022. [Google Scholar]
  32. Noor, S.; Islam, S.; Mumtarin, M.; Chakraborty, N. Dynamic load test of full-scale pile for the construction and rehabilitation of bridges. IOP Conf. Ser. Mater. Sci. Eng. 2019, 513, 012017. [Google Scholar] [CrossRef]
  33. O’Neill, M.W.; Hassan, K.M. Perimeter load transfer in drilled shafts in the Eagle Ford formation. In Design and Performance of Deep Foundations: Piles and Piers in Soil and Soft Rock; ASCE: Reston, VA, USA, 1993; pp. 229–244. [Google Scholar]
  34. O’Neill, M.; Hassan, K. Drilled shafts: Effects of construction on performance and design criteria. In Proceedings of the International Conference on Design and Construction of Deep Foundations, Orlando, FL, USA, 6–8 December 1994; pp. 137–187. [Google Scholar]
  35. O’Neill, M.; Townsend, F.; Hassan, K.; Buller, A.; Chan, P. Load Transfer for Drilled Shafts in Intermediate Geomaterials; No. FHWA-RD-95-172; Federal Highway Administration: Washington, DC, USA, 1996.
  36. O’Neill, M.W.; Reese, L.C. Drilled Shafts: Construction Procedures and Design Methods; Final Report No. FHWA-IF-99-025; U.S. Department of Transportation: Washington, DC, USA, 1999.
  37. O’Neill, M.W. Side Resistance in Piles and Drilled Shafts. J. Geotech. Geo-Environ. Eng. 2001, 127, 3–16. [Google Scholar] [CrossRef]
  38. Osman, M.A.; Ahmed, E.M.A.; Ahmed, O.B.E.M. Comparison between dynamic and static pile load testing. Electron. J. Geotech. Eng. 2013, 18, 3615–3624. [Google Scholar]
  39. Paikowsky, S.G. Load and Resistance Factor Design (LRFD) for Deep Foundations with Contributions by Birgission G., McVay M., Nguyen T., Kuo C., Baecher G., Ayyub B., Stenerson K., O’Mally K., Chernauskas L., and O’Neill M.; NCHRP Report 507. National Cooperative Highway Research Program Report for Project NCHRP. 2004. Available online: https://libraryarchives.metro.net/dpgtl/nchrp/nchrp-annual-report/2004-nchrp-annual-report.pdf (accessed on 23 August 2014).
  40. Paikowsky, S.G. Innovative Load Testing Systems; NCHRP Web-Only Document 84 (Project 21-08); Transportation Research Board of the National Academies: Washington, DC, USA, 2006. [Google Scholar]
  41. Papageorgiou, O. Soft Rocks. In Geotechnical Engineering of Hard Soils-Soft Rocks: Proceedings of an International Symposium for ISSMFE, IAEG and ISRM, Athens, Greece, 20–23 September 1993; A. A. Balkema: Athens, Greece, 1997. [Google Scholar]
  42. PLAXIS 3-D Prog, Version 2020. PLAXIS 3-D Manual. Available online: https://www.civil.iitb.ac.in/~ajuneja/Plaxis%20program/3D%20Foundation%20Introductory/Manuals/English/3DFV15-Tutorial.pdf (accessed on 23 August 2014).
  43. Pramila, A.D.; Shaun, S.W.; Kam, W.N.G. Static and Economic Analyses of Driven Steel H-piles in IGM Using the Wyopile Database; ASCE: Reston, VA, USA, 2020; Volume 25. [Google Scholar]
  44. Tomlinson, M.J. Pile Design and Construction Practice, 4th ed.; E & FN Spon: London, UK, 1994. [Google Scholar]
  45. Tomlinson, M.J. Foundation Design and Construction, 7th ed.; Pearson Education Ltd.: Edinburgh, UK, 2001. [Google Scholar]
  46. Rausche, F.; Likins, G.E.; Liang, L.; Hussein, M.H. Static and Dynamic Models for CAPWAP Signal Matching; The Art of Foundation Engineering Practice, Geotechnical Special Publication No. 198; ASCE: Reston, VA, USA, 2010; pp. 534–553. [Google Scholar]
  47. Rowe, R.K.; Armitage, H.H. A Design Method for Drilled Piers in Soft Rock. Can. Geotech. J. 1987, 24, 126–142. [Google Scholar] [CrossRef]
  48. Vesic, A.S. Design of Pile Foundations, NCHRP Synthesis 42; Transportation Research Board, National Research Council: Washington, DC, USA, 1977; 68p. [Google Scholar]
  49. Williams, A.F.; Johnston, I.W.; Donald, I.B. The design of socketed piles in weak rock. In Golden Jubilee of the International Society for Soil Mechanics and Foundation Engineering Commemorative Volume 1; Institution of Engineers: Canberra, Australia, 1980. [Google Scholar]
  50. Wu, B.; Marsden, J.R.; Hudson, J.A. Undrained Mechanical Behavior of Mudstone. In The Engineering Geology of Weak Rock: Proceedings of the 26th Annual Conference of the Engineering Group Geological Society, Leeds, UK, 9–13 September 1990; A. A. Balkema: Athens, Greece, 1993; pp. 87–94. [Google Scholar]
  51. Xu, J.; Dai, G.; Gong, W.; Zhang, Q.; Haque, A.; Gamage, R.P. A review of research on the shaft resistance of rock-socketed piles. Acta Geotech. 2021, 16, 653–677. [Google Scholar] [CrossRef]
  52. Shah, P.V.; Thaker, K.K. Evaluation of WSM, LRFD, and FE Methods for Pile Capacity Calculation with Pile Load Test for IGM. In Proceedings of the Indian Geotechnical Conference 2019: IGC-2019 Volume I; Springer Nature: Singapore, 2019; pp. 335–347. [Google Scholar]
  53. Randolph, M.F. Science and empiricism in pile foundation design. Geotechnique 2003, 53, 847–875. [Google Scholar] [CrossRef]
  54. Lin, S.-S.; Chang, Y.-H. Effects of Toe Grouting on Axial Performance of Drilled Shafts Socket in Intermediate Geomaterial. Geotech. Eng. J. SEAGS AGSSEA 2015, 46, 87–93. [Google Scholar]
  55. Schmidt, H.H.; Rumpelt, T.K. Pile Load Capacity in Pre-consolidated Keuper Marls of Southwest Germany. In Geotechnical Engineering of Hard Soils Soft Rocks: Proceedings of an International Symposium for ISSMFE, IAEG and ISRM, Athens, Greece, 20–23 September 1993; A. A. Balkema: Athens, Greece, 1993; pp. 1021–1028. [Google Scholar]
  56. Seidel, J.P.; Haberfield, C.M. The Axial Capacity of Pile Sockets in Rocks and Hard Soils. Ground Eng. 1995, 5, 33–38. [Google Scholar]
  57. Svinkin, M.R. Engineering aspects in evaluation of pile capacity by dynamic testing. In Proceedings of the Structures Congress, Las Vegas, NV, USA, 14–16 April 2011; pp. 1686–1697. [Google Scholar]
  58. Spink, T.W.; Norbury, D.R. The Engineering Geological Description of Weak Rocks and Over-consolidated Soils. In The Engineering Geology of Weak Rock: Proceedings of the 26th Annual Conference of the Engineering Group Geological Society, Leeds, UK, 9–13 September 1990; A. A. Balkema: Athens, Greece, 1993; pp. 289–301. [Google Scholar]
  59. Lobo-Guerrero, S.; Vallejo, L.E. DEM analysis of crushing around driven piles in granular materials. Géotechnique 2005, 55, 617–623. [Google Scholar] [CrossRef]
  60. Peng, S.Y.; Ng, C.W.W.; Zheng, G. The dilatant behavior of sand–pile interface subjected to loading and stress relief. Acta Geotech. 2014, 9, 425–437. [Google Scholar] [CrossRef]
  61. Brown, S.R.; Scholz, C.H. Broad bandwidth study of the topography of natural rock surface. J. Geophys. Res. 1985, 90, 12575–12582. [Google Scholar] [CrossRef]
  62. Pan, W.; Li, X.; Wang, L.; Guo, N.; Mu, J. A normal contact stiffness fractal prediction model of dry-friction rough surface and experimental verification. Eur. J. Mech. A Solids 2017, 66, 94–102. [Google Scholar] [CrossRef]
  63. Latapie, B.; Albelda, R.A.; Abou Samra, M.; Alzaylaie, M.; Sumputh, J. A review of piling industry practices in Dubai, UAE: Proposed UCS-based correlations. Geotech. Res. 2019, 6, 103–129. [Google Scholar] [CrossRef]
  64. Hadi, A. Effect of Changes of Mesh Size on the Numerical Analysis of Reinforced Soil Walls. Aust. J. Basic Appl. Sci. 2011, 5, 1693–1696. [Google Scholar]
Figure 1. Google map of case study location in northern Egypt.
Buildings 14 02268 g001
Figure 2. Borehole locations.
Buildings 14 02268 g002
Figure 3. Lithology of soil layers in El Alamein city.
Buildings 14 02268 g003
Figure 4. Variation in (a) SPT, (b) CR, and (c) RQD vs. depth.
Buildings 14 02268 g004
Figure 5. (a) Variation in UCS vs. depth; (b) sample photos.
Buildings 14 02268 g005
Figure 6. Site photos of the geophysical study of (a) silty sand and limestone layers and (b) features of weathering in limestone at the site.
Buildings 14 02268 g006
Figure 7. Pile configuration and section details.
Buildings 14 02268 g007
Figure 8. Cross-hole tests: (a) cross-hole locations; (b) cross-hole test results.
Buildings 14 02268 g008
Figure 9. Typical pile integrity test results.
Buildings 14 02268 g009
Figure 10. Static pile load test in Alamein project.
Buildings 14 02268 g010
Figure 11. Arrangement for the sensors in high-strain dynamic load test [5].
Buildings 14 02268 g011
Figure 12. Dynamic pile load test configuration.
Buildings 14 02268 g012
Figure 13. Loading and unloading–settlement behavior for 1.20 m diameter working and non-working piles.
Buildings 14 02268 g013
Figure 14. Load–settlement curves of one and two loading cycles with diameters of 1200 mm.
Buildings 14 02268 g014
Figure 15. Load–settlement behavior under loading and unloading for piles with diameters of 800 mm.
Buildings 14 02268 g015
Figure 16. Calibration of dynamic pile load test for (a) 1200 mm pile diameter and (b) 800 mm pile diameter.
Buildings 14 02268 g016
Figure 17. Influence of the mesh size change on the pile load–settlement response.
Buildings 14 02268 g017
Figure 18. Finite element model: (a) model configuration, (b) mesh generation, and (c) result sample.
Buildings 14 02268 g018
Figure 19. Load–settlement curve for FE model and non-working load test.
Buildings 14 02268 g019
Figure 20. Load–settlement behavior for (a) a pile with a diameter of 1200 mm and (b) a pile with a diameter of 800 mm.
Buildings 14 02268 g020
Figure 21. Comparison of the proposed equation with other site locations for a pile with a diameter of 800 mm [48].
Buildings 14 02268 g021
Figure 22. Comparison of the proposed equation with other site locations for a pile with a diameter of 1200 mm [48].
Buildings 14 02268 g022
Figure 23. Determination of ultimate resistance from pile load tests and FE model by Davisson’s method.
Buildings 14 02268 g023
Figure 24. Predicted ultimate capacity: (a) pile with a diameter of 1200 mm and (b) pile with a diameter of 800 mm.
Buildings 14 02268 g024
Figure 25. FE results for load–settlement response and ultimate capacities: (a) pile dia. 600 mm, (b) pile dia. 800 mm, (c) pile dia. 1000 mm, (d) pile dia. 1200 mm, (e) pile dia. 1500 mm and (f) pile dia. 2000 mm.
Buildings 14 02268 g025
Figure 26. Typical results for load–settlement response and ultimate capacities for a pile with a diameter of 1200 mm ( φ load).
Buildings 14 02268 g026
Table 1. Piles’ data.
Diameter
(mm)
Pile Length (m)Reinforced Length (m)Non-Reinforced Length (m)Pile Design Capacity (MN)Compressive Strength (MPa)Pile Structural Capacity (MN)
120050.035.015.010.040.011.30
80040.030.010.03.540.05.03
Table 2. Loading procedure for working piles.
Loading TypeLoadingUnloading
Load Percentage25%50%75%100%125%150%125%100%75%50%25%0%
Time (Min.)606060 180 180 720 15 15 15 15 15 240
Table 3. Loading procedure for non-working piles.
Loading TypeLoadingUnloading
Load Percentage25%50%75%100%125%150%175%200%175%125%100%75%50%25%0%
Time (Min.)606060 180 180 36018072015 15 15 15 15 15 240
Table 4. Dynamic load test calibration.
Pile CodeSettle. From Static Test (mm)Settle. From Dynamic Test (mm)Dynamic Settle. Percentage (%)
0NTS-D11.201.8616.70
4NTS-D11.432.7624.15
7NTS-D9.402.7028.72
8NTS-D12.422.1017.00
0NES-D6.351.2018.90
5NES-D6.511.1015.36
7NES-D6.201.0016.12
Table 5. Summary of the dynamic load test results.
Pile CodeCAPWAP Capacity (MN)Load Transfer by Friction (MN)Load Transfer by Bearing (MN)Friction/Total Capacity (%)Settle. At Top (mm)Settle. At Tip (mm)
0NTS-D15.0912.172.91812.500.71
4NTS-D21.0017.463.53832.760.24
5NTS-D20.8018.002.80873.250.61
6NTS-D30.6629.331.33963.500.25
7WTD-116.1315.031.10932.700.21
8NTS-D19.2418.830.41982.100.19
0NES-D8.007.050.94883.00.45
5NES-D6.816.030.78881.20.19
6NED9.158.820.33962.10.12
7WED6.906.130.77891.00.17
8NED9.738.581.15882.00.30
Table 6. Soil properties for PLAXIS modeling (HS model parameters).
ParameterGM, Silty GravelSM, Silty SandArgillaceous LimestoneML, SiltMarlCL, Lean ClayCH, Fat ClayGC, Clayey Gravel
Bulk Unit Weight, γ (kN/m3)18.518.019.018.519.019.019.018.5
Friction Angle, ϕ (deg.)3433303230------33
Secant Modulus, E 50 r e f MPa)50401204540201540
Unload/Reload Modulus, E e o d r e f (MPa)100802409080403080
Oedometer Modulus, E e o d r e f (MPa)3528853228151328
Cohesion, C’ ref. (kPa)---501501002008050100
Dilatancy, ψ (deg.)43020------3
Table 7. Soil properties for PLAXIS modeling (MC model parameters).
ParameterGM, Silty GravelSM, Silty SandArgillaceous LimestoneML, SiltMarlCL, Lean ClayCH, Fat ClayGC, Clayey Gravel
Bulk Unit Weight, γ (kN/m3)18.518.019.018.519.019.019.018.5
Friction Angle, ϕ (deg.)3433303230------33
Deformation Modulus, Es (MPa)50401204540201540
Cohesion, c’ ref. (kPa)---501501002008050100
Dilatancy, ψ (deg.)43020------3
Table 8. Design, ultimate capacity, and related settlement considering strength factors.
PileAASHTOFE Models and Davisson’s Method
D (mm)L
(m)
φqs, φqp
(0.60 and 0.55)
Proposed φqs, φqp
(0.70 and 0.65)
Ultimate
Design Capacity (MN)Settle.
(mm)
Design Capacity
(MN)
Settle.
(mm)
Load (MN)Related Settle. (mm) and
(% from Dia.)
Ult. Load (MN)Related Settle. (mm) and
(% from Dia.)
600200.650.60.750.710.90.156.926.54.4
251.000.71.150.81.91.50.257.733.25.5
301.401.01.611.12.62.10.358.642.07.0
800301.901.02.191.23.51.60.212.537.54.7
352.651.23.051.34.92.30.3014.747.55.9
403.501.54.001.76.43.80.8020.5698.6
1000405.704.06.504.4108.30.8323545.4
456.604.57.605.111.710.21.0227686.8
507.505.48.606.113.312.01.2035929.2
1200407.003.28.053.412.64.60.4041665.5
458.503.89.804.015.37.30.6159988.2
5010.004.411.504.818.19.40.80651179.8
15004011.002.112.652.4203.90.2689895.9
4513.002.514.952.8234.40.31091067.1
5015.003.117.253.427.55.20.351271278.5
20004018.002.320.702.633.74.20.21113733.7
4521.002.724.153.037.75.10.26130884.4
5024.003.227.603.543.25.80.291531085.4
Disclaimer/Publisher’s Note: The statements, opinions and data contained in all publications are solely those of the individual author(s) and contributor(s) and not of MDPI and/or the editor(s). MDPI and/or the editor(s) disclaim responsibility for any injury to people or property resulting from any ideas, methods, instructions or products referred to in the content.

