Abstract
Musculoskeletal disorders, which are epidemiologically related to exposure to whole-body vibration (WBV), are frequently self-reported by workers in the construction sector. Several activities during building construction and demolition expose workers to this physical agent. Directive 2002/44/CE defined a method of assessing WBV exposure that was limited to an eight-hour working day, and did not consider the cumulative and long-term effects on the health of drivers. This study aims to propose a methodology for generating individualised models for vehicle drivers exposed to WBV that are easy to implement by companies, to ensure that the health of workers is not compromised in the short or long term. A measurement campaign was conducted with a professional driver, and the collected data were used to formulate six artificial neural networks to predict the daily compressive dose on the lumbar spine and to assess the short- and long-term WBV exposure. Accurate results were obtained from the developed artificial neural network models, with R2 values above 0.90 for training, cross-validation, and testing. The approach proposed in this study offers a new tool that can be applied in the assessment of short- and long-term WBV to ensure that workers’ health is not compromised during their working life and subsequent retirement.
1. Introduction
A high percentage of workers in the European Union are exposed to whole-body vibration (WBV), according to the European Agency for Safety and Health at Work (EU-OSHA) [1]. WBV exposure is an inseparable part of the operations performed by vehicle drivers and equipment operators [2,3,4,5,6]. This exposure is epidemiologically related to the most common work-related health problems in the EU, namely musculoskeletal disorders (MSDs) [7]. Previous studies highlighted that WBV exposure increases the risk of sciatica and lower back pain (LBP) [8]. The characteristic aspects of vibration exposure (such as the frequency distribution of the signal energy and the magnitude of the acceleration) and the worker (e.g., weight, height, and personal factors) can influence the occurrence of MSDs, and awkward posture and repetitive tasks can also aggravate the symptoms [9]. Work-related MSDs are of concern worldwide, as they account for a significant proportion of all workplace injuries, have a high cost in terms of the health of the worker, and affect businesses and society in general [10]. The third European Survey of Enterprises on New and Emerging Risks (ESENER) showed that MSDs are among the risks of greatest concern to European workplaces [11]. The World Health Organization (WHO) reported in 2022 that 1.71 billion people had MSDs around the world, and that MSDs were the leading contributor to disability, with LBP being the single leading cause of disability in 160 countries [12]. The construction industry is among the sectors in which MSDs are most frequently self-reported by workers [1]; this was pointed out by the European Risk Observatory in a report published in 2010 [13], and more than a decade later, MSDs are still a major concern in the construction sector, indicating that the current policies and safety measures have not contributed to a decrease in the prevalence of self-reported MSDs in this sector. Therefore, developing assessment models to minimise the occurrence of MSDs is of significant benefit to society.
In 2002, to allow measures to be implemented to protect workers from adverse health effects, limits on workers’ exposure to WBV were established by the European Union in Directive 2002/44/CE. In addition, the European Directive 2006/42/EC [14] establishes that manufacturers must design and construct vehicle seats that transmit vibrations in such a way that the WBV transmitted to the driver are reduced to a minimum. In addition, manufacturers of equipment that transmits vibrations are required to declare the emission level of each model they supply (Directive 2022/44/EC). However, it should be noted that the values declared by manufacturers are based on tests, but not on in-use measurements. As a result, since many different parameters influence the level of transmitted vibrations, the emission level declared by the manufacturer is not always equal to the actual dose of WBV transmitted to the driver.
The Directive 2022/44/CE [15] establishes models for assessing daily exposure to WBV based on the daily exposure value normalised to an eight-hour reference period (A(8)) and the vibration dose value (VDV), both of which are defined in ISO 2631-1 [16]. These methods are metrics of the external vibration acceleration load and take as inputs the exposure time and the triaxial signal of the acceleration measured at the seating surface: the root mean square (rms) in the case of A(8), and the vibration dose value (vdv) in the case of VDV. However, previous research has shown that the A(8) and VDV models may be poorly correlated with the internal load acting on the lumbar spine [17]. Some studies suggest that these methods may underestimate the severity of the effects of exposure to vibration containing shocks [18]. Recent research has revealed that there is an elevated risk of MSDs related to LBP, even for WBV exposures that are below the limits set in the European directive [19]. Moreover, the effects of long-term WBV exposure are not considered by the A(8) and VDV models, which may mean although that an exposure to WBV may be assessed as safe in the short term, it may have adverse consequences for the worker’s health in the long term [20].
The recently released ISO 2631-5:2018 standard [21] defines methods of assessing the risk of chronic injury caused by exposure to repeated shocks to the lumbar spine, due to WBV containing multiple shocks, in two exposure regimes (severe and less severe). According to this standard, the internal lumbar forces are estimated based on transfer functions. These functions were derived from the results of a group of finite element models of a seated human. These finite element models were developed for different individual anthropometric characteristics and various upright sitting postures, for representative groups of European drivers [22]. However, although the methods described in ISO 2631-5:2018 allow for the assessment of short- and long-term WBV exposure, companies within the EU are not obliged to apply them to assess the WBV to which their workers are exposed. In addition, although this method is based on the estimation of internal lumbar forces and is a better predictor of LBP than acceleration-based methods (e.g., A(8) and VDV), the primary drawback of these methods is the complexity of their application [19]. The implementation of the method defined in ISO 2631-5:2018 requires the wave signal to be recorded for the subsequent evaluation of WBV exposure, which involves the use of specialised and expensive equipment. The implementation of this assessment method may also be limited due to the atomised and traditional nature of the construction sector in Europe [23]. The complexity of the calculation may prevent small and medium-sized construction companies from applying it on a daily basis for the long-term monitoring of the effects of WBV exposure on the health of their workers.
These considerations provide evidence of the limitations of current WBV assessment methods. Neither of the models established in Directive 2002/44/CE, i.e., A(8) and VDV, consider the personal characteristics of the driver or long-term assessments, and may have poor accuracy in predicting individual exposure risk. In contrast, the ISO 2631-5:2018 standard model considers the individual variables, but its complexity imposes a limitation in terms of its implementation. There is therefore a need to generate methodologies that allow for the development of individualised models for the long-term continuous assessment and monitoring of workers’ health, which would make it easier for companies to implement them. Individualised models represent an alternative approach to general models, since the individual risk is assessed rather than the average risk for a group, where the assumed characteristics may be different from those of the individual.
In view of the above discussion, the objective of this research is to develop a methodology to facilitate the implementation of long-term WBV exposure assessment models based on measures of WBV exposure. We present a methodology for generating individualised models for workers exposed to WBV that can be implemented by companies, and which can ensure that the health of workers is not compromised due to exposure to WBV, either in the short or long term. In this way, our approach overcomes the limitations of the A(8) and VDV methods. To achieve this goal, the current study includes: (i) the development of a WBV measurement campaign, (ii) an assessment of the collected data using models that include individual characteristics, and (iii) the generation of an ANN-based model to facilitate individual assessment and long-term monitoring.
The structure of the manuscript is given as follows. Section 2 presents a literature review about the effects of WBV exposure on heavy machine drivers in the construction sector. In addition, this section reviews the application of machine learning techniques to the assessment of vibration exposure. Section 3 presents the materials and methods used in this research. Section 4 shows the results obtained concerning the performance of the proposed ANN and its application to a case study. Finally, Section 5 presents the discussion of the results obtained from the proposed model and Section 6 provides the main conclusions and findings.
2. Literature Review
Several activities in the construction sector involve driving different vehicles and machinery, which transmit WBV to workers, such as earth-moving operations [24,25], the transport of materials [26,27], and, in general, the use of heavy machinery equipment and vehicles [28]. WBV-exposing activities are prevalent across various phases of a building’s life cycle, including construction (such as material transportation and earth-moving), demolition (involving heavy machinery and rubble transport), as well as the infrastructure maintenance (including tasks like asphalting and ditch cleaning). In fact, demolition is recognised by the EU-OSHA as the most hazardous process in construction and demands rigorous safety measures [29]. This agency has emphasised that vibration exposure during demolition works must be managed and minimised as far as possible [29]. Nevertheless, this exposure minimisation should not only be carried out during demolition but also during all phases of construction, as vibration exposure (along with other physical hazards) is the second predominant category of risk identified in the sector of construction of buildings (34.26%) [30].
Preventing construction workers from suffering MSDs and enhancing their musculoskeletal health throughout their working lives is essential in order to address the long-term effects of demographic aging. This goal is in line with those of the European Strategy 2020–2022 [1]. After analysing the long-term consequences for workers’ health, EU-OSHA highlighted the need for a multidisciplinary approach to strategy and health policy at both the national and European levels to encourage the development of tools, approaches, and models oriented towards managing and assessing all the factors that could lead to MSDs. [1].
In this context, it should be noted that the assessment methods set in the Directive 2022/44/CE (A(8) and VDV) do not consider aspects such as the demographic and anthropometric characteristics of the drivers, which influence the amount of vibration that is transmitted to the driver’s spine [31]. The impact of the personal factors of drivers exposed to WBV have been explored in previous research works. Madhushanka et al. [32] investigated the WBV exposure of operators of construction vehicles and found that experience (number of years of exposure to WBV) and age were the most important factors that could affect drivers’ health, in addition to the daily exposure to vibration. Dewangan et al. [33] reported that biodynamic responses to vertical WBV were strongly coupled with body mass and certain anthropometric dimensions (body fat and hip circumference). Previous studies have also highlighted the importance of sitting posture during driving. In addition, previous researchers have already noted that the A(8) and VDV methods do not consider the adverse consequences for the worker’s health in the long-term activities [34]. Different responses to vibration can result from different inclinations of the back, as these can change the forces on the lumbar spine [35]. Previous studies have also suggested that internal dynamic forces are influenced by the interaction between the subject and the seat interface [36]. Hinzt et al. [22] noted that the level of risk could be improved through the consideration of both the posture and stature of the operator.
In addition, previous researchers have already noted that the A(8) and VDV methods do not consider the adverse consequences for the worker’s health in the long term. Ramar et al. [37] analysed the discomfort of dumper operators during different operations and concluded that although the vibration exposures were within the Health Guidance Caution Zone limits, neck and shoulder pain were creating discomfort. De la Hoz-Torres et al. [38] assessed the short-term WBV exposure transmitted to drivers of heavy equipment vehicles (HEVs) and found that the VDV method was more restrictive for exposure levels above the limiting values, whereas other short-term assessment methods indicated that the same exposure levels were safe for workers. In addition, a recent study conducted by Bovenzi and Schust [19] concluded that assessment methods based on measures of external vibration acceleration provided worse predictors of LBP than measures of internal lumbar forces.
To date, few studies have been conducted to propose models to facilitate the assessment of long-term WBV exposure using new approaches or machine learning (ML) techniques. The application of ML techniques for the development of models to predict complex variables has been successfully used in a wide variety of fields, such as the transport industry [39], financial market [40] or industrial sector [41]. The recent scoping review conducted by Chan et al. [42] on the role of ML in the prevention of MSDs concluded that ML techniques have enhanced work-related MSD prevention efforts, since although this is a relatively new approach, a wide variety of diverse algorithms are available to learn complex interactions. In this context, some researchers have used new approaches to generate models and frameworks to reduce WBV exposure to driving operations. De la Hoz-Torres et al. [43] proposed a GIS-based methodological framework to manage and reduce the exposure to WBV using the least-cost path algorithm for the process of route design. Upadhyay et al. [44] used a statistical approach to reduce WBV exposure among dumper operators. Rahimdel et al. [45] developed a vibrational health risk assessment for mining truck operators using artificial neural networks (ANNs). Atal et al. [46] used a Bayesian network to investigate dumper operators’ WBV exposure based on vibration measurements and a questionnaire survey in opencast coal mines. Singh et al. [47] analysed the ride comfort of agricultural tractors and proposed prediction models based on ML algorithms. They concluded that an ANN model was the most accurate in terms of predicting the ride comfort. In summary, and based on the results reported in the previous studies, ML techniques can provide accurate results and can be used to develop worker risk assessment models.
3. Materials and Methods
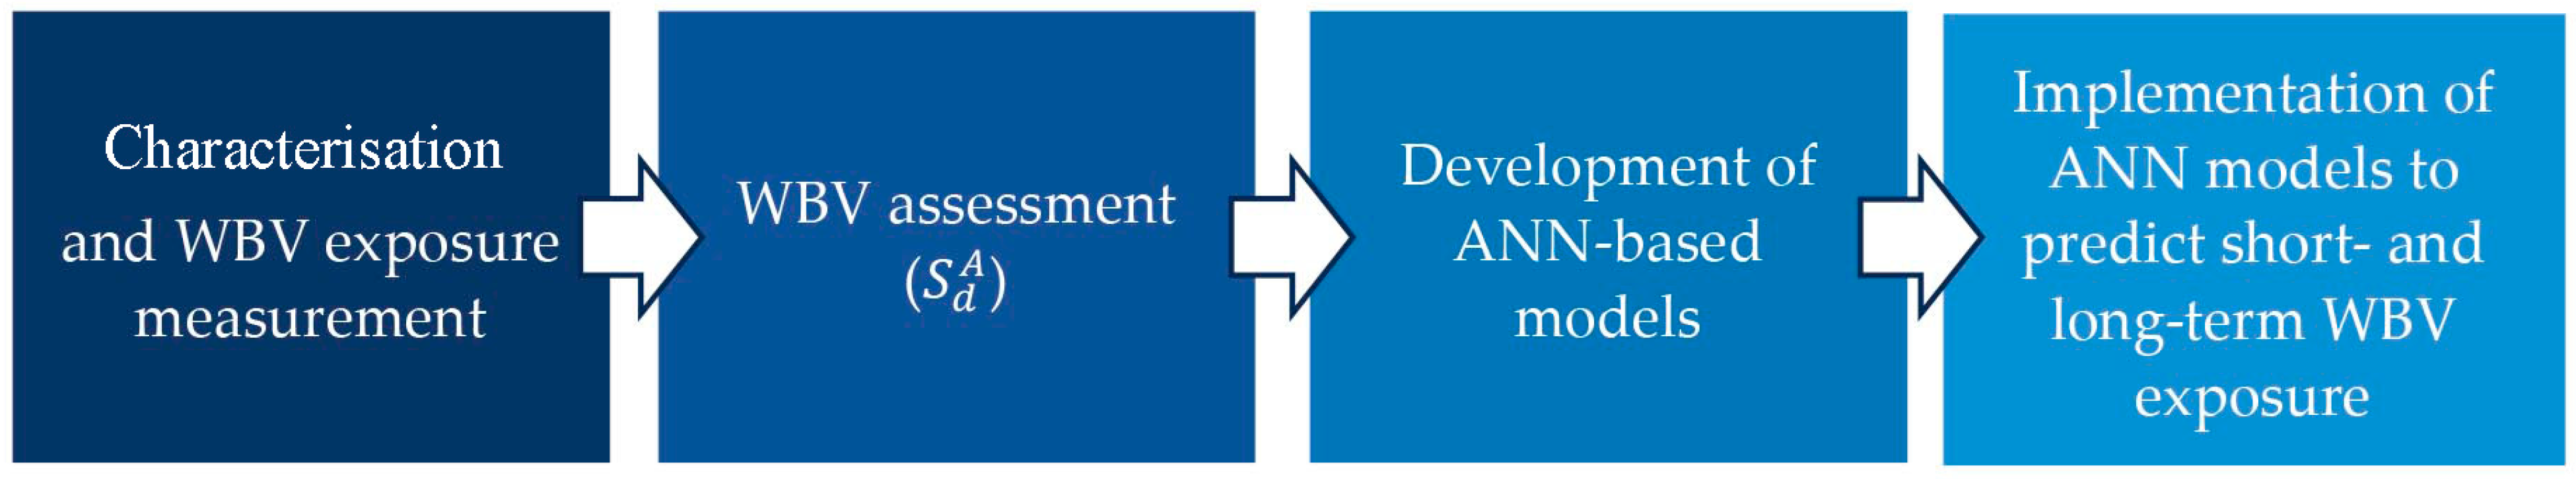
This section is divided into several subsections that describe the experimental work carried out, the sensors used during the data acquisition process, and the ANN used in this study. An overview of the methodological approach of this work is shown in Figure 1.
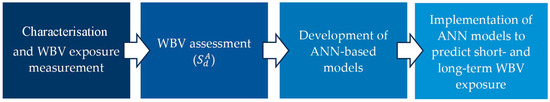
Figure 1.
Methodological approach applied in this study.
3.1. Research Participants and Experimental Setup
This study presents a methodology that can ease the implementation of individual assessment models. The proposed methodology is versatile and can be effectively applied to various activities that expose vehicle drivers to WBV. These activities occur during different phases of building construction, such as earthmoving, material transport, and demolition. For instance, during demolition, heavy machinery is used to dismantle buildings, and debris transportation also involves significant WBV exposure.
For this purpose, an employee with extensive experience of driving the HEVs commonly used in the construction sector was chosen, and the typical driving activities that exposed him to WBV were characterised and analysed. He was a healthy adult male with more than 20 years of driving experience (HEVs), without an MSD history or current pain. The characteristics of the driver and information about his work experience are shown in Table A1 (Appendix A). While the participant was specifically chosen due to his extensive HEV driving experience, it is important to note that this selection does not limit the applicability of the proposed methodology to younger drivers. This study was approved by the ethics committee of the University of Minho (reference number CEICSH 101/2023) and respected the fundamental principles established in the Declaration of Helsinki. An informed consent form was signed by the participant as part of the experimental campaign.
The vehicle selected for this study was a tractor, as the driver was most familiar with driving this type of HEV. This is a Class II Category A vehicle [48] and its characteristics are shown in Table A2 (Appendix A).
In this investigation, we monitored and collected data during the typical activities carried out by the driver with this vehicle, which included travelling at different velocities and on different types of surfaces during load transport activities (earth and backfill materials). In this scenario, the driver is exposed to WBVs received through the vehicle seat surface. A typical work cycle was identified, and a route for field measurement was selected. This route included different type of surfaces: tarmac roads (IRI: 8.6 mm/m), unpaved roads (IRI: 11.9 mm/m) and off-road (IRI: 15.4 mm/m). The route was representative of the complete work cycle. Previous studies on the WBV exposure assessment have also used this experimental design [49,50].
Subsequently, after the field test was defined, the procedure and objectives of this research were explained to the driver. He was instructed to remain seated and to avoid losing contact with the seat. The driver performed the test and repeated the predefined route. The equipment used in this study to measure the acceleration transmitted between the seat and the driver was an SV 38 (SVANTEK, Warsaw, Poland) MEMS triaxial accelerometer, which was connected to an SV 106A six-channel human vibration meter and analyser. The SV38 sensor measured the signal along the x- (front-to-rear), y- (left-to-right) and z- (buttocks-to-head) axes. The data sampling rate was 6 kHz, and the process of data acquisition followed the requirements and recommendations set out in ISO 2631-1:1997 and 2631-5:2018. A global positioning system was used to register the vehicle’s location, and subsequently to determine the travel velocity. The recorded data were processed using MATLAB® software (version R2013b v.8.2). Measurements were made over periods of at least 120 s, with a maximum speed deviation of 2.5 km/h. The methodology used in this study followed the ISO 2631-1:1997 recommendations (to ensure an error of less than 3 dB at a 90% confidence level, a minimum measurement duration of 108 s for a lower frequency limit of 1 Hz was selected). Each recorded measurement was processed and used to analyse the health effects of vibration over different exposure times (from 1 to 8 h), which provided a total dataset of 3040 WBV exposures.
3.2. Vibration Exposure and Assessment of Health Risks
WBV assessment was first carried out using measures of external vibration. This approach is commonly used to assess WBV exposure, as it is the method indicated in Directive 2002/44/EC. The input to this process consisted of the acceleration values measured at the seat interface (i.e., between the operator and the seat). According to ISO 2631-1, the acceleration should be weighted (using the factors described the ISO standard), and the obtained results used to assess the daily WBV exposure. Based on the recorded values, the rms (Equation (1)) and vdv (Equation (2)) of the signal were calculated and used in the A(8) (Equation (3)) and VDV (Equation (4)) assessment methods, respectively.
where denotes the different axes x, y and z; is the root mean square (rms) of the weighted averaged acceleration in the i-th axis; is the time duration of the measurement; is the frequency-weighted instantaneous acceleration along the i-th axis (Wk on the z-axis and Wd on the x- and y-axes); is the vibration dose value of the weighted averaged acceleration along the i-th axis; A(8) is the 8 h daily exposure; are the dimensional multiplication factors in each axis (); is the vdv exposure along the i-th axis; is the exposure duration; is the 8 h reference duration; and is the measurement period.
According to the European Directive 2002/44/CE, the three axes should be evaluated, and the highest value obtained should be used for comparison with the daily exposure action value (A(8)EAV = 0.50 m/s2 and VDVEAV = 9.10 m/s1.75) and the daily exposure limit value (A(8)ELV = 1.15 m/s2 and VDVELV = 21.00 m/s1.75).
ISO 2631-1:1997 specifies that rms methods are applicable for crest factors (CF) of below nine, whereas for exposures with a CF of above nine, other methods such as vdv are indicated. However, Directive 2002/44/CE does not mention this aspect. The CF is determined using Equation (5):
where is crest factor along the i-th axis; is the instantaneous peak value of the frequency-weighted acceleration signal on the i-axis and is the rms of the weighted averaged acceleration along the i-th axis.
In addition, in this study, the WBV assessment method defined in the International Standard ISO 2631-5:2018 was applied. This method is based on the calculation of the internal lumbar forces. In addition, the method used here was the one developed for “less severe conditions”, since the activities corresponded to this regime (i.e., exposure without free-fall events, peak accelerations of up to 9.81 m/s2 in the z-direction and where the driver remains seated). The activities conducted in the construction sector are most likely to correspond to this exposure regime. The flowchart for the determination of the and RA parameters according to ISO 2631-5:2018 is shown in Figure 2.
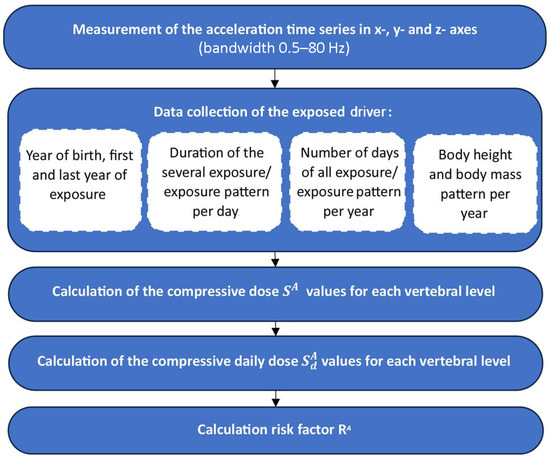
Figure 2.
Flowchart of the calculation of the risk factor RA (ISO 2631-5:2018) [21].
The application of this method required us to record the acceleration between the operator and the seat, and the intra-spinal forces were predicted using the transfer function described in the ISO 2631-5:2018 standard. Although the acceleration measurement process followed the procedures outlined in ISO 2631-1:1997, the calculation required the application of a more complex method than those described in ISO 2631-1 and was not based on the widely used signal rms value.
As a minimum, the ISO 2631-5:2018 model takes as input the acceleration measured at the seat surface in the three directions (x, y and z) and the posture and body mass index of the exposed driver (BMI). In addition, the acceleration measured at the feet and backrest can also be included in the evaluation. The compressive forces at different vertebral levels are calculated based on these acceleration time series and the transfer functions, which depend on the posture and BMI. The compressive dose is calculated for the six disc levels (i.e., T12/L1, L1/L2, L2/L3, L3/L4, L4/L5 and L5/S1) based on Equation (6).
where is the area of a vertebral endplate, and are the peak compressive forces acting on the area of a vertebral endplate.
The values obtained for each disc level can be used to determine the equivalent daily compressive dose of the lumbar spine (Equation (7)).
where is the dynamic compressive dose to the lumbar spine due to WBV exposure from activity j; is the time period over which has been measured; and is the time period of the daily vibration exposure to the activity j.
In terms of long-term WBV exposure assessment, ISO 2631-5 describes the risk of spinal injury based on the RA parameter. This parameter considers the duration of exposure related to the age of the exposed individual and the year at which the exposure started. RA is estimated for vertebral levels T12/L1 to L5/S1 and requires as input data the value of and duration of each vibration exposure, the year of birth of the exposed individual, the first year of exposure, the last year of exposure, and the duration and pattern of each exposure per year. Assuming a constant exposure pattern per day over all years, RA is calculated according to Equation (8):
where is the number of years of exposure; is the year counter; Ni is the number of exposure days per year ; is the constant daily compressive dose; is the mean value of the compressive–decompressive force divided by the area of a vertebra endplate B, and is the ultimate strength of a lumbar vertebra for a person aged (b + 1) years (where b is the age at which the exposure started).
This standard also defines the limits of probability of an adverse health effect: a low probability is indicated by < 0.8, while a high probability is indicated by > 1.2.
3.3. Artificial Neural Network
To generate a model to predict the long-term health risk of an individual exposed to WBV, an ANN model was formulated for each vertebral level in this study. This approach is necessary because, when a driver is exposed to WBV, the at each vertebral level varies. Consequently, the also differs. By accurately formulating models that determine , the safety manager can assess the , allowing him to evaluate the driver long-term WBV exposure.
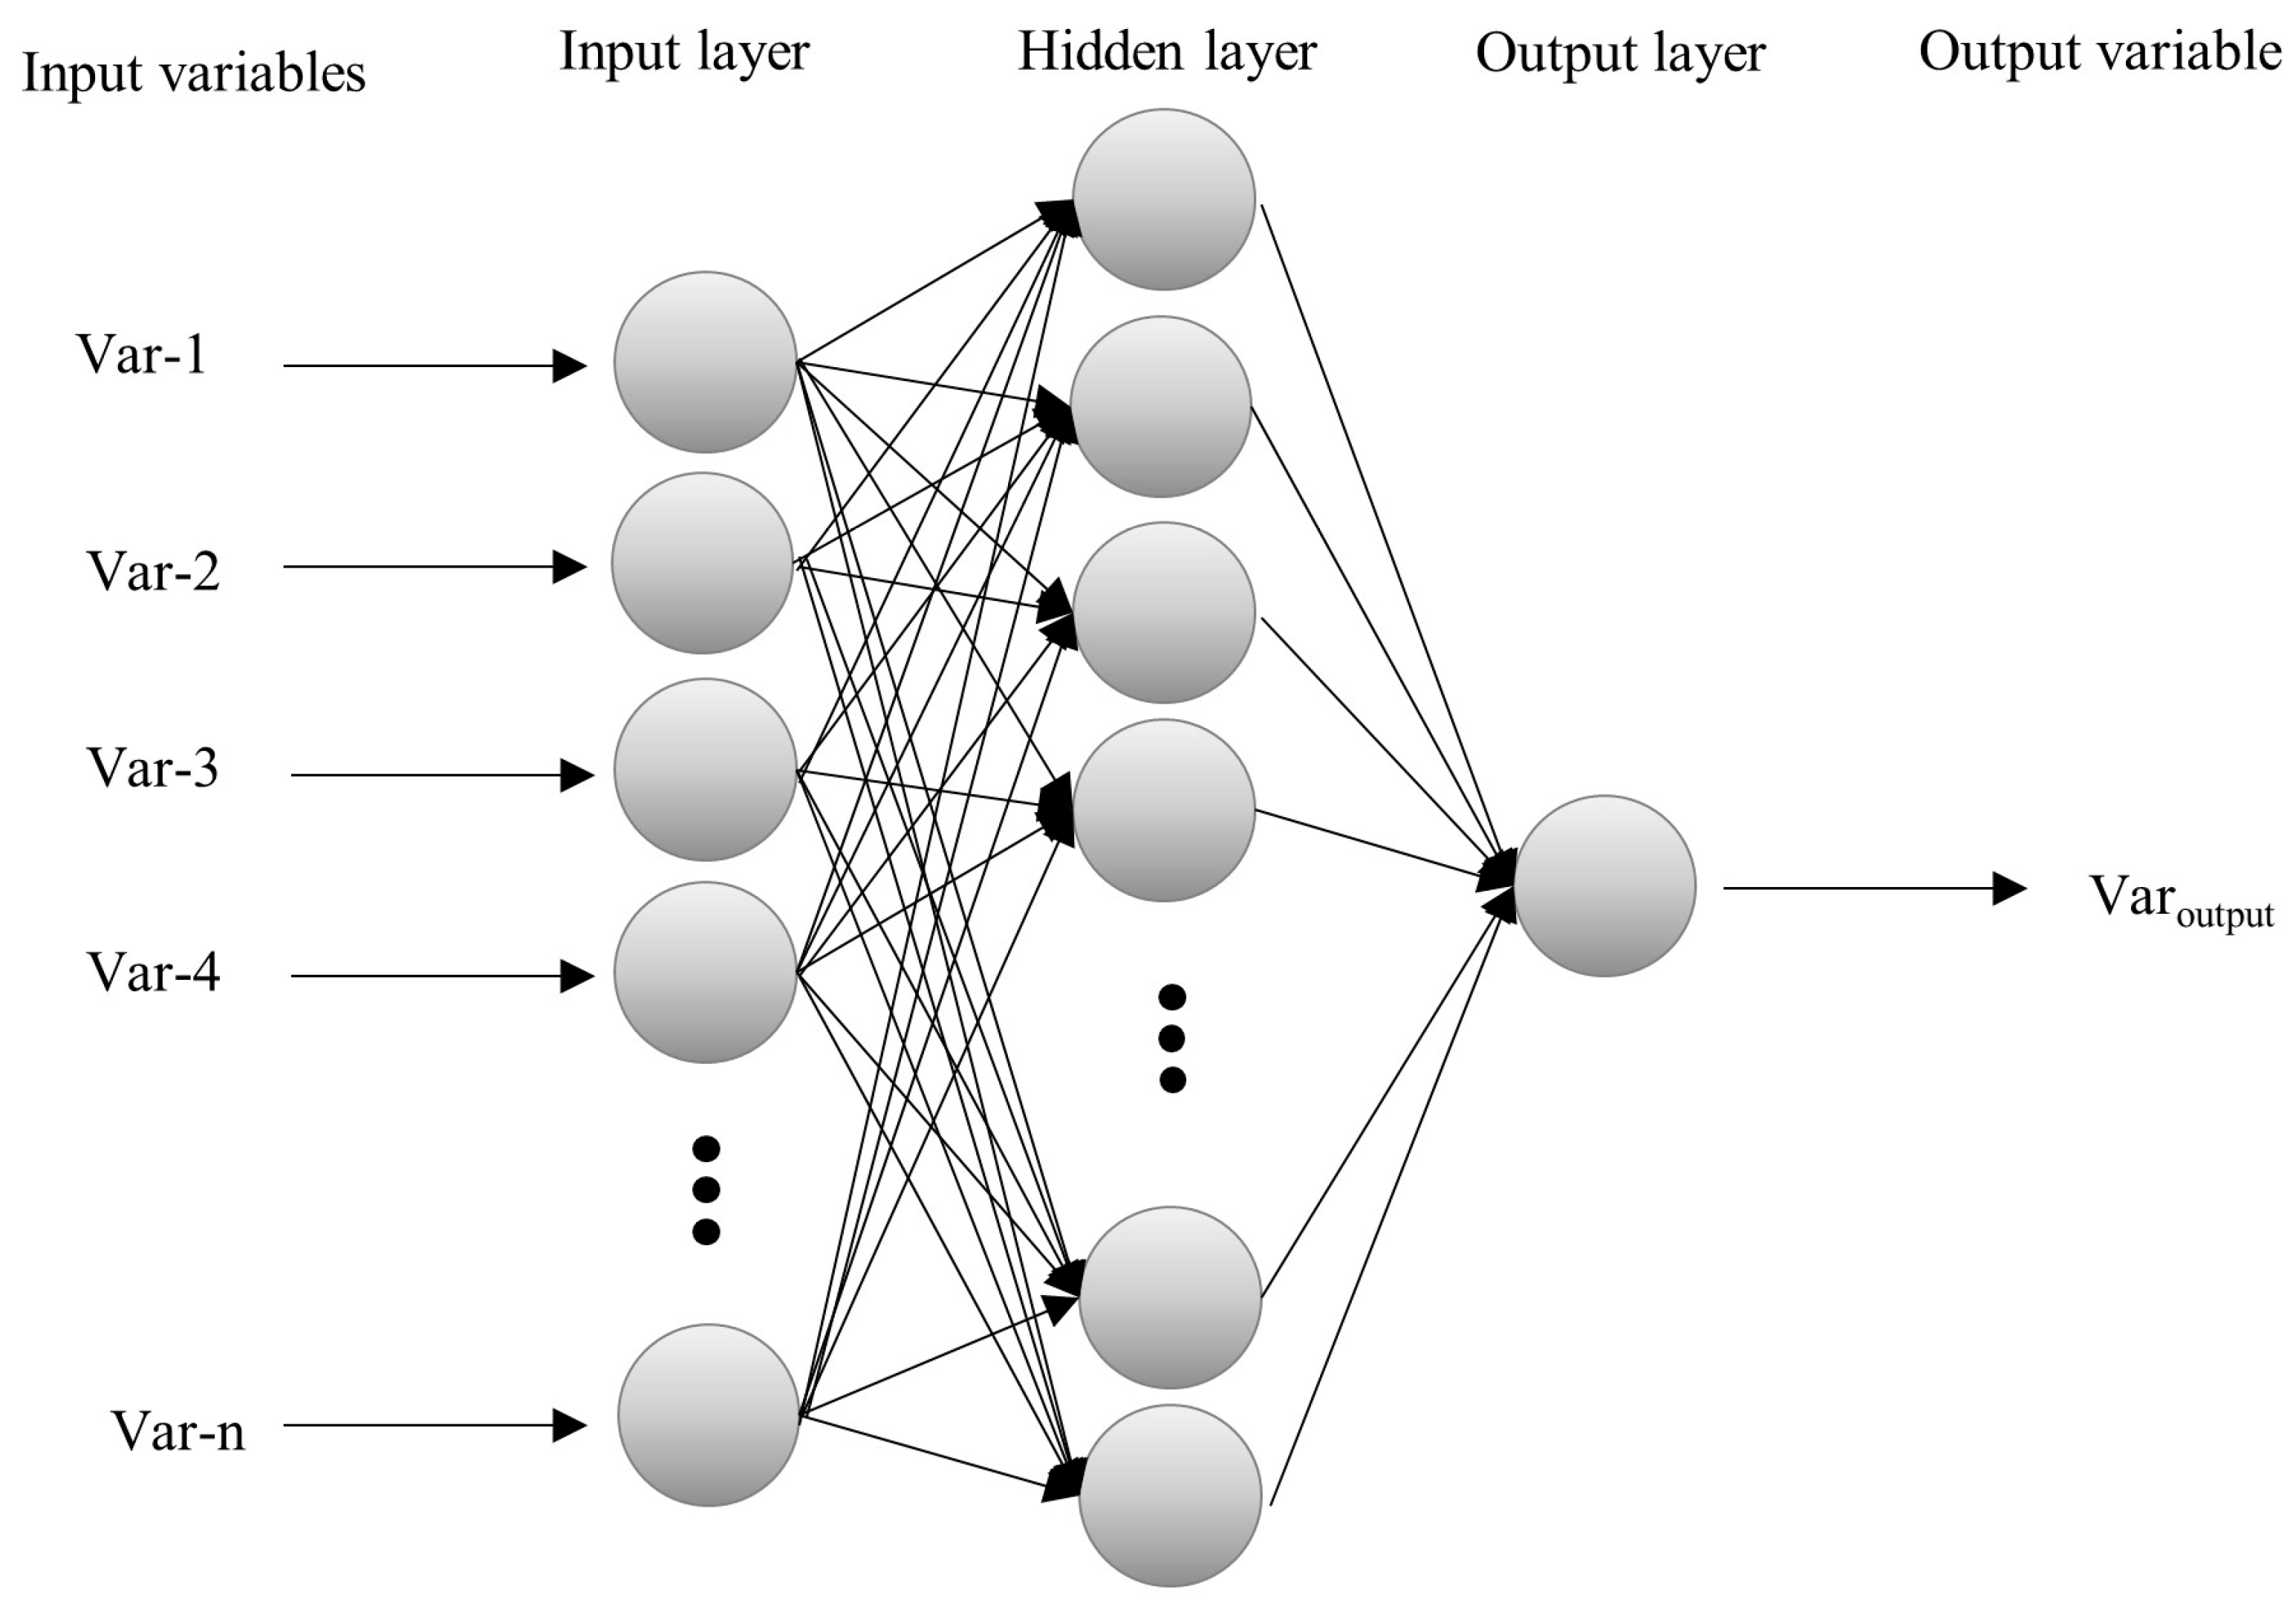
An ANN was chosen for the predictive models, since this type of ML algorithm has been used in previous studies of the construction sector to predict complex variables that depend on several parameters, such as non-destructive vibration testing [51], the behaviour of building occupants [52] and safety management [53,54,55]. A multilayer perceptron ANN was used in this study, with an architecture that consisted of an input layer, which was connected to one or more hidden layers, and an output layer (Figure 3). The basic structure only had one hidden layer, and since any complex nonlinear function can be approximated in the first instance with this structure according to ANN theory [56], this was the structure selected. The ANN models were constructed, trained and validated using Python and Scikit-learn library.
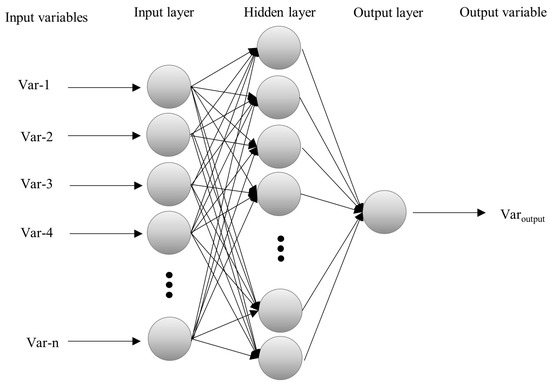
Figure 3.
Architecture of an artificial neural network (one hidden layer and one output variable).
In this study, 13 variables have been selected for the input layer and one variable for the output layer. Different variables were selected as ANN input parameters: the rms on each axis (i.e., rmsx, rmsy and rmsz), the vdv on each axis (i.e., vdvx, vdvy and vdvz), the crest factor on each axis (i.e., CFx, CFy and CFz), and the mean velocity, type of surface, measurement period, and exposure time. Posture and anthropometric characteristics were not included as input variables, as these do not vary across exposures. These characteristic parameters of the acceleration signal are typically used by companies to assess the exposure of drivers according to European Directive 2002/44/CE, meaning that their measurement does not pose a challenge or problem for companies that have used these values previously to assess WBV exposure. Therefore, the data collection process required for the implementation of the proposed methodology should not pose a problem for companies and safety managers, since these variables are used to assess short-term WBV exposure according to the methods set out in the Directive 2002/44/CE.
A single output parameter was selected, consisting of the compressive dose . The was calculated from the data collected in the field measurements and applying the assessment method defined in ISO 2631-5:2018. This parameter was selected because it is based on the internal lumbar forces, and this approach provides better predictors of LBP than methods based on external vibration acceleration [19]. In addition, is critical in determining the risk of short- and long-term exposure according to ISO 2631-5:2018. The optimal number of neurons in the hidden layers was calculated using Equation (9) [57,58,59]:
where is the number of neurons in the hidden layers, and is the number of neurons in the input layer. Given that the compressive dose is different at each vertebra level, six models were generated to estimate the health risk assessment RA for each level. Table A3 in Appendix A shows a summary of the sets and parameters used in this study.
To generate the ANN models, the dataset was segmented into training (80%) and test (20%) sets for each of the prediction models. The backpropagation lbfgs (quasi-Newton method) algorithm was selected as a solver for weight optimisation. The rectified linear unit (ReLU) was selected as activation function for the hidden layer.
In addition, K-fold cross validation was implemented. This approach requires dividing the input data into k partitions to create k identical models, each of which is trained on k − 1 partitions and evaluated on the remaining partition [60]. This algorithm starts with a random mixing of the dataset and the initialisation of the parameter k (integer) that will define the number of partitions or splits of the dataset. The k parameter sets the number of training and validation iterations that will be used to develop the model. Once the value of k is set, the training and validation process starts. During the k iterations these steps are repeated:
- One of the k partitions is taken and separated from the rest. This fold will be the one that validates the model so that it registers performance and errors.
- The remaining k − 1 splits are taken and the model is trained with them.
- Once the training process is completed, the model is validated with the fold from step one and its performance is stored.
These steps are repeated k times, so that each split is used exactly once for validation. The validation score for the model is determined based on the average of the k validation rms error measurements. The final performance of the model will be the average of all performances. In this study, the number of folds was five (Figure 4).
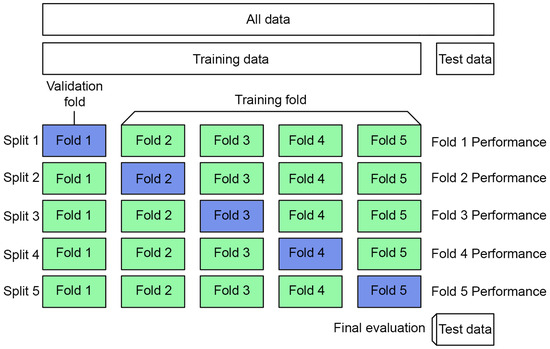
Figure 4.
K-fold approach used during the training and validation process.
Additionally, the data were also normalised using Equation (10), to avoid the smaller numbers being overridden by the larger numbers and the premature saturation of the neurons in the hidden layer [61].
where are the normalised data (in the range zero to one); is the initial parameter value; is the minimum value of the set of values and is the maximum value of the set of values.
Finally, the ANN models developed in this study were evaluated through a comparison of the predicted and actual values of . Two forms of statistical error were considered: the mean absolute error (MAE), which is the mean of the absolute error between the actual and predicted values, and the mean square error (MSE), which is the average of the squared errors between the actual and predicted values. Equations (11) and (12) were used to estimate these errors, respectively.
where is the total number of data, is the predicted value and is the observed value.
As can be deduced from Equations (11) and (12), the lower the values of MAE and MSE, the better the accuracy of the model.
4. Results
4.1. Performance Analysis of the ANN Models
The collected data were processed and used to analyse the health effects of WBV exposure. A total dataset of 3040 WBV exposures were used for this purpose. This dataset was elaborated based on the data collected during the measurement campaign. Anonymous sample data can be downloaded in Supplementary Materials. The ISO 2631-1:1997 recommendations were followed in this study (a minimum measurement duration of 108 s for a lower frequency limit of 1 Hz is required to ensure an error of less than 3 dB at a 90% confidence level). The obtained values were used to generate six ANN models to predict for each level of the spine. The accuracy of the different ANN models was evaluated. A summary of the R2, MSE and MAE values is shown in Table 1 for the training, cross-validation and test datasets. Each of the generated models had a high R2 value of above 0.90. Differences of less than 0.01 were found between the values of R2 for the different datasets at all vertebral levels, except between the training and cross-validation, and cross-validation and test datasets for the L4/L5 and L3/L4 vertebral levels, where a difference of 0.02 was observed. The statistical errors were analysed, where the lower the prediction error, the higher the accuracy of the developed models. Similar values for the MSE were shown by all models (0.01), although greater variation was found in the MAE values (between 0.017 and 0.025). The results showed that the models provided accurate predictions.

Table 1.
Summary of results for the coefficient of determination (R2), MSE and MAE for the ANN models.
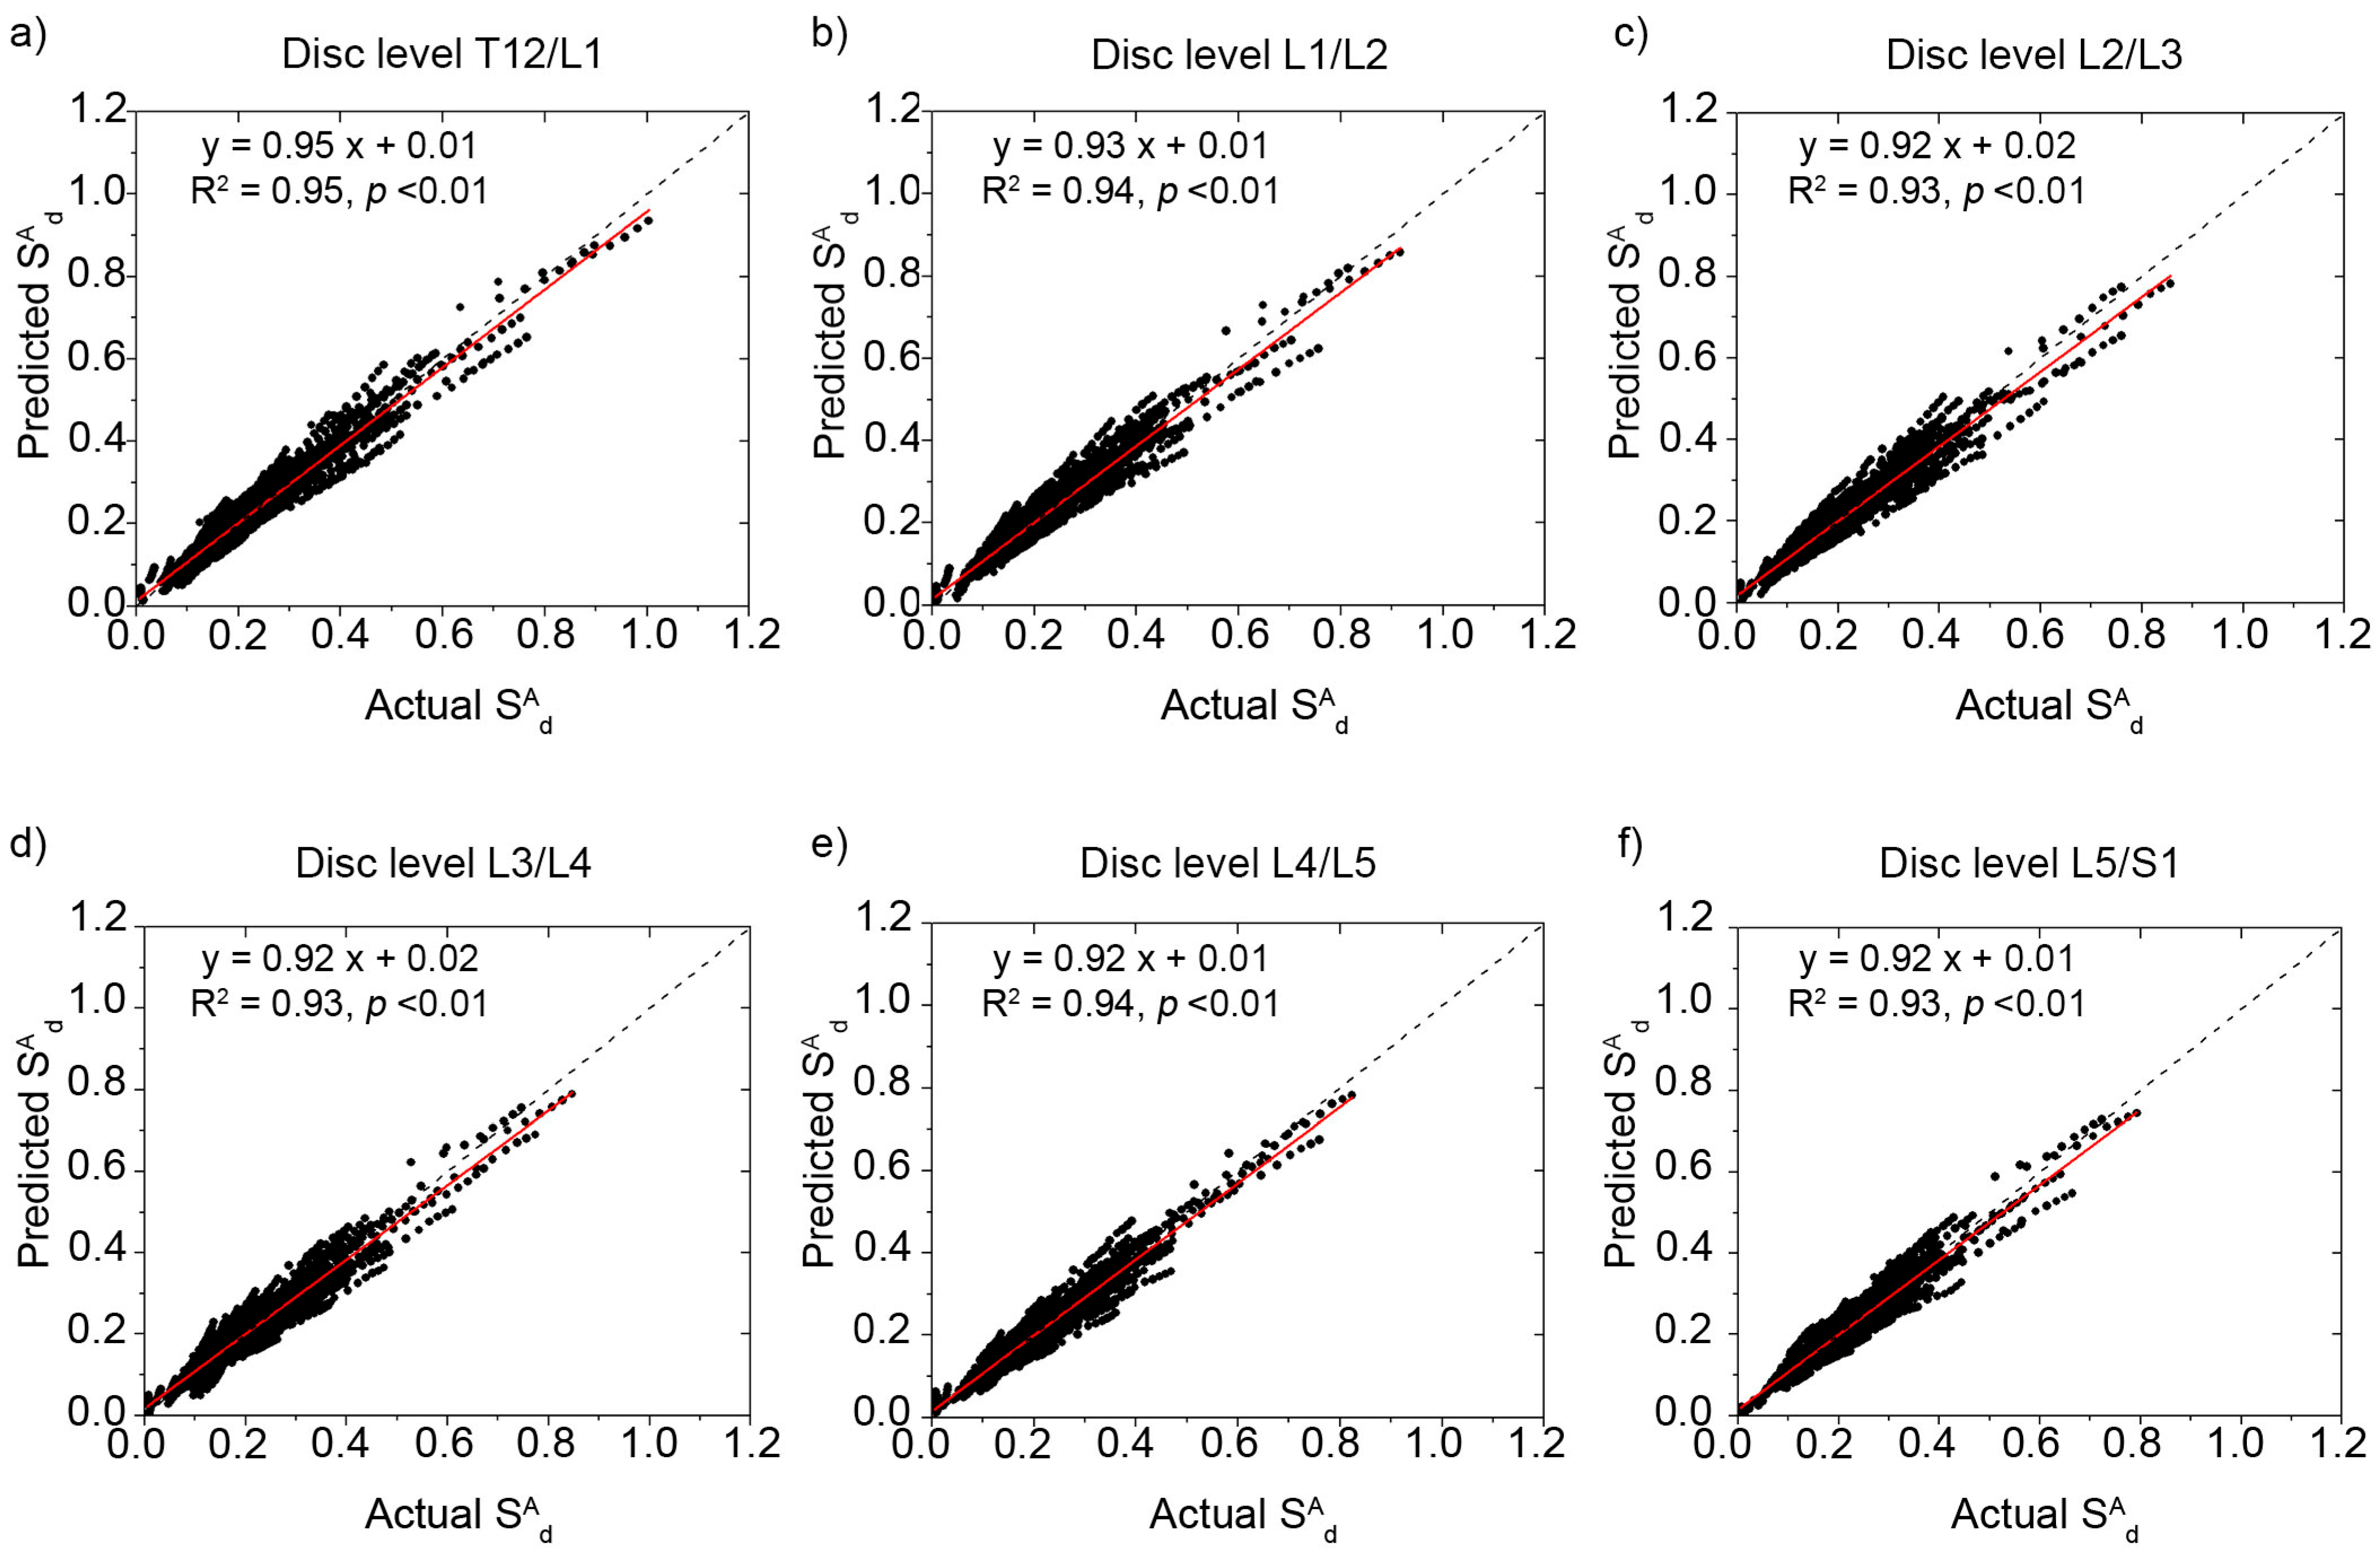
Figure 5 shows the relationship between the actual values for each vertebral level, and the predicted values obtained from the ANN models. In addition, the linearly regressed relationships obtained between both values are shown as solid red lines. The performance of each vertebral level ANN model was compared against the ideal conditions, which are shown on each graph as a bisector line. The closer the slope of the model’s regressed line to that of the bisector line, and the smaller the error determined from the difference between the actual and predicted values, the better the model’s performance. It can be observed from Figure 3 that the formulated ANN models provide accurate predictions, since the values are close to the bisector line. This conclusion can also be drawn from the regression equation and R2 obtained for each ANN model (Figure 3). The slope of all regressed lines is close to one, with values ranging between 0.92 and 0.95.
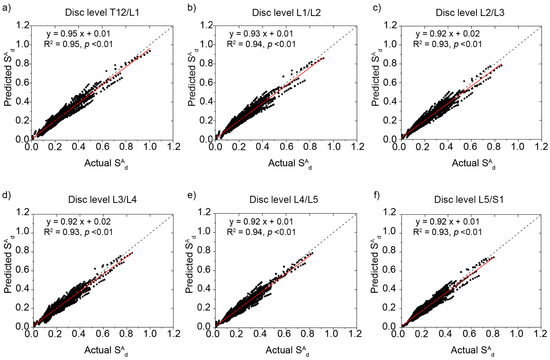
Figure 5.
Relationships between predicted and actual values for six vertebral levels: (a) T12/L1, (b) L1/L2, (c) L2/L3, (d) L3/L4, (e) L4/L5, (f) L5/S1. The red line represents the regression equation, and the dotted line represents the bisector line.
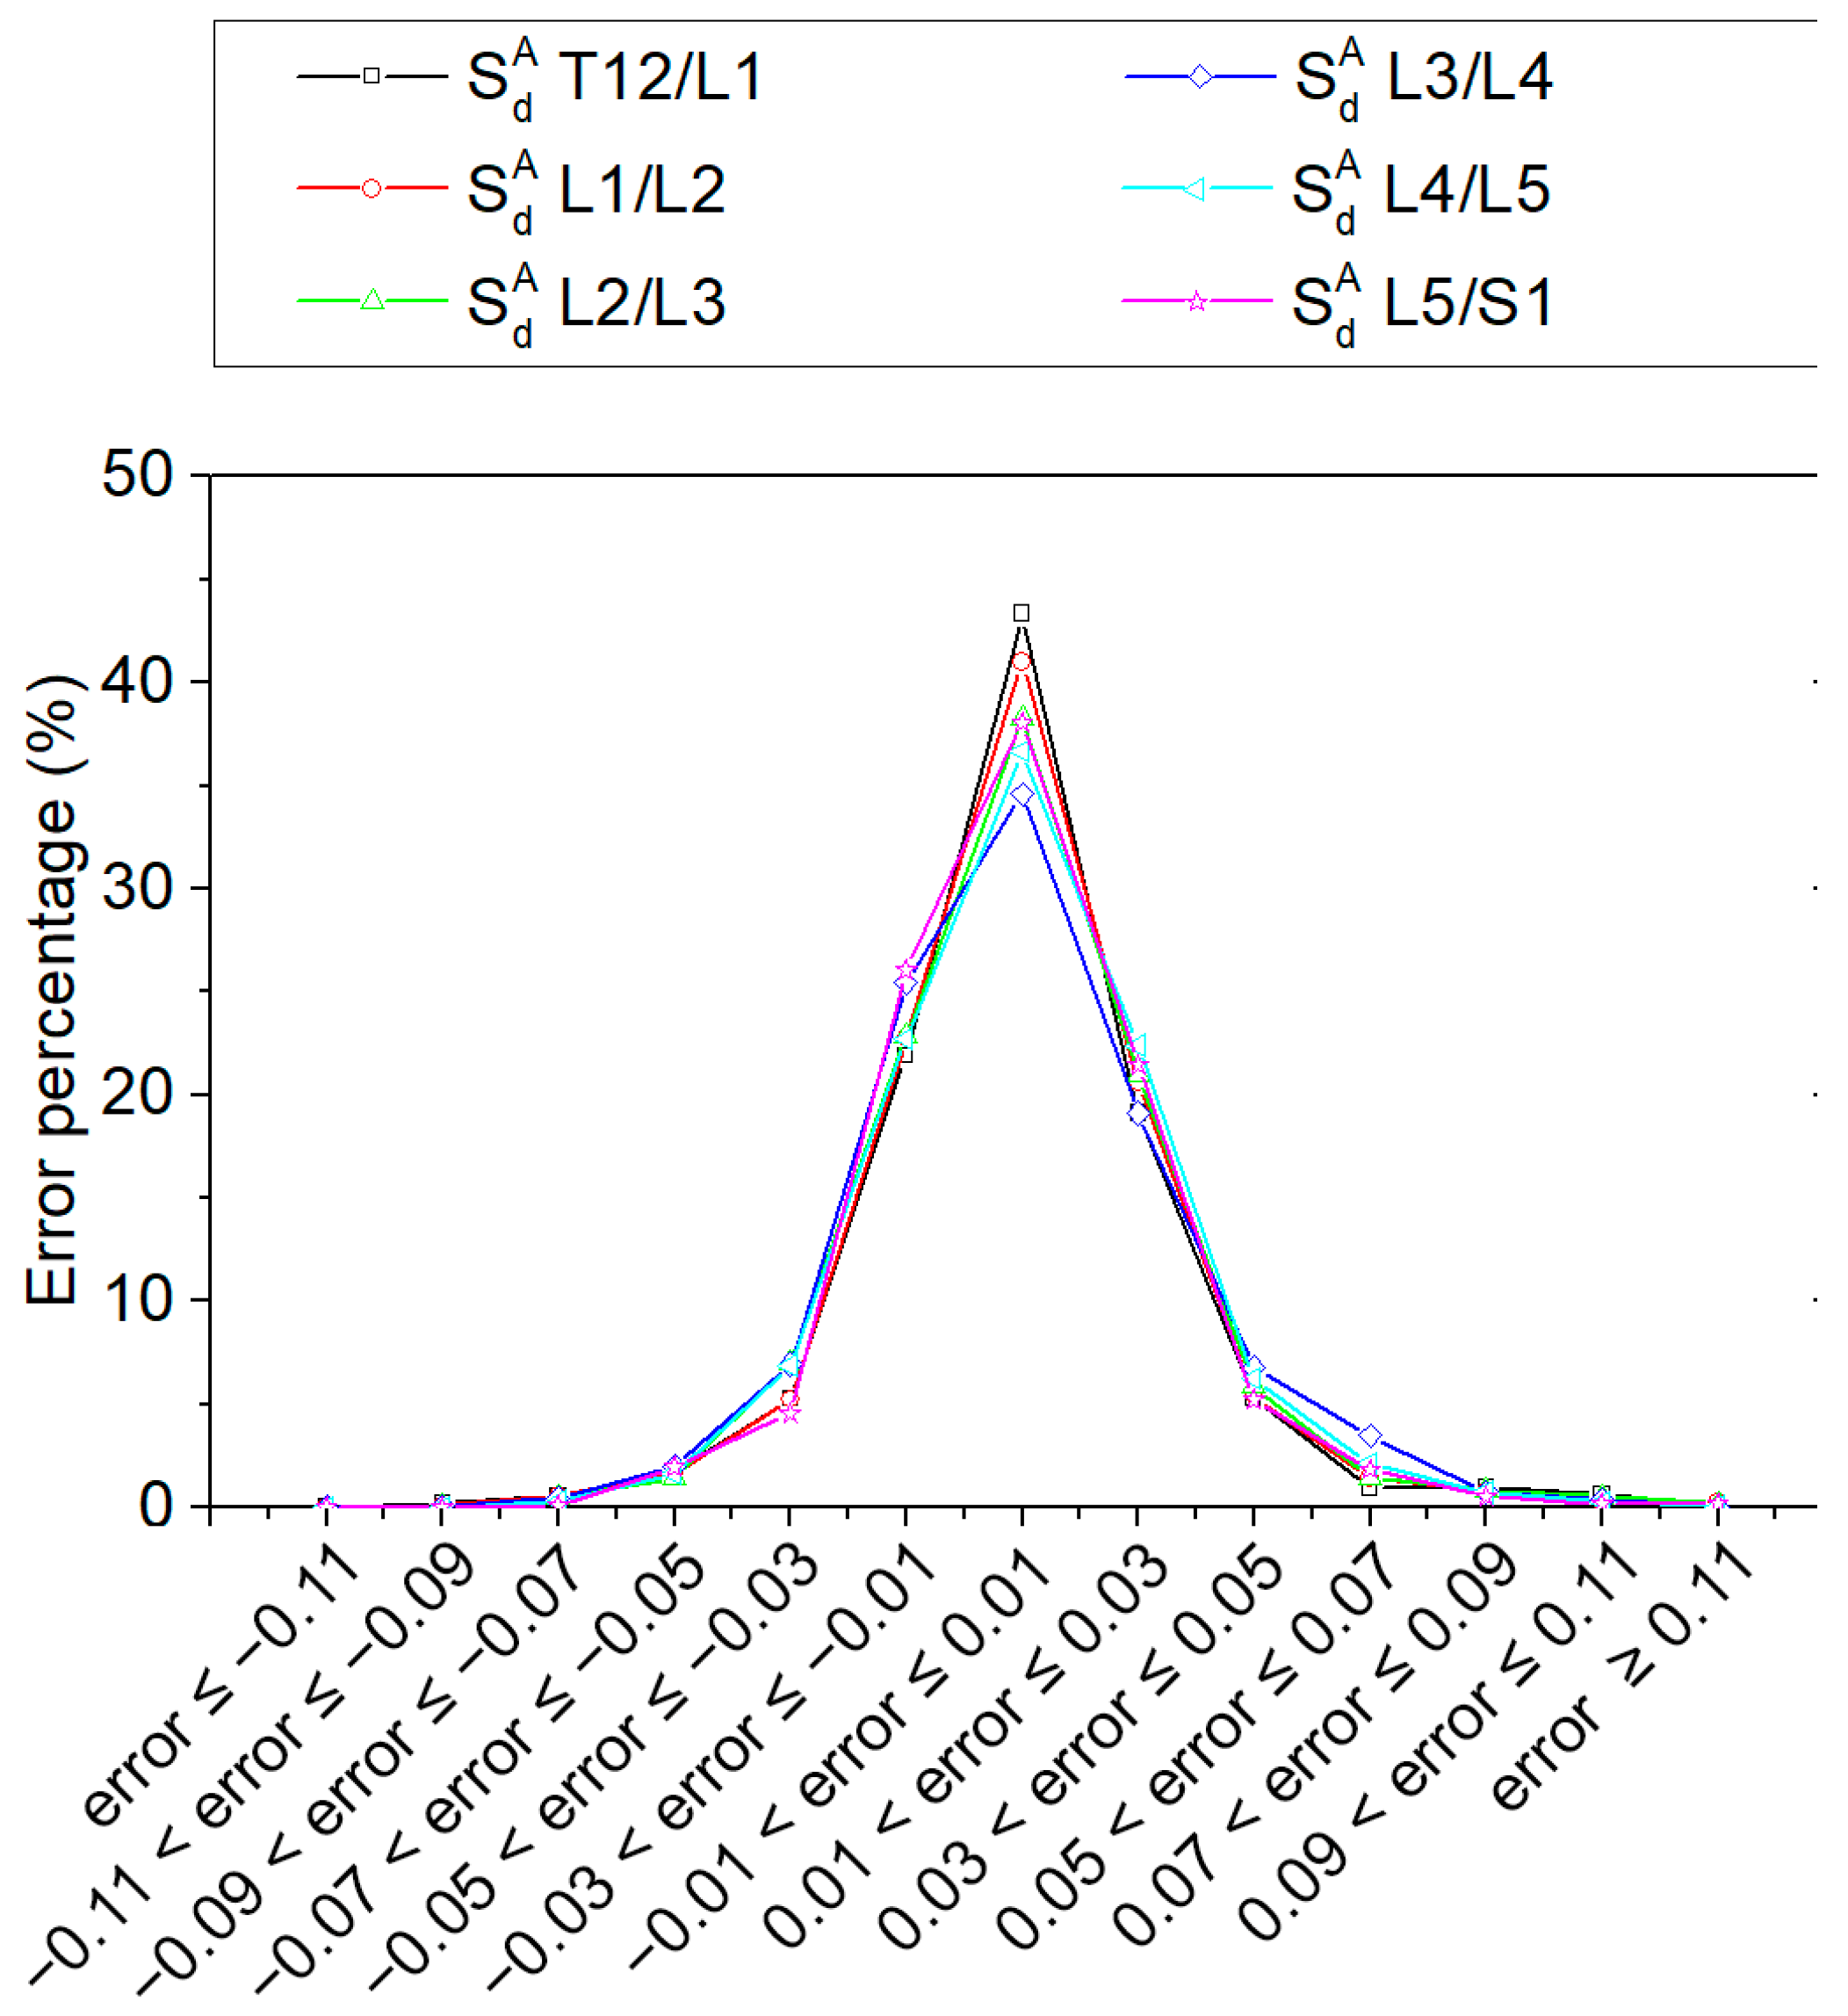
Figure 6 shows the error distribution profiles for the six developed ANN models. The error was determined by subtracting the predicted values from the actual values. A positive error shows that the actual value was underestimated, since the predicted value was lower than the actual value. In contrast, a negative error implies that the predicted value was higher than the actual value, meaning that the actual value was overestimated by the model. The obtained error profiles show that the predicted values deviate by less than 0.03 from the actual values for the levels T12/L1 (84.4%), L1/L2 (84.3%), L2/L3 (82.1%), L3/L4 (79.1%), L4/L5 (81.2%) and L5/T1 (85.5%). In addition, and as shown in Figure 3, the error profiles of the models show a slight positive deviation. However, the frequency of this error is very low (deviations of greater than 0.09 represent less than 1% of the total sample).
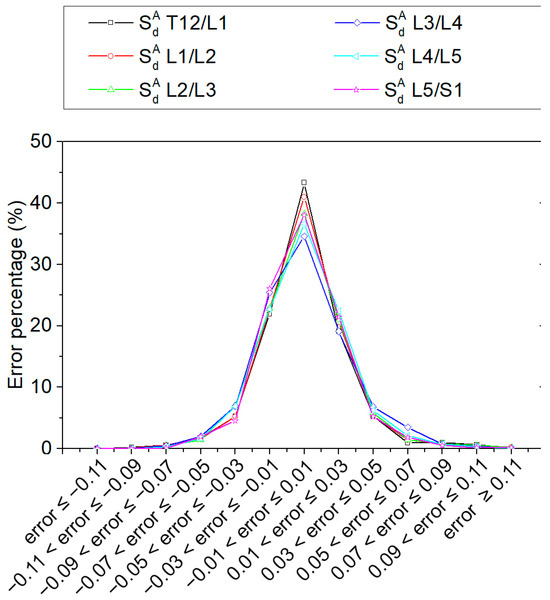
Figure 6.
Error distribution profile for the ANN models for the six vertebral levels.
These results indicate that the ANN models formulated here provide accurate results and can be used as useful tools to predict individual assessment values.
4.2. Case Study and Comparison of the Assessment Models
To illustrate the application of the generated ANN models and to compare them to other models, a typical daily work cycle for the driver who participated in the study was selected. This work cycle included two different types of driving activities: driving on a tarmac road (for 4 h at a mean velocity of 17.1 km/h) and driving on unpaved roads (for 1.5 h at a mean velocity of 17.8 km/h). These types of driving activities were evaluated, and the acceleration transmitted to the driver through the seat was measured. The values of rms and vdv are shown in Table 2.
Table 2.
Summary of the measured rms and vdv values for the different activities in the selected work cycle.
The A(8) and VDV methods were applied based on the collected values, and the obtained daily WBV exposures were 0.46 m/s2 and 16.11 m/s1.75, respectively. According to Directive 2002/44/CE, the value obtained for A(8) does not exceed the EAV limit, meaning that the WBV exposure is safe for the health of the driver. In contrast, the obtained VDV value exceeds the EAV limit, indicating that action should be taken in order to reduce the driver’s WBV exposure.
The collected vibration data were also used to apply the ISO 2631-5:2018 method, and the results were compared with the predicted values obtained from the developed ANN models. Table 3 shows these results. The values generated by the ISO 2631-5:2018 model and our ANN models were very similar (with differences of between 0.002 and 0.03). The most unfavourable value was seen for vertebral level T12/L1.
Table 3.
values obtained from the ISO 2631-5:2018 model and the formulated ANN models.
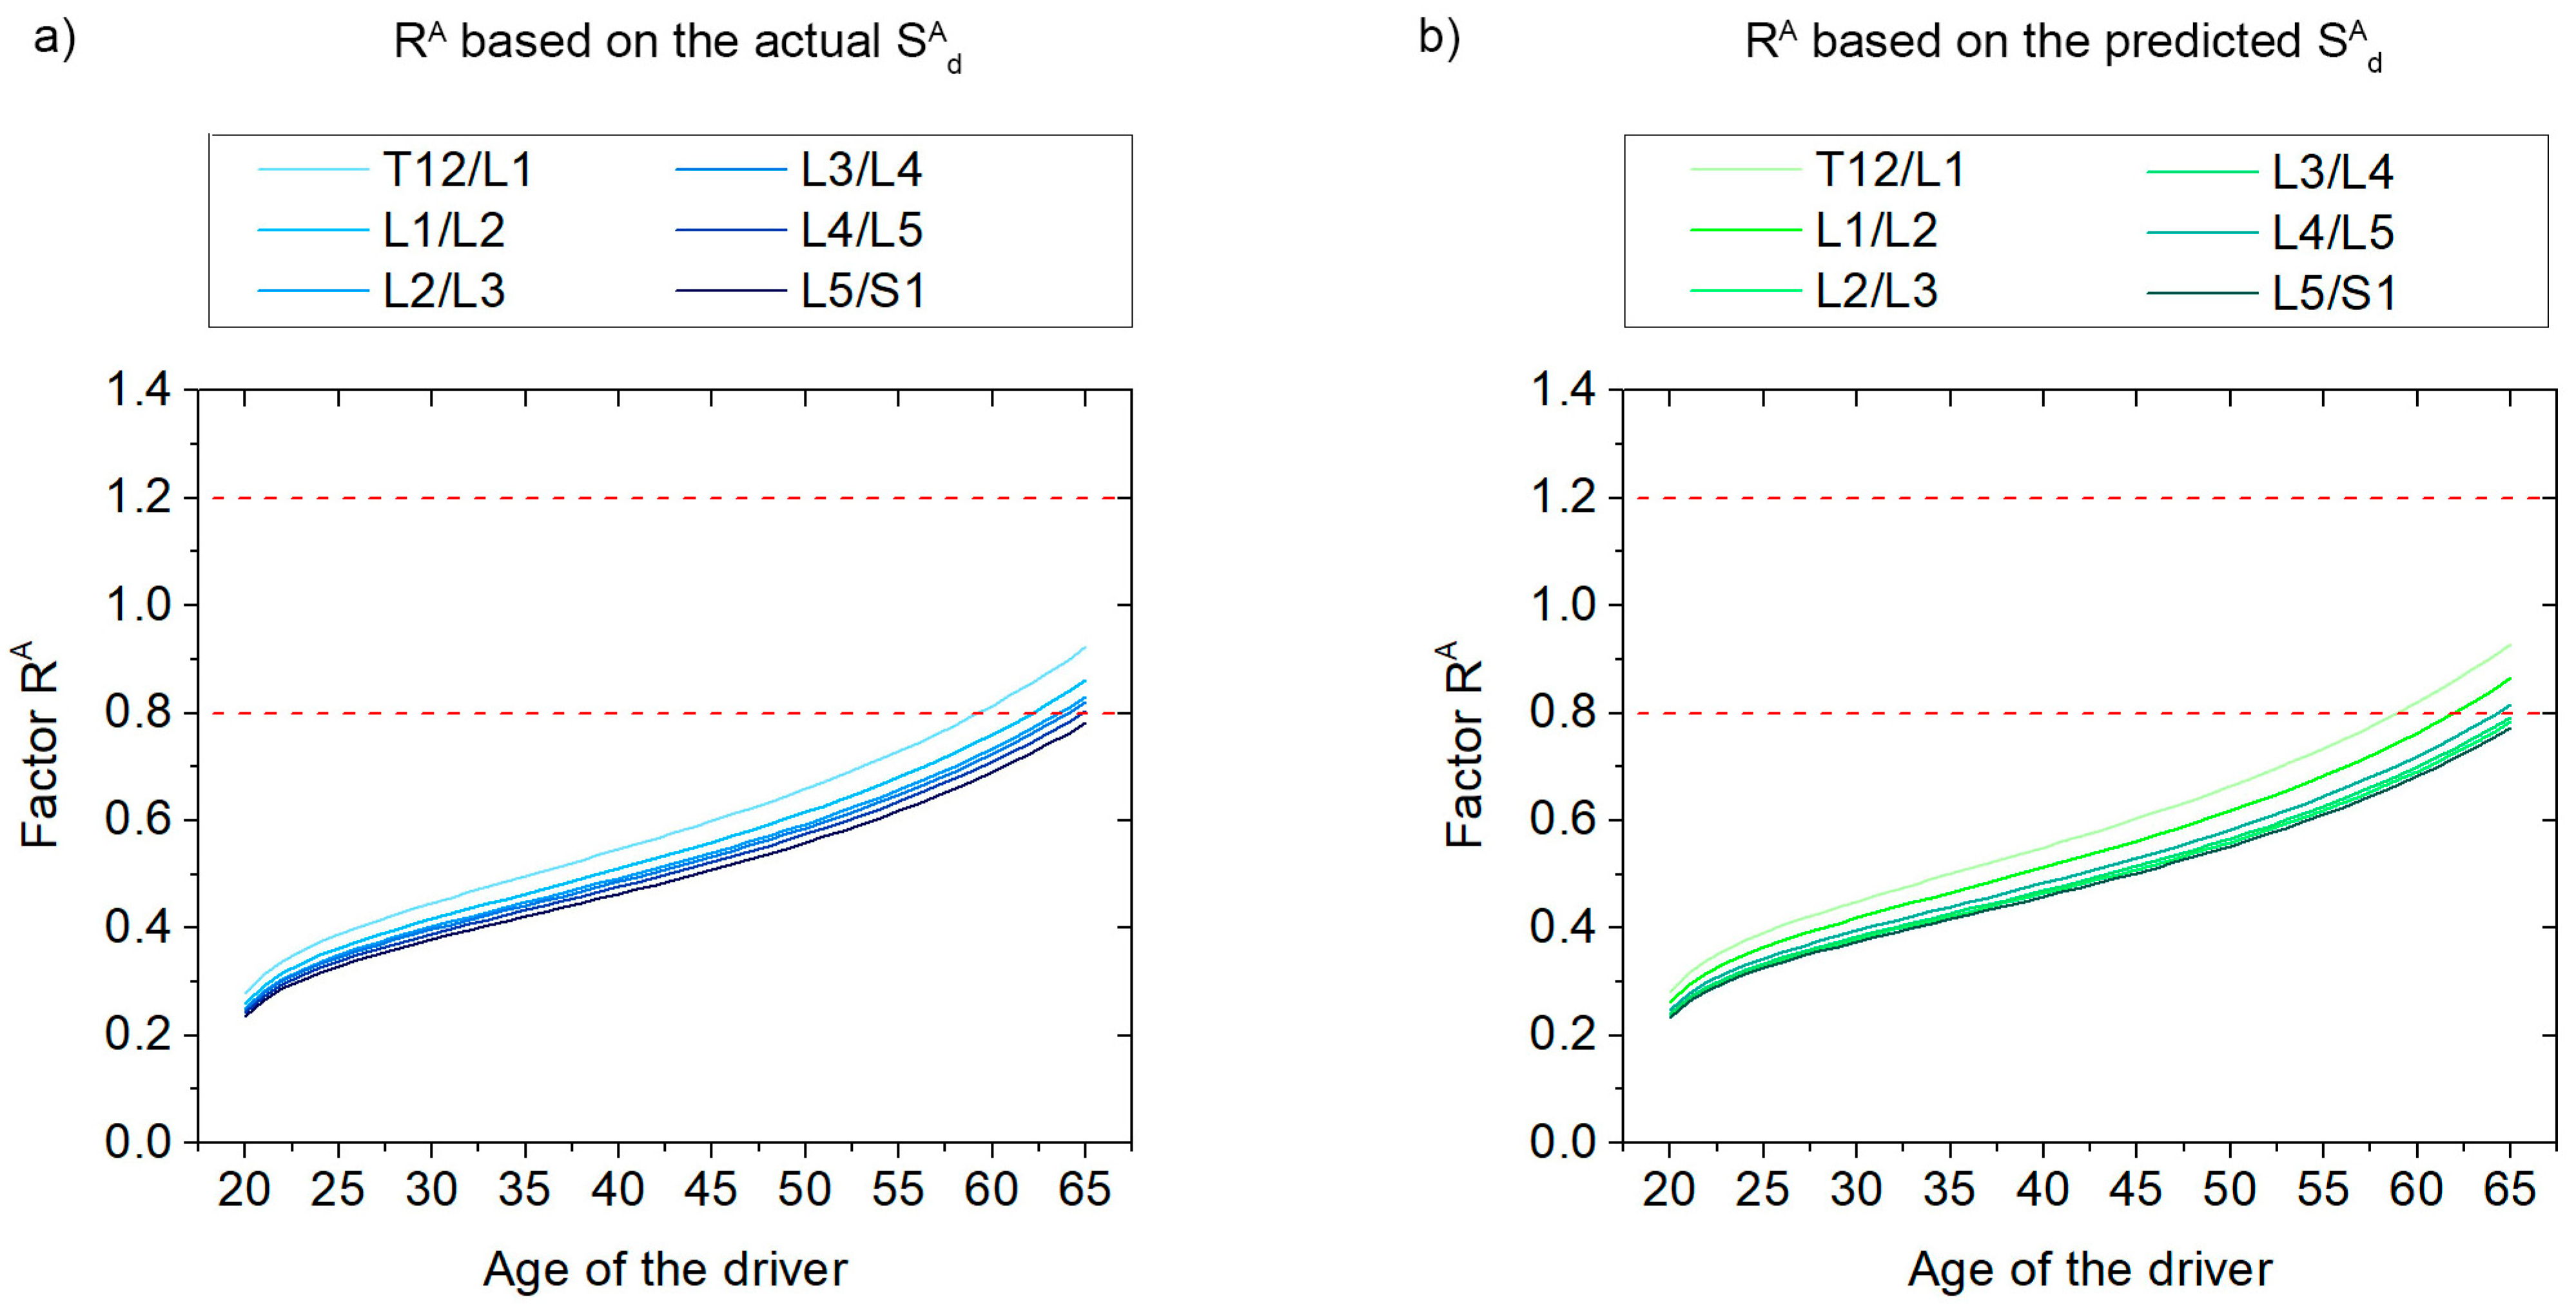
The values were then used to evaluate the risk factor RA. The long-term WBV exposure was calculated based on the assumption of a constant daily exposure in the most unfavourable scenario, where the driver was first exposed at the age of 20 and was exposed to over 45 working years (240 days per year), assuming a constant compressive stress = 0.25 MPa. The RA calculated over the years for each vertebra level is shown in Figure 7.
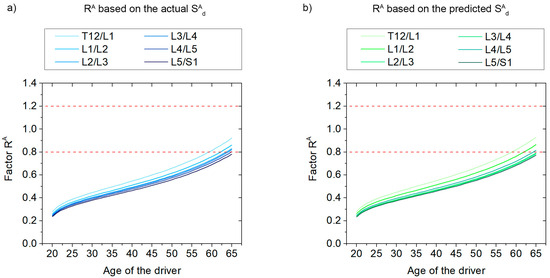
Figure 7.
Evolution of the RA factor based on (a) the actual values, and (b) the predicted values. Red dotted lines indicate low and high probability limits.
Figure 5 shows that the behaviour of the risk factor RA obtained from the actual and predicted values is similar. The RA obtained from the actual at the T12/L1 vertebral level is higher than 0.8 for an age of 59. The RA value obtained for the same vertebral level based on the predicted gives the same result at the same age. The ages at which a value of RA = 0.8 is exceeded are also the same based on both the actual and predicted for levels L1/L2 (62 years), L2/L3 (64 years), L3/L4 (64 years) and L4/L5 (65 years). The value RA for vertebral level L5/S1 does not exceed 0.8 before the age of 65 years.
These results provide evidence that a long-term assessment of the RA parameter based on the actual is equivalent to one based on the values predicted by the developed models. Thus, the ANN models proposed in this study prove to be a useful resource for predicting long-term health risks from vibration exposure. This assessment is essential to protect workers’ health during both their working life and subsequent retirement. Therefore, the proposed methodology can be used by safety managers to support the decision-making process during the design of activities to protect construction workers from excessive WBV exposure. It can be applied to any activity that exposes drivers to WBV during the building construction, maintenance and demolition.
5. Discussion
This research presents a method of developing individual ANN-based assessment models to predict the due to WBV exposure. A different approach is used here from the methods established in the European Directive 2022/44/CE, which are based on the external vibration acceleration load and consider only the short-term adverse health effects. Instead, the parameter is chosen in this study as the output of six ANN models. Since is based on the internal lumbar forces, it provides better predictions of LBP than methods based on measures of external acceleration. Furthermore, it can be used to assess the health effects of long-term cumulative WBV exposure from the calculation of the risk factor RA.
The values predicted using the proposed ANN models provide a daily dose estimate that can be used to support decision-making processes as part of health and safety management. The obtained values for R2, MAE and MSE indicate that our models provide accurate values. From a performance assessment of the models, it is possible to conclude that ANN algorithms can be used to predict the WBV exposure assessment based on the internal lumbar forces.
The potential use of this type of ML algorithm has been noted in previous research; for instance, Singh et al. [47] proposed ML models to predict the overall value of vibrations transmitted to drivers during tractor driving and found that ANN models provided a more accurate prediction of ride comfort than other ML algorithms, such as linear regression and decision tree regressor. An R2 value of 0.90 was obtained from the ANN model developed by Singh et al. In this line, Rahimdel et al. [45] assessed the WBV transmitted to truck operators in mining and developed an ANN model to predict the rms of the vertical acceleration based on the four input parameters (speed level, play load, haul road quality, and load geometry). The Pearson correlation value found between the actual and predicted rms values was 0.96.
However, it should be noted that both the model developed by Sigh et al. [47] and the model developed by Rahimdel et al. [45] predict rms acceleration at the seat surface, which is a worse predictor of low back pain than internal lumbar forces. Further studies are needed to accurately predict LBP as a consequence of WBV exposure. Few studies proposed vibration exposure assessment models based on ML algorithms. More studies are needed to further explore this area.
In addition, it should be remarked that the inputs to the proposed ANN models in this study are typical parameters of the acceleration signals (rms, vdv and CF), which are widely known and are currently used by European companies to assess the WBV exposure of their workers. Hence, the measurement of these parameters should not pose a challenge for companies, as Directive 2002/44/CE established in 2002 that these parameters should be used to assess WBV exposure. Although the proposed ANN models rely only these commonly used input parameters, the output parameter () allows for an assessment not only of short-term exposure but also long-term exposure. This means that the limitations of the methods defined in the Directive 2002/44/CE, which can only be used to assess short-term WBV exposure, can be overcome.
We note that although the generation of these ANN models for each driver involves an initial effort, it allows for the assessment of short- and long-term WBV exposure. The proposed approach can therefore be used to create a new tool that can help to minimise the adverse effects of WBV exposure on the health of workers, thus improving their quality of life during their working years and subsequent retirement. This aspect is especially important, given that the problem of workforce aging has attracted attention over the last decade due to increases in life expectancy and delays in retirement [12]. This gives rise to an increased likelihood of developing MSDs caused by the cumulative effects of WBV exposure.
The results obtained from the developed models can also be used to generate a database containing a worker’s lifetime exposure history. This database can provide key information for assessing long-term WBV exposure based on reliable data. The implementation of the proposed ANN models can facilitate the assessment of exposure over the entire working life of a driver, which is essential to protect workers’ health in both the short and long term. A safety manager can use this information during the design of activities to support decision-making processes and risk assessments.
The proposed approach for generating individualised WBV assessment models provides a potential tool for use with Internet of Things (IoT) technologies. Previous studies have noted that the current development and growth in the area of IoT offers new avenues for healthcare and smart health monitoring [62,63,64]. The integration of the IoT with the proposed models could play a vital role in real-time monitoring and safety enhancement during driving activities. This approach will change the conventional mode of health and safety management to a new smart system. Future studies are needed to explore the creation of a complete system of smart health, including device design, data collection and model integration for real-time monitoring.
This study proposes a methodology that can be applied to any driving activity that exposes drivers to WBV under less severe conditions. These activities include the driving of a wide variety of vehicles, such as earthmoving machinery, tractors, off-road vehicles, trucks, etc. Although a tractor has been selected to illustrate the application of the methodology proposed in this study, it can be applied to any other activity carried out with other vehicles. Since the magnitude of transmitted vibrations depends on a wide variety of parameters (e.g., type of driving surface, travel speed, type of vehicle, etc.), a case-by-case basis should be applied to implement the proposed methodology. In fact, the proposed methodology offers safety managers a valuable tool for informed decision-making. It assists during the planning and design stages of construction activities, aiming to protect workers from excessive WBV exposure. This approach can be seamlessly integrated into various tasks, spanning construction, maintenance, and demolition processes. Thus, although a tractor driver has been selected in this study, the proposed methodology is applicable to other types of vehicles. More studies are needed to study the applicability of more machine learning algorithms for risk prediction related to vibration exposure.
Furthermore, the implementation of the proposed models will encourage the use of best practices and models to reduce WBV exposure and to increase safety knowledge in the construction industry. Their implementation will also support the achievement of objectives related to two of the three priorities of the EU Strategic Framework on Health and Safety at Work 2021–2027 [65]: anticipating and managing change in the context of demographic transitions (such as the increased aging of the workforce) and improving the prevention of work-related accidents and diseases.
Finally, in terms of limitations, it should be noted that the generation of the ANN models requires some initial effort, and small and medium-sized companies in the construction sector may be less motivated to implement the proposed model due to this fact. Nevertheless, despite this initial effort, the models generated using the proposed methodology can be used to assess the short- and long-term WBV received by the driver over his/her entire working life. Therefore, the implementation of the proposed methodology can contribute to reducing the occurrence of MSDs, which not only have a high cost for the worker’s health, but also affect businesses and society in general.
6. Conclusions
Work-related MSDs are of concern worldwide, and the construction industry is among the sectors in which MSDs are most frequently reported by workers. WBV exposure is epidemiologically related to the occurrence of MSDs. In this context, the objective of this study was to propose a methodology to generate individualised models based on ANN algorithms to assess short- and long-term WBV exposure. The results obtained from six ANN models led to the following findings.
Our ANN models for six vertebral lumbar levels provided accurate results. The R2 value obtained for each ANN model was above 0.90 for all datasets (training, cross-validation, and testing), with differences of less than 0.01 between datasets at all vertebral levels (except for L3/L4 and L4/L5, where a difference of 0.02 was found).
The difference between the actual and predicted values obtained from each ANN model was analysed. All models gave similar MSE values (0.001) and MAE values of below 0.025. These results indicate that our ANN models provide accurate predictions. The error distribution profiles for the six models showed that around 80% of the predicted values deviated by less than 0.03 from the actual value for all vertebral levels. Deviations of greater than 0.09 were found to represent less than 1% of the total.
The proposed models were applied to an illustrative case study. The predicted values were found to vary from the actual values by less than 0.03 MPa for the six ANN models. A long-term WBV assessment based on the RA factor provided equivalent results based on both the actual and predicted values of .
The obtained results showed that the implementation of the proposed model can extend the capabilities of the safety manager during the WBV assessment process. The proposed model can be used to identify driving activities that may be harmful to workers’ health in the short or long term. In fact, this is one of the main advantages of the proposed model compared to the methods laid out in the EU Directive EU 2002/44/EC (i.e., A(8) and VDV), which can only be used to assess vibration exposure on a daily basis. Therefore, and in view of the results obtained in this study, the necessity of amending the provisions of the Directive 2002/44/EC is evident. The need to assess the cumulative exposure as an obligation of employers should be included in Art. 4 Determination and assessment and Art. 5 Provisions aimed at avoiding or reducing exposure.
The proposed ANN models can allow companies to implement short- and long-term WBV exposure assessment models to ensure that the health of workers is not compromised, either during a driver’s working life or during retirement. The approach used in this study can be applied to any activity that exposes workers to WBV during any phase of the building life cycle (including construction, maintenance or demolition). The purpose of the proposed methodology is aligned with the European Strategy 2020–2022 and contributes to minimising the exposure to harmful WBV for the health of workers in the construction sector, a need highlighted by EU-OSHA. This methodology constitutes a new practical tool that can be used by safety managers for assessing and managing WBV exposure, thus preventing construction workers from suffering from MSDs and promoting their musculoskeletal health throughout their working lives. Thus, it can be used to address the long-term effects of demographic aging and protect the health of construction workers.
Finally, future research should explore the implementation of the proposed ANN models in conjunction with IoT devices and real-time monitoring to assess WBV during driving activities. New wearable devices and monitoring sensors could be used to collect data and predict potentially hazardous WBV exposure in real time. The driver behaviour and the values could be evaluated based on historical data. Incorporating an assessment model based on ML algorithms into the control system of HEV vehicles could provide a smart tool for monitoring WBV exposure in real time and, if necessary, issue warning signals to reduce risk.
Supplementary Materials
Anonymous sample data can be downloaded at: https://doi.org/10.12795/11441/158149.
Author Contributions
M.L.d.l.H.-T. and A.J.A.: conceptualisation, formal analysis, methodology, investigation, performed the experiments, data curation, and the writing of the manuscript; N.C. and P.A.: conceptualisation, resources and supervised the manuscript; D.P.R. and M.D.M.-A.: conceptualisation, resources, project administration, funding acquisition and supervised the manuscript. All authors have read and agreed to the published version of the manuscript.
Funding
This publication is part of the I + D + i project PID2019-108761RB-I00, funded by MCIN/AEI/10.13039/501100011033. María Luisa de la Hoz-Torres wishes to acknowledge the support of the Ministerio de Ciencia, Innovación y Universidades of Spain under a Margarita Salas post-doctoral contract (MS2022-32) funded by the European Union-NextGenerationEU. Antonio J. Aguilar wishes to acknowledge the support of the University of Granada under a post-doctoral research contract.
Data Availability Statement
The original contributions presented in the study are included in the article and Supplementary Materials, further inquiries can be directed to the corresponding author.
Conflicts of Interest
The authors declare no conflicts of interest.
Appendix A
Table A1.
Driver’s characteristics.
Table A1.
Driver’s characteristics.
| Characteristic | Value |
|---|---|
| Age | 59 years |
| Height | 1.73 m |
| Weight | 73 kg |
| BMI | 24.4 kg/m2 |
| Mean daily exposure duration (WBV) | 7 h |
| Mean annual exposure duration (WBV) | 150 days per year |
| Age at first year of WBV exposure | 20 years |
| Cumulative exposure duration to WBV | 39 years |
| Posture group (based ono ISO 2631-5:2018) | 3 |
Table A2.
Characteristics of the tractor.
Table A2.
Characteristics of the tractor.
| Characteristics | Tractor Dimensions | ||
|---|---|---|---|
| Power | 78 kW | Weight | 3800 kg |
| Cylinder | 4 | Wheelbase | 2.26 m |
| Front tyre (width/diameter) | 7.50/18 | Length | 4.19 m |
| Rear tyre | 13.6R38 | Width | 2.05 m |
| Height (cab) | 2.26 | ||
Table A3.
Sets and parameters used in this study.
Table A3.
Sets and parameters used in this study.
| Structure | Input layer | rmsx |
| rmsy | ||
| rmsz | ||
| vdvx | ||
| vdvy | ||
| vdvz | ||
| CFx | ||
| CFy | ||
| CFz | ||
| mean velocity | ||
| type of surface | ||
| measurement period | ||
| exposure time | ||
| Output layer | ||
| Activation function hidden layer | Rectified linear unit (ReLU) | |
| Backpropagation algorithm | Lbfgs (quasi-Newton method) | |
| Dataset segmentation | Training | 80% |
| Test | 20% | |
| Model validation | k-fold cross validation | |
| Performance metrics | MSE, MAE, R2 | |
References
- EU-OSHA. Preventıon of Musculoskeletal Dısorders and Psychosocıal Rısks in the Workplace: EU Strategıes and Future Challenges. Available online: https://osha.europa.eu/en/publications/prevention-musculoskeletal-disorders-and-psychosocial-risks-workplace-eu-strategies-and-future-challenges (accessed on 23 October 2023).
- de la Hoz-Torres, M.L.; López-Alonso, M.; Ruiz, D.P.; Martínez-Aires, M.D. Analysis of Whole-Body Vibrations Transmitted by Earth Moving Machinery. In Occupational Safety and Hygiene V; CRC Press/Balkema: Leiden, The Netherlands, 2017; pp. 453–456. [Google Scholar]
- Carletti, E.; Pedrielli, F. Noise and Vibration Risk Assessment for the Operators of Crawler Loaders. Arch. Acoust. 2019, 44, 761–773. [Google Scholar] [CrossRef]
- Duarte, J.; Castelo Branco, J.; Matos, M.L.; Santos Baptista, J. Understanding the Whole-Body Vibration Produced by Mining Equipment as a Role-Player in Workers’ Well-Being—A Systematic Review. Extr. Ind. Soc. 2020, 7, 1607–1623. [Google Scholar] [CrossRef]
- Voicu, D.; Stoica, R.M.; Vilău, R.; Marinescu, M.; Digulescu, A.; Despina-Stoian, C.; Popescu, F. Frequency Analysis of Vibrations in Terms of Human Exposure While Driving Military Armoured Personnel Carriers and Logistic Transportation Vehicles. Electronics 2023, 12, 3152. [Google Scholar] [CrossRef]
- Carletti, E.; Pedrielli, F. Tri-Axial Evaluation of the Vibration Transmitted to the Operators of Crawler Compact Loaders. Int. J. Ind. Ergon. 2018, 68, 46–56. [Google Scholar] [CrossRef]
- EU-OSHA. Work-Related Musculoskeletal Disorders: Prevalence, Costs and Demographics in the EU. Available online: https://osha.europa.eu/en/publications/msds-facts-and-figures-overview-prevalence-costs-and-demographics-msds-europe (accessed on 23 October 2023).
- Burström, L.; Nilsson, T.; Wahlström, J. Whole-Body Vibration and the Risk of Low Back Pain and Sciatica: A Systematic Review and Meta-Analysis. Int. Arch. Occup. Environ. Health 2015, 88, 403–418. [Google Scholar] [CrossRef] [PubMed]
- Singh, K.J.; Palei, S.K.; Karmakar, N.C. Role of Contributing Factors on Health Risks of Whole-Body Vibration Exposure of Heavy Equipment and Vehicle Operators: A Critical Review. J. Vib. Control 2023, 30, 2338–2355. [Google Scholar] [CrossRef]
- Pavlovic-Veselinovic, S.; Hedge, A.; Veselinovic, M. An Ergonomic Expert System for Risk Assessment of Work-Related Musculo-Skeletal Disorders. Int. J. Ind. Ergon. 2016, 53, 130–139. [Google Scholar] [CrossRef]
- EU-OSHA. Third European Survey of Enterprises on New and Emerging Risks (ESENER 2019): Overview Report; EU-OSHA: Bilbao, Spain, 2023. [Google Scholar]
- World Health Organization. Musculoskeletal Health. Available online: https://www.who.int/news-room/fact-sheets/detail/musculoskeletal-conditions (accessed on 9 November 2023).
- EU-OSHA. OSH in Figures: Work-Related Musculoskeletal Disorders in the EU-Facts and Figures. Available online: https://osha.europa.eu/en/publications/osh-figures-work-related-musculoskeletal-disorders-eu-facts-and-figures (accessed on 23 October 2023).
- Directive 2006/42/EC on Machinery, and Amending Directive 95/16/EC of the European Parliament and of the Council of 5 February 2013. 2006. Available online: https://eur-lex.europa.eu/LexUriServ/LexUriServ.do?uri=OJ:L:2006:157:0024:0086:en:PDF (accessed on 2 June 2024).
- Directive 2002/44/CE Of the European Parliament and of the Council of 25 June 2002 on the Minimum Health and Safety Requirements Regarding the Exposure of Workers to the Risks Arising from Physical Agents (Vibration) (Sixteenth Individual Directive within the Meaning of Article 16(1) of Directive 89/391/EEC). 2022. Available online: https://eur-lex.europa.eu/resource.html?uri=cellar:546a09c0-3ad1-4c07-bcd5-9c3dae6b1668.0004.02/DOC_1&format=PDF (accessed on 2 June 2024).
- ISO 2631-1:1997, Mechanical Vibration and Shock Evaluation of Human Exposure to Whole-Body Vibration Part 1: General Requirements. 1997. Available online: https://www.iso.org/standard/7612.html (accessed on 2 June 2024).
- Schust, M.; Menzel, G.; Hofmann, J.; Forta, N.G.; Pinto, I.; Hinz, B.; Bovenzi, M. Measures of Internal Lumbar Load in Professional Drivers–the Use of a Whole-Body Finite-Element Model for the Evaluation of Adverse Health Effects of Multi-Axis Vibration. Ergonomics 2015, 58, 1191–1206. [Google Scholar] [CrossRef]
- De la Hoz-Torres, M.L.; Aguilar, A.J.; Ruiz, D.P.; Martínez-Aires, M.D. Whole Body Vibration Exposure Transmitted to Drivers of Heavy Equipment Vehicles: A Comparative Case According to the Short-and Long-Term Exposure Assessment Methodologies Defined in ISO 2631-1 and ISO 2631-5. Int. J. Environ. Res. Public Health 2022, 19, 5206. [Google Scholar] [CrossRef]
- Bovenzi, M.; Schust, M. A Prospective Cohort Study of Low-Back Outcomes and Alternative Measures of Cumulative External and Internal Vibration Load on the Lumbar Spine of Professional Drivers. Scand. J. Work. Environ. Health 2021, 47, 277. [Google Scholar] [CrossRef]
- De la Hoz-Torres, M.L.; Aguilar, A.J.; Martínez-Aires, M.D.; Ruiz, D.P. A Methodology for Assessment of Long-Term Exposure to Whole-Body Vibrations in Vehicle Drivers to Propose Preventive Safety Measures. J. Saf. Res. 2021, 78, 47–58. [Google Scholar] [CrossRef] [PubMed]
- ISO 2631-5:2018. Mechanical Vibration and Shock Evaluation of Human Exposure to Whole-Body Vibration Part 5: Method for Evaluation of Vibration Containing Multiple Shocks. 2018. Available online: https://www.iso.org/standard/50905.html (accessed on 2 June 2024).
- Hinz, B.; Seidel, H.; Hofmann, J.; Menzel, G. The Significance of Using Anthropometric Parameters and Postures of European Drivers as a Database for Finite-Element Models When Calculating Spinal Forces during Whole-Body Vibration Exposure. Int. J. Ind. Ergon. 2008, 38, 816–843. [Google Scholar] [CrossRef]
- Taboada, G.L.; Seruca, I.; Sousa, C.; Pereira, Á. Exploratory Data Analysis and Data Envelopment Analysis of Construction and Demolition Waste Management in the European Economic Area. Sustainability 2020, 12, 4995. [Google Scholar] [CrossRef]
- Doğan, T.; Erdem, B.; Duran, Z. Phase-Based Evaluation of Whole-Body Vibration Exposure for Hydraulic Excavator Operators. Int. J. Heavy Veh. Syst. 2023, 30, 655–676. [Google Scholar] [CrossRef]
- Tekin, A. Assessment of Vibration Exposure of Mine Machinery Operators at Three Different Open-Pit Coal Mines. J. South Afr. Inst. Min. Met. 2022, 122, 235–243. [Google Scholar] [CrossRef]
- Cinquemani, S.; Cutini, M.; Abbati, G.; Meloro, G.; Sabbioni, E. Experimental Assessment of the Effect of Different Tires on Comfort of Construction Truck Operators. Conf. Proc. Soc. Exp. Mech. Ser. 2019, 5, 249–257. [Google Scholar] [CrossRef]
- Ramar, K.; Kumaraswamidhas, L.A. Excavator Driver Seat Occupational Comfort Assessment with Lumbar Support Cushion. J. Vib. Control 2022, 28, 3510–3523. [Google Scholar] [CrossRef]
- Mohammad Javad Golhosseini, S.; Aliabadi, M.; Golmohammadi, R.; Farhadian, M.; Akbari, M.; Hamidi Nahrani, M.; Samavati, M. The Influence of Combined Exposure to Noise and Whole-Body Vibration on Hearing Loss under Simulated Heavy Equipment Driving Conditions. Appl. Acoust. 2021, 179, 108058. [Google Scholar] [CrossRef]
- European Agency for Safety and Health at Work (EU-OSHA) Demolitions and Dismantling. Available online: https://oshwiki.osha.europa.eu/en/themes/demolitions-and-dismantling (accessed on 4 April 2024).
- European Agency for Safety and Health at Work (EU-OSHA); Senior Labour Inspectors Committee (SLIC) Working Group Strategy; Anyfantis, I. Labour Inspectors’ Insights into Perceived High-Risk Occupations and Sectors in Europe: An EU-OSHA-SLIC Survey; Publications Office of the European Union: Luxembourg, 2023. [Google Scholar] [CrossRef]
- Seidel, H.; Pöpplau, B.M.; Morlock, M.M.; Püschel, K.; Huber, G. The Size of Lumbar Vertebral Endplate Areas—Prediction by Anthropometric Characteristics and Significance for Fatigue Failure Due to Whole-Body Vibration. Int. J. Ind. Erg. 2008, 38, 844–855. [Google Scholar] [CrossRef]
- Madhushanka, J.G.N.; De Silva, G.H.M.J.S.; De Silve, G.S.Y. Investigation on Whole Body Vibration Exposures of Operators of Construction Vehicles. In Proceedings of the 6th International Conference on Structural Engineering and Construction Management, Kandy, Sri Lanka, 11–13 December 2015; pp. 117–122. [Google Scholar]
- Dewangan, K.N.; Shahmir, A.; Rakheja, S.; Marcotte, P. Seated Body Apparent Mass Response to Vertical whole Body Vibration: Gender and Anthropometric Effects. Int. J. Ind. Ergon. 2013, 43, 375–391. [Google Scholar] [CrossRef]
- Park, J.H.; Kia, K.; Srinivasan, D.; Kim, J.H. Postural Balance Effects from Exposure to Multi-Axial Whole-Body Vibration in Mining Vehicle Operation. Appl. Ergon. 2021, 91, 103307. [Google Scholar] [CrossRef] [PubMed]
- Zhang, C.; Guo, L.X. Analysis of Lumbar Spine Injury with Different Back Inclinations under Whole-Body Vibration: A Finite Element Study Based on Whole Human Body Models. Int. J. Ind. Ergon. 2023, 95, 103447. [Google Scholar] [CrossRef]
- Seidel, H. On the Relationship between Whole-Body Vibration Exposure and Spinal Health Risk. Ind. Health 2005, 43, 361–377. [Google Scholar] [CrossRef]
- Ramar, K.; Kumaraswamidhas, L.A.; Balaji, P.S.; Agasthian, A. Whole Body Vibration Impact Assessment on Dumper Operator Using Computational Learning Technique. Int. J. Precis. Eng. Manuf. 2023, 24, 219–238. [Google Scholar] [CrossRef]
- De la Hoz-Torres, M.L.; Aguilar-Aguilera, A.J.; Martínez-Aires, M.D.; Ruiz, D.P. Assessment of Whole-Body Vibration Exposure Using ISO2631-1:2008 and ISO2631-5:2018 Standards. In INTER-NOISE and NOISE-CON Congress and Conference Proceedings; Institute of Noise Control Engineering: Grand Rapids, MI, USA, 2019. [Google Scholar]
- Zhan, C.; Zhang, X.; Yuan, J.; Chen, X.; Zhang, X.; Fathollahi-Fard, A.M.; Wang, C.; Wu, J.; Tian, G. A Hybrid Approach for Low-Carbon Transportation System Analysis: Integrating CRITIC-DEMATEL and Deep Learning Features. Int. J. Environ. Sci. Technol. 2024, 21, 791–804. [Google Scholar] [CrossRef]
- Mousapour Mamoudan, M.; Ostadi, A.; Pourkhodabakhsh, N.; Fathollahi-Fard, A.M.; Soleimani, F. Hybrid Neural Network-Based Metaheuristics for Prediction of Financial Markets: A Case Study on Global Gold Market. J. Comput. Des. Eng. 2023, 10, 1110–1125. [Google Scholar] [CrossRef]
- Gholizadeh, H.; Fathollahi-Fard, A.M.; Fazlollahtabar, H.; Charles, V. Fuzzy Data-Driven Scenario-Based Robust Data Envelopment Analysis for Prediction and Optimisation of an Electrical Discharge Machine’s Parameters. Expert. Syst. Appl. 2022, 193, 116419. [Google Scholar] [CrossRef]
- Chan, V.C.H.; Ross, G.B.; Clouthier, A.L.; Fischer, S.L.; Graham, R.B. The Role of Machine Learning in the Primary Prevention of Work-Related Musculoskeletal Disorders: A Scoping Review. Appl. Erg. 2022, 98, 103574. [Google Scholar] [CrossRef] [PubMed]
- de la Hoz-Torres, M.L.; Aguilar, A.J.; Ruiz, D.P.; Martínez-Aires, M.D. GIS-Based Framework to Manage Whole-Body Vibration Exposure. Autom. Constr. 2021, 131, 103885. [Google Scholar] [CrossRef]
- Upadhyay, R.; Senapati, A.; Chau, K.; Bhattacherjee, A.; Patra, A.K.; Chau, N. Development of an Intervention Program to Reduce Whole-Body Vibration Exposure Based on Occupational and Individual Determinants among Dumper Operators. Int. J. Occup. Saf. Ergon. 2023, 30, 41–55. [Google Scholar] [CrossRef]
- Rahimdel, M.J.; Mirzaei, M.; Sattarvand, J. Vibrational Health Risk Assessment for Truck Operators in Mining Using Artificial Neural Network. Proc. Inst. Mech. Eng. Part D J. Automob. Eng. 2021, 236, 2991–3004. [Google Scholar] [CrossRef]
- Atal, M.K.; Palei, S.K.; Chaudhary, D.K.; Kumar, V.; Karmakar, N.C. Occupational Exposure of Dumper Operators to Whole-Body Vibration in Opencast Coal Mines: An Approach for Risk Assessment Using a Bayesian Network. Int. J. Occup. Saf. Ergon. 2022, 28, 758–765. [Google Scholar] [CrossRef] [PubMed]
- Singh, A.; Nawayseh, N.; Singh, H.; Dhabi, Y.K.; Samuel, S. Internet of Agriculture: Analyzing and Predicting Tractor Ride Comfort through Supervised Machine Learning. Eng. Appl. Artif. Intell. 2023, 125, 106720. [Google Scholar] [CrossRef]
- Regulation No. 167/2013 of the European Parliament and of the Council. Available online: https://eur-lex.europa.eu/legal-content/EN/TXT/?uri=celex%3A32013R0167 (accessed on 5 January 2024).
- Langer, T.H.; Ebbesen, M.K.; Kordestani, A. Experimental Analysis of Occupational Whole-Body Vibration Exposure of Agricultural Tractor with Large Square Baler. Int. J. Ind. Ergon. 2015, 47, 79–83. [Google Scholar] [CrossRef]
- Deboli, R.; Calvo, A.; Preti, C. Whole-Body Vibration: Measurement of Horizontal and Vertical Transmissibility of an Agricultural Tractor Seat. Int. J. Ind. Ergon. 2017, 58, 69–78. [Google Scholar] [CrossRef]
- You, G.; Wang, B.; Li, J.; Chen, A.; Sun, J. The Prediction of MOE of Bamboo-Wood Composites by ANN Models Based on the Non-Destructive Vibration Testing. J. Build. Eng. 2022, 59, 105078. [Google Scholar] [CrossRef]
- de la Hoz-Torres, M.L.; Aguilar, A.J.; Costa, N.; Arezes, P.; Ruiz, D.P.; Martínez-Aires, M.D. Predictive Model of Clothing Insulation in Naturally Ventilated Educational Buildings. Buildings 2023, 13, 1002. [Google Scholar] [CrossRef]
- Zhou, Z.; Wei, L.; Yuan, J.; Cui, J.; Zhang, Z.; Zhuo, W.; Lin, D. Construction Safety Management in the Data-Rich Era: A Hybrid Review Based upon Three Perspectives of Nature of Dataset, Machine Learning Approach, and Research Topic. Adv. Eng. Inform. 2023, 58, 102144. [Google Scholar] [CrossRef]
- Koc, K.; Ekmekcioğlu, Ö.; Gurgun, A.P. Accident Prediction in Construction Using Hybrid Wavelet-Machine Learning. Autom. Constr. 2022, 133, 103987. [Google Scholar] [CrossRef]
- Sadeghi, H.; Mohandes, S.R.; Hosseini, M.R.; Banihashemi, S.; Mahdiyar, A.; Abdullah, A. Developing an Ensemble Predictive Safety Risk Assessment Model: Case of Malaysian Construction Projects. Int. J. Environ. Res. Public Health 2020, 17, 8395. [Google Scholar] [CrossRef]
- Hsu, K.-l.; Gupta, H.V.; Sorooshian, S. Artificial Neural Network Modeling of the Rainfall-Runoff Process. Water Resour. Res. 1995, 31, 2517–2530. [Google Scholar] [CrossRef]
- Moon, J.W. Performance of ANN-Based Predictive and Adaptive Thermal-Control Methods for Disturbances in and around Residential Buildings. Build. Environ. 2012, 48, 15–26. [Google Scholar] [CrossRef]
- Hecht-Nielsen, R. Kolmogorov’s Mapping Neural Network Existence Theorem. In Proceedings of the International Conference on Neural Networks; IEEE Press: New York, NY, USA, 2018. [Google Scholar]
- Yang, J.; Rivard, H.; Zmeureanu, R. On-Line Building Energy Prediction Using Adaptive Artificial Neural Networks. Energy Build. 2005, 37, 1250–1259. [Google Scholar] [CrossRef]
- Chollet, F. Deep Learning with Python, 2nd ed.; Simon and Schuster: New York, NY, USA, 2021. [Google Scholar]
- Basheer, I.A.; Hajmeer, M. Artificial Neural Networks: Fundamentals, Computing, Design, and Application. J. Microbiol. Methods 2000, 43, 3–31. [Google Scholar] [CrossRef] [PubMed]
- Babar, M.; Rahman, A.; Arif, F.; Jeon, G. Energy-Harvesting Based on Internet of Things and Big Data Analytics for Smart Health Monitoring. Sustain. Comput. Inform. Syst. 2018, 20, 155–164. [Google Scholar] [CrossRef]
- Singh, A.; Nawayseh, N.; Samuel, S.; Dhabi, Y.K.; Singh, H. Real-Time Vibration Monitoring and Analysis of Agricultural Tractor Drivers Using an IoT-Based System. J. Field Robot. 2023, 40, 1723–1738. [Google Scholar] [CrossRef]
- Singh, A.; Nawayseh, N.; Dhabi, Y.K.; Samuel, S.; Singh, H. Digital Agriculture: Analysis of Vibration Transmission from Seat to Back of Tractor Drivers under Multi-Directional Vibration Conditions. Int. J. Ind. Eng. Theory Appl. Pract. 2023, 30, 463–473. [Google Scholar] [CrossRef]
- Communication from the Commission to the European Parliament, the Council, the European Economic and Social Committee and the Committee of the Regions EU Strategic Framework on Health and Safety at Work 2021–2027 Occupational Safety and Health in a Changing World of Work. Available online: https://eur-lex.europa.eu/legal-content/EN/TXT/?uri=CELEX%3A52021DC0323&qid=1626089672913#PP1Contents (accessed on 9 November 2023).


Disclaimer/Publisher’s Note: The statements, opinions and data contained in all publications are solely those of the individual author(s) and contributor(s) and not of MDPI and/or the editor(s). MDPI and/or the editor(s) disclaim responsibility for any injury to people or property resulting from any ideas, methods, instructions or products referred to in the content. |
© 2024 by the authors. Licensee MDPI, Basel, Switzerland. This article is an open access article distributed under the terms and conditions of the Creative Commons Attribution (CC BY) license (https://creativecommons.org/licenses/by/4.0/).