
Mechanical Performance Analysis and Parametric Study of the Transition Section of a Hybrid Cable-Stayed Suspension Bridge
Abstract
:1. Introduction
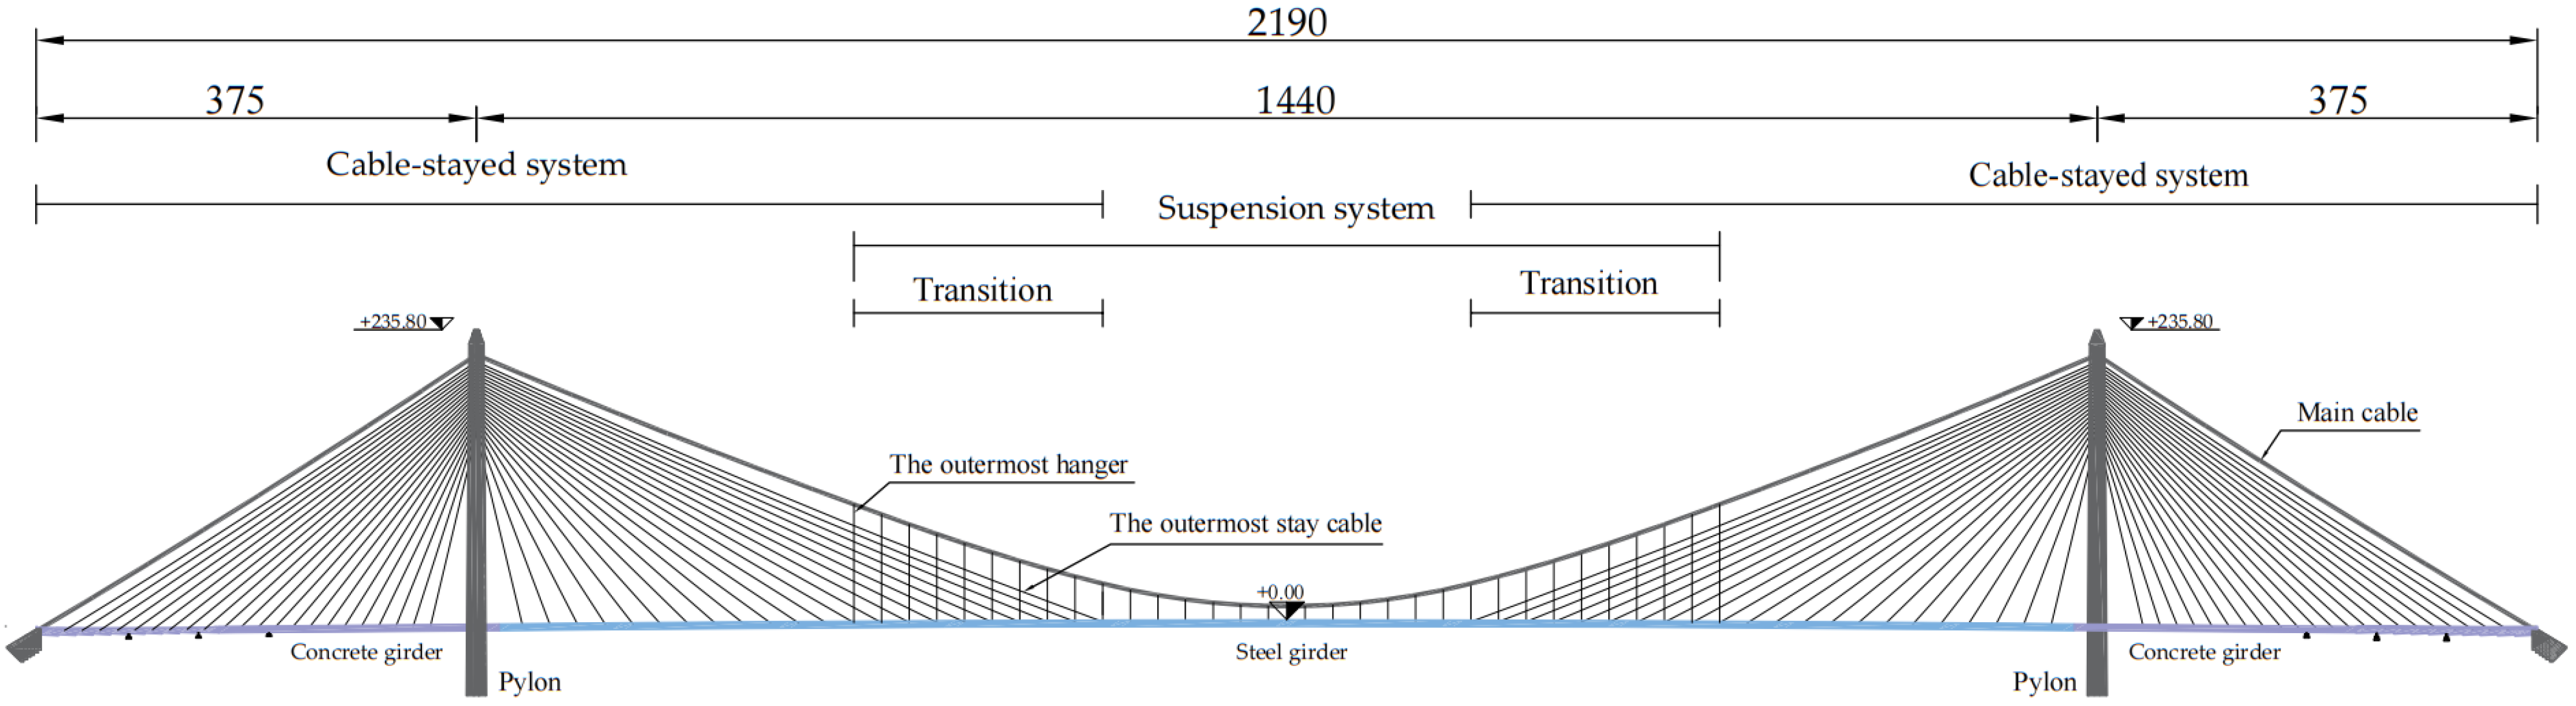
2. Example Bridge
Basic Information
3. Finite Element Modeling
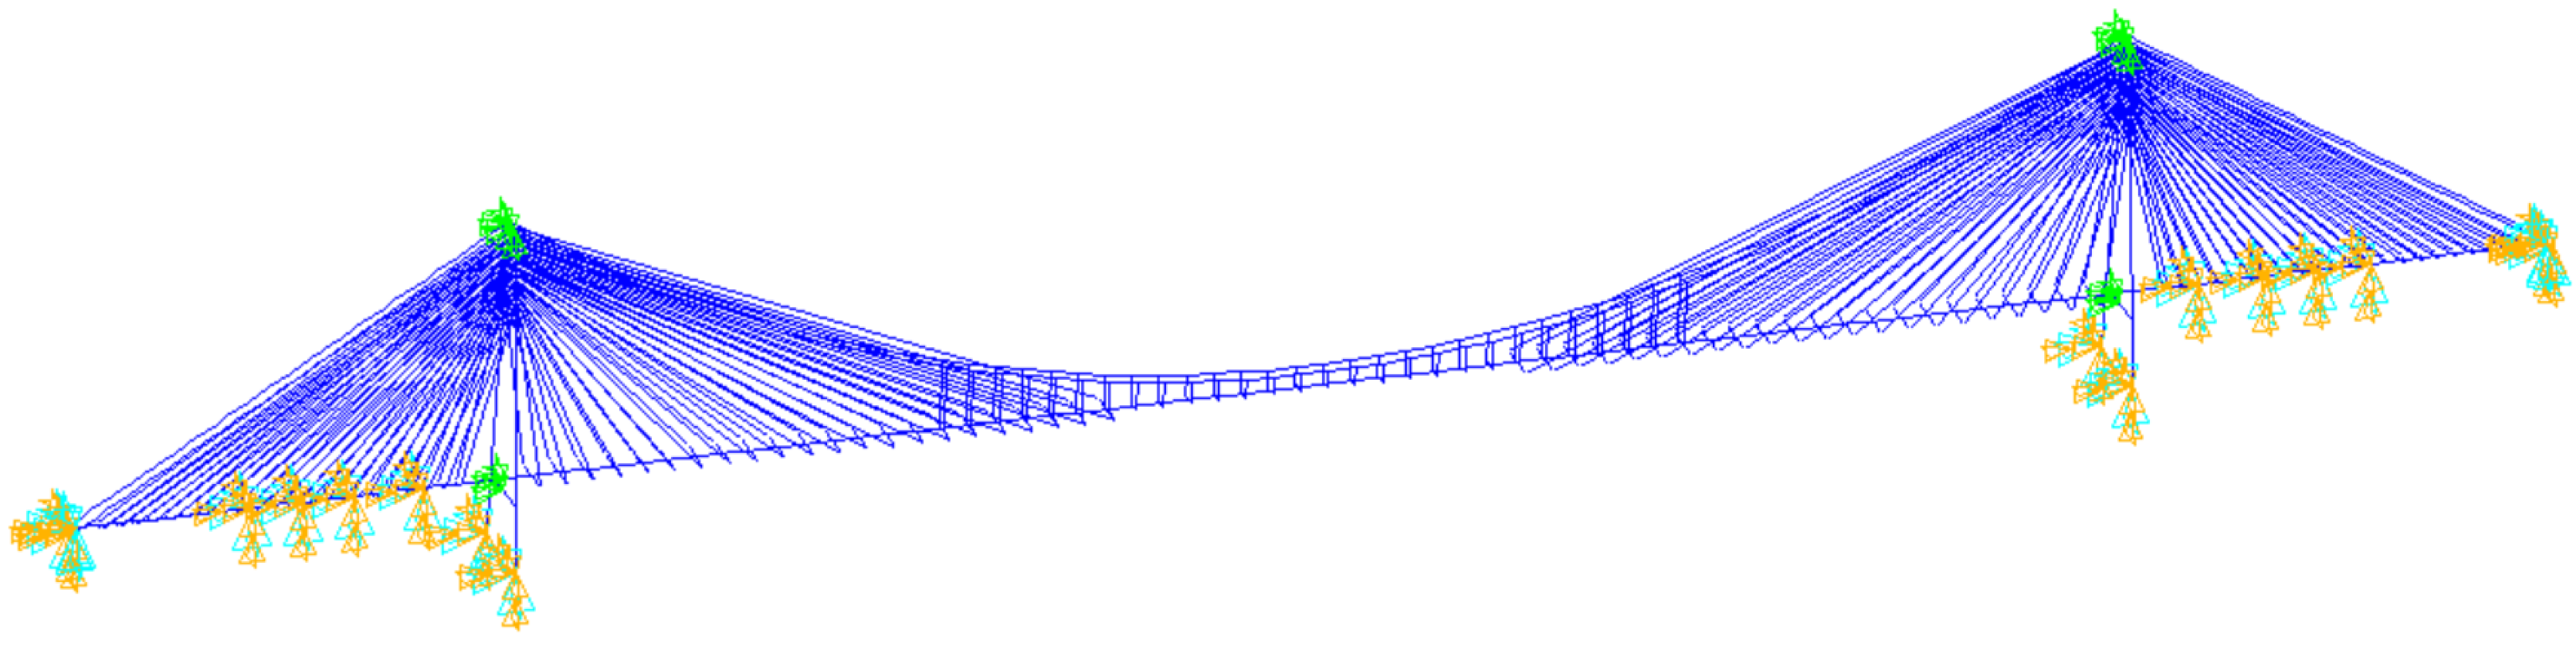
3.1. Global Model
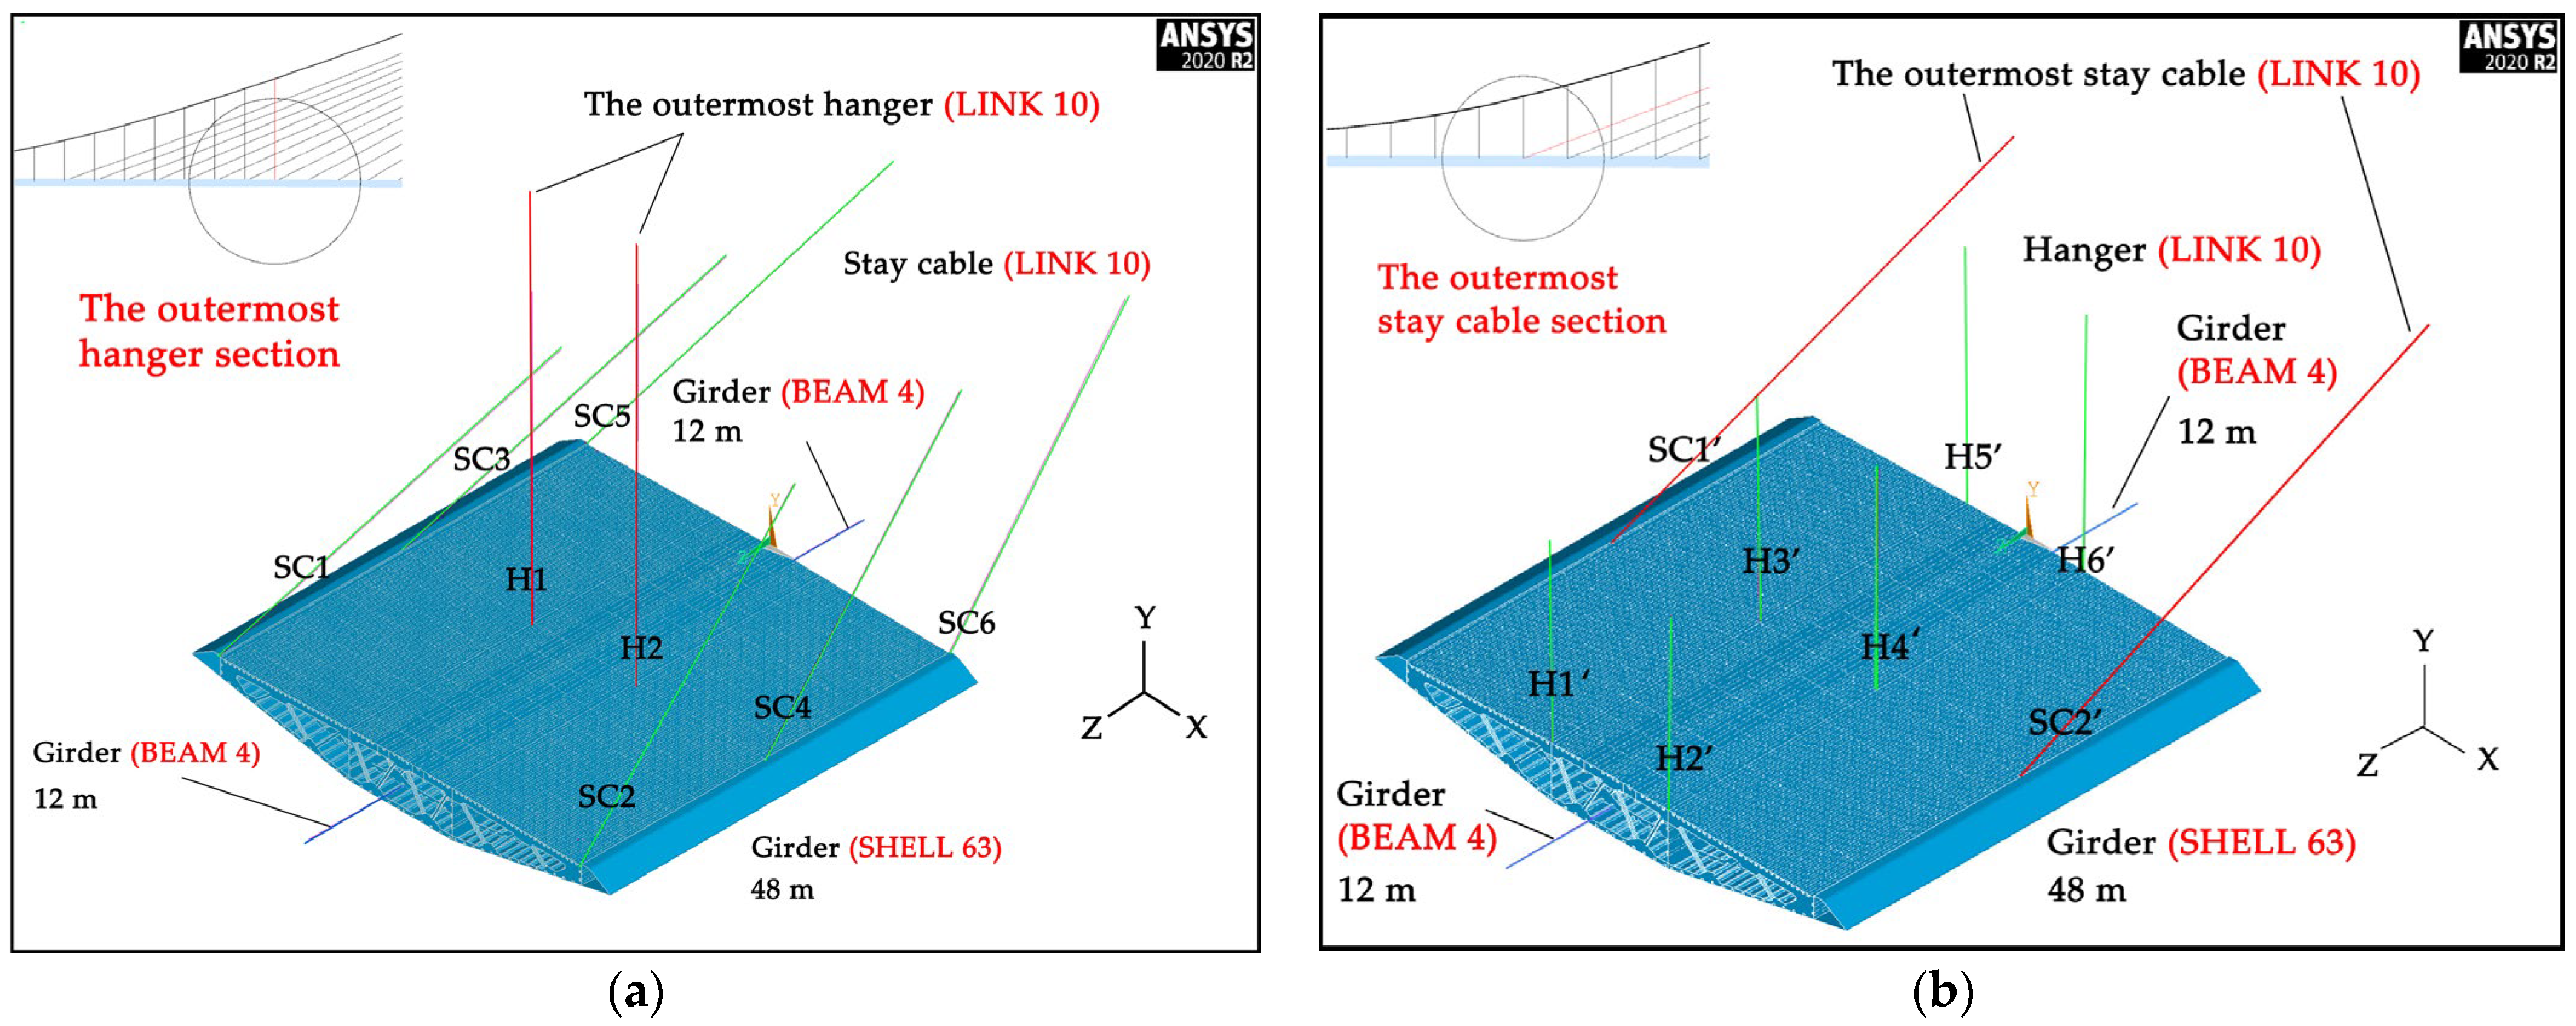
3.2. Local FEM of the Transition Area
3.3. Model Validation
4. Mechanical Properties of the Transition Section
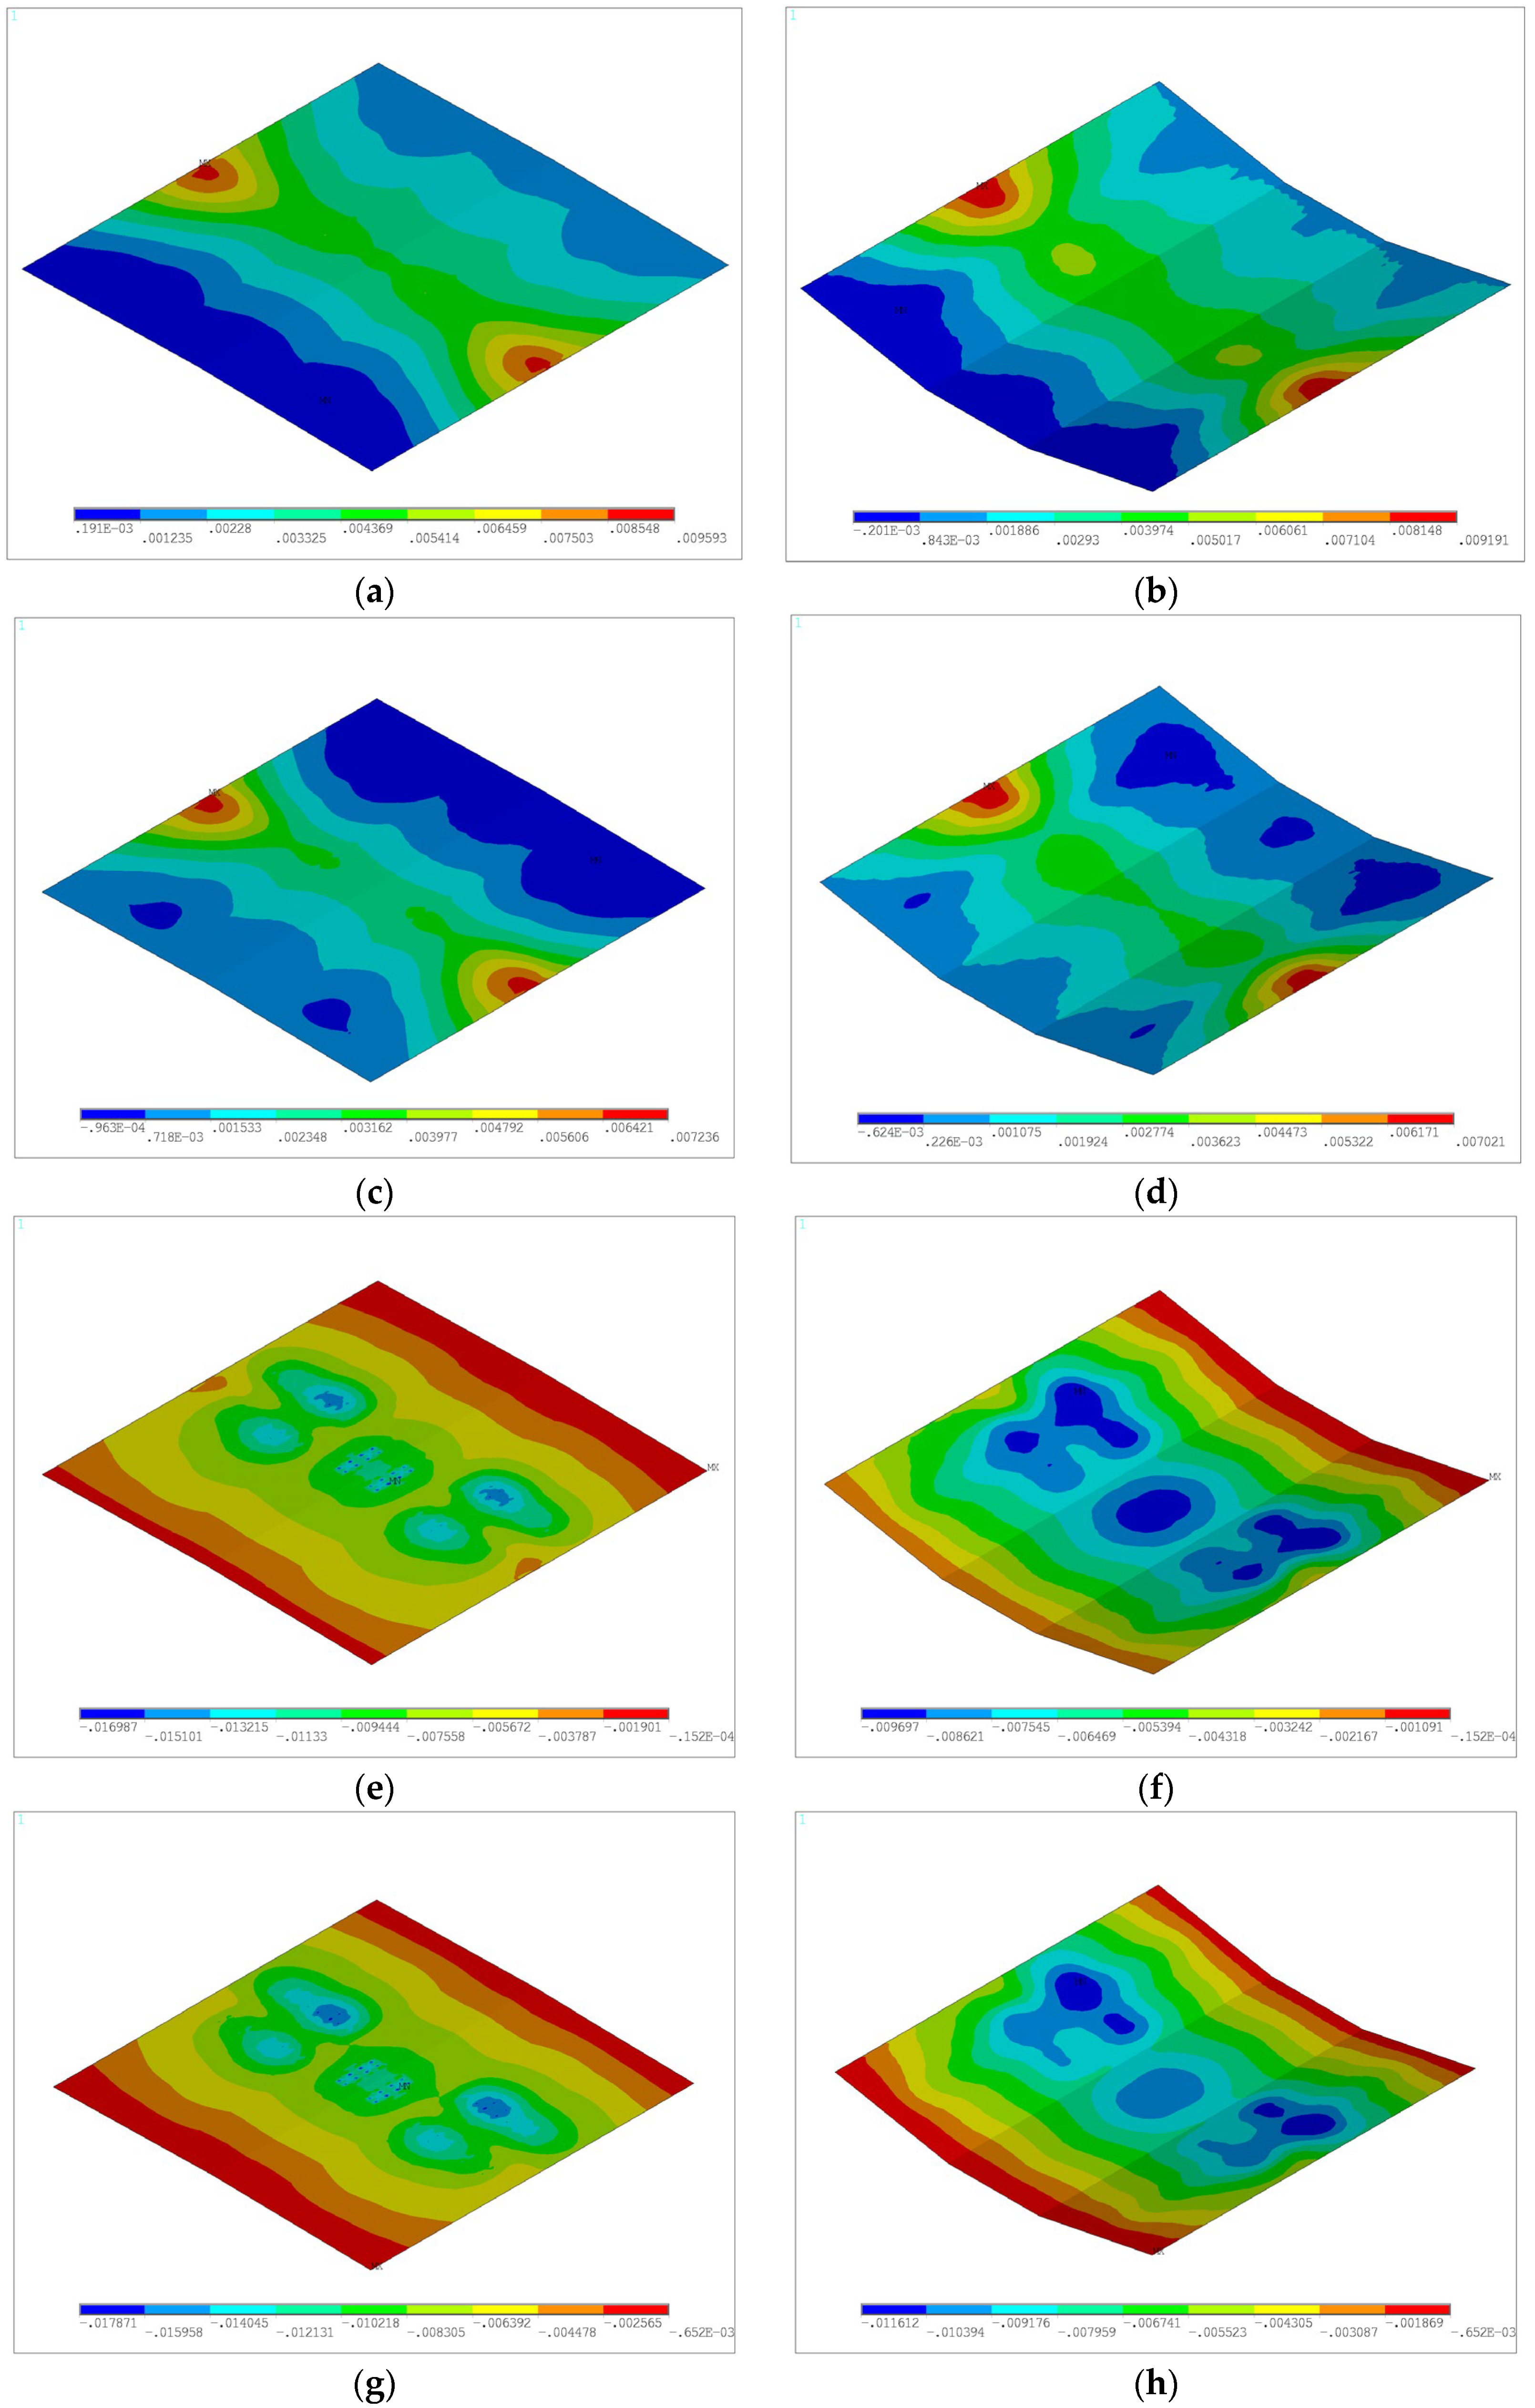
4.1. Local Stress Distribution of the Transition Section Girder
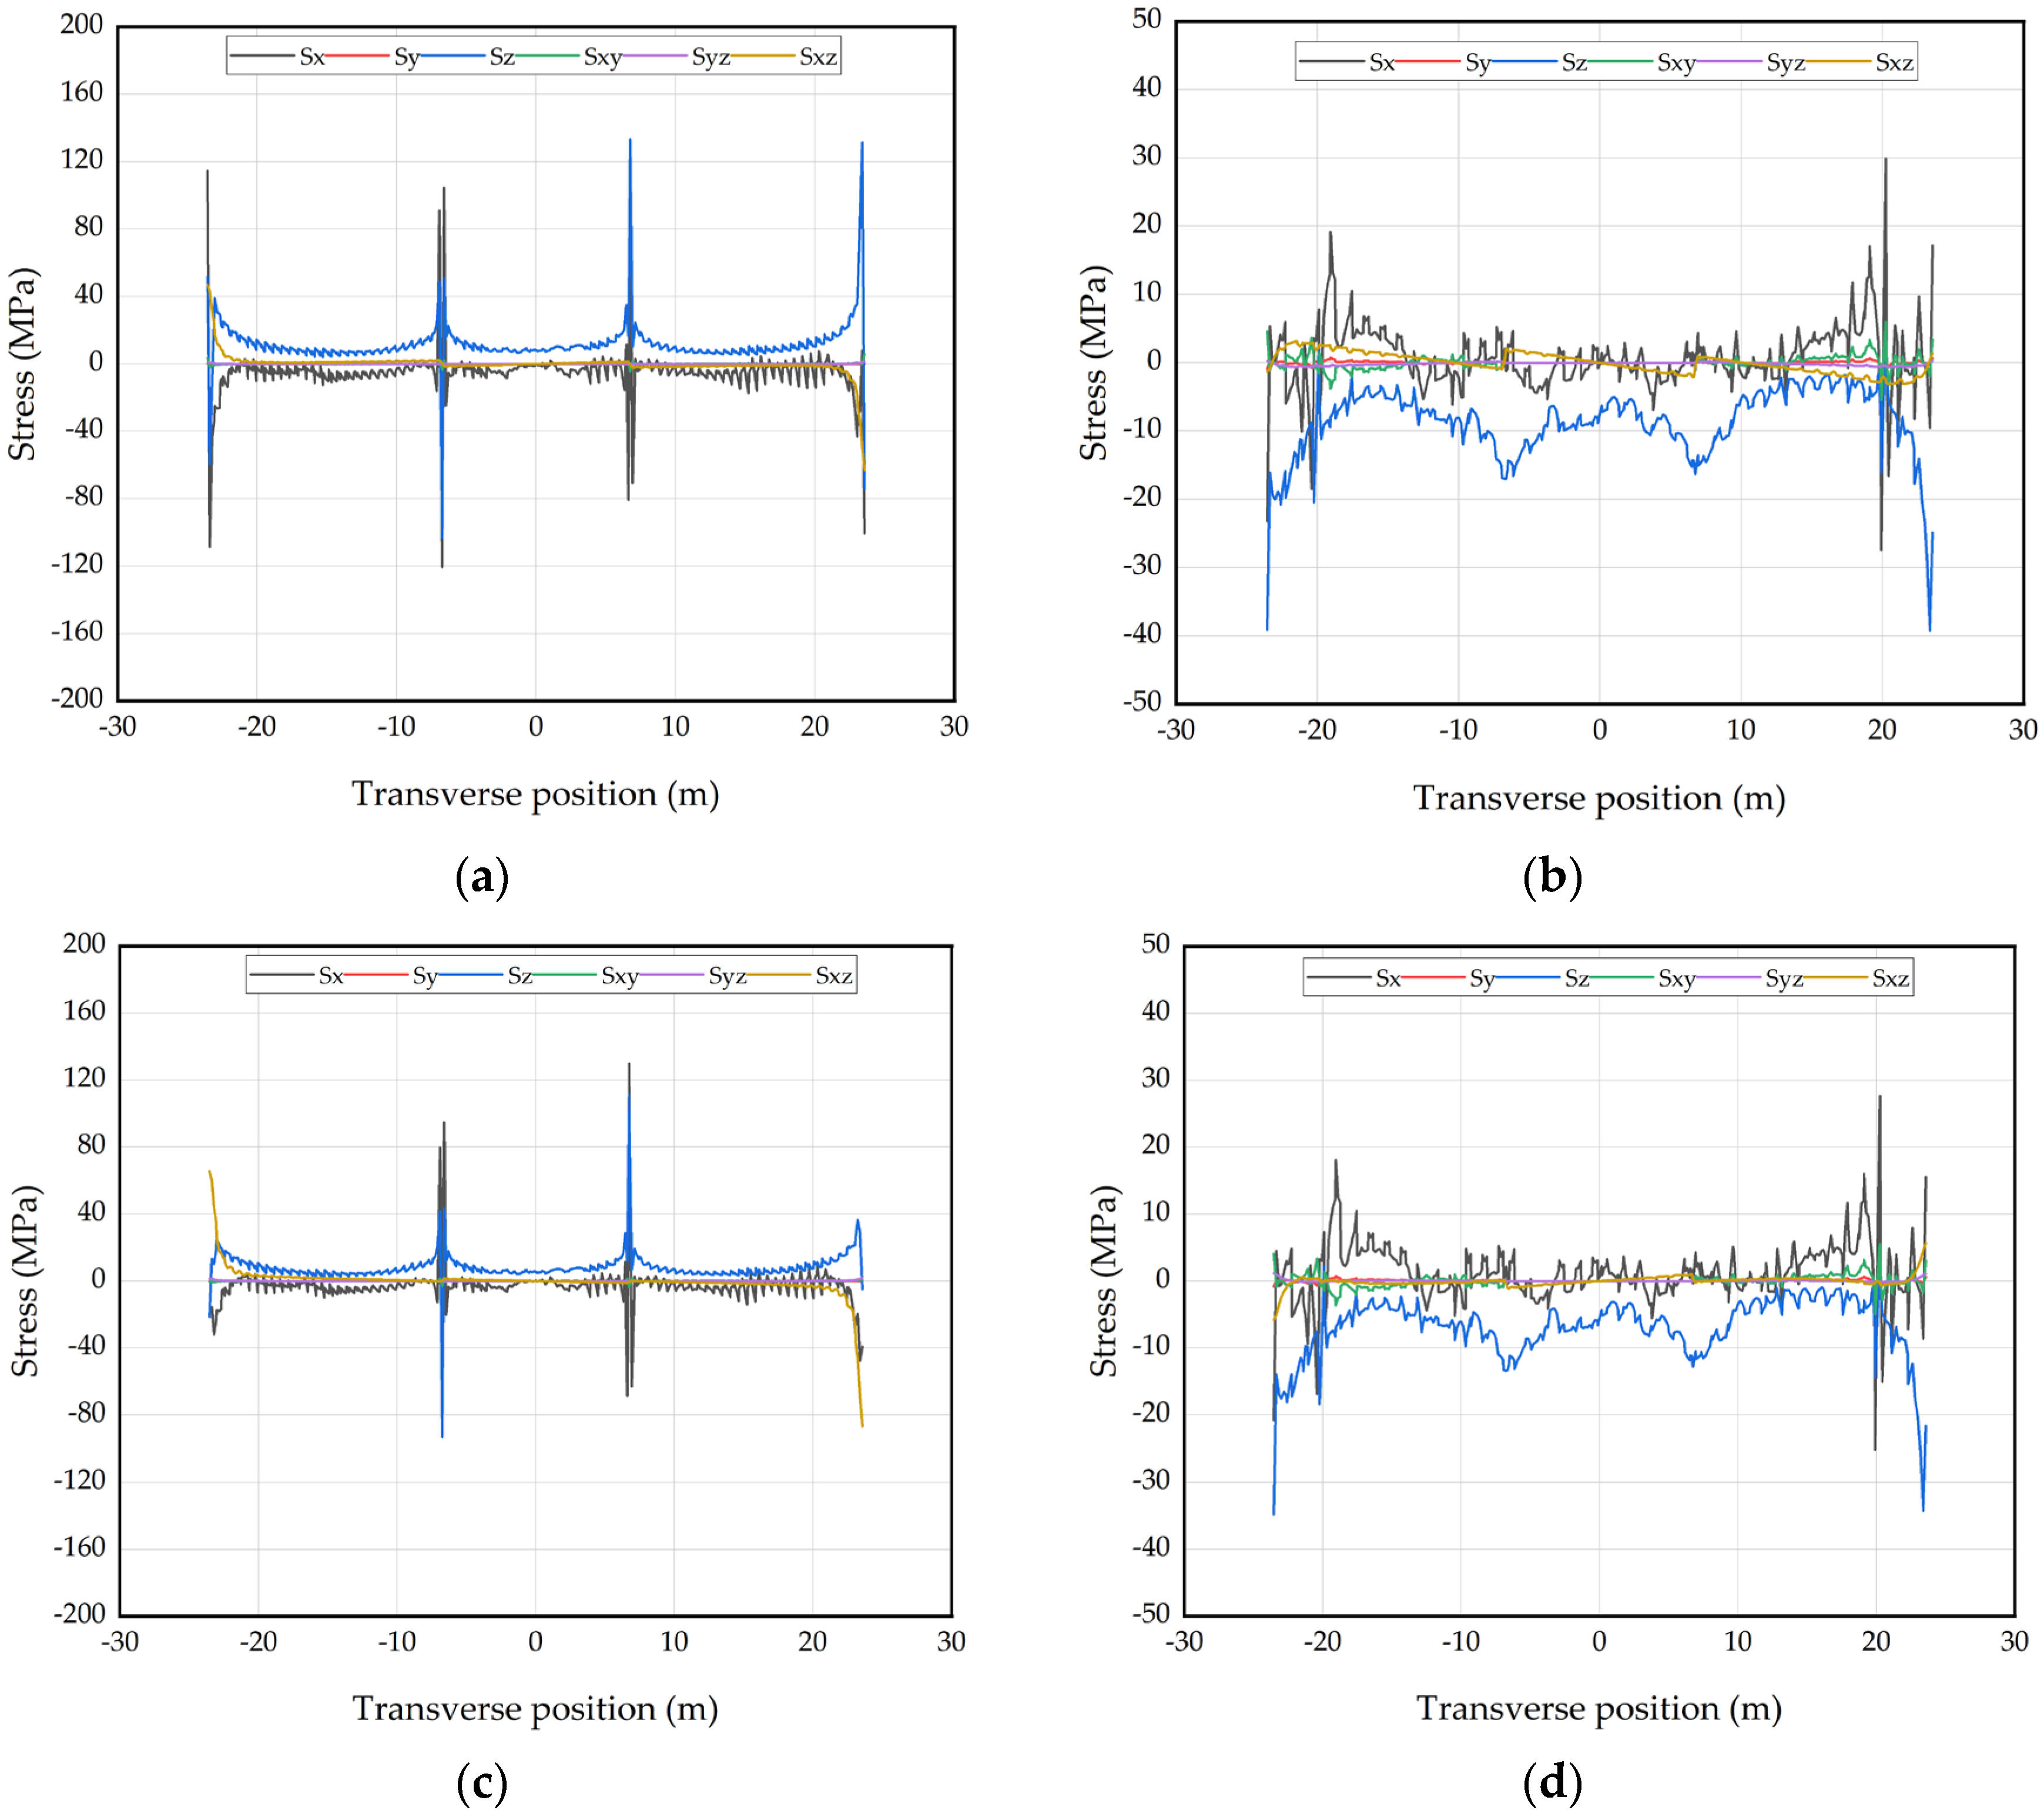
4.1.1. Stress under Dead Load
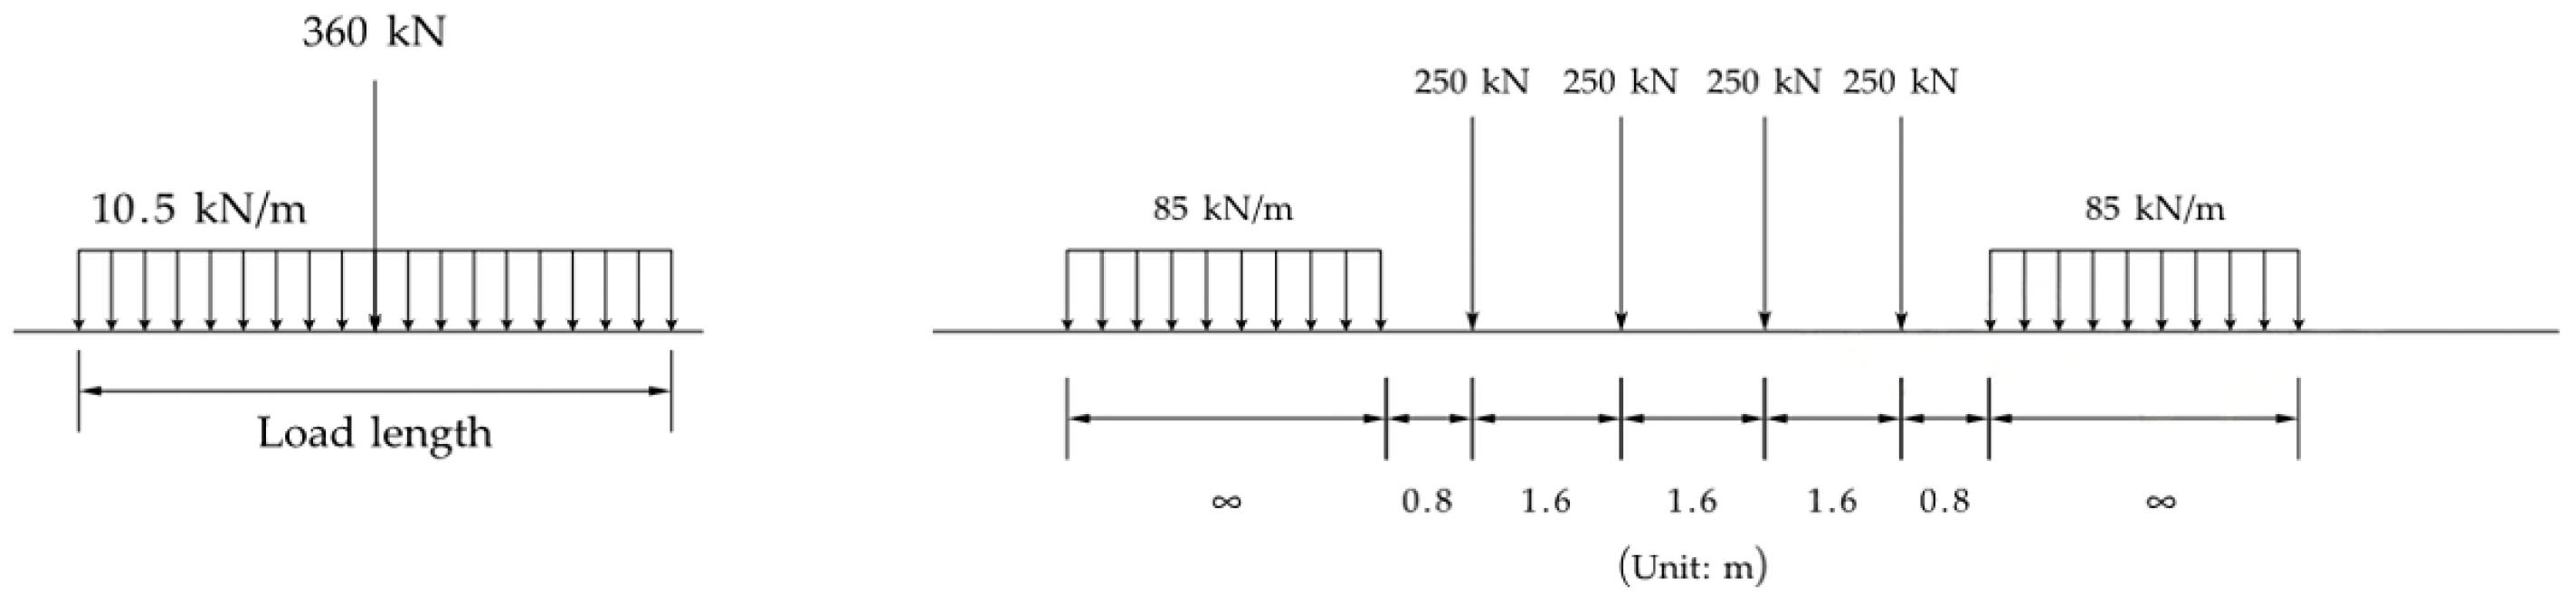
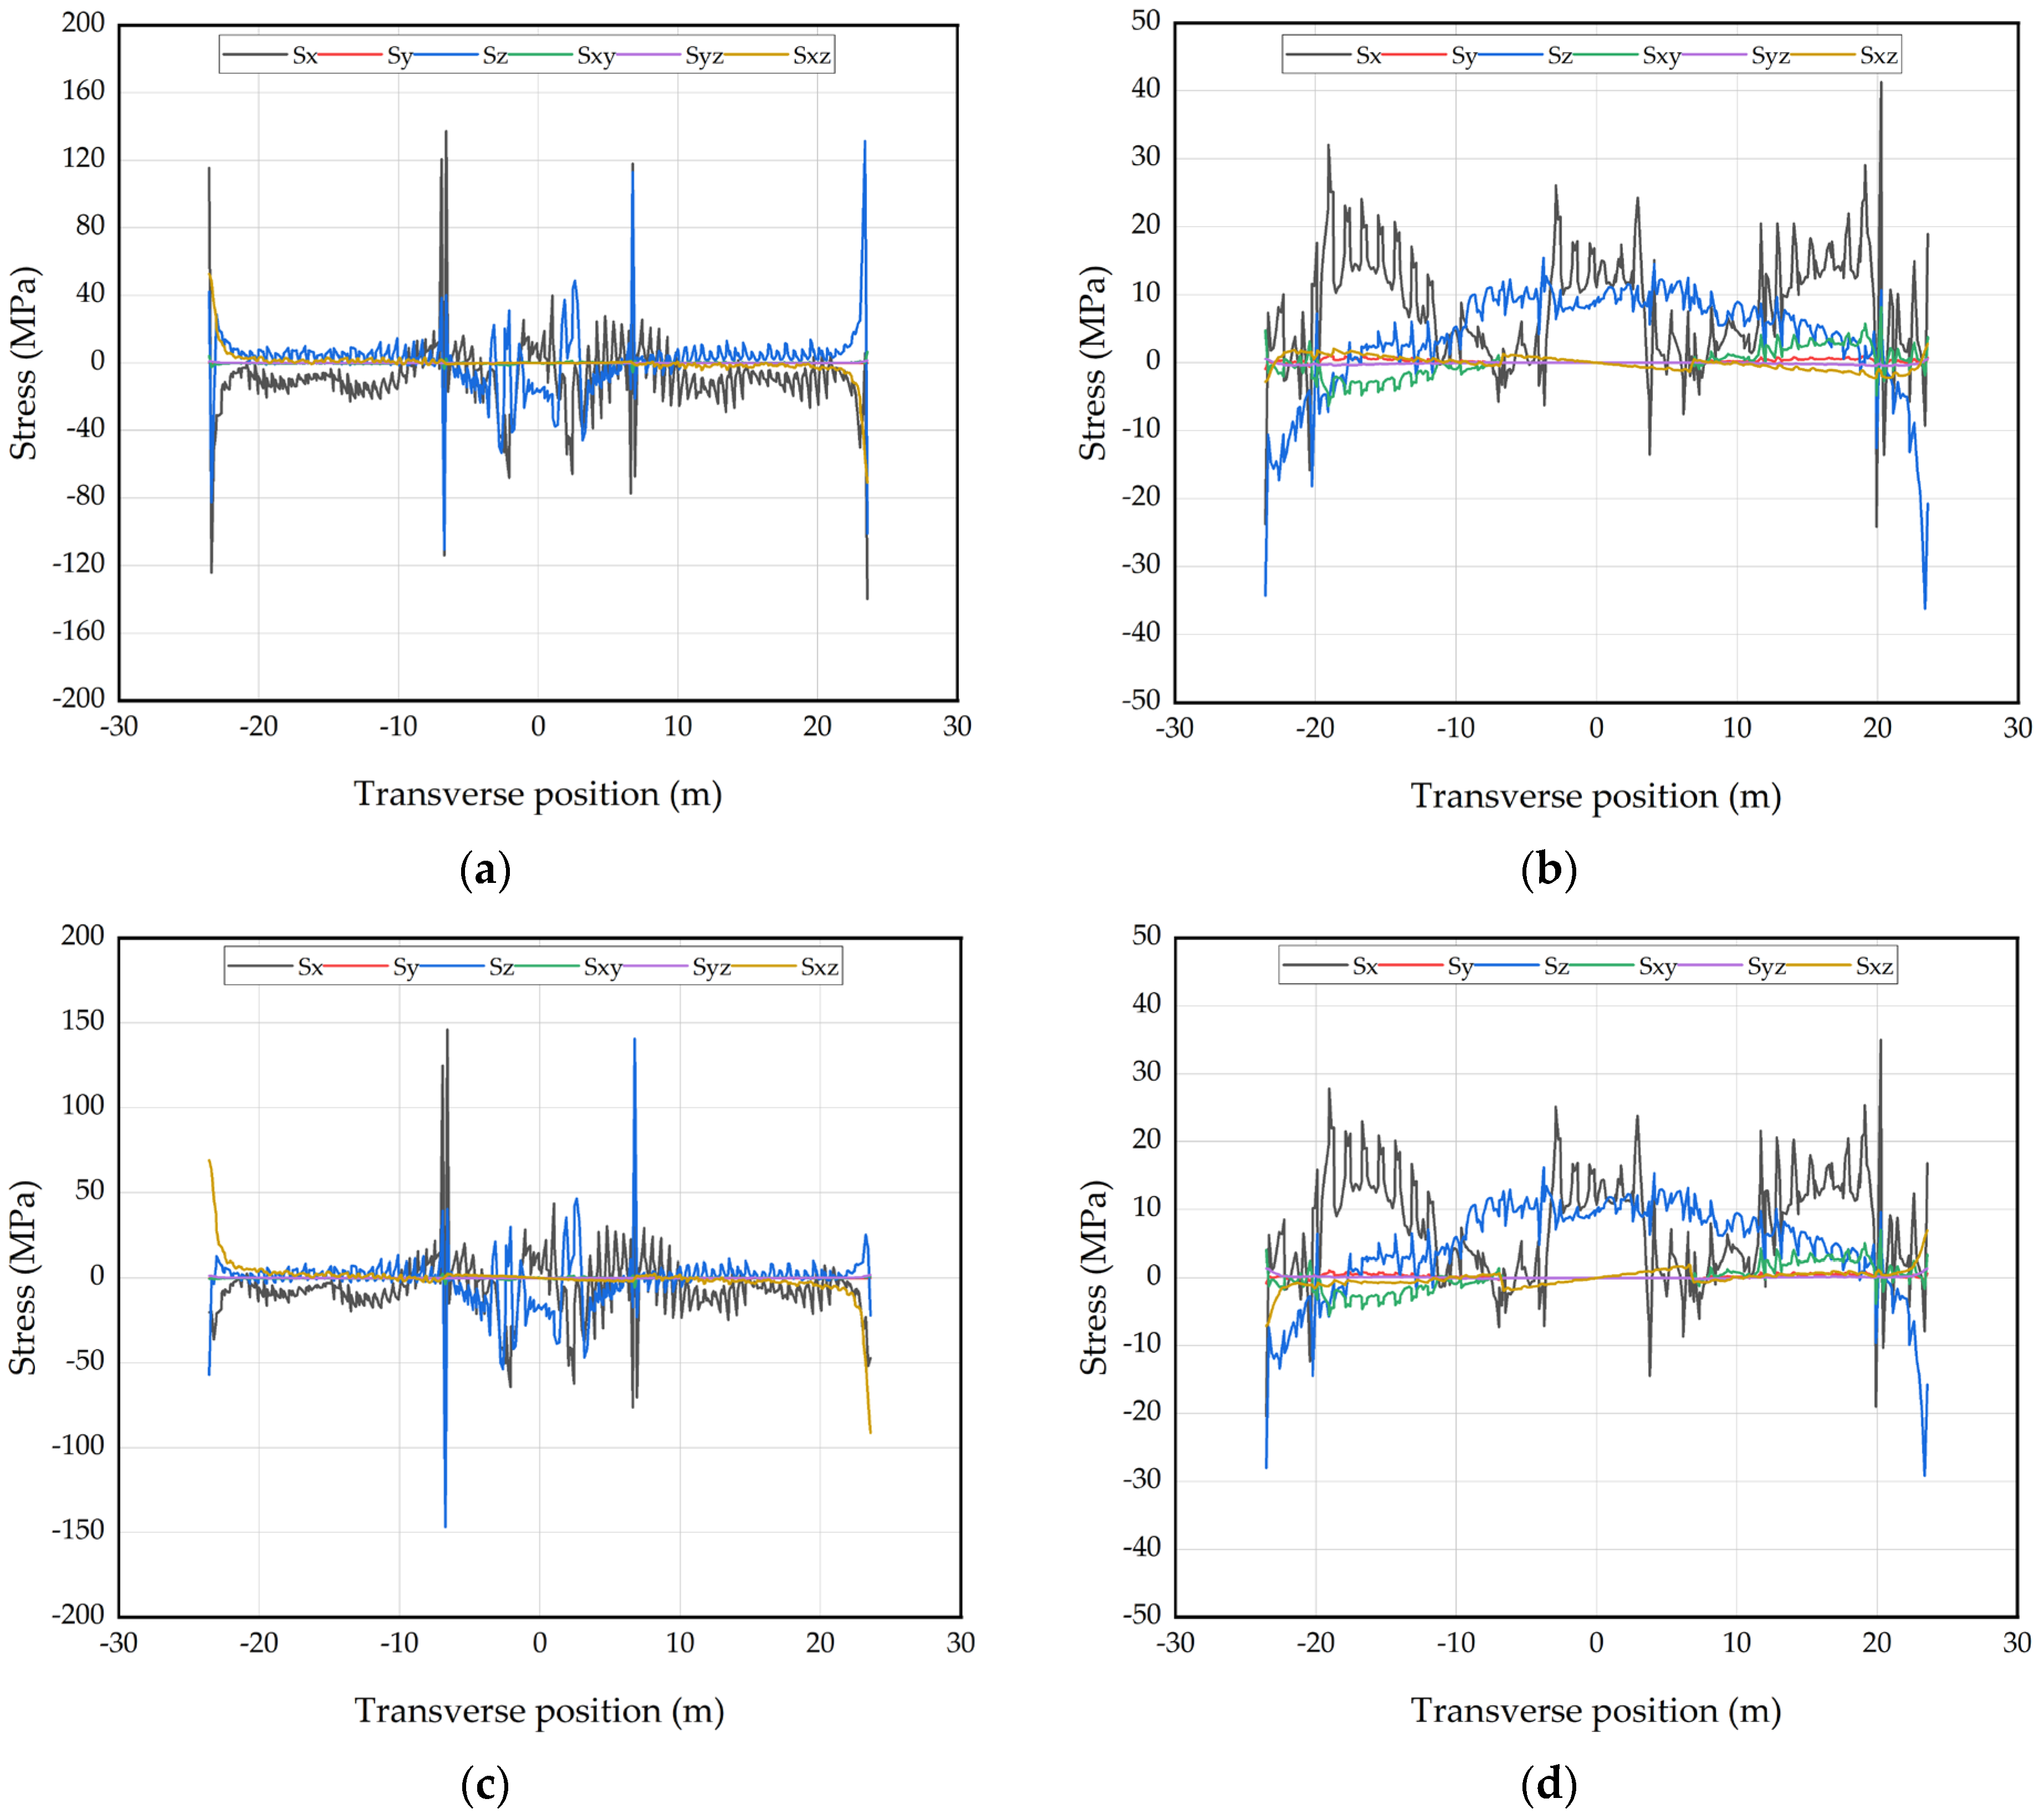
4.1.2. Stress under Dead and Live Loads
4.2. Vertical Displacement
5. Parametric Study
5.1. Influence of Structural Parameters on Mechanical Performance of the Transition Section Girder
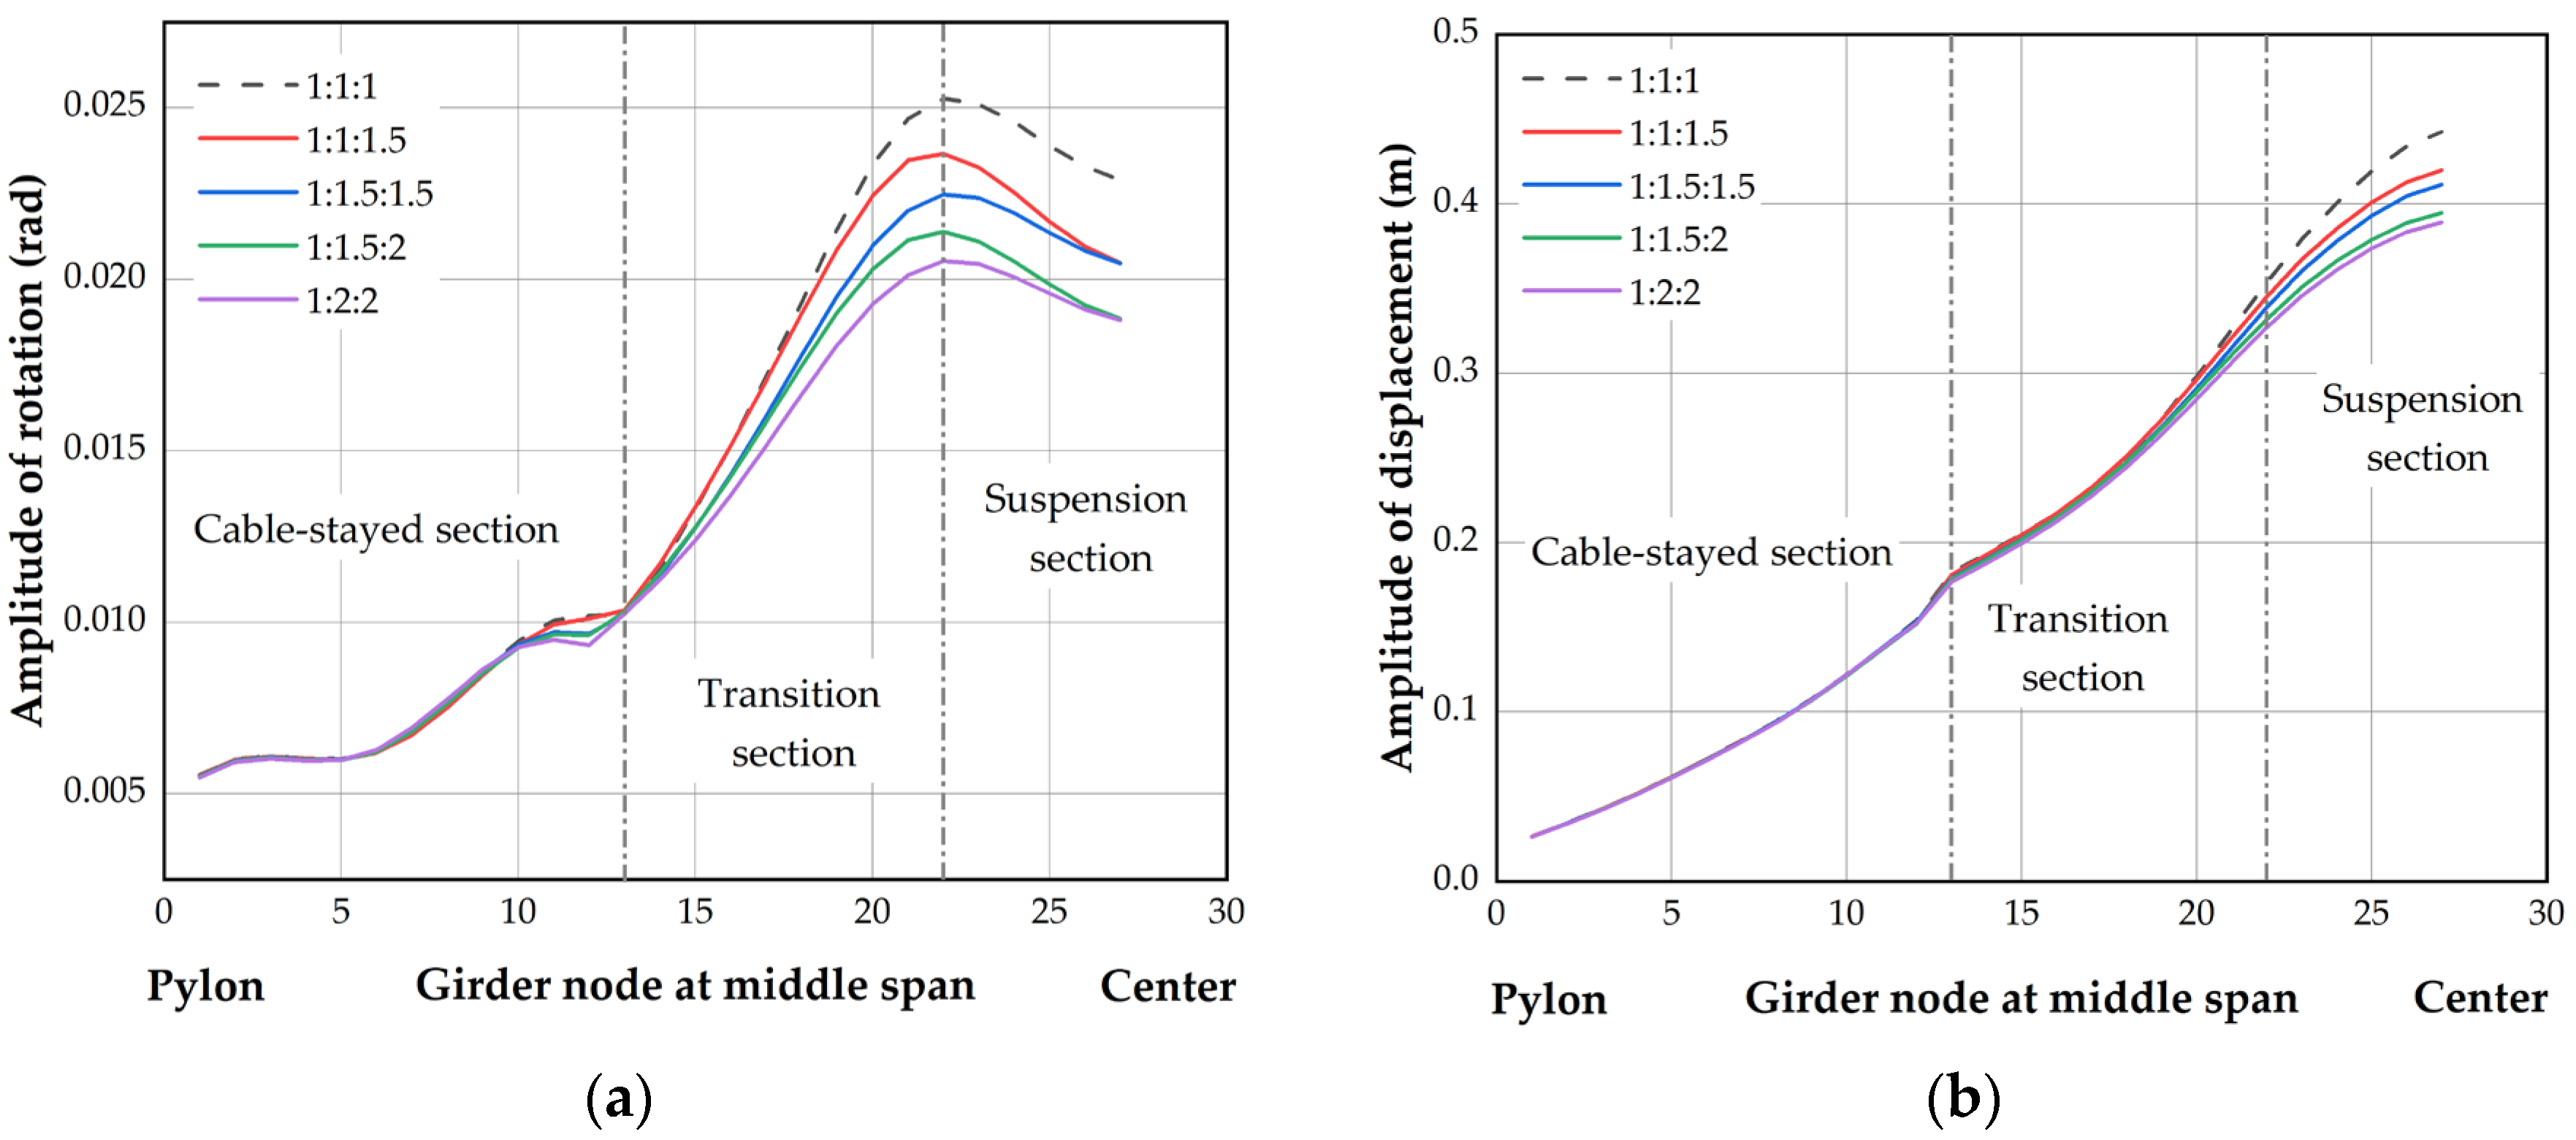
5.1.1. Effect of the Girder Stiffness
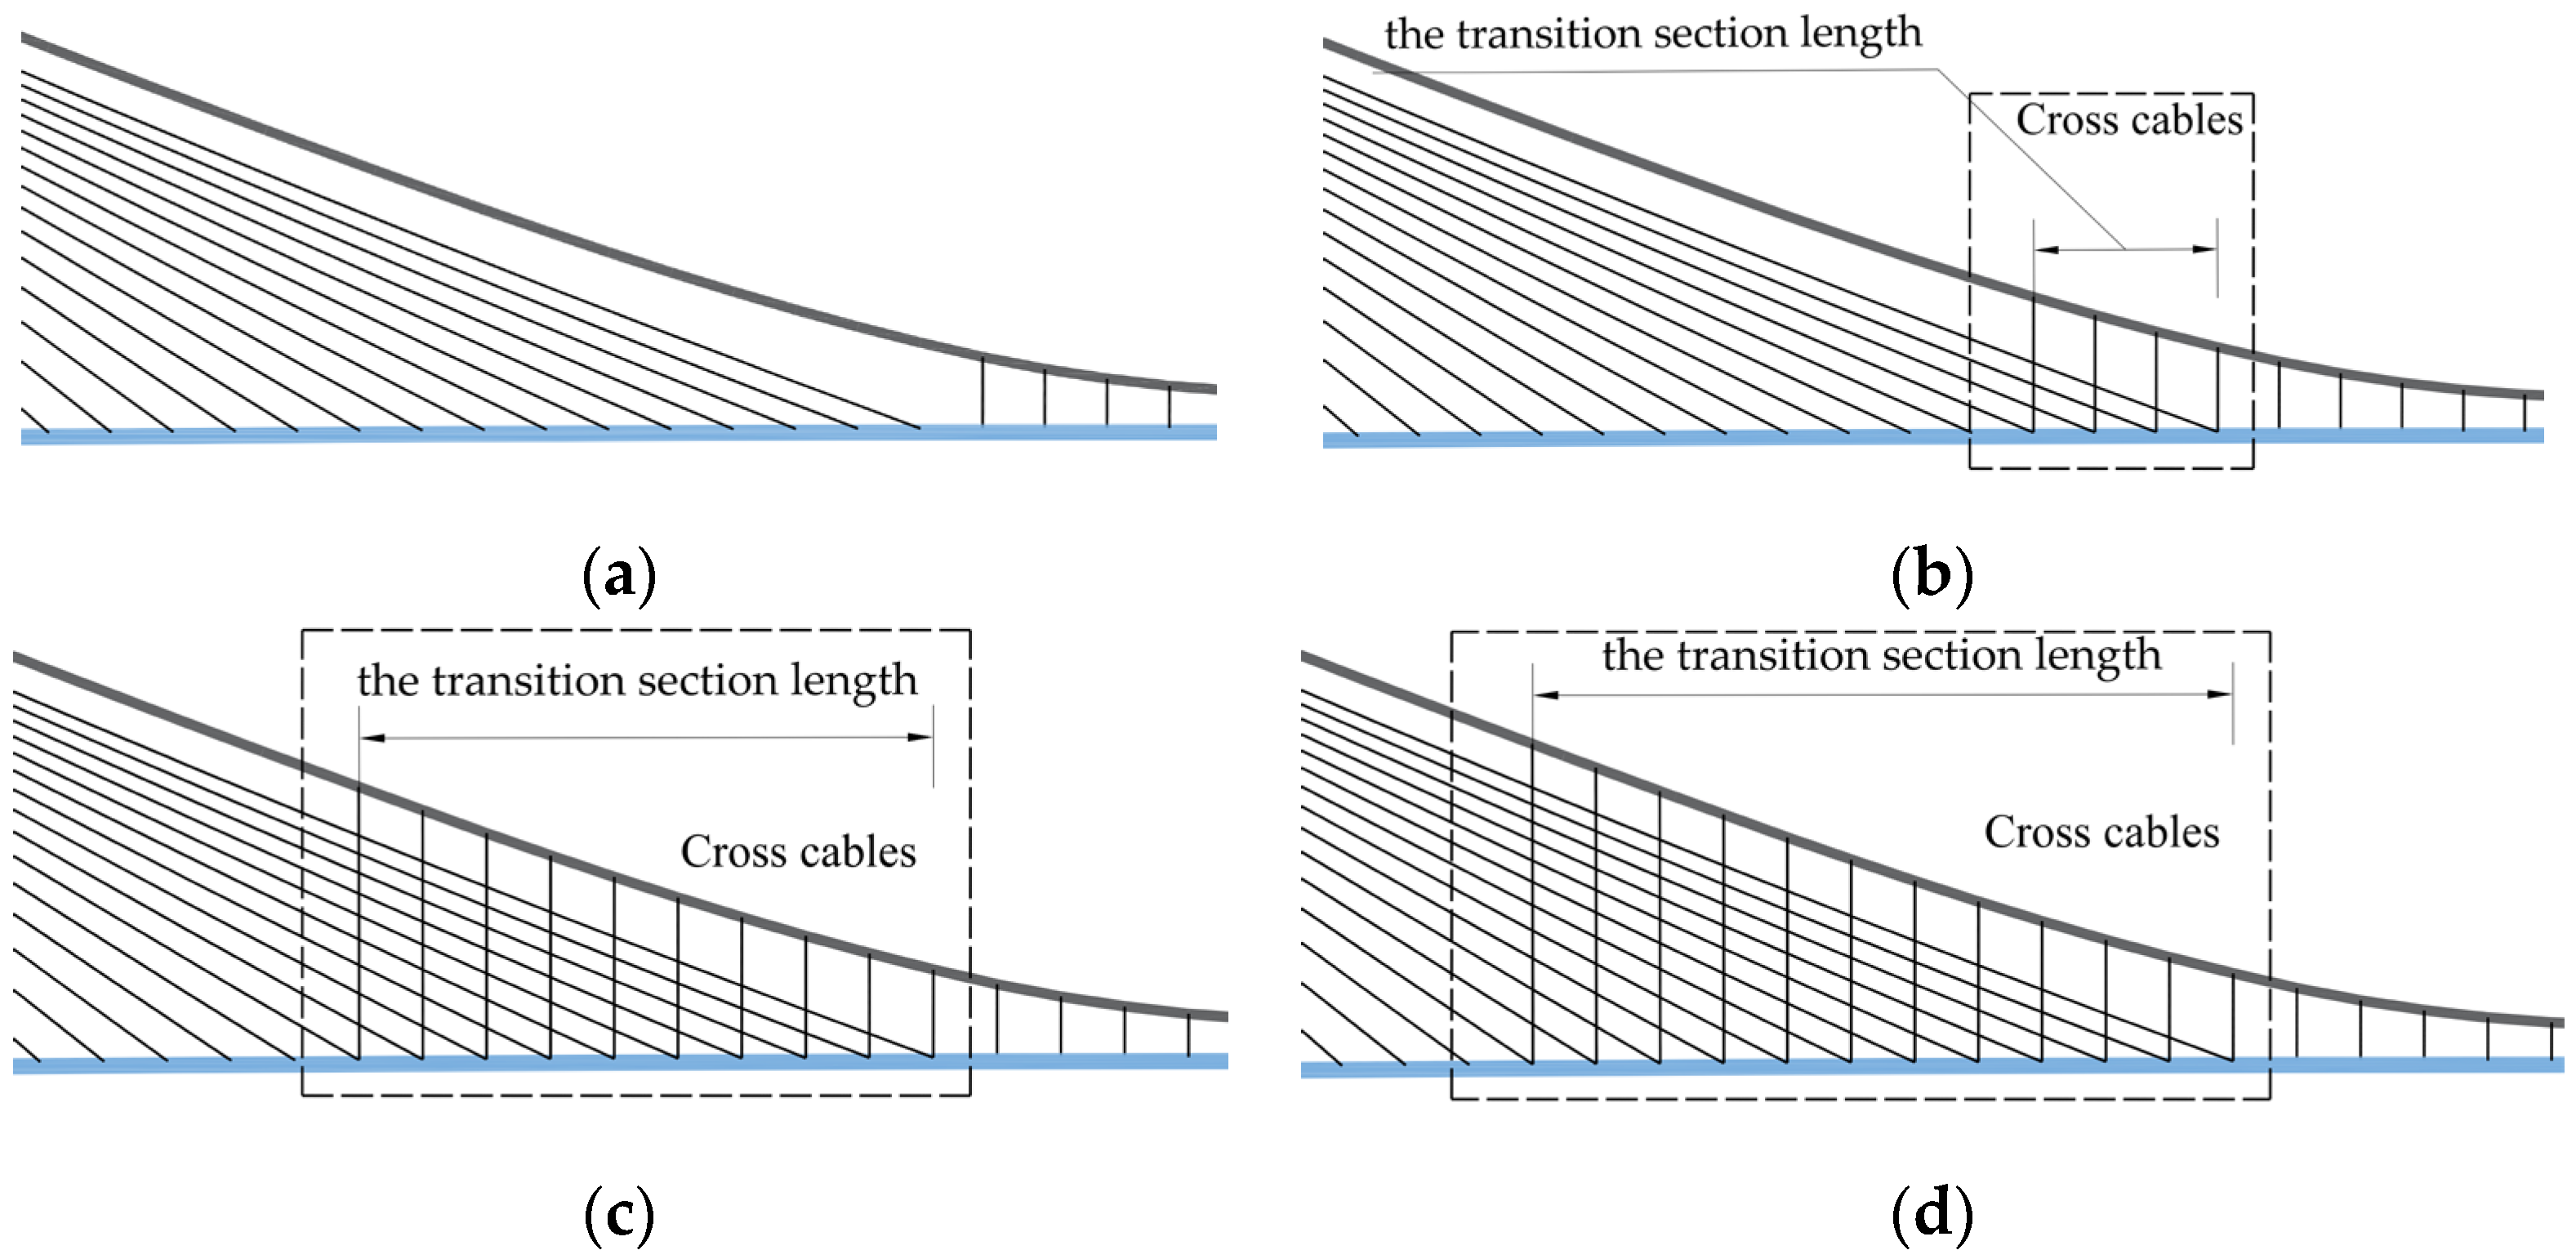
5.1.2. Effect of the Length of the Transition Section
5.2. Influence of Structural Parameters on Mechanical Performance of Stayed Cables and Hangers in the Transition Section
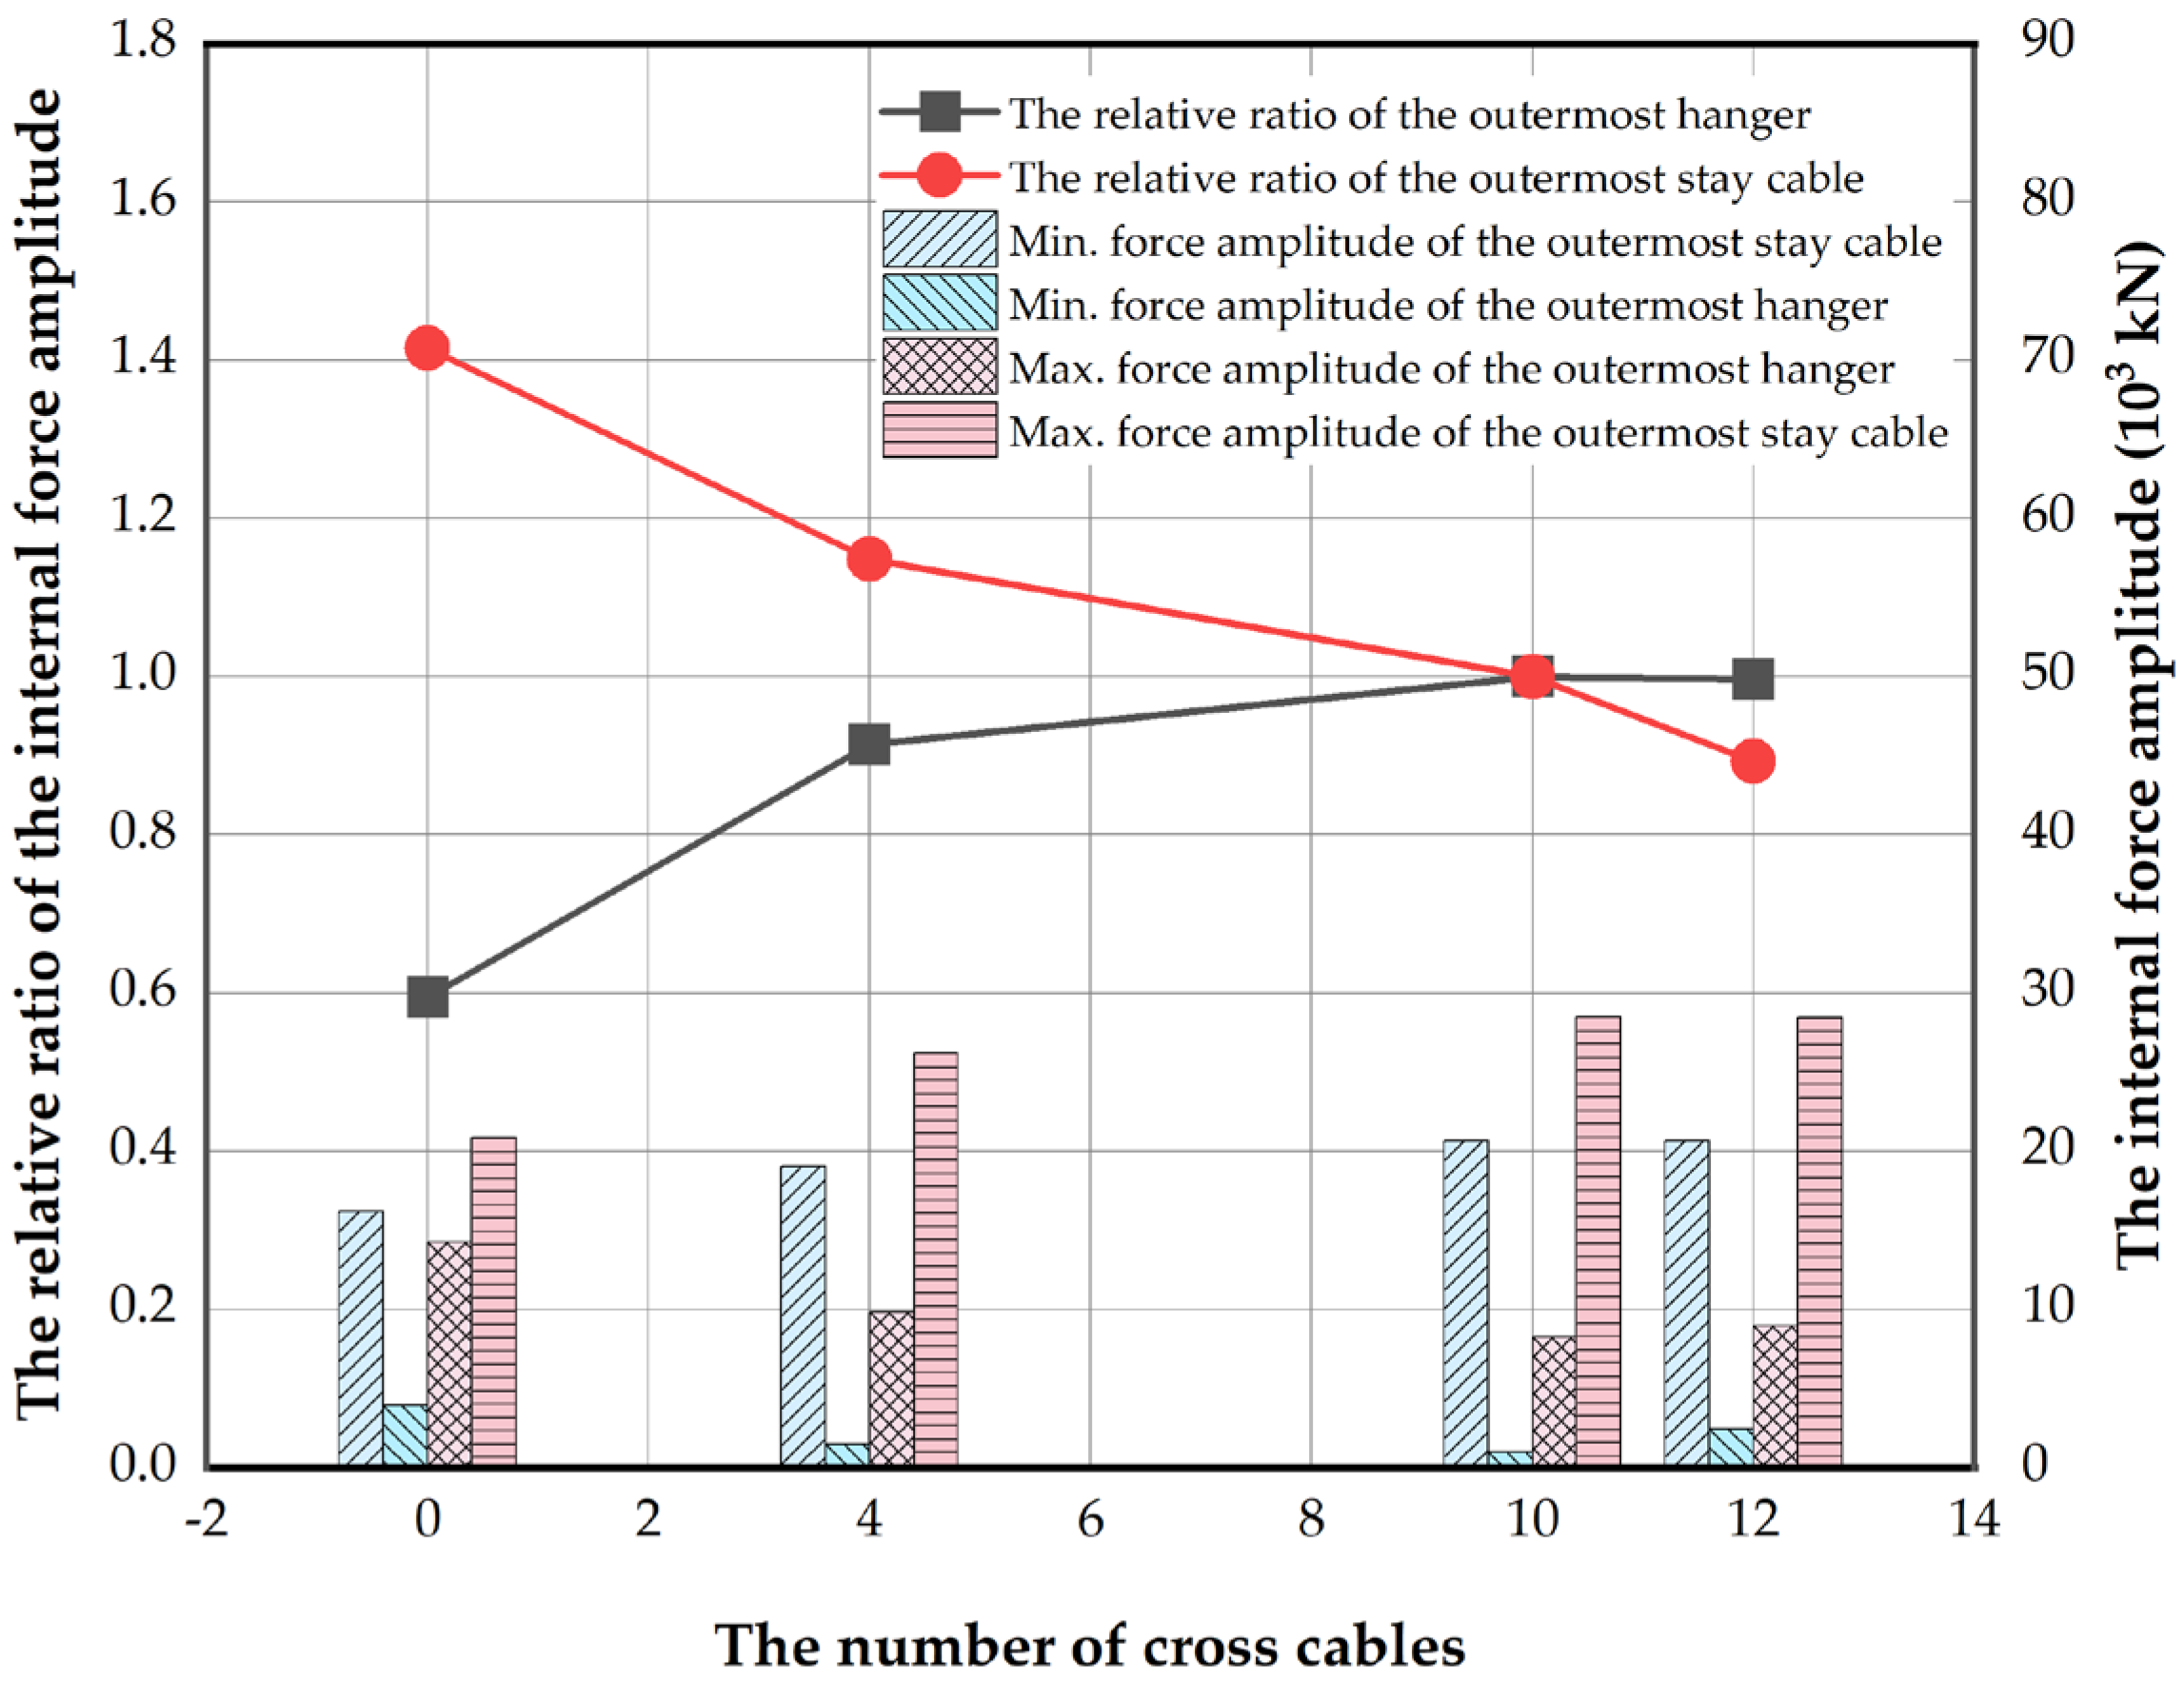
5.2.1. Effect of Number of Cross Cables
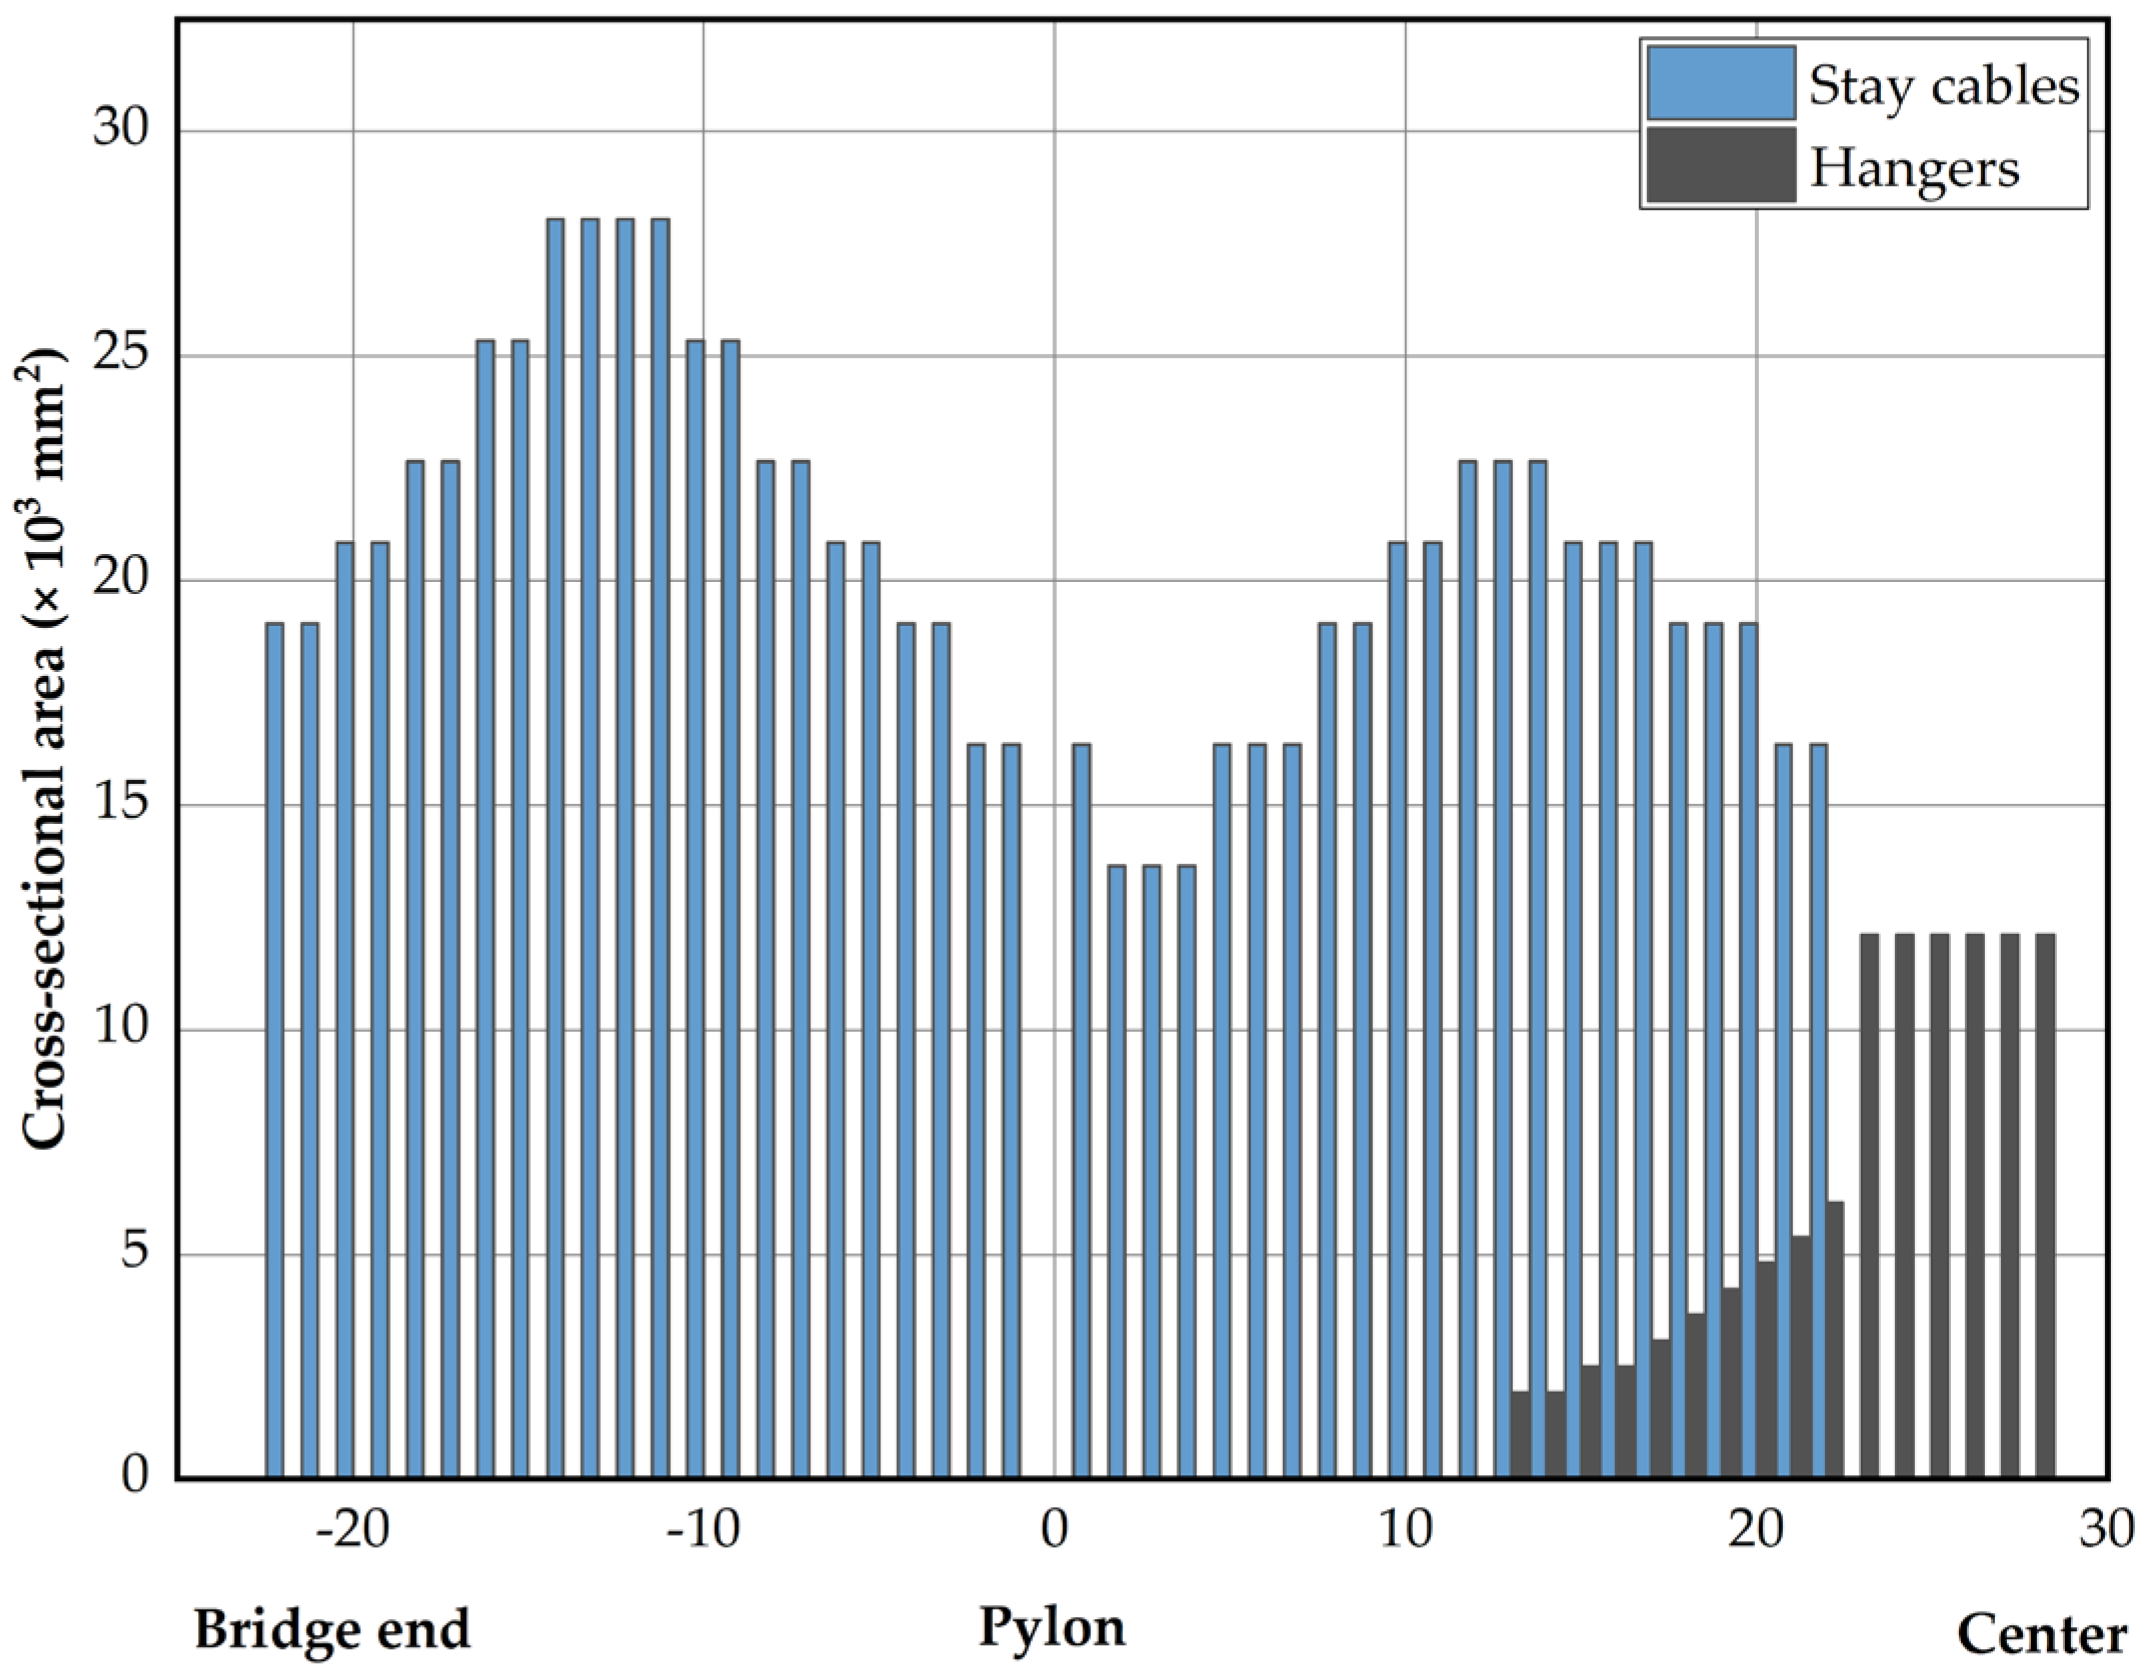
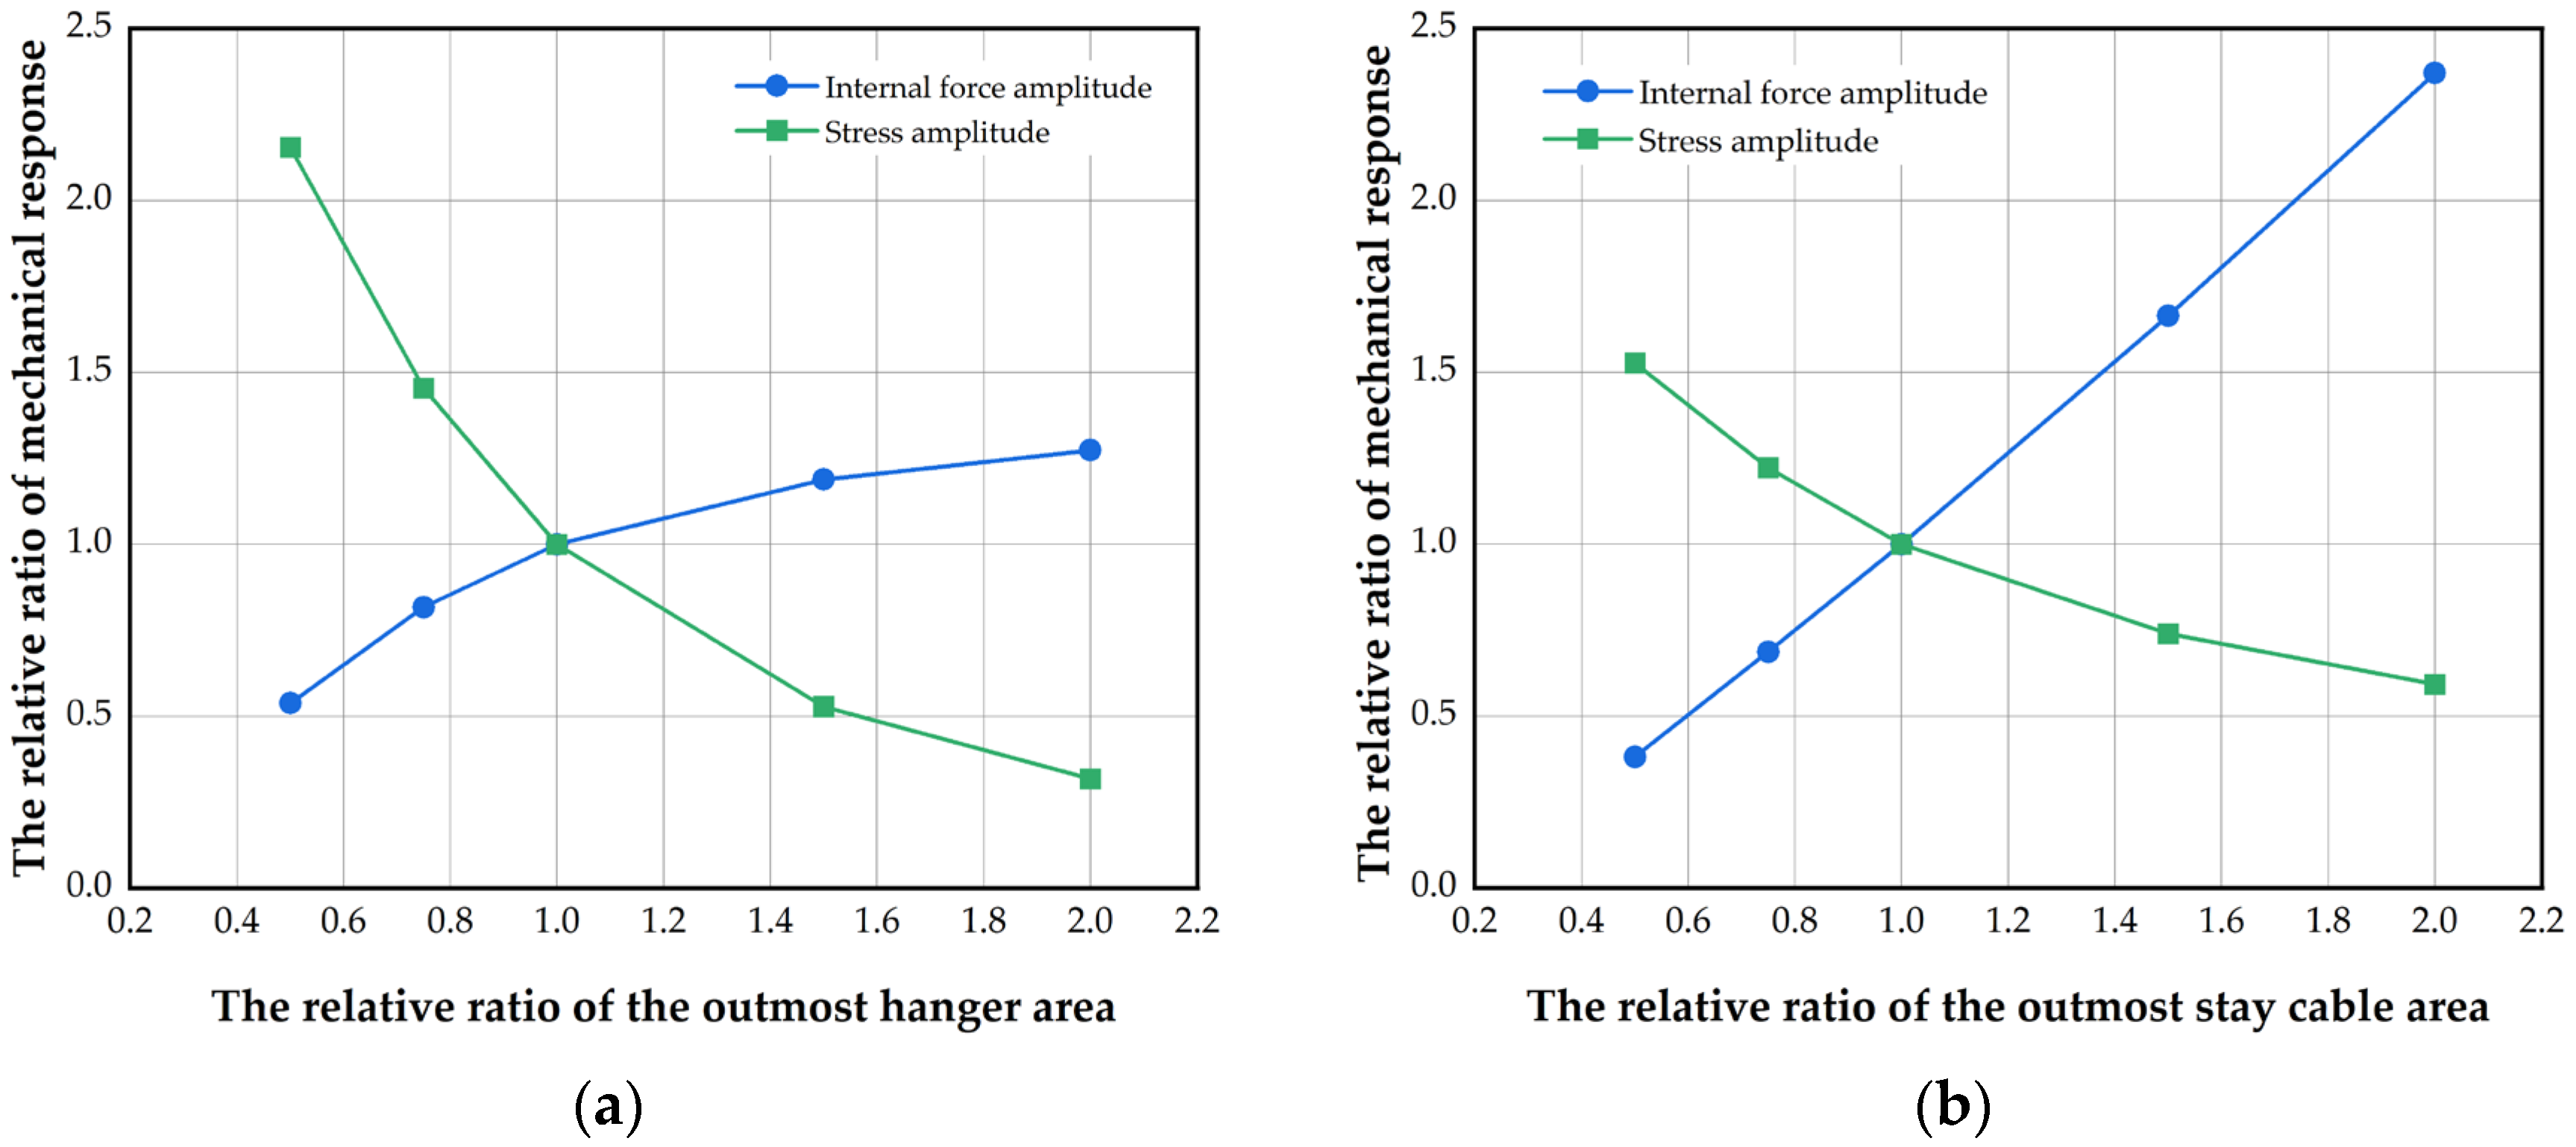
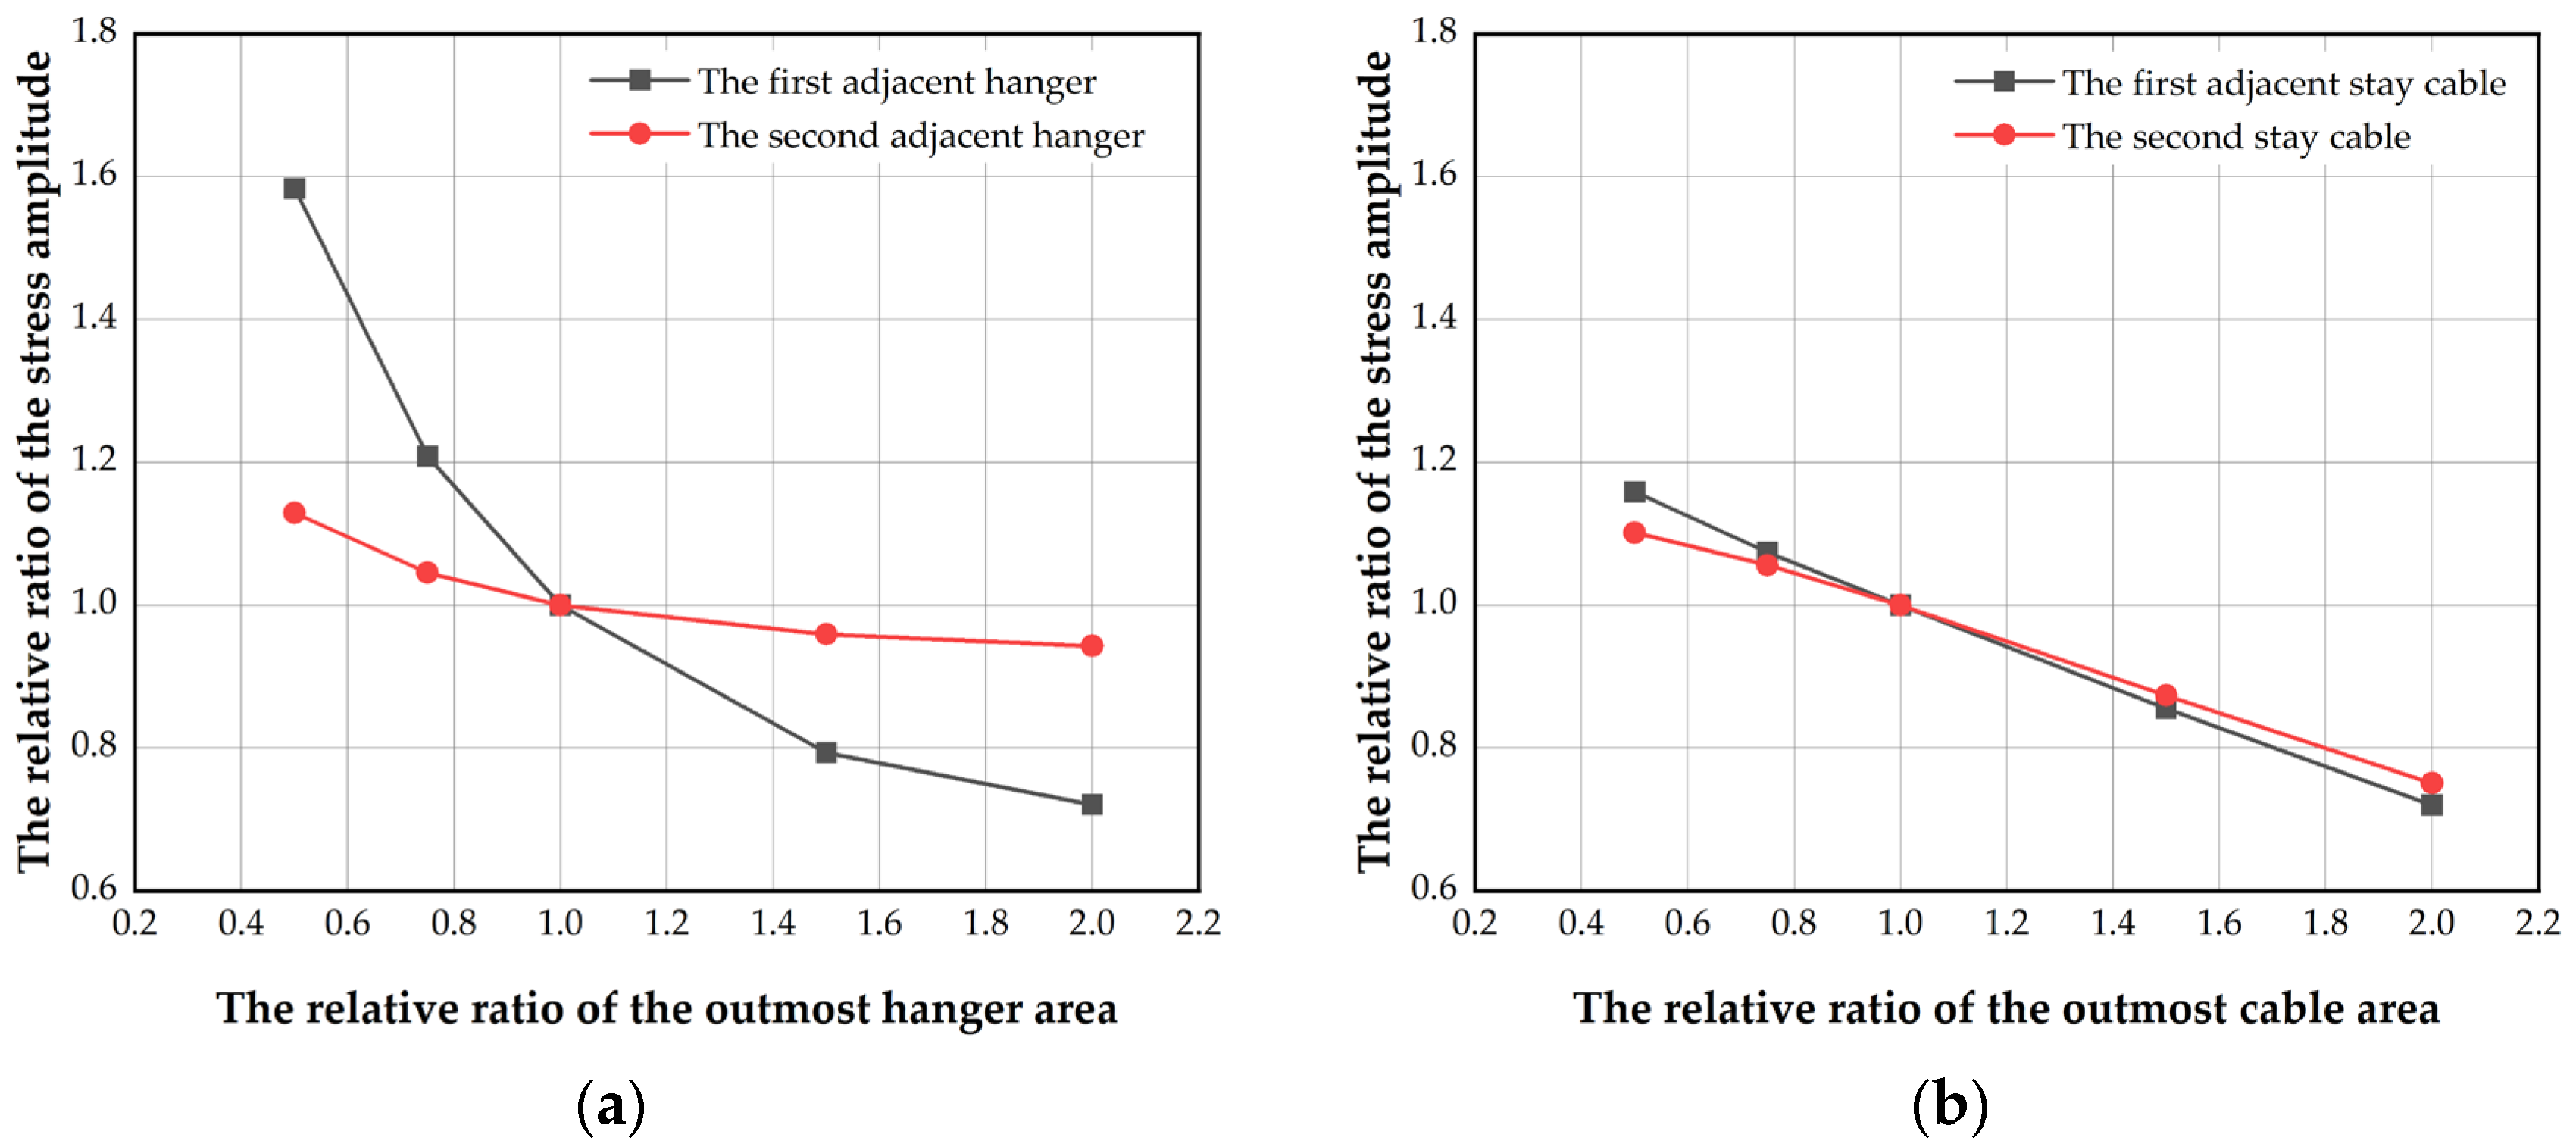
5.2.2. Effect of the Cross-Sectional Area of the Outermost Cables
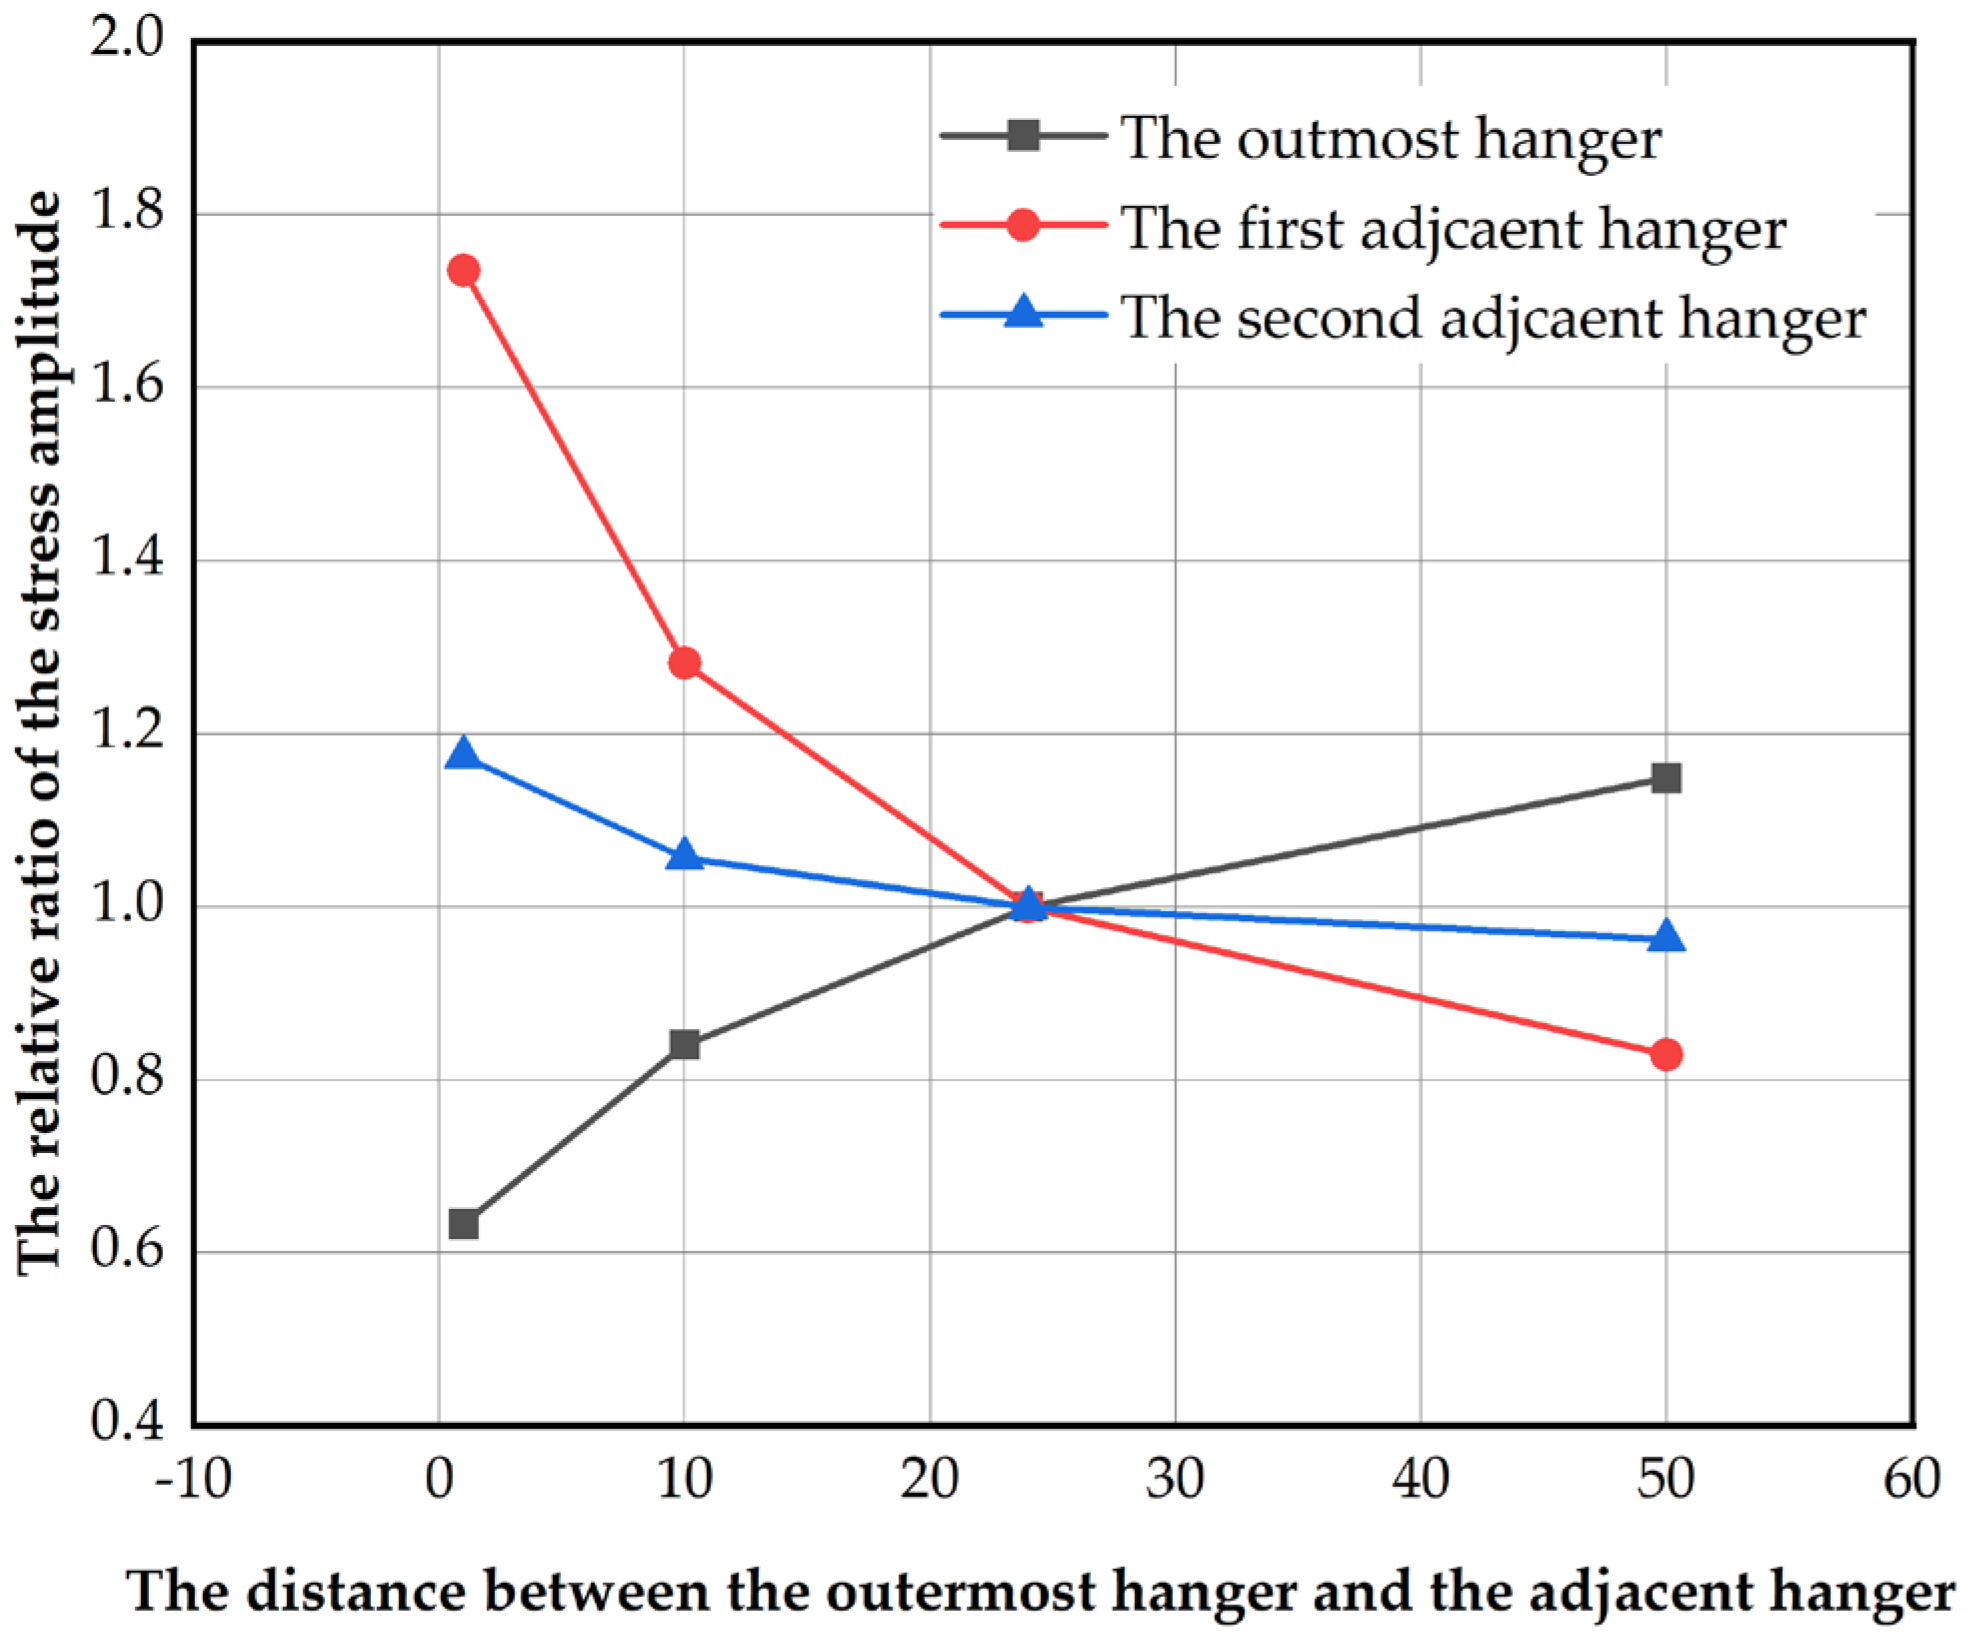
5.2.3. Effect of the Distance between the Outermost Hanger and the Adjacent Hanger
6. Conclusions
- At the transition between the cable-stayed section and the suspension section, there is a sudden and significant change in the mechanical properties. By adjusting the overall structural parameters, such as the number of cross cables, a smooth transition from the cable-stayed system to the suspension system can be achieved, and the stress state of the girder in the transition section can be effectively improved. In contrast, local parameters such as the stiffness of the girder have little effect;
- The stress distribution in each segment girder in the transition area has the same pattern. The live load has a significant effect on the girder stress between the two hangers in the transverse direction. There is stress concentration at the connection between the cables and the girder. There is distinct relative deflection between two plates.
- As the number of cross cables increases, the internal force amplitude of the outermost hanger decreases significantly, while the internal force amplitude of the outermost stay cable increases. Cross cables can significantly reduce the internal force amplitude under live load of the outermost hanger, and improve the cable force distribution in the transition section.
- Increasing the cross-sectional area of the outermost hanger has a more significant effect on reducing the stress amplitude, which can greatly alleviate the fatigue damage problem that may occur on the outermost hanger. However, since increasing the area of the outermost stay cable will lead to excessive internal force amplitude, it is recommended not to increase the stay cable area so as to solve the fatigue problem. Moreover, increasing the cross-sectional area of the outermost cables also has a significant impact on increasing the stress amplitude of adjacent cables, but as the distance increases, the effect on further cables becomes smaller and smaller;
- Adding an auxiliary hanger at a certain distance plays an important role in reducing the internal force amplitude of the outermost hanger. This can also be achieved by changing the distance between the hangers;
- The research presented herein emphasizes the importance of addressing structural continuity and the strategic arrangement of cables within the transition section during the initial design stages of HCSS bridges, which is anticipated to result in enhanced performance characteristics for such bridges in the future.
Author Contributions
Funding
Data Availability Statement
Acknowledgments
Conflicts of Interest
References
- Gimsing, N.J.; Georgakis, C.T. Cable Supported Bridges: Concept and Design; John Wiley & Sons: Hoboken, NJ, USA, 2011; ISBN 1-119-95187-9. [Google Scholar]
- Mao, W.; Hu, X. Latest Developments and Prospects for Long-Span Bridges in China. Bridge Constr. 2020, 50, 13–19. [Google Scholar]
- Martins, A.M.B.; Simões, L.M.C.; Negrão, J.H.J.O. Optimization of Cable-Stayed Bridges: A Literature Survey. Adv. Eng. Softw. 2020, 149, 102829. [Google Scholar] [CrossRef]
- Li, H.; Ou, J. The State of the Art in Structural Health Monitoring of Cable-Stayed Bridges. J. Civ. Struct. Health Monit. 2016, 6, 43–67. [Google Scholar] [CrossRef]
- Wang, D.; Ye, J.; Wang, B.; Wahab, M.A. Review on the Service Safety Assessment of Main Cable of Long Span Multi-Tower Suspension Bridge. Appl. Sci. 2021, 11, 5920. [Google Scholar] [CrossRef]
- Kim, S.; Won, D.H.; Kang, Y.J. Ultimate Behavior of Steel Cable-Stayed Bridges-I. Rational Ultimate Analysis Method. Int. J. Steel Struct. 2016, 16, 601–624. [Google Scholar] [CrossRef]
- Freire, A.M.S.; Negrao, J.H.O.; Lopes, A.V. Geometrical Nonlinearities on the Static Analysis of Highly Flexible Steel Cable-Stayed Bridges. Comput. Struct. 2006, 84, 2128–2140. [Google Scholar] [CrossRef]
- Yoo, H.; Choi, D.H. Improved System Buckling Analysis of Effective Lengths of Girder and Tower Members in Steel Cable-Stayed Bridges. Comput. Struct. 2009, 87, 847–860. [Google Scholar] [CrossRef]
- Nicoletti, V.; Quarchioni, S.; Tentella, L.; Martini, R.; Gara, F. Experimental Tests and Numerical Analyses for the Dynamic Characterization of a Steel and Wooden Cable-Stayed Footbridge. Infrastructures 2023, 8, 100. [Google Scholar] [CrossRef]
- Zhang, W.; Tian, G.; Chen, Y. Evolution of Suspension Bridge Structural Systems, Design Theories, and Shape-Finding Methods: A Literature Survey. J. Traffic Transp. Eng. (Engl. Ed.) 2024, 11, 225–244. [Google Scholar] [CrossRef]
- Zhang, W.M.; Ge, Y.J.; Levitan, M.L. Aerodynamic Flutter Analysis of a New Suspension Bridge with Double Main Spans. Wind Struct. 2011, 14, 187–208. [Google Scholar] [CrossRef]
- Zhang, L.; Xiao, R.; Sun, B.; Jiang, Y.; Zhang, X.; Zhuang, D.; Zhou, Y.; Tu, X. Study on Economic Performances of Multi-Span Suspension Bridges Part 1: Simple Estimation Formulas. Struct. Eng. Mech. 2013, 47, 265–286. [Google Scholar] [CrossRef]
- Bruno, D.; Greco, F.; Lonetti, P. A Parametric Study on the Dynamic Behavior of Combined Cable-Stayed and Suspension Bridges under Moving Loads. Int. J. Comput. Methods Eng. Sci. Mech. 2009, 10, 243–258. [Google Scholar] [CrossRef]
- Konstantakopoulos, T.G.; Michaltsos, G.T. A Mathematical Model for a Combined Cable System of Bridges. Eng. Struct. 2010, 32, 2717–2728. [Google Scholar] [CrossRef]
- Qiu, J.; Shen, R.L.; Li, H.G.; Zhang, X. Analysis of Structural Parameters of Cable-Stayed Suspension Bridges. AMR 2010, 163–167, 2068–2076. [Google Scholar] [CrossRef]
- Zhang, X.-J. Investigation on Mechanics Performance of Cable-Stayed-Suspension Hybrid Bridges. Wind Struct. 2007, 10, 533–542. [Google Scholar] [CrossRef]
- Starossek, U. Cable-Stayed Bridge Concept for Longer Spans. J. Bridge Eng. 1996, 1, 99–103. [Google Scholar] [CrossRef]
- Paultre, P.; Proulx, J.; Begin, T. Dynamic Investigation of a Hybrid Suspension and Cable-Stayed Bridge. Earthq. Engng. Struct. Dyn. 2000, 29, 731–739. [Google Scholar] [CrossRef]
- Erdog, H.; Gülal, E. Ambient Vibration Measurements of the Bosphorus Suspension Bridge by Total Station and GPS. Exp. Tech. 2013, 37, 16–23. [Google Scholar] [CrossRef]
- Sun, B.; Cai, C.; Xiao, R. Analysis Strategy and Parametric Study of Cable-Stayed-Suspension Bridges. Adv. Struct. Eng. 2013, 16, 1081–1102. [Google Scholar] [CrossRef]
- Lin, T.Y.; Chow, P. Gibraltar Strait Crossing—A Challenge to Bridge and Structural Engineers. Struct. Eng. Int. 1991, 1, 53–58. [Google Scholar] [CrossRef]
- Buckland, P.G. Increasing the Load Capacity of Suspension Bridges. J. Bridge Eng. 2003, 8, 288–296. [Google Scholar] [CrossRef]
- Guesdon, M.; Erdogan, J.E.; Zivanovic, I. The Third Bosphorus Bridge: A Milestone in Long-Span Cable Technology Development and Hybrid Bridges. Struct. Eng. Int. 2020, 30, 312–319. [Google Scholar] [CrossRef]
- Reis, A.J.; Pedro, J.J.O. The Europe Bridge in Portugal: Concept and Structural Design. J. Constr. Steel Res. 2004, 60, 363–372. [Google Scholar] [CrossRef]
- Arruda, M.R.T.; Serafim, J.P.M. Parametric Test for the Preliminary Design of Suspension Bridges. Int. J. Adv. Struct. Eng. 2017, 9, 165–176. [Google Scholar] [CrossRef]
- Zhang, W.; Chen, J.; Tian, G.; Chang, J. Reasonable Completed State Evaluation for Hybrid Cable-Stayed Suspension Bridges: An Analytical Algorithm. Structures 2022, 44, 1636–1647. [Google Scholar] [CrossRef]
- Xiao, L.; Huang, Y.; Wei, X. Study on Deflection-Span Ratio of Cable-Stayed Suspension Cooperative System with Single-Tower Space Cable. Infrastructures 2023, 8, 62. [Google Scholar] [CrossRef]
- Liang, T.; Zhao, H.; Liu, Y.-Q. Research on Rational Design of Connection Part for Combined Cable-Stayed and Suspension Bridge. J. Highw. Transp. Res. Dev. 2016, 33, 70–75. [Google Scholar]
- Wang, H.L.; Qin, S.F.; Huang, C.L.; Ge, X.M. Living Load Nonlinear Analysis of Self-Anchored Cable-Stayed Suspension Bridges. Appl. Mech. Mater. 2010, 29, 1583–1587. [Google Scholar] [CrossRef]
- Wang, H.L.; Qin, S.F.; Jiang, R.B. The Design of Jianshe Bridge. Adv. Mater. Res. 2011, 255, 792–796. [Google Scholar] [CrossRef]
- CCCC Highway Consultants Co., Ltd. JTG-D60-2015; General Specifications for the Design of Highway Bridges and Culverts. China Communications Press: Beijing, China, 2015.
- National Railway Administration of People’s Republic. TB10002-2017; General Specifications for the Design of Railway Bridges and Culverts. China Railway Publishing House: Beijing, China, 2015.
- Li, G.; Xiao, L.; Huang, Q.; Pu, L.; Wei, X. Experimental Investigation on the Performance of Cable-Girder Anchorage Structure of Hybrid Cable-Stayed Suspension Bridges. Structures 2023, 56, 104911. [Google Scholar] [CrossRef]
- Zhang, W.-M.; Chen, J. Effects of Key Parameters of Hybrid Cable-Stayed Suspension Bridge on the Fatigue Resistance of Side Hangers in Bonding Zones. Structures 2024, 63, 106441. [Google Scholar] [CrossRef]
- Zheng, H.; Qin, J.; Zhang, M.; Yuan, R.; Li, Y.; Zhou, Z. Modal Characteristics Analysis and Vibration Control of Long-Span Cable-Stayed-Suspension Hybrid Bridge Based on Strain Energy Method. Structures 2024, 64, 106522. [Google Scholar] [CrossRef]


| Parameter | Unit | Value | |
|---|---|---|---|
| Span length | Left side span | m | 375 |
| Main span | m | 1440 | |
| Right side span | m | 375 | |
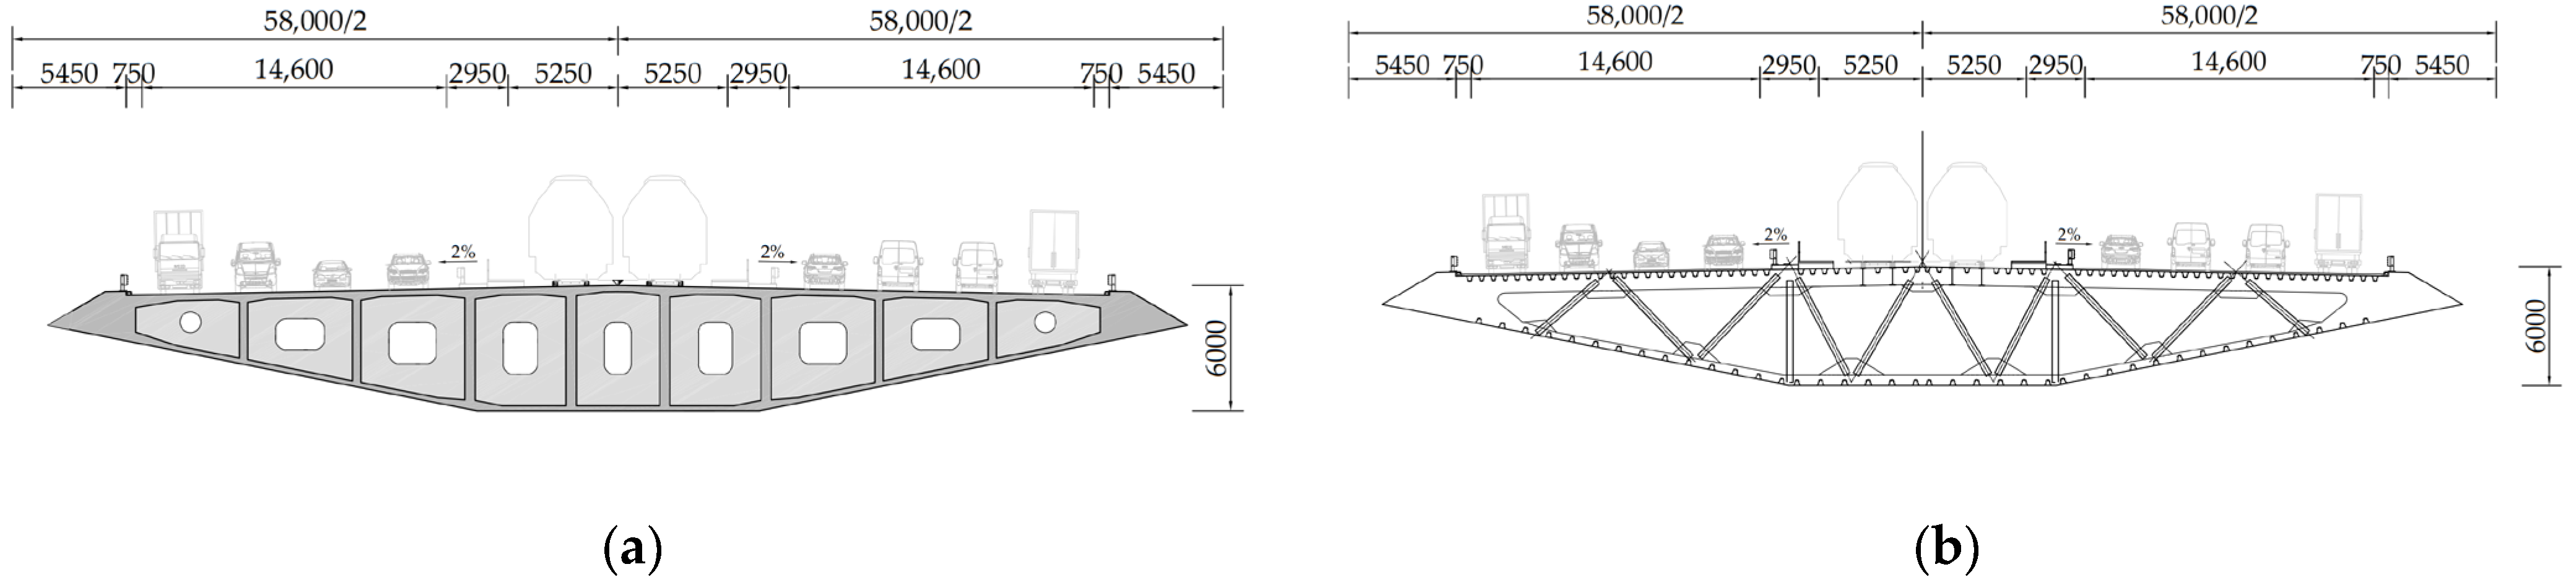
| Steel box girder | Material | - | Q345qD |
| Area | m2 | 3.307 | |
| Concrete box girder | Material | - | C60 |
| Area | m2 | 56.648 | |
| Pylon | Material | - | C60 |
| Height | m | 335 | |
| Main cable | Material | - | Steel |
| Tensile strength | MPa | 1860 | |
| Area | m2 | 0.483 | |
| Stay cable | Material | - | Steel |
| Tensile strength | MPa | 1860 | |
| Hanger | Material | - | Steel |
| Tensile strength | MPa | 1860 | |
| Component | Elastic Modulus (GPa) | Poisson’s Ratio | Cross-Sectional Properties | ||
|---|---|---|---|---|---|
| Izz (m4) | Iyy (m4) | Ixx (m4) | |||
| Main cable | 195 | 0.31 | - | - | - |
| Hanger | 195 | 0.31 | - | - | - |
| Stay cable | 195 | 0.31 | - | - | - |
| Steel girder | 210 | 0.3 | 15.461 | 728.050 | 39.432 |
| Concrete girder | 35 | 0.2 | 194.600 | 13,721.100 | 570.042 |
| Pylon | 35 | 0.2 | 1859.180 | 1418.880 | 2267.310 |
| Position | DX | DY | DZ | ROTX | ROTY | ROTZ |
|---|---|---|---|---|---|---|
| Anchor node of the main cable | 1 | 1 | 1 | 1 | 1 | 1 |
| Bottom of the pylon | 1 | 1 | 1 | 1 | 1 | 1 |
| Abutment | 1 | 1 | 0 | 0 | 0 | 0 |
| Auxiliary pier | 1 | 1 | 0 | 0 | 0 | 0 |
| Main cable and pylon | 1 | 1 | 1 | 1 | 1 | 1 |
| Girder and pylon | 1 | 1 | 0 | 0 | 0 | 0 |
| Dead Load Effects | Global FEM | Local FEM | Error | ||
|---|---|---|---|---|---|
| The outermost hanger section | Maximum vertical displacement of the local model center (m) | 0 | 0.0383 | 0.0383 | |
| Axis force of cables (kN) | H1 | 3126 | 3159 | 1.05% | |
| H2 | 3126 | 3159 | 1.05% | ||
| SC1 | 5475 | 5421 | −0.99% | ||
| SC2 | 5475 | 5421 | −0.99% | ||
| SC3 | 6239 | 6307 | 1.09% | ||
| SC4 | 6239 | 6307 | 1.09% | ||
| SC5 | 11,237 | 11,202 | −0.31% | ||
| SC6 | 11,237 | 11,202 | −0.31% | ||
| The outermost stay cable section | Maximum vertical displacement of the local model center (mm) | 0 | 0.0277 | 0.0277 | |
| Axis force of cables (kN) | SC1′ | 6982 | 6972 | −0.14% | |
| SC2′ | 6982 | 6972 | −0.14% | ||
| H1′ | 5378 | 5324 | −1.00% | ||
| H2′ | 5378 | 5324 | −1.00% | ||
| H3′ | 2891 | 2917 | 0.90% | ||
| H4′ | 2891 | 2917 | 0.90% | ||
| H5′ | 2896 | 2752 | −1.52% | ||
| H6′ | 2896 | 2652 | −1.52% | ||
| Section | Relative Stiffness Ratio | ||||
|---|---|---|---|---|---|
| Group 1 | Group 2 | Group 3 | Group 4 | Group 5 | |
| The stayed section | 1 | 1 | 1 | 1 | 1 |
| The transition section | 1 | 1 | 1.5 | 1.5 | 2 |
| The suspension section | 1 | 1.5 | 1.5 | 2 | 2 |
| The Number of Cross Cables | The Tending Moment Amplitude | The Rotation Amplitude | ||
|---|---|---|---|---|
| Interface 1 | Interface 2 | Interface 1 | Interface 2 | |
| 4 | 797.87 | 581.63 | 1.324 | 2.554 |
| 10 | 629.19 | 551.36 | 1.019 | 2.469 |
| 12 | 524.42 | 548.94 | 0.936 | 2.457 |
Disclaimer/Publisher’s Note: The statements, opinions and data contained in all publications are solely those of the individual author(s) and contributor(s) and not of MDPI and/or the editor(s). MDPI and/or the editor(s) disclaim responsibility for any injury to people or property resulting from any ideas, methods, instructions or products referred to in the content. |
© 2024 by the authors. Licensee MDPI, Basel, Switzerland. This article is an open access article distributed under the terms and conditions of the Creative Commons Attribution (CC BY) license (https://creativecommons.org/licenses/by/4.0/).
Share and Cite
Jia, L.; Xu, J.; Luo, K.; Li, W.; Liu, Y.; Pei, H. Mechanical Performance Analysis and Parametric Study of the Transition Section of a Hybrid Cable-Stayed Suspension Bridge. Buildings 2024, 14, 1805. https://doi.org/10.3390/buildings14061805
Jia L, Xu J, Luo K, Li W, Liu Y, Pei H. Mechanical Performance Analysis and Parametric Study of the Transition Section of a Hybrid Cable-Stayed Suspension Bridge. Buildings. 2024; 14(6):1805. https://doi.org/10.3390/buildings14061805
Chicago/Turabian StyleJia, Lijun, Jiawei Xu, Kedian Luo, Weihui Li, Yangqing Liu, and Huiteng Pei. 2024. "Mechanical Performance Analysis and Parametric Study of the Transition Section of a Hybrid Cable-Stayed Suspension Bridge" Buildings 14, no. 6: 1805. https://doi.org/10.3390/buildings14061805