Article

Experimental Investigation of the Bond Performance at the Interface between Engineered Geopolymer Composites and Existing Concrete

1
Foshan Nanhai Power Supply Bureau, Guangdong Power Grid Co., Ltd., China Southern Power Grid Co., Ltd., Foshan 528299, China
2
Foshan Chancheng Power Supply Bureau, Guangdong Power Grid Co., Ltd., China Southern Power Grid Co., Ltd., Foshan 528010, China
3
School of Civil and Transportation Engineering, Guangdong University of Technology, Guangzhou 510006, China
4
School of Civil Engineering and Transportation, South China University of Technology, Guangzhou 510640, China
*
Author to whom correspondence should be addressed.
Buildings 2024, 14(6), 1819; https://doi.org/10.3390/buildings14061819
Submission received: 21 May 2024 / Revised: 10 June 2024 / Accepted: 13 June 2024 / Published: 15 June 2024
(This article belongs to the Special Issue Next-Gen Cementitious Composites for Sustainable Construction)

Abstract

:
Engineered geopolymer composite (EGC) exhibits ultra-high toughness, excellent crack control capability, and superior durability, making it highly promising for applications in bridge connecting slabs, wet joints of prefabricated components, and concrete structure reinforcement. However, the bond performance and failure mechanisms at the interface between EGC and existing concrete remain unclear. To elucidate the bond performance of EGC to existing concrete, direct shear tests were conducted on 15 sets of EGC–existing concrete bond specimens. This study explored the effects of existing concrete strength, interface roughness, and EGC strength on the bond performance and mechanisms. Additionally, a direct shear bond mechanical model was established to predict the interface bond strength. The results indicate that, with comparable compressive strength, the preparation of EGC can reduce the total carbon emissions by up to 127% compared to ECC. The failure mode of EGC-existing concrete bond specimens was mainly adhesive failure (except for specimen C30-III-G95), which can be categorized into serrated interfacial failure and alternating crack paths. The change in interface roughness was the primary factor leading to the transition between failure paths. The changes in interface roughness and EGC strength significantly influenced the bond performance. Under their combined effect, the interface bond strength of specimen C50-III-G95 increased by 345% compared to C50-I-G45. In contrast, the improvement in existing concrete strength had a relatively smaller effect on the increase in interface bond strength. Based on the experimental results and the bonding mechanism under direct shear stress, a direct shear bond mechanical model correlating existing concrete strength, interface roughness, and EGC strength was established. The model predictions showed good consistency with the experimental results. This study provides theoretical support and experimental data for the engineering application of EGC.

1. Introduction

Reinforced concrete structures are widely used in hydraulic and civil engineering. However, during their service life, the structures may experience creep and shrinkage [1,2,3], erosion from substances such as sulfates and chlorides [4,5,6], and excessive loads and fatigue [7,8], which can induce concrete cracking, rebar corrosion, and spalling of the concrete cover, ultimately leading to a decline in the structural safety and reliability. Nevertheless, demolishing buildings with safety hazards to reconstruct them must consider local economic development and environmental pollution issues, balancing the contradictions among structural safety, economic benefits, and environmental protection [9,10]. Based on this, reinforcing existing damaged structures, while ensuring structural safety and minimizing construction volume, is an effective way to promote the harmonious development of cities and nature.
Engineered cementitious composites (ECC), designed through micro-mechanics, exhibit significant tensile strain hardening and multiple cracking behaviors after the incorporation of a suitable amount of high-performance fibers into the cement-based mortar [11,12,13,14,15,16]. Additionally, the tensile cracks in ECC usually remain below 100 μm, effectively preventing the intrusion of harmful substances into the concrete [17]. Using ECC, a high-performance concrete, to reinforce aging structures not only maximally extends the lifespan of buildings but also significantly reduces the likelihood of needing secondary reinforcement [18,19,20], aligning well with the sustainable development goals of the construction industry. However, the production of ECC typically requires 2 to 3 times more cement than traditional concrete [21]. Given that cement manufacturing is a process with high energy consumption and high carbon dioxide emissions [22], using non-clinker cements (such as geopolymers) to produce EGC represents a promising alternative [23,24,25,26,27,28]. Studies show that compared to the production of ECC, the production of fly ash-based EGC reduces energy consumption by about 60% and carbon dioxide emissions by about 80% [29,30]. Furthermore, EGC also exhibits good chemical resistance [31,32], rapid hardening, and high early strength [33,34], making it highly potential in the reinforcement field.
The interface region between EGC and concrete is often considered a weak point, determining the failure mode of the entire component. This is due to discontinuities in material, high porosity accumulation, and concentration of micro-cracks at the interface between new and old concrete [35]. Therefore, improving interfacial bond performance can enhance the overall performance of the component. The strength and elastic modulus of the reinforcement material, the strength of the existing concrete, and the roughness of the interface are significant factors affecting interfacial bond performance [36,37,38]. Generally, increasing the strength of the reinforcement concrete can enhance the interfacial bond strength and shift the failure from the interface to the base material [39,40]. Research indicates that UHPC, as a reinforcement material, can reduce the amount of free water in the transition zone at the interface, decrease the porosity formed by air bubbles accumulating during vibration, and ultimately manifest as an increase in interfacial bond strength [41]. According to Kumar et al. [42], the elastic modulus of EGC is directly related to the interfacial bond strength between EGC and existing concrete. Moreover, EGC with a higher cracking strength exhibits stronger interfacial bonding with the existing concrete. However, when there is a significant difference in the elastic modulus between the reinforcement layer and the existing concrete layer, it can lead to localized stress concentration at the edge of the interface, thereby promoting the development of shear stress and early failure of the bonded interface [43]. Additionally, Semendary et al. [44] through direct tensile tests studying the effect of UHPC reinforcement on NSC and HSC at different curing ages, found that the interfacial bond strength growth rate of UHPC-HSC was higher than that of UHPC-NSC in the early stages (3–7 days) and exhibited higher interfacial bond strength at 28 days (UHPC-NSC at 3.15 MPa and UHPC-HSC at 3.45 MPa). Moreover, Courard et al. [38] state that stronger existing concrete shows superior interfacial bond performance when aggressive interface treatment methods (such as pneumatic bush hammering) are used.
Changes in interface roughness can significantly affect the interfacial bond strength, mainly due to increased interfacial shear friction and mechanical interlocking between different concrete layers [45]. Wang et al. [46] found that, when using EGC to reinforce existing concrete, increasing the ductility of EGC does not result in higher interfacial bond strength, whereas improving the interfacial roughness effectively enhances the interfacial bonding performance. Under shear conditions, sufficient interface roughness can change the location of failure in a component (from the bond interface to either the reinforcement layer or the existing concrete layer) [43]. However, the study by Costa et al. [47] suggests that the beneficial effects of increased interface roughness on shear and tensile bond strength have boundary effects, and beyond a certain level of interface roughness, the interfacial bond strength will stabilize. Using sand blasting to treat the bonding interface is an effective method to improve interface roughness. The treated bond interface surface texture is neither too rough nor too smooth, and it allows the aggregate to be exposed, avoiding the mechanical damage to existing concrete caused by chiseling [39]. Additionally, interface agents and the moisture content of the interface can also affect the bond performance to some extent [41,48]. Different interface agents have varying effects on the bonding interface. Jiang et al. [49] found that using cement paste interfacial agent and polymer modified interfacial agent on the bonding interface, through direct shear tests, the cement paste interfacial agent can enhance the chemical bonding between ECC and existing concrete, while the polymer modified interfacial agent has no effect. Some researchers have pointed out that applying interface agents might lead to a loss of interface roughness and a weakening of the fiber bridging effect [50]. Moreover, the mechanism of how the moisture content of the bonding interface affects the bonding strength when pouring the reinforcement layer is still unclear. One view suggests that the moisture content of the interface during the pouring of the reinforcement layer depends on the materials chosen for the substrate and the overlay [43]. Farzad et al. [51] indicated that when ordinary concrete is used as the overlay material, wetting the bonding interface can increase the bonding strength, while keeping the bonding interface dry is more beneficial when ultra-high-performance concrete is used as the overlay material. Summarizing the above literature, reports on the interfacial bonding performance of EGC-existing concrete are still relatively scarce. Additionally, variations in the strength of existing concrete, which can result in different reinforcement effects of EGC, have not been considered (as the strength of existing concrete cannot be consistent in actual engineering). EGC is an ideal reinforcement material that can enhance the durability of reinforced structures, and the fiber bridging effect produced by the organic fibers can improve the shear performance of the bonding interface. Therefore, researching the interfacial bonding performance of EGC- existing concrete is of significant importance.
This study prepares EGC using fly ash and granulated blast furnace slag as binder materials and controls the quality ratio of fly ash to slag (8:2, 7:3, 6:4, across three groups) to adjust the strength of EGC. Pneumatic bush hammers are used to roughen the interface of existing concrete. This study explores the effects of existing concrete strength, interface roughness, and EGC strength on the bond performance of EGC–existing concrete, analyzes the failure modes and the development patterns of interfacial bond strength, and establishes a direct shear bond mechanics model to predict interfacial bond strength, providing a reference for practical engineering applications. By elucidating these aspects, this study contributes to understanding the interfacial bonding mechanical behavior of EGC–existing concrete, enabling more rational application of EGC as a reinforcement material. However, the material curing conditions, interface treatment methods, and environmental exposure conditions considered in this study are relatively limited and require further in-depth research.

2. Experimental Program

2.1. Raw Materials and Mix Proportion

The materials used to prepare EGC primarily consist of binder materials, aggregates, alkaline activators, water, ultra-high-molecular-weight polyethylene fibers (PE fibers), and retarders. The binder materials used include Class F fly ash (FA) and S105-grade granulated blast furnace slag (GGBFS), both provided by Longze Water Purification Materials Co., Ltd. in Gongyi City, China. The chemical composition and loss on ignition are as shown in Table 1. The aggregate is quartz powder (QP) sourced locally from Guangzhou, China. The particle size distribution of the binder materials and aggregates is shown in Figure 1. The alkaline activator is prepared by mixing a preconfigured solution of 10 mol/L sodium hydroxide and sodium silicate solution (modulus 2.25, mass fraction of m(SiO2):m(Na2O):m(H2O) = 29.99 wt%:13.75 wt%:56.26 wt%) at a ratio of 1:2, which is added to a planetary mixer along with additional water during the mixing process to prepare EGC. The PE fibers used are produced by Beijing Quantum Terra New Materials Technology Co., Ltd, Beijing, China. The physical and mechanical parameters of these fibers are shown in Table 2. Additionally, to ensure that the freshly mixed EGC remains in a pliable state for a sufficient duration to meet pouring requirements, BaCl2 is used as a retarder.
The materials used to prepare the existing concrete include P.II 42.5R ordinary Portland cement, fine aggregates, coarse aggregates, super-plasticizer (SP), and water. The ordinary Portland cement is sourced from Yuebao Cement Co., Ltd. in Guangzhou City, China. The fine aggregate used is river sand with a maximum particle size of 2.36 mm, and the coarse aggregate used is granite crushed stone with a particle size range of 5–10 mm (both sourced locally in Guangzhou, China). The SP is produced by Jiangmen Qiangjian Building Materials Company, Jiangmen, China and mainly consists of a sodium naphthalene sulfonate formaldehyde condensate. The mixing water used in this experiment comes from laboratory tap water.

2.2. Specimens and Preparation

According to ASTM-C469/C469M-22 [52] and JSCE [53] requirements, cylindrical axial compression specimens and dumbbell-shaped axial tensile specimens of EGC were prepared. A total of three types of EGC were designed, and three specimens of each type were prepared to test the compressive and tensile properties of EGC. The specific dimensions of the specimens are shown in Figure 2a,b.
The applied external load may be eccentric, causing bending moments at the bond interface, which can alter the magnitude and direction of the primary shear stresses. Therefore, this study uses cubic double-sided bonded specimens for testing. A total of 45 EGC–concrete bond specimens were prepared, with their specific designs shown in Figure 2c The mix proportions for EGC and existing concrete are provided in Table 3 and Table 4, respectively.
Before pouring the EGC reinforcement layer, this experiment requires surface treatment of the existing concrete, which has been cured for 28 days. The surface of the existing concrete is roughened using a pneumatic bush hammer to achieve the pre-designed interface roughness targets, forming Type I, Type II, and Type III interfaces.
Based on the influencing factors set in the experiment (EGC strength grade, existing concrete strength, and interface roughness), the 45 EGC-existing concrete bond specimens are divided into 15 groups, with three specimens per group. The specific grouping is shown in Table 5. The symbol definition for the groups is as follows: The first character (C30, C50, C70) indicates the strength grade of the existing concrete, the second character (I, II, III) represents the type of bond interface, and the third character (G45, G70, G95) represents the strength grade of EGC. For example, C30-I-G45 refers to a specimen where the existing concrete is bonded to EGC through a Type I interface (with the existing concrete strength grade as C30 and the EGC strength grade as G45).

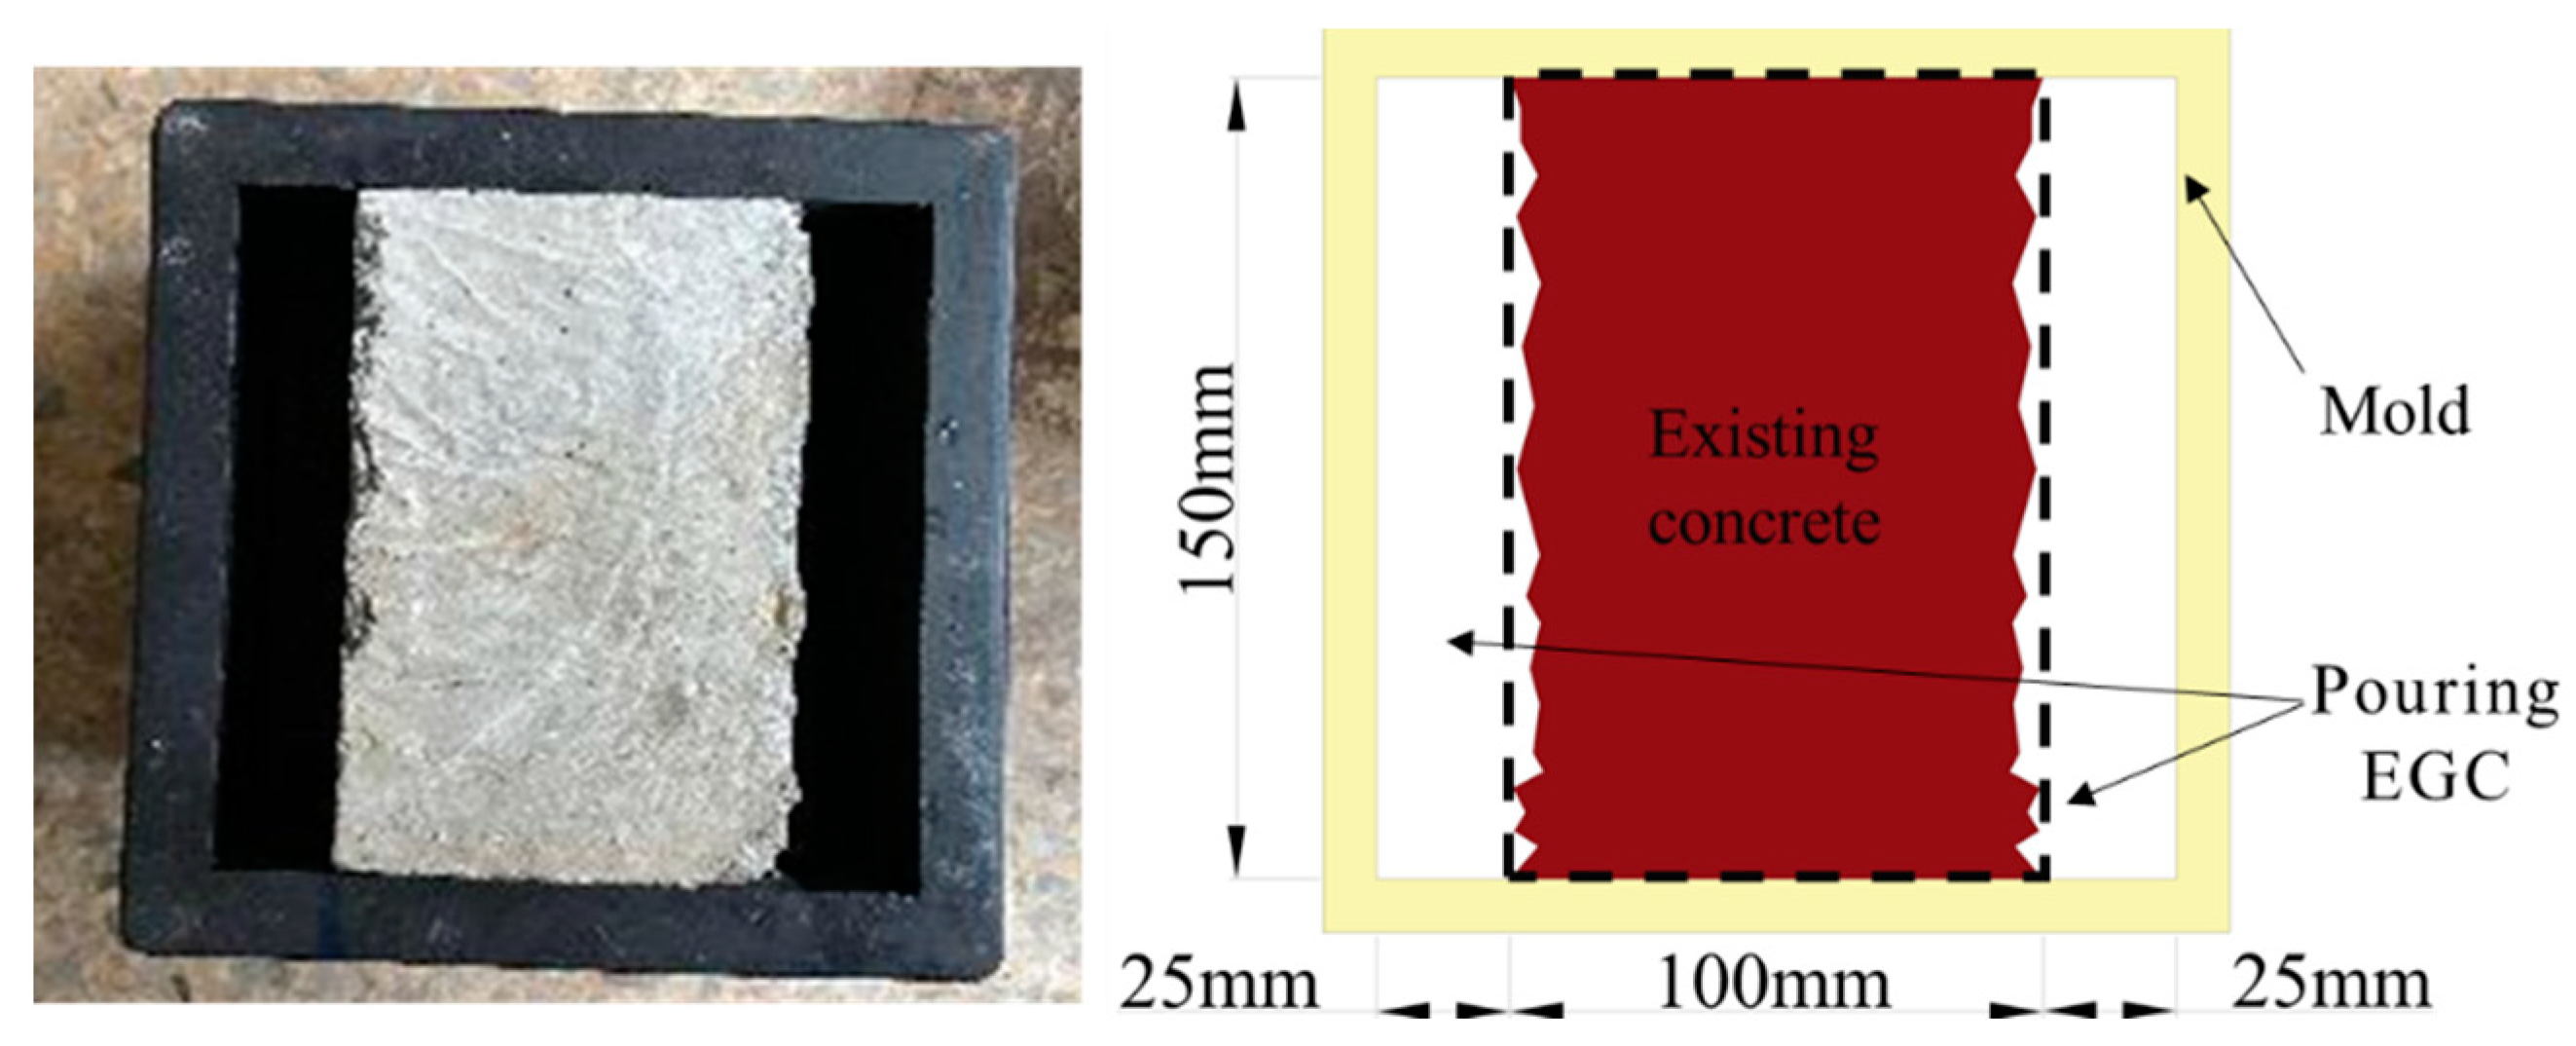
2.2.1. Production of The Existing Concrete

According to JGJ 55-2011 [54], existing concrete is produced using a forced mixer to mix the concrete materials. Before casting, a 50 mm thick baffle is embedded in the cubic mold to facilitate subsequent bush hammering work. The mixing process is as follows: First, the cement and aggregate are added to the mixer and mixed for 2 min, then the water-reducing agent and water mixture are poured into the mixer and mixed for another 2 min. Finally, the freshly mixed concrete is poured into the mold and vibrated to form. The surface of the mold is covered with plastic wrap, demolded after curing in the laboratory indoor environment for 24 h, then placed in water for curing for 28 days before bush hammering. Additionally, extra cubes of all groups of existing concrete are prepared to test the compressive strength at 28 days, with three per group.

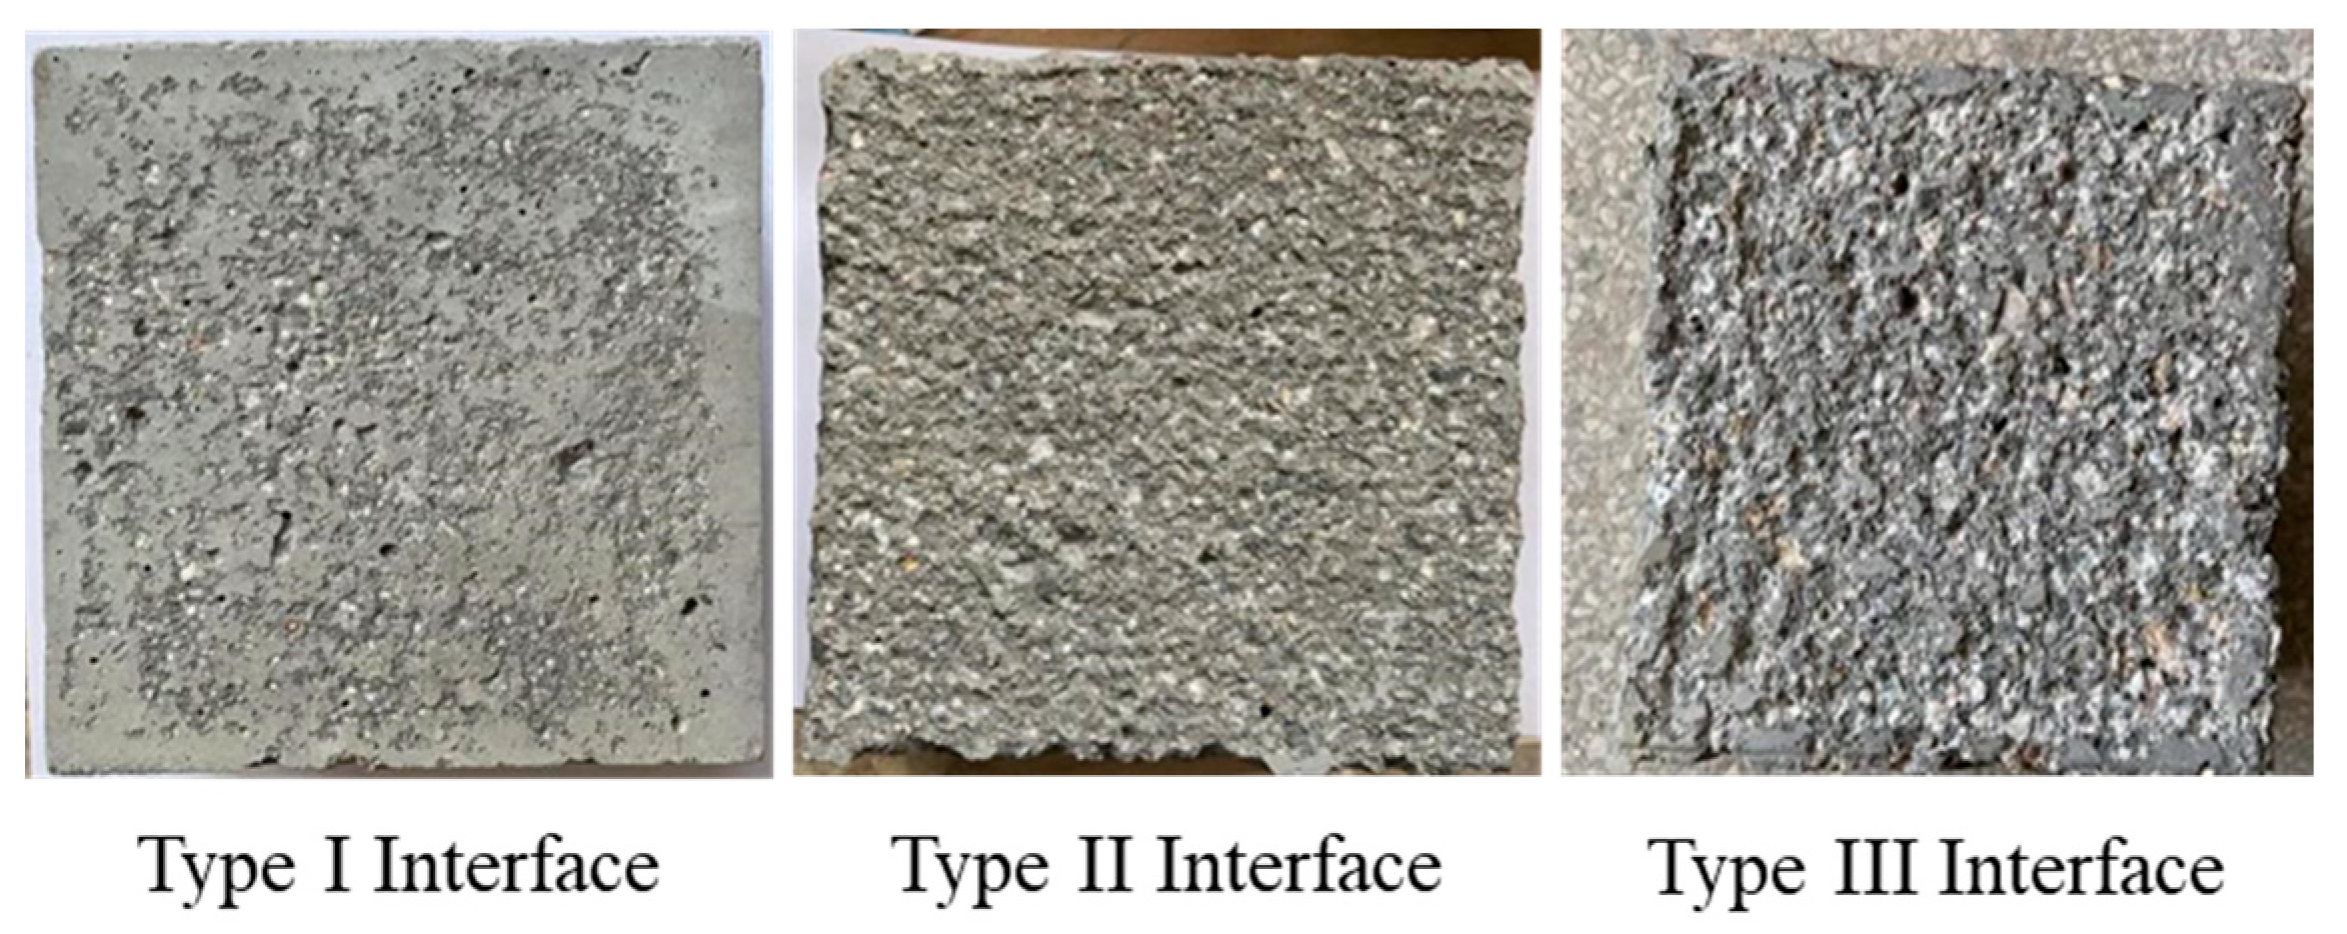
2.2.2. Interfacial Roughness Treatment

After the existing concrete had reached a curing age of 28 days, it was removed from the water tank and dried for the application of three different interface roughness levels through bush hammering. Different types of scabbler heads were used with a pneumatic bush hammer to roughen the surface of the existing concrete, resulting in varying depths of roughening. For Type I interfaces, a lychee-faced scabbler head was used to lightly roughen the surface without removing the of laitance of existing concrete. Type II interfaces were treated by using the lychee-faced scabbler head for deep roughening. Type III interfaces involved deep roughening with the lychee-faced scabbler head followed by further roughening with a pineapple-faced scabbler head. Both Type II and Type III interfaces removed the laitance from the surface of the existing concrete. Specimens with different interface types were strictly processed according to the specified roughening requirements, and the consistency of interface treatment effects was reflected by the stability of the measured interface roughness data. The roughening effects for Type I, Type II, and Type III interfaces are illustrated in Figure 3.
The sand patch test was used to measure the roughness of the bond interface. The specific implementation process involved enclosing the surface of the specimen with plastic boards, ensuring that the top of the plastic board was level with the highest point of the bond interface. Then, a material with a known bulk density was poured onto the surface of the existing concrete, and the mass of the poured sand was measured to determine the average depth of sand pouring into the bond interface. According to references [17,55], after cleaning the residual bonding material on the interface of the existing concrete, the interface roughness was calculated using Equation (1). Here, m represents the mass of the sand used for pouring; A represents the area of the bond interface, which is 225 cm2; and ρ represents the bulk density of the pouring sand, measured in this experiment as 1.61 cm3. The calculated roughness values for Type I, II, and III interfaces are 0.15 mm, 1.15 mm, and 2.15 mm, respectively.
R o u g h n e s s = m A × ρ

2.2.3. Pouring of the EGC

The existing concrete part of the EGC–existing concrete bond specimens, after interface treatment, is placed in a 150 mm cubic plastic mold, leaving a symmetric gap of 25 mm on each side, as shown in Figure 4. The preparation process for EGC is as follows: Mixing is carried out using a planetary mortar mixer with dual-speed settings, with a low speed of 75 r/min and a high speed of 135 r/min. First, all dry materials (FA, GGBFS, QP, and BaCl2) are poured into the mixer and mixed at low speed for 2 min. After the dry materials are uniformly mixed, the alkaline activator solution and additional water are slowly added and mixing is continued at a low speed for 1 min, then at a high speed for 2 min. Finally, while maintaining low-speed mixing, PE fibers are evenly added within 3 min. After mixing, the freshly mixed EGC is poured into the molds for axial tensile tests and axial compression tests, as well as the molds containing the existing concrete cubes (using a tamper during the process to ensure even distribution of EGC over the bond interface). Then, the molds are placed onto a vibrating table to eliminate air bubbles. All specimens are covered with plastic wrap, demolded after curing in a laboratory indoor environment for 24 h, then placed in water to cure for 28 days before being dried, in preparation for testing.

3. Experimental Setup and Procedure

3.1. Axial Compressive Test for EGC

The setup and installation method for the axial compression test of EGC (Figure 5) are set according to ASTM-C469/C469M-22 [52]. Loading is performed using a universal testing machine with a displacement loading speed of 0.2 mm/min. To observe the compression deformation of EGC, two 50 mm long resistance strain gauges and linear displacement gauges are placed in the axial compression direction of the cylindrical specimens.

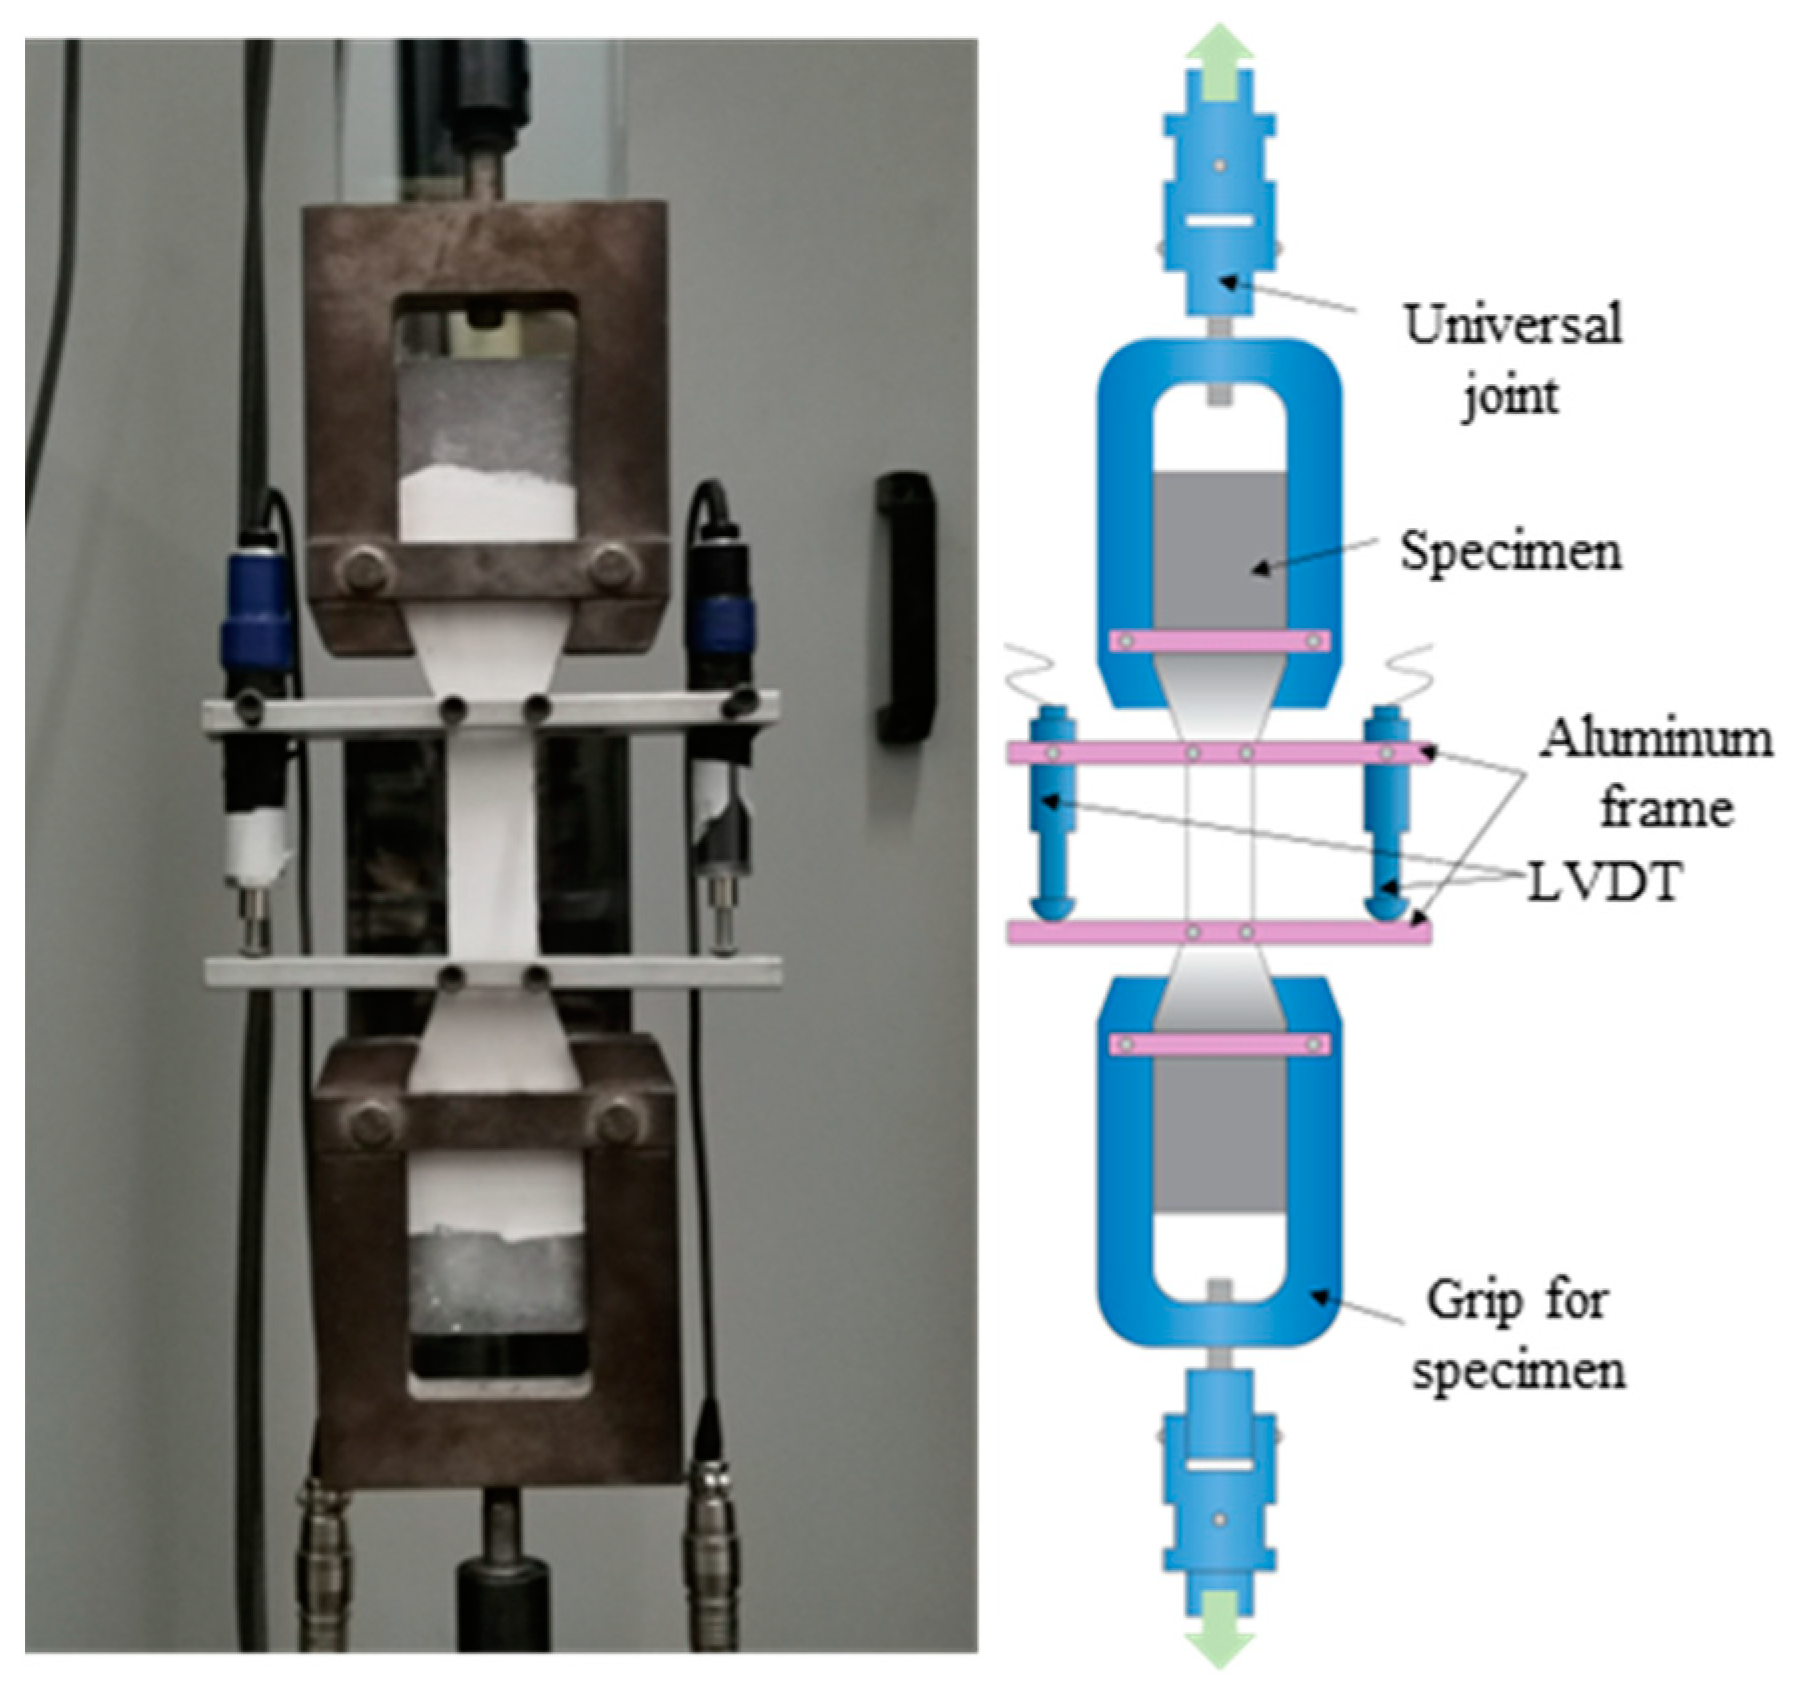
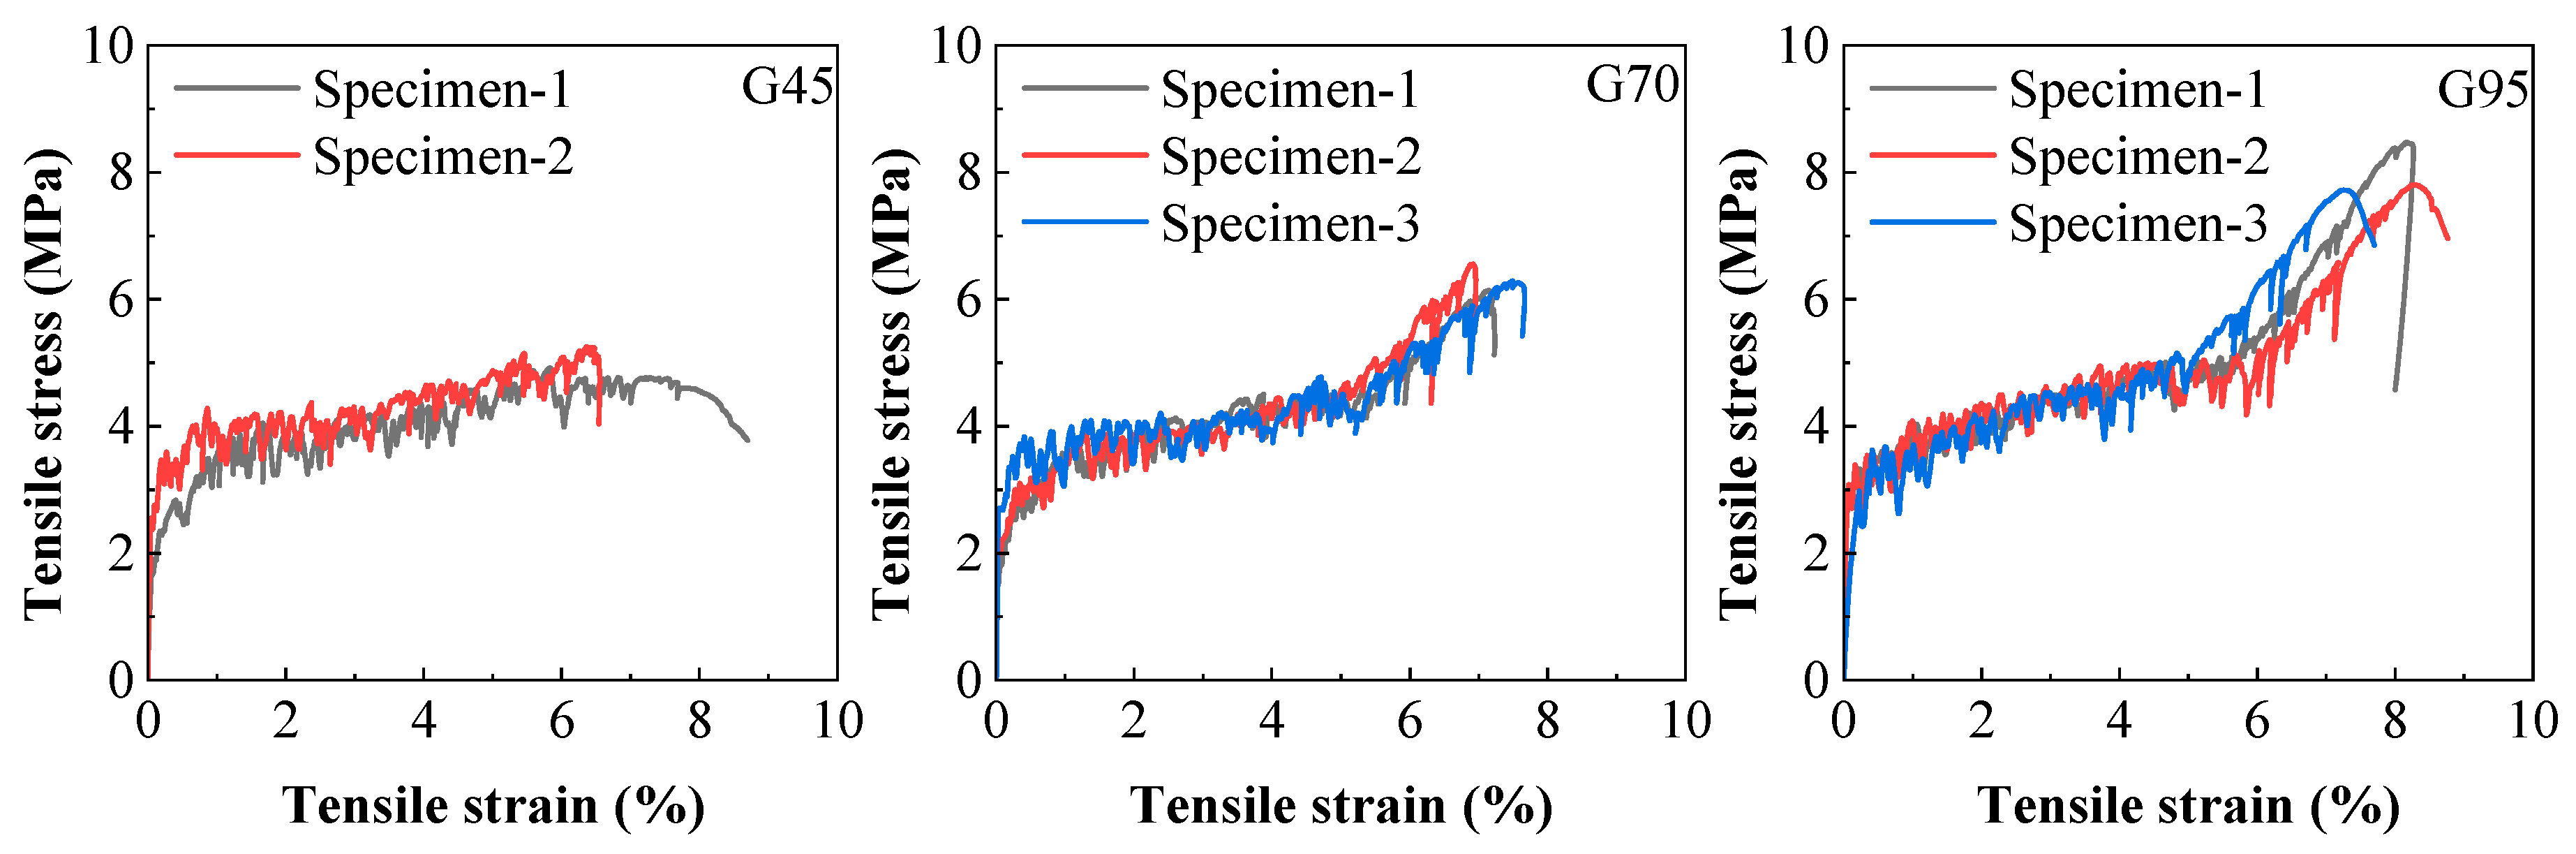
3.2. Axial Tensile Test for EGC

The setup and installation method for the axial tensile test of EGC (Figure 6) follow the guidelines of JSCE [53]. The test is conducted using a microcomputer-controlled electro-hydraulic servo universal testing machine at a displacement loading speed of 0.5 mm/min. Tensile deformation data from the central measuring area of the dumbbell-shaped specimens are collected using linear displacement gauges set on both sides of the specimens, with a collection frequency of 1 Hz.

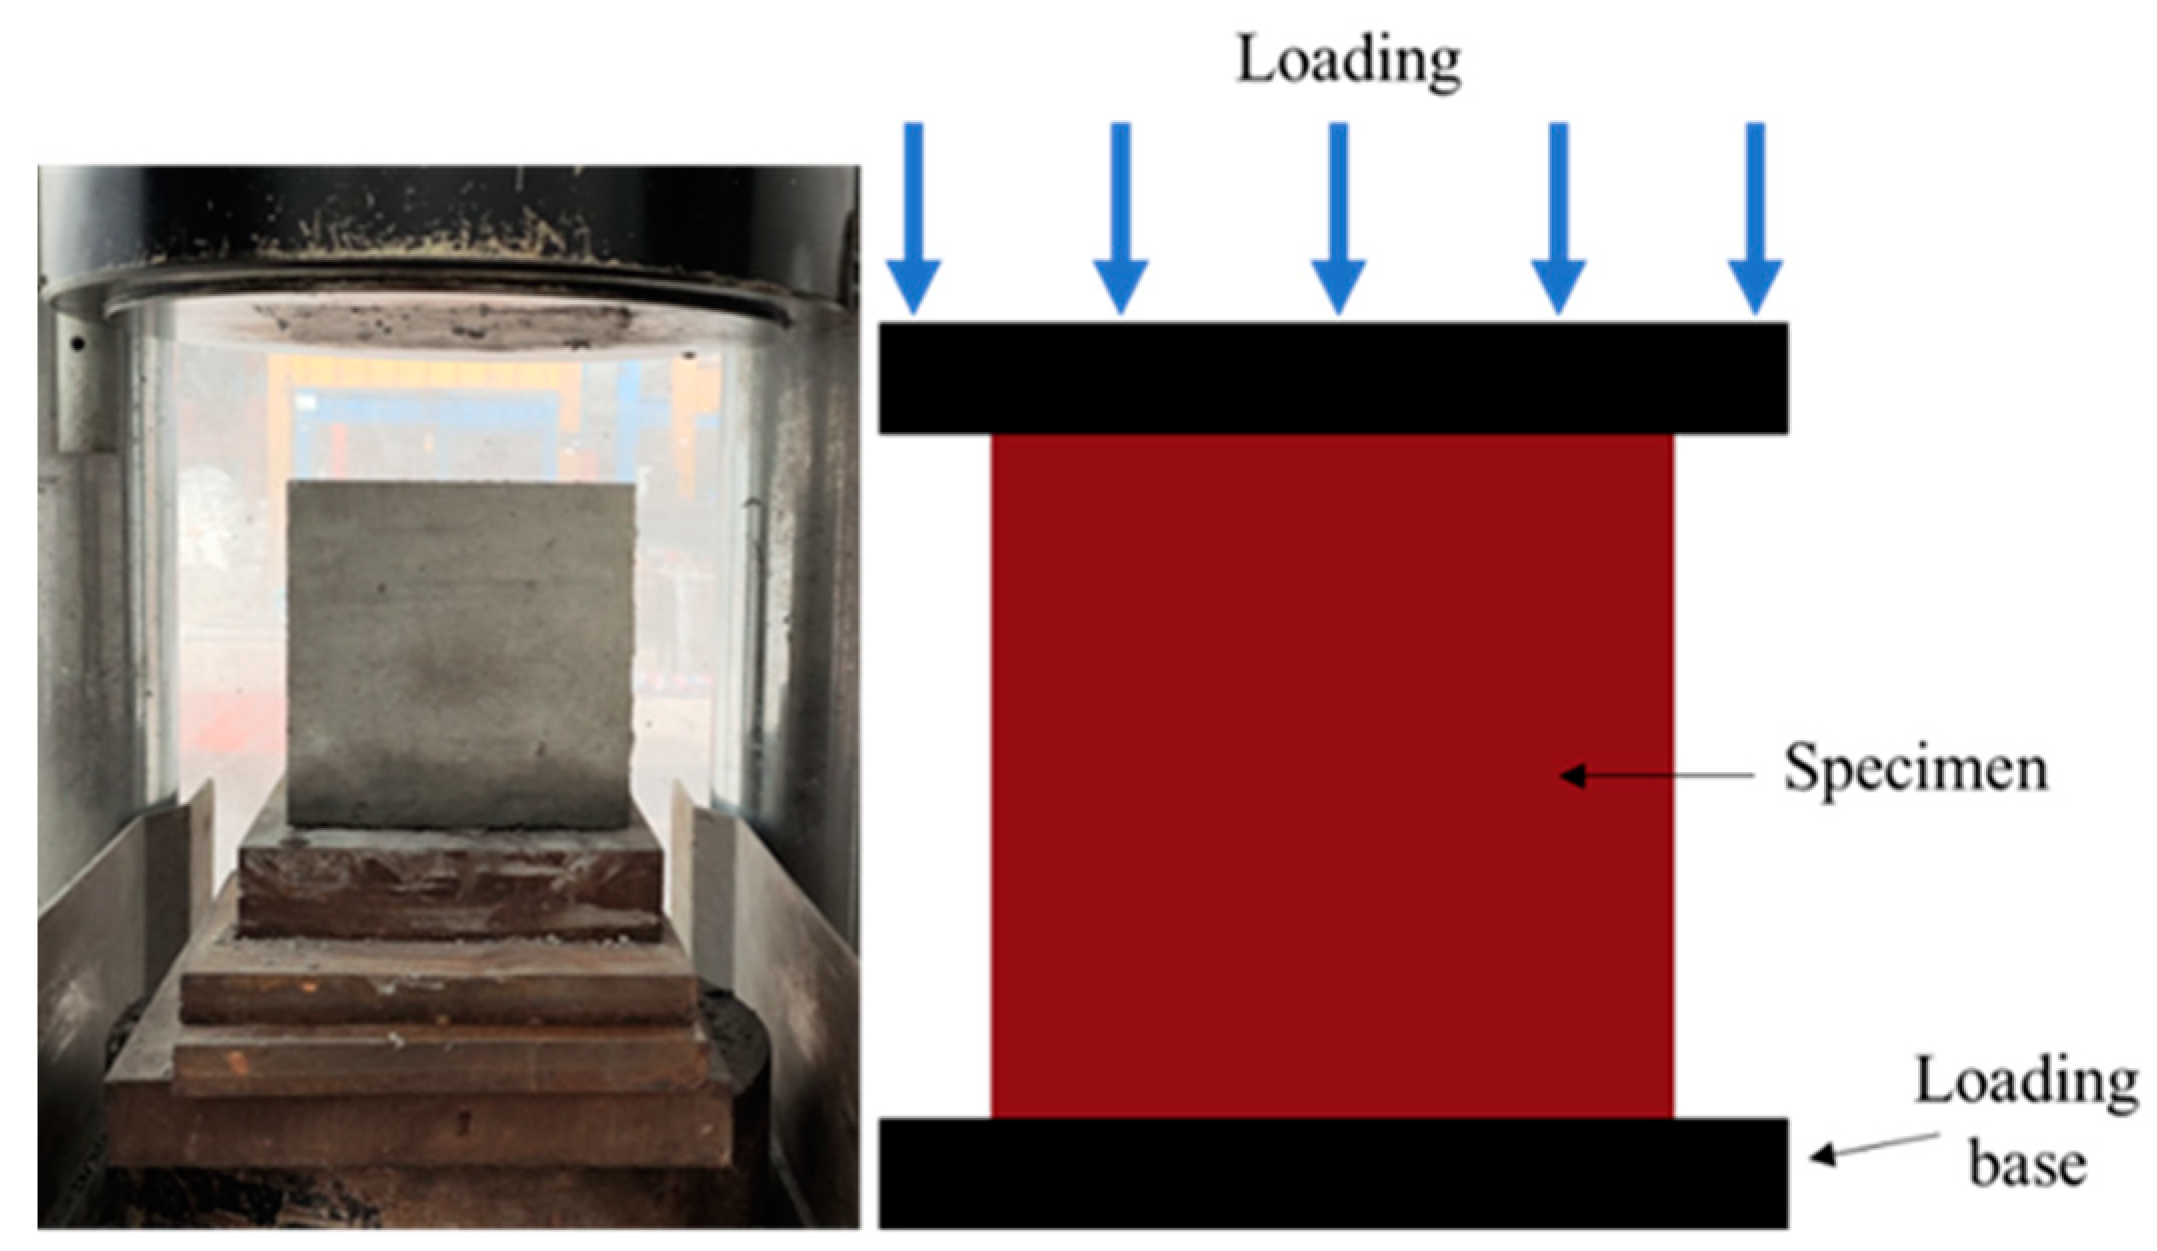
3.3. Axial Compressive Test for Existing Concrete

The setup and installation method for the axial compression test of existing concrete (Figure 7) are established according to JGJ 55-2011 [54]. The test is conducted using a universal testing machine with a force loading mode at a loading speed of 0.5 MPa/s. The compressive strengths of the three types of existing concrete are shown in Table 6.

3.4. Direct Shear Test of EGC-Existing Concrete Interface Bond Performance

The experimental setup and installation method for the direct shear bond performance test of the EGC–existing concrete interface are shown in Figure 8. A steel shim measuring 150 mm in length, 100 mm in width, and 20 mm in thickness was placed flat on the top surface of the existing concrete portion of the specimen. Two steel shims measuring 150 mm in length, 25 mm in width, and 20 mm in thickness were placed at the bottom of the EGC portion of the specimen to support it. Load was then applied to the rigid shim on the top of the specimen to generate shear force at the interface between the EGC and the existing concrete. Loading was carried out using a universal testing machine. According to references [56,57], the displacement loading speed was set at 0.2 mm/min. Linear displacement gauges were positioned on both sides of the specimen to collect slip values at the bond interface. The slip value at the bonding interface can reflect the improvement effect of EGC on the shear brittleness failure of the specimen.
After the specimen fails, we recorded the ultimate load Pu and calculated the interfacial bond strength of the specimen using Equation (2). In Equation (2), τ represents the interfacial bond strength of the specimen and Pu is the ultimate load at the bonded interface of the specimen.
τ = P u 2 A

4. Results and Discussion

4.1. Basic Mechanical Properties and Environmental Benefits of EGC

The basic mechanical parameters of EGC and the tensile stress–strain curve can be found in Table 7 and Figure 9, respectively. From Figure 7, it is evident that as the proportion of slag in the binder materials increases, the basic mechanical properties of EGC are significantly enhanced. Studies indicate that incorporating slag to replace fly ash in EGC can enhance material strength due to the higher CaO content and reactivity of slag compared to fly ash [58]. Moreover, CaO can promote the production of C-S-H/C-A-S-H gel during the hydrolysis and polymerization reactions of the binder materials, further improving the mechanical properties and microstructure of the geopolymers [59].
To further investigate the environmental benefits of EGC, an environmental assessment is conducted using the total CO2 emissions per unit volume of concrete (CO2-e). Additionally, for comparison, ECC with compressive strengths [60,61,62] similar to the three EGC types discussed in this study are selected to demonstrate the lower carbon footprint of EGC. The calculation of CO2-e is based on Equation (3) [63,64]:
C O 2 e = Q × E C × G W P
In the equation, Q represents the quantity of fuel consumed during production activities (kg), EC represents the energy content of the fuel (J/kg), and GWP represents the global warming potential parameter of the fuel (kg CO2-e/J). EC × GWP (kg CO2-e/kg) represents the CO2 emission index. Table 8 lists the carbon emission factors for each of the main raw materials.
Table 9 displays the total carbon emissions for the three types of EGC discussed in this paper and their corresponding ECC counterparts for comparison. From the data in Table 9, it can be seen that the total carbon emissions of EGC primarily originate from the production of the alkali activators, whereas the carbon emissions of ECC mainly stem from the production of cement. Under conditions of comparable compressive strength, the total carbon emissions produced from manufacturing EGC are significantly lower than those from producing ECC, with a reduction of up to 127%. Therefore, compared to ECC, using EGC as a reinforcing material in engineering applications offers superior environmental benefits.

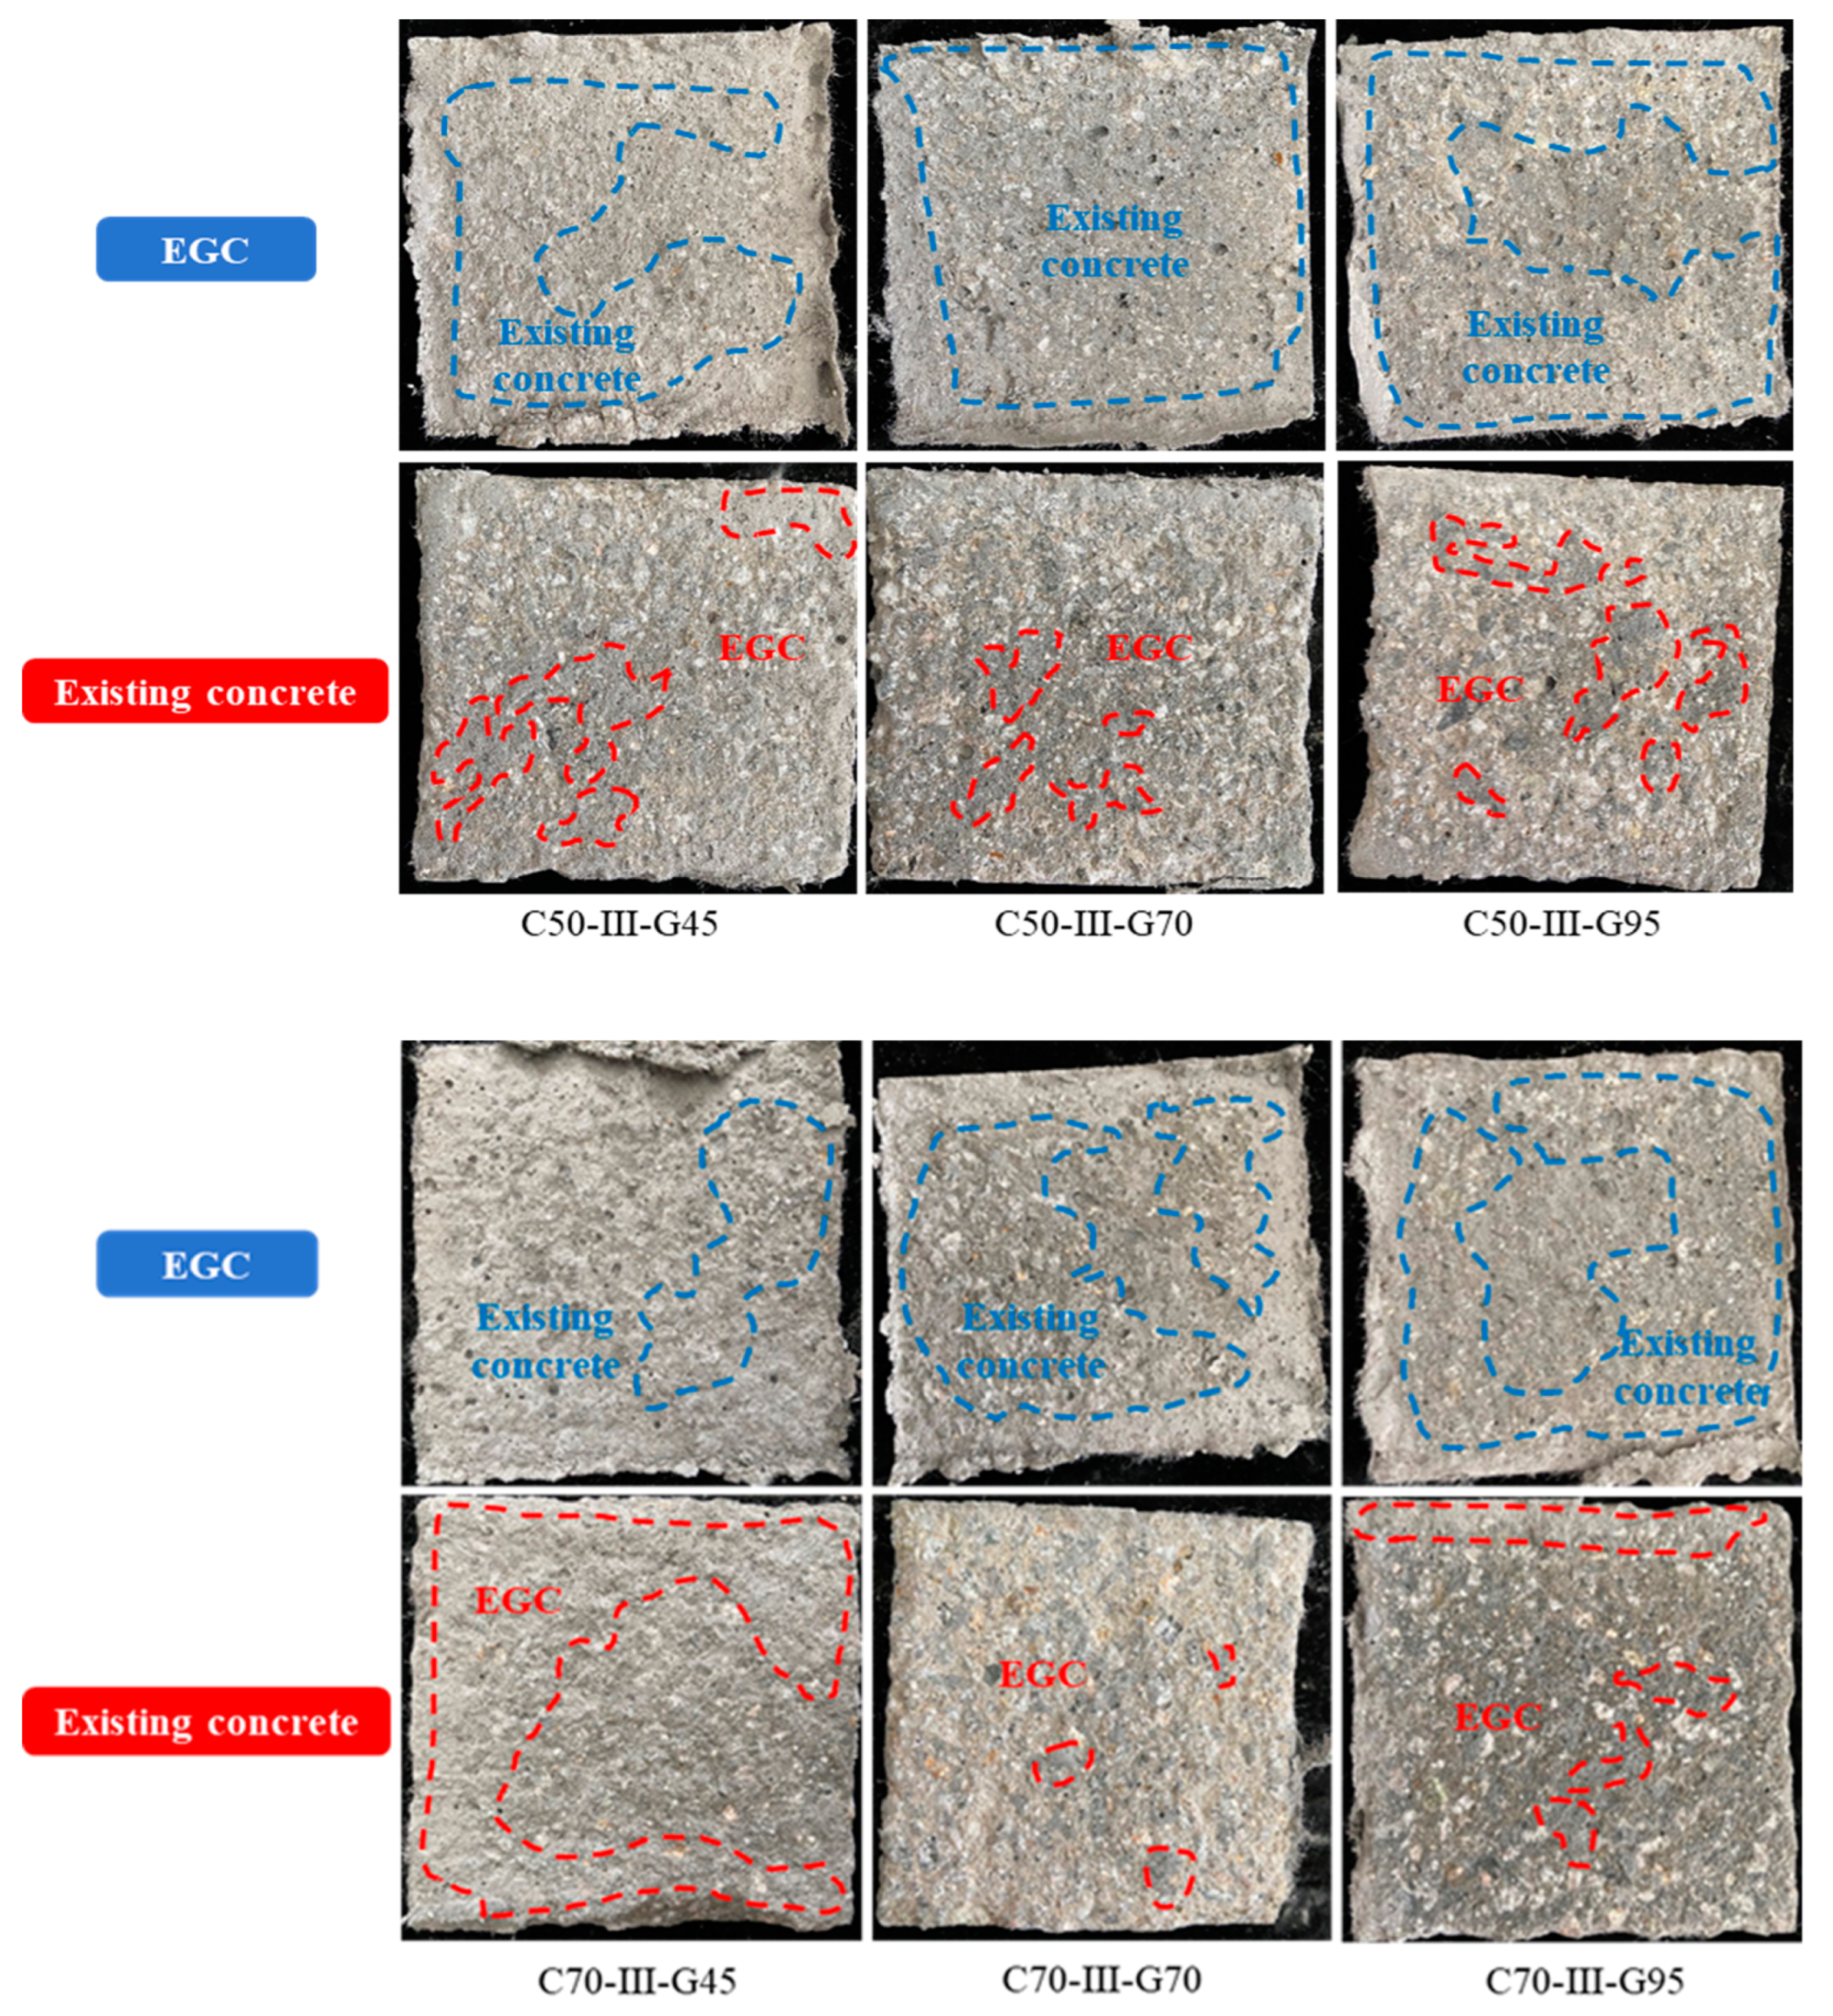
4.2. Failure Modes of Specimens in Interfacial Bond Direct Shear Test

The failure modes of the EGC–existing concrete bond specimens are shown in Figure 10. All specimens exhibit clear cracking when reaching the ultimate load Pu, followed by a sharp drop in load, displaying a quasi-brittle failure mode. However, due to the bridging action of fibers at the interface, the existing concrete and EGC do not immediately separate and peel off. Most specimens produce sounds of concrete cracking twice, which may be due to the heterogeneity of the concrete material causing different bond strengths at the interfaces on either side. Eventually, the bond interfaces on both sides of the specimen fail in succession.
Based on the location of the main cracks after specimen failure, the failure modes can be categorized into cohesive failure and adhesive failure. Within adhesive failure, there are two failure paths: serrated interfacial failure and alternating crack [66]. As shown in Figure 10, all specimens, except for C30-III-G95, exhibited adhesive failure. Jiang et al. [49] indicated that increasing the interface roughness enhanced the mechanical interlocking effect between the existing concrete and ECC. Additionally, the fiber bridging effect improved the shear performance of the specimens, and the excellent deformability of ECC prevented premature failure of the ECC section. Ultimately, the existing concrete section was sheared off, leading to the failure of the specimens. Specimen C30-III-G95 followed this pattern, with the lower strength of the existing concrete leading to cohesive failure. Although the other specimens all exhibited adhesive failure, changes in interface roughness affected their failure paths.
(1) With constant strengths of existing concrete and EGC, an increase in interface roughness changes the failure path. Specimens with type I interfaces exhibit serrated interfacial failure, while those with type II and III interfaces show alternating crack failure. This is because type I interface specimens undergo only slight roughening without removing the surface laitance of the existing concrete. The lower strength of the laitance layer causes the laitance and some concrete to be pulled out [35], forming serrated interfacial failure. In contrast, type II and III interface specimens had the surface laitance removed and a certain roughness created, leading to a better bonding interface between EGC and the existing concrete. This shifts the failure path to alternating crack, with both materials interlocking. Additionally, roughening introduces micro-cracks on the concrete surface, enhancing mechanical interlocking at the interface [38], resulting in the shearing of some coarse aggregate during failure. However, the transition from type II to type III interface does not significantly increase the amount of EGC remaining on the concrete part of the interface. (2) With constant existing concrete strength and interface roughness, increasing EGC strength results in more concrete being retained on the EGC part of the specimen after failure. (3) With constant interface roughness and EGC strength, increasing the strength of the existing concrete results in more EGC being retained on the concrete part of the specimen and less concrete on the EGC part.
During the experiment, the ultimate load Pu is recorded when the specimen fails, and the interfacial bond strength τ can be calculated using Equation (2). Table 10 summarizes the interfacial bond strengths and failure modes of the specimens. Data from Table 10 indicate that increases in the existing concrete strength, interface roughness, and EGC strength all positively affect the interfacial bond performance. Additionally, the standard deviation values of the bonding interface strength for all specimens are relatively small. This indicates that the specimen preparation method used in this study has repeatability. Furthermore, the significance of the three experimental variables was tested using the Bonferroni correction to analyze the data and ensure the reliability of the conclusions. Table 11 presents the results of the tests for main effects among the experimental variables. From Table 11, it is evident that all three experimental variables exhibit main effects. This indicates that different existing concrete strength, interface roughness, and EGC strength significantly affect the interface bond strength of the specimens. Therefore, the differences in the experimental results are due to the specific experimental treatments. However, the interaction terms of existing concrete strength * EGC strength and interface roughness * EGC strength have p > 0.05, indicating no statistical significance.

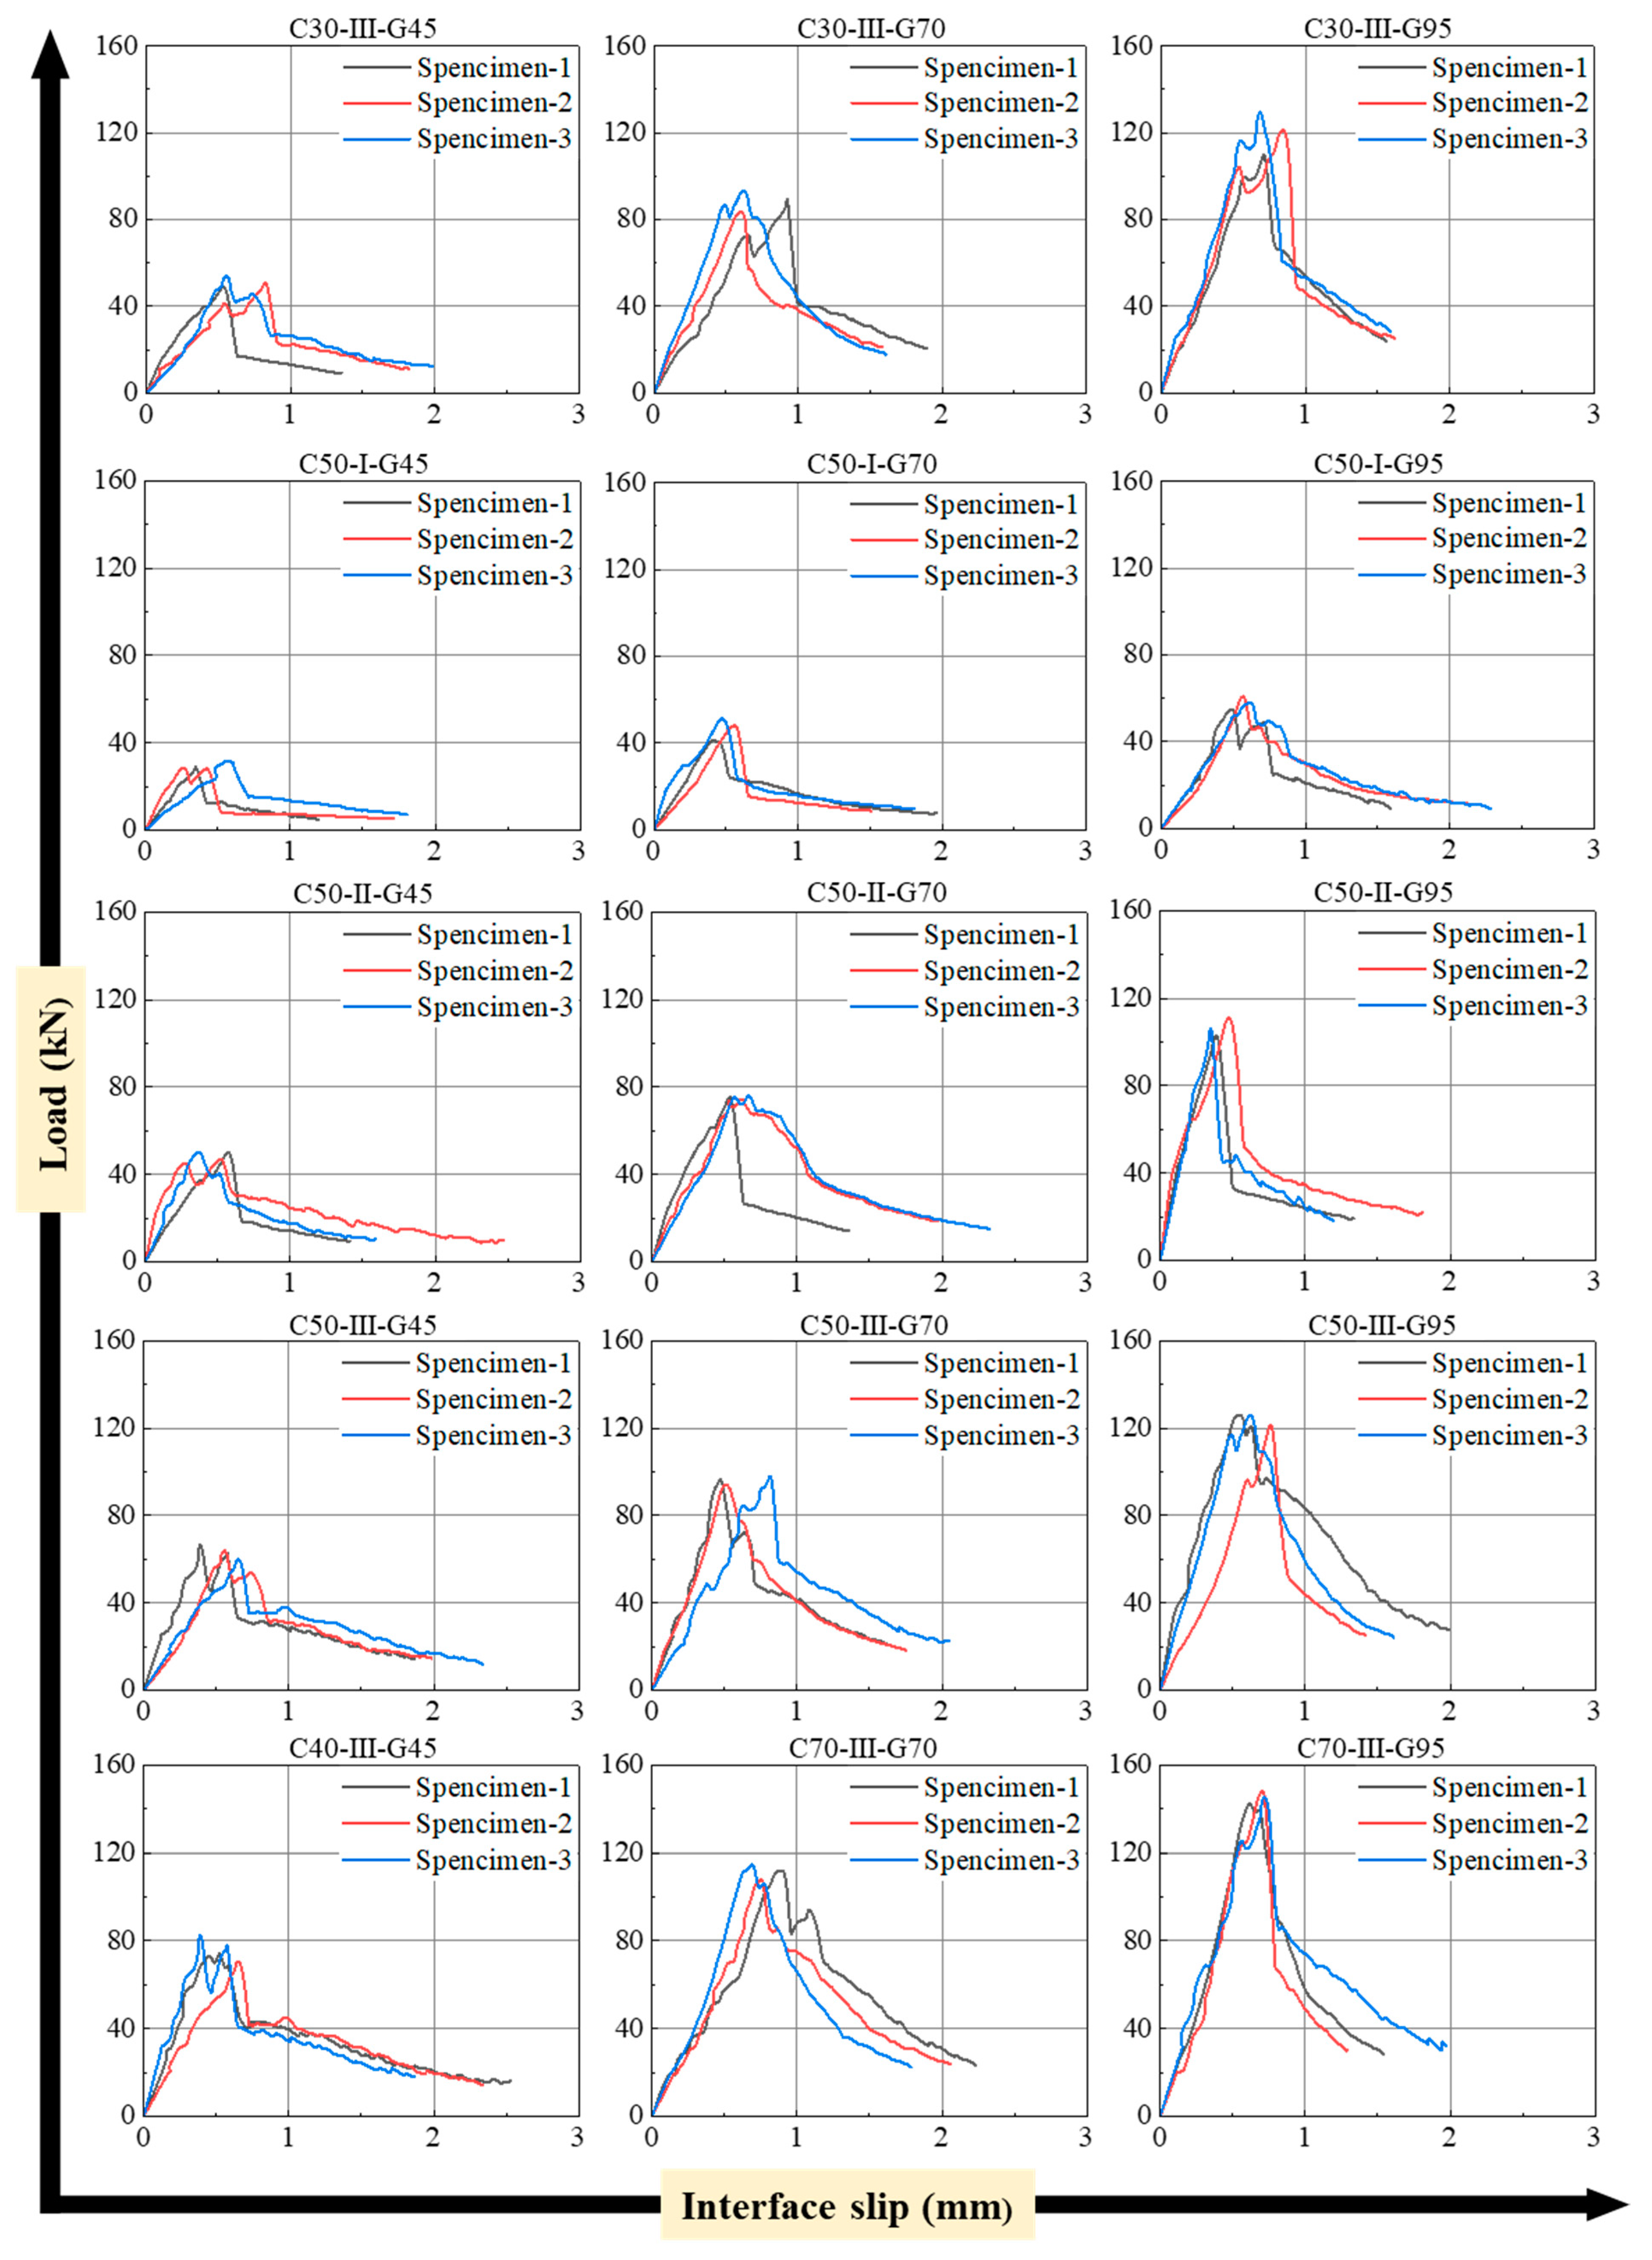
4.3. Load–Slip Curve of the Specimens

The load–slip curves of all specimen bond interfaces are shown in Figure 11. From Figure 11, it can be seen that before reaching the ultimate load Pu, the relationship between the load and interface slip is generally linear. After reaching the ultimate load Pu, the load drops sharply but does not drop to zero. Due to the bridging action of fibers at the interface, the load–slip curve exhibits a certain degree of ductility. Because of the inconsistency in bond strength on both sides of the specimens, some specimen load–slip curves show two peaks.

4.4. Analysis of Interfacial Bond Strength Parameters

4.4.1. Interface Roughness

The effect of interface roughness on the interface bond strength is shown in Figure 12. When the strength grade of the existing concrete is C50 and the strength grade of EGC is C45, the interface bond strengths of Type II and Type III interface specimens increase by 0.436 MPa and 0.786 MPa, respectively, compared to an interface bond strength of 0.674 MPa for Type I interface specimens. The increase in interface roughness has a significant impact on the development of interface bond strength. Additionally, as seen in Figure 12, when the strength of the existing concrete and EGC remains constant, the interface bond strength increases with increasing interface roughness. This is because increasing the interface roughness is equivalent to increasing the bonding surface area while also enhancing the mechanical interlocking at the bond interface [67].

4.4.2. Existing Concrete Strength Grade

The effect of existing concrete strength grade on interface bond strength is shown in Figure 13. When the strength grade of EGC is G45, and the interface type is Type III, compared to an interface bond strength of 1.18 MPa for specimens with existing concrete strength grade C30, the interface bond strengths for specimens with existing concrete strength grades C50 and C70 increase by 23.1% and 32.1%, respectively. According to data from Table 8, the bond strength at the interface increases with the increase in the strength of the existing concrete when the interface roughness and EGC strength remain constant. This is because, in high-strength concrete, the adhesion between cement paste and aggregates is higher than in lower-strength concrete, making it less likely for aggregates to be pulled out along with the EGC overlay, thereby enhancing the bond strength at the interface [44]. Additionally, high-strength concrete can form a more robust bond at the interface with microcracks created during pneumatic chiseling of the overlay [38]. However, combining data from Table 8 and the analysis of Figure 11, the increase in the strength of existing concrete does not significantly enhance the bond strength at the interface.

4.4.3. EGC Strength Grade

The influence of EGC strength grade on interface bond strength is illustrated in Figure 12 and Figure 13. As shown in Figure 10, for specimens with interface Type I and existing concrete strength grade C50, compared to an interface bond strength of 0.674 MPa for specimens with EGC strength grade G45, the interface bond strength increased by 0.396 MPa and 0.636 MPa for specimens with EGC strength grades G70 and G95, respectively. Additionally, Figure 12 illustrates that for specimens with existing concrete strength grade C30 and interface Type III, compared to an interface bond strength of 1.18 MPa for specimens with EGC strength grade G45, the interface bond strength increased by 70.0% and 120% for specimens with EGC strength grades G70 and G95, respectively. It can be observed that the interface bond strength increases with increasing EGC strength. Eduardo et al. [40] suggest that for a given shear stress, the use of higher-strength reinforcement materials generates higher normal stresses at the interface, thereby enhancing the interface bond strength.
Furthermore, with the existing concrete strength and EGC strength held constant, the increase in bond strength varies with different levels of interface roughness. As the interface roughness increases, the bond strength enhancement is more significant when using high-strength EGC as the reinforcement layer. For instance, the bond strength of specimen C50-III-G95 is 354% higher compared to that of specimen C50-I-G45. This is because increased interface roughness maximizes the mechanical interlocking and friction between the high-strength EGC and the existing concrete. Therefore, when the strength of the existing concrete remains constant, the simultaneous increase in EGC strength and interface roughness contributes more significantly to the enhancement of bond strength at the interface.

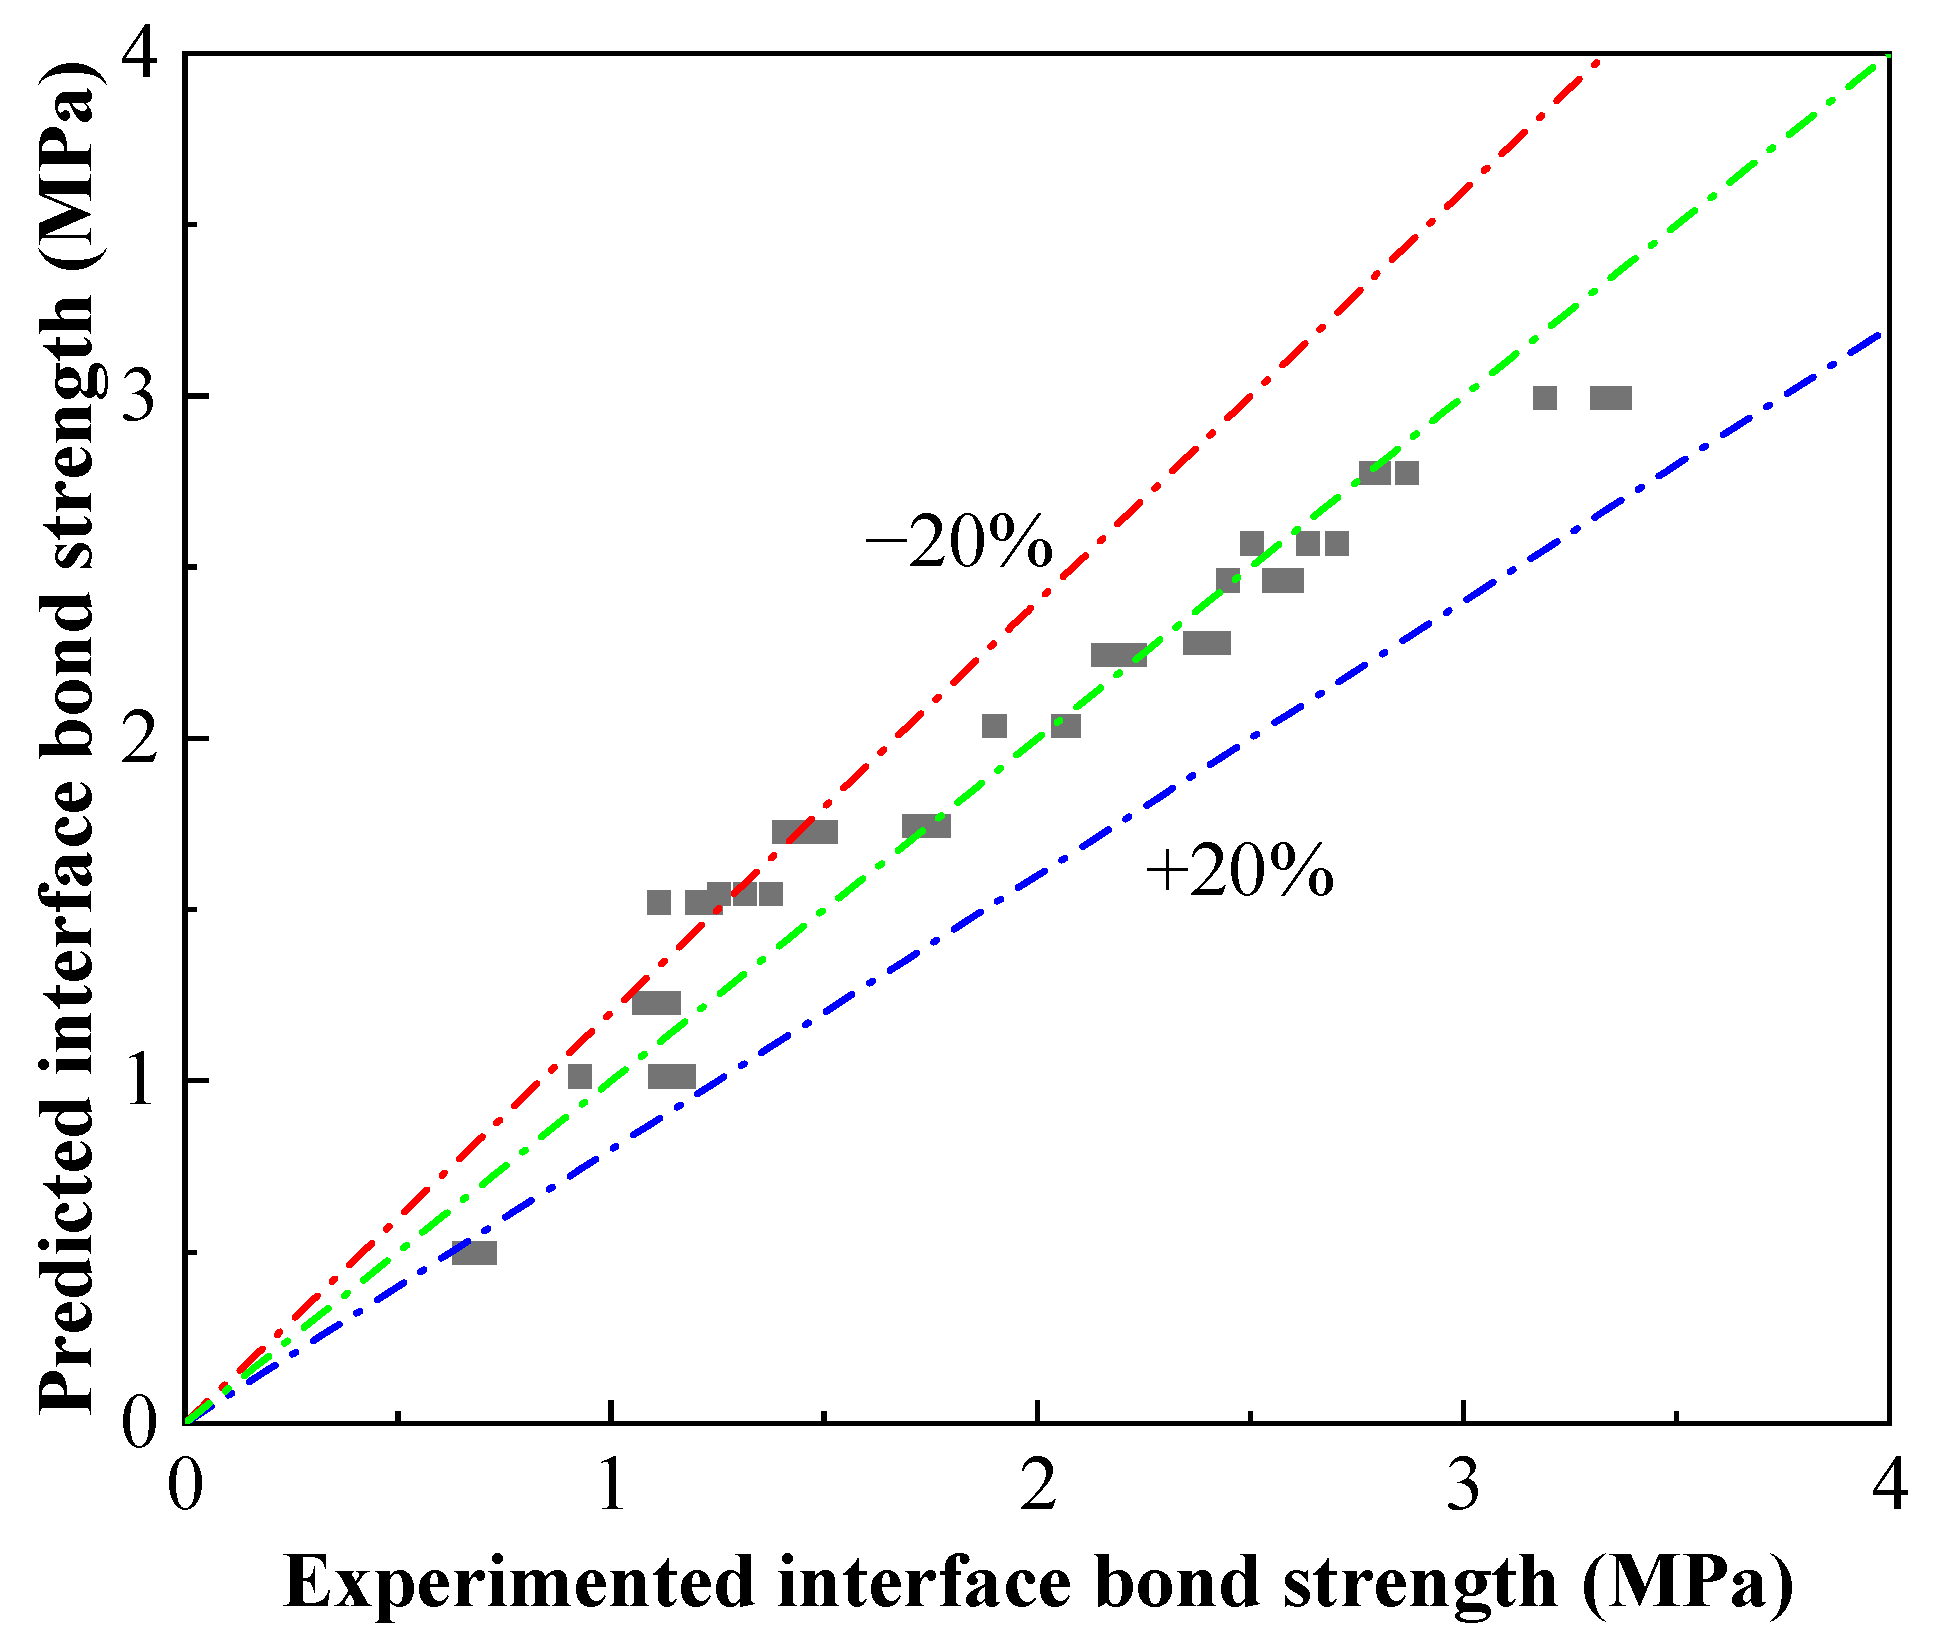
4.5. Modeling of Interfacial Bond Strength between EGC and Existing Concrete

Based on the results of bilateral direct shear bond tests and the mechanism of direct shear force bonding, this paper establishes a direct shear bond mechanical model by conducting elasto-plastic analysis and incorporating the Mohr–Coulomb theory. This model correlates interface roughness, existing concrete strength, and EGC strength to predict the interface bond strength.
According to a relevant reference [68], the interface bond strength τ can be predicted using the following Equation (4):
τ = 3 3 σ s 1 + σ s 2 β 1 + β + τ s 0 1 β 1 + β
Here, σs1 and σs2 represent the uniaxial compressive strengths of the existing concrete and EGC, respectively. τ s 0 is the shear stress on the velocity discontinuity surface, and β is a velocity reduction coefficient ranging from 0 to less than 1.
By combining the Mohr–Coulomb strength theory and simplifying the calculations, the Mohr stress circle envelope can be approximated as a straight line, resulting in the following equation:
τ s 0 = 1 2 σ 1 σ 2 cos φ
In the equation, σ1 represents the tensile stress at the bond interface, σ2 represents the compressive stress at the bond interface, and φ is the internal angle of friction.
The stress at the bond interface is determined by the weaker material. In this experiment, the strength of the existing concrete is close to or less than that of EGC, and the bush hammering of the interface induces microcracks in the concrete, reducing its strength. This corresponds to the experimental observation that most of the concrete at the bond interface is pulled out. Therefore, σ1 can be represented by the tensile strength of concrete, and σ2 can be represented by the compressive strength of concrete, with the relationship between concrete’s tensile strength σ1 and compressive strength σ2 as follows [69]:
σ 1 = 0.3 σ 2 2 / 3
The tangent of the friction angle φ is the coefficient of friction. Therefore, the friction angle φ can be regarded as a parameter reflecting the interface roughness. And cos φ can be expressed by the function f(H), where H is a variable. From Equations (5) and (6), it follows that:
τ s 0 = 1 2 0.3 σ 2 2 / 3 σ 2 f H
Combining Equations (4) and (7), the interface bond strength τ can be expressed as follows:
τ = 3 3 σ s 1 + σ s 2 β 1 + β + 1 2 0.3 σ s 2 2 / 3 σ s 2 f H 1 β 1 + β
Here, a quadratic function is used to model the impact of interface roughness H on interface bond strength. Letting f H = c H 2 + d H + e , a = 3 β 3 1 + β , b = 1 β 1 + β , and substituting into Equation (8), we obtain:
τ = a σ s 1 + σ s 2 + 1 2 b 0.3 σ s 2 2 / 3 σ s 2 c H 2 + d H + e
The fitting of the experimental data from this study results in the following:
τ = 0.02269 σ s 1 + σ s 2 + 0.34716 2 0.3 σ s 2 2 / 3 σ s 2 0.01325 H 2 0.10062 H + 0.22786 , R 2 = 0.94
The comparison of predicted values from the direct shear bond mechanics model for EGC and existing concrete against experimental values is shown in Figure 14 and Table 12. From Table 12, it can be seen that when the EGC strength is lower, there is a larger discrepancy between the predicted values from the bond mechanics model and the experimental values. This is because the derivation of the mechanical model assumes that the strength of the existing concrete is less than or equal to the strength of EGC. However, the data error for most groups is within 20%, indicating that the bond mechanical model derived in this study shows good consistency between the predicted and experimental values.
Additionally, the applicability of the proposed bond mechanics model needs to be verified using experimental data from existing relevant literature. The validation results of the bond mechanics model’s applicability are shown in Figure 15 and Table 13. As can be seen in Figure 15, some validation data exhibit a significant error (>30%) compared to the predicted values of the bond mechanics model. By analyzing the reasons for the large prediction errors combined with the post-cast material parameters provided in Table 13, it can be observed that: on the one hand, the strength of the post-cast material is lower than the strength of the existing concrete, violating the assumption premise of the bond mechanics model; on the other hand, the interface form of the existing concrete in this study is a chiseled interface, whereas the interface forms of samples numbered 6, 7, and 11 are grooved interfaces, which significantly increase the bond area and thereby the bond strength. In summary, when the strength of the post-cast material is greater than the strength of the existing concrete and the interface form of the existing concrete is a chiseled interface, the bond mechanics model’s prediction accuracy is high. Therefore, the bond mechanics model proposed in this paper can be used to predict the bond strength of the interface between existing concrete and post-cast material under direct shear conditions and can serve as a reference for engineering design.

5. Conclusions

This study conducted direct shear tests on EGC–existing concrete bond specimens, altering the strength of existing concrete, interface roughness, and EGC strength. It examined how these variables affect failure modes and interface bond strength, resulting in a shear bond mechanics model with minimal prediction errors. The study also analyzed how varying fly ash and slag ratios of EGC impact its mechanical properties. Based on the findings, the following conclusions and future outlooks are presented:
(1)
Increasing the slag proportion in EGC enhances its microstructure, improving the compressive and tensile properties. Additionally, EGC production results in up to 127% lower carbon emissions compared to ECC.
(2)
Adhesive failure was the primary mode observed. The fiber bridging effect at the interface prevented immediate separation of the existing concrete and EGC, reducing brittleness. Higher interface roughness altered the failure path and increased the bond surface area, enhancing mechanical interlocking.
(3)
Within certain limits, interface bond strength increased with greater interface roughness, existing concrete strength, and EGC strength. Interface roughness and EGC strength had significant impacts, while existing concrete strength had a lesser, but still positive, effect.
(4)
A direct shear bond mechanical model was developed, correlating existing concrete strength, interface roughness, and EGC strength. Validation showed the model is applicable when the post-cast material is stronger than the existing concrete and when the concrete interface is chiseled. Prediction errors were generally within 30%. This study used fly ash and slag, activated with sodium hydroxide and sodium silicate, to make EGC. Future research should test other precursors and activation systems for EGC and concrete interfaces.
(5)
This study focused on interface roughness, existing concrete strength, and EGC strength, without considering interface moisture content or bonding agents. Other factors like curing conditions, interface treatment, and environmental exposure also affect bond performance. Adverse conditions like wet–dry cycles, seawater erosion, and freeze–thaw cycles also deserve to be explored for their potential impact.

Author Contributions

Methodology, writing—original draft, Z.L.; formal analysis, writing—review and editing, J.T.; software, J.O.; visualization, Y.Y.; conceptualization, S.L.; data curation, T.L.; investigation, visualization, R.L.; resources, supervision, W.L. All authors have read and agreed to the published version of the manuscript.

Funding

This research was supported by the Foshan Nanhai Power Supply Bureau, Guangdong Power Grid Co., Ltd., China Southern Power Grid Co., Ltd., as well as the Foshan Chancheng Power Supply Bureau, Guangdong Power Grid Co., Ltd., China Southern Power Grid Co., Ltd., grant number 0301002023030103XG00073.

Data Availability Statement

The data presented in this study are available upon request from the corresponding author. The data are not publicly available due to confidentiality issues.

Conflicts of Interest

The authors Zhibin Li, Jiaqi Tan, Ji Ouyang, and Yongxin Yu were employed by the Foshan Nanhai Power Supply Bureau, Guangdong Power Grid Co., Ltd., China Southern Power Grid Co., Ltd. The author Shibin Li was employed by the Foshan Chancheng Power Supply Bureau, Guangdong Power Grid Co., Ltd., China Southern Power Grid Co., Ltd. The remaining authors declare that the research was conducted in the absence of any commercial or financial relationships that could be construed as potential conflicts of interest. The authors declare that this research received supporting from the Foshan Nanhai Power Supply Bureau, Guangdong Power Grid Co., Ltd., China Southern Power Grid Co., Ltd., as well as the Foshan Chancheng Power Supply Bureau, Guangdong Power Grid Co., Ltd., China Southern Power Grid Co., Ltd. The funders were not involved in the study design; the collection, analysis, or interpretation of the data; the writing of this article; or the decision to submit it for publication.

References

  1. Wu, L.; Farzadnia, N.; Shi, C.; Zhang, Z.; Wang, H. Autogenous shrinkage of high performance concrete: A review. Constr. Build. Mater. 2017, 149, 62–75. [Google Scholar] [CrossRef]
  2. Aggelis, D.G. Classification of cracking mode in concrete by acoustic emission parameters. Mech. Res. Commun. 2011, 38, 153–157. [Google Scholar] [CrossRef]
  3. Khan, I.; Xu, T.; Castel, A.; Gilbert, R.I. Early-age tensile creep and shrinkage induce cracking in internally restrained concrete members. Mag. Concr. Res. 2018, 71, 1167–1179. [Google Scholar] [CrossRef]
  4. Tennakoon, C.; Shayan, A.; Sanjayan, J.G.; Xu, A. Chloride ingress and steel corrosion in geopolymer concrete based on long term tests. Mater. Des. 2017, 116, 287–299. [Google Scholar] [CrossRef]
  5. Grengg, C.; Müller, B.; Staudinger, C.; Mittermayr, F.; Breininger, J.; Ungerböck, B.; Borisov, S.M.; Mayr, T.; Dietzel, M. High-resolution optical pH imaging of concrete exposed to chemically corrosive environments. Cem. Concr. Res. 2019, 116, 231–237. [Google Scholar] [CrossRef]
  6. Shaheen, F.; Pradhan, B. Influence of sulfate ion and associated cation type on steel reinforcement corrosion in concrete powder aqueous solution in the presence of chloride ions. Cem. Concr. Res. 2017, 91, 73–86. [Google Scholar] [CrossRef]
  7. Fu, C.; Ye, H.; Jin, X.; Yan, D.; Jin, N.; Peng, Z. Chloride penetration into concrete damaged by uniaxial tensile fatigue loading. Constr. Build. Mater. 2016, 125, 714–723. [Google Scholar] [CrossRef]
  8. Huang, Y.; Ye, H.; Fu, C.; Jin, N. Modeling moisture transport at the surface layer of fatigue-damaged concrete. Constr. Build. Mater. 2017, 151, 196–207. [Google Scholar] [CrossRef]
  9. Zhao, Y.; Yu, M.; Xiang, Y.; Kong, F.; Li, L. A sustainability comparison between green concretes and traditional concrete using an emergy ternary diagram. J. Clean Prod. 2020, 256, 120421. [Google Scholar] [CrossRef]
  10. Ekolu, S.O. Implications of global CO2 emissions on natural carbonation and service lifespan of concrete infrastructures—Reliability analysis. Cem. Concr. Compos. 2020, 114, 103744. [Google Scholar] [CrossRef]
  11. Su, J.; Luo, R.; Chen, Z.; Lin, J.; Huang, P.; Guo, Y. Experimental study on the fracture performance of rubberized high strength-high ductility concrete with j-integral method. Constr. Build. Mater. 2024, 421, 135668. [Google Scholar] [CrossRef]
  12. Liu, H.; Zhang, Q.; Gu, C.; Su, H.; Li, V.C. Influence of micro-cracking on the permeability of engineered cementitious composites. Cem. Concr. Compos. 2016, 72, 104–113. [Google Scholar] [CrossRef]
  13. Lu, C.; Leung, C.K.; Li, V.C. Numerical model on the stress field and multiple cracking behavior of engineered cementitious composites (ECC). Constr. Build. Mater. 2017, 133, 118–127. [Google Scholar] [CrossRef]
  14. Lin, J.; Song, Y.; Xie, Z.; Guo, Y.; Yuan, B.; Zeng, J.; Wei, X. Static and dynamic mechanical behavior of engineered cementitious composites with PP and PVA fibers. J. Build. Eng. 2020, 29, 101097. [Google Scholar] [CrossRef]
  15. Ahmed, S.F.U.; Maalej, M. Tensile strain hardening behaviour of hybrid steel-polyethylene fibre reinforced cementitious composites. Constr. Build. Mater. 2009, 23, 96–106. [Google Scholar] [CrossRef]
  16. Lu, C.; Leung, C.K.Y. Theoretical evaluation of fiber orientation and its effects on mechanical properties in engineered cementitious composites (ECC) with various thicknesses. Cem. Concr. Res. 2017, 95, 240–246. [Google Scholar] [CrossRef]
  17. Teng, X.; Lu, C.; Li, C.; Chen, Z. Investigation on shear mechanical behavior of the interface between sulphoaluminate cement (SAC)-ECC and existing concrete. Constr. Build. Mater. 2023, 403, 133184. [Google Scholar] [CrossRef]
  18. Hou, M.; Hu, K.; Yu, J.; Dong, S.; Xu, S. Experimental study on ultra-high ductility cementitious composites applied to link slabs for jointless bridge decks. Compos. Struct. 2018, 204, 167–177. [Google Scholar] [CrossRef]
  19. Zheng, Y.; Zhang, L.F.; Xia, L.P. Investigation of the behaviour of flexible and ductile ECC link slab reinforced with FRP. Constr. Build. Mater. 2018, 166, 694–711. [Google Scholar] [CrossRef]
  20. Li, V.C. Tailoring ECC for special attributes: A review. Int. J. Concr. Struct. Mater. 2012, 6, 135–144. [Google Scholar] [CrossRef]
  21. Wang, S.; Li, V. Engineered cementitious composites with high-volume fly ash. ACI Mater. J. 2007, 104, 233–241. [Google Scholar] [CrossRef]
  22. Manjunatha, M.; Seth, D.; Kvgd, B.; Roy, S.; Tangadagi, R.B. Utilization of industrial-based pvc waste powder in self-compacting concrete: A sustainable building material. J. Clean Prod. 2023, 428, 139428. [Google Scholar] [CrossRef]
  23. Guo, X.; Liu, X.; Yuan, S. Effects of initial damage on self-healing of fly ash-based engineered geopolymer composites (FA-EGC). J. Build. Eng. 2023, 74, 106901. [Google Scholar] [CrossRef]
  24. Wang, F.; Ma, J.; Ding, Y.; Yu, J.; Yu, K. Engineered geopolymer composite (EGC) with ultra-low fiber content of 0.2%. Constr. Build. Mater. 2024, 411, 134626. [Google Scholar] [CrossRef]
  25. Lin, J.; Liu, R.; Liu, L.; Zhuo, K.; Chen, Z.; Guo, Y. High-strength and high-toughness alkali-activated composite materials: Optimizing mechanical properties through synergistic utilization of steel slag, ground granulated blast furnace slag, and fly ash. Constr. Build. Mater. 2024, 422, 135811. [Google Scholar] [CrossRef]
  26. Lao, J.; Huang, B.; Xu, L.; Khan, M.; Fang, Y.; Dai, J. Seawater sea-sand engineered geopolymer composites (EGC) with high strength and high ductility. Cem. Concr. Compos. 2023, 138, 104998. [Google Scholar] [CrossRef]
  27. Peng, Y.; Zheng, D.; Pan, H.; Yang, J.; Lin, J.; Lai, H.; Wu, P.-Z.; Zhu, H.-Y. Strain hardening geopolymer composites with hybrid pom and UHMWPE fibers: Analysis of static mechanical properties, economic benefits, and environmental impact. J. Build. Eng. 2023, 76, 107315. [Google Scholar] [CrossRef]
  28. Zhang, Z.; Yu, J.; Qin, F.; Sun, F. Thermal effect on mechanical properties of metakaolin-based engineered geopolymer composites (EGC). Case Stud. Constr. Mater. 2023, 18, e02150. [Google Scholar] [CrossRef]
  29. Juenger, M.C.G.; Winnefeld, F.; Provis, J.L.; Ideker, J.H. Advances in alternative cementitious binders. Cem. Concr. Res. 2011, 41, 1232–1243. [Google Scholar] [CrossRef]
  30. Shi, C.; Jiménez, A.F.; Palomo, A. New cements for the 21st century: The pursuit of an alternative to portland cement. Cem. Concr. Res. 2011, 41, 750–763. [Google Scholar] [CrossRef]
  31. Bakharev, T. Durability of geopolymer materials in sodium and magnesium sulfate solutions. Cem. Concr. Res. 2005, 35, 1233–1246. [Google Scholar] [CrossRef]
  32. Rostami, M.; Behfarnia, K. The effect of silica fume on durability of alkali activated slag concrete. Constr. Build. Mater. 2017, 134, 262–268. [Google Scholar] [CrossRef]
  33. Haruna, S.; Mohammed, B.; Wahab, M.M.A. Effect of GGBS slag on setting time and compressive strength of one-part geopolymer binders. J. Infrastruct. Facil. Asset Manag. 2020, 2, 149–160. [Google Scholar] [CrossRef]
  34. Lemougna, P.N.; Nzeukou, A.; Aziwo, B.; Tchamba, A.B.; Wang, K.; Melo, U.C.; Cui, X.-M. Effect of slag on the improvement of setting time and compressive strength of low reactive volcanic ash geopolymers synthetized at room temperature. Mater. Chem. Phys. 2020, 239, 122077. [Google Scholar] [CrossRef]
  35. He, Y.; Zhang, X.; Hooton, R.D.; Zhang, X. Effects of interface roughness and interface adhesion on new-to-old concrete bonding. Constr. Build. Mater. 2017, 151, 582–590. [Google Scholar] [CrossRef]
  36. Zhong, S.; Hu, X.; Yang, B.; Peng, G. Bond performance between cementitious grout and normal concrete subjected to freeze–thaw damage. Constr. Build. Mater. 2023, 405, 133344. [Google Scholar] [CrossRef]
  37. Shah, S.; Kishen, J.M. Fracture properties of concrete–concrete interfaces using digital image correlation. Exp. Mech. 2011, 51, 303–313. [Google Scholar] [CrossRef]
  38. Courard, L.; Piotrowski, T.; Garbacz, A. Near-to-surface properties affecting bond strength in concrete repair. Cem. Concr. Compos. 2014, 46, 73–80. [Google Scholar] [CrossRef]
  39. Júlio, E.N.B.S.; Branco, F.A.B.; Silva, V.D. Concrete-to-concrete bond strength. Influence of the roughness of the substrate surface. Constr. Build. Mater. 2004, 18, 675–681. [Google Scholar] [CrossRef]
  40. Júlio, E.N.B.S.; Branco, F.A.B.; Silva, V.D.; Lourenço, J.F. Influence of added concrete compressive strength on adhesion to an existing concrete substrate. Build. Environ. 2006, 41, 1934–1939. [Google Scholar] [CrossRef]
  41. Zhang, Y.; Zhu, P.; Liao, Z.; Wang, L. Interfacial bond properties between normal strength concrete substrate and ultra-high performance concrete as a repair material. Constr. Build. Mater. 2020, 235, 117431. [Google Scholar] [CrossRef]
  42. Kumar, S.; Sekhar Das, C.; Lao, J.; Alrefaei, Y.; Dai, J. Effect of sand content on bond performance of engineered geopolymer composites (EGC) repair material. Constr. Build. Mater. 2022, 328, 127080. [Google Scholar] [CrossRef]
  43. Austin, S.; Robins, P.; Pan, Y. Shear bond testing of concrete repairs. Cem. Concr. Res. 1999, 29, 1067–1076. [Google Scholar] [CrossRef]
  44. Semendary, A.A.; Svecova, D. Factors affecting bond between precast concrete and cast in place ultra high performance concrete (UHPC). Eng. Struct. 2020, 216, 110746. [Google Scholar] [CrossRef]
  45. Santos, P.; Júlio, E. Factors affecting bond between new and old concrete. ACI Mater. J. 2011, 108, 449–456. [Google Scholar] [CrossRef]
  46. Wang, B.; Feng, H.; Huang, H.; Guo, A.; Zheng, Y.; Wang, Y. Bonding properties between fly ash/slag-based engineering geopolymer composites and concrete. Materials 2023, 16, 4232. [Google Scholar] [CrossRef]
  47. Costa, H.; Carmo, R.N.F.; Júlio, E. Influence of lightweight aggregates concrete on the bond strength of concrete-to-concrete interfaces. Constr. Build. Mater. 2018, 180, 519–530. [Google Scholar] [CrossRef]
  48. Modesti, L.A.; Vargas, A.S.D.; Schneider, E.L. Repairing concrete with epoxy adhesives. Int. J. Adhes. Adhes. 2020, 101, 102645. [Google Scholar] [CrossRef]
  49. Jiang, B.; Qian, Z.; Gu, D.; Pan, J. Repair concrete structures with high-early-strength engineered cementitious composites (HES-ECC): Material design and interfacial behavior. J. Build. Eng. 2023, 68, 106060. [Google Scholar] [CrossRef]
  50. Shang, X.; Xu, F.; Yu, J.; Li, L.; Lu, Z. Study on the interfacial shear performance between engineered cementitious composites and concrete after being subjected to high temperatures. J. Build. Eng. 2021, 44, 103328. [Google Scholar] [CrossRef]
  51. Farzad, M.; Shafieifar, M.; Azizinamini, A. Experimental and numerical study on bond strength between conventional concrete and ultra high-performance concrete (UHPC). Eng. Struct. 2019, 186, 297–305. [Google Scholar] [CrossRef]
  52. ASTM C469/C469M-22; Standard Test Method for Static Modulus of Elasticity and Poisson’s Ratio of Concrete in Compression. ASTM International: West Conshohocken, PA, USA, 2022.
  53. Yokota, H.; Rokugo, K.; Sakata, N. JSCE Recommendations for design and construction of high performance fiber reinforced cement composite with multiple fine cracks. In High Performance Fiber Reinforced Cement Composites; Springer: Tokyo, Japan, 2007. [Google Scholar]
  54. JGJ 55-2011; Specification for Mix Proportion Design of Ordinary Concrete. MOHURD, Architecture & Building Press: Beijing, China, 2011.
  55. Santos, P.; Júlio, E. A state-of-art review on roughness quantification methods for concrete surfaces. Constr. Build. Mater. 2013, 38, 912–923. [Google Scholar] [CrossRef]
  56. Liu, C.; Wei, Y. Experimental study on interface performance between implantable cement-based sensor and matrix concrete. Constr. Build. Mater. 2022, 345, 128316. [Google Scholar] [CrossRef]
  57. Tian, J.; Wu, X.; Zheng, Y.; Hu, S.; Du, Y.; Wang, W.; Sun, C.; Zhang, L. Investigation of interface shear properties and mechanical model between ECC and concrete. Constr. Build. Mater. 2019, 223, 12–27. [Google Scholar] [CrossRef]
  58. Chang, J.J. A study on the setting characteristics of sodium silicate-activated slag pastes. Cem. Concr. Res. 2003, 33, 1005–1011. [Google Scholar] [CrossRef]
  59. Nath, S.K.; Kumar, S. Influence of iron making slags on strength and microstructure of fly ash geopolymer. Constr. Build. Mater. 2013, 38, 924–930. [Google Scholar] [CrossRef]
  60. Zhou, Y.; Xi, B.; Sui, L.; Zheng, S.; Xing, F.; Li, L. Development of high strain-hardening lightweight engineered cementitious composites: Design and performance. Cem. Concr. Compos. 2019, 104, 103370. [Google Scholar] [CrossRef]
  61. Long, X.; Xue, H.; Tan, Y.; Xia, C.; Huang, X.; Yan, X.; Zheng, L. Effect of ultra-low temperature freezing-thawing cycles on bending fatigue properties of PE-ECC. Case Stud. Constr. Mater. 2023, 19, e02603. [Google Scholar] [CrossRef]
  62. Zhang, Z.; Gao, Y.; Qin, F.; Sun, F.; Huang, Y. Mechanical properties of sustainable high strength ECC with substitution of cement by limestone powder. Case Stud. Constr. Mater. 2023, 19, e02434. [Google Scholar] [CrossRef]
  63. Lin, J.; Luo, R.; Su, J.; Guo, Y.; Chen, W. Coarse synthetic fibers (PP and POM) as a replacement to steel fibers in UHPC: Tensile behavior, environmental and economic assessment. Constr. Build. Mater. 2024, 412, 134654. [Google Scholar] [CrossRef]
  64. Chen, G.; Zheng, D.; Chen, Y.; Lin, J.; Lao, W.; Guo, Y.; Chen, Z.-B.; Lan, X.-W. Development of high performance geopolymer concrete with waste rubber and recycle steel fiber: A study on compressive behavior, carbon emissions and economical performance. Constr. Build. Mater. 2023, 393, 131988. [Google Scholar] [CrossRef]
  65. Park, S.; Choi, J.; Nguyễn, H.H.; Lương, Q.; Nguyễn, P.H.; Lee, B.Y. Cementless ultra-ductile composites reinforced by polyethylene-based short selvedge fibers for sustainable and resilient infrastructure. J. Build. Eng. 2023, 68, 106198. [Google Scholar] [CrossRef]
  66. Daneshvar, D.; Deix, K.; Robisson, A. Effect of casting and curing temperature on the interfacial bond strength of epoxy bonded concretes. Constr. Build. Mater. 2021, 307, 124328. [Google Scholar] [CrossRef]
  67. Ha, S.K.; Na, S.; Lee, H.K. Bond characteristics of sprayed frp composites bonded to concrete substrate considering various concrete surface conditions. Compos. Struct. 2013, 100, 270–279. [Google Scholar] [CrossRef]
  68. Yuan, Q.; Jan, L. Study on adhesive shear strength of young on old concrete. J. Build. Struct. 2001, 22, 46–50. (In Chinese) [Google Scholar]
  69. Wu, Z.; Zhang, J.; Yu, H.; Wu, Q.; Da, B. Computer-aided investigation of the tensile behavior of concrete: Relationship between direct and splitting tensile strength. Structures 2023, 55, 453–467. [Google Scholar] [CrossRef]
  70. Ju, Y.; Shen, T.; Wang, D. Bonding behavior between reactive powder concrete and normal strength concrete. Constr. Build. Mater. 2020, 242, 118024. [Google Scholar] [CrossRef]
Figure 1. Particle size distribution curves of binder materials and aggregates.
Buildings 14 01819 g001
Figure 2. Dimensions of specimens for test: (a) dumbbell-shaped specimen for axial tensile test; (b) cylinder specimen for axial compressive test; (c) cube double-sided bonding specimen for direct shear test.
Buildings 14 01819 g002
Figure 3. Schematic diagram of three types of interfacial roughness of EGC-existing concrete bond specimens.
Buildings 14 01819 g003
Figure 4. Mold for EGC–existing concrete bond specimens.
Buildings 14 01819 g004
Figure 5. Test equipment for axial compression test.
Buildings 14 01819 g005
Figure 6. Test equipment for axial tensile test.
Buildings 14 01819 g006
Figure 7. Test setup of existing concrete’s axial compressive test.
Buildings 14 01819 g007
Figure 8. Test setup of direct shear bond performance test.
Buildings 14 01819 g008
Figure 9. Tensile stress–strain curve of EGC.
Buildings 14 01819 g009
Figure 10. Failure modes of EGC–existing concrete bond specimens.
Buildings 14 01819 g010aBuildings 14 01819 g010b
Figure 11. Load–slip curves of the bond interface for EGC–existing concrete bond specimens.
Buildings 14 01819 g011
Figure 12. The impact of interface roughness on interface bond strength.
Buildings 14 01819 g012
Figure 13. The impact of existing concrete strength grade on interface bond strength.
Buildings 14 01819 g013
Figure 14. Comparison of experimental and predicted values of interface bond strength.
Buildings 14 01819 g014
Figure 15. Comparison of experimental and predicted values of interface bond strength from relevant reference [17,70].
Buildings 14 01819 g015
Table 1. Chemical composition and loss on ignition of binder materials (wt%).
Binder MaterialsCaOSiO2Al2O3SO3Fe2O3MgOTiO2OthersLoss on Ignition
GGBFS34.0034.5017.701.641.036.0105.120.84
FA4.0153.9731.152.204.161.011.132.374.60
Table 2. Physical and mechanical properties of PE Fiber.
Length
(mm)
Diameter
(mm)
Tensile Strength
(MPa)
Elastic Modulus
(GPa)
Density
(g/cm3)
Elongation
(%)
182425001200.973.7
Table 3. EGC mix design (kg/m3).
GroupsFAGGBFSQPActivatorWaterBaCl2PE Fiber
G45956.4239.1239.1478.271.712.019.4
G70849.7364.1242.8485.572.812.119.4
G95736.3490.9245.4490.973.612.319.4
Note: The “G” in “G45” stands for “Geopolymer”, and “45” indicates that the EGC strength grade is 45 MPa. Other groups have the same notation.
Table 4. Existing concrete mix design (kg/m3).
GroupsCementCoarse
Aggregate
Fine
Aggregate
WaterSP
C303161126750208-
C504441112622222-
C7058810285781643
Note: The “C” in “C30” stands for “Cement”, and “30” indicates that the existing concrete strength grade is 30 MPa. Other groups have the same notation.
Table 5. EGC–existing concrete bond specimens of grouping design.
GroupsExisting Concrete Strength GradeInterface TypeEGC Strength Grade
C30-III-G45C30IIIG45
C30-III-G70C30IIIG70
C30-III-G95C30IIIG90
C50-I-G45C50IG45
C50-I-G70C50IG70
C50-I-G95C50IG90
C50-II-G45C50IIG45
C50-II-G70C50IIG70
C50-II-G95C50IIG90
C50-III-G45C50IIIG45
C50-III-G70C50IIIG70
C50-III-G95C50IIIG90
C70-III-G45C70IIIG45
C70-III-G70C70IIIG70
C70-III-G95C70IIIG90
Table 6. Compressive strength of existing concrete.
GroupsCompressive Strength (MPa)
C3035.6 (1.27)
C5054.9 (1.89)
C7075.3 (2.53)
Note: the values are standard deviations in parentheses.
Table 7. Mechanical properties of EGC.
GroupsCompressive Strength (MPa)Elasticity Modulus (GPa)Initial Cracking
Strain (%)
Ultimate Tensile Strain (%)Initial Cracking Stress (MPa)Tensile Stress (MPa)
G4549.6 (1.15)8.88 (0.695)0.0340 (0.0200)6.10 (0.258)1.63 (0.0360)5.09 (0.167)
G7072.2 (0.364)14.1 (0.144)0.136 (0.0380)7.21 (0.283)2.53 (0.167)6.32 (0.171)
G9596.6 (0.545)18.8 (0.883)0.198 (0.122)7.93 (0.482) 3.20 (0.0930)8.00 (0.336)
Note: the values have standard deviations in parentheses.
Table 8. CO2-e emission of different materials.
MaterialsCementGGBFSFASilica FumeQuartz QowderNaOHNa2SiO3SPPE Fiber
Emission factor
(kg CO2-e/kg)
0.830
[63]
0.019
[64]
0.009
[64]
0.014
[65]
0.046
[64]
1.915
[64]
1.514
[64]
0.720
[64]
1.960
[65]
Table 9. CO2-e emission of different mixtures.
MaterialsMix Groups
G45G70G95Reference (C45) [61]Reference (C70) [62]Reference (C95) [60]
Cement---492.190746.095581.000
GGBFS4.5436.9189.327--14.250
FA8.6087.6476.6276.4044.061-
Silica Fume----1.2743.220
Quartz Sand10.99911.16911.28821.82220.74623.000
NaOH92.49193.90394.947---
Na2SiO3211.117214.340216.724---
SP---2.88014.40032.400
PE Fiber29.37229.37229.37237.24039.20039.200
CO2-e
(kg/m3)
357.129363.348368.285560.537825.776693.070
Table 10. Summary of interfacial bond strength and failure modes of EGC–existing concrete bond specimens.
GroupsFailure ModeInterfacial Bond Strength (MPa)Standard Deviation (MPa)
C30-III-G45alternating crack1.180.0515
C30-III-G70alternating crack2.010.0793
C30-III-G95cohesive failure2.610.0831
C50-I-G45serrated interfacial failure0.6740.0209
C50-I-G70serrated interfacial failure1.070.104
C50-I-G95serrated interfacial failure1.310.0498
C50-II-G45alternating crack1.110.0259
C50-II-G70alternating crack1.740.0243
C50-II-G95alternating crack2.400.0241
C50-III-G45alternating crack1.460.0400
C50-III-G70alternating crack2.180.0318
C50-III-G95alternating crack2.820.0356
C70-III-G45alternating crack1.740.0886
C70-III-G70alternating crack2.530.0636
C70-III-G95alternating crack3.290.0751
Table 11. Results of tests for main effects among the three experimental variables.
Source of VariationType III Sum of SquaresDegrees of FreedomMean SquareFpPartial Eta Squared
Corrected Model19.887 a141.421250.760<0.0010.992
Intercept171.4961171.49630,273.940<0.0010.999
Existing Concrete Strength1.58820.794140.136<0.0010.903
Interface Roughness2.67421.337236.018<0.0010.940
EGC Strength12.71026.3551121.825<0.0010.987
Existing Concrete Strength * Interface Roughness0.0000---0.000
Existing Concrete Strength * EGC Strength0.03840.0091.6560.1860.181
Interface Roughness * EGC Strength0.05840.0152.5810.0570.256
Existing Concrete Strength * Interface Roughness * EGC Strength0.0000---0.000
Error0.170300.006---
Total233.21445----
Adjusted Total20.05744----
Note: a indicates R2 = 0.992 (Adjusted R2 = 0.988). * is a symbol used to connect different experimental variables together to form an interaction term.
Table 12. Comparison of experimental and predicted values of interface bond strength.
GroupsExisting Concrete Strength (MPa)Interface Roughness (mm)EGC Strength (MPa)Experimented Interface Bond Strength (MPa)Predicted Interface Bond Strength (MPa)Error (%)
C30-III-G4535.62.1549.61.181.52−28.8
C30-III-G7035.62.1572.22.012.04−1.49
C30-III-G9535.62.1596.62.612.571.53
C50-I-G4554.90.1549.60.6740.49926.0
C50-I-G7054.90.1572.21.071.015.61
C50-I-G9554.90.1596.61.311.55−18.3
C50-II-G4554.91.1549.61.111.23−10.8
C50-II-G7054.91.1572.21.741.75−0.575
C50-II-G9554.91.1596.62.402.285.00
C50-III-G4554.92.1549.61.461.73−18.5
C50-III-G7054.92.1572.22.182.25−3.21
C50-III-G9554.92.1596.62.822.781.42
C70-III-G4575.32.1549.61.741.95−12.1
C70-III-G7075.32.1572.22.532.462.77
C70-III-G9575.32.1596.63.293.008.82
Table 13. Comparison of experimental and predicted values of interface bond strength from relevant reference.
NumberExisting Concrete Strength (MPa)Interface Roughness (mm)Post-cast Material Strength (MPa)Experimented Interface Bond Strength (MPa)Predicted Interface Bond Strength (MPa)Error (%)Ref.
166.30.32432.90.5000.30066.6[17]
266.30.77932.91.040.72244.1
366.31.2132.91.591.0748.3
445.32.2393.92.072.69−23.1[70]
545.34.4694.12.232.98−25.3
645.35.67113.44.963.2154.6
745.35.7490.33.642.6636.7
845.32.3997.93.242.8314.4
945.34.5383.73.082.7412.3
1045.34.4389.82.582.89−10.7
1145.36.0193.73.432.6529.2
1245.32.1199.91.752.79−37.2
Disclaimer/Publisher’s Note: The statements, opinions and data contained in all publications are solely those of the individual author(s) and contributor(s) and not of MDPI and/or the editor(s). MDPI and/or the editor(s) disclaim responsibility for any injury to people or property resulting from any ideas, methods, instructions or products referred to in the content.

