Abstract
A lime–sand pile is a three-phase particle composite material composed of a lime matrix, sand, and a loess aggregate at the meso level. Establishing a random aggregate model that can reflect the actual aggregate gradation, content, and morphology is the premise of numerical simulations of the meso-mechanics of lime–sand piles. In this paper, the secondary development of Abaqus 2022 is realized by writing Python 3.12 scripts, and a parameterized three-phase mixed lime–sand pile random meso-spherical aggregate model is obtained. A meso-modeling idea of lime–sand piles is creatively proposed, the integrated-generation algorithm of a spherical aggregate of different materials is written, and the material’s properties and mesh generation are given by the algorithm. Finally, a numerical simulation of temperature–expansion statics is carried out using an established mesoscopic model. Under different mixing ratios, the expansion force increases with an increase in the lime proportion. The increase in the expansion force is approximately 45% of that without an increased lime proportion. The simulated expansion forces are 8.81 kN, 12.61 kN, and 18.89 kN, respectively, which are similar to the experimental results for laboratory specimens, and the relative error is less than 3%. In the case of different height ratios, with increases in height, the change in the expansion force is very small, and the relative error between the simulated value and the experimental value is less than 2%, which further verifies the reliability of the mesoscopic random model of lime–sand piles. The model can be used to guide the practical application of engineering.
1. Introduction
A lime–sand pile is a type of pile made of a mixture of the following three materials: lime, sand, and soil. It is an improvement from a traditional lime pile, which is formed by mechanically forming a hole and compacting or pounding the pile in layers. It mainly utilizes the hydration reaction between quicklime and the moisture in the soil around the pile. When the lime–sand pile absorbs water, the quicklime within it will undergo a hydration reaction and be converted into calcium hydroxide (Ca(OH)2), which will absorb water and generate a lot of heat. Inside the lime–sand pile, the micropores and pore structures in the calcium hydroxide can adsorb the water in the soil and cause the water to penetrate the inside of the lime–sand pile. With the adsorption and infiltration of water, calcium hydroxide will gradually expand, fill the gaps between soil particles, reduce the water content of the soil around the pile, reduce the void ratio, improve the compactness of the soil, improve the bearing capacity of the natural foundation’s soft soil, and reduce its deformation.
In recent years, lime–sand piles have often been used to treat loess foundations to eliminate their wet subsidence due to their special performance, and they are widely used in northwest China, Central Europe, and elsewhere [1,2,3]. They can also be used to deal with permafrost foundations as permafrost foundations and loess foundations are part of the nature of similar lime–sand pile water absorption processes which continue to progress toward exothermic reactions which can make a permafrost foundation melt; the melted water can be absorbed by the lime–sand pile again, and successive reactions can improve the reliability of the permafrost foundation and its bearing capacity [4,5].
Although the material properties of lime–sand piles have been studied by many experts and scholars, both at home and abroad, for many years, such studies are still not sufficient, and there is still much room for development. Because the current domestic and foreign research on lime–sand piles is limited to the macro level, only their appearances can be analyzed, and the correlations between their micro-materials and macro-structural characteristics are not clear. Only their overall mechanical properties can be better portrayed. The optimal approach is to understand the properties of each material, followed by understanding the distribution of each material in the structure, the stress situation, and the overall performance of the composite. Therefore, it is necessary to study the micro level of a lime–sand pile to clarify the overall mechanical properties of its expansion process.
Since no research has been conducted on lime–sand pile materials at the fine-scale level (either at home or abroad), there is no numerical simulation for lime–sand pile materials. Therefore, this paper creatively proposes and validates a modeling method for a random spherical aggregate for lime–sand piles, and the generated fine-scale model is used for the corresponding numerical simulation of the expansion force, which is analogous to the fine-scale model used for modeling concrete.
1.1. Research on Mesoscopic Model Modeling
Since Roelfstra (1985) et al. [6] first proposed a mesoscopic model of concrete, scholars, both at home and abroad [7,8,9,10,11,12,13,14,15,16,17,18,19,20,21,22,23,24,25,26,27,28,29,30,31,32,33,34,35,36,37,38,39,40,41,42,43], have conducted in-depth research on it and proposed many classical mesoscopic models. Among them, Liu et al. [7] proposed a random aggregate model. The reason why this model is the most widely used is that it has the following four main advantages: first, the model takes into account the randomness of the aggregate’s shape; second, the model applies the three-dimensional Fuller gradation curve [8] and the two-dimensional Walraven formula [9] to the calculation of the number of aggregates; third, the model requires that the aggregate is randomly placed in a specified area, and a finite element mesh is mapped to this area; and fourth, the elements in different regions correspond to different material properties to simulate the three-phase characteristics of the concrete microstructure. Combined with the above advantages, the random aggregate model is the most widely used classical model, and it can simulate different test situations such as uniaxial tension and compression, shear, bending, and plastic damage, making it suitable for the meso-modeling of most composite materials.
Based on the random aggregate model method, scholars have conducted in-depth research on aggregate shape and delivery. Qin et al. [10] studied a random placement algorithm of a three-dimensional convex aggregate and put forward the idea of the homogenization of the placement area. Guan et al. [11] used an ellipsoidal aggregate particle model to simulate multiphase composite materials, and they proposed a finite element mesh generation algorithm for aggregate surfaces based on a mapping method. Qin et al. [12] applied CT slicing technology to three-dimensional modeling. The above research has further refined the mesoscopic aggregate model.
Regarding an aspect of mesoscopic numerical simulations, Avdeev et al. [13] studied the representative volume element of concrete, namely the RVE model. The size of an RVE is not accurately defined but is relative. It should be much smaller than the macrostructure and much larger than the internal characteristic structure. It serves as a bridge connecting the mesostructure and the macrostructure. In fact, it is a representative cube specimen studied by our traditional laboratory. The following simulation studies can be carried out by creating an RVE model to build a bridge. Zhu et al. [14] reconstructed and analyzed concrete based on the CT slicing technique. Yang et al. [15] analyzed the plastic damage process of concrete. Sun and Ma [16,17] also analyzed the diffusion law of chloride ions and sulfate ions in concrete. Liu and Wang [18,19,20] studied the properties of recycled concrete, fly ash concrete, and other admixture concrete through this model. Wu et al. [21] applied the mesoscopic aggregate model to the study of FRP-reinforced concrete. The random aggregate model is increasingly utilized in numerical analysis, which plays an important role in studying the meso-performance of materials.
In the selection of finite element and programming software, Fang and Jiang et al. [22,23] generated a concrete mesoscopic model based on MATLAB self-programming. Cheng and Tan et al. [24,25] embedded COMSOL and LS-DYNA software for pre-processing and numerical simulation. Caballero and Zhao et al. [26,27] simulated the three-dimensional mesostructure of concrete based on the cell shape in the Voronoi diagram. Guo and Xu et al. [28,29] used the Fortran program combined with the APDL command stream of ANSYS to establish a concrete mesoscopic model. In addition, Jia [30] wrote an aggregate model based on Visual C++, and Liang et al. [31] wrote an aggregate model based on the AutoCAD built-in VBA language.
In summary, there are many studies on the three-dimensional mesoscopic modeling of concrete, which is relatively advanced and plays a guiding role in the construction of a three-dimensional mesoscopic model of lime–sand piles.
1.2. Research Ideas and Purposes
Abaqus’s secondary development is comprehensive for its functional improvement. Compared with most finite element analysis software, Abaqus provides a variety of secondary development interfaces. Abaqus Scripting Interface [32] is an extended interface for secondary development of Python programming language. It has wider and more practical characteristics than the user subroutine interface and is especially suitable for the development of various functions of pre-processing and post-processing. The Abaqus script interface can be used to complete complex and random model establishment, parametric analysis, mesh generation, load and constraint application, file reading, data processing, cloud drawing, and other operations.
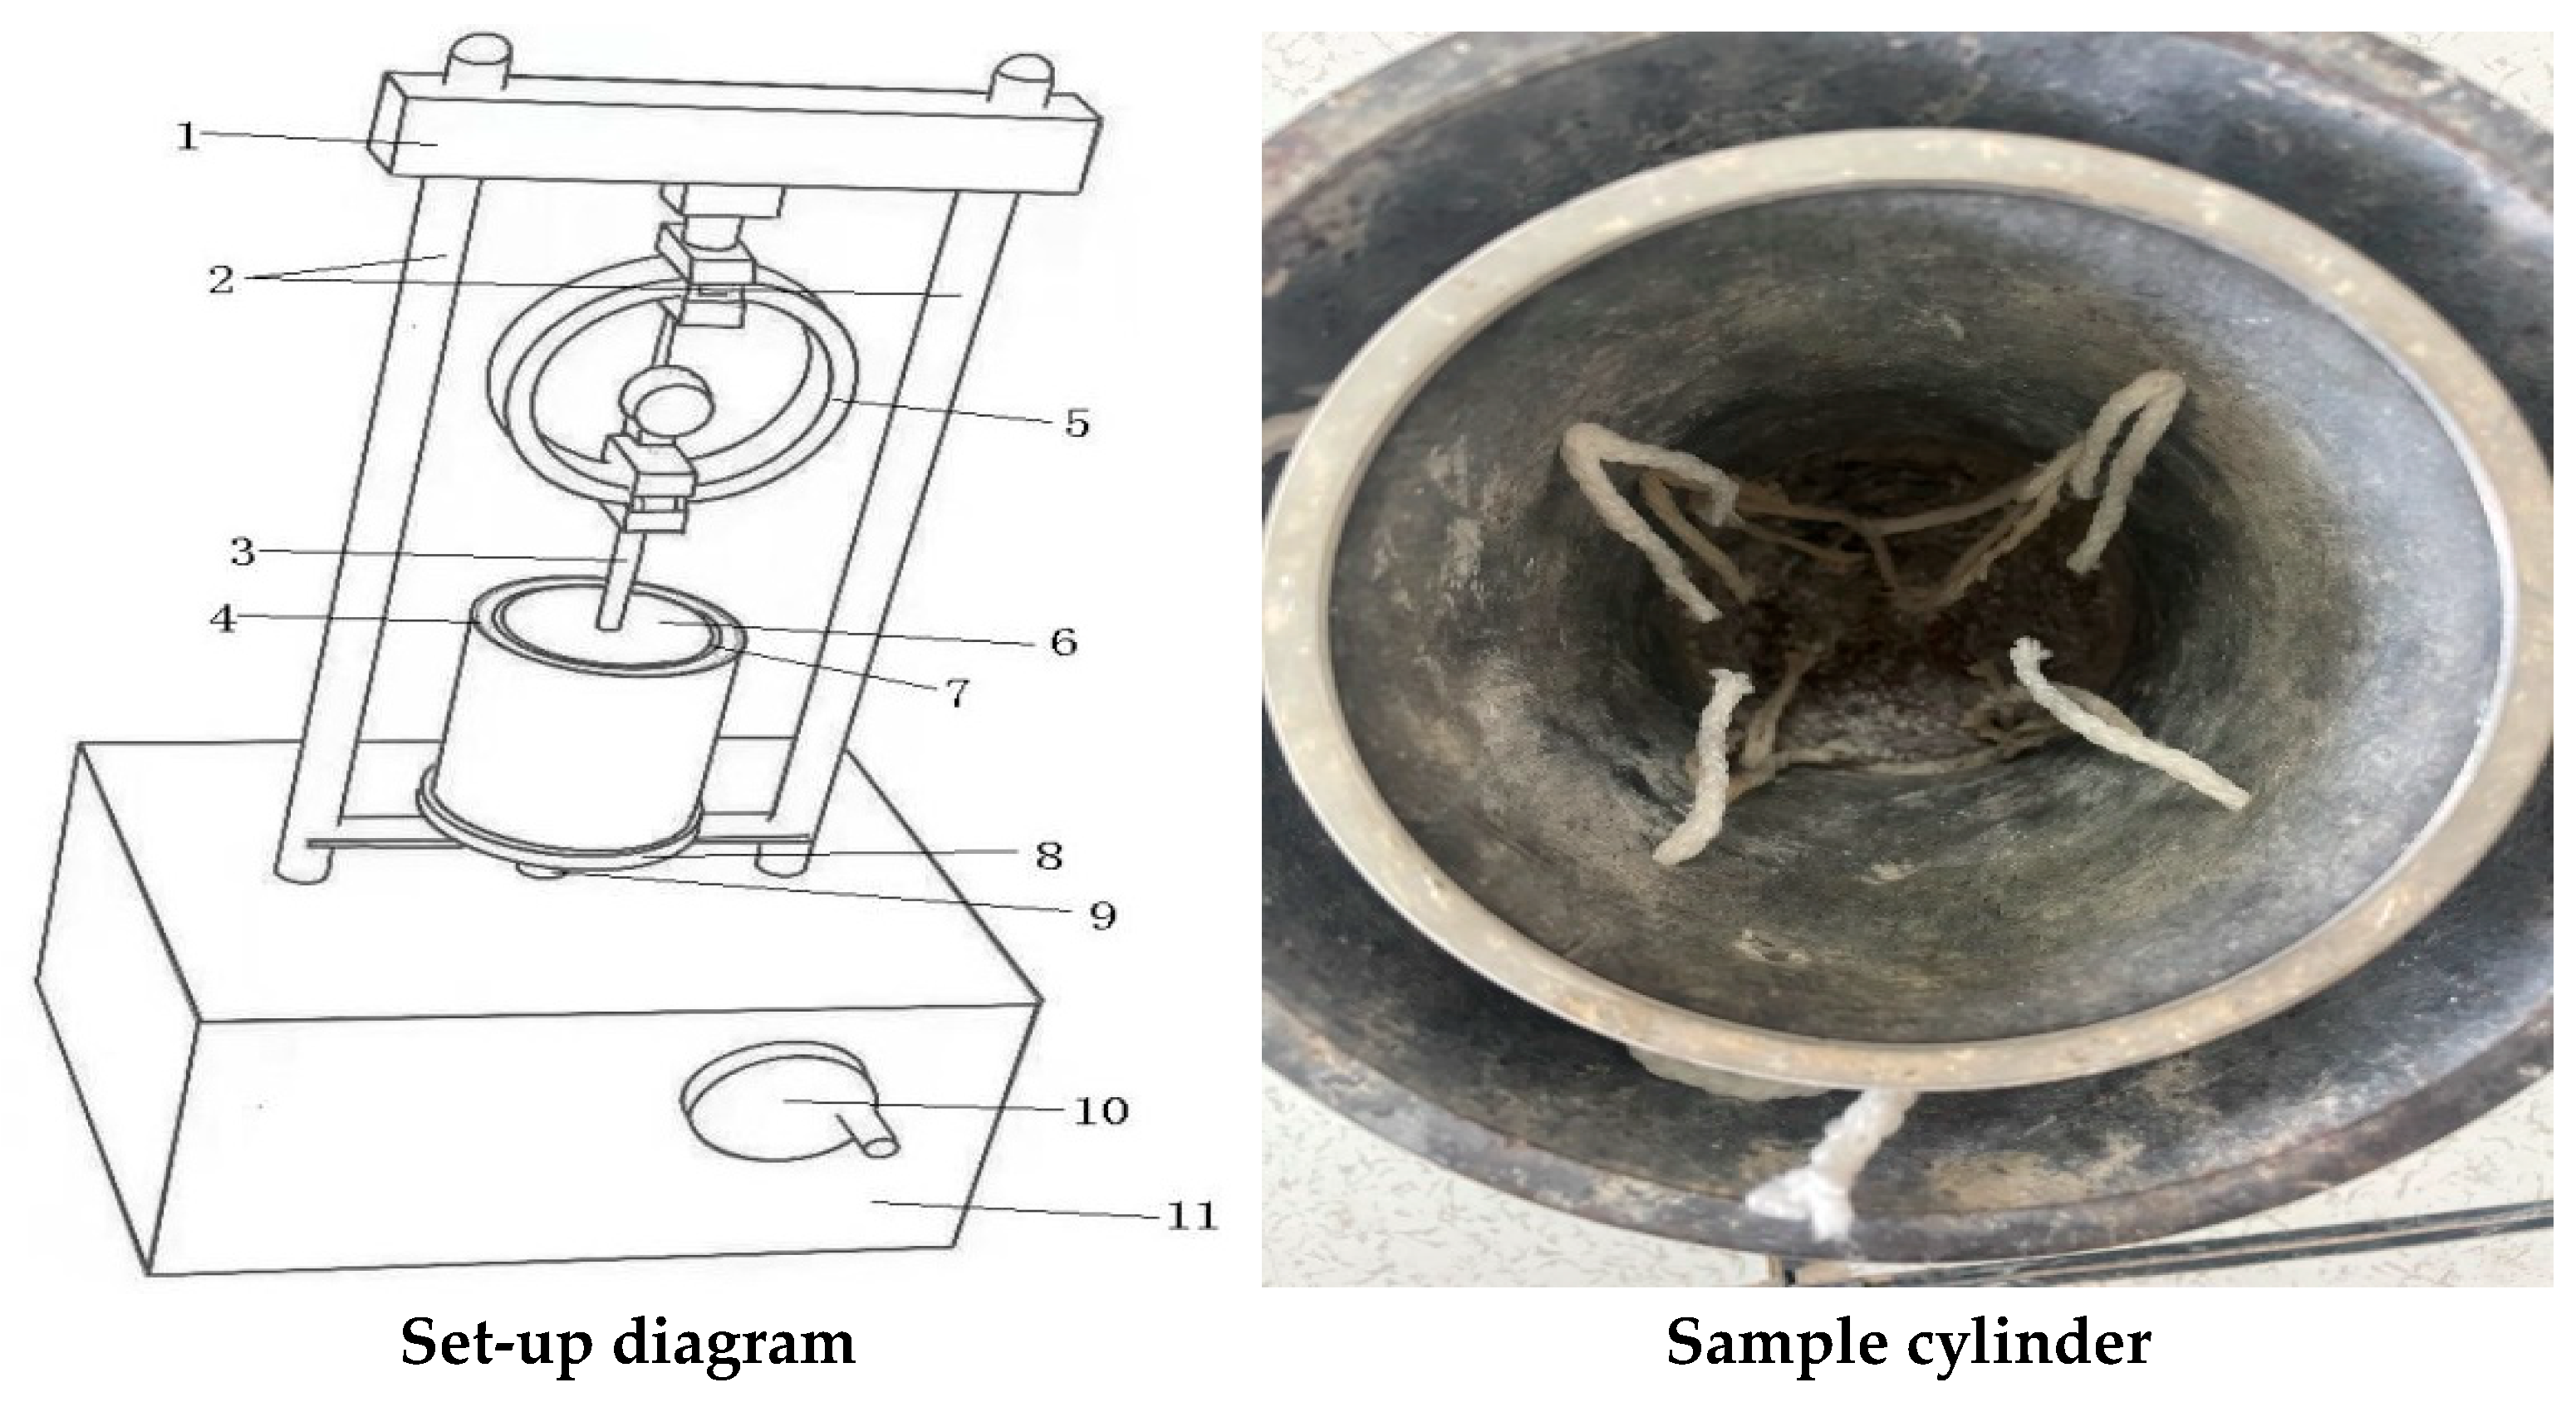
Our research group [33] previously designed a lime–sand pile reaction force tester and conducted multi-parameter experimental research on the expansion force of lime–sand piles. As depicted in Figure 1, the device is a double-layer cylinder structure. The inner diameter of the sample cylinder is 10.5 cm, the height is 22 cm, and there is no lateral deformation by the expansion force. There are four small holes at the height of 5 cm, 10 cm, and 15 cm of the sample cylinder wall. The middle interlayer is filled with water, and the water absorption cotton rope is passed on the barrel wall. The process of water absorption of lime–sand piles can be simulated, and the expansion reaction force can be tested by a force ring.
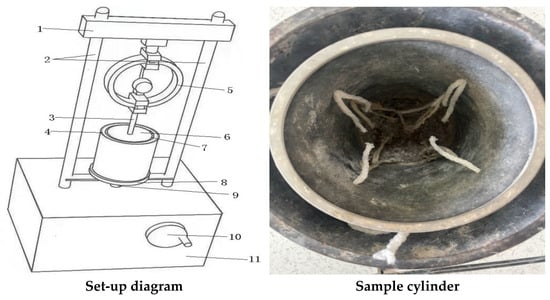
Figure 1.
Device design drawing. 1—beam; 2—support column; 3—cover plate column; 4—water injection cylinder; 5—force ring; 6—cover plate; 7—sample cylinder; 8—bearing platform; 9—lifting column; 10—bearing platform height adjustment wheel; 11—base.
In this paper, based on the background of the research group’s experiment, the Abaqus software is redeveloped with a Python language programming algorithm, the above device is completely restored and modeled, and the spherical aggregate is used to represent the loess and sand for simplified simulation research. Based on the idea of parametric modeling, the RVE model of a spherical aggregate of a lime–sand pile is generated. Firstly, an integrated generation algorithm for sand–loess spherical aggregates is designed. This algorithm controls the volume content and radius of the aggregate; when a certain aggregate meets the volume ratio, another particle is generated immediately, which is convenient for the subsequent material attribute assignment. When meshing, complex unit attribute discrimination can be avoided, and the obtained grid meets the requirements of aggregate and matrix grid coordination. Secondly, the Boolean intrusion discrimination algorithm is employed to enhance discrimination efficiency and aggregate volume content and avoid aggregate overlap. Finally, taking the aggregate model as an example, a finite element numerical simulation is carried out to further verify the effectiveness of the modeling method proposed in this paper. The expansion force of a lime–sand pile under arbitrary parameterization can be obtained in the future, which can be applied to actual engineering simulations and calculations and guide projects in using lime–sand piles to reinforce jacking foundations.
2. Meso-Model Modeling of Lime–Sand Pile
Based on the three-phase nonlinear material of a lime–sand pile, this section establishes a simplified spherical aggregate and lime matrix model that is consistent with the actual situation. To achieve this goal, the following research is carried out.
2.1. Aggregate Gradation Test
The particle size distribution of aggregates is an important parameter for the simulation of the mesostructure of continuous media. This distribution depends on the cumulative percentage passing through the ‘sieve’ with a specific pore size.
American scholar Fuller (W.B. Fuller) proposed a maximum density curve, also known as the Fuller curve, through a large number of experiments. The mathematical interpretation of the Fuller curve is that the gradation is regarded as a function of the aggregate size, and the function equation is Equation (1):
where P refers to the percentage of aggregate quality, D is the aggregate size, Dmax is the maximum particle size of aggregate, n = 0.5.
This paper decides to use this theory as the theoretical basis for subsequent gradation research. Fuller’s gradation principle Equation (1) is divided into a series of gradation sections by the Monte Carlo method [34]. The percentage of aggregate in each gradation section is calculated as follows (Equation (2)):
where P(Ds,Ds+1) refers to the cumulative percentage of aggregate in the grading section [Ds, Ds+1], Dmin is the minimum particle size of aggregate, Dmax is the maximum particle size of aggregate.
Then, the algorithm can be used to filter from Dmin to Ds and obtain the cumulative aggregate weight percentage in the grade segment [Dmin, Ds], which is calculated as show in Equation (3), and finally applied to the grading test:
where P(Dmin,Ds) refers to the generation probability of any aggregate size and Ds is any aggregate size.
According to the actual test model, the delivery area of the cylinder test block should be the space cylinder area. In the cylindrical coordinate system, the value of θ ranges from 0° to 360°, and the values of R and Z are determined by the size of the cylinder test block. The grading test is carried out in this area to verify the feasibility of the algorithm. The results show that the Python algorithm can complete the regional delivery, and the Fuller gradation theory is also applicable to the lime–sand pile material.
2.2. Determination of Basic Parameters of Aggregate
In the lime–sand pile test specimen, various parameters of the aggregate are random, and the random module of the Python language offers various functions for generating random numbers. By calling a random number and applying the Equation (4), the radius and spatial coordinates of the spherical aggregate that satisfy the gradation and are confined within the column area are determined as follows:
where Rn refers to the radius of the randomly generated nth spherical aggregate; Dmin and Dmax are the minimum and maximum particle sizes in this particle size range; Rc and Hc are the radius and height of the boundary cylinder for aggregate placement; and Xn, Yn, and Zn are the spatial coordinates of the nth randomly generated aggregate. np is the scientific computing numpy library of Python; pow is the built-in function in the np library; rdm is the abbreviation of random.random( ), which is a randomly obtained number of floating points between 0 and 1; and random.uniform( ) is the random generation of any floating point number in a given range. Since a certain distance needs to be reserved between aggregates and between aggregates and boundaries, the radius needs to be multiplied by a safety factor, that is, .
2.3. The Generation of Aggregate
A lime–sand pile is formed by the accumulation of three kinds of particle materials. Because there is no physical and chemical reaction before the particles are not absorbed, considering the composition, preparation process, and microstructure of the composite material, and the model only carries out static analysis, the ITZ is not considered in the modeling.
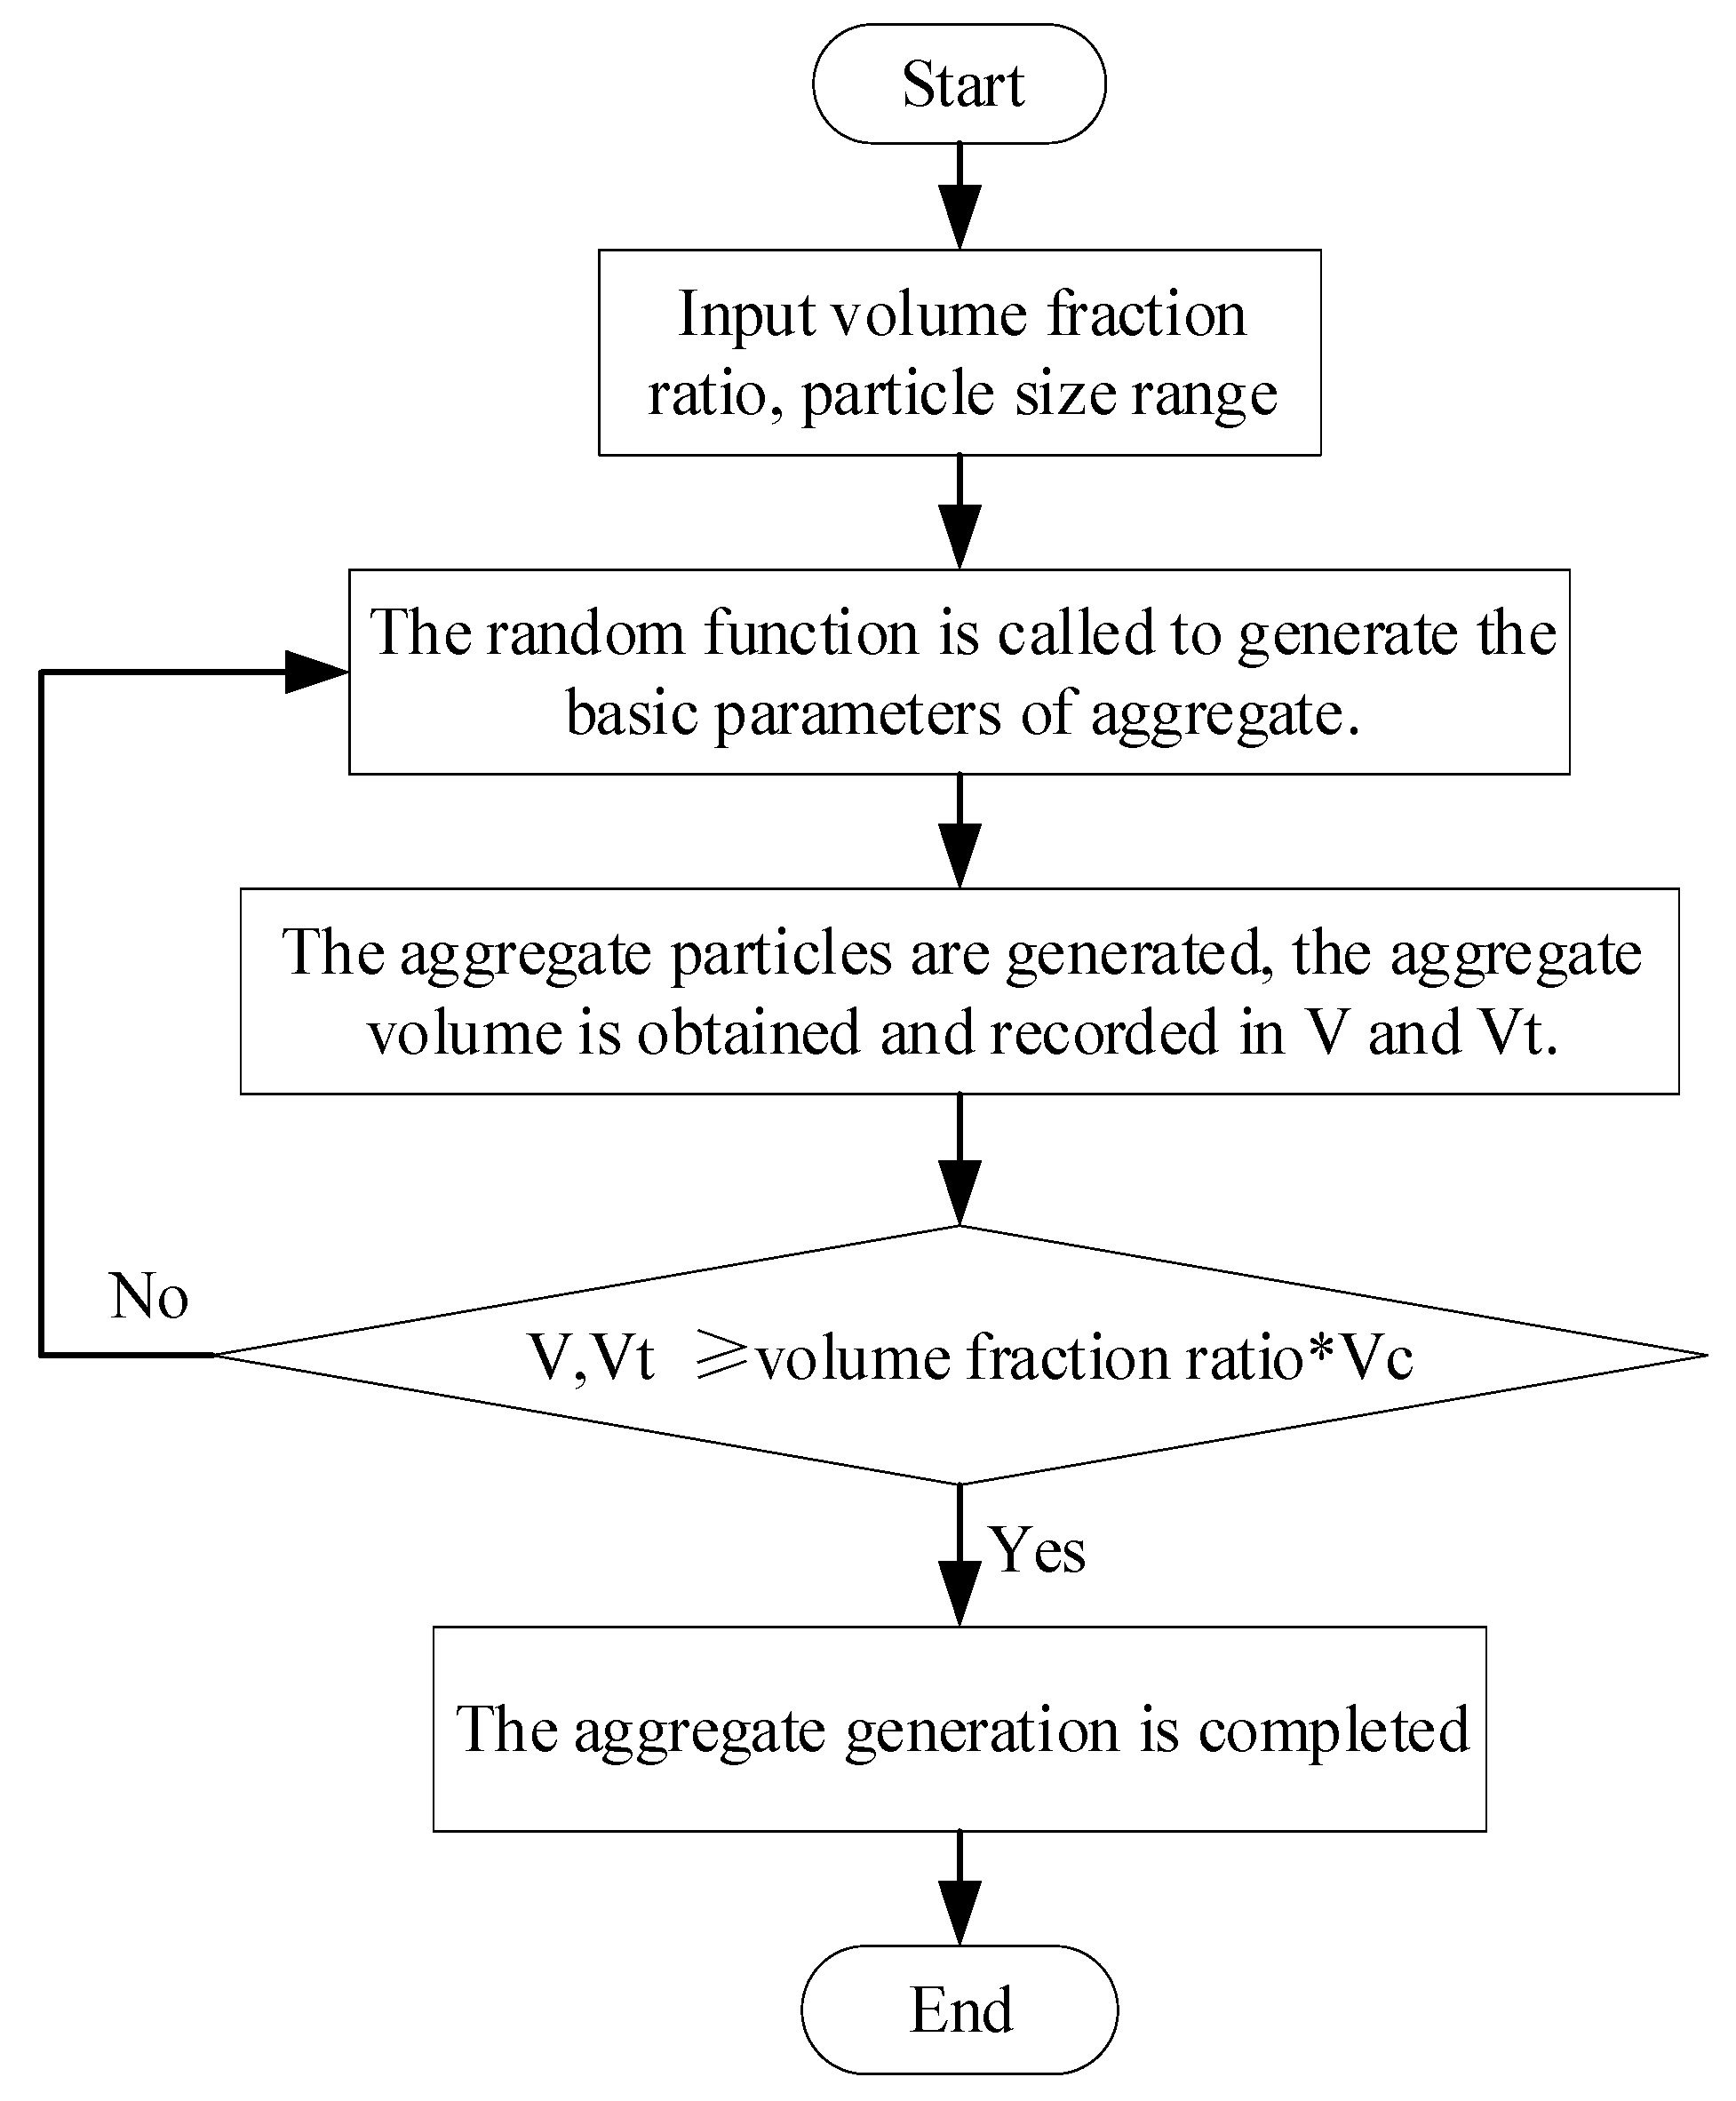
The generation method and steps of single aggregate in Abaqus finite element software are not described too much here. The aggregate volume can be calculated by the spherical volume formula, and can also be directly obtained by the built-in function getVeloume( ) of the Abaqus script interface. The total volume of the cylinder is calculated as Vc. Whenever an aggregate particle is generated, the aggregate volume is counted as Vi, the total volume of sand is V = ΣVi, and the total volume of loess is VT = ΣVi. Two large enough multidimensional arrays SphereDatas_xyzr[ ] and SphereTDatas_xyzr[ ] are defined to store the relevant data of all generated sand and loess aggregates. Using for i in range( ) loop traversal, the process of generating an aggregate algorithm is shown in Figure 2.

Figure 2.
Aggregate generation process.
2.4. Delivery of Aggregate
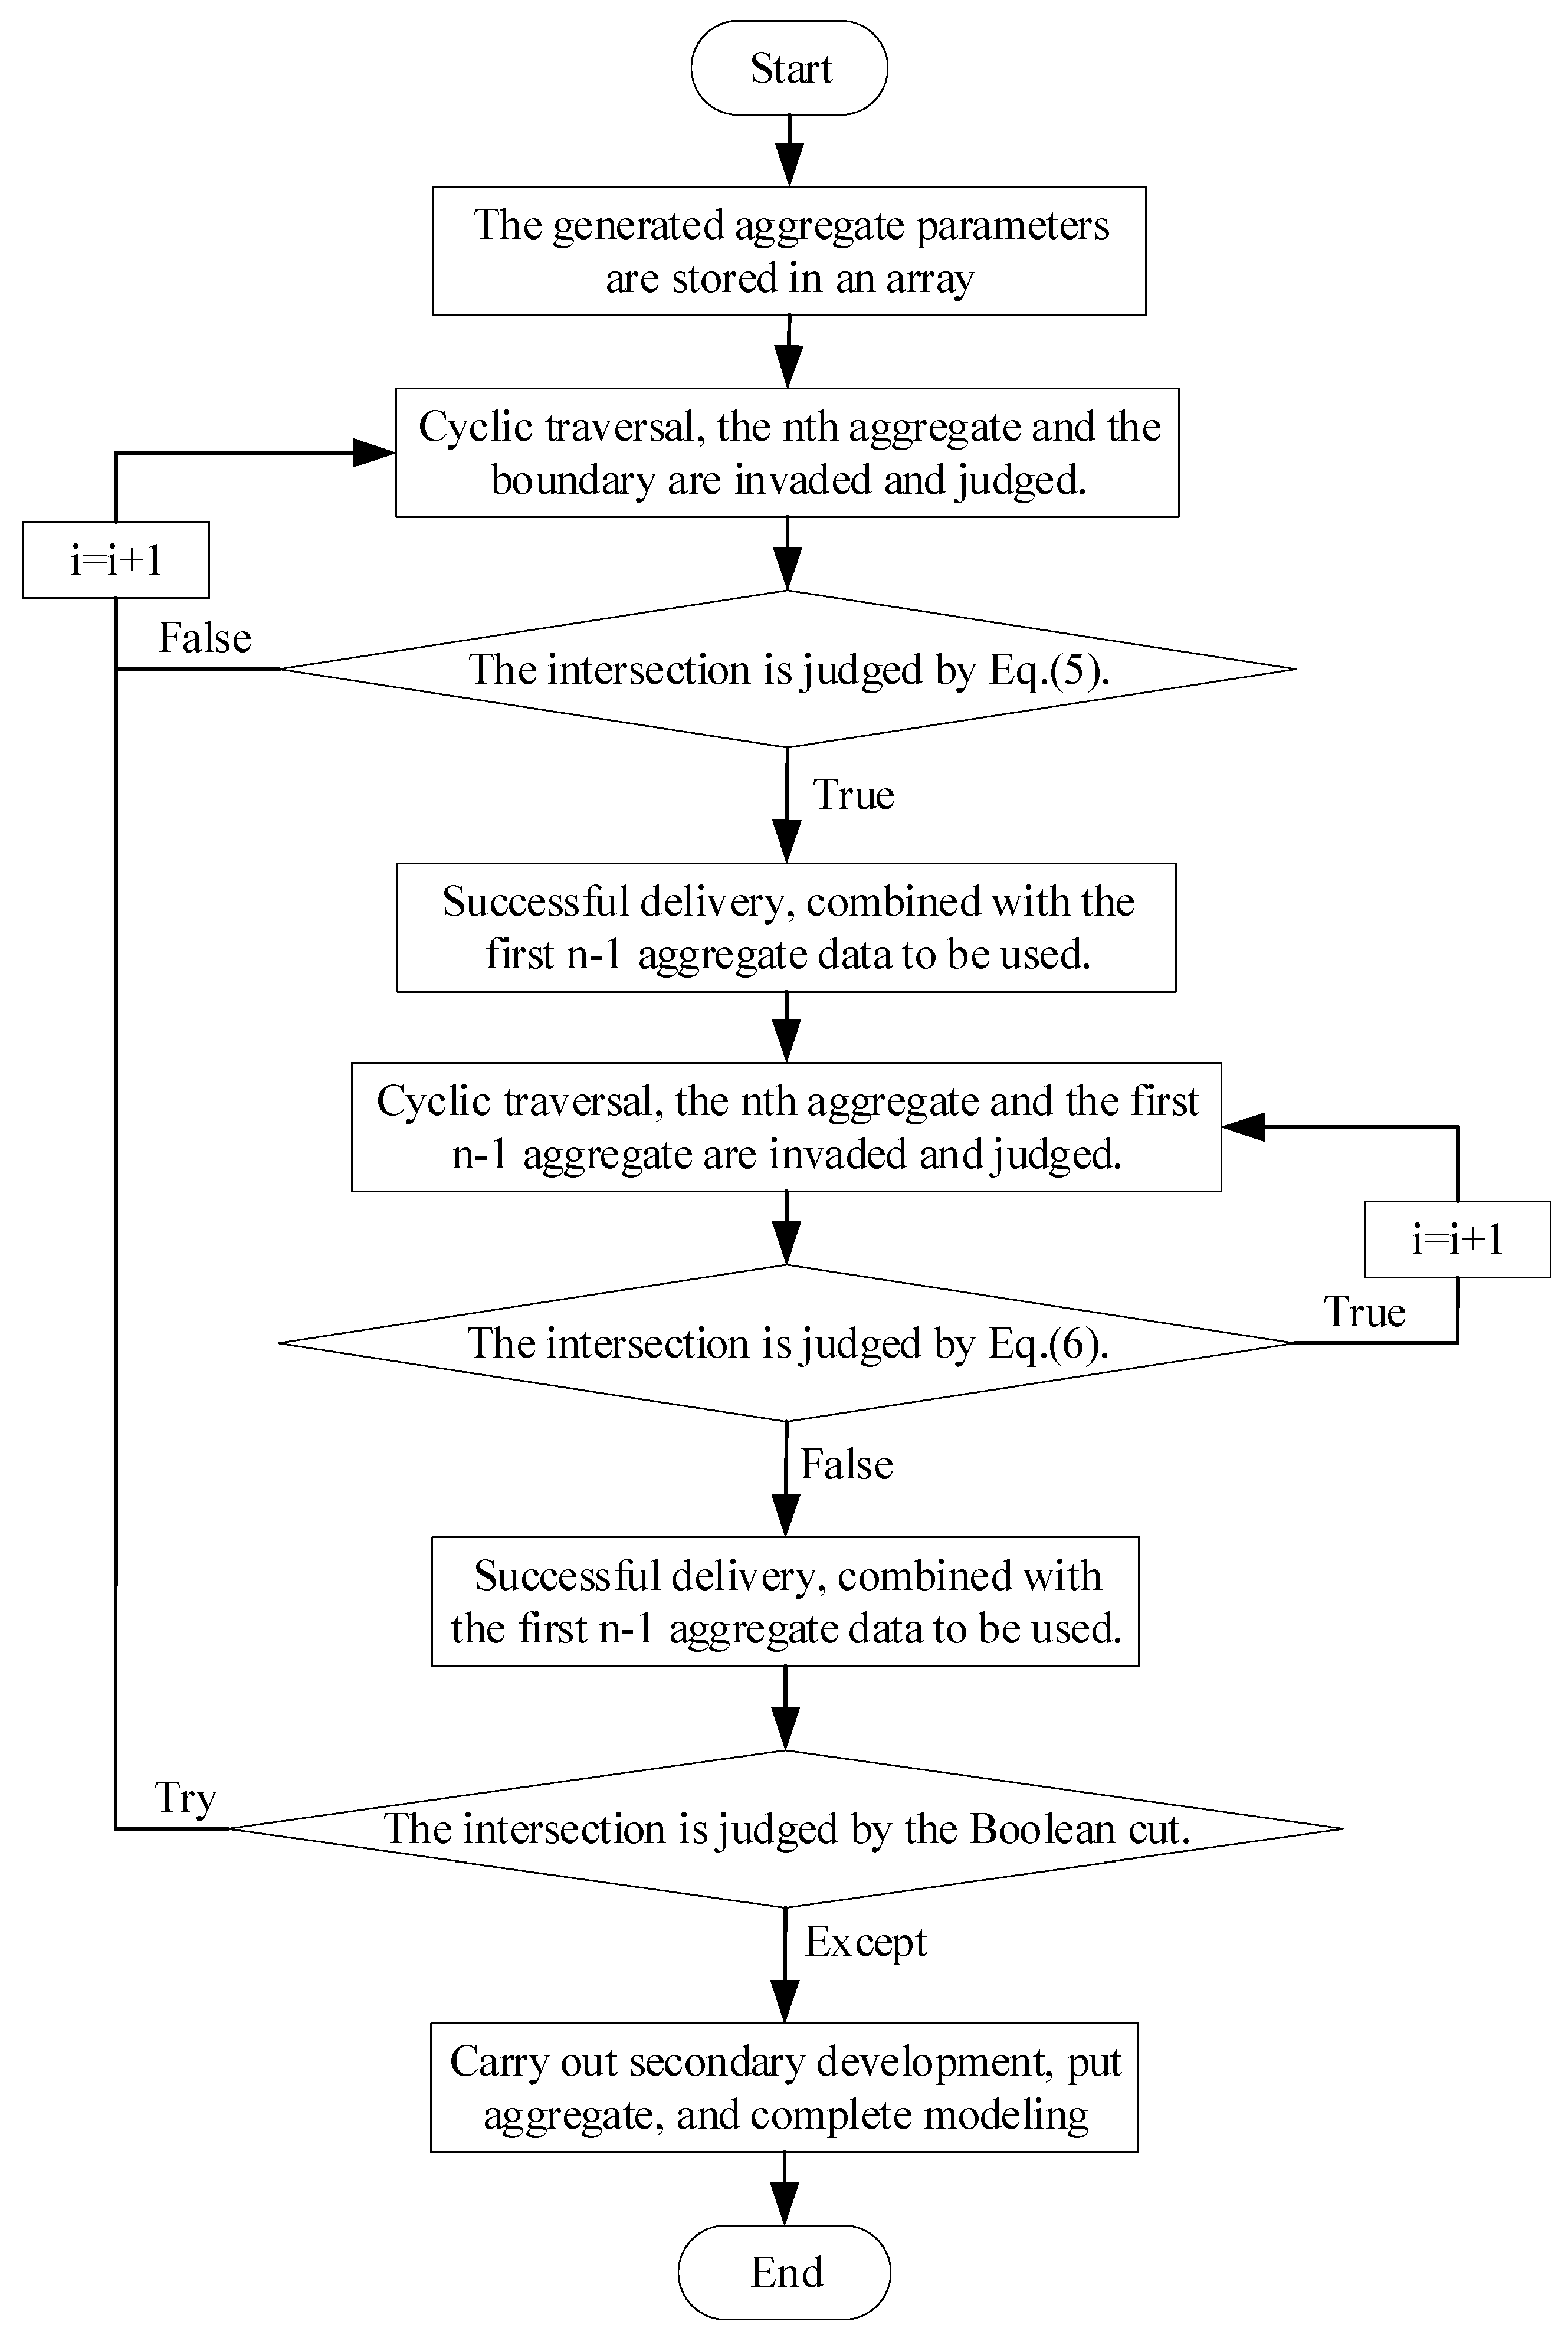
After the aggregate particles are generated according to the volume fraction and particle size range, the delivery test is conducted. The key to aggregate delivery is intrusion discrimination. In this paper, a Boolean cutting intrusion discrimination method proposed by Wu et al. [35] that can increase the volume content of the delivered aggregate is used as a reference, and an algorithm is written to judge the intersection. For the spherical aggregate and aggregate boundary, the specific concepts of this paper are as follows:
Step 1: The generated nth aggregate data are stored in the defined array.
Step 2: The valid data stored in the first step are traversed by for in range ( ), and the boundary between the sand and loess aggregate and cylinder is judged in turn. The Boolean-type True and False statements in Python language are used to test whether they intersect, and the judgment formula is shown in Equation (5). If it is False, the aggregate intersects with the boundary (failed test). If it is True, the aggregate does not intersect with the boundary (successful test).
Step 3: The aggregate that fails to be judged is returned to the second step to continue the delivery, and the aggregate that is judged to be successful is merged with the first n − 1 aggregate, and the data are saved and stored in the corresponding array for use.
Step 4: The valid data stored in the third step are circulated and traversed by for in range ( ), and the intrusion discrimination between sand and sand aggregate, sand and loess aggregate, loess and loess aggregate is carried out in turn. The judgment formula is shown in Equation (6). If it is False, the aggregate does not intersect with the previous aggregate (successful test). If it is True, the aggregate intersects with the previous aggregate (failed test).
Step 5: The aggregate that fails to be judged is returned to the fourth step to continue the delivery, and the aggregate that is judged to be successful is merged with the first n − 1 aggregate, and the data are saved and stored in the corresponding array for use.
Step 6: The effective data in the SphereDatas_xyzr[ ] array are put into the generation, and then the SphereTDatas_xyzr[ ] array is traversed circularly for the Boolean cutting test. The structural statement ‘try...except’ statement in Python language is used to test whether the cutting is abnormal. If there is no abnormality, the aggregate intersects with the previous aggregate (failed delivery). If there is an abnormality, the aggregate does not intersect with the previous aggregate (successful delivery).
Step 7: Using Python language, Abaqus secondary development is completed to generate contour map-positioning axis-part assembly, sand and loess aggregate parts are put into production, and the assembly is completed.
The results are summarized in Figure 3, and the algorithm flow is shown in Figure 4 The results indicate that the volume fraction ratio of spherical aggregate can approximately reach the predefined volume fraction ratio.
where Rn refers to the radius of the nth randomly generated spherical aggregate; Ri is the radius of the ith randomly generated spherical aggregate; Dmin and Dmax are the minimum and maximum particle sizes in the particle size range; Rc and Hc are the radius and height of the boundary cylinder of the aggregate; Xn, Yn, and Zn are the spatial coordinates of the nth randomly generated aggregate; and Xi, Yi, and Zi are the spatial coordinates of the ith randomly generated aggregate.

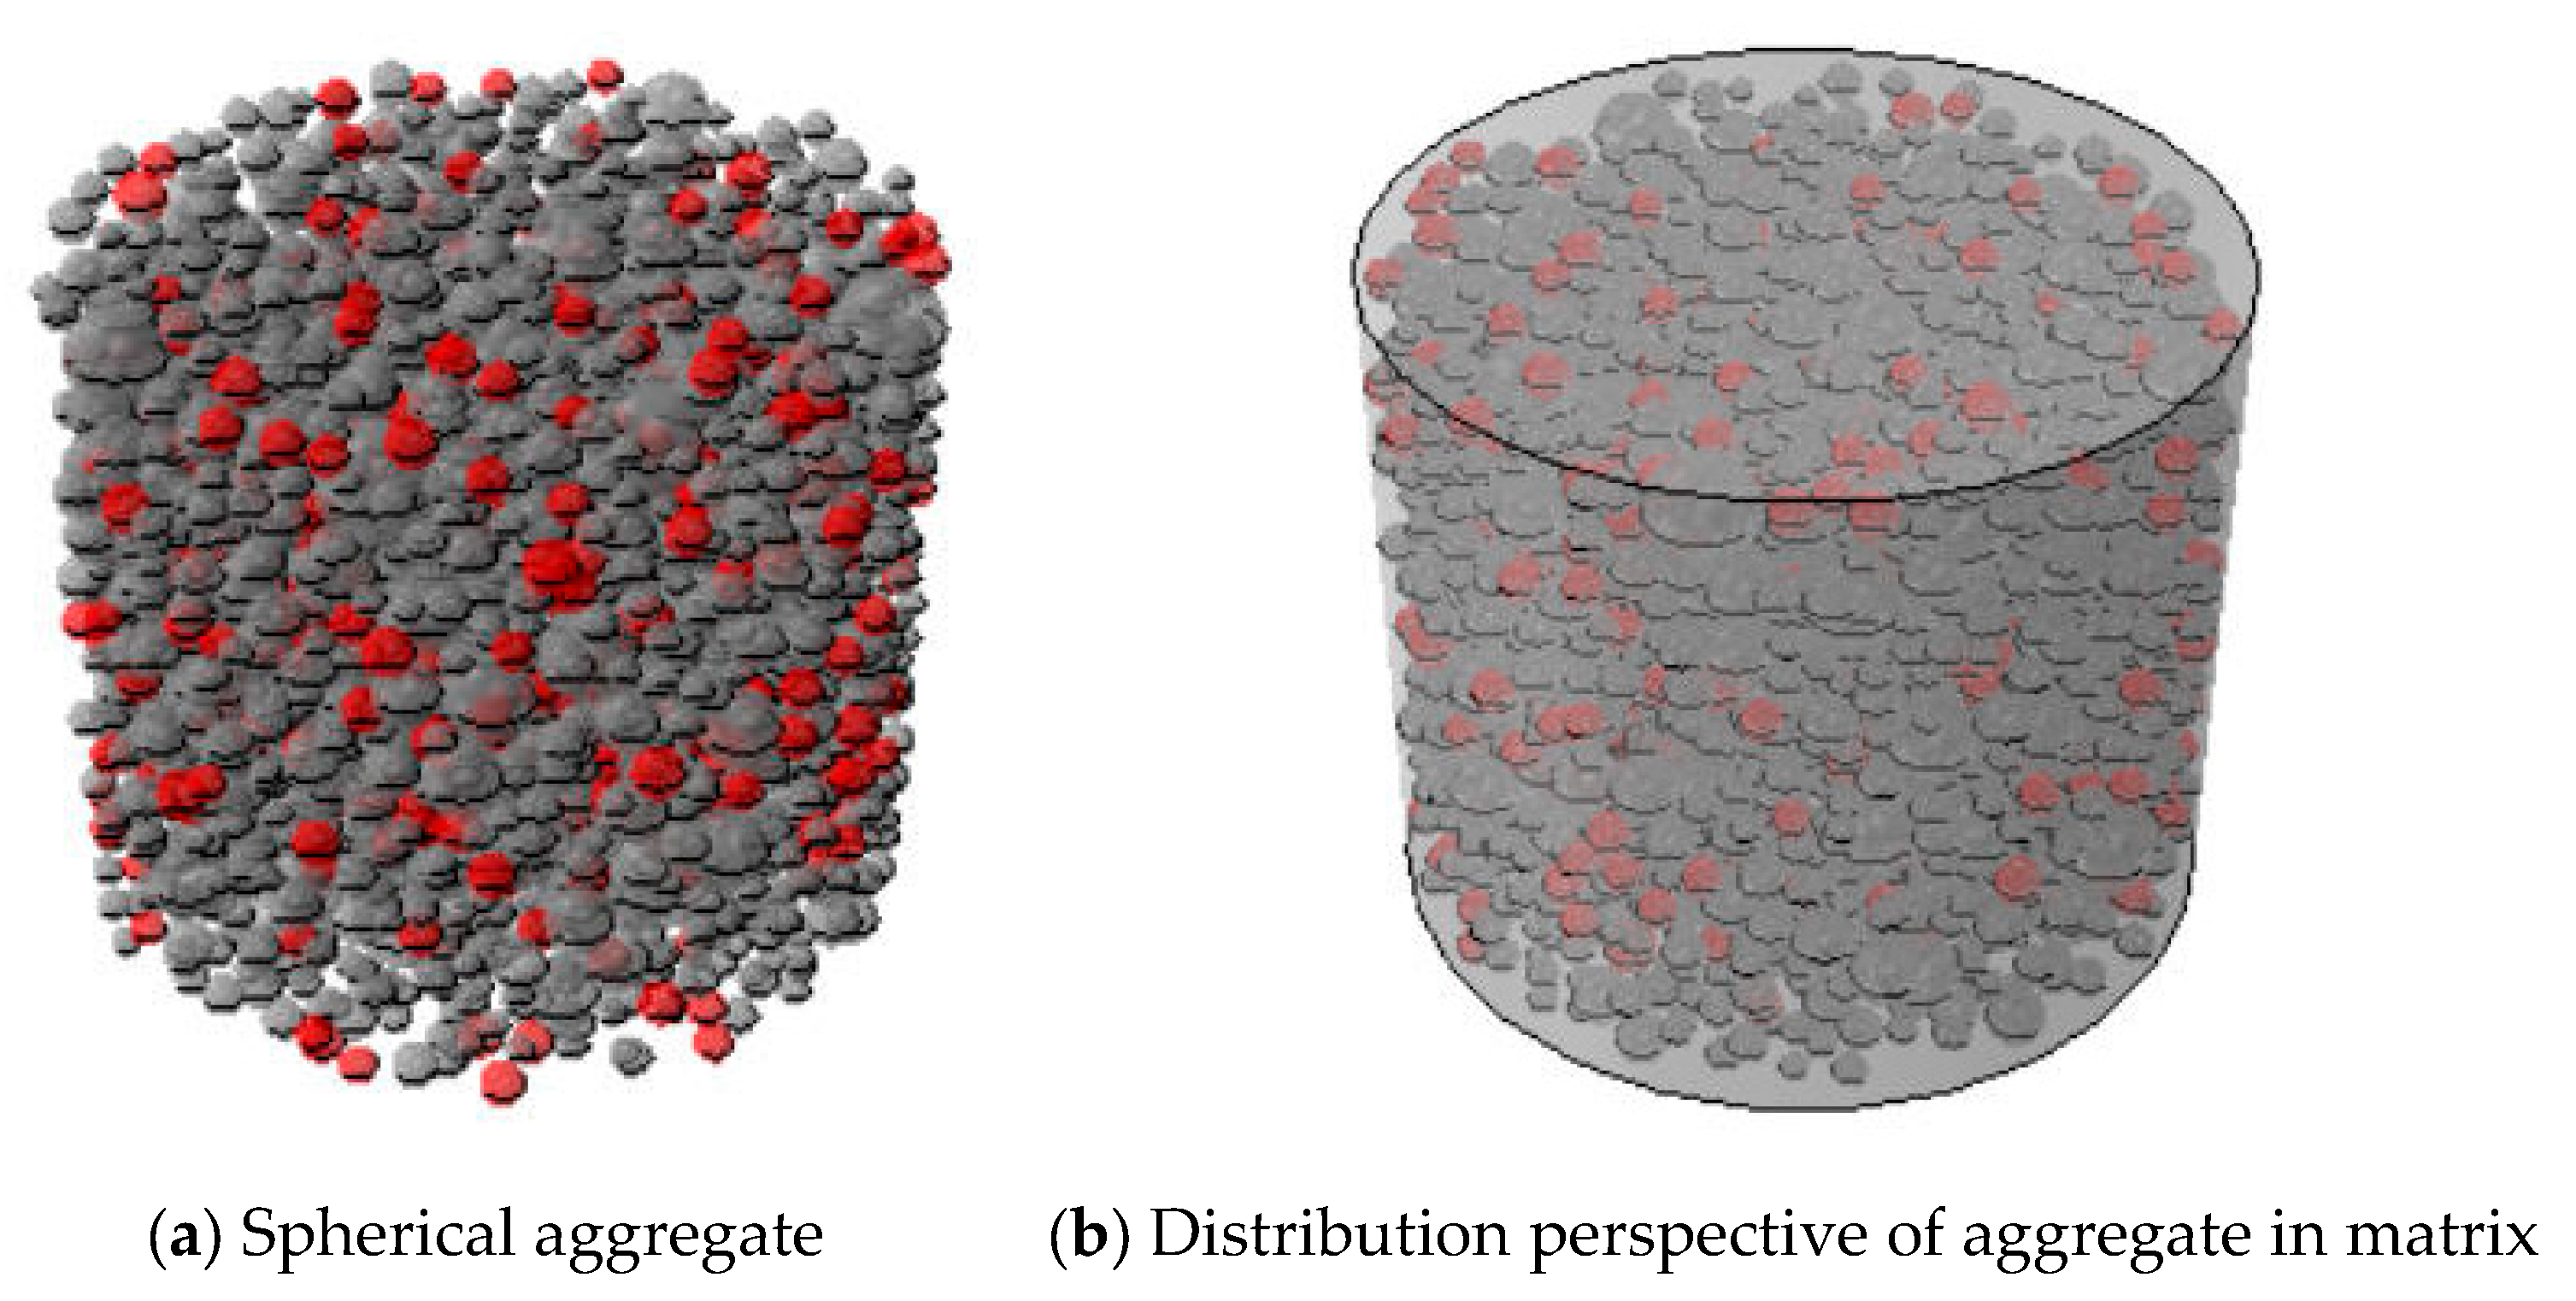
Figure 3.
Spherical aggregate and overall distribution map under Fuller gradation.
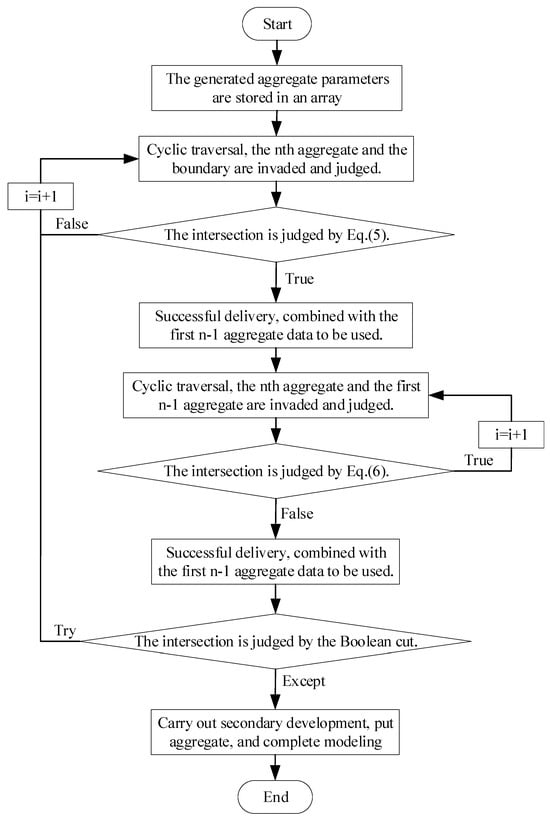
Figure 4.
Aggregate delivery process.
In the above Figure 3, the test cylinder delivery area Rc = 60 mm, and Hc = 100 mm. Gray is sand aggregate, red is loess aggregate, the particle size range is 2–22 mm, sand volume accounts for about 40%, and loess volume accounts for about 10%.
3. Numerical Simulation of Lime–Sand Pile Meso-Model
In this paper, based on the previous ‘Multi-parameter experimental study on the expansion force of lime-sand pile’ carried out by our research group, the validity of the meso-model of a lime–sand pile is verified.
3.1. Determination and Verification of Microscopic Parameters
In order to be consistent with the actual test, a finite element model of a cylindrical lime–sand pile with Rc = 50.25 mm and Hc = 50 mm was generated to simulate the static expansion under uniaxial temperature load. Before the formal loading simulation, it is necessary to accurately calibrate the meso-parameters of the model. The accuracy of the meso-model is closely related to its meso-mechanical parameters, which directly influence the mechanical behavior of the model at the macro level.
The lime, soil, and sand used in the test were all taken from the factory cave of Shaanxi in Baoji, China. The soil was loess, and the sand used was medium coarse sand. The detailed parameters of lime and soil are shown in Table 1 and Table 2.

Table 1.
Composition of lime.
Table 2.
Parameters of soil.
Because the sand aggregate has high hardness and is not sensitive to temperature, the content of loess aggregate is low, and its expansion effect is not significant, so the expansion of the two is not considered, which is simplified as the expansion reaction force generated by the hydration reaction of the lime matrix. Based on the theory of continuous medium, the deformation measured by the experiment is very small, and the numerical simulation is only for the overall change of its elastic stage, so the linear elastic constitutive relation is adopted. The stress–strain curve shows a one-to-one linear relationship, and the expression formula is ; that is, it obeys Hooke’s law.
The calculation of the equivalent thermal expansion coefficient, which reflects the overall thermal expansion behavior of composite materials, is crucial for analyzing the thermal deformation in composite structures and evaluating the reliability of structures. Due to the large investment in the testing of the thermal expansion coefficient, this paper uses the classical thermal expansion coefficient theory Kerner model [36] for trial prediction. The model is derived from the particle inclusion composite material, which is suitable for a variety of isotropic materials. The formulas are Equations (7) and (8):
where Vi refers to the volume ratio of each component, Ki is the bulk modulus of each component, the bulk modulus is related to the Young’s modulus and Poisson’s ratio, and αi is the thermal expansion coefficient of each component. K0 is the bulk modulus of the composite material, G0 is the shear modulus of the composite material, and the shear modulus is related to the Young’s modulus and Poisson’s ratio.
Based on the thermal expansion coefficient predicted by the formula, the finite element simulation inversion method is employed to determine the linear expansion coefficient of the lime–sand pile. After each simulation, according to the comparison between the obtained simulation results and the actual test, the mesoscopic parameter values are continuously adjusted until the results obtained by the finite element simulation method are basically consistent with the actual phenomenon, so that the established finite element model can effectively simulate the expansion reaction force of a lime–sand pile under different working conditions. The theoretical formula and correction coefficient for the expansion force will be derived and applied to engineering practice.
Finally, the mechanical parameters of the lime–sand pile matrix and aggregate are shown in Table 3.
Table 3.
Mechanical parameters of lime–sand pile.
3.2. Mesh Generation of Mesoscopic Model
Through the algorithm presented in the second section, in the process of parametric modeling of the mesoscopic model of a lime–sand pile, the aggregate and the matrix are independent of each other. In the next meshing process, the method seedPart( ) and ElemType( ) are directly called by script program to set the unit size and unit type of aggregate and lime matrix, respectively, which can avoid complex unit attribute discrimination and improve the calculation efficiency.
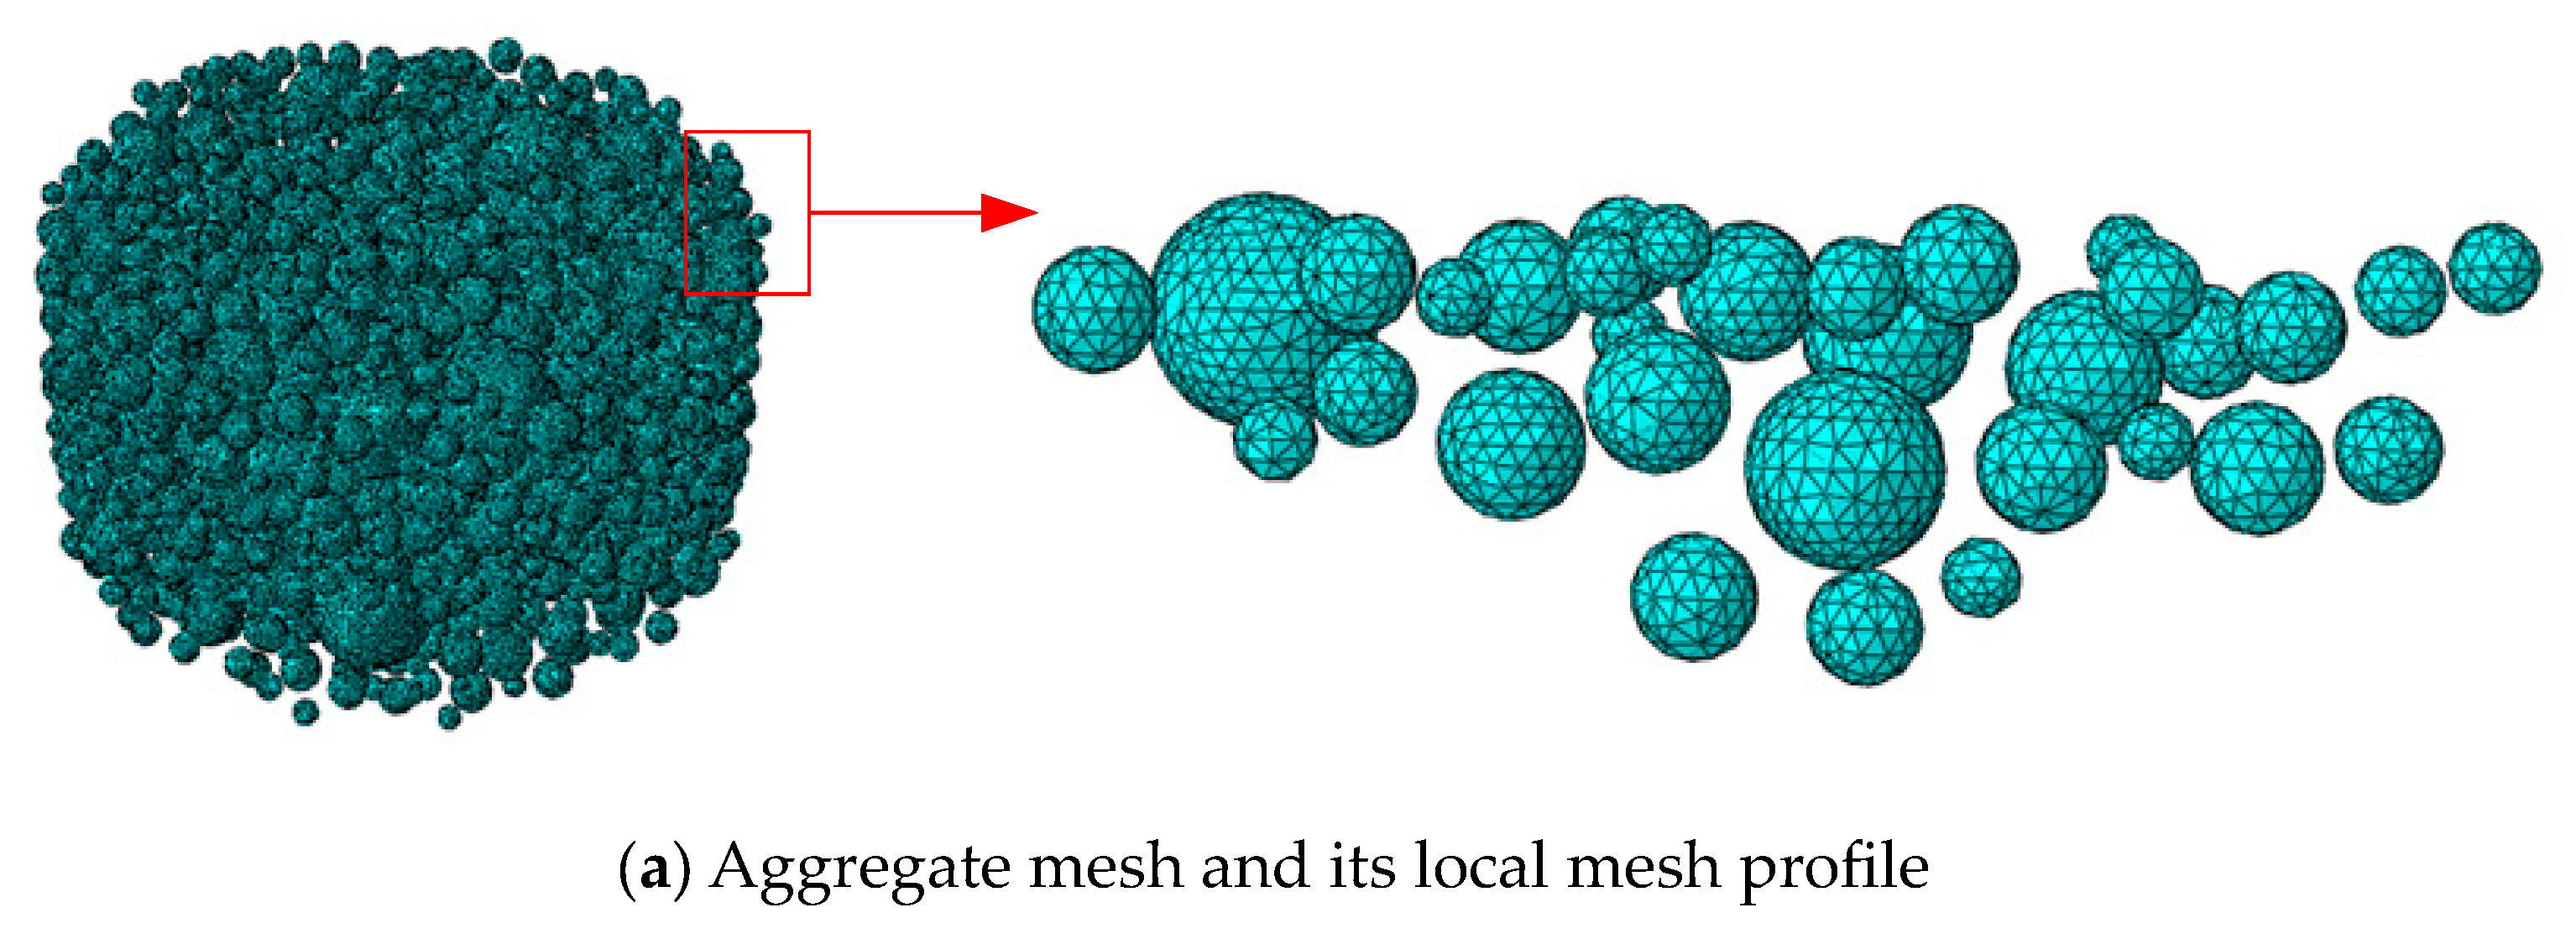
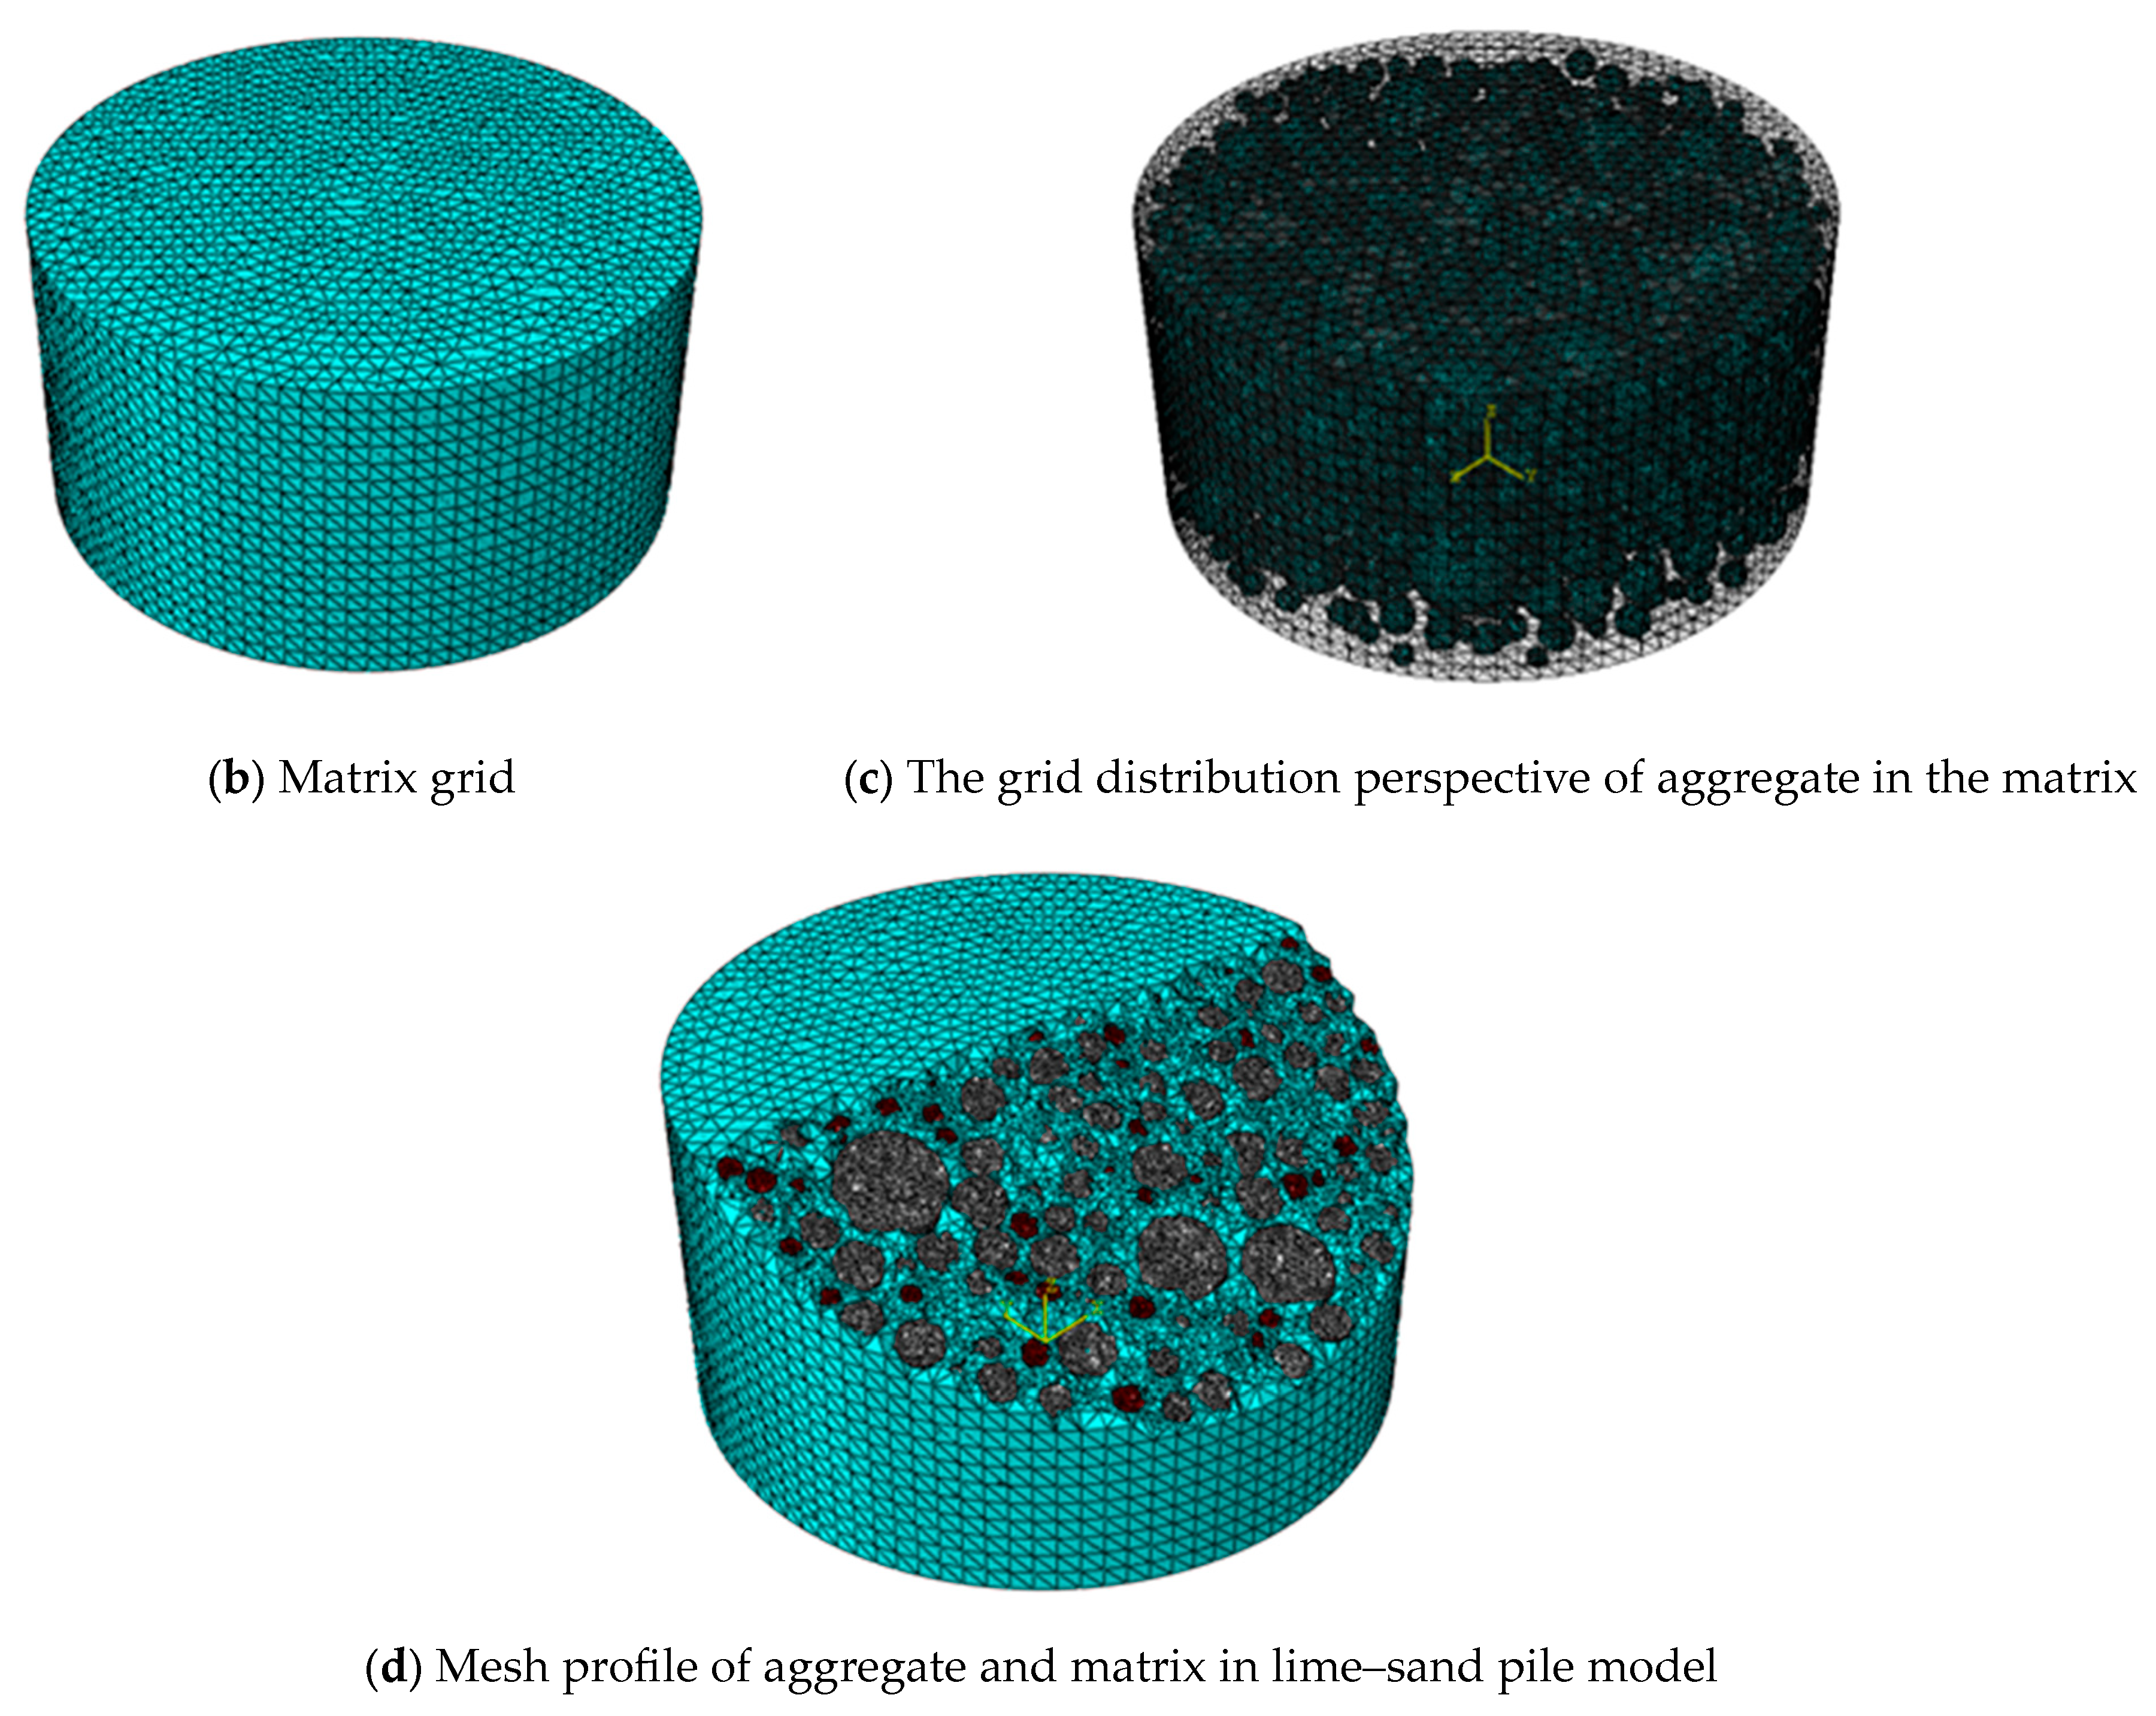
Due to the large number of aggregated components and grid generation units, more computing environments and computing time may be required. The element meshing of the sphere is relatively simple, and there is no need to add nodes for integral calculation. Therefore, the four-node linear tetrahedral element (C3D4) is used in this paper to facilitate the simulation calculation. In summary, the generated mesoscopic model is meshed, and the mesh results of the aggregate and matrix are illustrated in Figure 5.
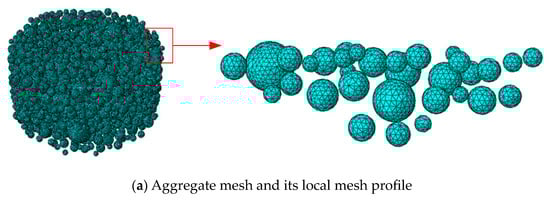

Figure 5.
Grid division of lime–sand pile model.
Finally, the grid subdivision is checked. Taking M-5:4:1 as an example, the data of the divided grid units are organized as shown in Table 4. From the table, it is evident that the model needs to be divided into many grid units, and the obtained grid division can fully meet the needs of finite element analysis, which will provide the basis for the subsequent numerical simulation of micromechanics.
Table 4.
Table of grid element numbers.
3.3. Static Simulation Analysis
3.3.1. Different Mixing Ratio Simulation Analysis
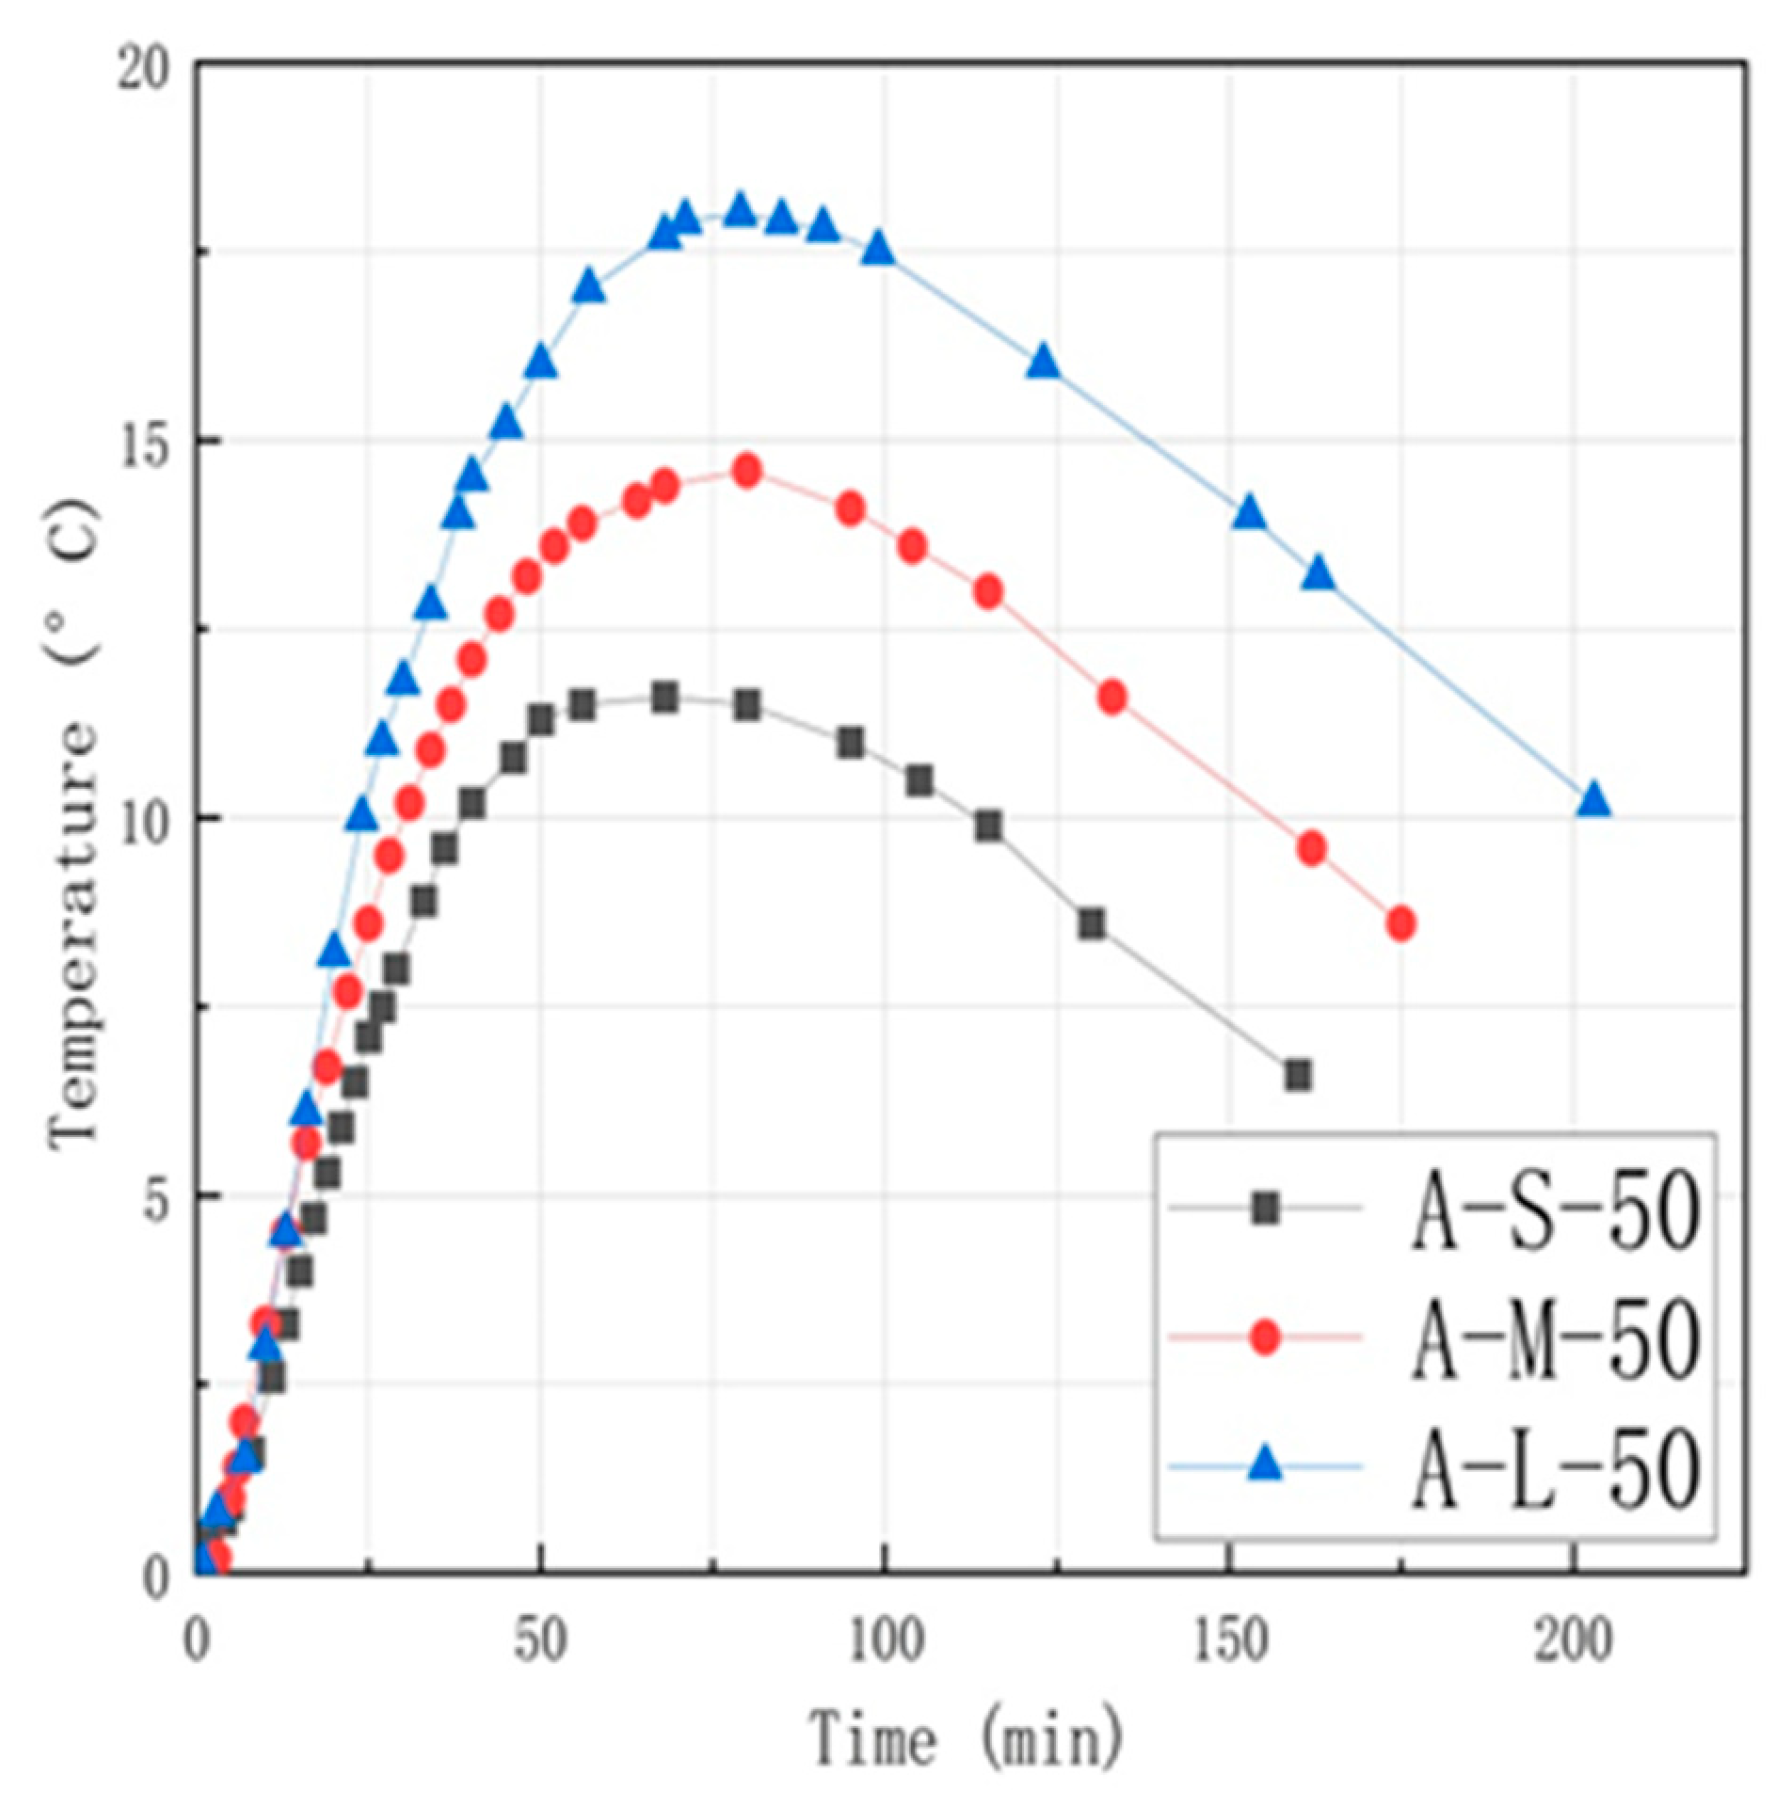
There are many parameters that affect the performance of a lime–sand pile, among which the mix ratio has a certain influence on the performance of a lime–sand pile. Based on this, the research group carried out an expansion force and temperature test of lime/sand/loess with different mixing ratios of 4:5:1, 5:4:1 and 6:3:1. The lime particle size was 1 mm and the sample height was 50 mm. The first part of the name of the test piece ‘A’ represents the normalized lime; the second part is the mix ratio: ‘S’ represents 4:5:1, ‘M’ represents 5:4:1, ‘L’ represents 6:3:1; and the third part is the height of the test piece. The temperature rise curves under different mix ratios are obtained as shown in Figure 6.
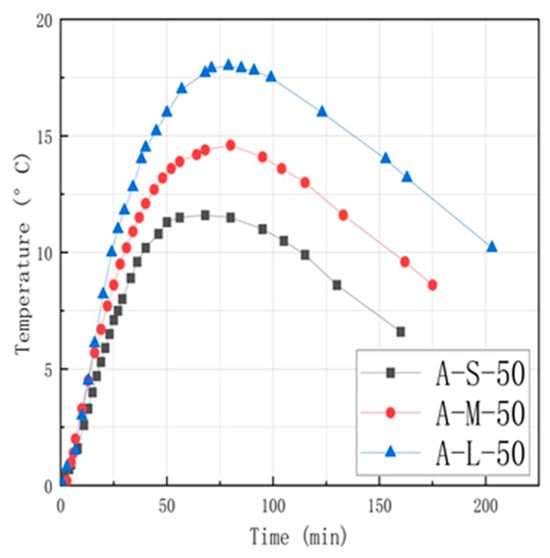
Figure 6.
Comparison of test temperature curves of different mixing ratios.
The change law of the temperature curve can be divided into two stages: a rising stage and a falling stage. When the reaction is carried out for 70–80 min, the three groups of samples reach the average peak temperatures, which are 11.6 °C, 14.5 °C, and 18.1 °C respectively. The peak temperature also increases with the increase in lime proportion. The mix ratio increases from 4:5:1 to 5:4:1, and then from 5:4:1 to 6:3:1, the increase is about 20% and then enters the falling stage. The lime digestion and exothermic process of A-S-50, A-M-50, and A-L-50 absorbed 350 mL, 400 mL, and 500 mL water, respectively, and the water absorption rate increased continuously. The curve data are used for the model temperature load setting.
The expansion force curves of different mix proportion tests with time are shown in Figure 7 below.
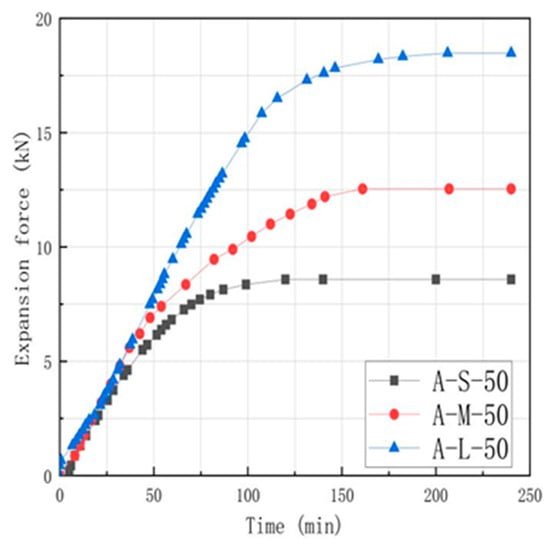
Figure 7.
Comparison of expansion force tests with different mixing ratios.
After the test reaches the stable stage, the average expansion forces of A-S-50, A-M-50, and A-L-50 are 8.58 kN, 12.37 kN, and 18.48 kN respectively. With the increase in lime proportion, the expansion force increases by about 45%.
In this paper, the verified mesoscopic parameters and the temperature rise curve obtained from the test (Figure 6) are input into the model as temperature loads. The dynamic explicit analysis method is used to set the analysis step. The specific way of loading and constraint is to couple the reference points RP-1 and RP-2 on the upper and lower bottom surfaces and add the corresponding boundary conditions (U3 = 0) so that the cylinder cannot move in the Z direction. The corresponding boundary conditions (U1 = 0, U2 = 0) are applied to the cylinder so that it cannot move in the X and Y directions. Under the action of temperature load, parameters such as stress, strain, displacement, and reference point reaction force are required to be output. The specific loading diagram is depicted in Figure 8.
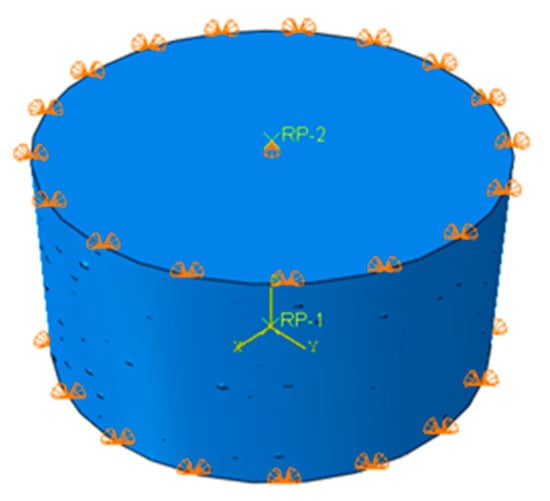
Figure 8.
Model loading schematic.
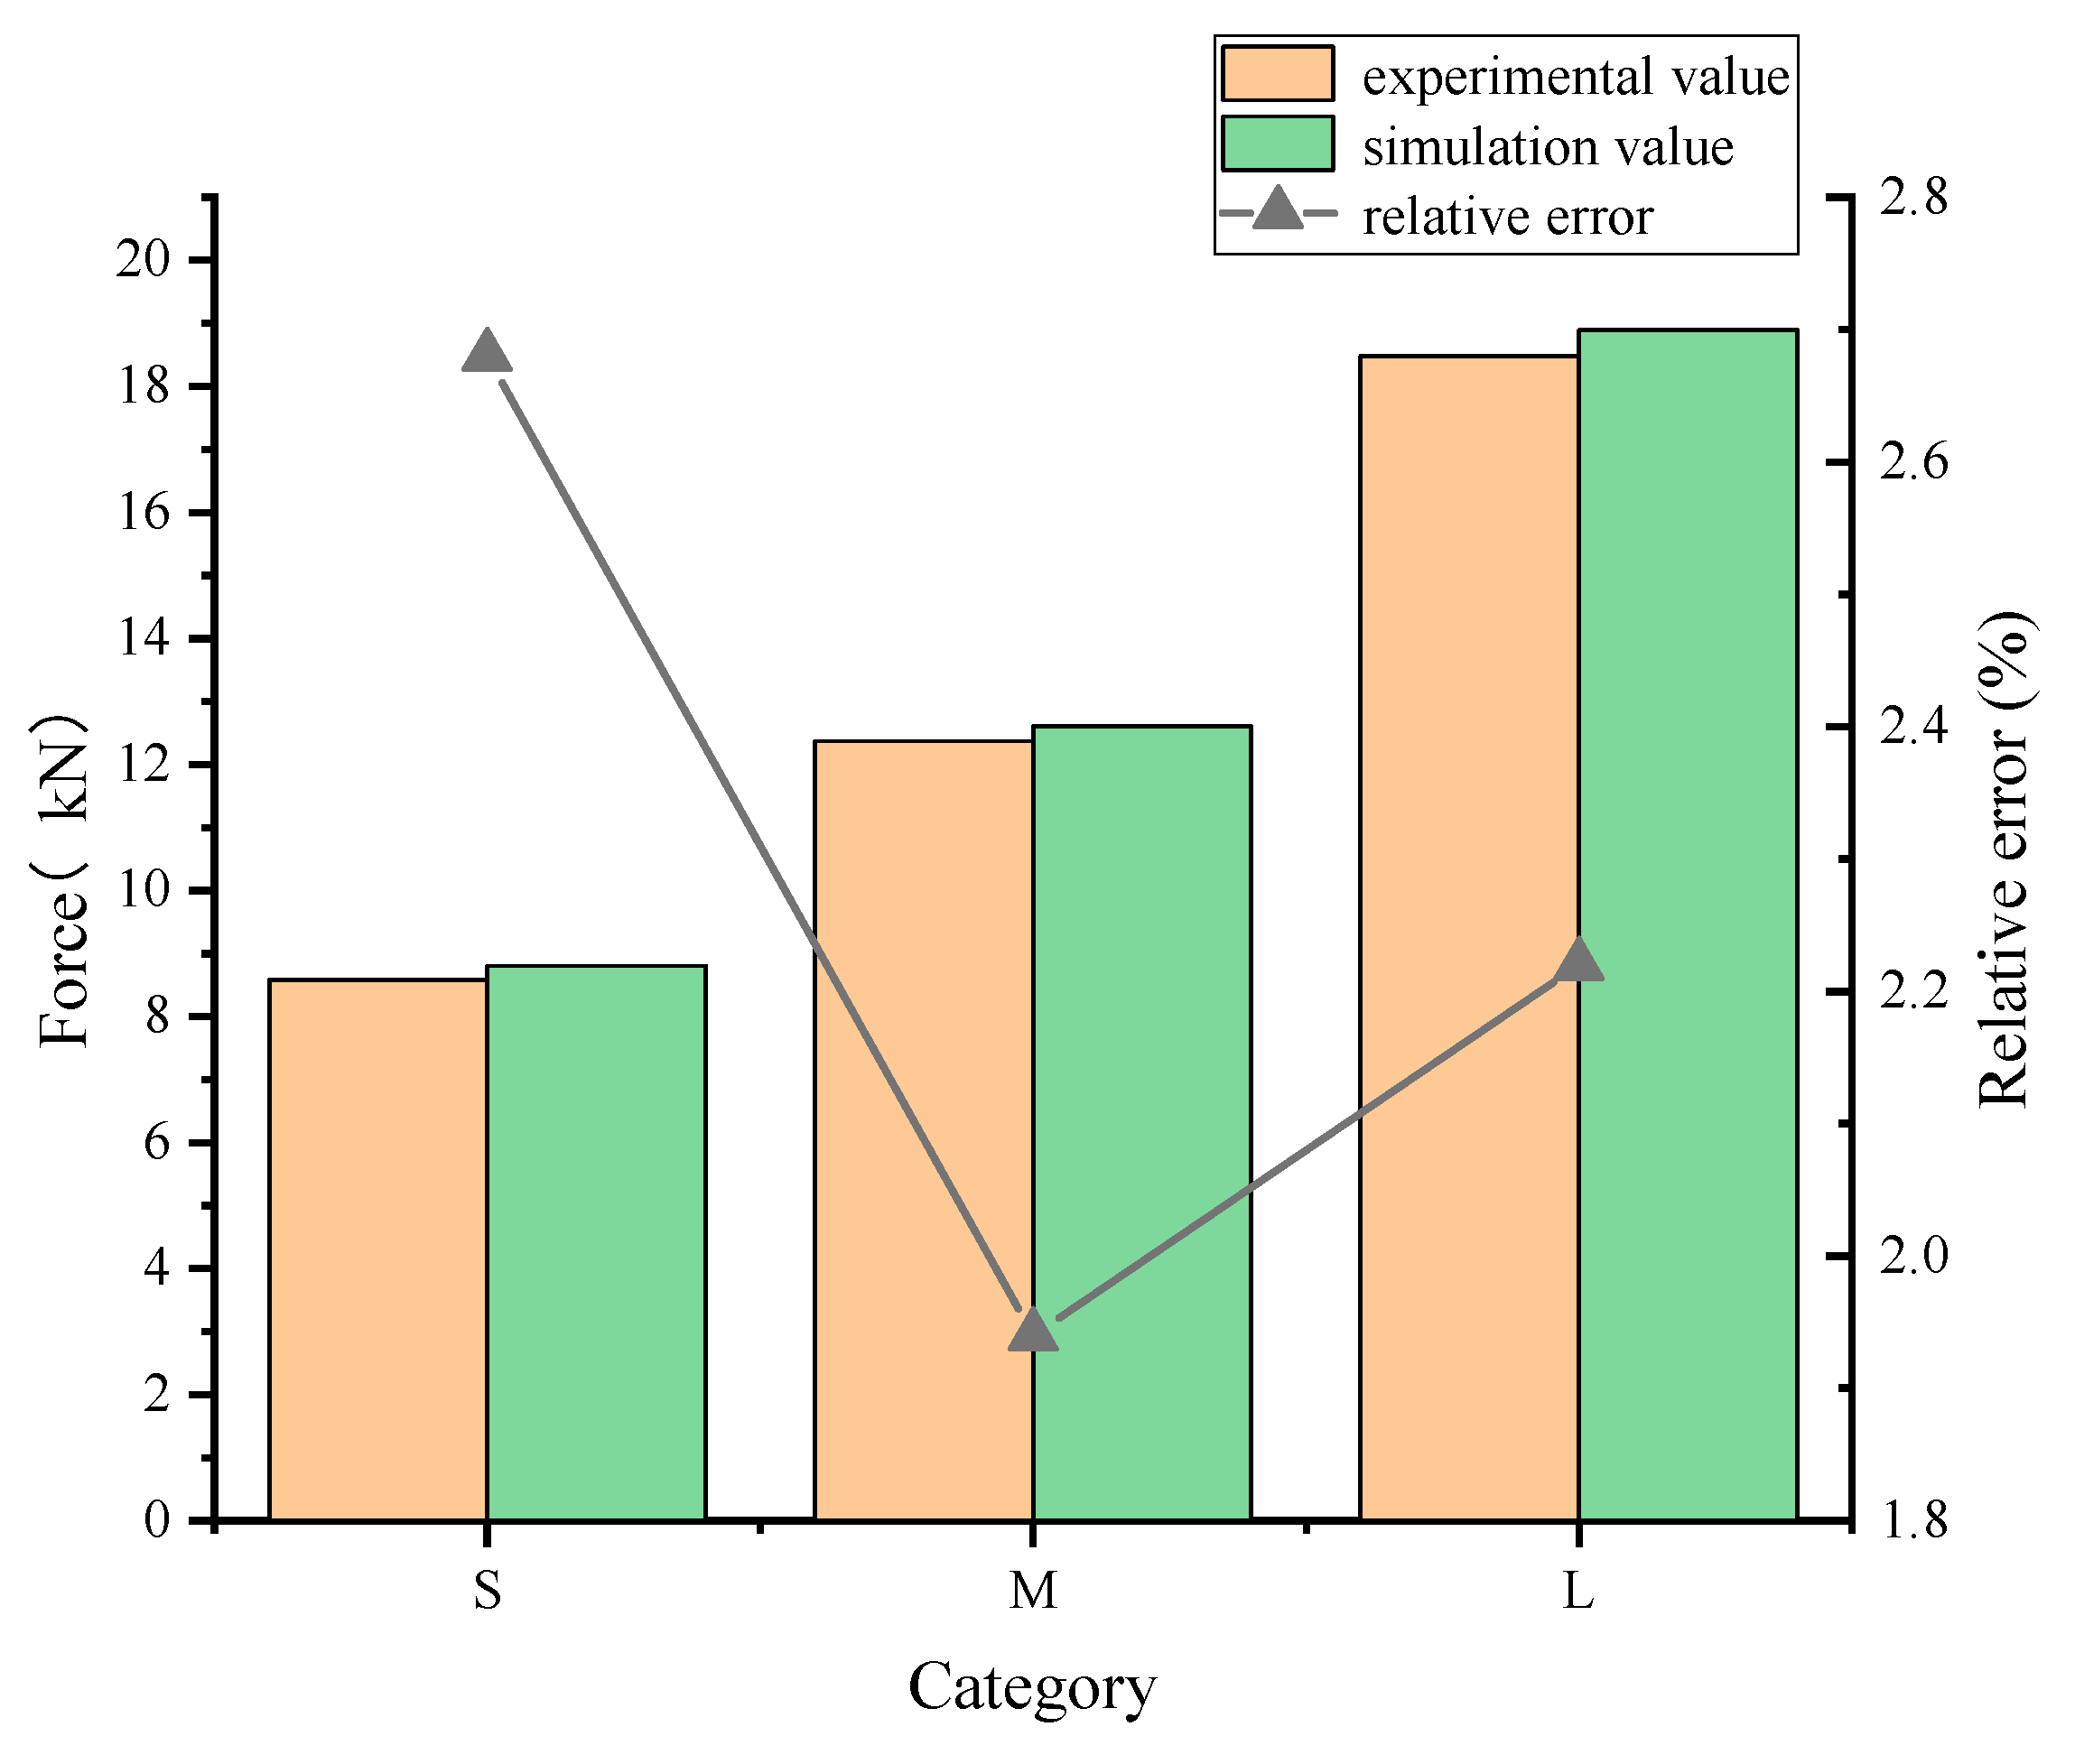
The expansion reaction force of different mix ratios of a lime–sand pile under the corresponding temperature load is obtained. Compared with the test, the summary results are shown in Table 5, as shown in Figure 9. Taking the 5:4:1 mixture ratio as an example, the variation curve of the expansion reaction force of the lime–sand pile with time is simulated, and the test is shown in Figure 10.
Table 5.
Summary of lime–sand pile proportioning test results and numerical simulation data.
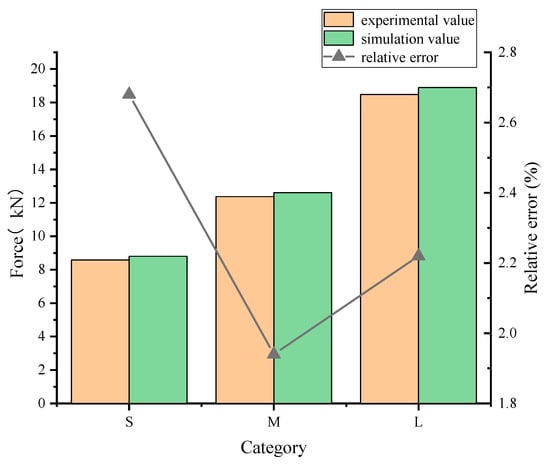
Figure 9.
Comparison of lime–sand pile proportion test results with numerical simulation.
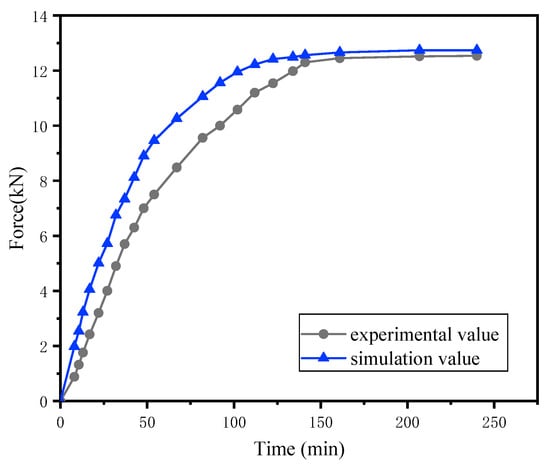
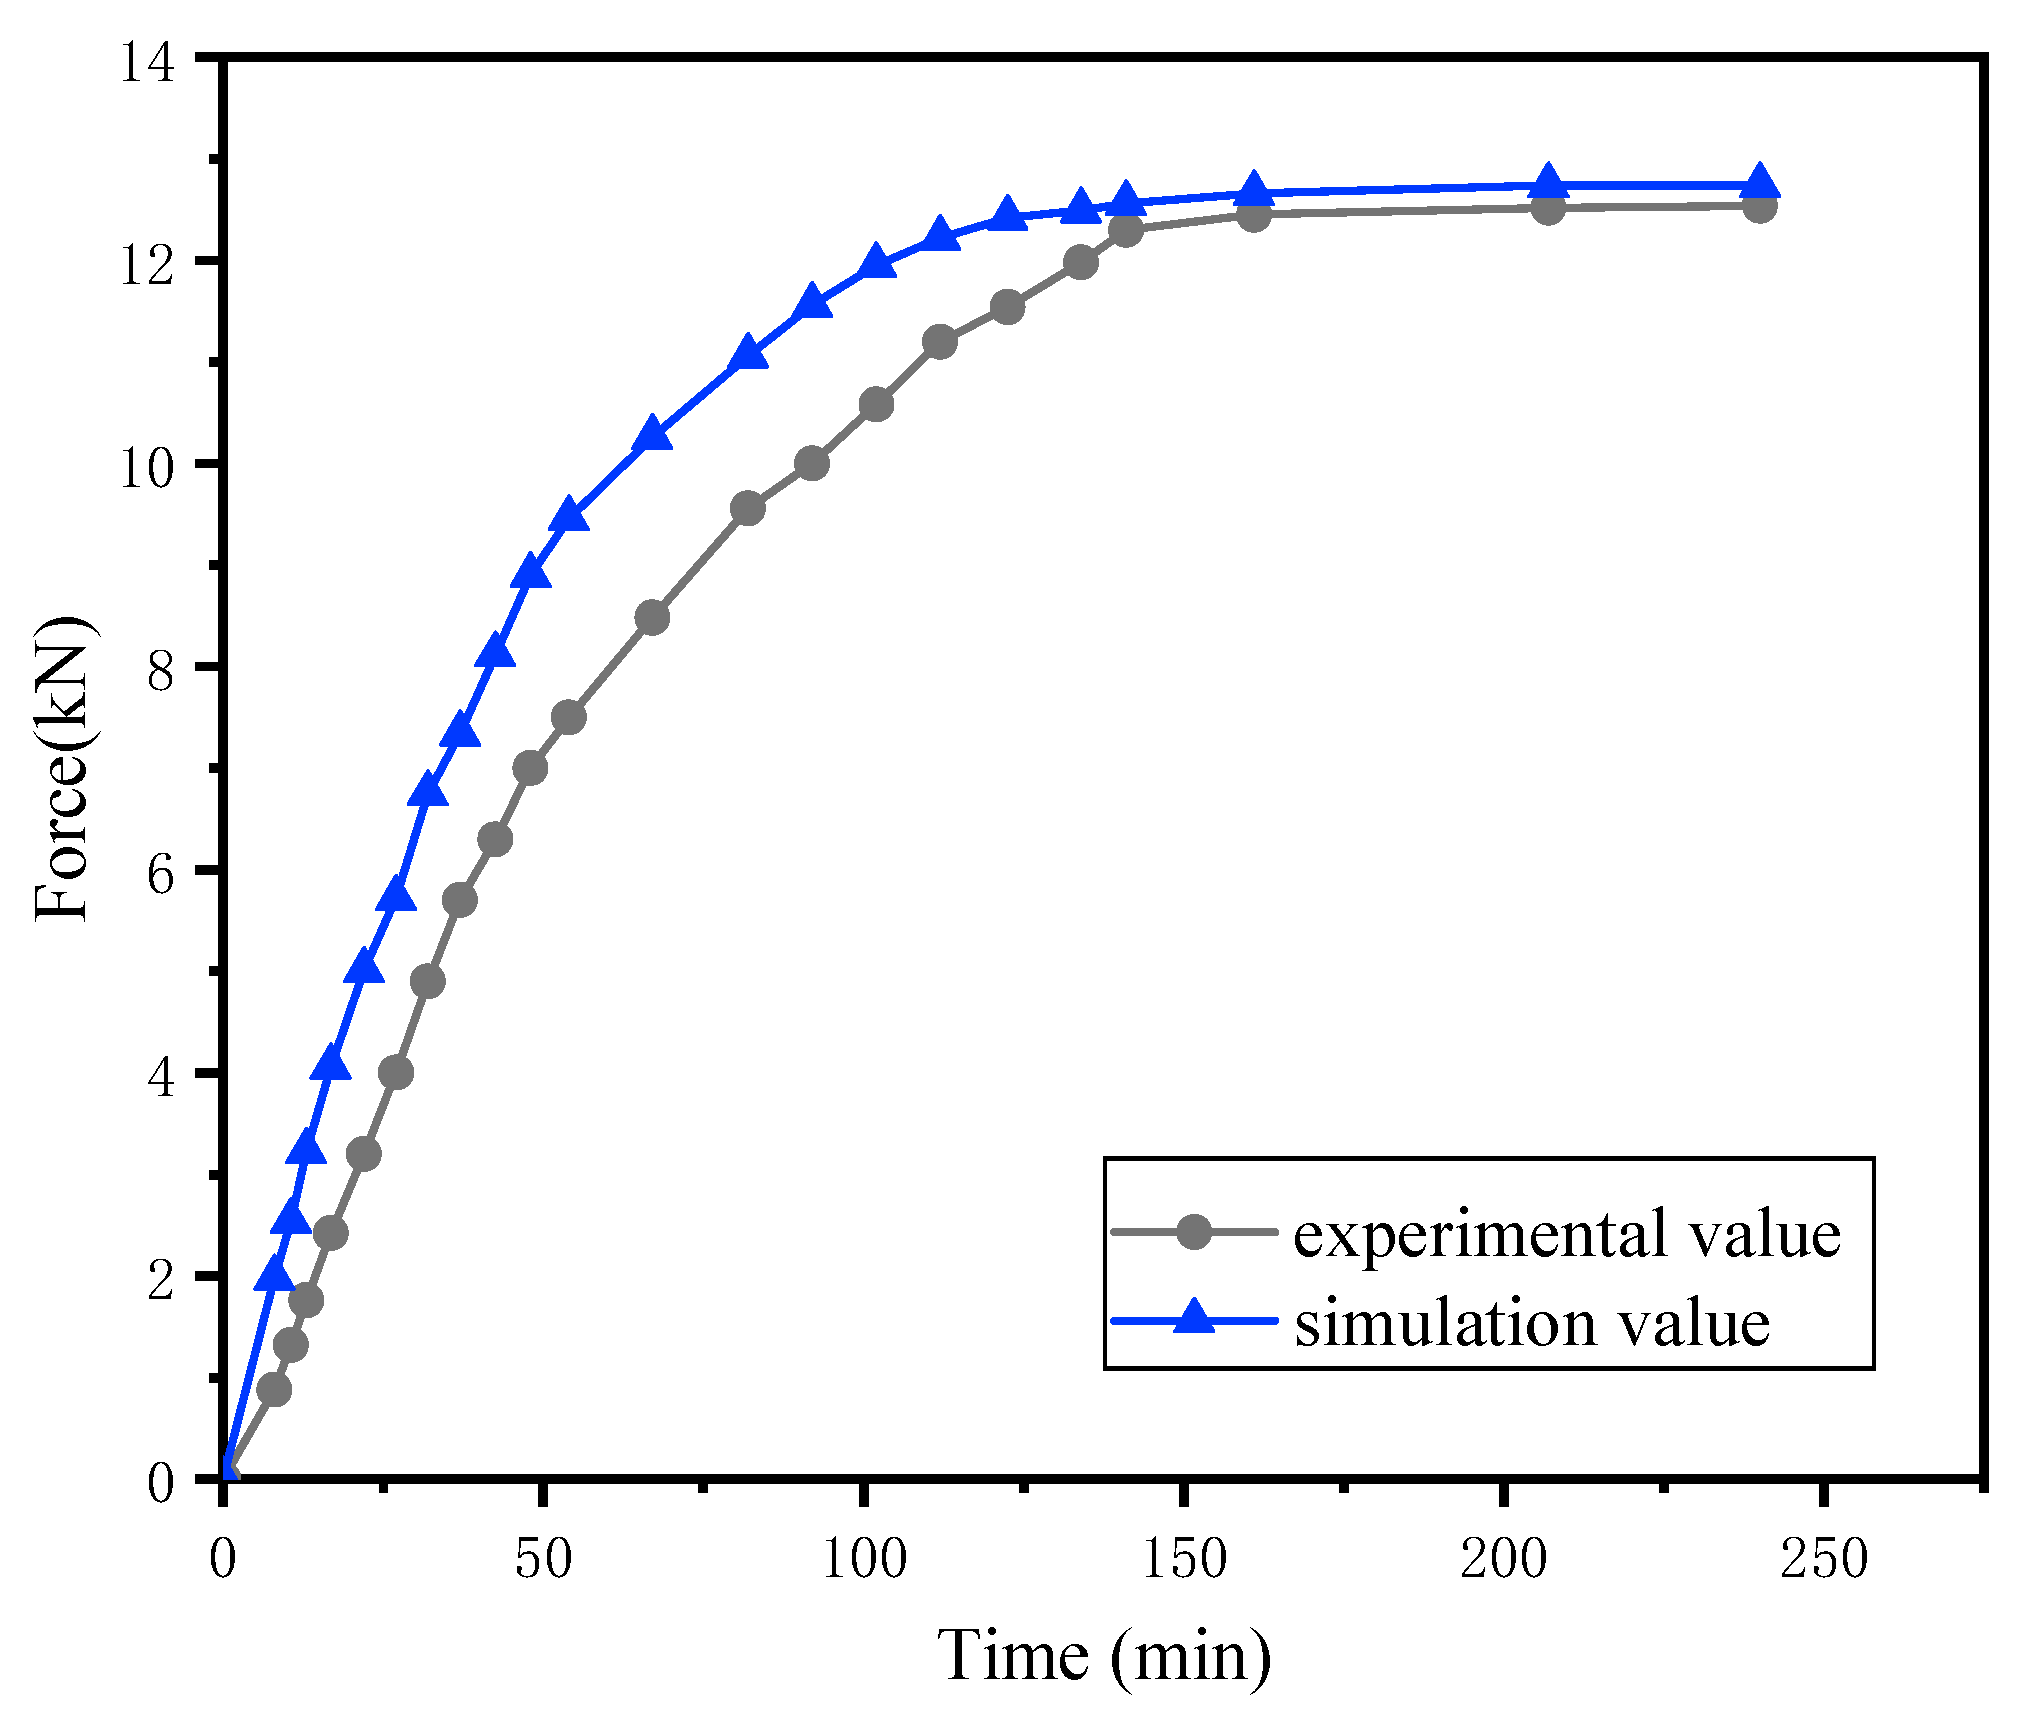
Figure 10.
Variation curve of expansion force of lime–sand pile.
After simulation, the expansion forces of A-S-50, A-M-50, and A-L-50 are 8.81 kN, 12.61 kN, and 18.89 kN, respectively. It can be seen from the change curve of the expansion reaction force of the lime–sand pile obtained from the calculation results that with the increase in time, the expansion force curve can be divided into three stages, namely rapid growth stage, slow growth stage, and stable stage, which is the same as the test law. However, the reaction speed of the simulated specimen is higher than that of the actual test, because the pores between the aggregates are not considered in the modeling process, so the expansion of the lime is larger than that of the test, resulting in a faster change in the expansion force in the process. With the passage of time, the final expansion force tends to be consistent. According to the three groups of mix proportions, with the increase in lime proportion, the expansion force increases by about 45%. The expansion reaction curve obtained based on the mesoscopic model generated by the algorithm in this paper is basically consistent with the test curve, which can better reflect the change process of the expansion reaction generated by the hydration reaction of the lime–sand pile. The size of the expansion reaction is similar to the test results of the laboratory specimens, and the relative error is below 3%. It shows that the mesoscopic model of a lime–sand pile proposed in this paper has certain reliability in simulating the mechanical properties of lime–sand piles.
3.3.2. Simulation Analysis of Different Heights
It is reasonable to set the height of a lime–sand pile to reinforce a foundation, and the influence of the height on the expansion force of a lime–sand pile is a problem often considered in engineering application. Based on this consideration, the research group carried out expansion force and temperature test experiments at different heights of 50 mm, 100 mm, and 150 mm and controlled the particle size of normalized lime to be 1 mm and the mix ratio to be 5:4:1. The temperature rise curves at different heights are shown in Figure 11.
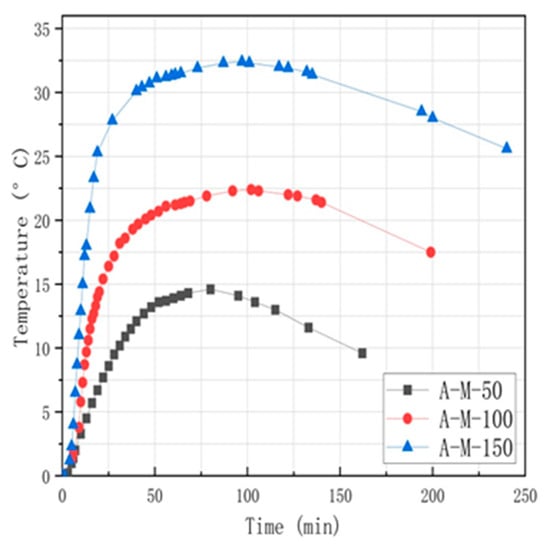
Figure 11.
Comparison of test temperature curves at different heights.
It can be seen from the time–temperature curve in Figure 11 that the reaction rules of the three groups of samples are basically the same, and the curves are divided into a rising stage and a falling stage. The temperature rising peaks of A-M-50, A-M-100, and A-M-150 are 14.5 °C, 22.3 °C, and 32.3 °C. As the height of the sample increases, the heat release rate of the lime–sand pile in the early stage is also faster, and the reaction heat release also increases. For every 50 mm increase in height, the heat release temperature also increases by 30–35%. The lime digestion and exothermic process of A-M-50, A-M-100, and A-M-150 absorbed 400 mL, 490 mL, and 700 mL water, respectively, and the water absorption rate increased continuously. The curve data are used for model temperature load setting.
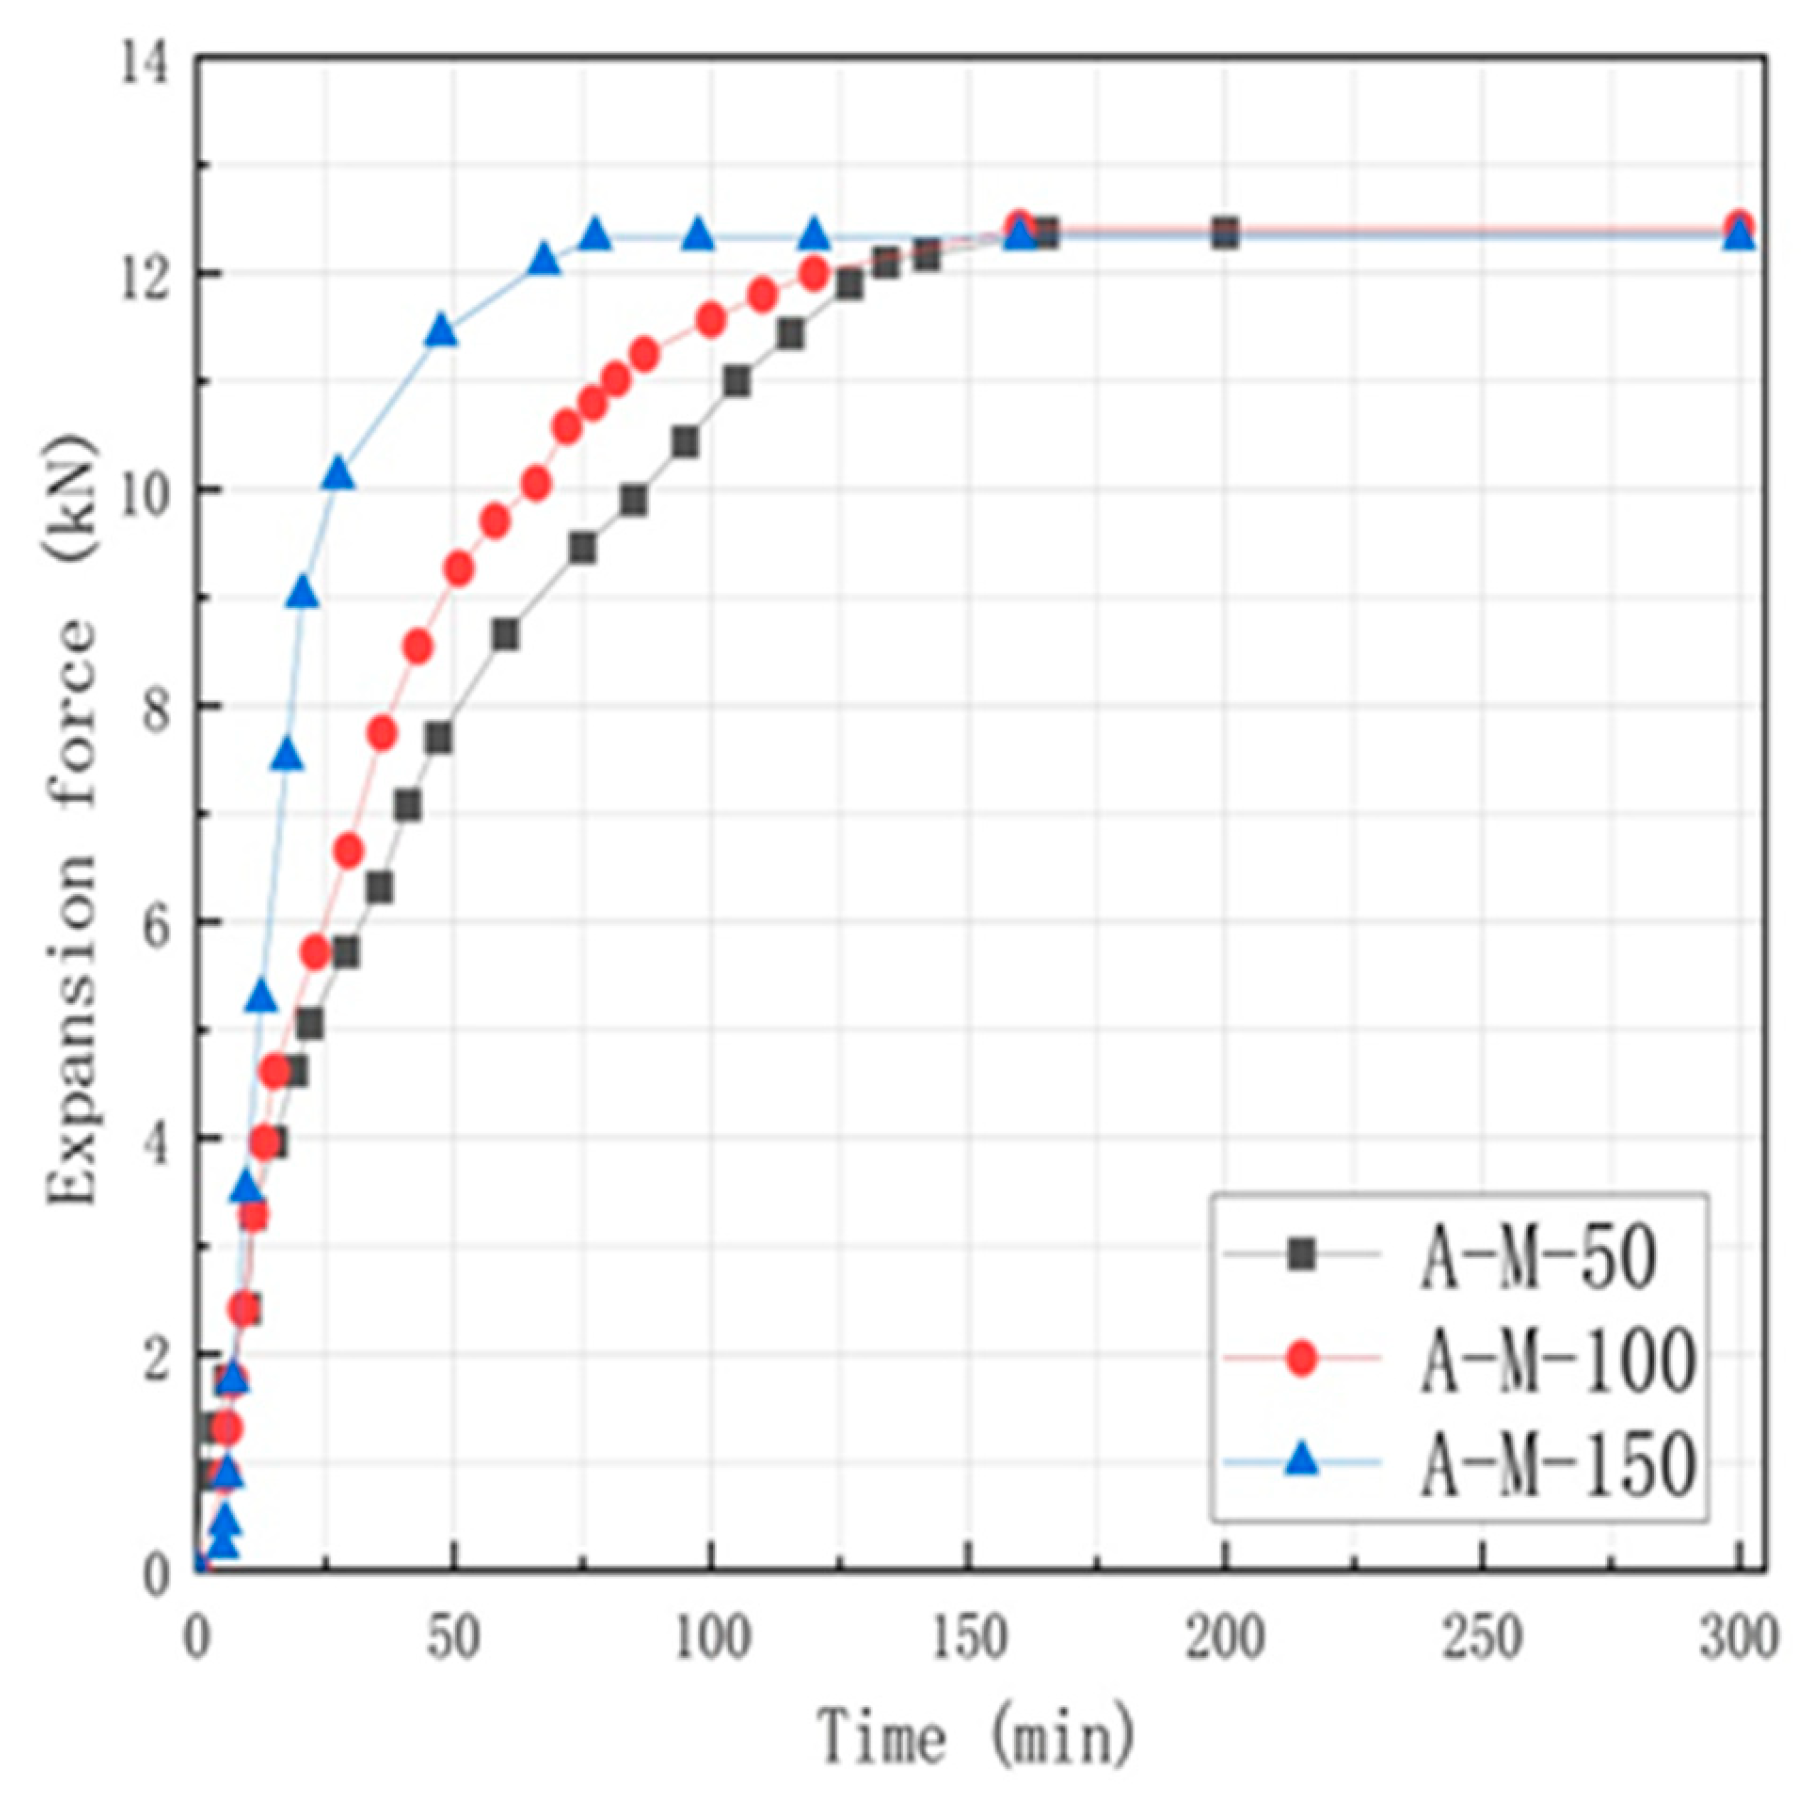
The time-dependent curves of the expansion force at different heights are shown in Figure 12 below.
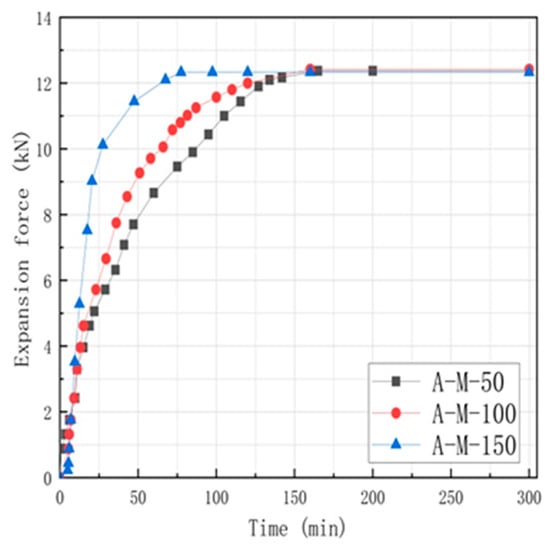
Figure 12.
Comparison of test expansion forces at different heights.
When the test reaches the stable stage, the expansion forces of A-M-50, A-M-100, and A-M-150 are 12.37 kN, 12.42 kN, and 12.33 kN respectively. The final expansion force difference of each sample is within ±0.1 kN, indicating that the change in height has no significant effect on the expansion force.
Using the parametric modeling method, similar to the previous loading method, the expansion reaction force of different height specimens of lime–sand piles under the corresponding temperature load is obtained. Compared with the test, the summary results are shown in Table 6, as shown in Figure 13.
Table 6.
Summary of lime–sand pile height test results and numerical simulation data.
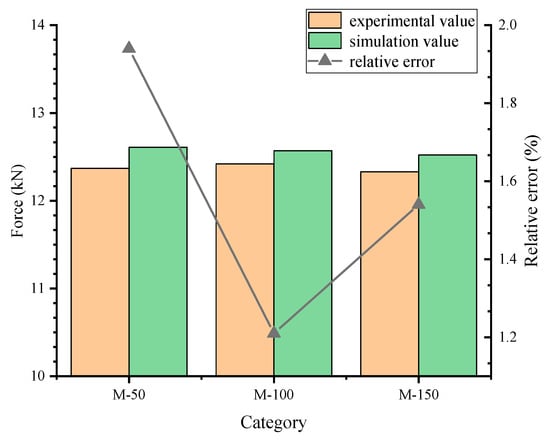
Figure 13.
Comparison of test results and numerical simulation for lime–sand piles at different heights.
After the simulation, the expansion forces of A-M-50, A-M-100, and A-M-150 are 12.61 kN, 12.57 kN, and 12.52 kN, respectively. It can be seen from the simulation results that the difference between the expansion force of lime–sand pile and the test results is within ±0.3 kN, indicating that the change in height has no obvious influence on the expansion force, which is consistent with the test law. This may be due to the fact that the lime–sand particles and the reactants in the hydration reaction can be evenly distributed in the sample and reach a similar degree of reaction. Based on the mesoscopic model generated by the algorithm in this paper, the expansion reaction force of the specimens at different heights is similar to the experimental results of the laboratory specimens, with a relative error below 2%, which further shows that the mesoscopic model of lime–sand pile proposed in this paper has certain reliability in simulating the mechanical properties of lime–sand piles.
4. Conclusions and Suggestions
In this paper, the parametric modeling and numerical simulation of a three-dimensional random aggregate model of a lime–sand pile are studied by using a Python–Abaqus secondary development platform, and the following conclusions are obtained:
- (1)
- The meso-modeling concept of lime–sand pile material is creatively proposed, the integrated generation algorithm for a spherical aggregate of different materials is developed, and the material properties and mesh generation are given by the algorithm. The Boolean intrusion discriminant algorithm is used to place the spherical aggregate, and the volume content of the aggregate is successfully improved. The obtained lime–sand pile meso-model satisfies the Fuller gradation. It is verified that the random aggregate model method can be applied to the meso-modeling of lime–sand piles. This paper effectively generates a meso-scale random model of lime–sand piles under various gradations.
- (2)
- Through numerical simulation, it is verified that under the same parameters such as height, particle size, and lime type, the expansion force increases with the increase in lime proportion, and the increase in expansion force is about 45% of that without increasing lime proportion, which is consistent with the experimental situation, but the reaction speed in the simulation is faster. The simulated expansion reaction force is similar to the experimental results of laboratory specimens, and the relative error is less than 3%.
- (3)
- Through numerical simulation, it can be verified that with the same mix ratio, particle size, and lime type, the expansion force changes little with the increase in height, which is consistent with the experimental situation. The simulated expansion reaction force is similar to the experimental results of laboratory specimens, and the relative error is less than 2%. It is verified that the change in height has no obvious effect on the expansion force.
- (4)
- Utilizing the Abaqus explicit solver, static numerical simulations of lime–sand pile specimens are conducted to verify the reliability of the meso-model obtained by the modeling algorithm presented in this paper. This model can be used for subsequent repeated tests or localized modifications.
The use of Python for the secondary development of Abaqus has obvious advantages. It can achieve repeated trial calculations or partial modification of the model through parametric modeling. In addition, only the temperature–expansion force test simulation test is performed in this paper, and more extensive numerical simulation is needed for many problems. In the future, the expansion reaction force value of lime–sand pile under a certain mix ratio can be determined by simulation. The hydration reaction mechanism of lime–sand pile can also be further simulated and tested to obtain the internal temperature distribution, carry out thermal–mechanical coupling analysis, carry out cross-scale analysis, and truly match the actual pile. Rationalizing and summarizing the actual multi-parameter expansion reaction force formula, correction coefficient, etc., will be the content and direction of further research in the future for readers’ reference.
Author Contributions
Conceptualization, J.Y. and J.S.; methodology, W.S.; software, M.Z.; validation, X.N.; formal analysis, J.Y. and J.S.; investigation, Y.Q. and X.N.; resources, S.Q. and J.J.; writing—original draft preparation, J.Y.; writing—review and editing, J.S.; visualization, Y.Q. and J.J.; supervision, M.Z.; project administration, W.S. and S.Q. All authors have read and agreed to the published version of the manuscript.
Funding
This research received no external funding.
Data Availability Statement
Data are contained within the article.
Conflicts of Interest
Xiaoyu Niu, Ming Zhou, and Junpeng Ju were employed by the company Shaanxi Ancient Construction Garden Construction Group Co., Ltd. The remaining authors declare that the research was conducted in the absence of any commercial or financial relationships that could be construed as a potential conflict of interest.
References
- Chen, P.; Cui, Q. Application of Lime Soil Pile in Collapsible Loess Ground Treatment. Adv. Mater. Res. 2014, 1049–1050, 256–259. [Google Scholar] [CrossRef]
- He, Y.Q.; Zhu, Y.P. Theory and experiment of collapsible loess foundation treatment by expansion method. Civ. Build. Environ. Eng. 2009, 31, 44–48. [Google Scholar]
- Shabir, H.; Muhammad, F.; Ahmed, K.F.; Saeed, Z. Experimental evaluation of lime column as a ground improvement method in soft soils. SN Appl. Sci. 2021, 3, 799. [Google Scholar]
- Zhang, C.X.; Wang, J.L. Discussion on the effect of lime pile pre-melting treatment of island permafrost foundation. Low Temp. Build. Technol. 2022, 44, 167–170+174. [Google Scholar] [CrossRef]
- Yang, X.M.; Cheng, J.; Cai, H.C. Effect evaluation of application of quicklime pile composite foundation in island frozen soil area. J. Railw. Sci. Eng. 2022, 19, 941–948. [Google Scholar] [CrossRef]
- Wittmann, F.H.; Roelfstra, P.E.; Sadouki, H. Simulation and analysis of composite structures. Mater. Sci. Eng. 1985, 68, 239–248. [Google Scholar] [CrossRef]
- Liu, G.T.; Wang, Z.M. Numerical simulation of fracture of concrete materials by random aggregate model. J. Tsinghua Univ. (Nat. Sci. Ed.) 1996, 1, 84–89. [Google Scholar]
- Schlangen, E.; Van Mier, J.G.M. Simple lattice modle for numerical simulation of fracture of concrete materials and structures. Mater. Struct. 1992, 25, 239–248. [Google Scholar] [CrossRef]
- Walraven, J.C.; Reinhardt, H.W. Theory and experiments on the mechanical behavior of cracks in plain and reinforced concrete subject to shear loading. Heron 1991, 26, 26–35. [Google Scholar]
- Qin, W.P.; Yang, X.H.; Chen, C.Y. A fast random placement algorithm for three-dimensional convex concrete aggregate. Hydropower Energy Sci. 2006, 3, 39–42+99. [Google Scholar]
- Guan, Z.Q.; Gao, Q.H.; Gu, Y.X.; Song, C.; Shan, J. Establishment of three-dimensional finite element mesh model of composite mesostructure. Eng. Mech. 2005, S1, 67–72. [Google Scholar]
- Qin, W.; Du, C.B. Meso-level mechanical modeling of three-dimensional concrete based on CT slices. Eng. Mech. 2012, 29, 186–193. [Google Scholar]
- Avdeev, I.; Sobolev, K.; Amirjanov, A.; Hastert, A. Micromechanical Models of Structural Behavior of Concrete. MRS Online Proceeding Libr. Arch. 2010, 20, 1276–1290. [Google Scholar] [CrossRef]
- Zhu, L.; Dang, F.N.; Ding, W.H.; Xue, Y.; Zhang, L. Based on CT technology and gray level co-occurrence matrix theory, the mesoscopic damage evolution process of concrete under different loads is studied. J. Civ. Eng. 2020, 53, 97–107. [Google Scholar] [CrossRef]
- Yang, S.D.; Gao, Y.M.; Tao, Z.; Chen, W. Research on plastic damage coupling mechanical properties of concrete based on random aggregate model. J. Univ. South China (Nat. Sci. Ed.) 2023, 37, 47–52+94. [Google Scholar] [CrossRef]
- Sun, J.Y.; Xie, J.B.; Zhou, Y.; Zhou, Y. A 3D three-phase meso-scale model for simulation of chloride diffusion in concrete based on ANSYS. Int. J. Mech. Sci. 2022, 219, 107127. [Google Scholar] [CrossRef]
- Ma, B. Study on the Diffusion Characteristics of Sulfate Ions in Concrete Based on Random Aggregate Model. Master’s Thesis, Chongqing Jiaotong University, Chongqing, China, 2023. [Google Scholar]
- Liu, Y.T. Meso-Simulation Study on Compressive Properties of Recycled Concrete and Analysis of Influencing Factors. Master’s Thesis, Xi’an University of Technology, Xi’an, China, 2023. [Google Scholar]
- Wang, S.X. Study on the Size Effect of Compressive Strength of Fly Ash Geopolymer Concrete at High Temperature. Master’s Thesis, Xi’an University of Architecture and Technology, Xi’an, China, 2023. [Google Scholar]
- Liu, S.Y.; Miao, Y.C.; Li, M.H.; Selyutina, N.; Smirnov, I.; Liu, Y.; Zhang, Y. Numerical analysis of damage and deterioration of recycled thermal insulation concrete after high temperature. J. Taiyuan Univ. Technol. 2024, 10, 1–14. [Google Scholar]
- Wu, H.; Lu, S.Y.; Chen, D. Dynamic shear behavior of FRP-concrete bond interface based on concrete 3D mesoscopic model. Eng. Mech. 2024, 41, 1–16. [Google Scholar]
- Fang, Q.; Zhang, J.H.; Huan, Y.; Zhang, Y. Research on modeling method of three-dimensional mesoscopic model of fully graded concrete. Eng. Mech. 2013, 30, 14–21+30. [Google Scholar]
- Jiang, B.K.; Sun, W.J. Analysis of geometric model of recycled concrete random aggregate based on MATLAB programming language. Sichuan Cem. 2023, 6, 7–9+12. [Google Scholar]
- Cheng, S.H.; Ren, Z.G.; Li, P.P.; Shangguan, J. Numerical modeling of concrete three-dimensional random concave-convex aggregate based on LS-DYNA. J. Wuhan Univ. Technol. 2014, 36, 89–94+121. [Google Scholar]
- Tan, Y.W.; Wang, S.G.; Xu, F.; Liu, W.; Chen, X.; Ran, Y. The application status of COMSOL Multiphysics in the study of concrete durability. J. Silic. 2017, 45, 697–707. [Google Scholar] [CrossRef]
- Caballero, A.; López, C.M.; Carol, I. 3D meso-structural analysis of concrete specimens under uniaxial tension. Comput. Methods Appl. Mech. Eng. 2006, 195, 7182–7195. [Google Scholar] [CrossRef]
- Zhao, C.; Yang, Q.Y.; Zhong, X.G.; Shu, X.; Shen, M. Voronoi-RBSM coupling concrete mesoscopic modeling method. Eng. Mech. 2024, 40, 1–11. [Google Scholar]
- Guo, R.Q.; Ren, H.Q.; Zhang, L.; Long, Z.; Wu, X.; Li, Z. SHPB simulation study based on concrete meso-aggregate model. Vib. Impact 2019, 38, 107–116. [Google Scholar] [CrossRef]
- Xu, Q.; Zhou, X.S.; Cheng, Z.C. Random aggregate model and meso-mechanical analysis of concrete based on Ansys. J. Wuhan Univ. 2019, 52, 1035–1040+1047. [Google Scholar] [CrossRef]
- Jia, J.Y.; Wang, Z.R.; Xiao, K. Research on concrete crack propagation simulation system based on VC++ and ANSYS. Ind. Build. 2012, 42, 539–543+576. [Google Scholar] [CrossRef]
- Liang, J.; Lou, Z.K.; Han, J.H. Concrete aggregate modeling analysis based on AutoCAD. J. Water Conserv. 2011, 42, 1379–1383. [Google Scholar] [CrossRef]
- Cao, J.F.; Wang, X.C.; Kong, L. Application of Python Language in Abaqus, 2nd ed.; Machine Industry Press: Beijing, China, 2020; pp. 109–182. [Google Scholar]
- Qiao, Y.; Si, J.; Yuan, J.; Wang, Y.; Niu, X.; Ju, J.; Zhou, M.; He, L. Multi-Parameter Experimental Research on the Expansion Force Affecting Lime-Sand Piles under Preloading Pressure. Buildings 2024, 14, 1208. [Google Scholar] [CrossRef]
- Xu, Z.J. Monte Carlo Method; Shanghai Science and Technology Press: Shanghai, China, 1985. [Google Scholar]
- Wu, Y.H.; Xiao, Y.X.; Xu, Y.F. Establishment of three-dimensional meso-random model of concrete based on Python-Abaqus. J. Comput. Mech. 2022, 39, 566–573. [Google Scholar]
- Kerner, E.H. The elastic and thermos-elastic properties of composite media. Proc. Phys. Society. Sect. B 1956, 69, 808. [Google Scholar] [CrossRef]
- Hu, L.P.; Chen, X.D.; Zhu, X.Y.; Chen, C. Mechanical properties analysis and discrete element simulation of steel slag pervious concrete with different aggregate sizes. Compr. Util. Fly Ash 2022, 36, 69–75+132. [Google Scholar] [CrossRef]
- Pei, X.J.; Zhang, F.Y.; Wu, W.J.; Liang, S.Y. Physicochemical and index properties of loess stabilized with lime and fly ash piles. Appl. Clay Sci. 2015, 114, 77–84. [Google Scholar] [CrossRef]
- Zhang, Z.Q.; Li, Y.L.; Zhu, X.Y.; Liu, X. Meso-scale corrosion expansion cracking of ribbed reinforced concrete based on a 3D random aggregate model. J. Zhejiang Univ. -Sci. A (Appl. Phys. Eng.) 2021, 22, 924–941. [Google Scholar] [CrossRef]
- Zhang, X.R.; Cheng, Y.H.; Wu, H. Analysis of dynamic compression behavior of concrete based on 3D mesoscopic model. Explos. Impact 2024, 44, 023102. [Google Scholar]
- Zhang, X.F.; Tian, Y.; Qin, P.; Xiao, T.; Wu, J. Mesoscopic simulation of uniaxial tension of concrete with deformed aggregate based on cohesion model. Hydropower 2022, 48, 73–77. [Google Scholar]
- Ke, Y.; Deng, D.; Gao, F.; Zheng, K. Application of meso-mechanical homogeneous model in the evaluation of mechanical and thermal performance parameters of shale ceramsite aggregate. Concrete 2017, 10, 32–36. [Google Scholar]
- Yu, Q.; Chen, Z.; Yang, J.; Rong, K. Numerical Study of Concrete Dynamic Splitting Based on 3D Realistic Aggregate Mesoscopic Model. Materials 2021, 14, 1948. [Google Scholar] [CrossRef]


Disclaimer/Publisher’s Note: The statements, opinions and data contained in all publications are solely those of the individual author(s) and contributor(s) and not of MDPI and/or the editor(s). MDPI and/or the editor(s) disclaim responsibility for any injury to people or property resulting from any ideas, methods, instructions or products referred to in the content. |
© 2024 by the authors. Licensee MDPI, Basel, Switzerland. This article is an open access article distributed under the terms and conditions of the Creative Commons Attribution (CC BY) license (https://creativecommons.org/licenses/by/4.0/).