
Analyzing Contingency Estimation for Residential Turnkey Projects in Saudi Arabia: A Neural Network Approach


Abstract
:1. Introduction
2. Objectives
- (1)
- Determine the primary factors contributing to project contingency.
- (2)
- Estimate the contingency percentage for each project phase based on the project’s complexity and the importance level of the contingency factors.
- (3)
- Analyze the results to comprehend the impact of the contingency factors on the project throughout its life cycle.
3. Background
3.1. Turnkey
- (1)
- The absence of owner involvement: Owners of turnkey projects frequently take a passive role compared to the contractor, who handles every element of the project. This absence of owner supervision may result in misunderstandings, poor communication, and unhappiness with the way the project turns out.
- (2)
- Ambiguity in scope characterization: Effective project execution depends on a precise characterization of the project’s scope. However, in turnkey projects, there may be disagreements or ambiguities in the scope of work, which could result in arguments about deliverables, responsibilities, and project requirements between the contractor and the owner.
- (3)
- Risk allocation: In turnkey projects, the contractor bears the majority of project risks, with the owner bearing the remainder. Accurately evaluating and controlling project risks can be difficult for contractors, particularly if unanticipated problems crop up while the project is being built. This may result in disagreements about who bears the responsibility for risk-related problems, delays, and cost overruns.
- (4)
- Cost overruns and schedule delays: Unexpected site circumstances, design modifications, supply chain interruptions, or contractor faults can all cause cost overruns and schedule delays on turnkey projects. It can be difficult for contractors to predict project prices and schedules with enough accuracy, which can result in losses of money and damaged relationships with owners.
3.2. Contingency
3.3. The Applications of Artificial Neural Networks (ANNs) in the Construction Industry
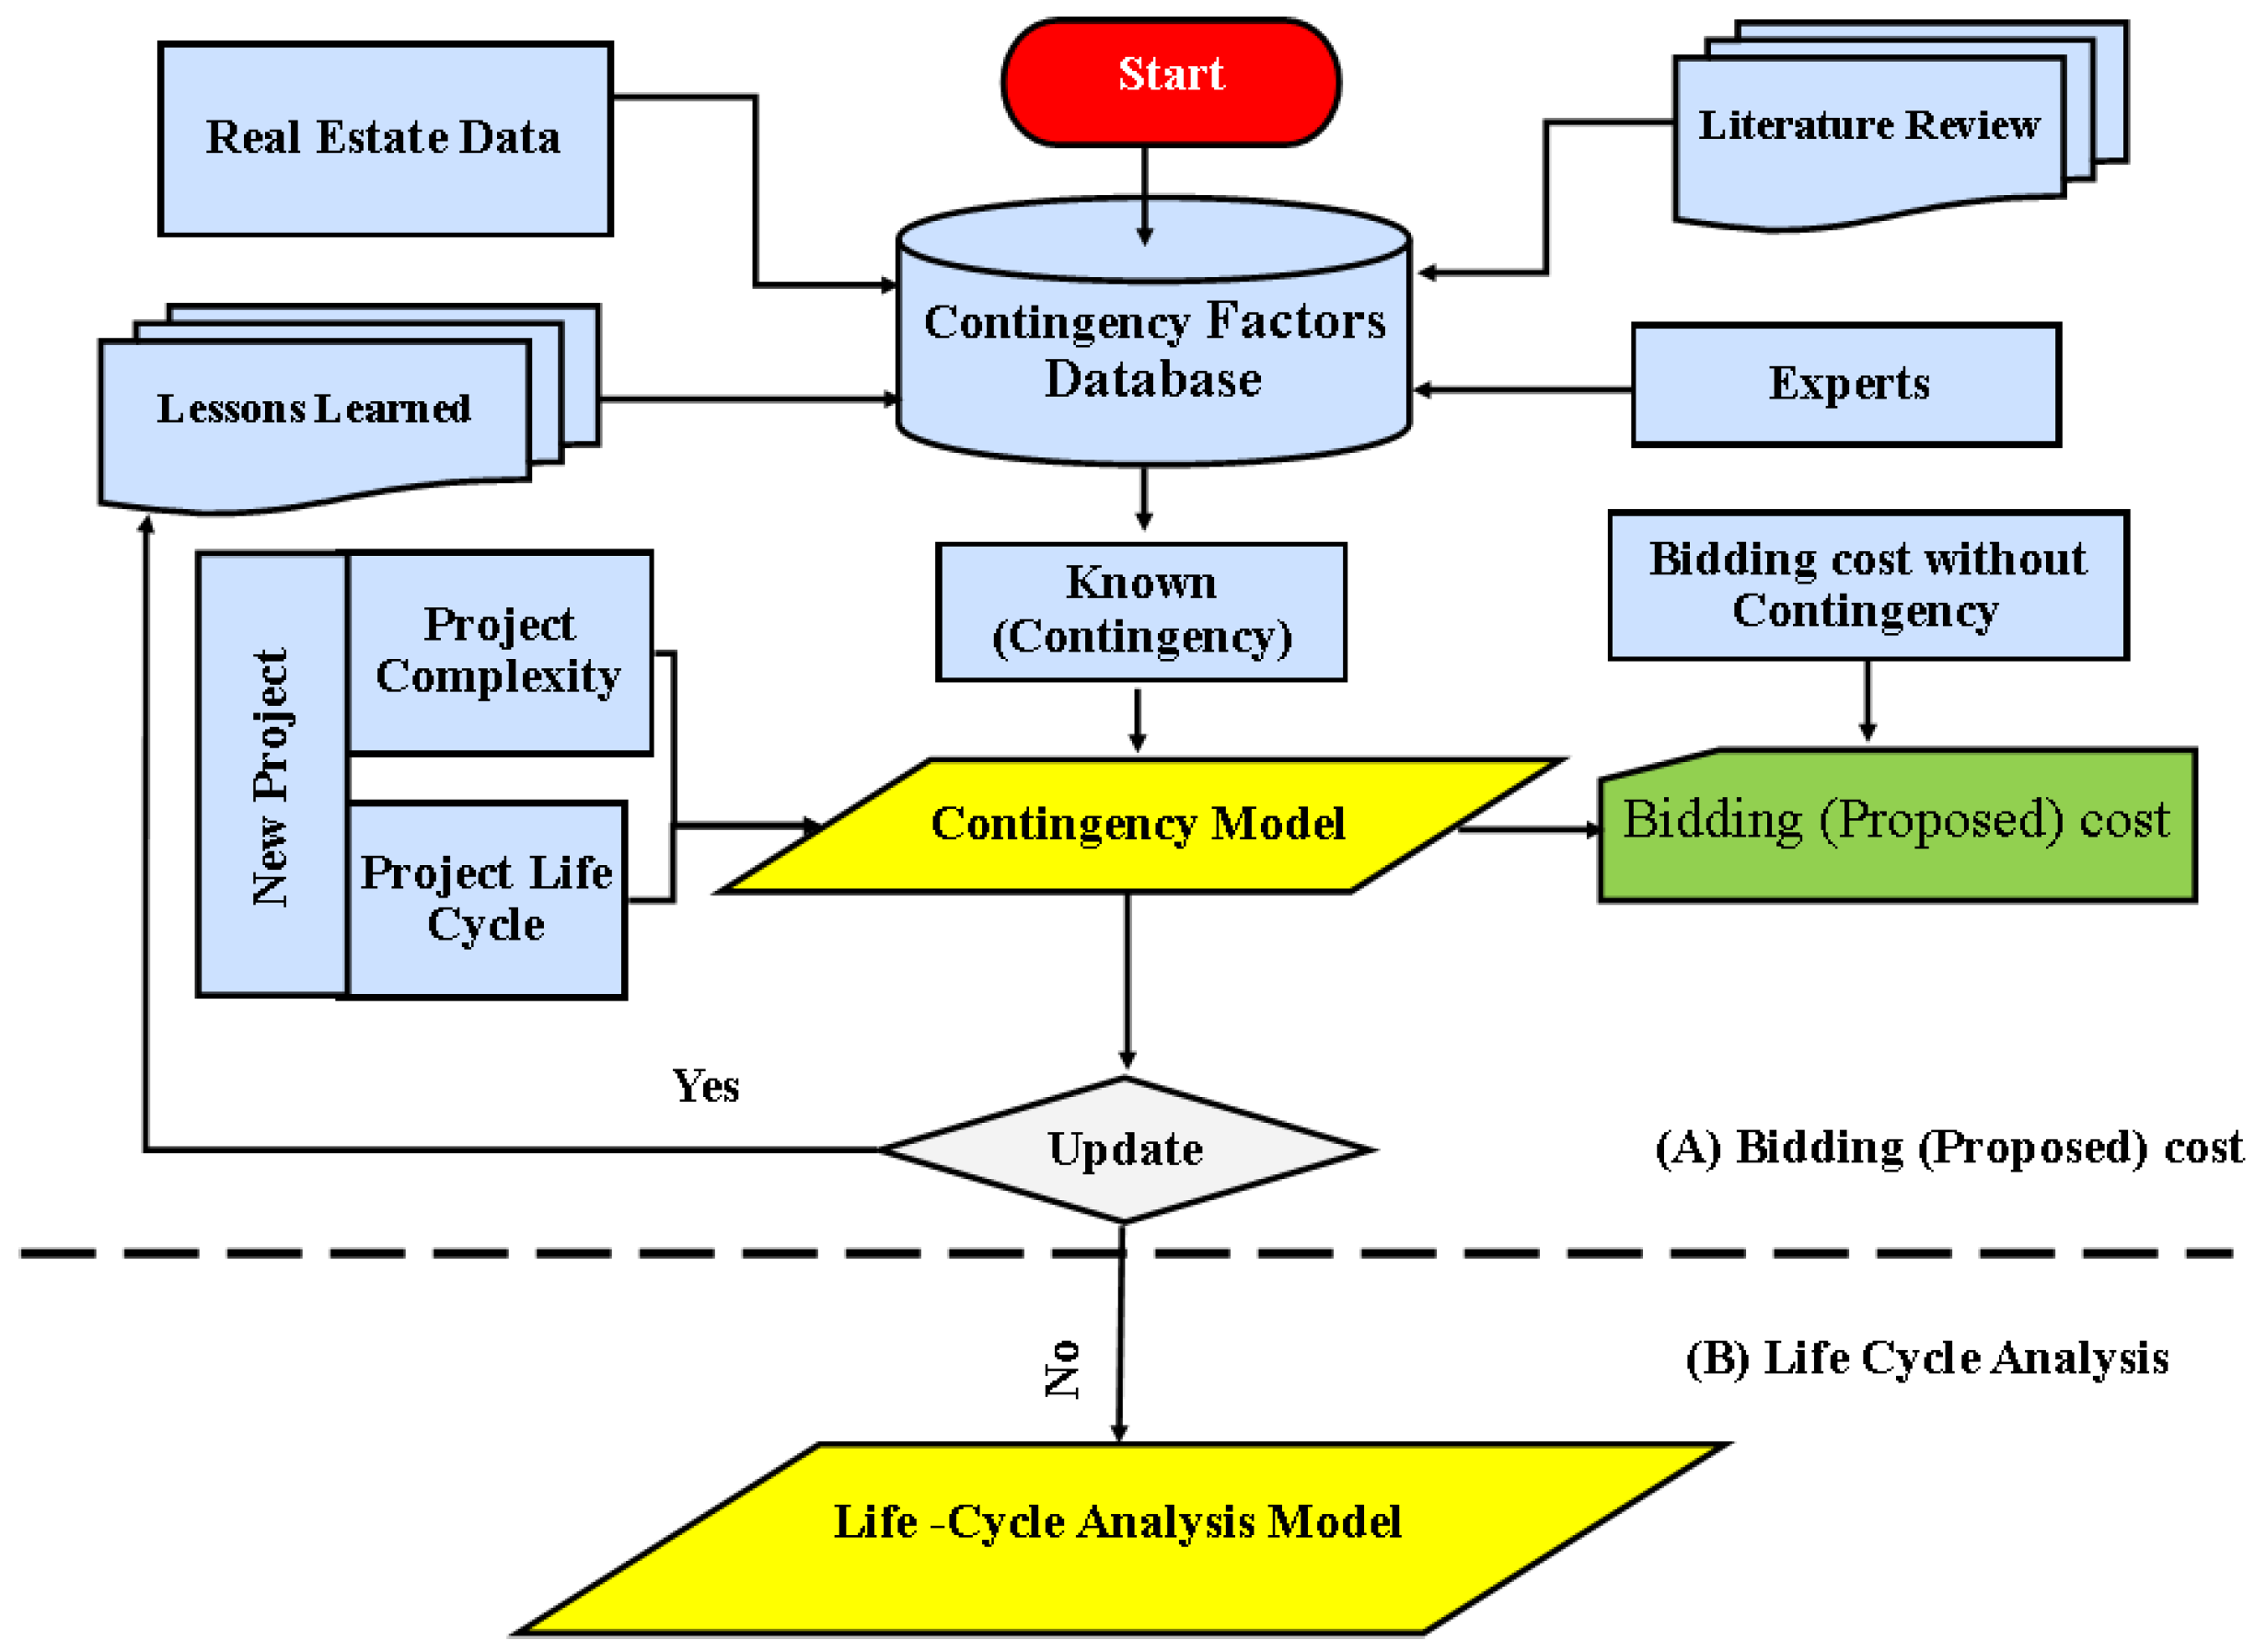
4. Research Methodology
4.1. Contingency Model
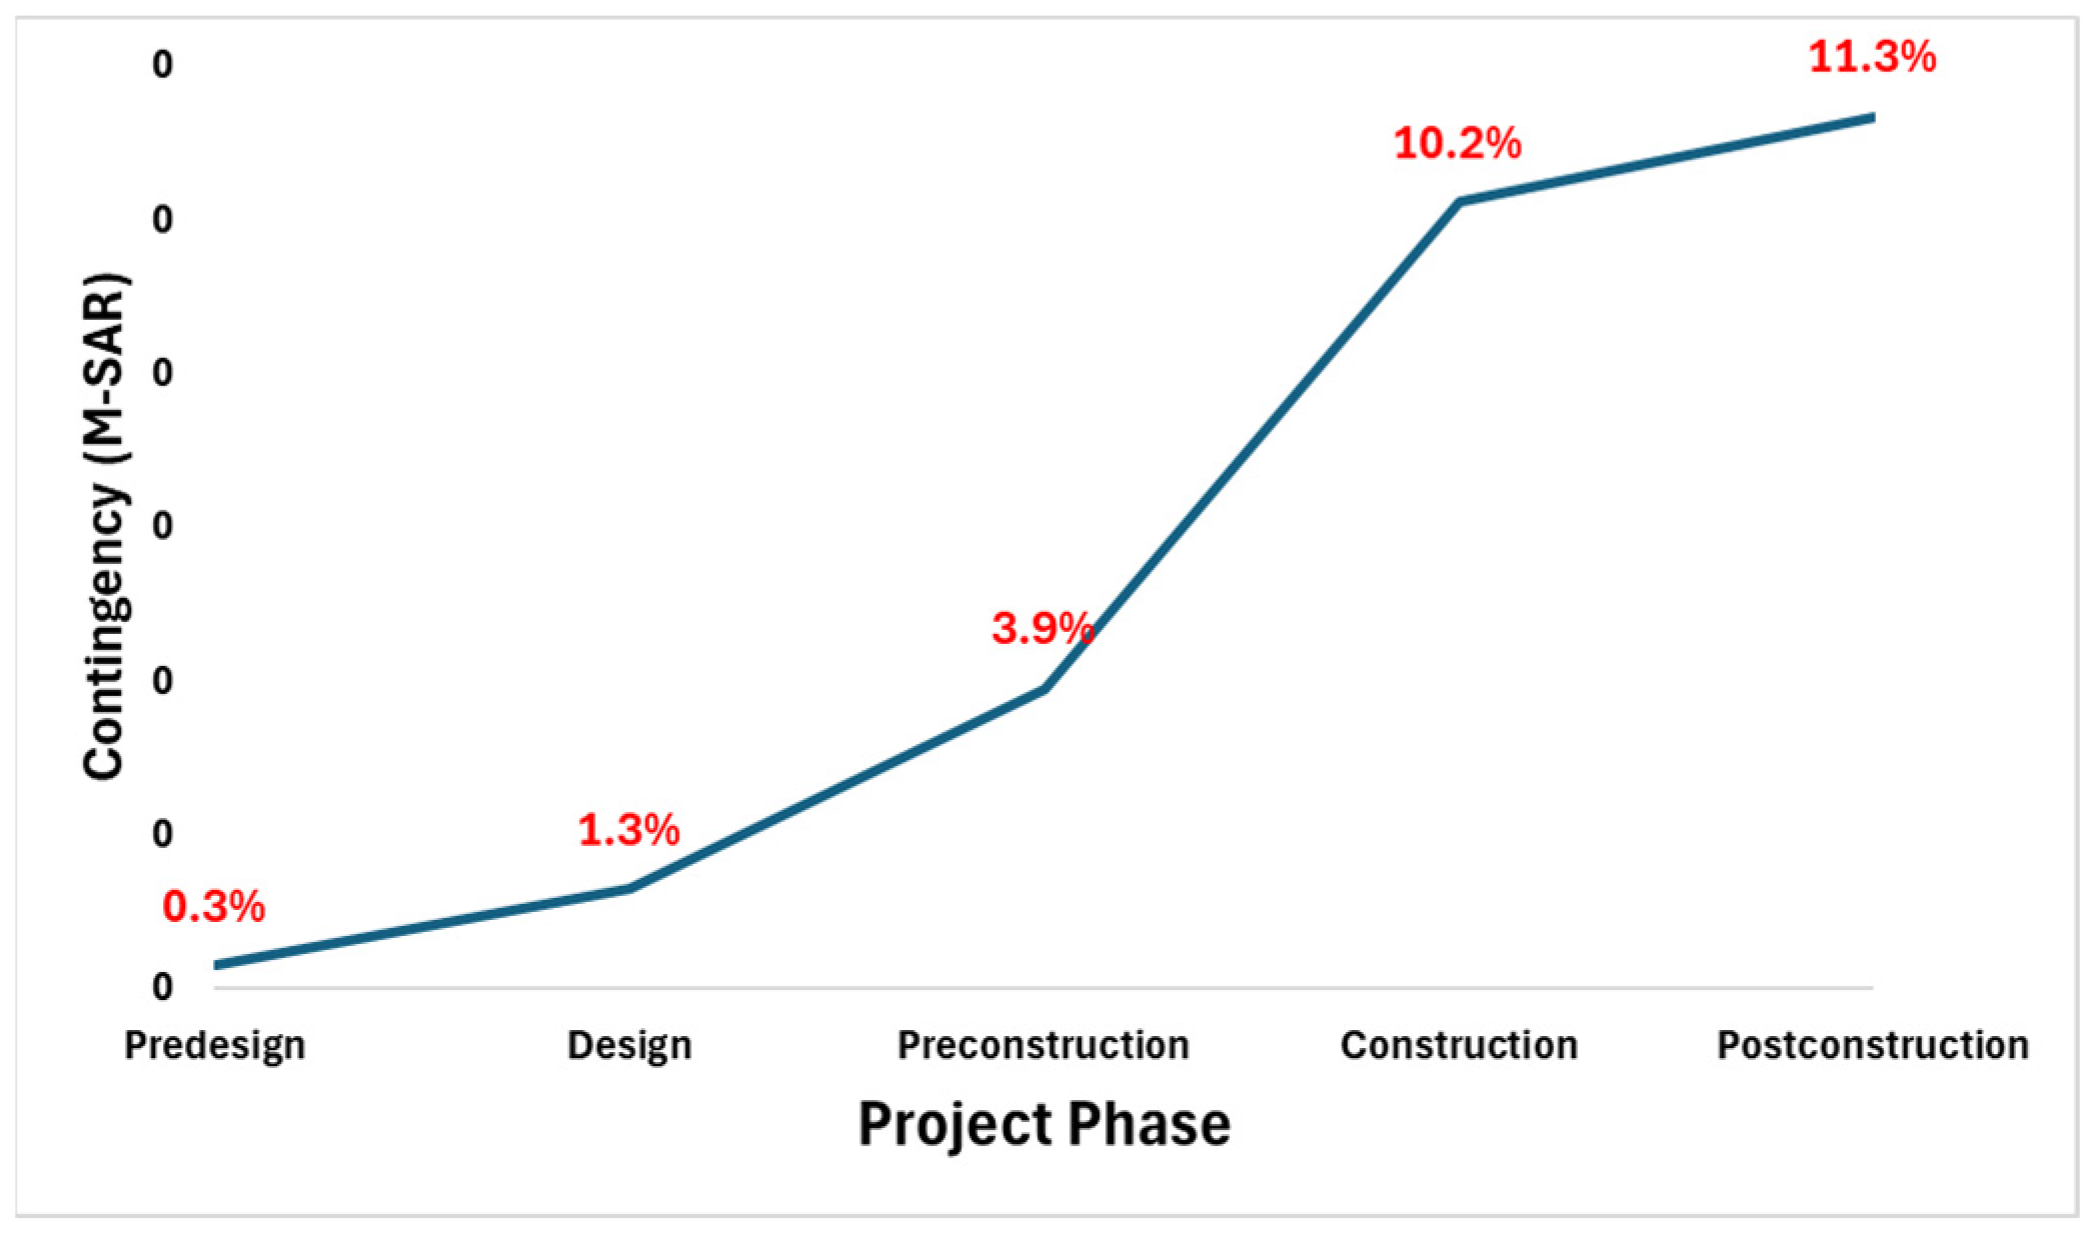
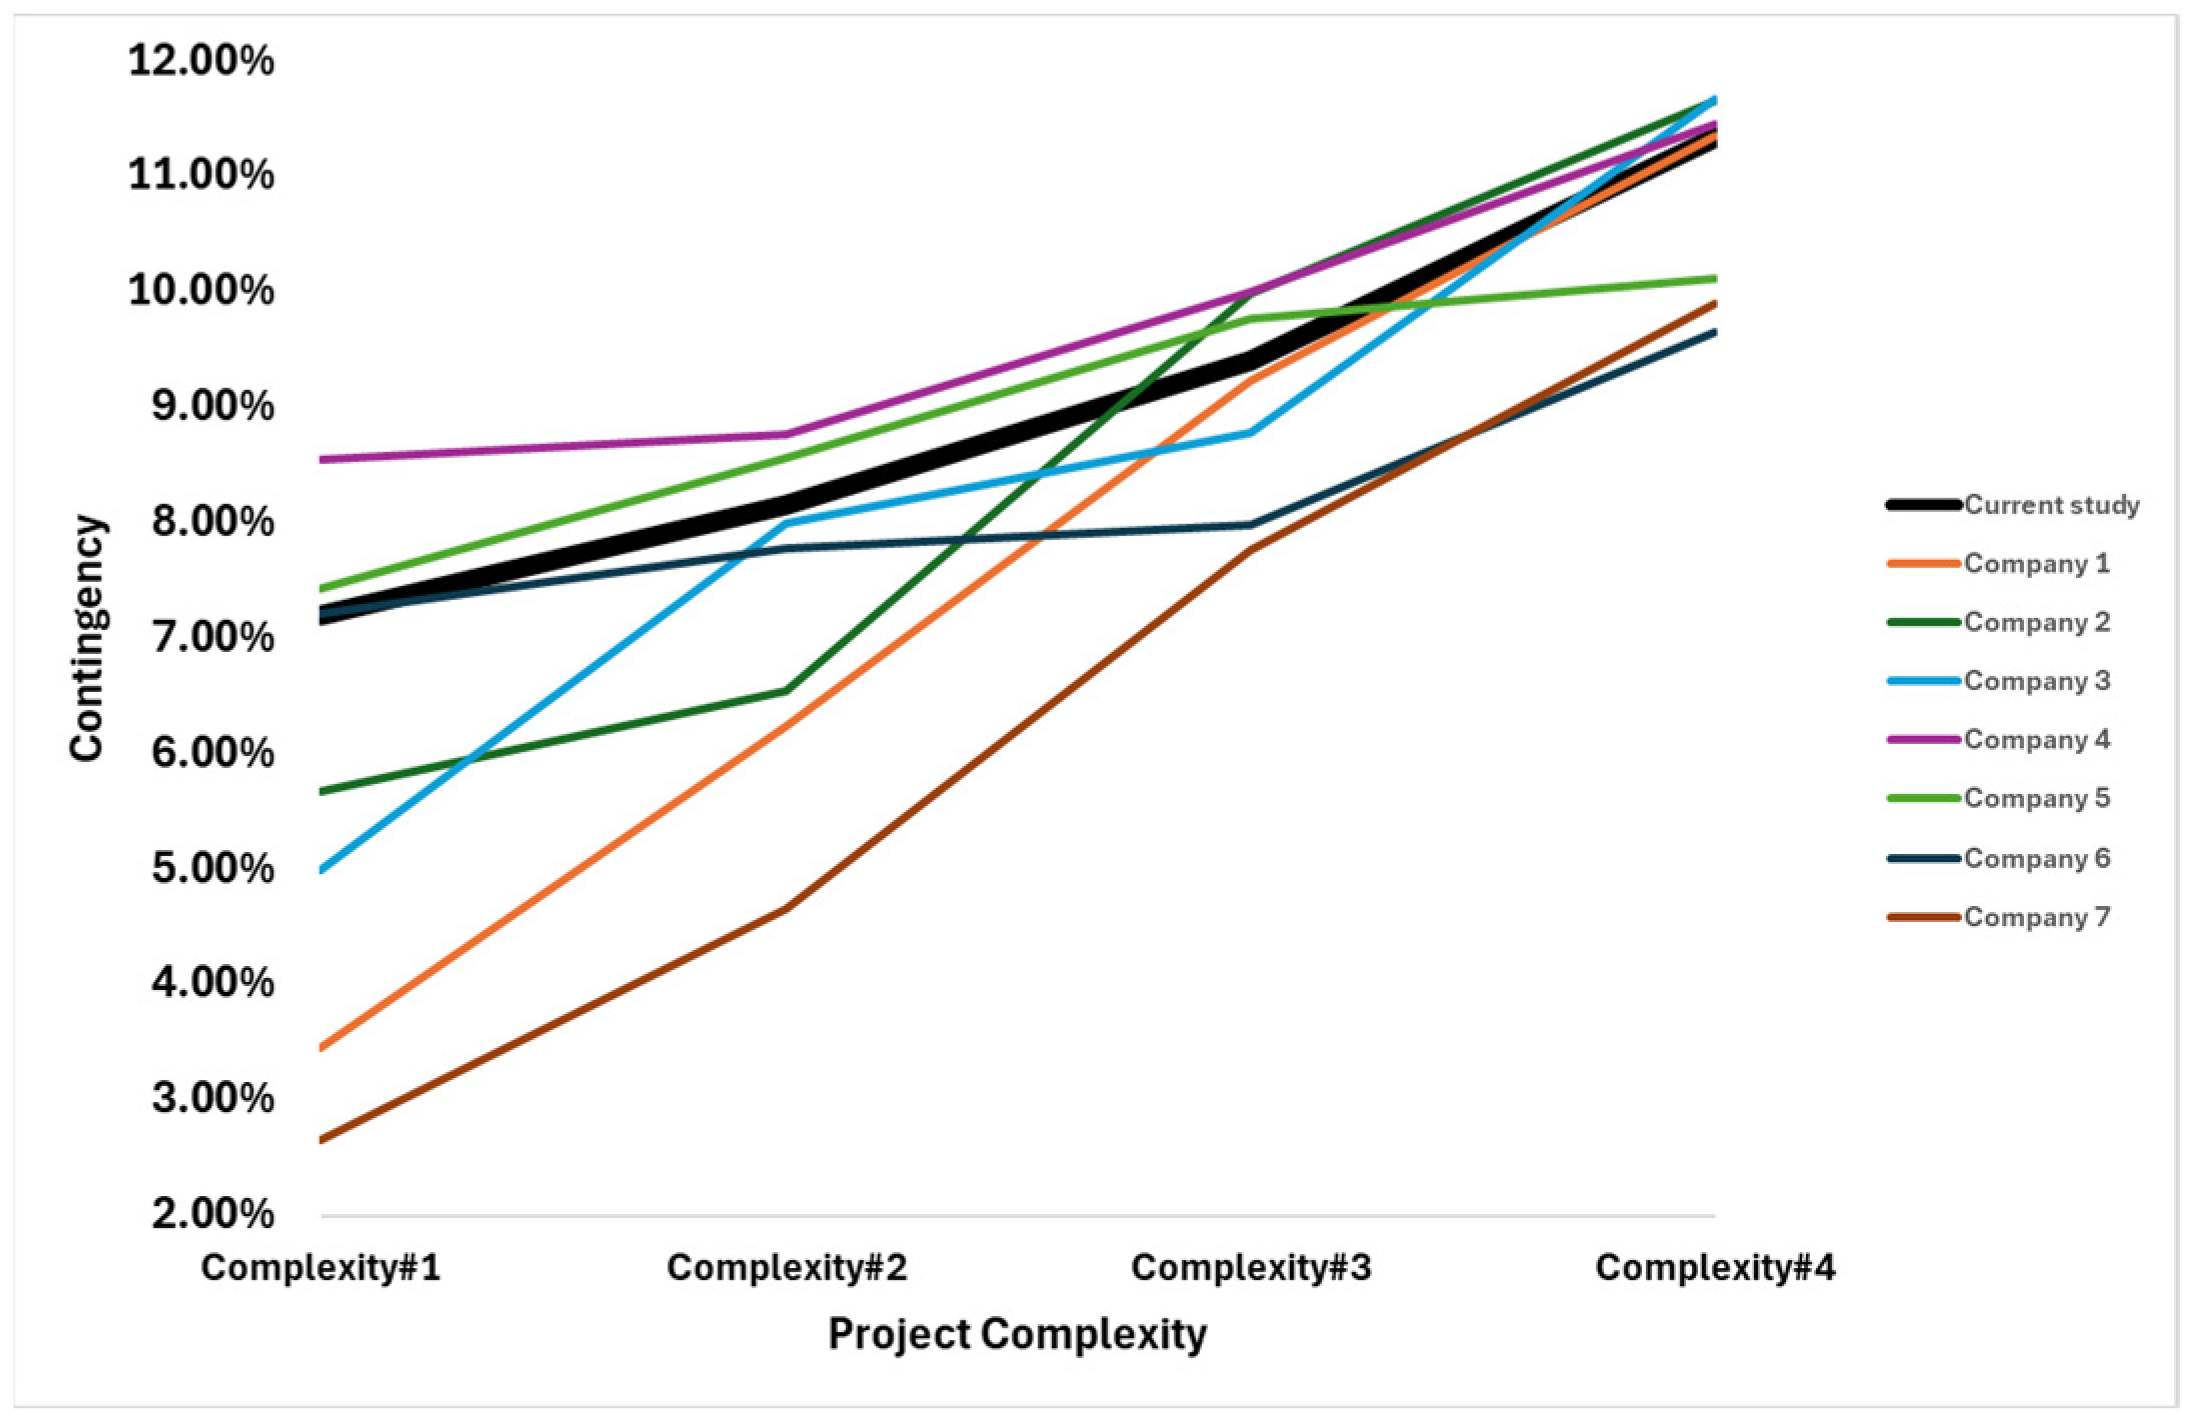
4.2. Contingency Life-Cycle Analysis
5. Model Implementation
5.1. Contingency Model
5.2. Contingency Life-Cycle Analysis
6. Findings
7. Originality/Value
8. Project Validation
9. Practical Applications
10. Limitations and Future Work
- (1)
- Data availability: The accuracy and reliability of the estimated contingency values rely heavily on the availability and quality of historical project data. Limited access to comprehensive project data may restrict the generalizability of the findings and the effectiveness of the ANN model in estimating contingency values accurately. The current model relies on only twenty construction projects: sixteen for testing and training and four for predicting. These data might not be enough for machine-learning models, which are typically designed for much larger datasets. A small dataset may result in the undertraining of the machine-learning model. Accordingly, future research stemming from this study might concentrate on integrating data from additional construction projects to enhance the ANN model, thereby improving the accuracy of the contingency value estimates.
- (2)
- Generalizability: The findings of this study are specific to the residential turnkey projects in Saudi Arabia and may not directly apply to other construction project types. Future research should investigate the applicability of the proposed methodology in diverse geographic locations and construction sectors.
- (3)
- Model refinement: Further refinement of the ANN model is essential to enhance its predictive accuracy and usability. Future research may involve optimizing the model parameters, exploring alternative machine-learning algorithms, and incorporating additional input variables to capture a broader range of project characteristics.
- (4)
- Questionnaire results: The applications of the developed models involved a survey partially based on questionnaires, which has inherent limitations that can affect the quality and reliability of the results. Validation, as described in Section 8, was conducted to mitigate these limitations. Future work could reduce the reliance on questionnaire surveys by gathering more specific data from construction projects to validate the results. Additionally, a comprehensive database is required to train the developed ANN model effectively.
11. Conclusions
Funding
Data Availability Statement
Acknowledgments
Conflicts of Interest
References
- Mordor Intelligence. Saudi Arabia Residential Construction Market Size & Share Analysis—Industry Research Report—Growth Trends. Available online: https://www.mordorintelligence.com/industry-reports/saudi-arabia-residential-construction-market (accessed on 8 March 2024).
- Argaam. Saudi Arabia Sees 300,000 Residential Units by 2025-End: Official. Available online: https://www.argaam.com/en/article/articledetail/id/1687219 (accessed on 8 March 2024).
- PMI. The Standard for Project Management and a Guide to the Project Management Body of Knowledge (PMBOK Guide), 7th ed.; PMI: Newtown Square, PA, USA, 2021. [Google Scholar]
- Hoseini, E.; Bosch-Rekveldt, M.; Hertogh, M. Cost Contingency and Cost Evolvement of Construction Projects in the Preconstruction Phase. J. Constr. Eng. Manag. 2020, 146, 05020006. [Google Scholar] [CrossRef]
- Segner, R.O.; Sears, S.K.; Rounds, J.L.; Clough, R.H.; Sears, G.A. Construction Project Management, 6th ed.; John Wiley & Sons, Inc.: Hoboken, NJ, USA, 2015. [Google Scholar]
- Berends, T.; Stewart, R.B.; Cretu, O. Risk Management for Design and Construction; WILEY & Sons, Inc.: Hoboken, NJ, USA, 2011. [Google Scholar]
- Halpin, D.W. Construction Management, 3rd ed.; John Wiley & Sons, Inc.: Hoboken, NJ, USA, 2006. [Google Scholar]
- Adafin, J.; Wilkinson, S.; Rotimi, J.O.B.; Odeyinka, H. Accuracy in Design Stage Cost Estimating through Risk-Contingency Analysis: A Theoretical Exploration; ASCE: Atlanta, GA, USA, 2014. [Google Scholar]
- Schuyler, J.R. Risk and Decision Analysis in Projects, 3rd ed.; Planning Press TM: Aurora, CO, USA, 2016. [Google Scholar]
- Oberlender, G. Project Management for Engineering and Construction, 3rd ed.; McGraw-Hill Education: New York, NY, USA, 2015. [Google Scholar]
- Peterson, S.; Dagostino, F. Estimating in Building Construction, 8th ed.; Pearson: London, UK, 2014. [Google Scholar]
- Singh, A. Quantitative Risk Management and Decision Making in Construction; ASCE Press: Reston, VA, USA, 2017. [Google Scholar] [CrossRef]
- Diab, M.F.; Asce, A.M.; Varma, A.; Asce, M.; Panthi, K. Modeling the Construction Risk Ratings to Estimate the Contingency in Highway Projects Introduction and Problem Statement. J. Constr. Eng. Manag. 2017, 143, 04017041. [Google Scholar] [CrossRef]
- Günhan, S.; Asce, M.; Arditi, D. Budgeting Owner’s Construction Contingency. J. Constr. Eng. Manag. 2007, 133, 492–497. [Google Scholar] [CrossRef]
- Fernando, N.; Kasun, K.D.; Zhang, H. An artificial neural network (ANN) approach for early cost estimation of concrete bridge systems in developing countries: The case of Sri Lanka. J. Financ. Manag. Prop. Constr. 2023, 29, 23–51. [Google Scholar] [CrossRef]
- Aslam, B.; Maqsoom, A.; Inam, H.; ul Basharat, M.; Ullah, F. Forecasting Construction Cost Index through Artificial Intelligence. Societies 2023, 13, 219. [Google Scholar] [CrossRef]
- Teferi, H.; Debela, G.C.; Tadesse, F. Integrated Approach of Cost Estimation for Road Projects by Using Artificial Neural Network (ANN) and Analytic Hierarchy Process (AHP). J. Xidian Univ. 2021, 15, 212–225. [Google Scholar] [CrossRef]
- Abd, A.M.; Naseef, F.S. Predicting the Final Cost of Iraqi Construction Project Using Artificial Neural Network (ANN). Indian J. Sci. Technol. 2019, 12, 1–7. [Google Scholar] [CrossRef]
- Kusonkhum, W.; Srinavin, K.; Chaitongrat, T. The Adoption of a Machine Learning Approach in a Big Data Concept to Predict Project Cost Budgeting in the Thai Auction Process of Procurement Management for a Construction Project. Civ. Eng. 2023. [Google Scholar] [CrossRef]
- Trach, R.; Trach, Y.; Lendo-Siwicka, M. Using ann to predict the impact of communication factors on the rework cost in construction projects. Energies 2021, 14, 4376. [Google Scholar] [CrossRef]
- Woldemariam, W.; Murillo-Hoyos, J.; Labi, S. Estimating Annual Maintenance Expenditures for Infrastructure: Artificial Neural Network Approach. J. Infrastruct. Syst. 2016, 22, 04015025. [Google Scholar] [CrossRef]
- Alashari, M.; El-Rayes, K.; Helaly, H. Machine-Learning Model for Predicting Maintenance Costs of EPDM Roofing Systems. J. Perform. Constr. Facil. 2023, 37, 04023048. [Google Scholar] [CrossRef]
- Salman, A. Criticality-Based Management of Facility Assets. Buildings 2024, 14, 339. [Google Scholar] [CrossRef]
- Obianyo, J.I.; Udeala, R.C.; Alaneme, G.U. Application of neural networks and neuro-fuzzy models in construction scheduling. Sci. Rep. 2023, 13, 8199. [Google Scholar] [CrossRef]
- Alsugair, A.M.; Al-Gahtani, K.S.; Alsanabani, N.M.; Alabduljabbar, A.A.; Almohsen, A.S. Artificial Neural Network Model to Predict Final Construction Contract Duration. Appl. Sci. 2023, 13, 8078. [Google Scholar] [CrossRef]
- Al-Hafid, M.S.M.; Suleiman, A.; Al-Hafid, M.S.; Sulaiman, A.-B.R.; Al-Fahadi, A.S. Short-Term Optimal Hydrothermal Scheduling Using ANN. 2011. Available online: https://www.researchgate.net/publication/322447959 (accessed on 10 March 2024).
- Lishner, I.; Shtub, A. Using an Artificial Neural Network for Improving the Prediction of Project Duration. Mathematics 2022, 10, 4189. [Google Scholar] [CrossRef]
- Fan, X.; Yu, X. Machine learning-assisted optimal schedule of underground water pipe inspection. J. Infrastruct. Preserv. Resil. 2023, 4, 20. [Google Scholar] [CrossRef]
- Basheer, I.A.; Hajmeer, M. Artificial Neural Networks: Fundamentals, Computing, Design, and Application. 2000. Available online: https://www.sciencedirect.com/science/article/abs/pii/S0167701200002013 (accessed on 26 March 2024).
- Palisade/Lumivero Corporation. Lumivero; Lumivero Corporation: Denver, CO, USA, 2017. [Google Scholar]
- Assaad, R.H.; El-adaway, I.H.; Hastak, M.; LaScola Needy, K. Key Factors Affecting Labor Productivity in Offsite Construction Projects. J. Constr. Eng. Manag. 2023, 149, 04022158. [Google Scholar] [CrossRef]
- Castelblanco, G.; Fenoaltea, E.M.; De Marco, A.; Demagistris, P.; Petruzzi, S.; Zeppegno, D. Combining Stakeholder and Risk Management: Multilayer Network Analysis for Complex Megaprojects. J. Constr. Eng. Manag. 2024, 150, 04023161. [Google Scholar] [CrossRef]
- Iyer, K.C.; Sagheer, M. Hierarchical Structuring of PPP Risks Using Interpretative Structural Modeling. J. Constr. Eng. Manag. 2010, 136, 151–159. [Google Scholar] [CrossRef]
- Noorzai, E. Public–Private Partnership Risks in Conflict Zones and Solutions: Case Study for Afghanistan. J. Infrastruct. Syst. 2021, 27, 05021001. [Google Scholar] [CrossRef]
- Perrenoud, A.; Lines, B.C.; Savicky, J.; Sullivan, K.T. Using Best-Value Procurement to Measure the Impact of Initial Risk-Management Capability on Qualitative Construction Performance. J. Manag. Eng. 2017, 33, 04017019. [Google Scholar] [CrossRef]
- Sadeh, H.; Mirarchi, C.; Pavan, A. Integrated Approach to Construction Risk Management: Cost Implications. J. Constr. Eng. Manag. 2021, 147, 04021113. [Google Scholar] [CrossRef]
- Tatari, A. Simulating Cost Risks for Prefabricated Construction in Developing Countries Using Bayesian Networks. J. Constr. Eng. Manag. 2023, 149, 04023037. [Google Scholar] [CrossRef]
- Moreno-Betancur, M.; Latouche, A.; Menvielle, G.; Kunst, A.E.; Rey, G. Relative index of inequality and slope index of inequality: A structured regression framework for estimation. Epidemiology 2015, 26, 518–527. [Google Scholar] [CrossRef] [PubMed]


| Category | Complexity Level | |||
|---|---|---|---|---|
| Very Complicated | Complicated | Medium | Low | |
| (1) Number of stories | more than 9 | 6–9 | 3–5 | Less than 3 |
| (2) Design | Very High (Iconic or landmark projects with highly intricate architectural designs and structural systems) | High (Large-scale projects with complex architectural features and structural requirements) | Medium (Moderate-sized projects with some architectural complexity) | Low (Simple and straightforward designs with standard building components) |
| (3) Sophisticated machinery and new technology | Very High (Advanced construction equipment and tools) | High (Automated and robotic machinery and tools) | Medium (Specialized construction machinery and tools) | Low (Heavy equipment and tools) |
| (4) Safety requirements | Continuous Improvement and Innovation | Regulatory Compliance | Site-specific safety plan | Basic safety requirements |
| Financial | Legal | Technical | Site Condition | Stakeholders |
|---|---|---|---|---|
| Inflation | Dispute with owner | Design issues | Weather | Subcontractor changes |
| Funding | Social impacts | Constructability problems | Safety | Human errors |
| Bankruptcies | Environmental impacts | Soil problems | Site layout | Conflicts |
| Warranty | Permissions from authorities | Incorrect scope | Poor logistic | Low skills |
| Insurance | Change in law | Quality issues | Accessibility | |
| Market fluctuation | Materials | Security | ||
| Machines |
| Category | First (Frequency, %) | Second (Frequency, %) | Third (Frequency, %) | Total |
|---|---|---|---|---|
| Degree | PhD (11, 19%) | Master (12, 21%) | B.Sc. (35, 60%) | 58 |
| Position | Manager (6, 10%) | Engineer (28, 48%) | Technician (24, 42%) | 58 |
| Experience | >20 years (18, 31%) | 10 to 20 years (15, 26%) | <10 years (25, 43%) | 58 |
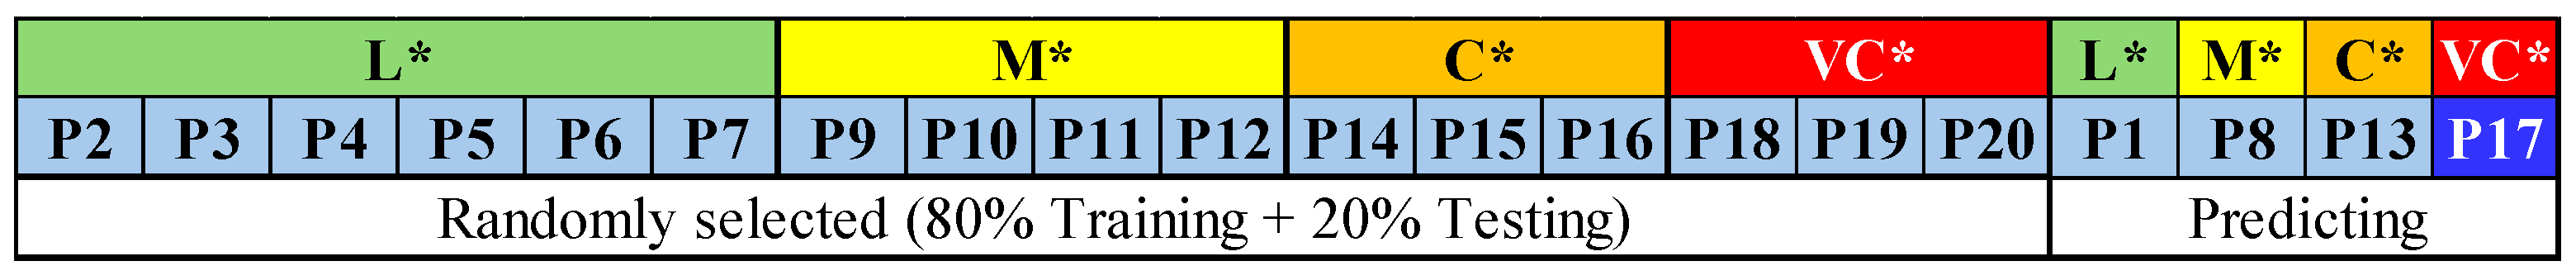
| Project Complexity | No. of Project | Project No. (k) |
|---|---|---|
| Low | 6 | 2, 3, 4, 5, 6, and 7 |
| Medium | 4 | 9, 10, 11, and 12 |
| Complicated | 3 | 14, 15, and 16 |
| Very complicated | 3 | 18, 19, and 20 |
| No | Contingency Factors | Phase | ||||
|---|---|---|---|---|---|---|
| Predesign | Design | Preconstruction | Construction | Postconstruction | ||
| 1 | Site layout | 0 | 1 | 1 | 1 | 0 |
| 2 | Soil problems | 0 | 1 | 1 | 1 | 0 |
| 3 | Dispute with owner | 0 | 0 | 1 | 1 | 1 |
| 4 | Insurance | 0 | 0 | 1 | 1 | 1 |
| 5 | Weather | 0 | 0 | 0 | 1 | 0 |
| 6 | Design issues | 0 | 1 | 1 | 1 | 0 |
| 7 | Social impacts | 0 | 0 | 1 | 1 | 1 |
| 8 | Market fluctuation | 0 | 0 | 1 | 1 | 0 |
| 9 | Funding | 1 | 1 | 1 | 1 | 1 |
| 10 | Quality issues | 0 | 0 | 0 | 1 | 1 |
| 11 | Subcontractor changes | 0 | 0 | 1 | 1 | 1 |
| 12 | Human errors | 0 | 1 | 1 | 1 | 0 |
| 13 | Material | 0 | 0 | 0 | 1 | 1 |
| 14 | Environmental impacts | 0 | 0 | 1 | 1 | 1 |
| 15 | Low skills | 0 | 1 | 1 | 1 | 0 |
| 16 | Poor logistic | 0 | 0 | 1 | 1 | 1 |
| 17 | Warranty | 0 | 0 | 0 | 1 | 1 |
| 18 | Constructability problems | 0 | 0 | 0 | 1 | 1 |
| 19 | Conflicts | 0 | 0 | 1 | 1 | 1 |
| 20 | Accessibility | 0 | 0 | 1 | 1 | 1 |
| 21 | Safety | 0 | 0 | 1 | 1 | 1 |
| 22 | Permissions from authorities | 1 | 1 | 1 | 1 | 1 |
| 23 | Change in law | 1 | 1 | 1 | 1 | 1 |
| 24 | Incorrect scope | 0 | 1 | 1 | 1 | 1 |
| 25 | Machines | 0 | 0 | 1 | 1 | 0 |
| 26 | Security | 0 | 0 | 1 | 1 | 0 |
| 27 | Bankruptcies | 1 | 1 | 1 | 1 | 1 |
| 28 | Inflation | 1 | 1 | 1 | 1 | 1 |
| Total | 5 | 11 | 23 | 28 | 19 | |
| No | Contingency Factors | 1 | 2 | 3 | 4 | 5 | Total Reviewers | RII |
|---|---|---|---|---|---|---|---|---|
| 1 | Site layout | 2 | 6 | 12 | 14 | 24 | 58 | 0.77931 |
| 2 | Soil problems | 2 | 9 | 8 | 24 | 15 | 58 | 0.74138 |
| 3 | Dispute with owner | 3 | 7 | 15 | 18 | 15 | 58 | 0.72069 |
| 4 | Insurance | 8 | 6 | 7 | 18 | 19 | 58 | 0.71724 |
| 5 | Weather | 9 | 7 | 7 | 12 | 23 | 58 | 0.71379 |
| 6 | Design issues | 6 | 7 | 12 | 16 | 17 | 58 | 0.70690 |
| 7 | Social impacts | 8 | 8 | 9 | 12 | 21 | 58 | 0.70345 |
| 8 | Market fluctuation | 8 | 9 | 8 | 12 | 21 | 58 | 0.70000 |
| 9 | Funding | 2 | 11 | 18 | 12 | 15 | 58 | 0.69310 |
| 10 | Quality issues | 8 | 9 | 11 | 24 | 6 | 58 | 0.63793 |
| 11 | Subcontractor changes | 7 | 13 | 14 | 13 | 11 | 58 | 0.62759 |
| 12 | Human errors | 8 | 11 | 13 | 18 | 8 | 58 | 0.62414 |
| 13 | Material | 8 | 13 | 14 | 11 | 12 | 58 | 0.62069 |
| 14 | Environmental impacts | 11 | 12 | 14 | 8 | 13 | 58 | 0.60000 |
| 15 | Low skills | 6 | 13 | 22 | 11 | 6 | 58 | 0.59310 |
| 16 | Poor logistic | 18 | 19 | 5 | 7 | 9 | 58 | 0.49655 |
| 17 | Warranty | 12 | 18 | 20 | 6 | 2 | 58 | 0.48966 |
| 18 | Constructability problems | 15 | 13 | 22 | 6 | 2 | 58 | 0.48621 |
| 19 | Conflicts | 15 | 15 | 17 | 11 | 0 | 58 | 0.48276 |
| 20 | Accessibility | 13 | 23 | 14 | 5 | 3 | 58 | 0.46897 |
| 21 | Safety | 17 | 18 | 14 | 7 | 2 | 58 | 0.45862 |
| 22 | Permissions from authorities | 18 | 21 | 13 | 5 | 1 | 58 | 0.42759 |
| 23 | Change in law | 23 | 20 | 5 | 6 | 4 | 58 | 0.42069 |
| 24 | Incorrect scope | 31 | 12 | 6 | 6 | 3 | 58 | 0.38621 |
| 25 | Machines | 23 | 24 | 8 | 3 | 0 | 58 | 0.36897 |
| 26 | Security | 32 | 11 | 8 | 7 | 0 | 58 | 0.36552 |
| 27 | Bankruptcies | 32 | 14 | 10 | 2 | 0 | 58 | 0.33793 |
| 28 | Inflation | 32 | 20 | 3 | 2 | 1 | 58 | 0.32414 |
| Method | RMS Error | Training Time | Reason Training Stopped | Number of Trials | Training (% Bad Predictions) | Testing (% Bad Predictions) |
|---|---|---|---|---|---|---|
| GRNN | 0.00 | 0:00:14 | Auto-Stopped | 108 | 5 | 25 |
| MLFN 2 Nodes | 0.00 | 0:03:00 | Auto-Stopped | 726,188 | 75 | 79 |
| MLFN 3 Nodes | 0.00 | 0:03:00 | Auto-Stopped | 587,146 | 76 | 78 |
| MLFN 4 Nodes | 0.00 | 0:03:00 | Auto-Stopped | 471,988 | 75 | 80 |
| MLFN 5 Nodes | 0.00 | 0:03:00 | Auto-Stopped | 374,796 | 75 | 77 |
| MLFN 6 Nodes | 0.00 | 0:03:00 | Auto-Stopped | 319,689 | 72 | 75 |
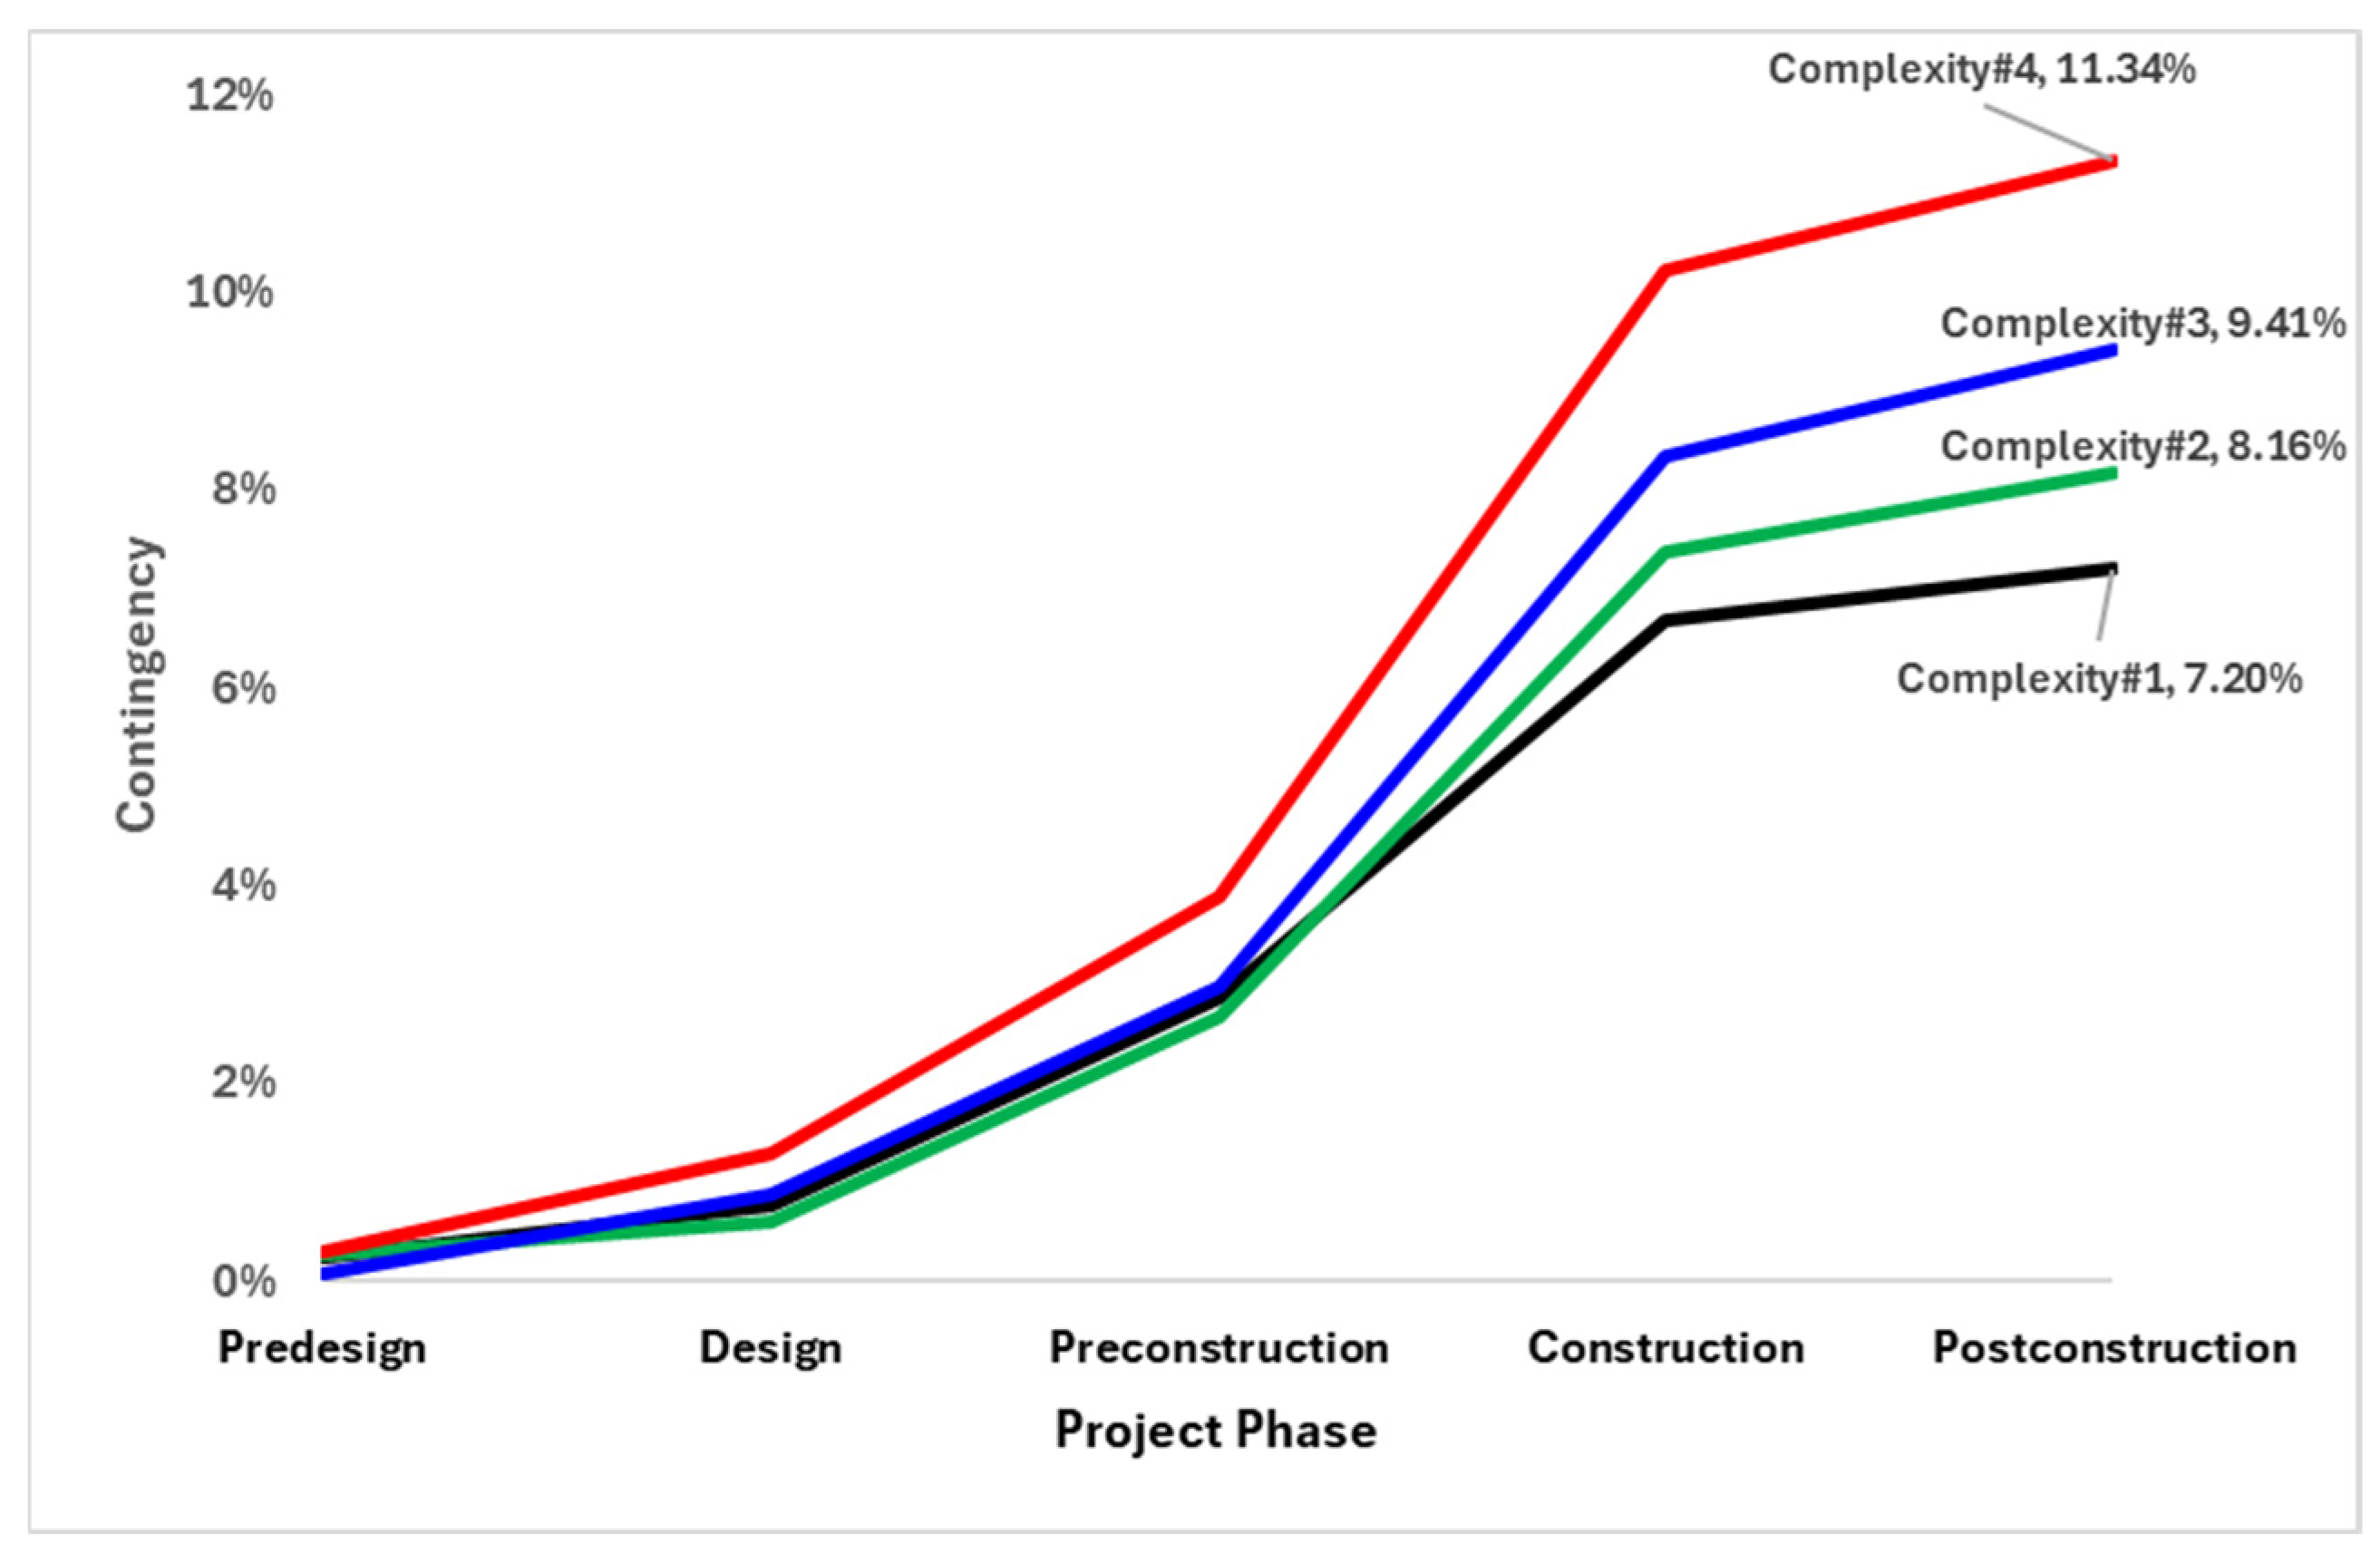
| Complexity | Predesign | Design | Preconstruction | Construction | Postconstruction | Total |
|---|---|---|---|---|---|---|
| 1 | 0.24% | 0.52% | 2.10% | 3.82% | 0.53% | 7.20% |
| 2 | 0.26% | 0.35% | 2.05% | 4.71% | 0.79% | 8.16% |
| 3 | 0.08% | 0.78% | 2.10% | 5.38% | 1.06% | 9.41% |
| 4 | 0.30% | 0.99% | 2.61% | 6.33% | 1.12% | 11.34% |
| Decision | Predesign | Design | Preconstruction | Construction | Postconstruction | Total |
|---|---|---|---|---|---|---|
| Agree | 23 (58%) | 25 (62%) | 30 (74%) | 32 (80%) | 28 (70%) | 138 (69%) |
| Not sure | 8 (20%) | 7 (18%) | 5 (13%) | 3 (8%) | 9 (22%) | 32 (16%) |
| Disagree | 9 (22%) | 8 (20%) | 5 (13%) | 5 (12%) | 3 (8%) | 30 (15%) |
| Total (%) | 40 (100%) | 40 (100%) | 40 (100%) | 40 (100%) | 40 (100%) | 200 (100%) |
Disclaimer/Publisher’s Note: The statements, opinions and data contained in all publications are solely those of the individual author(s) and contributor(s) and not of MDPI and/or the editor(s). MDPI and/or the editor(s) disclaim responsibility for any injury to people or property resulting from any ideas, methods, instructions or products referred to in the content. |
© 2024 by the author. Licensee MDPI, Basel, Switzerland. This article is an open access article distributed under the terms and conditions of the Creative Commons Attribution (CC BY) license (https://creativecommons.org/licenses/by/4.0/).
Share and Cite
Salman, A. Analyzing Contingency Estimation for Residential Turnkey Projects in Saudi Arabia: A Neural Network Approach. Buildings 2024, 14, 1844. https://doi.org/10.3390/buildings14061844
Salman A. Analyzing Contingency Estimation for Residential Turnkey Projects in Saudi Arabia: A Neural Network Approach. Buildings. 2024; 14(6):1844. https://doi.org/10.3390/buildings14061844
Chicago/Turabian StyleSalman, Alaa. 2024. "Analyzing Contingency Estimation for Residential Turnkey Projects in Saudi Arabia: A Neural Network Approach" Buildings 14, no. 6: 1844. https://doi.org/10.3390/buildings14061844