Abstract
Indoor transitional space is a popular buffer space between buildings’ interior and exterior environments nowadays. Maintaining a comfortable indoor thermal comfort for transitional spaces often poses challenges to building designers and engineers. Some existing studies have already explored this topic, but they are mainly carried out in academic buildings. There are, however, still many other types of buildings containing transitional space, including entertainment buildings such as theaters and tourist centers. To provide useful information about people’s thermal requirements in the transitional space of entertainment buildings, this study has adopted both field measurement and questionnaire methods. Additionally, the same method has been repeated in an academic setting as well, so the results can be compared with existing studies. By comparing participants’ thermal requirements, it indicates that people’s thermal requirements are significantly impacted by operative temperature, which can give architects suggestions to improve the thermal environment in transitional spaces. In addition, in transitional spaces, people had a high tolerance for their thermal environment, especially participants in entertainment buildings, who showed a fairly high thermal satisfaction rate of 96% in winter and 94% in summer, far beyond the rates of 89% and 73% in academic buildings. Combined with the analysis of participants’ thermal preferences and the reason people stay in transitional spaces, it implies a close relationship between participants’ thermal comfort differences and the function that transitional spaces provide.
1. Introduction
In current society, transitional spaces are a special type of room in buildings, as they provide a link between indoor and outdoor environments [1]. Transitional space commonly includes outdoor transitional space (e.g., bus stations and courtyards), semi-outdoor space (e.g., train stations and porches), and indoor transitional space (e.g., foyers and lift lobbies) [2]. Within these types, indoor transitional space has been developed to work as a buffer space between indoor and outdoor environments. In modern non-residential buildings, indoor transitional space has become very common, providing functional areas like resting areas, performance areas, and meeting areas [3]. Although indoor transitional space often takes up no more than 40% of buildings’ total floor area, their energy demand could be up to three times that from the remaining parts of buildings [4]. Therefore, reducing the energy consumption of this special space type becomes very important for reducing overall building energy consumption. To achieve this intention, a good understanding of occupants’ thermal requirements is essential for guiding architectural design, system selection, and building operation [2,5,6,7].
Existing studies in terms of the thermal requirements in indoor transitional spaces were mainly carried out in academic buildings. In Bangkok, Thailand, Jitkhajornwanich et al. [8] studied the thermal environment of indoor transitional space in two academic buildings, using calculated neutral temperatures and preferred temperatures for both cool and warm seasons. In a study carried out by Pitts et al. [9] in one academic building and one office building, a wider thermal comfort range in transitional space was observed than was predicted by Fanger’s PMV model. In a laboratory building, Wu and Mahdavi [10] assessed people’s thermal requirements in transitional states and suggested that the change in thermal sensation was consistent with the respective difference in temperature. In Malaysia, Kwong and Adam [11] conducted a field study in the enclosed lift lobby of an educational institution, and their result showed a lower thermal expectation than conventional space. In another study by Kwang and Adam [12], it was found that occupants’ thermal perception was directly related to the level of human occupancy in transitional space. Additionally, a sudden change in temperature may lead to discomfort for occupants. To investigate the thermal performances of both semi-opened and fully enclosed transitional spaces in different seasons, Hui and Jiang [13] conducted a study in one academic building in Hong Kong. In this study, they observed that people accept a wider thermal environment in transitional spaces, and their thermal response varies with dressing, activity level, past thermal experience, and prior thermal preference. Therefore, they believed that the current comfort standards and criteria are not suitable for designing transitional spaces.
In addition to the studies carried out in academic buildings, there are some relevant studies carried out in other types of buildings as well. For example, Hwang et al. [14] studied occupants’ thermal requirements in the transitional space of one commercial building in Bangkok, Thailand. From the study, they observed that the thermal requirements of occupants in the transitional space were similar to those in an office environment. Kotopouleas and Nikolopoulou [15] conducted a study in airport terminals, evaluating the thermal perceptions of both passengers and staff. Their study revealed the complications of thermal requirements in airport terminals. Avantaggiato [16] conducted a study in three Italian shopping centers, and the study demonstrated the inappropriateness of using both Fanger’s PMV model and the adaptive comfort model for transitional spaces, as customers were found to have a much wider range of indoor comfort feelings. However, research data regarding the thermal environment of transitional areas are still lacking [13,17,18]. The majority of studies [4,5,13,19,20,21,22,23] came to the conclusion that a greater variety of comfort conditions than those suggested by Fanger’s model can be accepted by individuals in transitional settings. They contend that Fanger’s model is limited by the steady-state settings in which it was created, but transitional regions include dynamic characteristics that render Fanger’s model inappropriate. According to certain research [8,9,10,11], users in transitional spaces are also more adaptive. This observation may be influenced by the amount of time spent in the transitional area as well as prior thermal experience. All these studies concluded that further investigation on thermal comfort in transitional spaces at different times of the year is required to expand the database of evidence. All of these studies came to the conclusion that in order to increase the body of evidence, more research on thermal comfort in transitional spaces at various times of the year is needed.
The above review work reflects that most existing studies in terms of indoor transitional space focused on academic buildings, with some investigations carried out in other building types, including airport terminals and lobbies. To obtain a comprehensive understanding, more data are still highly required, especially from non-academic buildings. In current society, entertainment buildings have started to play an important role, as they can provide functions like cinemas, leisure centers, cafés, amusement arcades, et al. This building type may consume a high level of energy, but relevant studies seem to be rare, especially for their transitional space. To fill this gap, this study has selected one entertainment building located in the UK, and data relevant to occupants’ thermal requirements were collected by both subjective and objective methods. To compare occupants’ thermal requirements between this building type and academic buildings, which have been better understood, data were collected using the same methods from one academic building close by. We hope that the results from this study will provide field evidence about the thermal requirements of the transitional space in entertainment buildings to help control this space more efficiently.
2. Methodology
The methodology conducted in this research included on-site questionnaire surveys and physical measurements, one existing entertainment building and one academic building with indoor transitional spaces were chosen as the case study building. The monitoring of both interior and outdoor environmental conditions occurred concurrently with the field studies and the administration of questionnaire surveys.
2.1. Case Study Buildings
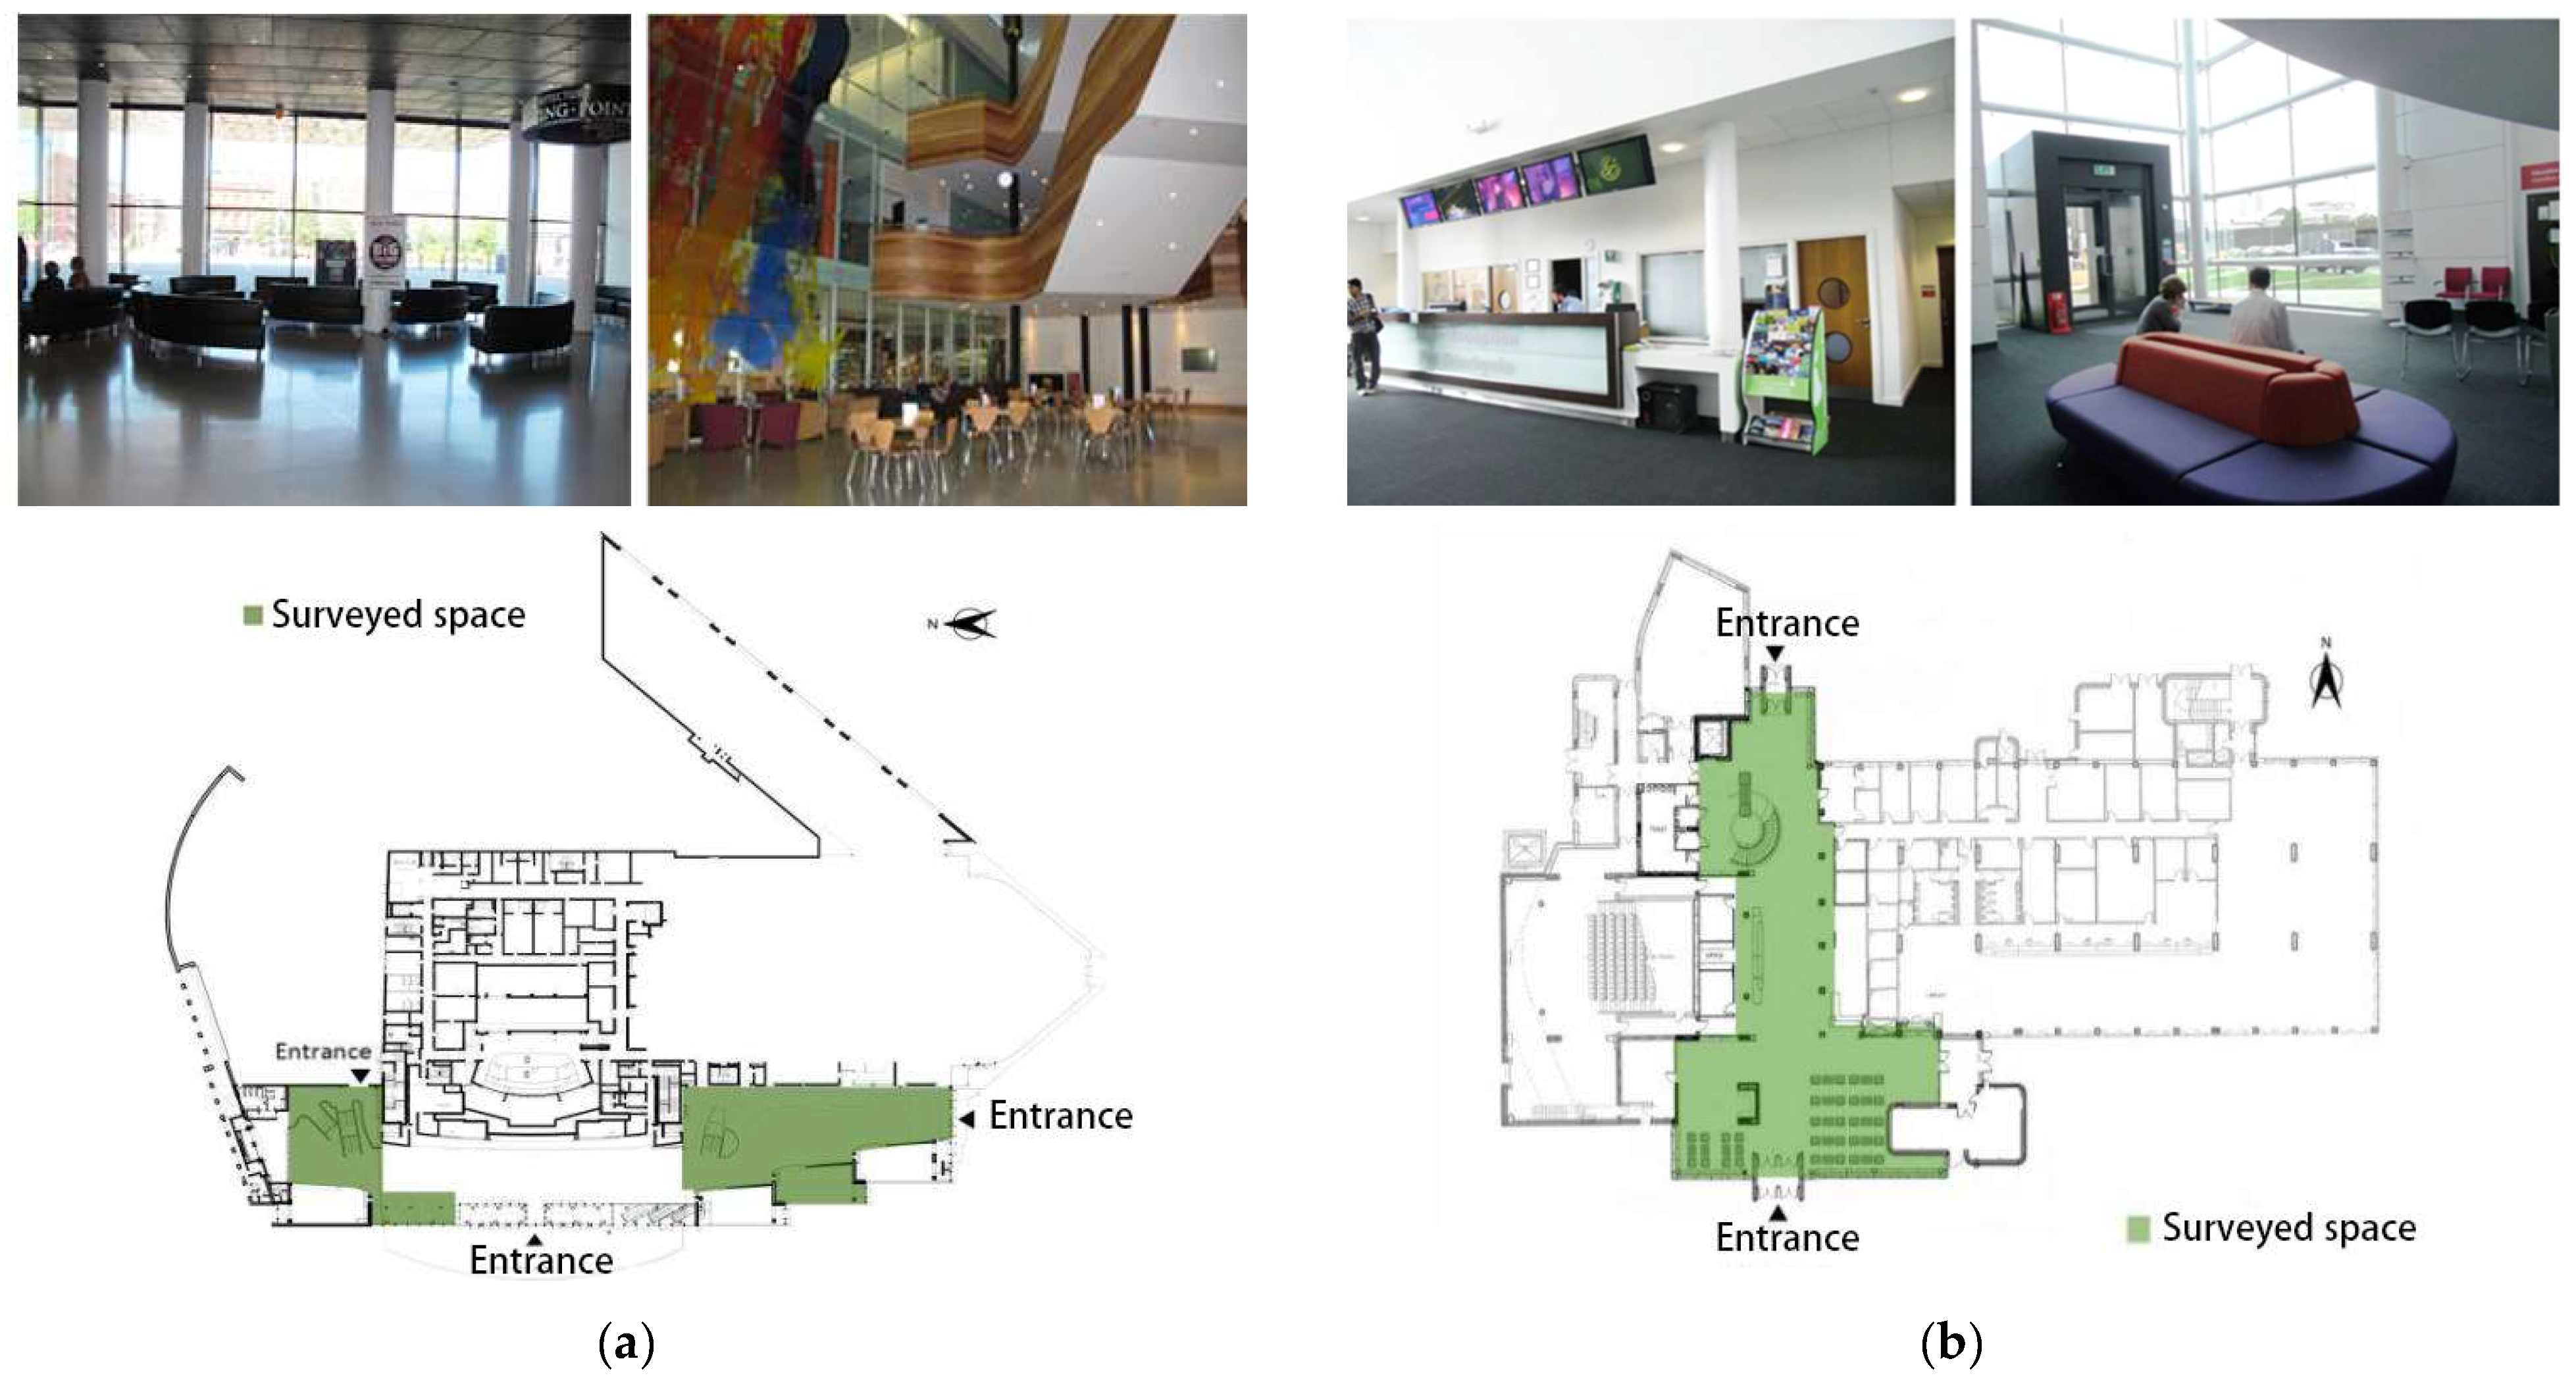
In this study, two buildings with different operational functions were investigated. One is an academic building, and another is an entertainment building. Both buildings are in the city of Cardiff, UK (51°29′0″ N, 3°11′0″ W, alt. 65 m) and have transitional space inside. Figure 1 depicts the two buildings and the layouts of the transitional spaces in them. Both transitional spaces connect with the main entrances of the two buildings, and they contain communal spaces like cafés, bars, and shops. For the transitional spaces in the two buildings under investigation, there are some common functional areas, such as corridors for passing through, resting areas, eating and drinking areas, and informal meeting areas. The TSAB (Transitional Space in the Academic Building), however, has one more function than the TSEB (Transitional Space in the Entertainment Building), which is the study area. To maintain a comfortable indoor thermal environment, both spaces were centrally controlled by dedicated HVAC systems, so the users have no control over the indoor thermal environment. Table 1 lists some key information about the two indoor transitional spaces investigated in this study.

Figure 1.
Investigated buildings and transitional spaces. (a) Entertainment building, (b) academic building.

Table 1.
Key characteristics of the investigated transitional spaces.
2.2. Physical Measurements
The survey was conducted in both winter (the last week of January for the TSAB and the first week of February for the TSEB) and summer (the first week of August for the TSAB and the second week of August for the TSEB) to reflect seasonal variations. The measurement was performed in two consecutive weeks to ensure a similar outdoor environment. The data were collected daily, from the opening of the buildings (9 a.m. for both TSEB and TSAB) to the closure of the buildings (7 p.m. for the TSEB and 5 p.m. for the TSAB).
In this study, indoor environmental parameters, namely, air temperature, mean radiant temperature, relative humidity, and air velocity, were measured and recorded. Operative temperature and relative humidity were measured by an AREXX TSN-TH70E Wireless Temperature and Humidity Sensor (accuracy: ±0.2 °C for temperature and ±5% for humidity), and air velocity was measured by a Testo RS327-0640 hot-wired anemometer (accuracy: ±0.1 m/s). All measurements were carried out at the center of different thermal zones within the indoor transitional space, 1.1 m above the floor (the abdomen level recommended in ISO 7726) [24], with the avoidance of direct sunlight and local heating and cooling sources. The measurement intervals were set at 2 min. The outdoor temperature was measured by a DELTA-T WS-GP1 weather station (accuracy: ±0.2 °C), located on the roof of one building on the campus of Cardiff University, at an interval of 2 min as well. The weather station was installed three meters above the roof level to avoid the heat generated by the building.
2.3. Questionnaire Surveys
In addition to the above physical parameters, relevant subjective information was also collected using questionnaires to reflect occupants’ thermal sensations and preferences. The questions were developed according to ASHRAE Standard 55 [25]. The questionnaire consists of three main sections. Section 1 collects relevant personal information, such as participants’ gender, age, and occupation. Section 2 investigates participants’ historical interactions with the building and the indoor transitional space under investigation, such as their purposes for using the space, activity level, previous visit frequency, time spent at the interviewed location, and clothing insulation. Section 3 focuses on participants’ thermal perceptions of the indoor transitional space. All participants were randomly selected from the users of the investigated transitional spaces. All participants required a minimum setup time of 5 min to ensure sufficient time to experience the local thermal environment. To determine participants’ metabolic rate, their activities were recorded by the researcher of this study through observation. Their clothing insulation was estimated by themselves using the checklist given in ASHRAE Standard 55. Finally, a total of 494 interviews were conducted throughout the survey period, with 243 (49%) performed in the winter and 251 (51%) performed in the summer. To balance gender, there were 232 (47%) females and 262 (53%) males who participated. All participants were selected randomly from the targeted transitional spaces.
2.4. Data Analysis
The data collected from the field studies were first compiled into spreadsheets and then analyzed using the Statistical Package for Social Science (SPSS) version 20. The data were prepared separately for both buildings, and the results were then compared. To statistically estimate the potential effect of various factors on participants’ thermal sensation, such as operative temperature and cloth insulation, linear regression was adopted [26], with the outcomes analyzed based on two significance levels, namely, average statistical significance (p < 0.05) and high statistical significance (p < 0.01). For the analysis of participants’ thermal preference and preferred temperature, probit analysis was applied, as in previous studies [14].
3. Results and Discussion
3.1. Results from the Academic Building (with Comparisons to Existing Studies)
The data analysis of this study started in the academic building, so its results can be compared with existing studies. Table 2 has included the main results from both this study and previous studies. The results indicate that in a tropical climate country, the cloth value of people using the indoor transitional spaces is close to the cloth value in the summer UK. In terms of the metabolic rate, it indicates that except for the quite large metabolic rate range of 0.7–3.8 in research on transient thermal comfort in the UK, the metabolic rate in other research both in the UK and tropical countries has a little difference of 1.0–1.9. The results indicate that people in cooler climates favor cooler conditions than people in warmer climates. Therefore, it can be assumed that people in the UK should favor a cooler temperature range than those in tropical climate countries. As approved by the survey results in this research, the neutral temperature in Cardiff (UK) transitional space is about 4 °C lower than that in those tropical climate countries, while preferred temperature is 3 °C lower and the comfort temperature range is 4–5 °C lower. It can be seen that the comfort range in this study is wider than both these two surveys in Greece and the UK.
Table 2.
Comparison of results from other field research related to indoor transitional space.
The previous studies also showed multiple space types in the transitional spaces of academic buildings, such as lift lobby, foyer, atrium, café, and corridor. Furthermore, occupants’ activity level was different as well while in different space types, such as walking and standing occurring mainly in corridors or lift lobby, resting and meeting occurring mainly in resting areas, and eating and drinking occurring mainly in cafés). This may explain why people showed different neutral temperatures and acceptable temperature ranges in different transitional spaces. To further investigate the relationship between thermal comfort and the architecture design of indoor transitional spaces, a comparison between the research on thermal comfort in indoor transitional spaces of academic buildings and entertainment buildings is conducted.
3.2. Results from the Entertainment Building (with Comparisons to the Academic Building)
3.2.1. Descriptive Analysis
The total number of responses collected from the questionnaire surveys was 494, with detailed statistics listed in Table 3. The results reflect a good distribution in both winter and summer, as well as between males and females. It includes the measured values of both environmental and non-environmental parameters that affect occupant thermal sensations. In terms of age, the results indicate that people who visit TSAB are younger than those who visit TSEB. Due to the academic function of TSAB, quite a lot of visitors are students. In terms of clothing insulation, the results indicate that visitors wear more clothing in TSAB than in TSEB in winter, but TSAB’s visitors wear less in summer. This is affected by the time participants stay in the spaces, especially in winter. If people stay in the transitional spaces for a very short time or just pass through the spaces, they will not take off their coat. It is indicated that participants in the transitional spaces of TSEB and TSAB have approximate cloth insulation. In summer, the transitional space occupants had very similar clothing insulation values, while in winter, the effect of outdoor weather resulted in distinct variations in clothing levels between the different individuals.
Table 3.
Summary of the surveyed and monitored results.
Participants’ metabolic range is indicated similarly in the transitional spaces of TSEB and TSAB. In TSEB, the metabolic rate of participants is similar to that in TSAB, even though the activity level is a little different: participants rarely use entertainment as a transitional space for study and working. The participants’ activity in the entertainment transitional space was predominantly eating and drinking (1.5 met), social, watching performances (1.2 met), or sitting (1.0 met). In TSAB, this was predominantly reading and writing, social (meeting and talking), watching performances and working on computers (1.2 met) or sitting (1.0 met), but a small number of them were eating or drinking (1.5 met).
As mentioned in the research methodology, three major environmental parameters, namely, operative temperature (To), air velocity (AV), and relative humidity (RH), have been monitored in this study. It could be observed that in terms of average values, most parameters are similar between the two types of buildings, except the indoor operative temperature in summer (25.6 °C in the TSAB vs. 22.1 °C in the TSEB).
3.2.2. Comparisons of Occupant Thermal Comfort
The best that people can realistically hope to achieve is a thermal environment that satisfies the majority of people in the space, or, more simply, ‘reasonable comfort’. Fanger claimed that, in general, a comfort zone is an environment situation in which 80% of the occupants feel satisfied with their environment, and the HSE (Health & Safety Executive) in the UK also considers 80% of occupants as a reasonable limit for the minimum number of people who should be thermally comfortable in an environment [27,28].
Thermal sensation: The statistical distributions of the survey participants’ perceptions of the thermal environment are summarized in Figure 2. In winter, 55% of participants in TSEB expressed their thermal sensation as “neutral”, while in TSAB, the percentage is 29%. In summer, 54% of participants in TSEB and 34% of TSAB expressed their thermal sensation as “neutral”. In winter TSAB, almost 50% of the votes fell in the “warmer than neutral” region of the scale, i.e., including “slightly warm” (34%), “warm” (7%), and “hot” (3%) and 50% of the votes “cooler than neutral”, i.e., including “slightly cool” (19%), “cool” (9%), and “cold” (2%). In entertainment, this ratio is less and relatively equal to 18% and 27% separately. In summer TSAB, more than ten times as many votes fell in the “warmer than neutral” region of the scale, i.e., including “slightly warm” (43%), “warm” (12%), and “hot” (6%), compared to the votes “cooler than neutral”, i.e., including “slightly cool” (5%), “cool” (1%), and “cold”(0%), which shows a relatively equal ration in TSEB, as 24% and 23% separately, even the votes on “slightly cool” are 2% higher than “slightly warm”.
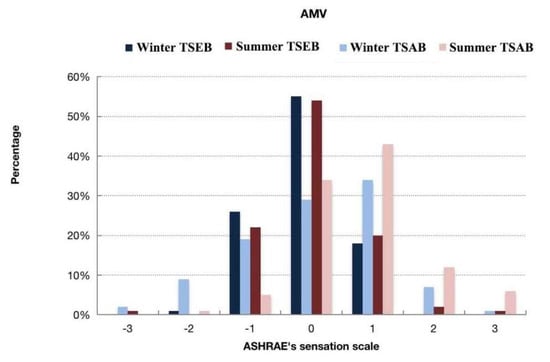
Figure 2.
Distributions of thermal sensation votes in TSEB and TSAB.
The PPD thermal comfort index is based on the assumption that people voting in the middle three categories (i.e., “slightly cool” −1, “neutral” 0, and “slightly warm” +1) of the 7-point thermal sensation scale are satisfied with their thermal environment. Extending the assumption to the AMV in the survey of TSAB, 82% of the participants in the winter and summer were satisfied with their transitional space thermal conditions. But in TSEB, it is as high as 99% in winter and 98% in summer. By logical extension, votes on +2 (warm), +3 (hot), −2 (cool), and −3 (cold) can be regarded as an expression of thermal dissatisfaction, which in TSAB amounted to 18% both in winter and summer when in entertainment it was only 1% and 2%. It indicates that in both buildings, a quite high percentage of participants are satisfied with their thermal environment compared to the industry-accepted minimum standard of 80% acceptability, as recommended in regulatory documents such as ASHRAE’s Standard 55 [29].
Thermal satisfaction: The data analysis indicated that the thermal conditions in the two surveyed transitional spaces in buildings regularly meet people’s thermal requirements. In both cases, the satisfaction with the thermal environment according to the ASHRAE scale central categories (−1, 0, +1) meets the ASHRAE standards requirement of 80% [30]. Actually, it is far more than 80% in TSEB; the satisfactory rate is close to 100% both in winter and summer. In terms of direct acceptability, higher acceptability also happens at TSEB for 96% in winter and 94% in summer, whereas at TSAB it is 89% and 73%. It indicates that, according to the thermal sensation scale or direct acceptability, people in TSEB indoor transitional spaces have a much higher thermal satisfaction rate than in TSAB, even though the measured operative temperature in them is quite beyond the comfort temperature boundary.
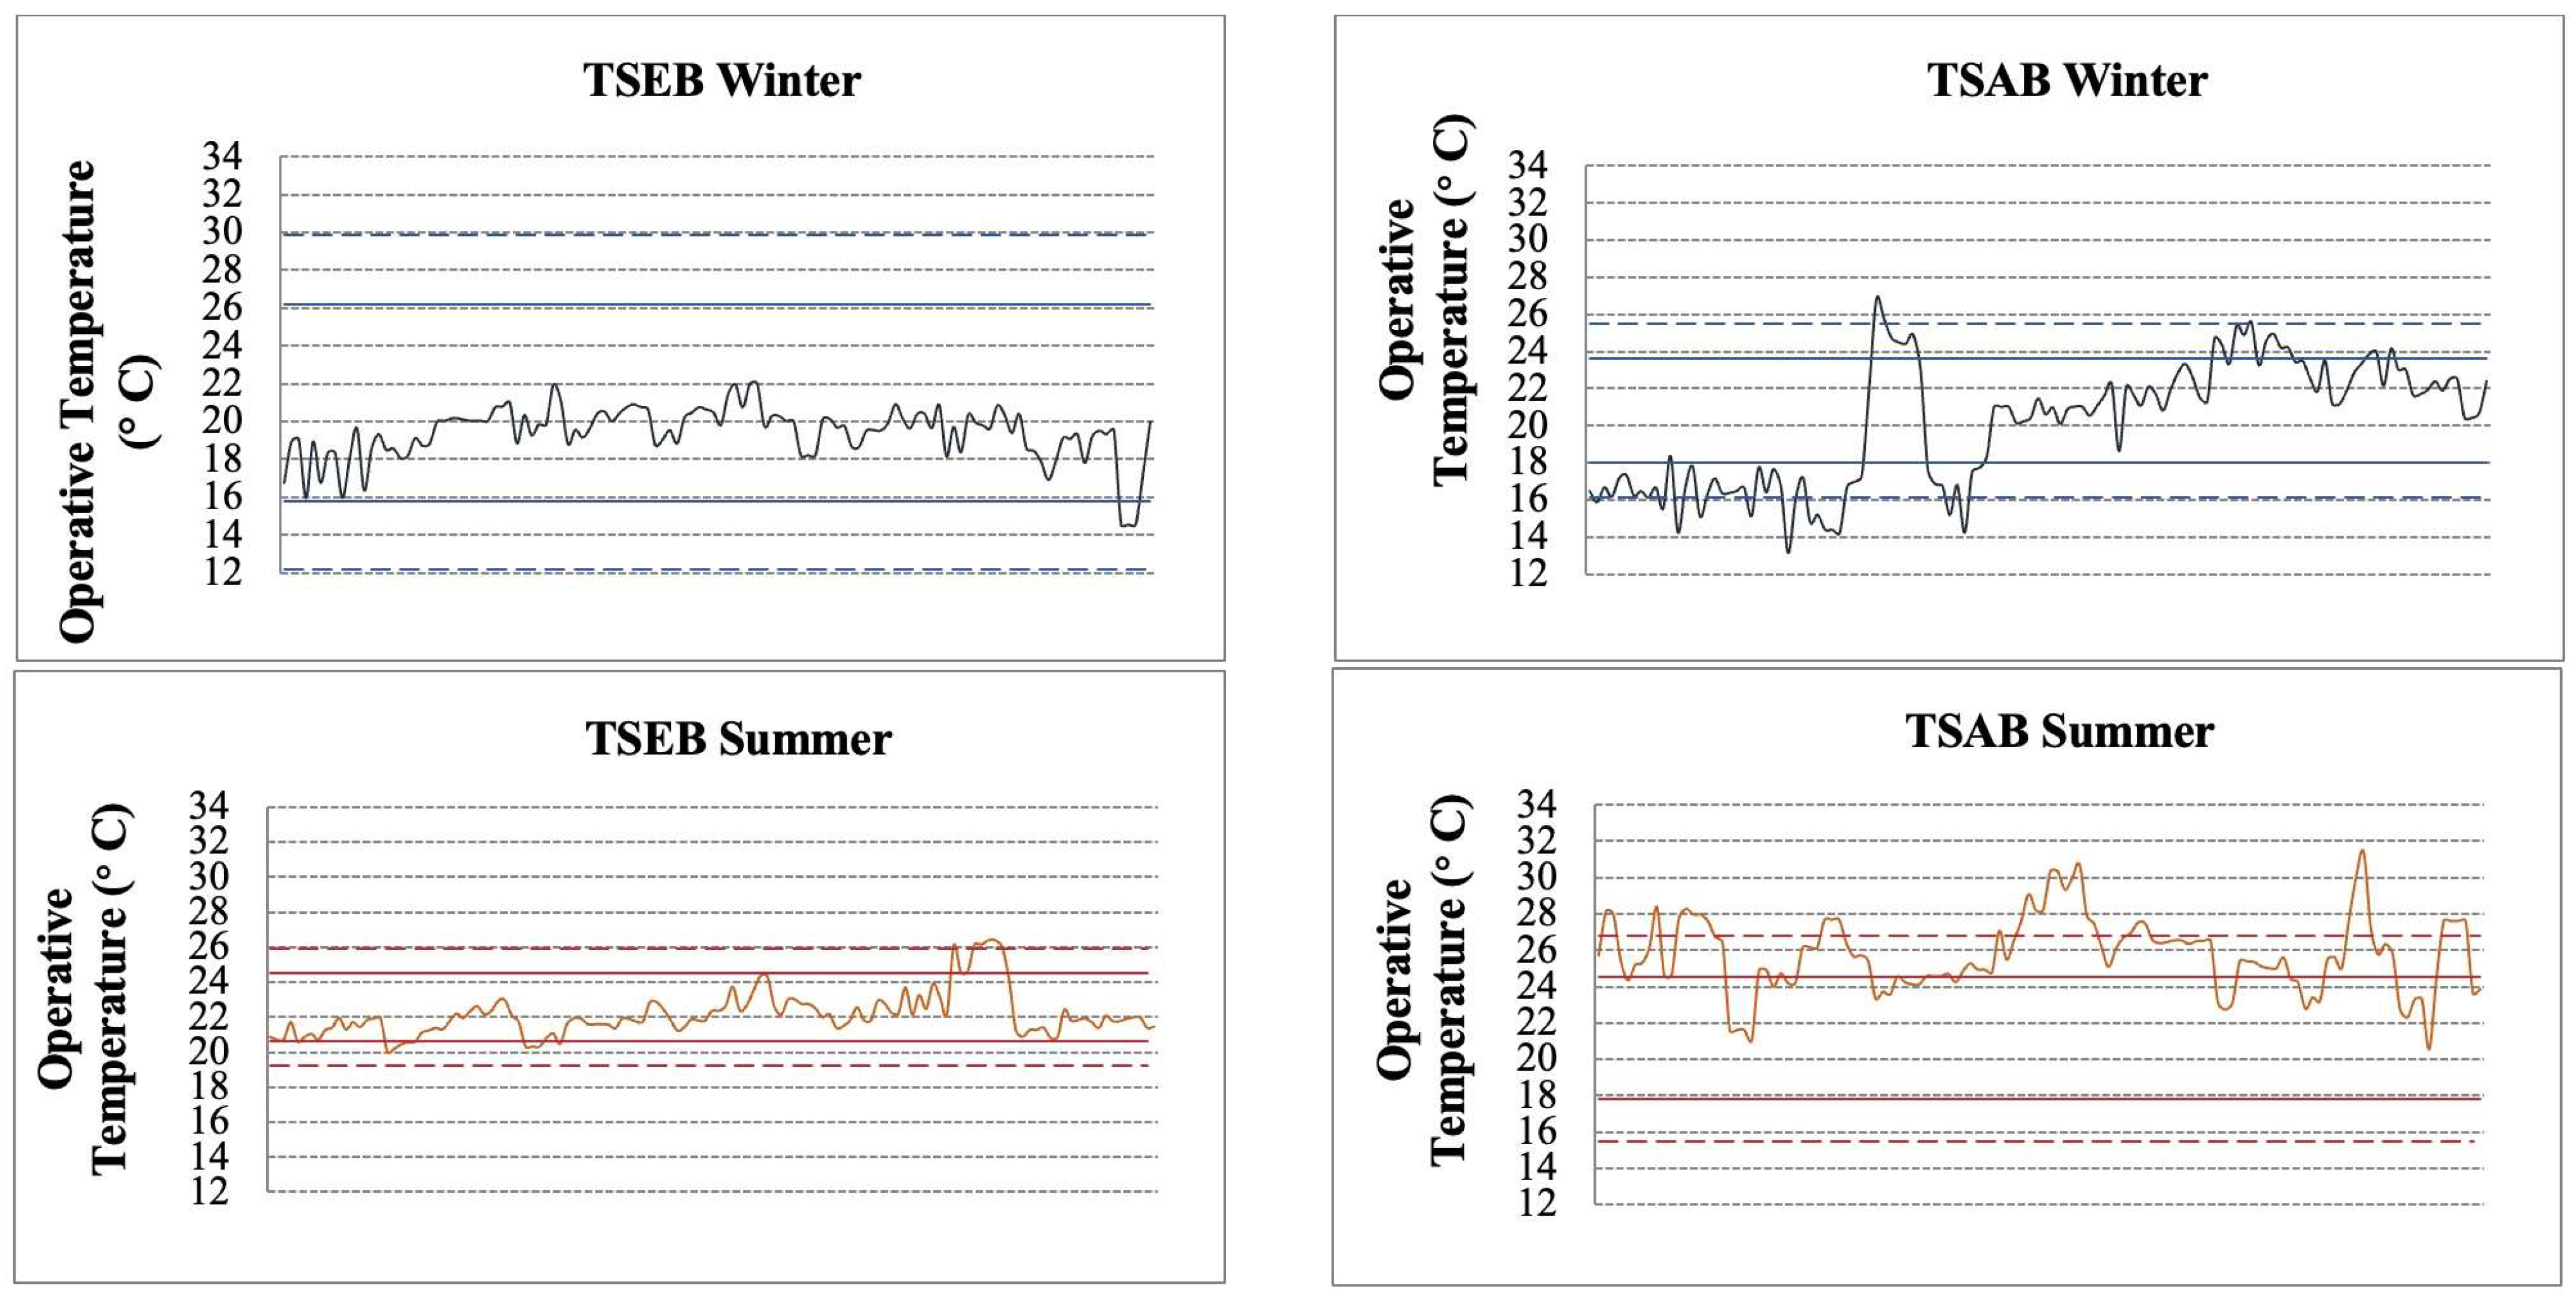
Figure 3 indicates the operative temperature during survey time, together with the 80% and 90% acceptability temperature ranges. During the winter surveys, the temperature lies within the acceptable range of 80% in TSEB, and 85% in TSAB during the monitoring time. However, the summer operative temperature in all of these two cases was not 100% within the 80% acceptable range. Especially in TSAB, the percentage of operative temperature remains within that range for only 73% of the time, which highlights the periods of overheating. Additionally, the acceptable temperature range in winter TSEB is far wider than the actual operative temperature range, which also illustrates a high thermal tolerance of the environment for participants in TSEB.
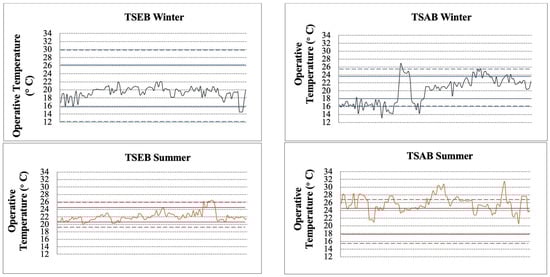
Figure 3.
Operative temperature, 80% (dotted lines) and 90% (continuous lines) acceptability temperature ranges in winter and summer of two cases.
Thermal perception: This study defines the relative contribution of environmental and personal parameters (heat-balance parameters) to the thermal perception of subjects in indoor transitional spaces. To find which environmental parameters had a strong influence on thermal comfort in two indoor transitional spaces, two steps of statistical analysis were conducted. Firstly, a correlation analysis was carried out between AMV and the evaluation parameters (environmental and personal parameters). Secondly, a further ordinal regression analysis was carried out on the correlated environmental and the personal parameters with AMV.
Table 4 shows the results of the correlation analysis between AMV and the evaluated parameters in TSEB and TSAB, respectively. The results indicate that AMV is more correlated with operative temperature than with any other physical variable, with the associated coefficients being 0.256 for TSEB and 0.492 for TSAB (all significant at p < 0.01). In terms of personal parameters, AMV correlated to clothing insulation rather than activity, as indicated by the results of −0.019 for TSEB (significant at p > 0.05) and −0.327 for TSAB (significant at p < 0.01). Therefore, these variables are analyzed by using ordinal regression analysis (because the AMV value is an ordinal variable).
Table 4.
Correlation analysis between AMV and evaluate parameters.
Table 5 shows the results of the ordinal regression to predict the criterion variable (AMV). For the data collected in TSEB, operative temperature (p < 0.001) and clothing insulation (p = 0.001) are the significant variables and account for almost 10% of the variation in the actual sensation vote (AMV). However, r2 = 0.095 indicates weakness in the ability of the predicted model to fit that data. By comparing it to clothing insulation, the Wald value also indicates that operative temperature (Wald = 26.801 p < 0.001) is the most important predictor that influences the actual thermal sensation votes of TSEB’s participants. Clothing insulation for participants in TSEB was found to be significant in predicting the AMV; however, it had less influence on the AMV compared to operative temperature. The Wald value of clothing insulation is 10.715 and p = 0.001. In TSAB, explanatory variables include operative temperature and clothing insulation, which screen out correlation analysis. As can be seen, operative temperature is the significant variable (p < 0.001) and accounts for almost 24% (Cox and Snell r2 = 0.235) of the variation in the actual sensation vote (AMV). However, r2 = 0.235 indicates weakness in the ability of the predicted model to fit that data. The Wald value also indicates that operative temperature (Wald = 39.792 p < 0.001) is the most important predictor that influences the actual thermal sensation votes of TSAB’s participants. This result suggests the importance of solar radiation intensity together with air temperature. Thus, the mitigation of solar and air temperatures is significant for the design of indoor transitional spaces, and these two parameters could have a great impact on the use of the indoor transitional spaces and may determine the number of people and activities in them.
Table 5.
Ordinal regression statistics and best fit model to predict AMV using environmental and personal data from TSEB and TSAB.
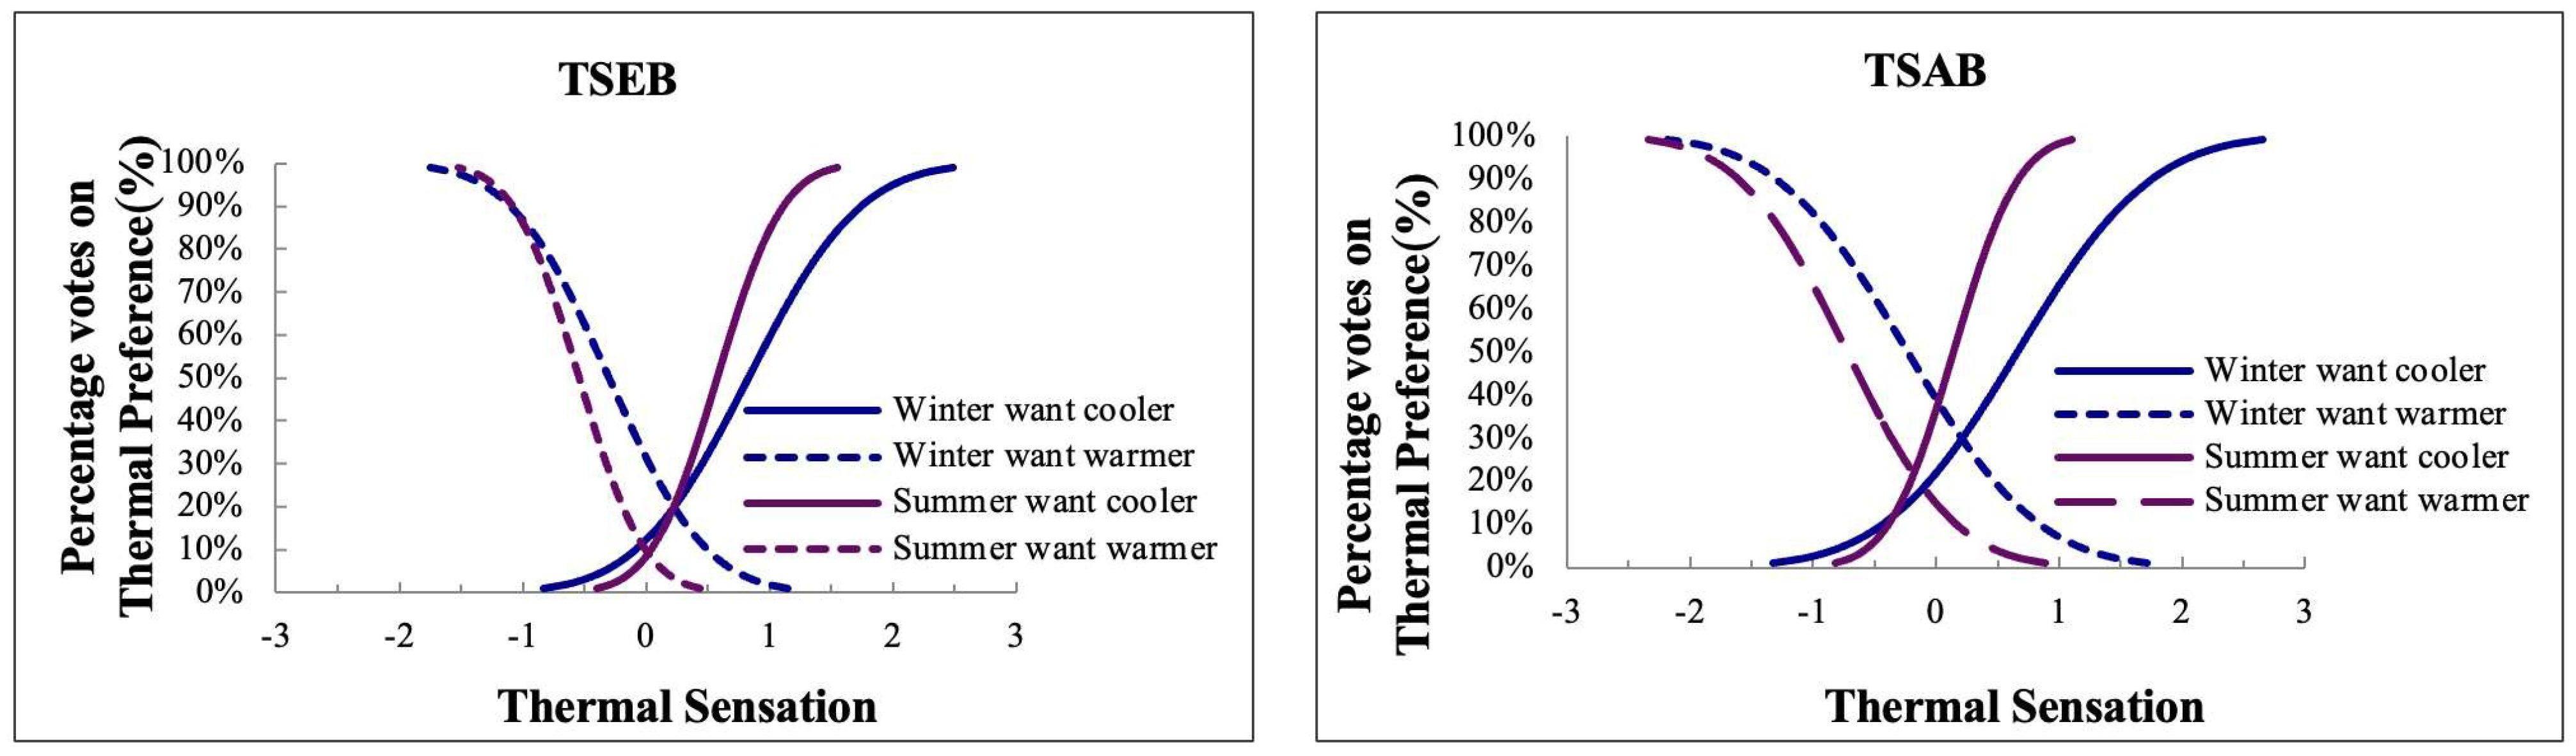
Thermal preference: The preferred sensation is the sensation people actually expected, compared to the neutral sensation, which indicates people feel comfortable. The comparison of preferred sensations between different groups could help to explore differences or similarities in their thermal perception. The smaller difference between the neutral and preferred sensations of people relates to their good adaptation to the thermal environment. Figure 4 shows the distribution of survey participants’ thermal preference votes in relation to their thermal sensation votes using probit analysis. In TSEB, it shows participants’ preference did not coincide with the thermal neutral condition, but it was shifted slightly toward a positive value both in winter and summer on the sensation scale. In TSAB, this preference did not coincide with the thermal neutral condition but was shifted slightly toward a positive value in winter and a negative value in summer on the sensation scale. As thermal sensation increased (i.e., from cold to hot), the percentage of subjects voting for ‘want cooler’ generally increased. As one might expect, the percentage of those preferring to be warmer (i.e., ‘want warmer’ responses) tended to increase as thermal sensation decreased from warm to cool. The preferred thermal sensation indicates that in winter, both groups were a little warmer than neutral, with 0.21 and 0.22 sensation levels in TSAB and TSEB, while in summer, people prefer cooler with −0.18 and 0.02 sensation levels in TSAB and TSEB. The higher sensitivity level of 0.02 in summer proves the operative temperature in summer TSEB is lower than TSAB. The analysis of preference votes demonstrated an asymmetrical correlation between thermal sensation and thermal preference in TSAB both in winter and summer, and an asymmetrical correlation between thermal sensation and thermal preference in winter and a symmetrical correlation in summer in TSEB.
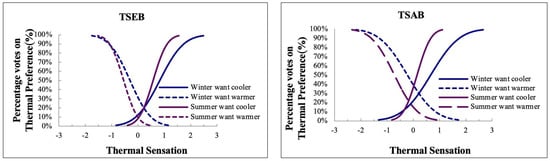
Figure 4.
Percentage of thermal preference against thermal sensation in two cases.
3.2.3. Investigation of the Thermal Conflict
This study raised the question of how the thermal comfort requirements in indoor transitional spaces in both entertainment and academic buildings in UK climate, such as the thermal sensitivity and the neutral temperature. Additionally, if the different thermal comfort requirements in different indoor transitional spaces depend on the different functions (different ways of subjects using them). The analysis of thermal neutral temperature, preferred temperature, and comfort temperature range was explained in detail.
Neutral temperature: Neutral temperature is the thermal index value corresponding with a maximum number of building occupants voting neutral on a thermal sensation scale [31,32]. When a neutral temperature can be achieved, most people will feel thermally comfortable and accept the thermal environmental condition [25]. The average neutral temperature has been used in thermal comfort research to study the effects of experience on respondents’ thermal perception [33]. A binned method was adopted by setting the increments of indoor operative temperature at half-degree Celsius in order to eliminate the outliers [34,35,36,37]. This study adopted linear regression to evaluate neutral temperatures, which has been used to investigate thermal comfort datasets since the 1930s [38,39].
Data collected from TSAB and TSEB were used to calculate the neutral temperatures to examine how people from different indoor transitional spaces adjust to their thermal perceptions. The “bin mean thermal sensation vote” rather than the individual actual votes was used to reduce individual differences [14,40]. This can be achieved by gathering several votes that correspond with half or more To degrees, depending on the highest value of r2 obtained.
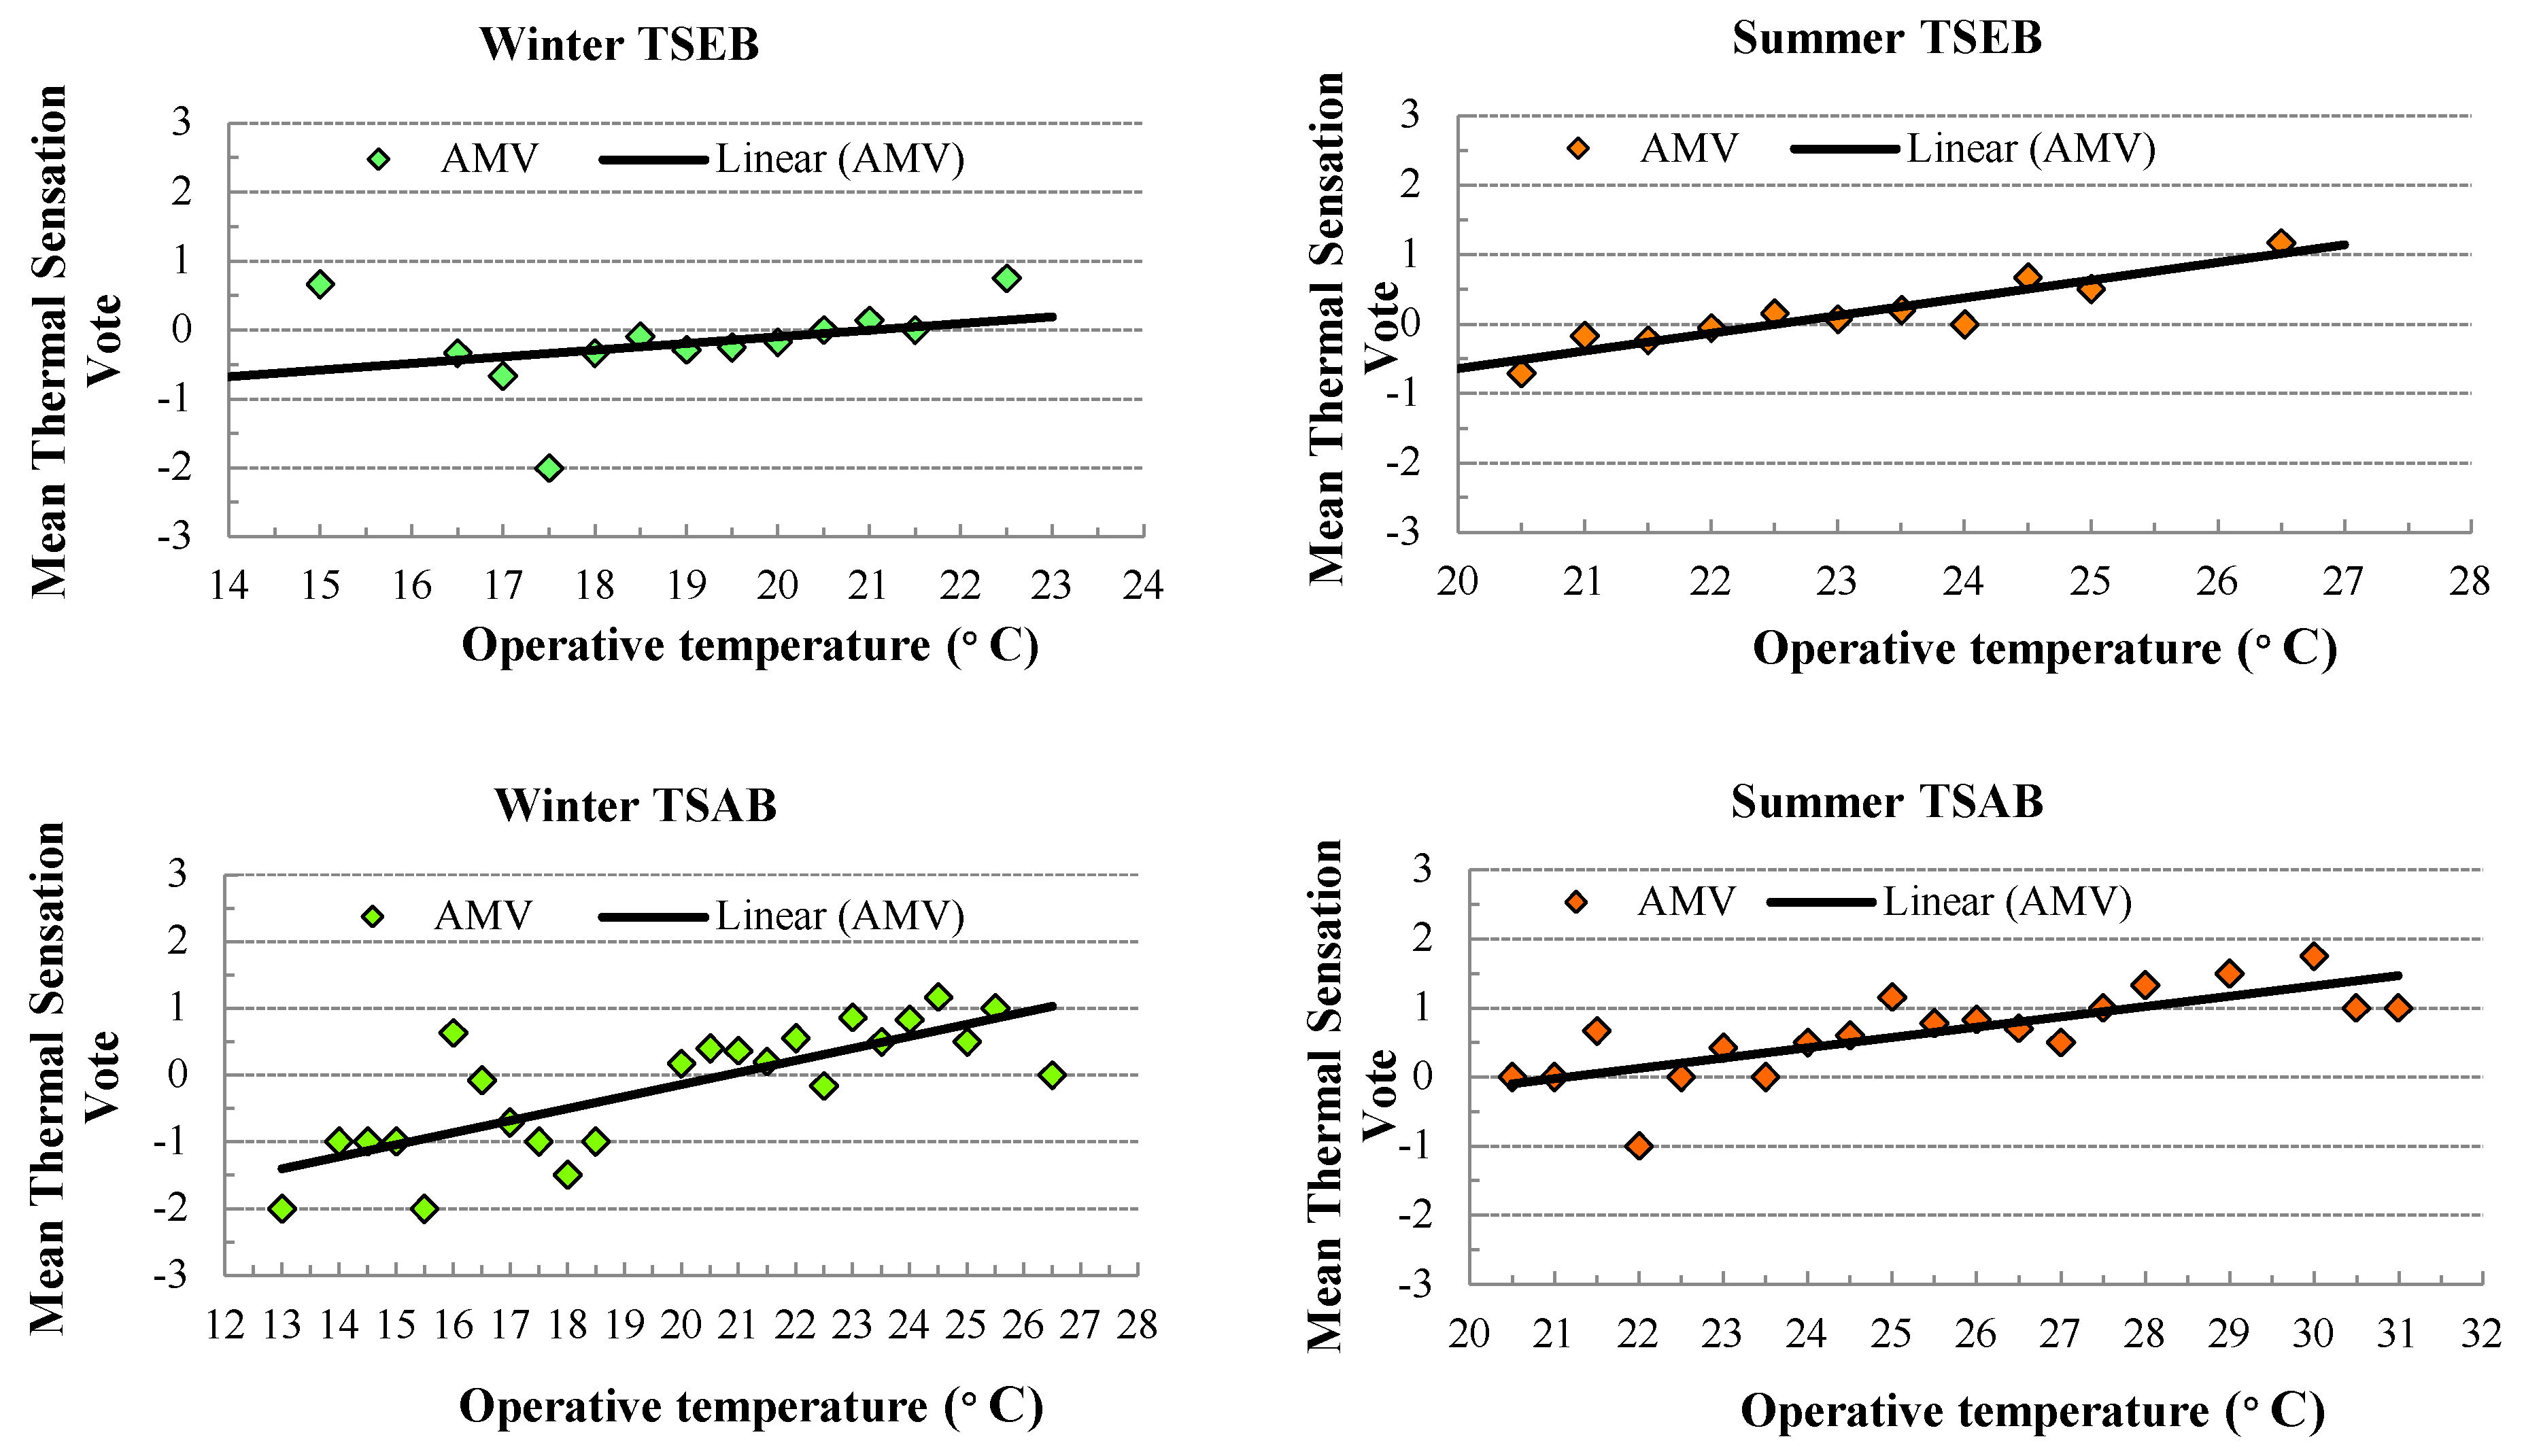
Because of the significance of the operative temperature as a predictor of the thermal sensation in the context of this study, it was therefore used as a thermal index to calculate the neutral temperature and examine the thermal sensitivity. The sensitivity of subjects’ thermal sensation to operative temperature was evaluated by examining the mean thermal sensation vote response for each half-degree interval. The plotted data are in Figure 5, and the fitted regression lines for subjects’ sensation prediction versus operative temperature in winter and summer are as follows:

Figure 5.
Mean observed sensation in indoor transitional spaces in winter and summer.
Winter TSEB:
AMV = 0.162 To − 3.264, r2 = 0.716
Summer TSEB:
AMV = 0.254 To − 5.730, r2 = 0.867
Winter TSAB:
AMV = 0.180 To − 3.740, r2 = 0.600
Summer TSAB:
AMV = 0.150 To − 3.173, r2 = 0.586
In adaptive thermal comfort theory, it regards the gradient of this regression equation as being inversely proportional to the adaptability of the building occupants under analysis. A very shallow gradient indicates the subjects were able to adapt very effectively to changes in temperature (instead of feeling over- or under-heated and shifting their thermal sensation accordingly), whereas a steep regression line suggests the subjects were not successful in adapting because they quickly felt warm (or cool) as the room temperature shifted away from their neutrality. At more than five and six degrees per thermal sensation unit, the regression equation shows this sample to be remarkably successful at adapting to changes in indoor temperature.
The neutral temperatures (Tn) can be calculated by using Equations (1) to (4) when AMV = 0. The actual neutral temperature in winter is 20.8 °C and 20.1 °C in TSAB and TSEB, while in summer it is 21.1 °C and 22.6 °C, respectively. As can be seen, the neutral temperature of the TSAB group is lower in winter but higher in summer. The result shows differences in thermal sensitivity and neutrality between these two indoor transitional spaces. This finding shows that the thermal requirements of people in indoor transitional spaces must be considered separately according to the function of the space. This is mainly due to the difference in the prevailing thermal environment in both of these two locations and the influence of thermal adaptive methods.
Preferred temperature: The preferred sensation and preferred temperature are the sensation and temperature people actually expected, compared to the neutral sensation and temperature in which people feel comfortable. The comparison of temperatures between different groups could help in exploring differences in their thermal perceptions or similarities. The smaller difference between the neutral and preferred choice of sensation and temperature for a group of people relates to their good adaptation to the thermal environment. Probit analysis is employed for advanced analysis in thermal studies to survey thermal preference sensations and calculate the preferred temperature. This method is used for thermal sensation assessments by Ballantyne, Hill and Spencer [41], which were conducted separately on the preferences of the participants in winter and summer for warmer and cooler conditions.
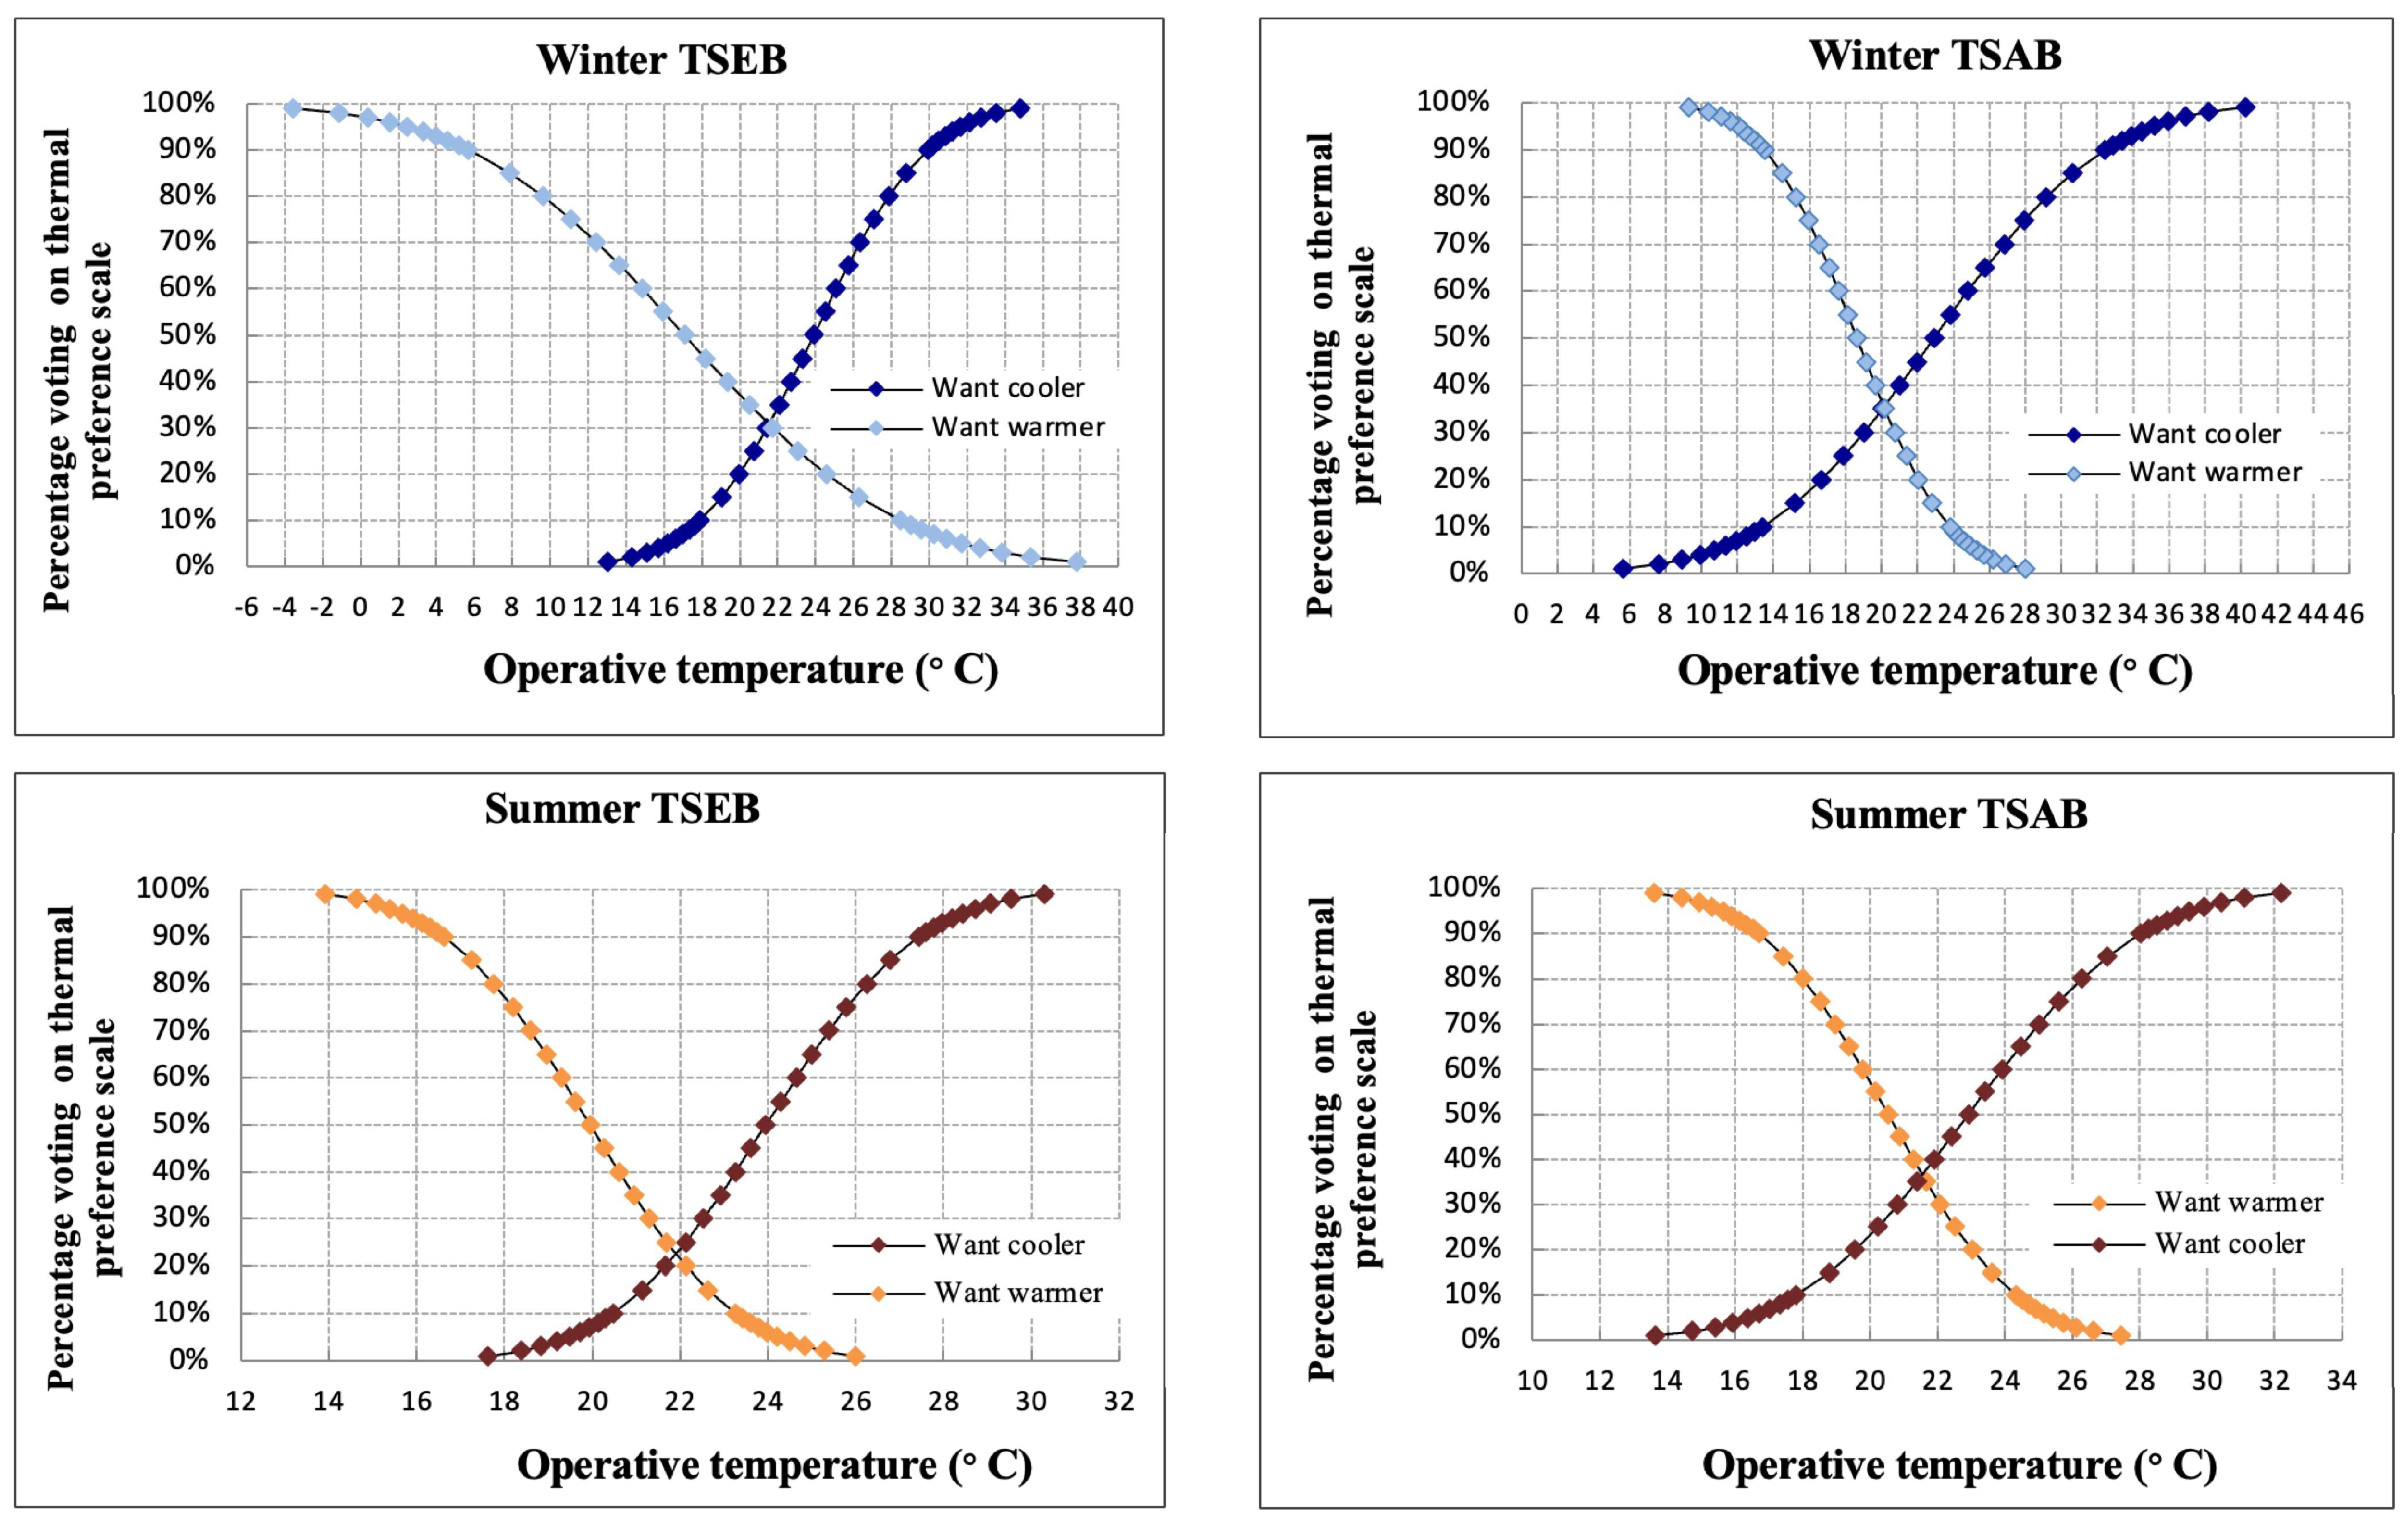
The cumulative frequency distributions for the “wanting warmer” and “wanting cooler” inclinations were plotted against the operative temperature scale of the environment in winter and summer (Figure 6). The point located at the intersection of the two cumulative curves corresponds to the participants’ preference in terms of sensation. To investigate preferred temperatures, participants’ preference votes were binned into half degree intervals of indoor operative temperature. The point of intersection between the “want cooler” and “want warmer” probit models is taken to represent the group’s preferred temperature. According to the regression model, the preferred temperature in winter is 20.2 °C in TSAB and 21.6 °C in TSEB; in summer, the temperature is 21.5 °C and 21.9 °C separately.
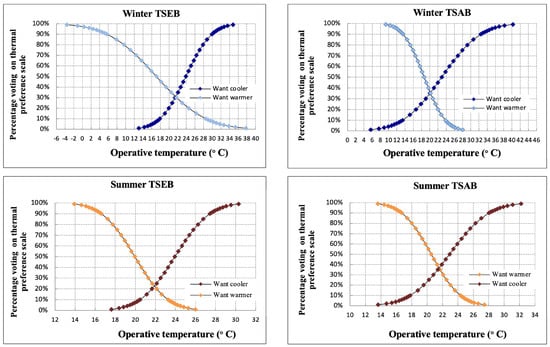
Figure 6.
Probit regression models fitted to thermal preference percentages.
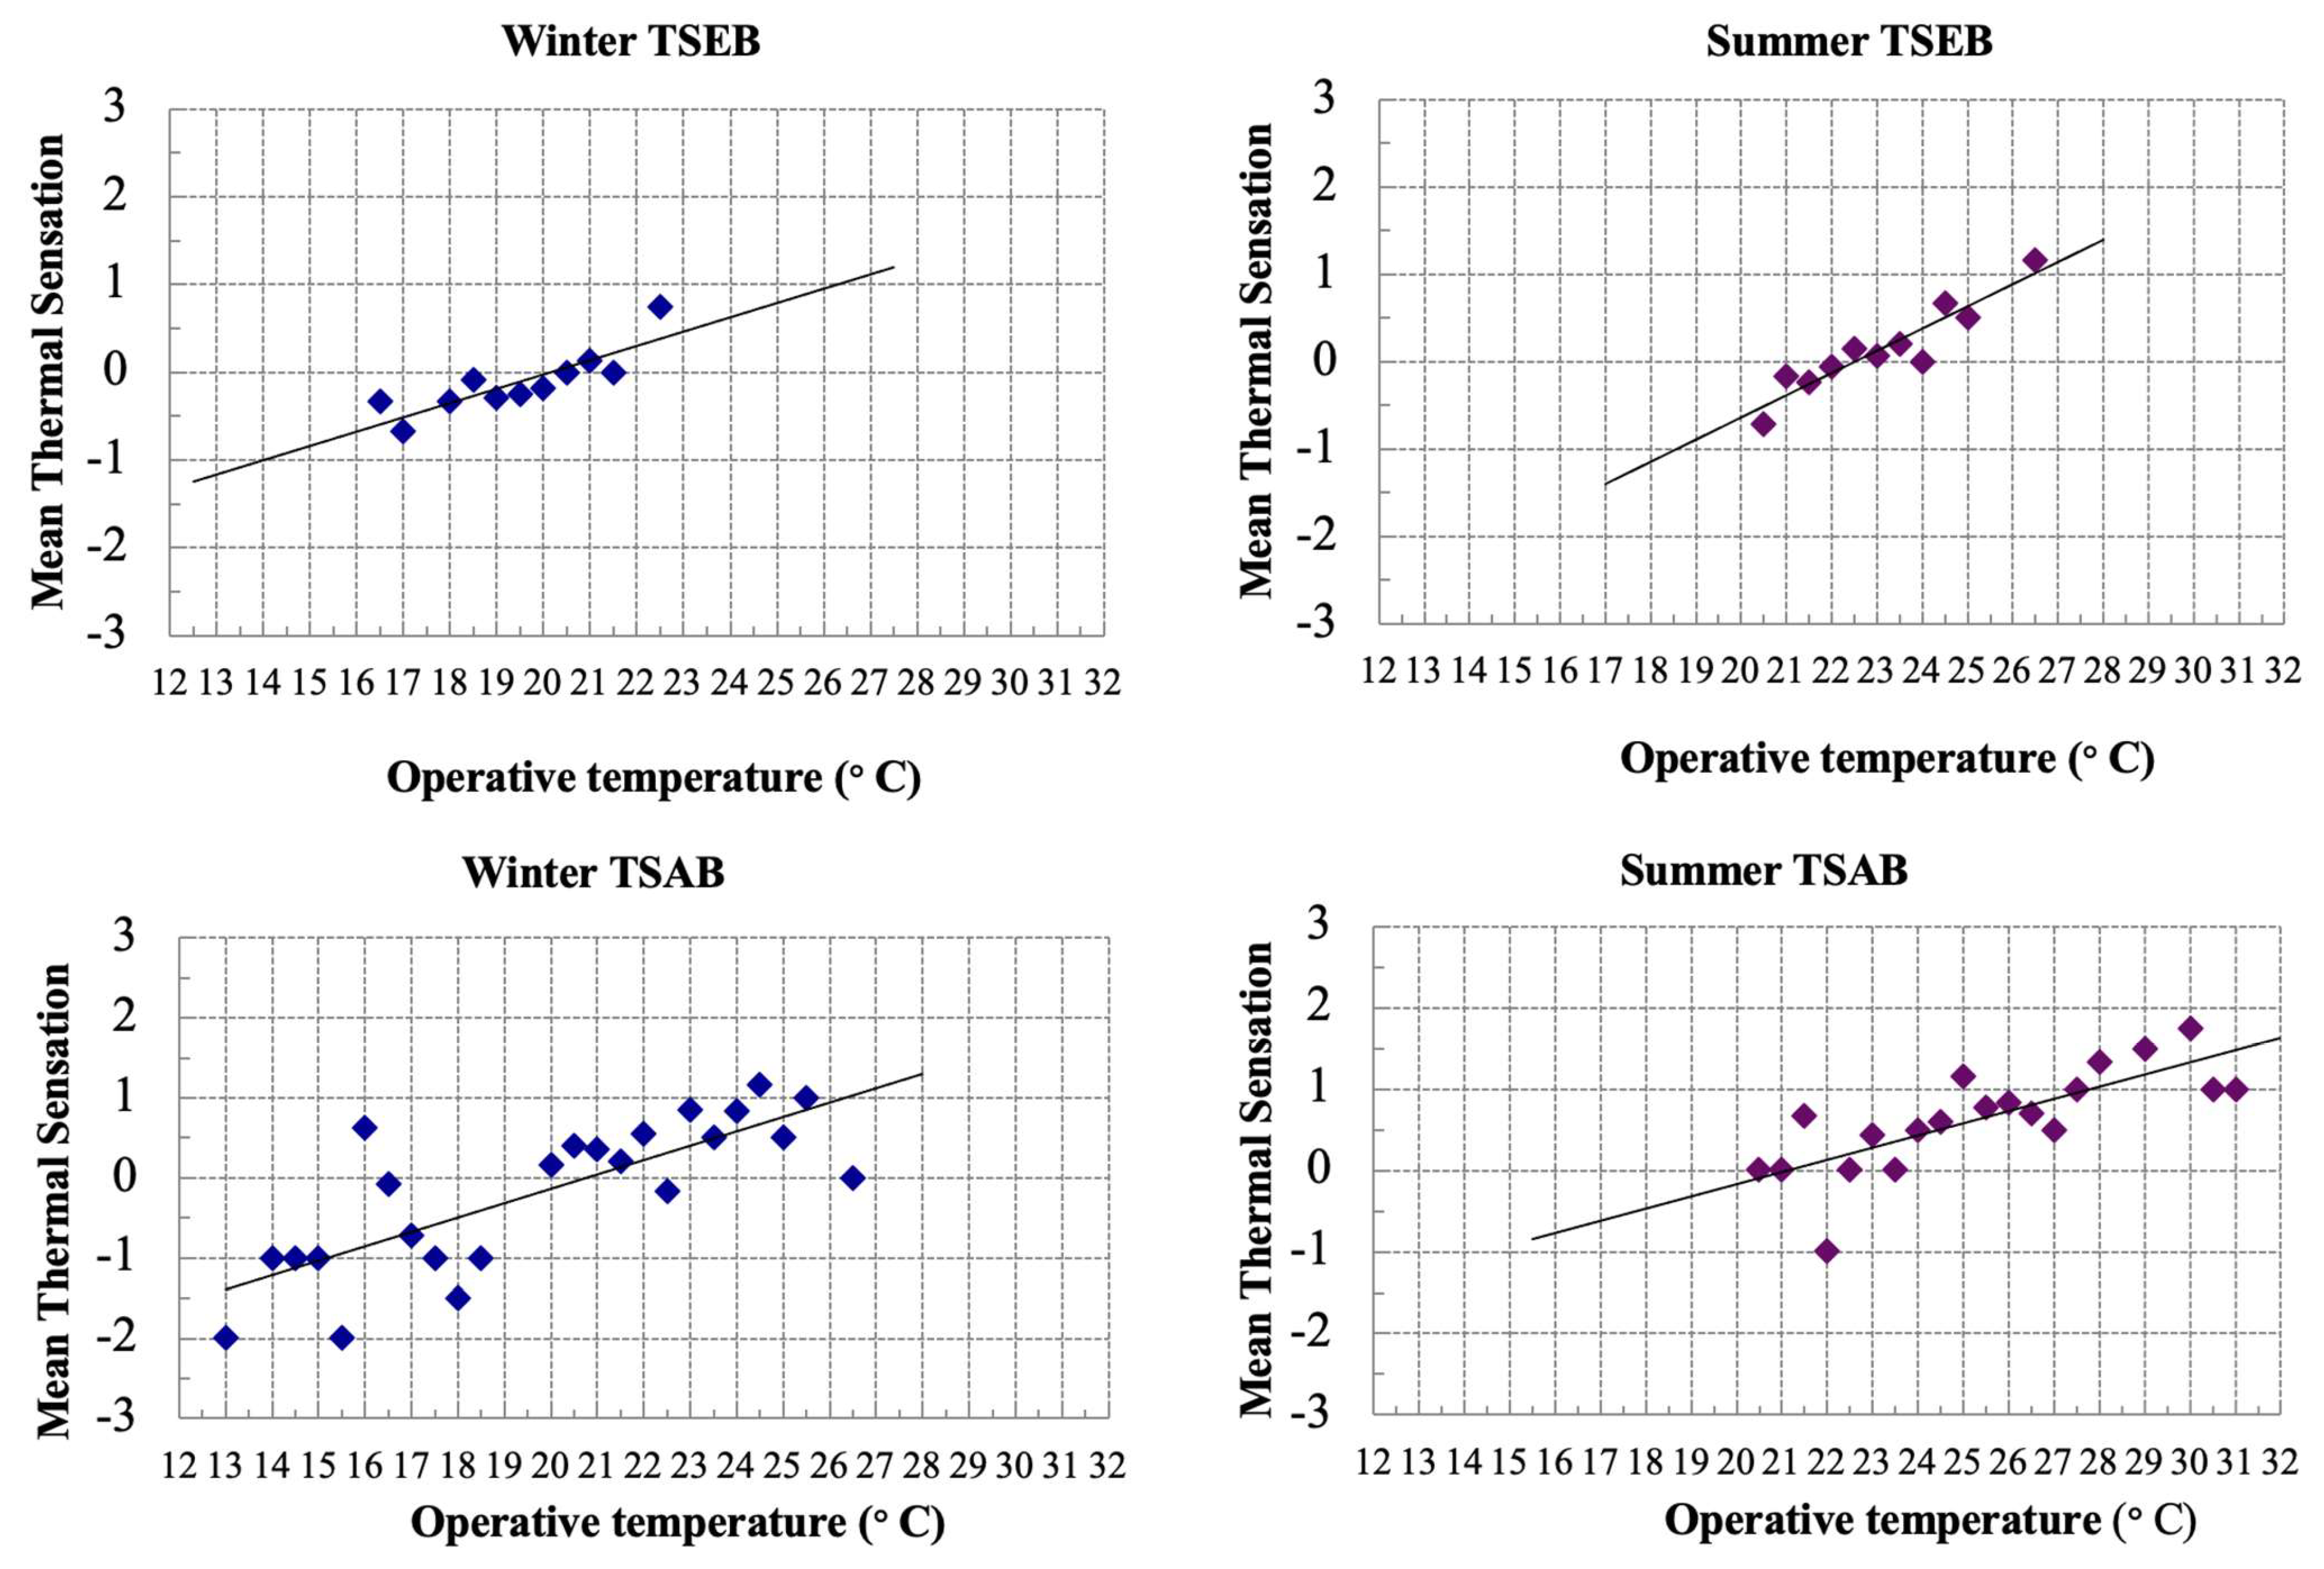
Thermal comfort range: regression equations describing the dependence of sample mean thermal sensation on mean indoor operative temperature are often used to define acceptable temperature limits for a particular sample. In the case of ASHRAE 55-2013, the so-called “comfort zone,” as expressed on a temperature-humidity graph has its boundaries defined as −0.5 PMV on the cool side and +0.5 PMV on the warm side. Different from the fundamental logic adopted in ASHRAE and also ISO to define their comfort zones [25,30,42], some scholars research in the thermal comfort of transitional spaces and expand the comfort zone in these spaces as −1 < PMV < +1 [7], which can be applied to the results obtained in this thermal comfort survey of participants in transitional spaces in the present study. But with key differences, rather than using predicted mean thermal sensations (PMV), this survey has the advantage of actual mean thermal sensations. The mean indoor operative temperatures corresponding to mean thermal sensations of +1 and −1 stretch from 14 °C to 27.0 °C in winter and from 14.5 °C to 27.8 °C in summer (marked region on Figure 7).
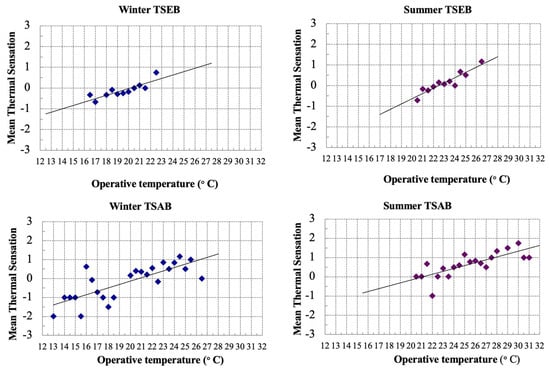
Figure 7.
Mean thermal sensation votes (−3 = cold, through 0 = neutral to +3 = hot) related to indoor operative temperature in summer.
In TSEB, the mean indoor operative temperatures corresponding to group mean thermal sensations of +1 and −1 stretch from 14.0 °C to 26.3 °C in winter and from 18.6 °C to 26.5 °C in summer. In TSAB, the mean indoor operative temperatures corresponding to group mean thermal sensations of +1 and −1 stretch from 15.2 °C to 26.3 °C in winter and from 14.5 °C to 27.8 °C in summer. The widest comfort temperature range in winter is TSEB at 12.3 °C, and in summer it is TSAB at 13.3 °C. The results prove again that in winter TSEB participants and in summer TSAB participants had the highest tolerance for their thermal environment. This result is in line with previous findings about acceptable temperatures in transitional spaces [4,5,9,13,19].
3.3. Thermal Preference and the Use of the Spaces
Table 6 shows the most popular areas the participants chose to stay in and the popular reason for it in these two cases. It indicates that in both of these two indoor transitional spaces, thermal consideration truly is a reason with quiet proportion when people choose a favorite space to stay. But this reason is always not the most important one; people frequently put their use requirements as the most significant reason to choose a space to stay.
Table 6.
Most popular area and popular reasons.
Figure 8 indicates that people in TSEB have a lower thermal preference rate for all of the stay reasons, but in TSAB, this rate is higher. It can be seen that the reason for passing through has the highest thermal non-preference rate, which means people passing through the indoor transitional space care less or less sensitivity about the thermal environment. The stay reason for working or study shows the highest thermal preference rate, which means people stay in the indoor transitional space because working or study cares more and more sensitivity to the thermal environment in the indoor transitional space. People staying in the indoor transitional spaces for thermal reasons (warm or cool) show a high preference rate, as expected.
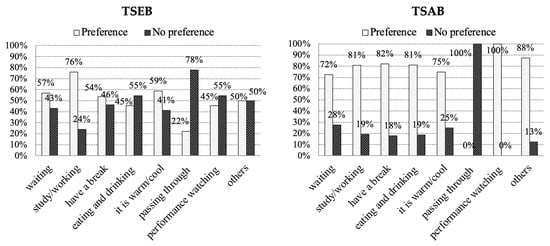
Figure 8.
Thermal preference of participants depends on the stay reason.
The data analysis showed a high thermal comfort acceptable level of 96% and 94% of in winter and summer in TSEB, which is quite higher than in TSAB. Correlation analysis was applied in this study to investigate the relationship between the environmental variables and the actual thermal sensation votes of participants. Operative temperature appears to be the most important predictor of thermal sensation in two indoor transitional spaces, which could have an excessive impact on the use of the indoor transitional spaces in the UK climate and may determine the number of people and activities in them. Strong correlations were identified for the influences of the operative temperature on people’s thermal sensations. Similar trends were identified for the two surveyed buildings, where the gradients were all positive. In other words, the higher the indoor operative temperature, the warmer the thermal sensation the building occupants would have [36,39]. Both the design and management of indoor transitional spaces can influence the operative temperature in them, for instance, moderate the size of the glass facade, change the seat area to avoid direct sun light, and use a moderate heating–cooling system to mitigate the air temperature in indoor transitional spaces [43]. Additionally, the cloth insulation also significantly affects subjects’ evaluation of their thermal sensation.
The investigation results of thermal sensation showed that people in TSAB were more thermally sensitive than people in TSEB in winter, as the slope value corresponds to 5.5 °C per sensation unit in TSAB and 6.1 °C in TSEB. However, in summer, people in TSEB were more thermally sensitive than people in TSAB; the corresponding degrees were 3.6 °C and 3.9 °C, respectively. This also means that people in winter in TSEB and people in summer in TSAB were thermally comfortable at a wider range of operative temperatures. The mean operative temperature in winter TSEB is lower when summer TSAB has a higher mean operative temperature. A possible explanation for why people in winter TSEB and summer TSAB were found to be less thermally sensitive might be due to the difference in clothing insulation and the way people use indoor transitional spaces (stay area, visit frequency, visit time, and stay time). A further analysis was carried out to quantify the acceptable temperatures in terms of neutral temperature, preferred temperature, and comfort temperature range. It shows the differences in acceptable temperature between the two different groups of participants in indoor transitional spaces. Excluding in summer TSAB, all other samples’ results reveal that neutral temperatures lie above or are the same with the mean operative temperature occupants experienced. In summer TSAB, the mean operative temperature is as high as 4.5 °C than the neutral temperature. The comparison revealed that the summer group of participants in TSAB was more comforted by the cooler environment than the other three groups of participants. Additionally, the difference between the preferred temperature and the neutral temperature of the two groups demonstrates the occurrence of thermal adaptation. In addition, the comparison of a neutral temperature with a preferred temperature could explain which group is better adapted to its thermal environment. The differences between neutral temperature and preferred temperature in winter in academic and TSEB are 0.6 and 1.5 °C separately; in summer, they are 0.3 and 0.7 °C separately. The results prove that TSAB’s participants have a better adaptation ability (smaller difference between neutral temperature and preferred temperature) to their thermal environment. The profile of the preferred temperature follows that of the neutral temperatures, and the two almost do not coincide. In TSEB, it demonstrates the preference for cooler temperatures in summer and warmer temperatures in winter. However, even in winter TSAB, participants still prefer a cooler environment, which explains the overheated thermal environment in it. This phenomenon is deduced due to the higher operative temperature in the sitting area in TSAB; even in winter, some participants complain it is too warm in this area. The high temperature of this area is gained through the big facade of glazing, and the north–south layout also results in longer sunshine time.
4. Conclusions
In this research, the field studies carried out in the indoor transitional spaces in different types of buildings show that people use the transitional spaces in different ways. There were 494 customers who attended the interview survey, and two surveyed buildings produced an evaluation of the thermal environmental performance and people’s adaptability. The detailed calculation of thermal comfort requirement parameters includes neutral temperature, preference temperature, and comfort temperature range. The comfort temperature range is quite wide as in TSEB from 14.0 °C to 26.3 °C in winter and 18.6 °C to 26.5 °C in summer; and from 15.2 °C to 26.3 °C in winter and 14.5 °C to 27.8 °C in summer in TSAB. The results indicate that participants in TSEB’s indoor transitional space have a higher thermal tolerance than in TSAB due to the different way of using the space, which also means the possibility of energy savings and specific design depends on the different functions of indoor transitional spaces.
The ordinal regression analysis was carried out to examine how the environmental variable related to the actual thermal sensation votes of participants. Operative temperature appeared to be the most important predictor of thermal sensation in two cases. In both entertainment and academic indoor transitional spaces, people had a wider thermal comfort temperature range than the CIBSE guide and fully occupied spaces such as offices in a moderate climate. It indicates participants in indoor transitional spaces had a higher tolerance for their thermal environment, which evidently suggests the possibility of useful energy savings through a modest (and realistic) relaxation of comfort standards regulation in transitional spaces. Additionally, this study has found that the way people use indoor transitional spaces has an important influence on participants’ thermal requirements. The design of indoor transitional spaces has a significant influence on the thermal environment and the way people use indoor transitional spaces.
Environmental variables could have a great impact on the use of indoor transitional spaces in the UK’s moderate climate. The thermal environment in the indoor transitional space can be determined by the design and setting of the cooling and heating system inside it. Design-related environmental improvements are necessary, but they may not be sufficient for a successful design of indoor transitional spaces. On the other hand, physical features appear to play an important role in attracting people to indoor transitional space, but thermal comfort plays a significant influence on how people use the indoor transitional spaces. Access to good indoor transitional spaces is a luxury or a need for people, which is determined by the function of the building and each area of indoor transitional spaces. Indoor transitional spaces that offer good design and allow social activities are likely to influence their users to stay longer.
The surveyed buildings served different purposes, and the people’s activity inside the buildings was different. People visited TSEB for public events such as building tours and watching the show; this led to a relatively higher respondent’s activity level when compared to TSAB because a greater number of people were walking or standing before taking the questionnaire surveys. On the other hand, in TSAB, more people used the transitional spaces for resting, dining, and discussion. This may explain why TSEB had a lower neutral temperature and a wider acceptable temperature range when compared to TSAB. From another perspective, different architectural designs of transitional spaces could influence thermal comfort [43,44,45]. In this study, it was explained that this may be due to the different people’s usage and activity levels within the spaces as a result of architectural designs.
This statement was supported by the investigations of thermal preference and stay reasons. It indicated that thermal consideration truly is a reason with quiet proportion when people choose a favorite space to stay. But this reason is always not the most important one; people frequently put their use requirements as the most significant reason to choose a space to stay. However, the results of the analysis of thermal preference depending on the stay reason indicate that the participants’ thermal perception has a close relationship with the participants’ stay reasons in the indoor transitional spaces. Currently, transitional spaces are quite common in many types of buildings. In this study, clear evidence has been provided to justify the different thermal comfort requirements in academic buildings and entertainment buildings. From this conclusion, it would be reasonable to say that data need to be collected from other types of buildings with transitional spaces to control their thermal environment with higher energy efficiency.
This study focuses on human thermal comfort and the use of indoor transitional spaces in the UK. The studied sites are only located in Cardiff, UK, and the research focuses only on transitional spaces in academic and entertainment buildings. There are benefits and drawbacks to the field study methodology for research. The inability to directly regulate environmental factors and the challenge of accurately determining human physiological parameters are sources of limitations. However, field research is crucial to understanding thermal perception in an actual setting with regular operations. Moreover, only guests were considered in this study; staff were excluded from analysis to ensure that the sample presented participants who have self-adaptive freedom (staff were limited to moving their location and opening windows to modify thermal comfort conditions). Based on this research, further work needs to be conducted to cover more geographical areas within the UK climate since this study covers only Cardiff. Such an expansion may generalize the findings of this study or explain any particularities associated with the sites of the current study. Moreover, this investigation of the thermal comfort in indoor transitional space and the way people use the space should be further investigated. It has emphasized the important influence of improving the thermal environment in indoor transitional space and the possibility of energy saving in indoor transitional space.
Author Contributions
Conceptualization, G.H., C.T. and S.W.; Methodology, G.H. and S.W.; Software, G.H.; Validation, G.H.; Formal analysis, G.H.; Investigation, G.H.; Resources, G.H.; Data curation, G.H.; Writing—original draft, G.H.; Writing—review & editing, G.H., C.T. and S.W.; Visualization, G.H.; Supervision, C.T.; Funding acquisition, G.H. All authors have read and agreed to the published version of the manuscript.
Funding
This research was funded by Hebei University of Technology.
Data Availability Statement
Data is contained within the article.
Acknowledgments
The authors would like to express their gratitude to staff of the Glamorgan University and Millennium Center of Wales for their support to this study. Not only for providing the basic information about the buildings, but also lending the spaces for carrying out the field study data collections and physical measurements.
Conflicts of Interest
The authors declare no conflict of interest.
Abbreviations
| ASHRAE | American Society of Heating, Refrigerating and Air-Conditioning Engineers |
| HVAC | Heating, Ventilation and Air-conditioning |
| AMV | Actual Mean Vote |
| ISO | International Organization for Standardization |
| PMV | Predicted Mean Vote |
| PPD | Predicted Percentage of Dissatisfied |
| CIBSE | Chartered Institution of Building Services Engineers |
| UK | United Kingdom |
| TSAB | Transitional Space in the Academic Building |
| TSEB | Transitional Space in the Entertainment Building |
References
- Pitts, A.; Saleh, J.B. Transition spaces and thermal comfort—Opportunities for optimising energy use. In Proceedings of the PLEA 2006—23rd International Conference on Passive and Low Energy Architecture, Geneva, Switzerland, 6–8 September 2006. [Google Scholar]
- Adrian, P. Thermal Comfort in Transition Spaces. Buildings 2013, 3, 122–142. [Google Scholar] [CrossRef]
- Ilham, S. Thermal Comfort in Transitional Spaces in Desert Communities: The Study of Cases in Tucson; The University of Arizona: Tucson, AZ, USA, 2006. [Google Scholar]
- Chun, C.; Kwok, A.; Tamura, A. Thermal comfort in transitional spaces—Basic concepts: Literature review and trial measurement. Build. Environ. 2004, 39, 1187–1192. [Google Scholar] [CrossRef]
- Pitts, A.; Saleh, J.B.; Sharples, S. Building Transition Spaces, Comfort and Energy Use. In Proceedings of the PLEA 2008—25th Conference on Passive and Low Energy Architecture, Dublin, Ireland, 22–24 October 2008. [Google Scholar]
- Pitts, A.; Saleh, J.B. Potential for energy saving in building transition spaces. Energy Build. 2007, 39, 815–822. [Google Scholar] [CrossRef]
- Pitts, A.; Douvlou-Beggiora, E. Post-occupancy analysis of comfort in glazed atrium spaces. In Proceedings of the Closing the Loop: Ways forward for Post-Occupancy Evaluation, Cumberland Lodge, Windsor, UK, 29 April–2 May 2004. [Google Scholar]
- Jitkhajornwanich, K.; Pitts, A.C.; Malama, A.; Sharples, S. Thermal comfort in transitional spaces in the cool season of Bangkok. ASHRAE Trans. 1998, 104, 1181–1193. [Google Scholar]
- Jitkhajornwanich, K.; Pitts, A. Interpretation of thermal responses of four subject groups in transitional spaces of buildings in Bangkok. Build. Environ. 2002, 37, 1193–1204. [Google Scholar] [CrossRef]
- Wu, Y.-C.; Mahdavi, A. Assessment of thermal comfort under transitional conditions. Build. Environ. 2014, 76, 30–36. [Google Scholar] [CrossRef]
- Kwong, Q.J.; Tang, S.H.; Adam, N.M. Thermal comfort evaluation of the enclosed transitional spaces in tropical building: Subjective response and computational fluid dynamics simulation. J. Appl. Sci. 2009, 9, 3480–3490. [Google Scholar] [CrossRef]
- Jie Kwong, Q.; Adam, N.M. Perception of thermal comfort in the enclosed transitional spaces in tropical building. Indoor Built Environ. 2011, 2011, 524–533. [Google Scholar] [CrossRef]
- Hui, S.C.M.; Jiang, J. Assessment of thermal comfort in transitional spaces. In Proceedings of the Joint Symposium 2014: Change in Building Services for Future, Hong Kong, China, 25 November 2014. [Google Scholar]
- Hwang, R.L.; Yang, K.H.; Chen, C.P.; Wang, S.T. Subjective responses and comfort reception in transitional spaces for guests versus staff. Build. Environ. 2008, 43, 2013–2021. [Google Scholar] [CrossRef]
- Kotopouleas, A.; Nikolopoulou, M. Understanding thermal comfort conditions in airport terminal buildings. In Proceedings of the 8th Windsor Conference: Counting the Cost of Comfort in a Changing World Cumberland Lodge, Windsor, UK, 10–13 April 2014; Network for Comfort and Energy Use in Buildings: London, UK, 2014. Available online: http://nceub.org.uk (accessed on 25 October 2014).
- Avantaggiato, M.; Belleri, A.; Oberegger, U.F.; Pasut, W. Unlocking thermal comfort in transitional spaces: A field study in three Italian shopping centres. Build. Environ. 2021, 188, 107428. [Google Scholar] [CrossRef]
- Monterio, L.M.; Alucci, M.P. Transitional spaces in São Paulo, Brazil: Mathematical modeling and empirical calubration for thermal comfort assessment. In Proceedings of the Building Performance Simulation Association Conference Exhibition, Beijing, China, 3–6 September 2007. [Google Scholar]
- Rupp, R.F.; Vásquez, N.G.; Lamberts, R. A Review of Human Thermal Comfort in the Built Environment. Energy Build. 2015, 105, 178–205. [Google Scholar] [CrossRef]
- Kotopouleas, A.; Nikolopoulou, M. Thermal comfort conditions in airport terminals: Indoor or transition spaces? Build. Environ. 2016, 99, 184–199. [Google Scholar] [CrossRef]
- Hou, G. An Investigation of Thermal Comfort and the Use of Indoor Transitional Spaces. Ph.D. Thesis, Cardiff University, Cardiff, Wales, 2016. [Google Scholar]
- Li, Y.; Geng, S.; Chen, F.; Li, C.; Zhang, X.; Dong, X. Evaluation of thermal sensation among customers: Results from field investigations in underground malls during summer in Nanjing, China. Build. Environ. 2018, 136, 28–37. [Google Scholar] [CrossRef]
- Du, X.; Zhang, Y.; Lv, Z. Investigations and analysis of indoor environment quality of green and conventional shopping mall buildings based on customers’ perception. Build. Environ. 2020, 177, 106851. [Google Scholar] [CrossRef]
- Lu, P.; Li, J. Acceptable Temperature Steps for Occupants Moving between Air Conditioned Main Space and Naturally Ventilated Transitional Space of Building. Build. Environ. 2020, 182, 107150. [Google Scholar] [CrossRef]
- ISO 7726; Ergonomics of the Thermal Environment. ISO: Geneva, Switzerland, 1998.
- ASHRAE Standard 55-2010; Thermal Environmental Conditions for Human Occupancy. ASHRAE: Atlanta, GA, USA, 2010; ISSN 1041-2336.
- Pallant, J. SPSS Survival Manual: A Step by Step Guide to Data Analysis Using the SPSS Program, 4th ed.; McGraw Hill: New York, NY, USA, 2010. [Google Scholar]
- Fanger, P.O. Thermal Comfort: Analysis and Applications in Environmental Engineering; Danish Technical Press: Copenhagen, Denmark, 1970. [Google Scholar]
- Health and Safety Statistics. 2007. Available online: https://www.hse.gov.uk/statistics/ (accessed on 21 June 2007).
- ANSI/ASHRAE Standard 55-2013; Thermal Environmental Conditions for Human Occupancy, Atlaa. ASHRAE: Atlanta, GA, USA, 2013.
- ANSI/ASHRAE Standard 55-2004; Thermal Environmental Conditions for Human Occupancy. American Society of Heating: Atlanta, GA, USA, 2004.
- Humphreys, M. Field Studies of Thermal Comfort Compared and Applied. Build. Serv. Eng. 1976, 44, 5–27. [Google Scholar] [CrossRef]
- Brager, G.S.; de Dear, R.J. Thermal adaptation in the built environment: A literature review. Energy Build. 1998, 27, 83–96. [Google Scholar] [CrossRef]
- Lin, Z.; Deng, S. A study on the thermal comfort in sleeping environments in subtropics—Developing a thermal comfort model for sleeping environments. Build. Environ. 2008, 43, 70–80. [Google Scholar] [CrossRef]
- Palme, M.; Gaona, G.; Lobato-Cordero, A.; Beltrán, R.; Gallardo, A. Evaluating thermal comfort in a naturally conditioned office in a temperate climate zone. Buildings 2016, 6, 27. [Google Scholar] [CrossRef]
- Luo, M.; Ke, Z.; Ji, W.; Wang, Z.; Cao, B.; Zhou, X.; Zhu, Y. The time-scale of thermal comfort adaptation in heated and unheated buildings. Build. Environ. 2019, 151, 175–186. [Google Scholar] [CrossRef]
- Khalid, W.; Zaki, S.A.; Rijal, H.B.; Yakub, F. Investigation of comfort temperature and thermal adaptation for patients and visitors in Malaysian hospitals. Energy Build. 2019, 183, 484–499. [Google Scholar] [CrossRef]
- Wu, Z.; Li, N.; Wargocki, P.; Peng, J.; Li, J.; Cui, H. Adaptive Thermal Comfort in Naturally Ventilated Dormitory Buildings in Changsha. Energy Build. 2019, 186, 56–70. [Google Scholar] [CrossRef]
- Nicol, F.; Humphreys, M.; Roaf, S. Adaptive Thermal Comfort: Principles and Practice; Taylor & Francis Group: London, UK, 2012. [Google Scholar] [CrossRef]
- Zaki, A.; Damiati, S.A.; Rijal, H.B.; Hagishima, A.; Razak, A.A. Adaptive thermal comfort in university classrooms in Malaysia and Japan. Build. Environ. 2017, 122, 294–306. [Google Scholar] [CrossRef]
- De Dear, R.J.; Brager, G.S. Thermal comfort in naturally ventilated buildings: Revisions to ASHRAE Standard 55. Energy Build. 2002, 34, 549–561. [Google Scholar] [CrossRef]
- Ballantyne, E.R.; Hill, R.K.; Spencer, J.W. Probit analysis of thermal sensation assessments. Int. J. Biometeorol. 1977, 21, 29–43. [Google Scholar] [CrossRef] [PubMed]
- ISO 7730; Moderate Thermal Environments—Determination of the PMV and PPD Indices and Specification of the Conditions for Thermal Comfort. International Organization for Standardization: Geneva, Switzerland, 2005.
- Bodach, S.; Lang, W.; Hamhaber, J. Climate Responsive Building Design Strategies of Vernacular Architecture in Nepal. Energy Build. 2014, 81, 227–242. [Google Scholar] [CrossRef]
- Dili, A.S.; Naseer, M.A.; Varghese, T.Z. Passive Control Methods for a Comfortable Indoor Environment: Comparative Investigation of Traditional and Modern Architecture of Kerala in Summer. Energy Build. 2011, 43, 653–664. [Google Scholar] [CrossRef]
- Chandel, S.S.; Sharma, V.; Marwah, B.M. Review of energy efficient features in vernacular architecture for improving indoor thermal comfort conditions. Renew. Sustain. Energy Rev. 2016, 65, 459–477. [Google Scholar] [CrossRef]


Disclaimer/Publisher’s Note: The statements, opinions and data contained in all publications are solely those of the individual author(s) and contributor(s) and not of MDPI and/or the editor(s). MDPI and/or the editor(s) disclaim responsibility for any injury to people or property resulting from any ideas, methods, instructions or products referred to in the content. |
© 2024 by the authors. Licensee MDPI, Basel, Switzerland. This article is an open access article distributed under the terms and conditions of the Creative Commons Attribution (CC BY) license (https://creativecommons.org/licenses/by/4.0/).