
Risk Coupling Analysis of Metro Deep Foundation Pit Construction Based on Complex Networks

Abstract
:1. Introduction
2. Materials and Methods
2.1. Identification of Risk Factors
2.2. Theory and Methods
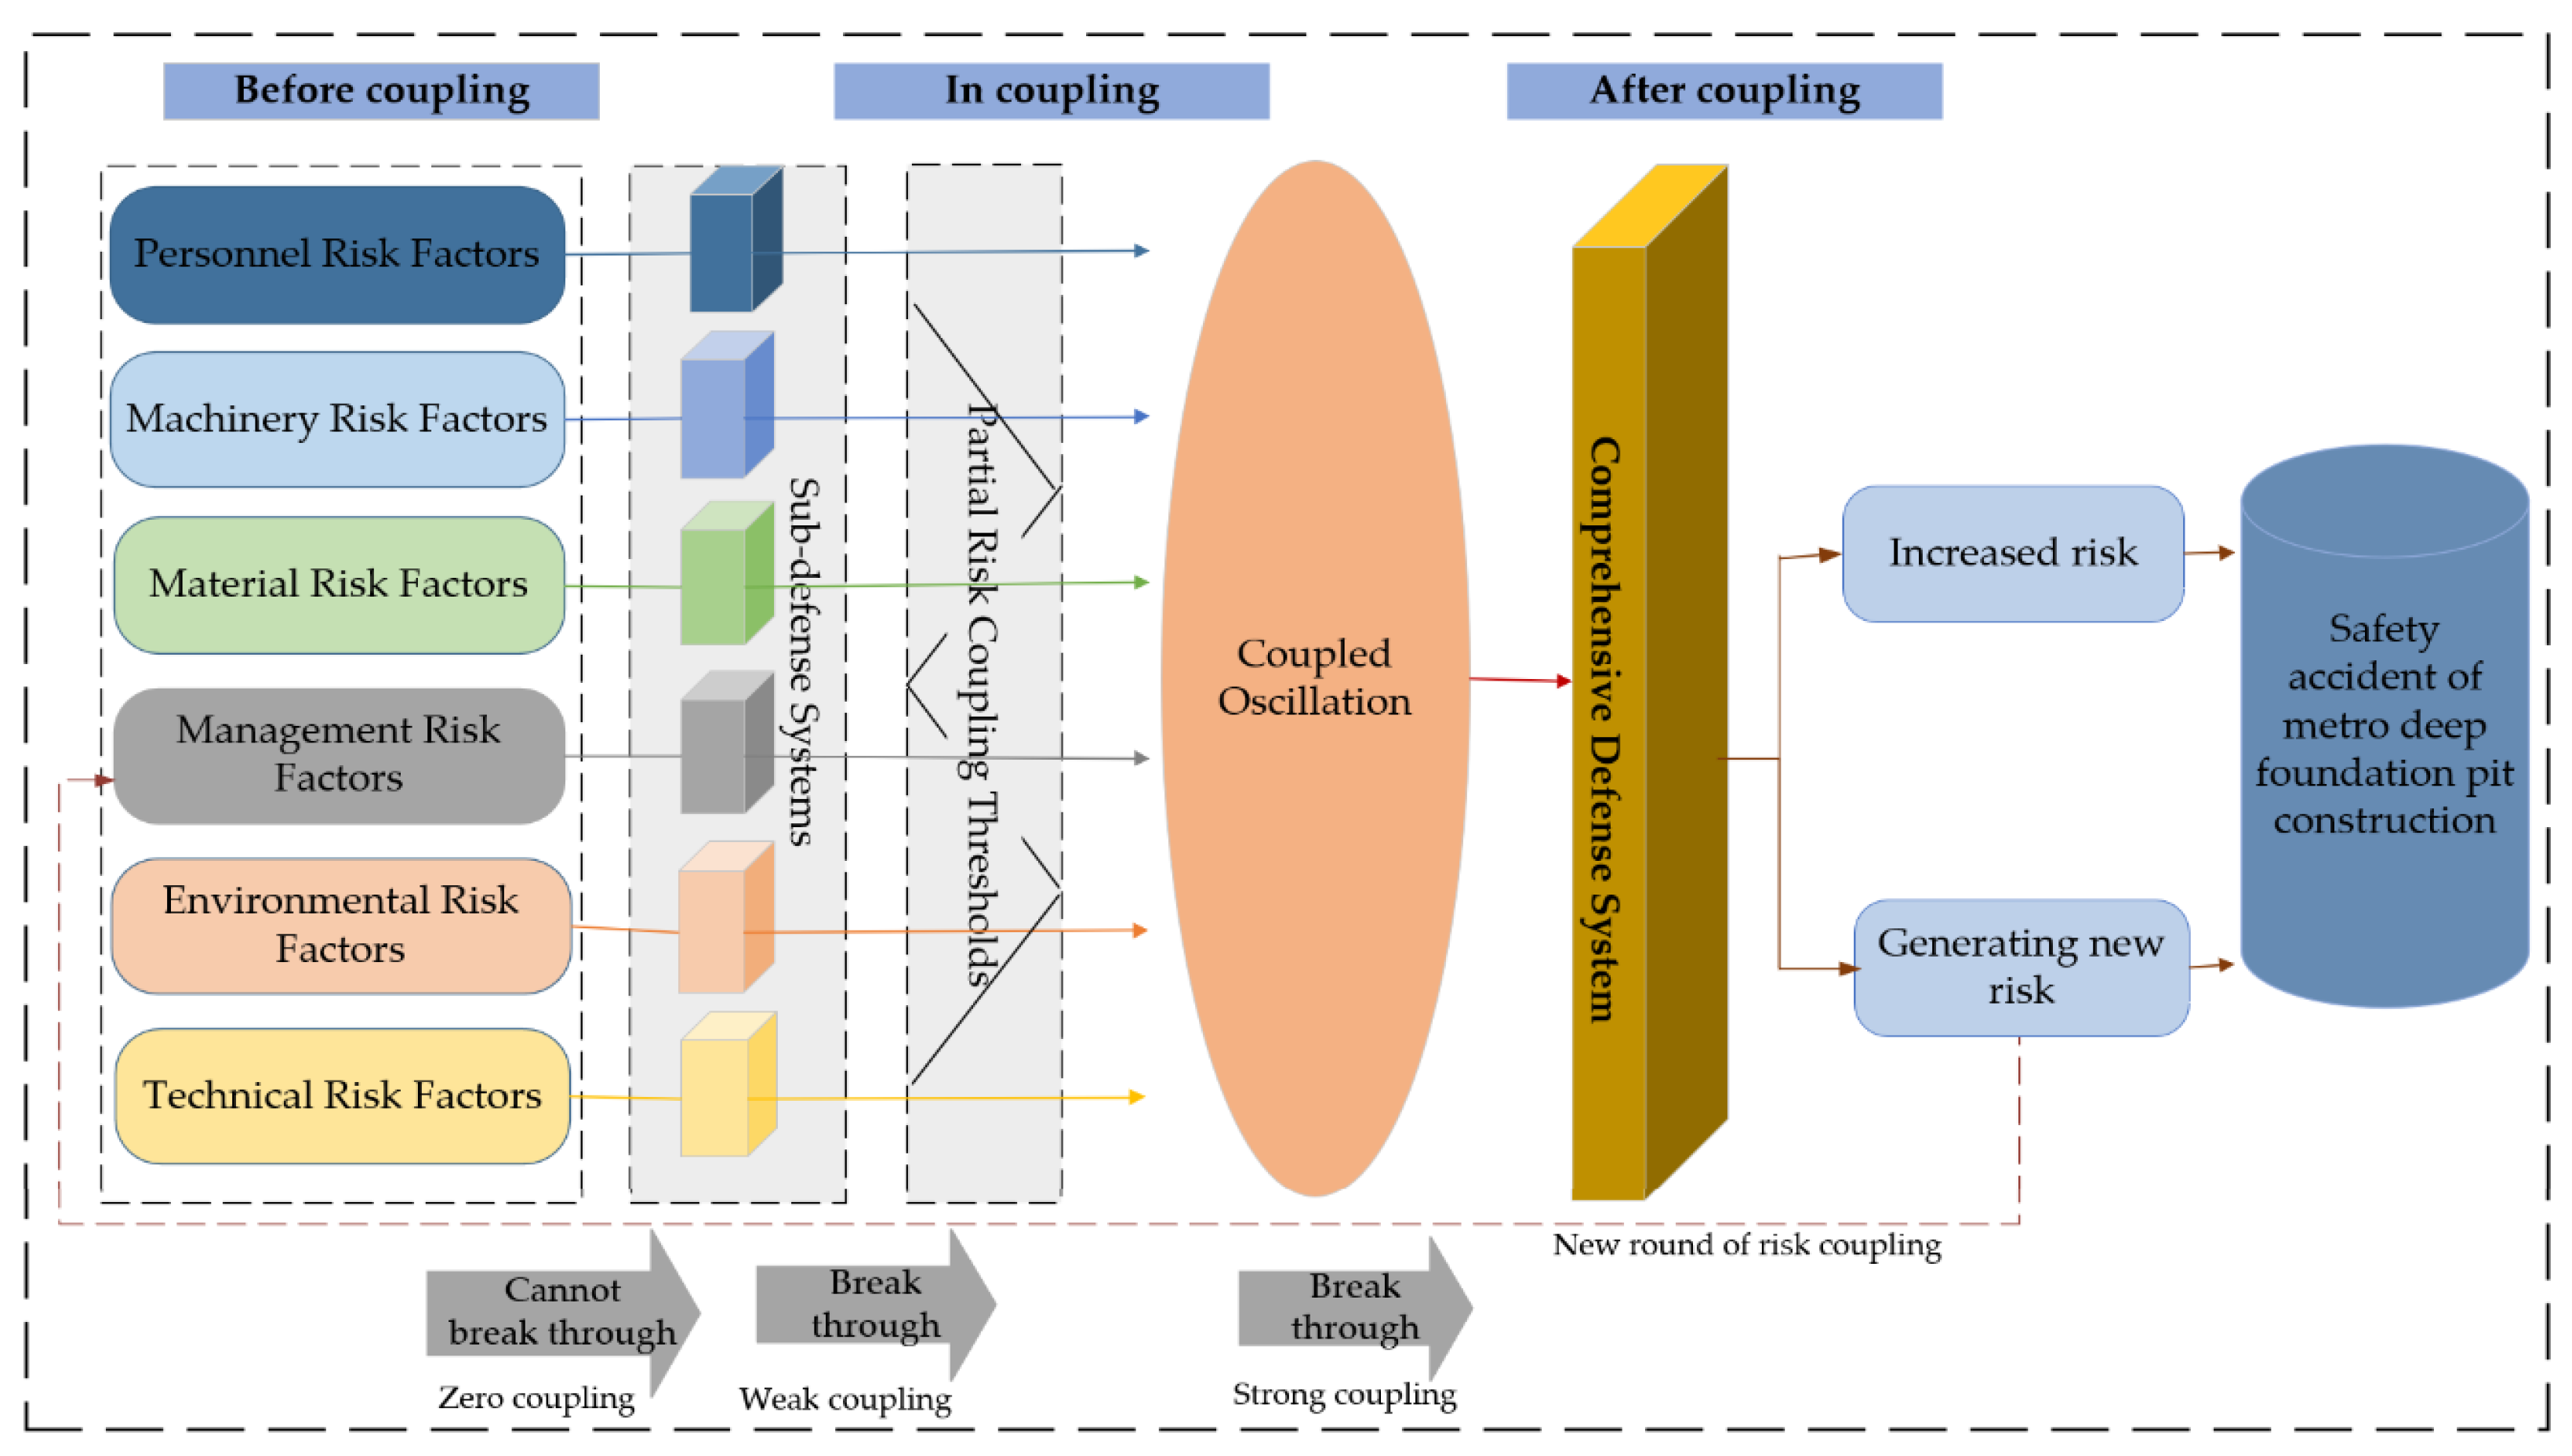
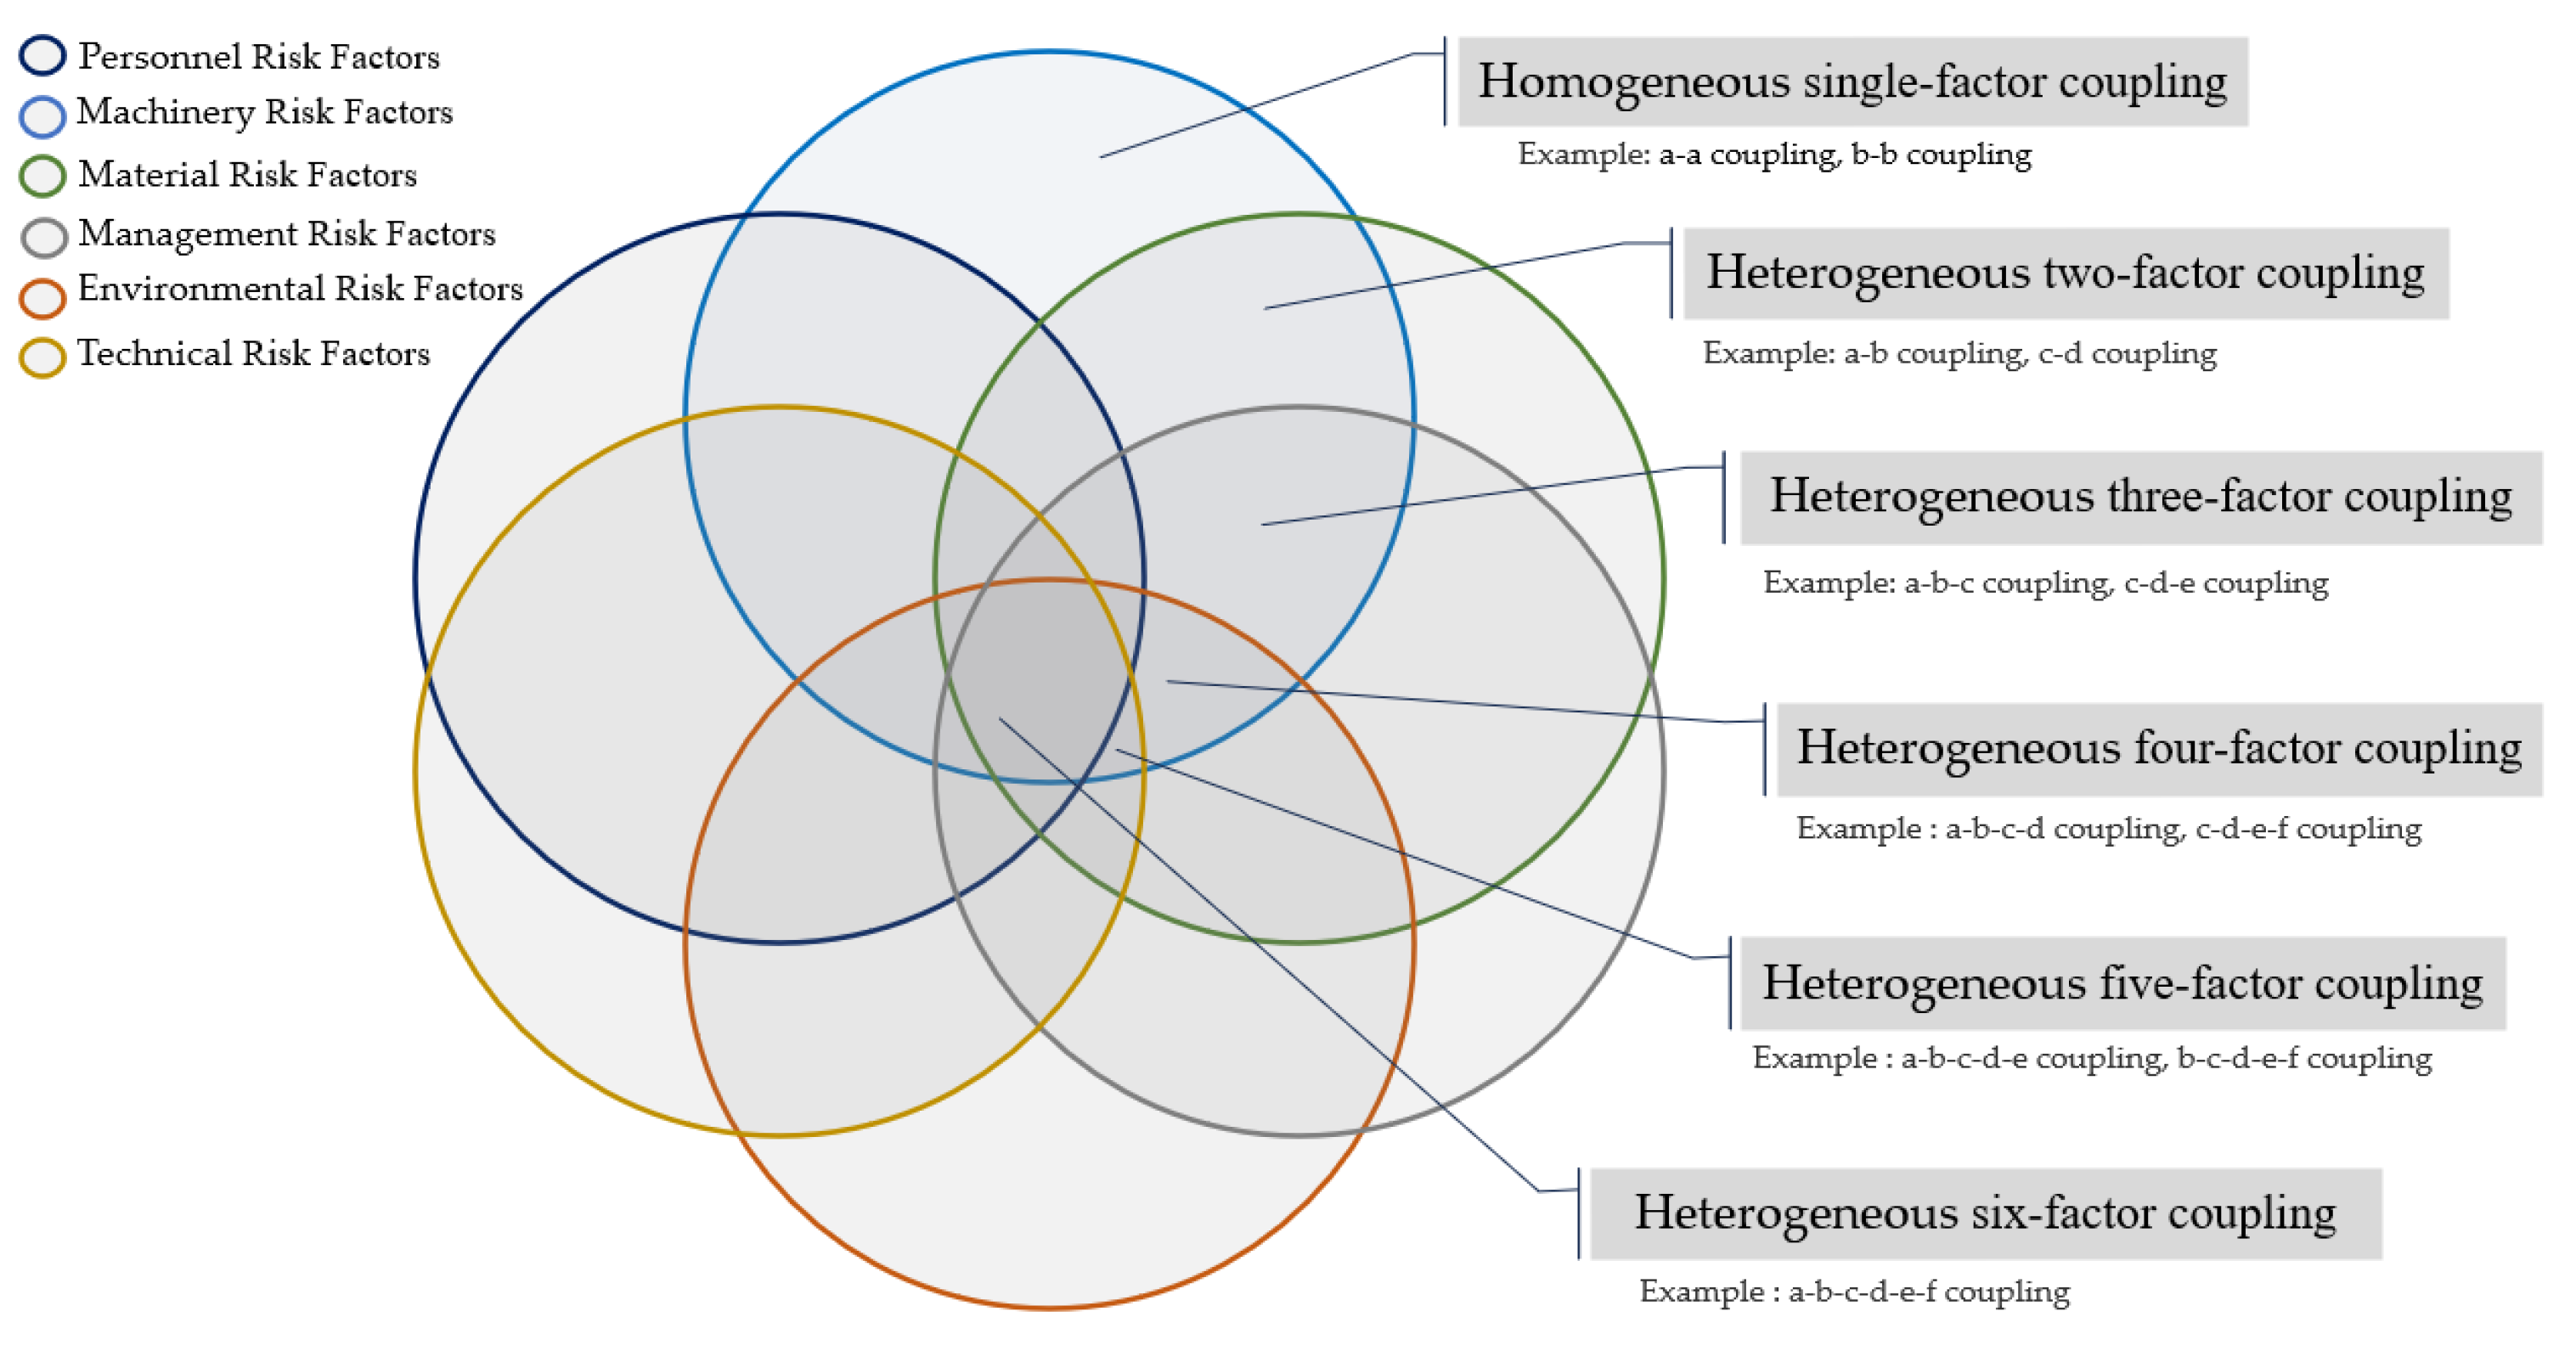
2.2.1. Analysis of Risk Coupling Mechanism
2.2.2. Overview of Complex Network Theory
- (1)
- Degree centrality: It refers to the number of all nodes that are adjacent to a particular node, reflecting the direct influence of that node. For a directed network, the degree is the sum of the in-degree and out-degree.
- (2)
- Degree distribution: It refers to the proportion of nodes in the network with a degree value of k, reflecting the distribution of nodes in the entire network.
- (3)
- Clustering coefficient: It refers to the proportion of other nodes closely connected to a node that also have mutual connections, used to measure the degree of aggregation between nodes in a network.
- (4)
- Betweenness centrality: It refers to the proportion of shortest paths through node a in the network, used to measure the ability of a single node to control relationships between other pairs of nodes.
- (5)
- Eigenvector centrality: It is used to measure the importance of nodes in the network, considering not only the number of connections with other nodes but also the number of connections of the other nodes that the node connects to.
- (6)
- Average path length: It refers to the average distance between all pairs of nodes in the network, reflecting the speed and efficiency of information propagation among nodes in the network.
- (7)
- Network density: It is a parameter that measures the ratio of the actual number of existing edges in a network to the potential number of edges, reflecting the closeness of the network.
- (8)
- Network diameter: It refers to the maximum distance between any two nodes in the network, reflecting the scalability of the network.
2.2.3. Overview of Immunization Theory for Complex Networks
2.3. The Analytical Framework
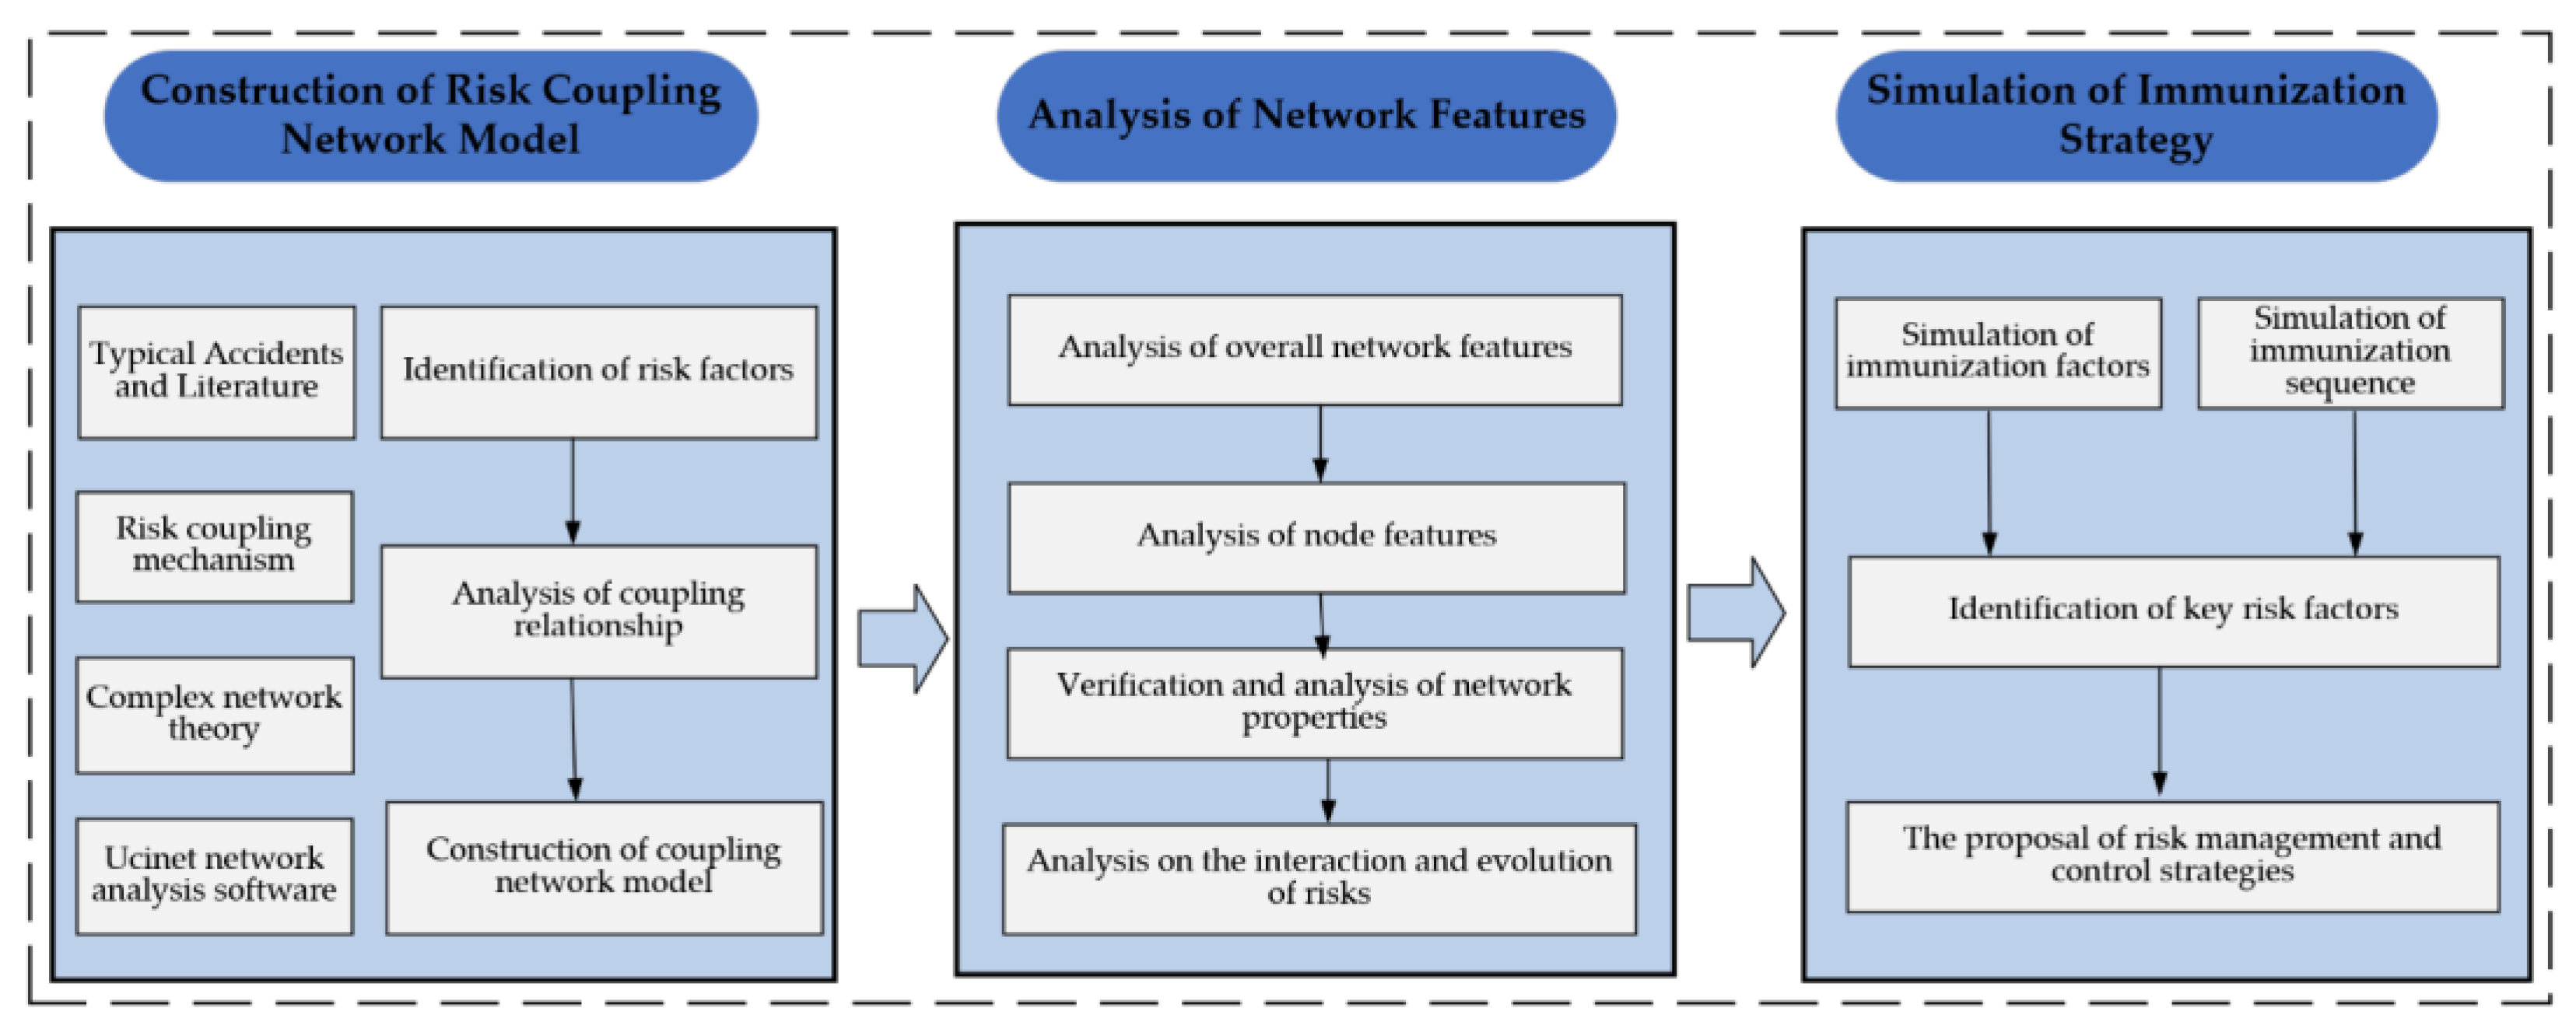
- (1)
- By identifying the risk factors and analyzing the coupling relationship, a risk-coupling network model is established and a visual risk-coupling network topology structure diagram is generated.
- (2)
- The risk-coupling law from the overall and individual perspectives is revealed by quantitatively calculating the topology indicators of the network model.
- (3)
- Based on the immunization theory of complex networks, the effects of different immunization factors and immunization sequences are evaluated through the dynamic changes of network efficiency, and the key risk factors are identified.
3. Network Model of Risk Coupling in Metro Deep Foundation Pit Construction
3.1. Construction of the Risk Coupling Network Model
- (1)
- Based on the list of risk factors of metro deep foundation pit construction, the risk-coupling evolution relationship is sorted out.
- (2)
- Constructing the adjacency matrix of the complex network, which provides a structured depiction of the interactions between the various risk factors.
- (3)
- Establishing a visual risk-coupling network model by using Ucinet6.0 software. In this model, the names of risk factors are replaced with concise risk factor codes, and the presence of an influence relationship between any two risk factors is indicated by a connection edge.
3.2. Analysis of the Topological Features of Risk-Coupling Networks
3.2.1. Analysis of Overall Network Features
- (1)
- Network size and network density
- (2)
- Average path length and network diameter
3.2.2. Analysis of Node Features
- (1)
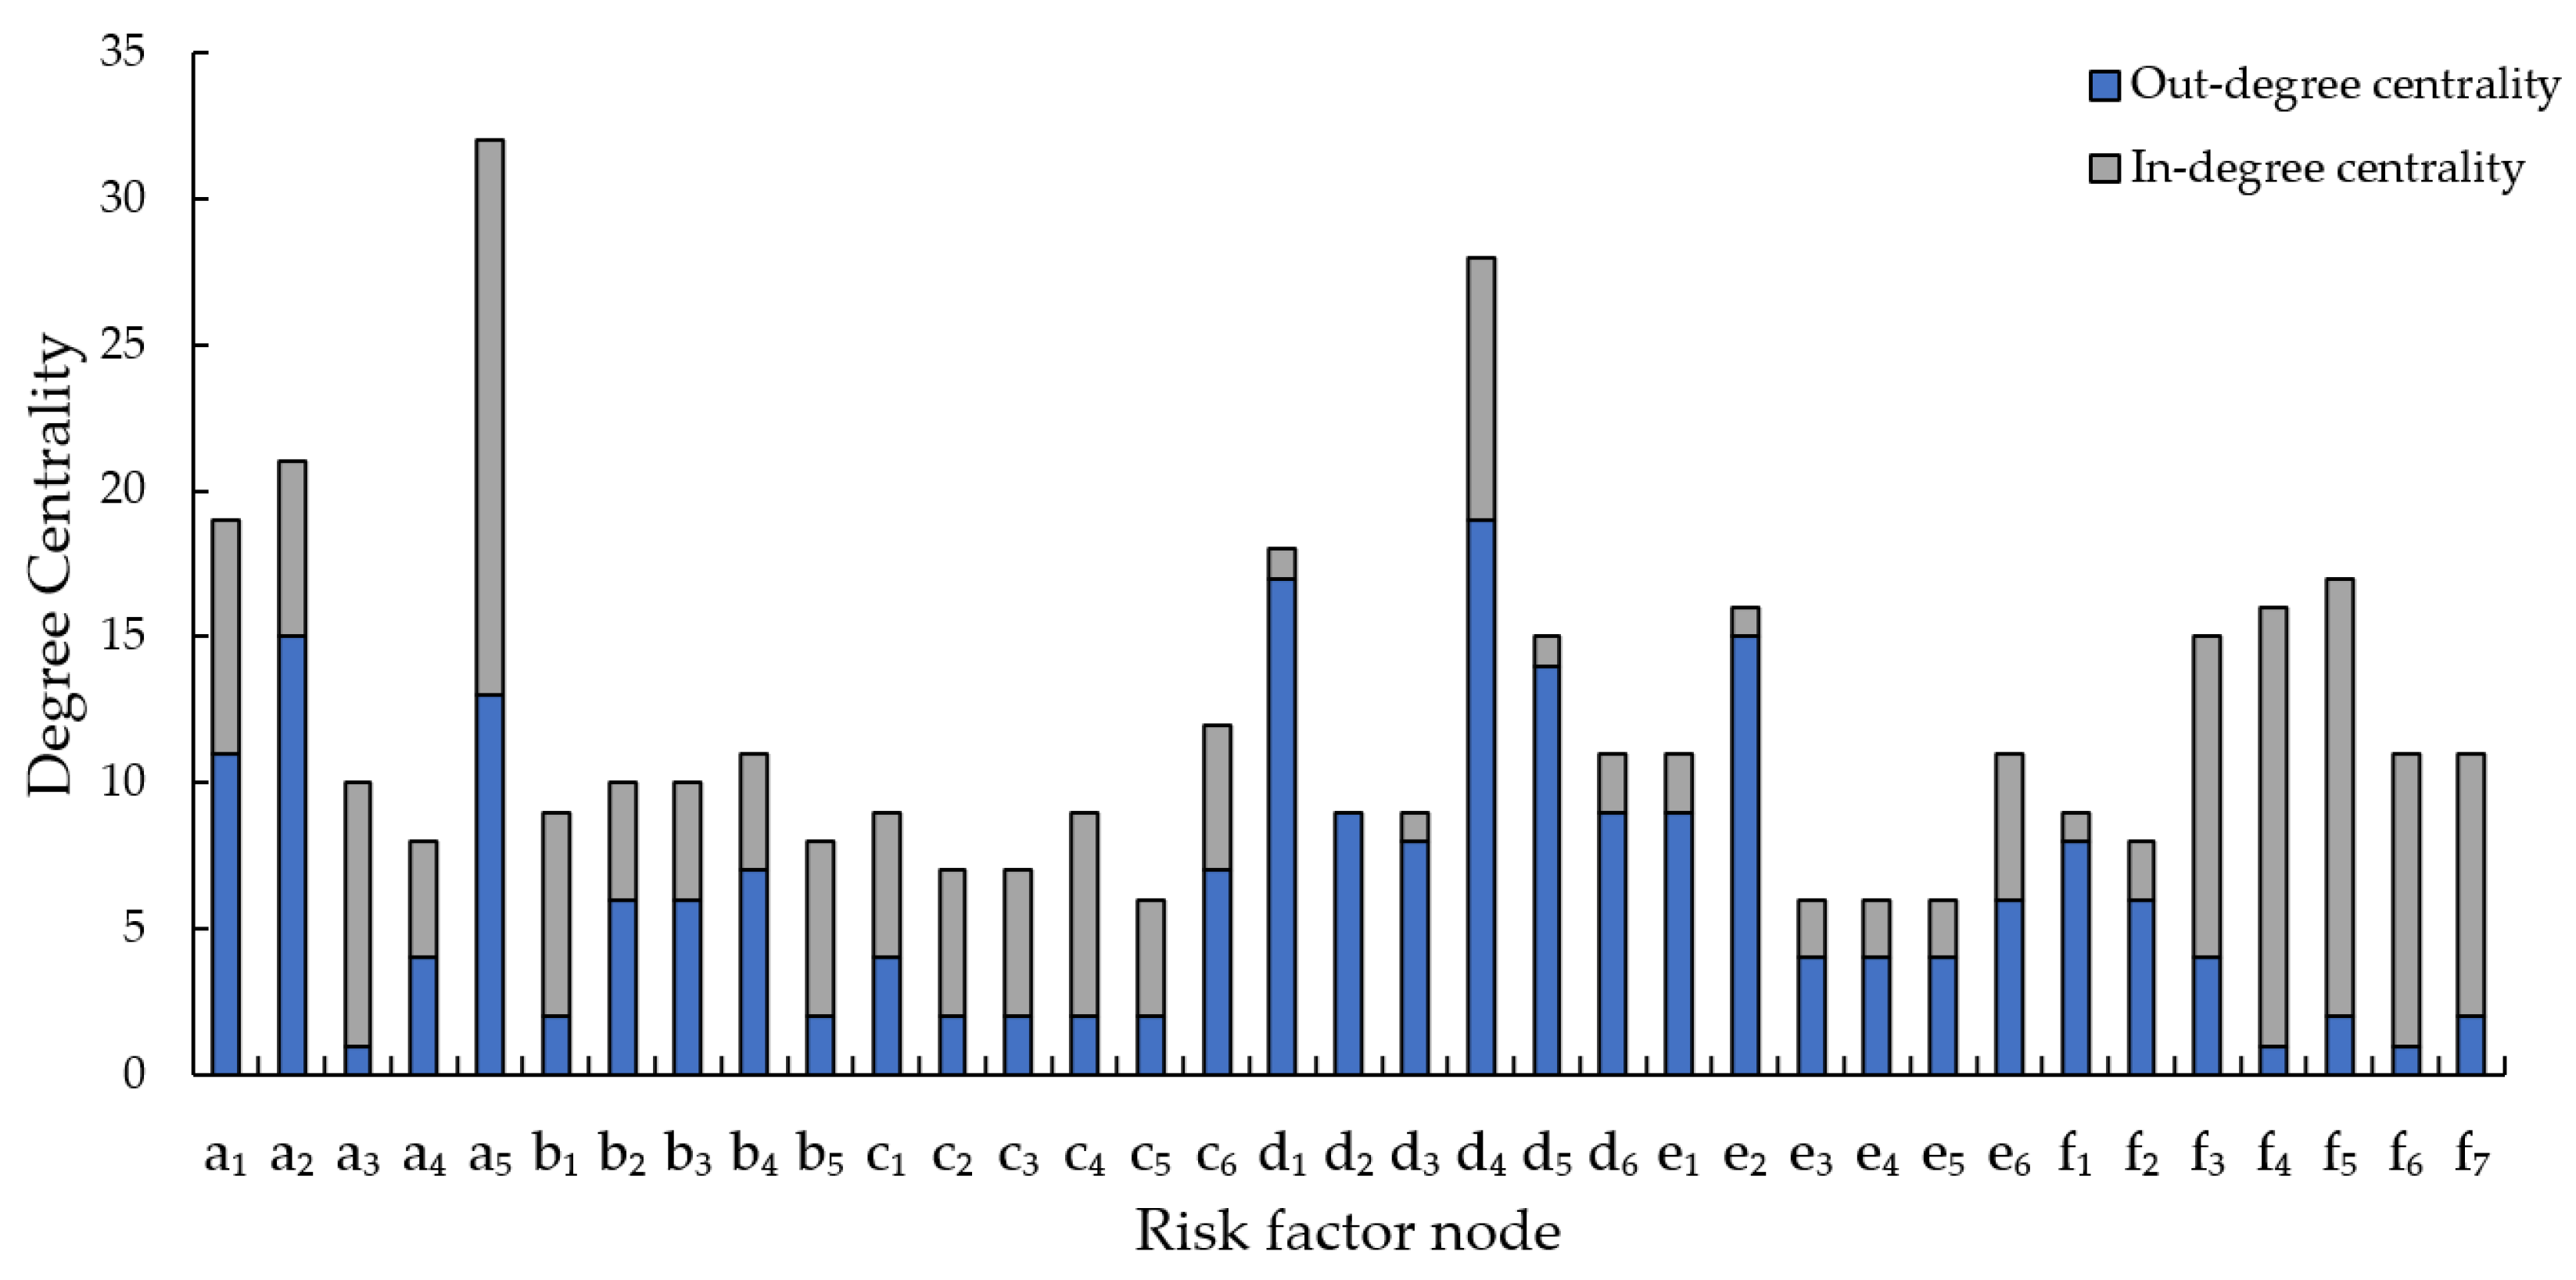
- Degree centrality
- (2)
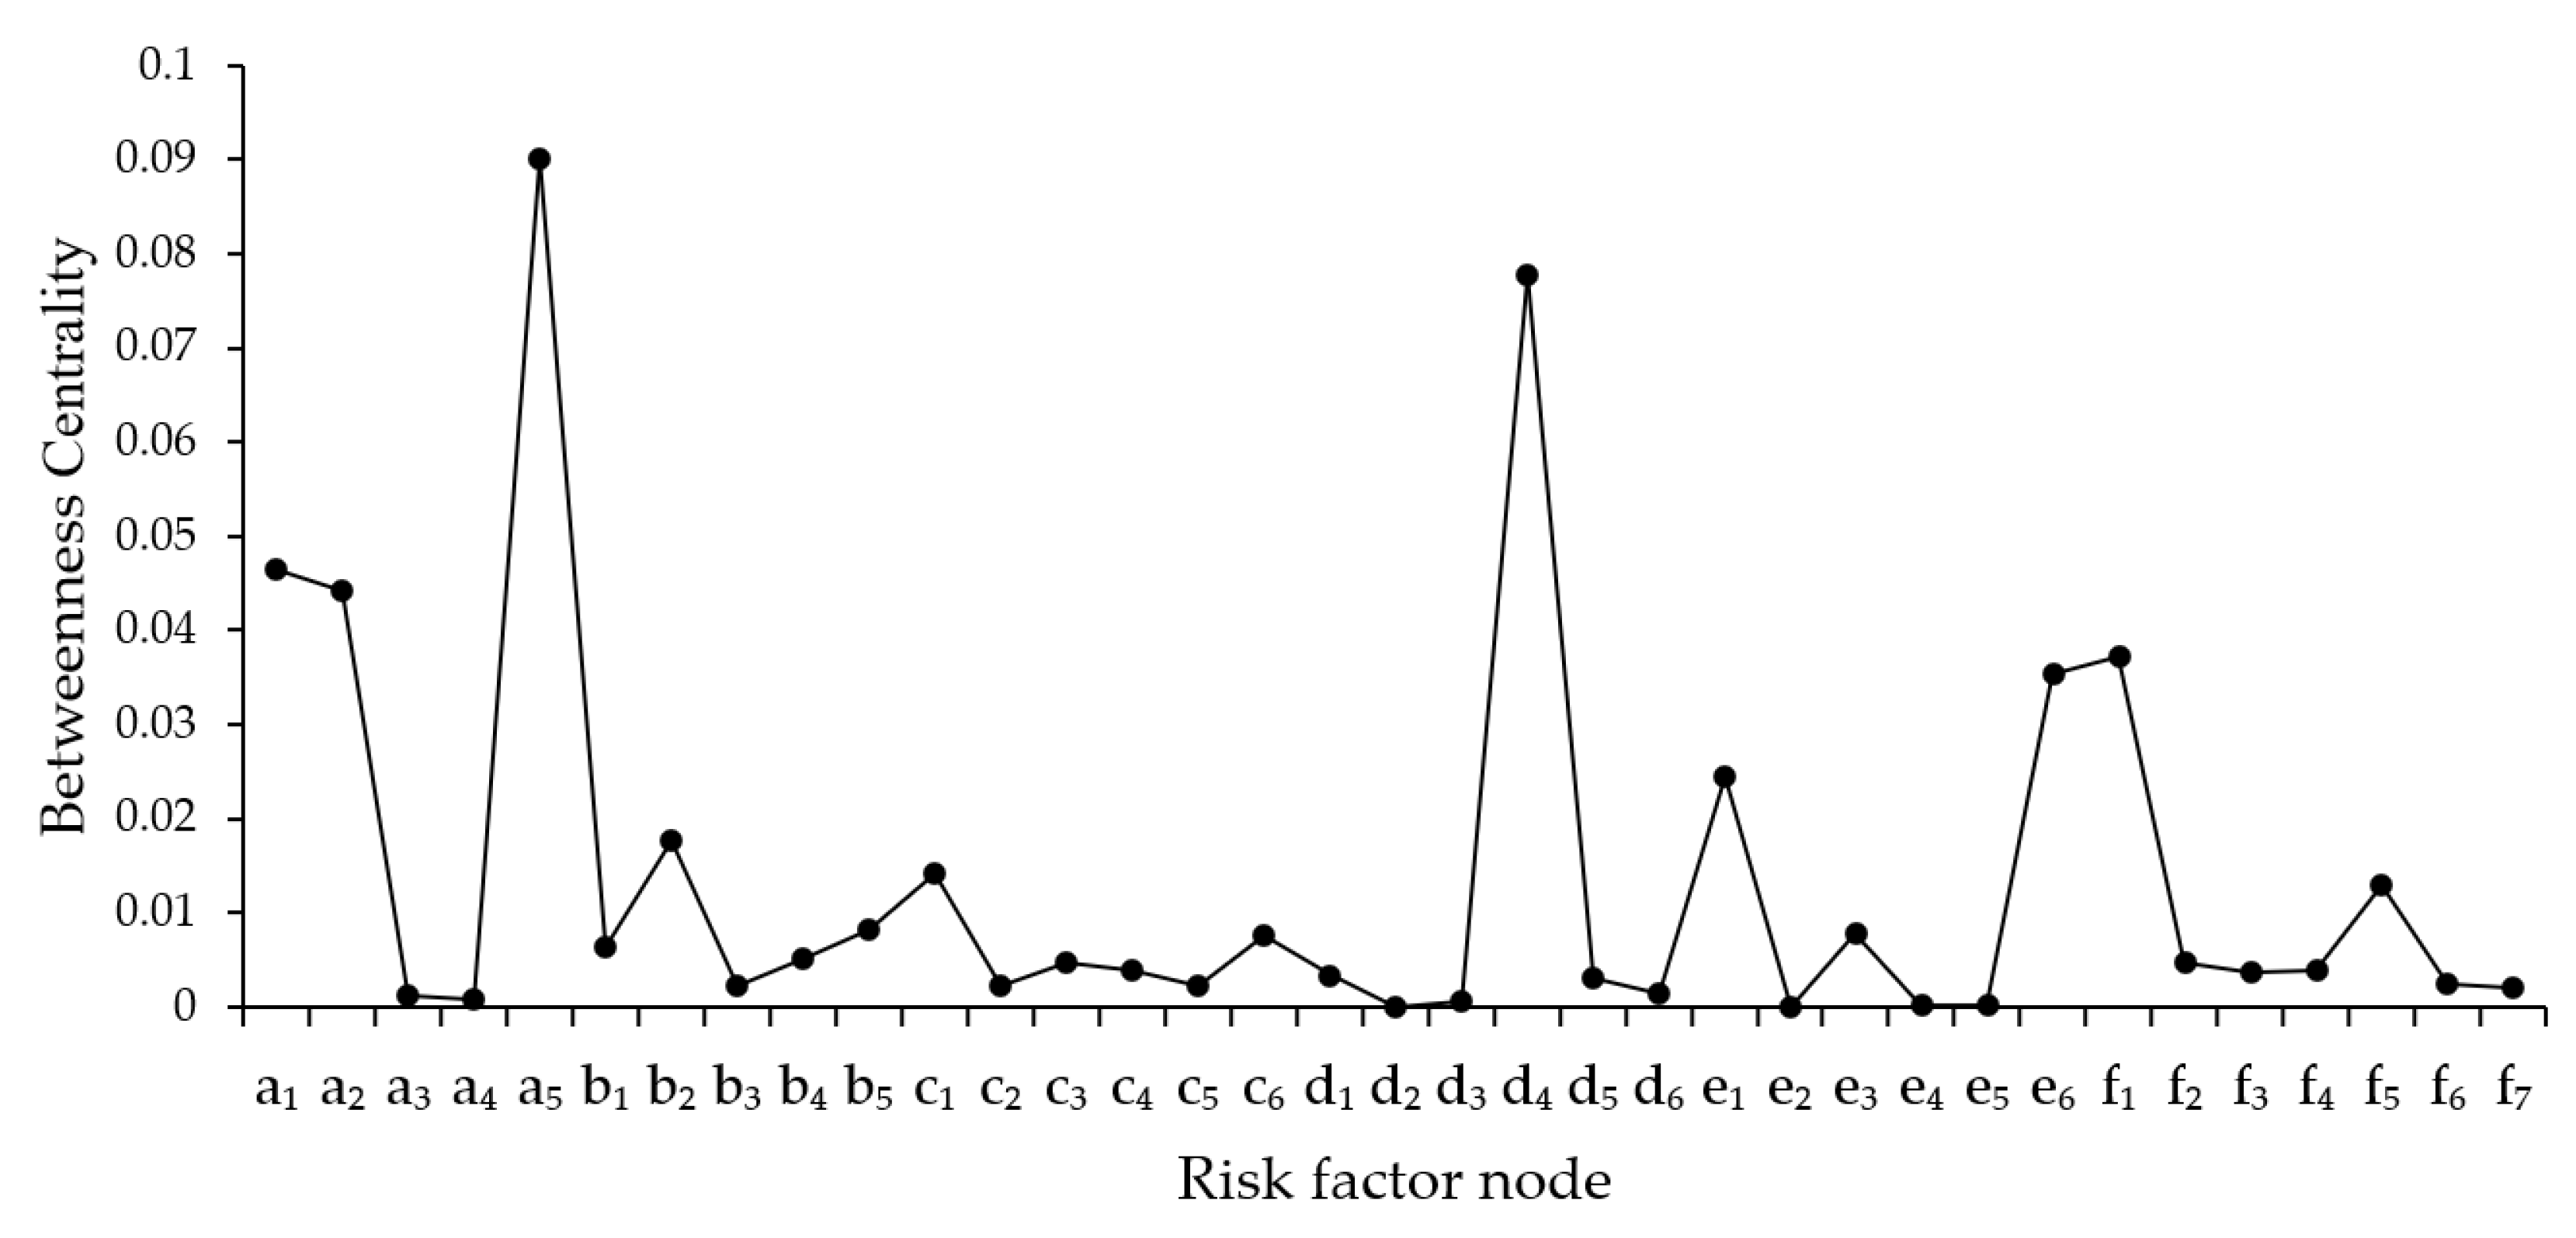
- Betweenness centrality
- (3)
- Eigenvector centrality
- (4)
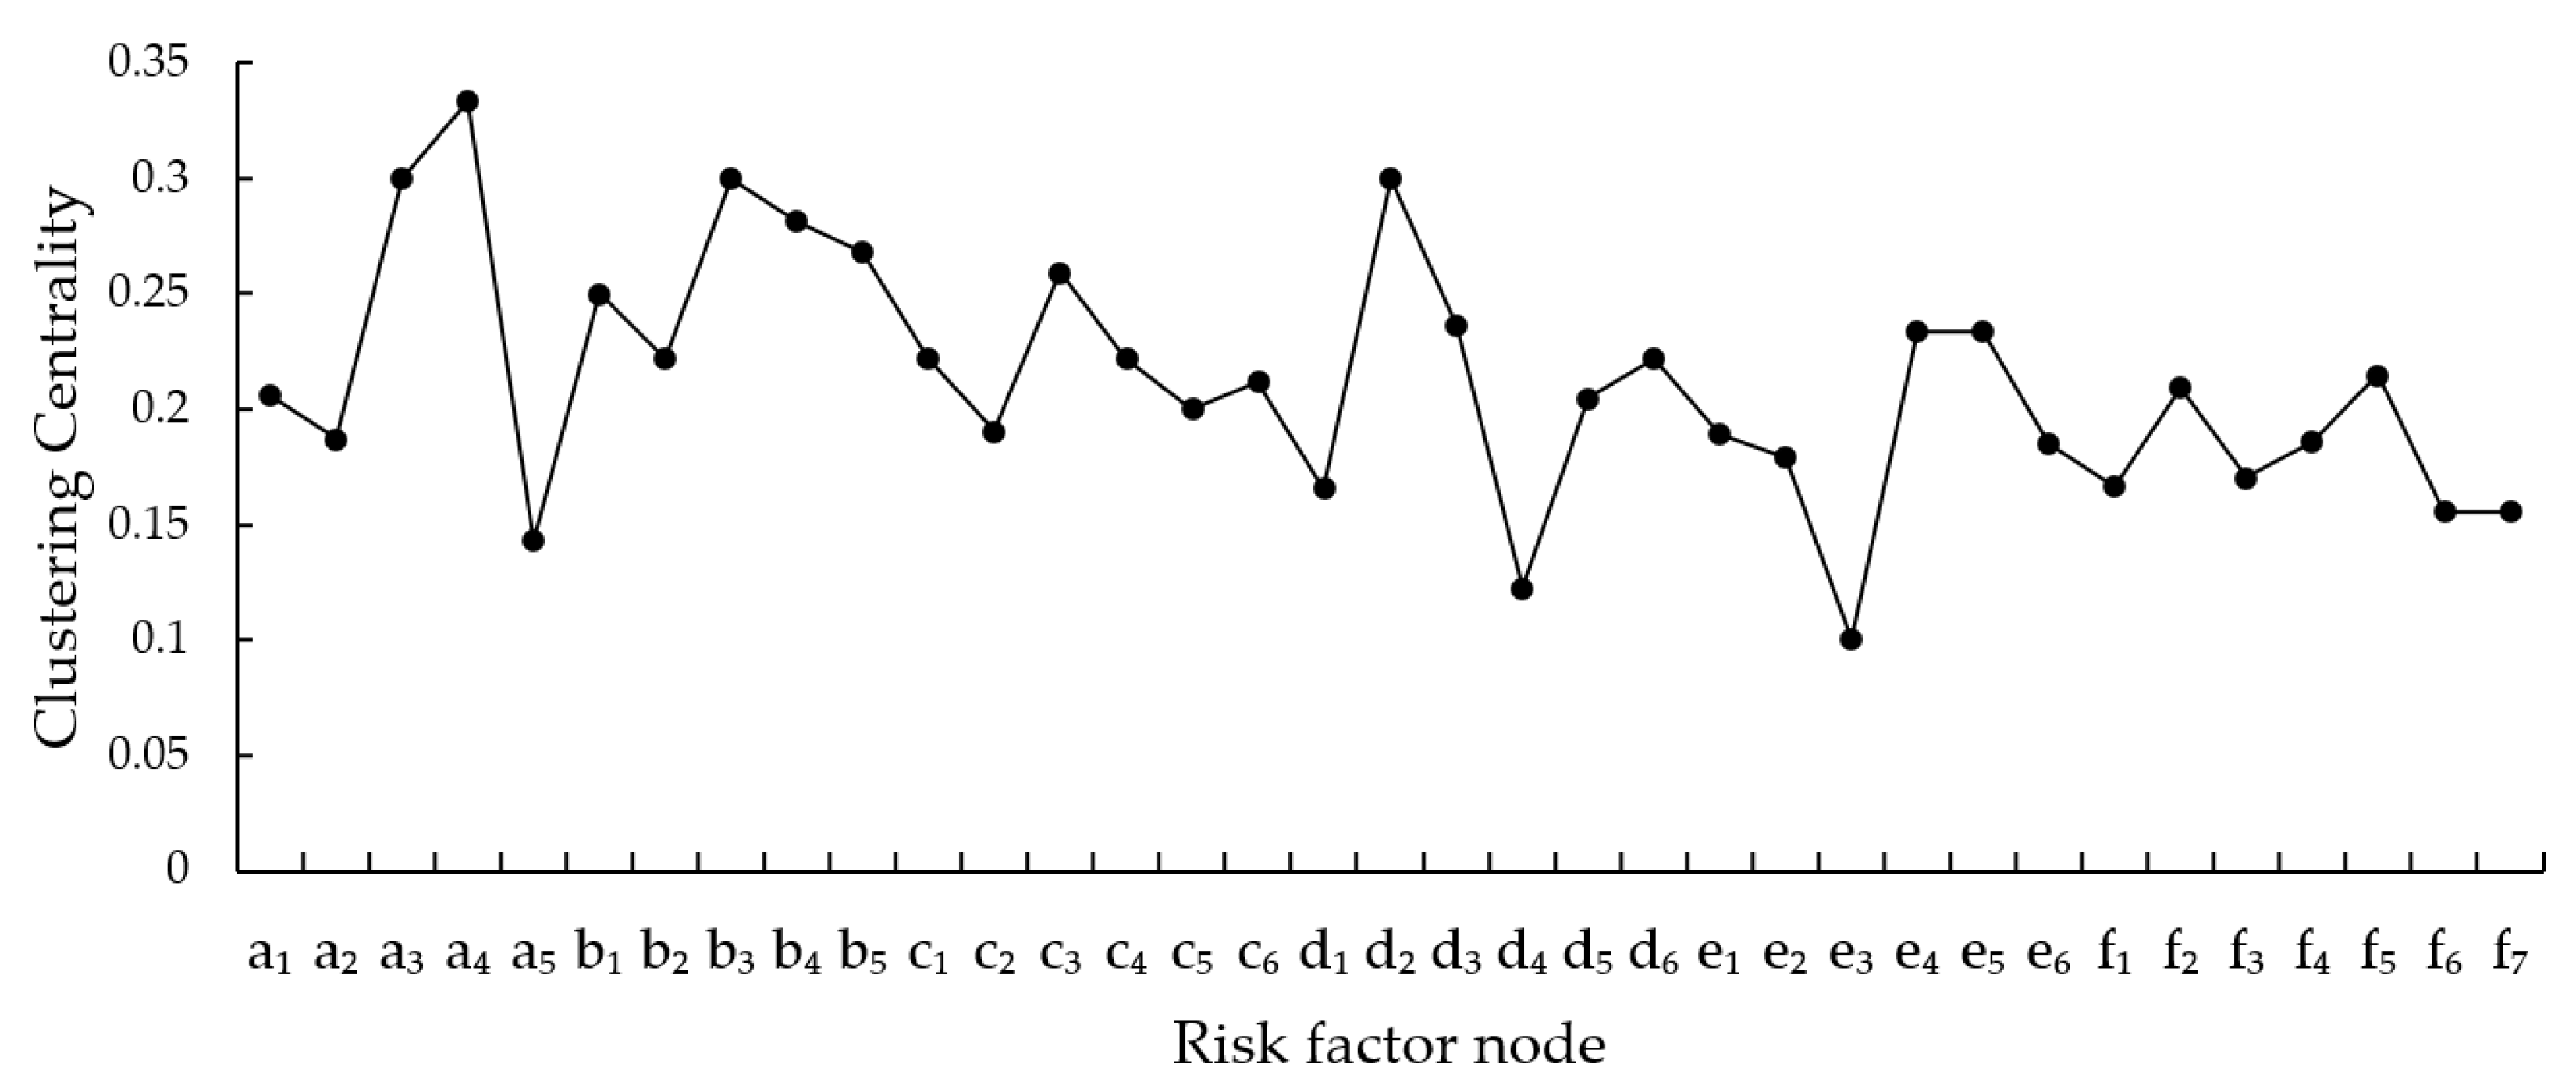
- Clustering coefficient
3.3. Verification and Analysis of Network Model Properties
- (1)
- Small-world property
- (2)
- Scale-free property
4. Immunization Simulation Analysis
4.1. Analysis of Simulation Strategies
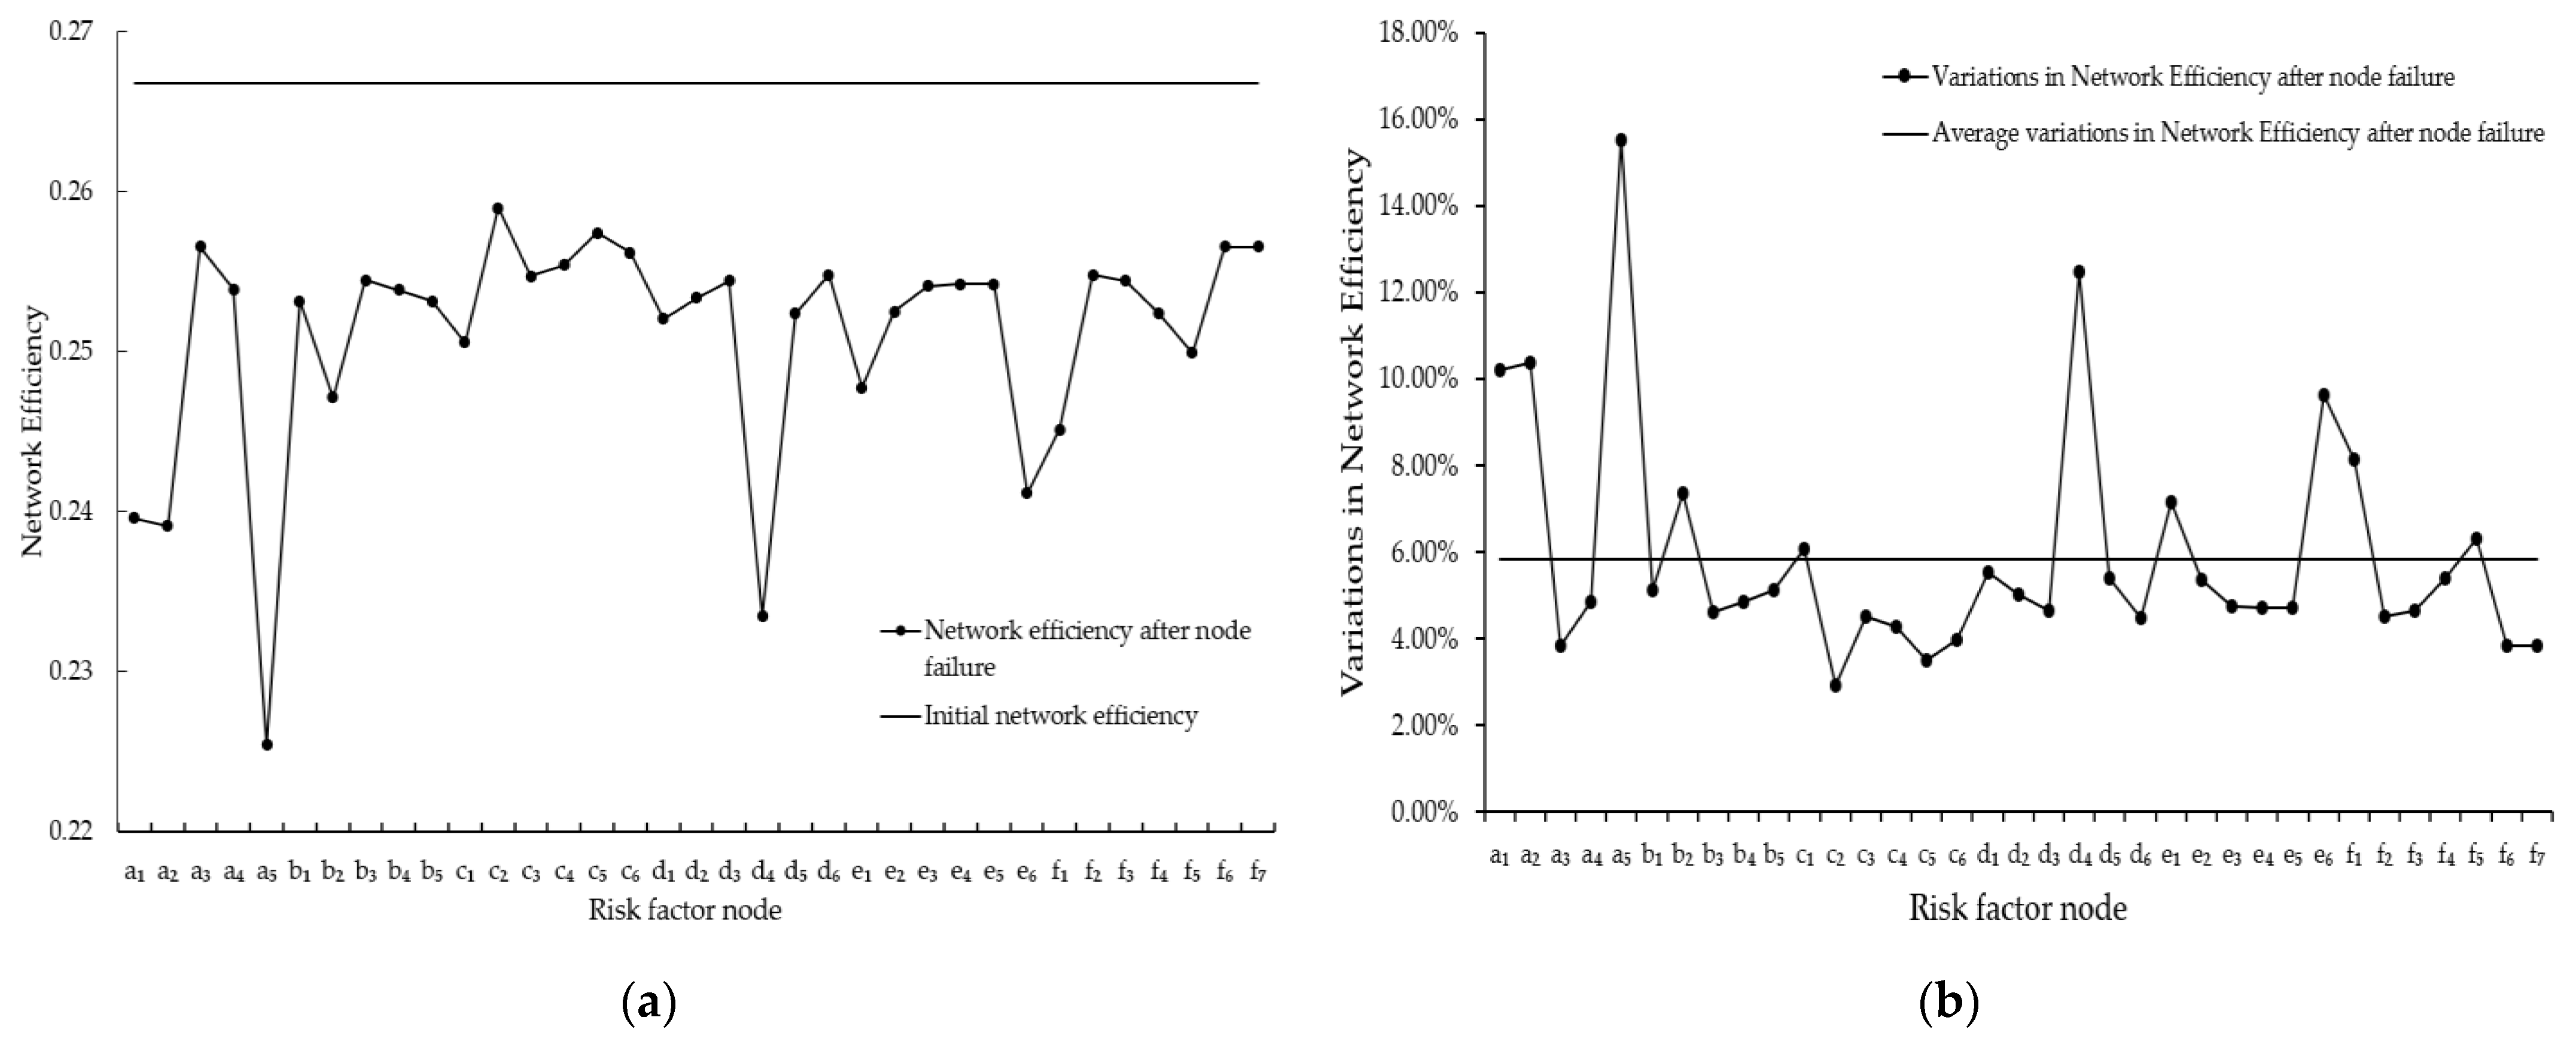
4.2. Simulation Analysis of Single-Node Immunization
4.3. Simulation Analysis of Random and Targeted Immunization
- (1)
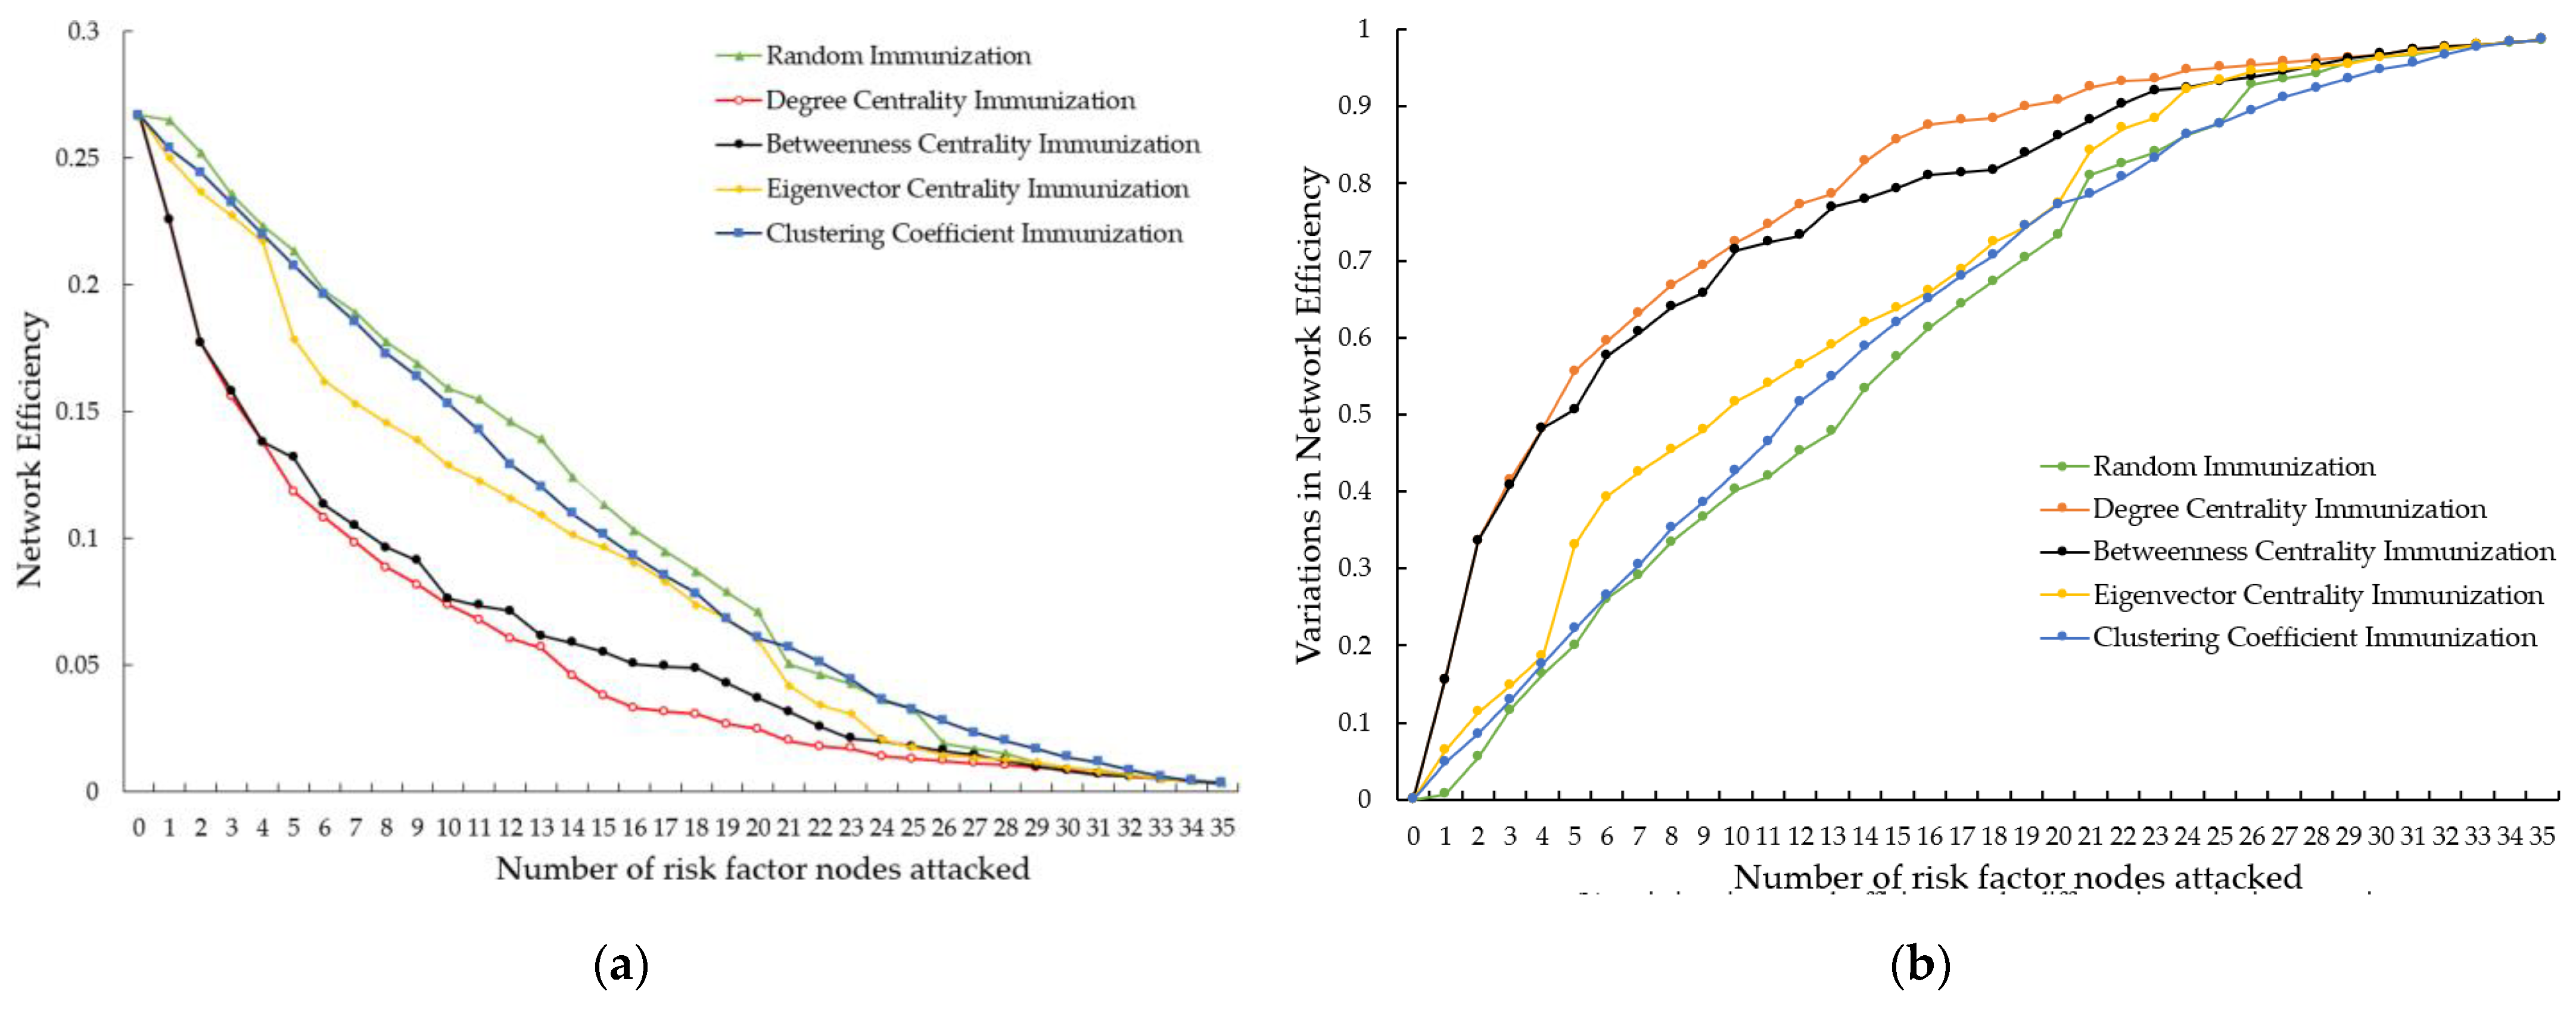
- Comparing targeted immunization and random immunization strategies, the random immunization strategy performs worse than the targeted immunization strategy. After removing 7 risk factor nodes, the network efficiency under random immunization and four targeted immunization strategies decreased by 0.291, 0.632, 0.607, 0.426, and 0.305, respectively. After further removal of 15 risk factor nodes, the network efficiency decreased by 0.574, 0.857, 0.794, 0.638, and 0.620, respectively. This indicates that the risk-coupling network has a strong vulnerability to targeted immunization, and targeted immunization strategies perform better in improving risk management efficiency. The targeted immunization strategy can effectively slow down the evolution of risk network coupling by selectively removing nodes with higher associated feature indicator values, which is a more effective means of risk management.
- (2)
- During the implementation of targeted immunization strategies, a nonlinear characteristic is observed in the decrease in network efficiency. With an increase in the number of attacked nodes, the initial decrease in network efficiency is significant, followed by a gradual slowdown. This phenomenon can be attributed to the fact that in the early stages of an attack, the removal of risk factor nodes with high associated feature indicator values, which play crucial roles in the network, can prolong or even cut off risk evolution paths, causing substantial disruption to the network’s risk-coupling effects. In the later stages of the attack, the remaining nodes generally have lower feature indicator values, and their removal has a limited impact on the overall connectivity of the network, leading to a slowing down in the decreasing trend of network efficiency. This underscores that controlling critical causal factors is more effective for safety management in metro deep foundation pits.
- (3)
- Among the four targeted immunization strategies, the degree centrality immunization strategy performs the best, while the clustering coefficient immunization strategy shows the lowest effectiveness, but all are superior to random immunization. Given the superior effectiveness of the degree centrality immunity strategy, concentrating resources on attacking the key nodes a5, d4, a2, a1, d1, f5, and d5 can effectively impede the risk-coupling effects and prevent risk incidents. In the practice of safety risk management in metro deep foundation pit construction, emphasis should be placed on identifying and evaluating key risk factors to achieve optimal resource allocation and maximize risk control effectiveness.
5. Conclusions
- (1)
- Based on complex network theory, a quantitative analysis of the characteristic indicators of the risk-coupling network in metro deep foundation pit construction was conducted using Ucinet6.0 software. The risk factor coupling network presents typical scale-free and small-world network properties. The nodes with higher degree, such as a5, are connected with more nodes. The nodes with large clustering coefficients, such as a4 have a strong local clustering effect. The nodes with large betweenness centrality play a significant intermediary role in risk propagation. The nodes with large eigenvector centrality are closely associated with other key risk factors.
- (2)
- Analysis of immunization strategies: Compared with different immunization factors, the failures of nodes like a5 and d4 have the most significant impact on risk coupling. Compared with different immunization sequences, targeted immunization is superior to random immunization, and degree centrality immunization has the best implementation effect. Prior control of key risk factors corresponding to degree centrality can effectively delay the risk-coupling effect, providing a theoretical basis for the formulation of risk-decoupling strategies.
- (3)
- Based on the above analysis, the following recommendations are proposed for the safe production construction and risk management of metro deep foundation pit projects: (1) Standardize safety behavior, strictly adhering to standard construction practices, and enhancing the level of employee competence are the primary tasks of safety management; (2) Strengthen the daily maintenance and inspection of construction machinery and equipment, to enhance the safety and operational efficiency of construction machinery and equipment; (3) Enhance the management of construction materials in storage, transportation, processing, and utilization to ensure the safety and reliability of engineering structures; (4) Strengthen safety education and training, implement safety briefings, safety supervision, and hazard inspections, establish standardized, comprehensive, and procedural management mechanisms to provide guarantees for safety management work; (5) Enhance the monitoring and early warning of risks related to the natural environment and work environment to mitigate the impact of environmental factors on the safety of metro deep foundation pit construction; and (6) Strengthen geological and hydrological surveys, and implement strict control over the design and construction processes of metro excavation shoring.
Author Contributions
Funding
Data Availability Statement
Conflicts of Interest
Nomenclature
| Abbreviation | |
| WBS-RBS | Work breakdown structure-risk breakdown structure |
| SVM | Support vector machine |
| G-COWA | Gray cluster analysis-combination ordered weighted averaging |
| TL-ANP | Two-tuple linguistic analytic network process |
| FBN | Fuzzy Bayesian network |
| FAHP | Fuzzy analytic hierarchy process |
| SNA | Social network analysis |
| C-OWA | Combination ordered weighted averaging |
| WSR | Wuli-Shili-Renli |
| Notation | |
| ki | Degree centrality |
| aji | Number of edges from other nodes to node i |
| aij | Number of edges from node i to other nodes |
| N | Total number of network nodes |
| Ci | Clustering coefficient |
| Ei | Actual number of edges between ki nodes |
| Ba | Betweenness centrality |
| nij | Number of shortest paths from node i to node j |
| nij(a) | Number of paths passing through node a between nodes i and j |
| ECi | Eigenvector centrality |
| λ | Constant |
| xj | Eigenvector corresponding to the eigenvalue λ−1 of the adjacency matrix |
| L | Average path length |
| dij | Shortest path between nodes i and j |
| D | Network diameter |
| d | Network density |
| E | Network efficiency |
References
- Zhang, S.; Riza, Y.S.; Loosemore, M.; Wang, S.J.; Gu, Y.J.; Li, H.F. Identifying critical factors influencing the safety of Chinese subway construction projects. Eng. Constr. Archit. Manag. 2021, 28, 1863–1886. [Google Scholar] [CrossRef]
- Hyun, K.C.; Min, S.; Choi, H.; Park, J.; Lee, I. Risk analysis using fault-tree analysis (FTA) and analytic hierarchy process (AHP) applicable to shield TBM tunnels. Tunneling Undergr. Space Technol. 2015, 49, 121–129. [Google Scholar] [CrossRef]
- Li, X.L.; Wan, R.Q.; Wu, B.; Meng, G.W.; Chen, H.H. Risk Assessment of the construction of metro stations with open cut method based on fuzzy comprehensive evaluation method. In IOP Conference Series: Earth and Environmental Science; IOP Publishing: Bristol, UK, 2020; Volume 636, p. 012029. [Google Scholar]
- Wang, Q.K.; Nian, C.G.; Yang, D.; Zhang, Y.F. Early warning of risks in metro deep foundation pit construction based on T-S fuzzy neural network. China Saf. Sci. J. 2016, 28, 161–167. [Google Scholar]
- Meng, G.W.; Huang, J.S.; Wu, B.; Nong, Z.J.; Xu, J.; Wei, H. Risk Assessment of Metro Station Deep Foundation Pit Construction Based on Mathematical Statistics. Urban Mass Transit 2021, 24, 55–60. [Google Scholar]
- Zhou, Y.; Su, W.J.; Ding, L.Y.; Luo, H.B.; Love, P.E.D. Predicting Safety Risks in Deep Foundation Pits in Subway Infrastructure Projects: Support Vector Machine Approach. J. Comput. Civ. Eng. 2017, 31, 04017052. [Google Scholar] [CrossRef]
- You, W.B.; Wang, J.B.; Zhang, W.; Liu, F.M.; Yang, D.Y. Construction risk assessment of deep foundation pit in metro station based on G-COWA method. In IOP Conference Series-Earth and Environmental Science; IOP Publishing: Bristol, UK, 2018; Volume 153, p. 052018. [Google Scholar]
- Jiang, J.; Liu, G.Y.; Huang, X.; Ou, X.D. Risk Assessment of Constructing Deep Foundation Pits for Metro Stations Based on Fuzzy Evidence Reasoning and Two-tuple Linguistic Analytic Network Process. Shock. Vib. 2022, 2022, 1070–9622. [Google Scholar] [CrossRef]
- Zhang, G.H.; Wang, C.T.; Jiao, Y.Y.; Wang, H.; Qin, W.M.; Chen, W.; Zhong, G.Q. Collapse Risk Analysis of Deep Foundation Pits in Metro Stations Using a Fuzzy Bayesian Network and a Fuzzy AHP. Math. Probl. Eng. 2020, 2020, 1–18. [Google Scholar] [CrossRef]
- Fu, L.P.; Wang, X.Q.; Zhao, H.; Li, M.N. Interactions among safety risks in metro deep foundation pit projects: An association rule mining-based modeling framework. Reliab. Eng. Syst. Saf. 2022, 221, 108381. [Google Scholar] [CrossRef]
- Xiang, P.C.; Liu, Y.L. Research on Risk Coupling Mechanism of Cross-regional Meja Construction Projects. Constr. Econ. 2018, 39, 97–101. [Google Scholar]
- Zhou, H.B.; Yang, Q.; Yang, Z.G.; Chen, C.Y.; Ji, M. Analysis and control of safety risk factors of tower crane based on complex network and N-K model. J. Saf. Environ. 2020, 20, 816–823. [Google Scholar]
- Zhou, Y.; Li, C.S.; Ding, L.Y.; Sekula, P.; Love, P.E.D.; Zhou, C. Combining association rules mining with complex networks to monitor coupled risks. Reliab. Eng. Syst. Saf. 2019, 186, 194–208. [Google Scholar] [CrossRef]
- Wang, Q.K.; Kang, X.W.; Zhu, K. Coupling evaluation method of construction risk in deep subway foundation pit. J. Northeast. Univ. (Nat. Sci. Ed.) 2021, 42, 1152–1158. [Google Scholar]
- Li, X.X.; Tan, Z.S.; Lei, K.; Ding, Y. Research on construction risk coupling of multiple factors in urban underground large space. Highway 2021, 66, 217–226. [Google Scholar]
- Fang, M.; Zhang, Y.; Zhu, M.J.; Chen, S.P. Cause Mechanism of Metro Collapse Accident Based on Risk Coupling. Int. J. Environ. Res. Public Health 2022, 19, 2102. [Google Scholar] [CrossRef] [PubMed]
- Guo, D.S.; Song, Z.P.; Xu, T.; Zhang, Y.W.; Ding, L.B. Coupling Analysis of Tunnel Construction Risk in Complex Geology and Construction Factors. J. Constr. Eng. Manag. 2022, 148, 4022097. [Google Scholar] [CrossRef]
- Zhou, L.P.; Irizarry, J.; Li, Q.M. Using network theory to explore the complexity of subway construction accident network(scan)for promoting safety management. Saf. Sci. 2014, 64, 127–136. [Google Scholar] [CrossRef]
- Chen, W.Q.; Deng, J.J.; Niu, L.C. Identification of core risk factors and risk diffusion effect of urban underground engineering in China: A social network analysis. Saf. Sci. 2022, 147, 105591. [Google Scholar] [CrossRef]
- Liu, Y.; Sun, Q.W.; Liu, G.X.; Meng, G.W.; LI, X.; Wu, B. FDEMATEL-TOPSIS model and its application for safety assessment of deep foundation pit construction of subway. Sci. Technol. Eng. 2022, 22, 4253–4260. [Google Scholar]
- Shen, Y.S.; Wang, P.; Li, M.P.; Mei, Q.W. Application of subway foundation pit engineering risk assessment: A case study of Qingdao rock area, China. KSCE J. Civ. Eng. 2019, 23, 4621–4630. [Google Scholar] [CrossRef]
- Wu, B.; Wan, Y.J.; Xu, S.X.; Zhao, C.X.; Liu, Y.; Zhang, K. A Multi-Source Intelligent Fusion Assessment Method for Dynamic Construction Risk of Subway Deep Foundation Pit: A Case Study. Sustainability 2023, 15, 10162. [Google Scholar] [CrossRef]
- Lam, C.Y.; Tai, K. Network topological approach to modeling accident causations and characteristics: Analysis of railway incidents in Japan. Reliab. Eng. Syst. Saf. 2020, 193, 106626. [Google Scholar] [CrossRef]
- Liu, J.T.; Schmid, F.; Zheng, W.; Zhu, J.B. Understanding railway operational accidents using network theory. Reliab. Eng. Syst. Saf. 2019, 189, 218–231. [Google Scholar] [CrossRef]
- Guo, S.Y.; Zhou, X.Y.; Tang, B.; Gong, P.S. Exploring the behavioral risk chains of accidents using complex network theory in the construction industry. Phys. A Stat. Mech. Its Appl. 2020, 560, 125012. [Google Scholar] [CrossRef]
- Chen, F.Y.; Ji, H.C.; Wei, Y.C. Using Network Theory to Explore the Risk Characteristics of Bridge-Tunnel Hybrid Construction. IEEE Access 2019, 7, 116038–116046. [Google Scholar] [CrossRef]
- Song, L.L.; Li, H.Y.; Deng, Y.L.; Li, C.Z. Understanding Safety Performance of Prefabricated Construction Based on Complex Network Theory. Appl. Sci. 2022, 12, 4308. [Google Scholar] [CrossRef]
- Deng, Y.L.; Song, L.L.; Zhou, Z.P.; Liu, P. An approach for understanding and promoting coal mine safety by exploring coal mine risk network. Complexity 2017, 2017, 7628569. [Google Scholar] [CrossRef]
- Leng, A.L.; Xing, G.Y.; Fan, W.G. Credit Risk Transfer in SME Loan Guarantee Networks. J. Syst. Sci. Complex. 2017, 30, 1084–1096. [Google Scholar] [CrossRef]
- Xu, N.J.; Wan, A.X.; Elahi, E.; Peng, B.H. Evaluating investment risks in overseas renewable energy projects: A WSR and D-AHP based approach. Environ. Prog. Sustain. Energy 2023, 43, e14306. [Google Scholar] [CrossRef]
- An, S.H.; Yu, R.H. Review on Complex Network Theory Research. Comput. Syst. Appl. 2020, 29, 26–31. [Google Scholar]


| Risk | Primary Risk Factor | Secondary Risk Factor | Typical Accident Cases |
|---|---|---|---|
| Safety risk of metro deep founda-tion pit constr-uction (R) | Personnel risk factors (a) | Poor awareness of personnel security (a1) | Falling accident on Guangzhou Metro Line 2 |
| Insufficient professional skills (a2) | Collapse accident on Beijing Metro Line 5 | ||
| Poor communication and adaptability (a3) | Collapse accident on Shenzhen Metro Line 1 | ||
| Poor physical or mental health (a4) | The other accident on Shenzhen Metro Line 8 | ||
| Violation of operating regulations (a5) | Object strike accident on Nanjing Metro Line 1 | ||
| Machinery risk factors (b) | Inadequate equipment maintenance (b1) | Mechanical injury accident on Qingdao Metro Line 3 | |
| Equipment failure (b2) | Lifting injury accident on Nanjing Metro Line 3 | ||
| Unreasonable equipment selection (b3) | Lifting injury accident on Guangzhou Metro Line 4 | ||
| Unreasonable arrangement of mechanical work (b4) | Lifting injury accident on Nanjing Metro Line 10 | ||
| Insufficient safety protection measures for mechanical equipment (b5) | Lifting injury accident on Beijing Metro Line 3 | ||
| Material risk factors (c) | Improper management of material storage, transportation and use (c1) | Collapse accident on Hangzhou Metro line 9 | |
| Substandard concrete strength (c2) | Collapse accident on Hangzhou Metro Line 4 | ||
| Insufficient stress in steel support (c3) | Collapse accident on Singapore metro | ||
| Inadequate strength of anchor rod (c4) | Collapse accident on Nanchang Metro Line 1 | ||
| Unqualified quality of retaining wall materials (c5) | Collapse accident on Qingdao Metro Line 1 | ||
| Improper control of material processing quality (c6) | Object strike accident on Shanghai Metro Line 7 | ||
| Management risk factors (d) | Inadequate safety education and training (d1) | Collapse accident on Hefei Metro Line 6 | |
| Incomplete rules and regulations (d2) | Collapse accident on Changsha Metro Line 4 | ||
| Insufficient safety investment (d3) | Collapse accident on Xuzhou Metro Line 3 | ||
| Inadequate safety supervision and hidden danger inspection (d4) | Object strike Accident on Shanghai Metro Line 7 | ||
| Inadequate safety briefing (d5) | Collapse accident on Shenzhen Metro Line 13 | ||
| Unreasonable construction organization and schedule arrangement (d6) | Collapse accident on Hangzhou Metro Line 1 | ||
| Environmental risk factors (e) | Poor geological and hydrological conditions (e1) | Collapse accident on Guangzhou Metro Line 3 | |
| Harsh weather or natural disasters (e2) | Collapse accident on Hangzhou Metro Line 4 | ||
| Complicated underground pipeline laying (e3) | Collapse accident on Beijing Metro Line 4 | ||
| Closing to large high-rise buildings (e4) | Collapse accident on Harbin Metro | ||
| Complicated peripheral traffic (e5) | Collapse accident on Beijing Metro Line 4 | ||
| Harsh operating environment (e6) | Electric shock accident on Wuhan Metro Line 4. | ||
| Technical risk factors (f) | Unspecified or deviation of geological and hydrological survey (f1) | Collapse accident on Hangzhou Metro Line 1 | |
| Improper design and construction scheme (f2) | Collapse accident on Singapore metro | ||
| Improper earthwork excavation (f3) | Collapse accident on Shanghai Metro Line 8 | ||
| Improper construction method of retaining structure (f4) | Collapse accident on Changsha Metro Line 4 | ||
| Error in setting and demolishing supports (f5) | Collapse accident on Shenzhen Metro Line 1 | ||
| Insufficient monitoring of foundation pit (f6) | Collapse accident on Qingdao Metro Line 3 | ||
| Untimely dewatering and drainage (f7) | Collapse accident on Shanghai Metro Line 4. |
| Strategy | Ranking Indicator | Interpretation |
|---|---|---|
| Single-node immunization | Only consider nodes. | Individually remove risk factor nodes one at a time |
| Targeted immunization | Degree centrality | Remove risk factor nodes continuously in the order of degree centrality |
| Betweenness centrality | Remove risk factor nodes continuously in the order of betweenness centrality | |
| Eigenvector centrality | Remove risk factor nodes continuously in the order of eigenvector centrality | |
| Clustering coefficient | Remove risk factor nodes continuously in the order of clustering coefficient | |
| Random immunization | Random order | Remove risk factor nodes continuously in random order |
Disclaimer/Publisher’s Note: The statements, opinions and data contained in all publications are solely those of the individual author(s) and contributor(s) and not of MDPI and/or the editor(s). MDPI and/or the editor(s) disclaim responsibility for any injury to people or property resulting from any ideas, methods, instructions or products referred to in the content. |
© 2024 by the authors. Licensee MDPI, Basel, Switzerland. This article is an open access article distributed under the terms and conditions of the Creative Commons Attribution (CC BY) license (https://creativecommons.org/licenses/by/4.0/).
Share and Cite
Huang, J.; Fang, J.; Wang, J. Risk Coupling Analysis of Metro Deep Foundation Pit Construction Based on Complex Networks. Buildings 2024, 14, 1953. https://doi.org/10.3390/buildings14071953
Huang J, Fang J, Wang J. Risk Coupling Analysis of Metro Deep Foundation Pit Construction Based on Complex Networks. Buildings. 2024; 14(7):1953. https://doi.org/10.3390/buildings14071953
Chicago/Turabian StyleHuang, Jinyan, Jun Fang, and Jingchang Wang. 2024. "Risk Coupling Analysis of Metro Deep Foundation Pit Construction Based on Complex Networks" Buildings 14, no. 7: 1953. https://doi.org/10.3390/buildings14071953