Abstract
As buildings become taller and slenderer, managing their vibrational response and mitigating it pose significant challenges in design. Tuned liquid dampers (TLDs) are liquid (usually water)-filled tanks that can mitigate structural vibrations by leveraging the sloshing motion of the contained fluid. However, the dynamic behavior of TLDs and their interaction with structures is complex. While most research on TLDs has focused on mitigating wind-induced vibrations, less attention has been paid to their seismic control of structural responses. Moreover, existing literature on the experimental research involving TLDs mostly pertains to small-scale models. This study aims to experimentally explore the effectiveness of large-scale TLDs in mitigating vibrations in both linear and nonlinear structures under seismic loads. A real-time hybrid simulation is employed as the experimental method, where only the TLD is physically constructed and tested, while the rest of the system is simulated numerically in a coupled manner, allowing for obtaining the dynamic response of the structure equipped with the TLD in real time. This approach offers the flexibility to significantly scale up the TLD size for physical testing while exploring various TLD-structure scenarios by numerically adjusting the structural properties within the simulation.
1. Introduction
In recent years, there has been a notable shift in the architectural landscape toward the construction of high-rise buildings. These structures are typically characterized by their slender and flexible design, often exhibiting low damping properties. As a result, engineers have been compelled to seek effective and cost-efficient methods to manage the vibrations of these buildings. As a response, several passive energy dissipators have been introduced to control hazards associated with tall buildings under dynamic loads, such as wind or seismic forces. Examples of these devices include friction dampers [1], tuned liquid dampers [2,3], viscoelastic dampers [4], metallic dampers [5], shape memory alloy-based reusable hysteretic dampers [6], and magneto-rheological fluid dampers [7,8].
Tuned liquid dampers have gained significant attention due to their minimal maintenance requirements, cost-effectiveness, and ease of installation [9,10]. As TLDs only require the liquid itself and a tank for which they can slosh inside, water storage tanks in high-rise structures can be repurposed into a TLD or serve dual functionality [9]. This allows for space saving and without the need to perform extensive remodeling to improve a building’s structural system [9]. In comparison to other damping systems, such as tuned mass dampers (TMDs), TLDs offer advantages, such as easier control over the natural frequency of a building [10], and may be more cost effective as TMDs generally require more work and materials to implement in structures [11]. TLDs are supplemental devices designed to mitigate the effects of dynamic forces, such as wind or seismic loads, on buildings. TLDs work by utilizing a sloshing liquid mass inside a container, which is tuned to oscillate at the same frequency as the frequency of the structure. This synchronized motion helps to dissipate energy and reduce the amplitude of vibrations, thereby improving the overall stability and safety of the structure. When a TLD undergoes a high-amplitude motion, the horizontal component of liquid velocity, associated with wave motion, causes wave crests to descend as the amplitude rises. This phenomenon is referred to as wave breaking [12]. As wave breaking occurs, simple linear models become inadequate to describe the liquid behavior, and the sloshing frequency of the liquid is altered [12]. Furthermore, this complex nonlinear effect impacts the shear force at the interface of the TLD with the structure, which opposes the structure’s motion, posing challenges for accurate modeling.
The mass ratio (MR), defined as the ratio of water mass to structural mass, significantly impacts the TLD-structure system’s performance. Existing literature suggests mass ratios ranging from 1% [13,14] to 4% [15], yet experimental validation for higher ratios remains sparse, with previous studies predominantly relying on numerical simulations. TLDs, with lower mass ratios, can effectively reduce structural displacement and acceleration without significantly adding to system inertia. Furthermore, the liquid sloshing frequency plays a crucial role in TLD behavior. Experimental findings [13,16] indicate optimal TLD effectiveness when the liquid frequency aligns closely with the excitation frequency, reaching resonance with the tank motion. However, past studies provide limited and scattered data on these influential parameters.
Several configurations of TLDs (e.g., rectangular, cylindrical, annular, and column-shaped) have been proposed and studied by researchers around the world. Most studies on TLDs have primarily concentrated on mitigating wind-induced vibrations in structures, with comparatively less attention paid to employing them for the seismic control of structural responses. More recently, researchers have begun to explore the effectiveness of these dampers in mitigating vibrations of structures under seismic loads [17,18,19].
The application of rectangular TLDs to mitigate the seismic response of structures was studied analytically and, in some cases, experimentally (on a small scale) by Banerji et al. [15], Malekghasemi et al. [20], Novo et al. [21], Rai et al. [22], Shad et al. [23], and Wang et al. [24]. Also, Jin et al. [25] studied the effectiveness of cylindrical TLDs as a passive control device to improve the seismic response of offshore platforms. Gaemmaghami et al. [26,27] numerically evaluated the performance of annular liquid tanks as a variant of TLDs in the vibration mitigation of wind turbines due to earthquake loads. Additionally, the seismic performance of tuned liquid column dampers (TLCDs) was investigated experimentally on a small scale by Zhu et al. [28].
Understandably, there is a lack of studies/discussion on nonlinear structures equipped with TLDs. This is because it can become quite costly and time-consuming to build and test nonlinear structures as the experiment can only be run once and a new specimen must be built to run the test again. However, in recent years, some effort has been put into characterizing the effectiveness of TLDs in nonlinear structures, such as the work by Das and Choudhury [29]. Das and Choudhury investigated the performance of a quarter-scale reinforced concrete building equipped with a TLD [29]. More research into nonlinear substructure models is important as buildings may not always stay within the elastic range. With the use of the testing methodology employed here (i.e., real-time hybrid simulation), since the nonlinear structure can be modeled numerically, it allows for a much more cost-effective method of investigating the performance of TLDs placed onto structures that experience nonlinear behavior.
The size of TLDs that are investigated in a laboratory is generally governed by the size of the test equipment available to the researcher(s), for example the size of the shake table available. However, the scale effect of structures and liquid dampers can have a significant impact on the behavior and performance, as noted by Wang et al. [24]. This aspect is further confirmed by Zhu et al. [30] in their investigation of the size effects of TLDs in RTHS tests. They reached the conclusion that downsized models tend to overstate the effectiveness of TLDs, emphasizing the need for full-scale experiments to obtain more accurate results [30].
2. Objectives
As mentioned in the Introduction Section, there is a sparse inventory of the experimental data on the performance of TLDs. It is mostly focused on wind applications and limited to only experiments on the interaction of small-scale TLD-structure setups that is feasible in the lab environment. Also, more research into nonlinear substructure models is crucial, as buildings may not always remain within the elastic range.
This study aims to experimentally investigate the performance of large-scale TLDs in suppressing the vibrations of both linear and nonlinear structures under seismic loading. This is carried out using a state-of-the-art experimental testing method, namely a real-time hybrid simulation (RTHS), where only the TLD is built and tested physically, and the rest of the system is simulated numerically. This testing method provides the flexibility to significantly increase the TLD size as the sole physically tested component of the setup. Additionally, it allows for the consideration of various TLD-structure scenarios by numerically altering the structural properties within the computer program. Utilizing the RTHS, which allows the nonlinear structure to be modeled numerically, offers a cost-effective method for investigating the performance of TLDs in structures that exhibit nonlinear behavior. The RTHS experiments are conducted using the computational/control platform that was previously developed and verified by the authors at the University of Toronto [31].
To the best of the authors’ knowledge, the TLD studied in this paper is the largest TLD that was coupled with the response of a nonlinear structure at the time of the experiments. The total mass of the TLD tested in this study is nearly 600 kg, while previously tested TLDs were in the range of 60 to 200 kg [24,32,33,34,35].
Given its comparable size to TLDs used in real-world applications, the findings from this study offer a more accurate and realistic insight into the interaction between TLDs and structures, including linear and nonlinear structural responses. Additionally, the experimental data obtained could be instrumental in refining existing analytical models for more dependable performance predictions of TLDs.
3. Real-Time Hybrid-Simulation Experimental Setup
3.1. Methodology: Real-Time Hybrid Simulation (RTHS)
In a hybrid simulation, as an experimental testing method, physical testing is combined with a numerical simulation. This technique is, in fact, considered a variation in the traditional pseudo-dynamic testing (PSD) method [36]. In this approach, the structure being tested is divided into two parts. The experimental substructure includes critical components of the structure that either lack a reliable analytical model or are difficult to accurately simulate using computer models. These components are physically tested in a laboratory setting. The analytical substructure comprises the remaining portion of the structure, which is simulated using computer models and analyzed numerically. By combining physical testing with computer simulation, hybrid testing allows researchers to study the behavior of complex structures more effectively and accurately [37].
If the test structure possesses properties that are dependent on the rate of loading, the experiments must be carried out in real time. This facilitates an accurate representation of the structure’s dynamic behavior and ensures the effective capture of load-rate-dependent characteristics [38,39,40]. The RTHS relies heavily on robust and effective computational resources and well-synchronized data communication [40]. The RTHS involves physically testing only critical components of the structures, while modeling the rest analytically. This approach enables the cost-effective and timely consideration of various influential parameters, loading scenarios, and structural configurations [41]. As a result, by employing the RTHS method, the dynamic performance of complex structures, including passive, active, and semi-active control devices, such as base isolators, tuned liquid, mass, and magneto-rheological dampers [20,42], can be accurately assessed. In this study, the RTHS method is adopted to experimentally investigate the performance of large-scale TLDs installed on linear and nonlinear structures subjected to seismic loading.
3.2. Mechanical Setup for Tests
This study utilized a 2.0 m × 1.5 m uniaxial shaking table with a 1.5-ton payload to move the large-scale TLD during the RTHS experiments. The shaking table simulated the roof floor of the test structure, and replicated real-life roof displacements. It was powered by a servo hydraulic actuation system, which included a hydraulic service manifold (HSM) capable of a continuous flow rate of 450 L/min (120 gpm) at a pressure of 20 mPa (3000 psi). Two fatigue-rated hydraulic actuators with a stroke length of ±127 mm (±5 inches) and a maximum force capacity of ±33 kN (7500 lbf) were driven by electro servo-valves with a flow capacity of 63 L/min (16.5 gpm) at 7 mPa (1000 psi). Each actuator was equipped with a ±127 mm (±5 inches) AC linear variable differential transformer (LVDT) sensor for displacement feedback and a dynamic load cell with a ±50 kN (±12,500 lbf) capacity for force feedback. The two actuators were mechanically linked to double the force capacity of the testing platform.
3.3. Real-Time Hybrid Simulator
The authors previously developed, implemented, and verified the user reconfigurable computational/control platform that is used in this study to conduct the RTHS experiments [31]. The key components of the developed real-time hybrid simulator include a quad-core real-time processor and a field programmable gate array (FPGA). Figure 1 shows the architecture of the platform, as well as all the signal routings amongst the system components. As shown in the figure, the simulation consists of two nested loops: an inner loop and an outer loop. The outer loop of the platform aims to solve the second-order ordinary equation of motion associated with the test structure that is expressed by:
where, M denotes the mass matrix, C represents the damping matrix (reflecting inherent structural damping), R stands for the restoring force vector, and F is the effective or applied external force vector. During iterations of the outer loop, a numerical integration algorithm is employed to compute the command displacements to be imposed on the test structure. Additionally, the outer loop encompasses all the tasks associated with determining the state of the analytical substructure and manipulating the input/output files.
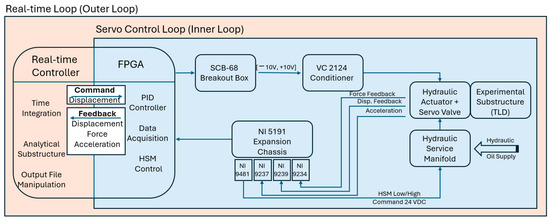
Figure 1.
RTHS platform system setup.
The inner loop serves as the servo-control mechanism of the system. It is responsible for applying command displacements to the experimental substructure via the hydraulic actuators. Within this loop, all data communication occurs between the controller and the hardware components, including the servo valves, LVDTs, and load cells [31]. It needs to be noted that, in Figure 1, the experimental substructure is represented as a spring element. However, as previously explained, in this study, the experimental substructure consists of a large-scale TLD driven by two dynamic actuators, which are coupled to enhance the force capacity.
3.4. Software
Unlike turnkey RTHS platforms, the controller of the current setup has been designed like an empty canvas, requiring user configuration to execute specific tasks for each application. This design enhances platform flexibility, allowing for various experiments and compatibility with different loading systems. For this application, in addition to the servo-control laws, multiple tasks are addressed and incorporated to ensure the safe startup, optimal performance, and secure shutdown of the shake table. The user interface of the RTHS platform, which manages computational, data acquisition, control, and safety-related tasks (such as displacement and force limit switches), was developed using LabVIEW (2009), MATLAB (2010), and Simulink (2010) programming tools. The core of the program comprises a multi-state Host VI (VI being the term for codes developed in LabVIEW (2009)), referred to as real-time VI, connected to an FPGA VI and several sub-VIs (similar to subfunctions in MATLAB), all coordinated within a LabVIEW project [31]
3.5. Ground Motions
In this RTHS investigation, a selection of seven earthquake records constitutes the ground motion suite. The significant features of these selected ground motions are outlined in Table 1.

Table 1.
Ground motions utilized in this study (re-produced from Ashasi-Sorkhabi and Mercan [43]).
3.6. Analytical and Experimental Substructures
In this study, a single-story shear building equipped with a large-scale TLD was tested using the RTHS platform explained in Section 3.2 and Section 3.3. The main structure, herein called the analytical substructure, was modeled numerically in a computer, and the TLD was tested physically (experimental substructure) in the lab.
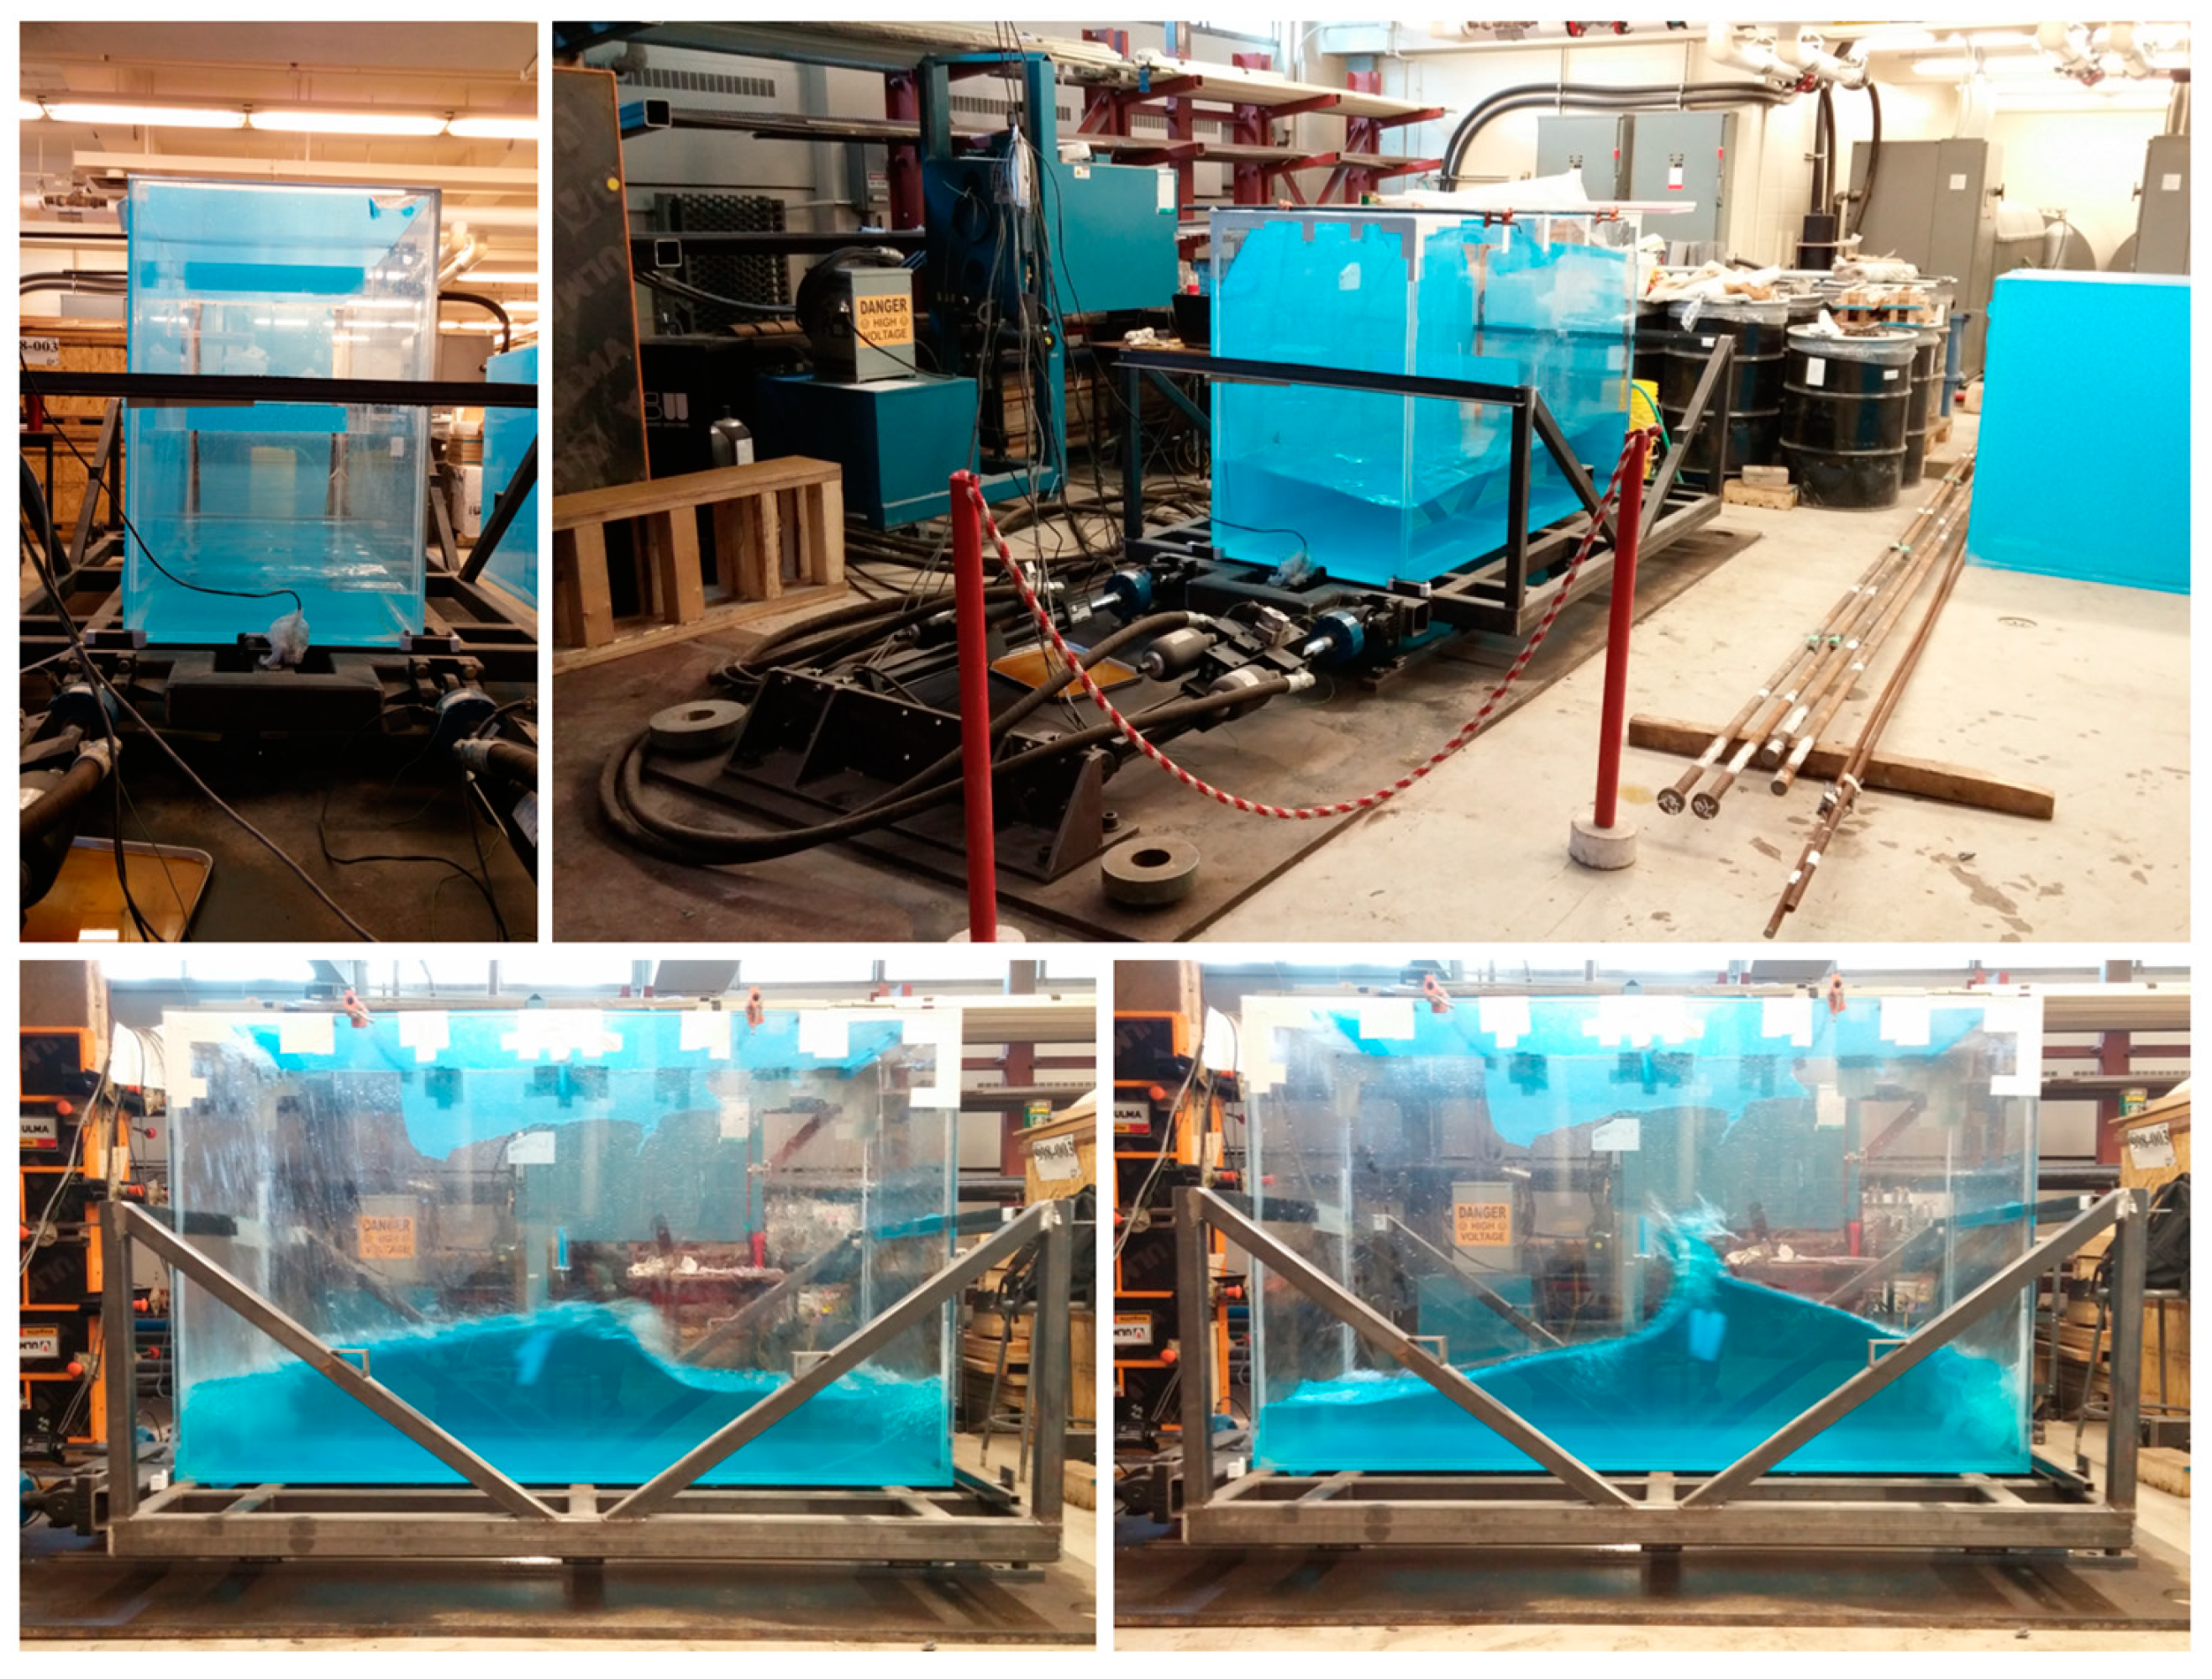
A large-scale water tank with dimensions shown on Table 2 was constructed from ¼ inch-thick transparent plexiglass sheets and was used as the experimental TLD during the RTHS experiments. To the best of authors’ knowledge, this experimental water tank is the largest TLD that has ever been tested in a lab environment to study the structure-TLD interaction. The height of the water in the tank was adjusted such that its sloshing frequency was tuned to the natural frequency of the analytical substructure. Equation (2) is employed to obtain the sloshing frequency of rectangular TLDs [13].
where L, hw, and g are the tank length, water height, and acceleration of gravity, respectively. In this study, the TLD was filled with 300 mm of water that resulted in a sloshing frequency of 0.418 Hz. Table 2 summarizes the geometrical and sloshing characteristics of the TLD.
Table 2.
Characteristics of the experimental substructure (TLD) (re-produced from Ashasi-Sorkhabi and Mercan [43]).
A total of six single-degree-of-freedom (SDOF) structures with properties shown in Table 3 were considered as the analytical substructure. The properties of the main structure in different cases are designed such that three TLD/structure mass ratios of 1%, 3%, and 5% could be obtained. In the first three cases shown on Table 3, the main structure is modeled with linear stiffness assumption in the lateral direction, and in the last three, the single-story buildings are modeled as elastic–perfectly plastic systems with a mass M, lateral stiffness, Kf, and yield strength, Vy. The inherent damping, C, of the analytical substructure is computed assuming a 2.0% damping ratio. The properties of the nonlinear structures are set so that, in all three cases, the structure yields when the roof displacements reach 55 mm.
Table 3.
Structural properties of the analytical substructure (1-storey structure).
Figure 2 shows the schematic of the RTHS experiments carried out in this study. During the tests, the TLD was physically isolated and tested on the shake table, serving as the experimental substructure in the RTHS. It represents a portion of the building’s roof. Meanwhile, the remaining structure was simulated numerically within the real-time controller. In each iteration of the outer control loop, displacement commands were computed and applied to both the analytical and experimental substructures. Following this, the restoring forces obtained from the TLD and computed for the analytical substructure were utilized to generate the subsequent command. To simulate the effects of ground motion records on the test structure, corresponding effective floor forces were computed and applied laterally during the experiments. Four experiments were conducted per each of the ground motions: structure without TLD, structure with TLD with a 1% mass ratio, structure with TLD with a 3% mass ratio, and structure with TLD with a 5% mass ratio. Throughout all the experiments conducted in this study, ground accelerations were scaled enough to achieve a peak roof displacement of approximately 80 mm in the uncontrolled structure. A picture of the actual specimen (experimental substructure) is shown in Figure 3.
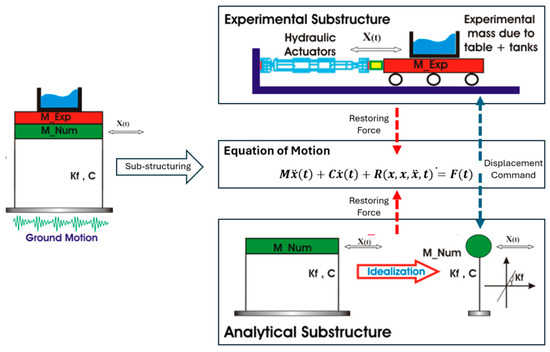
Figure 2.
Schematic view of the RTHS test setup.

Figure 3.
Experimental substructure.
4. RTHS of Linear/Nonlinear SDOF Equipped with Large-Scale TLD Subjected to Seismic Loading
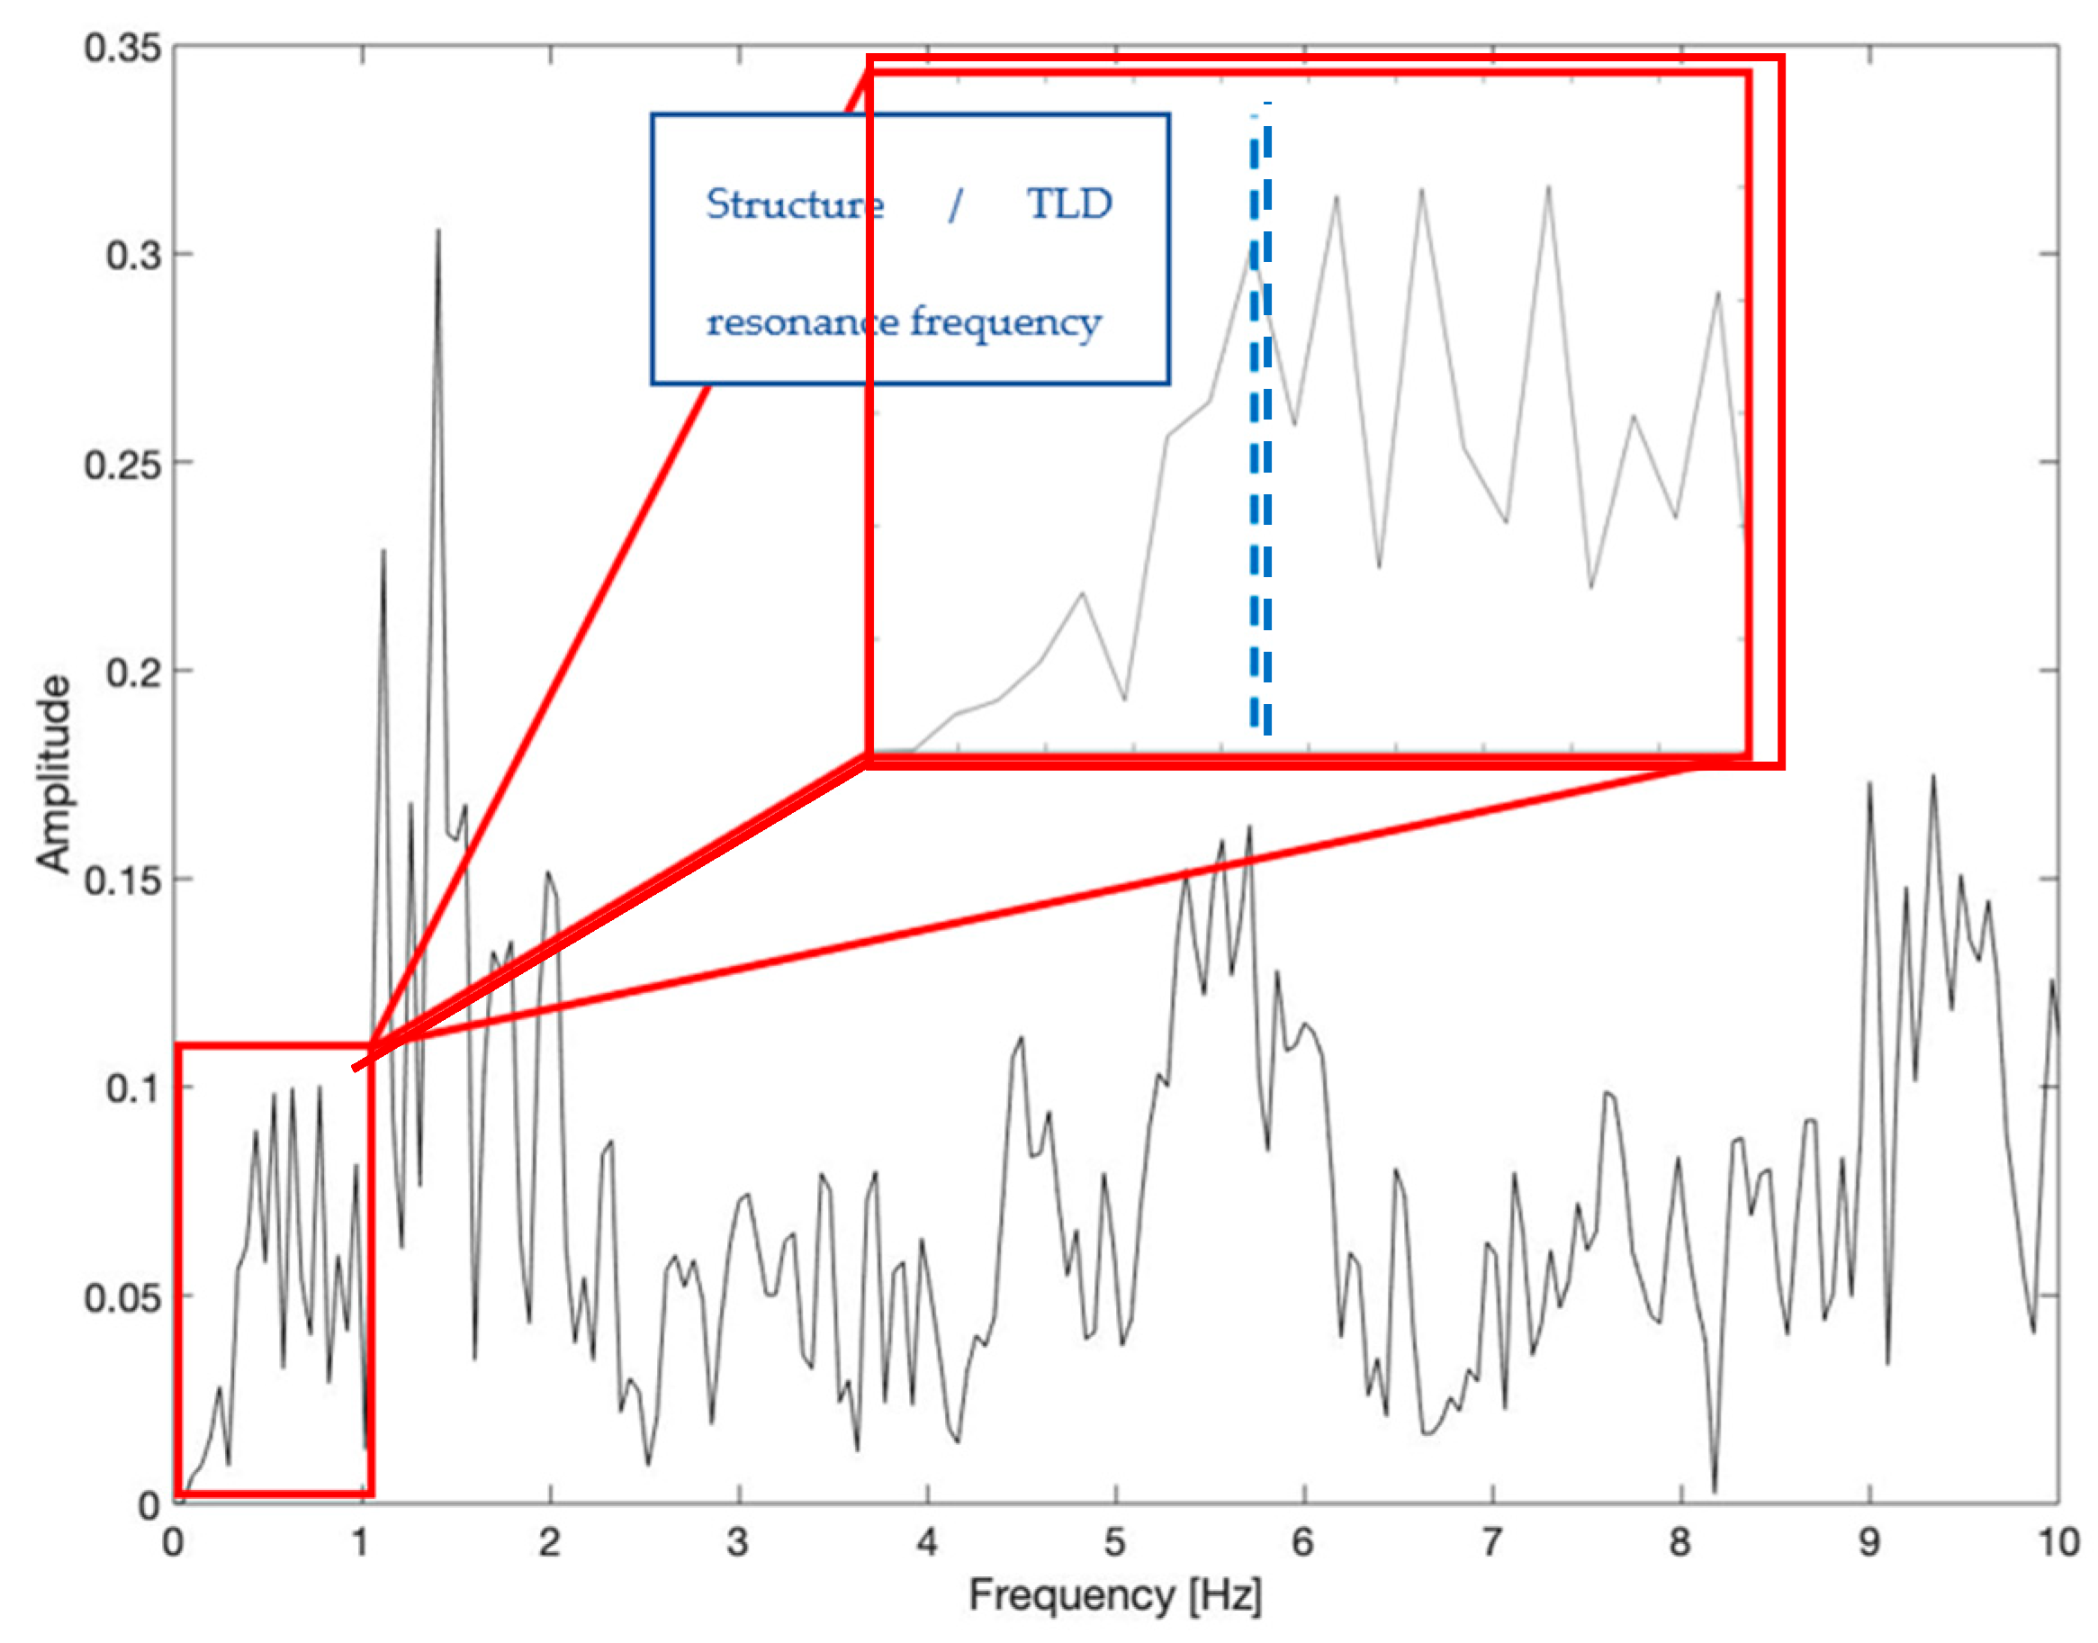
This section presents the RTHS experiment results on the seismic performance of SDOF structures equipped with a large-scale TLD on the roof. For completeness, multiple frequencies were investigated; however, since the TLDs are only tuned to the resonance of 0.418 Hz, only those results are considered. Here, for brevity, only a representative sample of the more than 30 tested configurations is presented. The results corresponding to EQ2 (i.e., Nahanni 1985), and resonance are provided; however, the entire performance envelope for all tests are presented at the end of each section. In Figure 4, the time history of the ground motion is provided, along with its Fast Fourier Transform (FFT) in Figure 5.
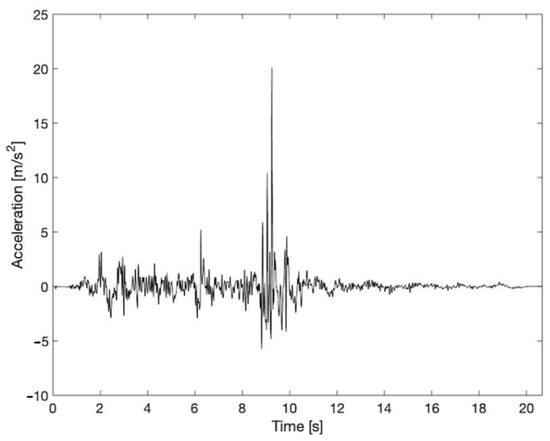
Figure 4.
Time history of the 1985 Nahanni Earthquake.
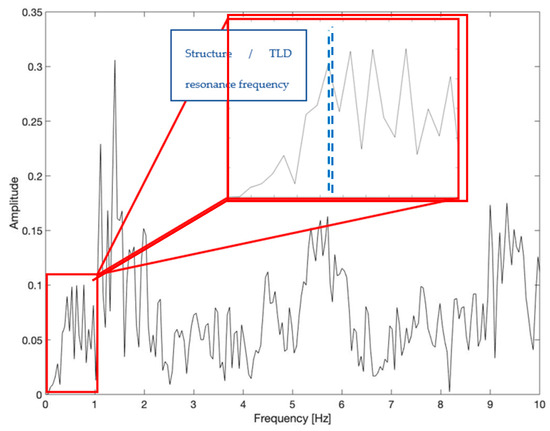
Figure 5.
FFT analysis of the 1985 Nahanni Earthquake, with an enlarged view focusing on frequencies below 1 Hz, encompassing the structural and sloshing frequencies.
5. Linear Substructure Results
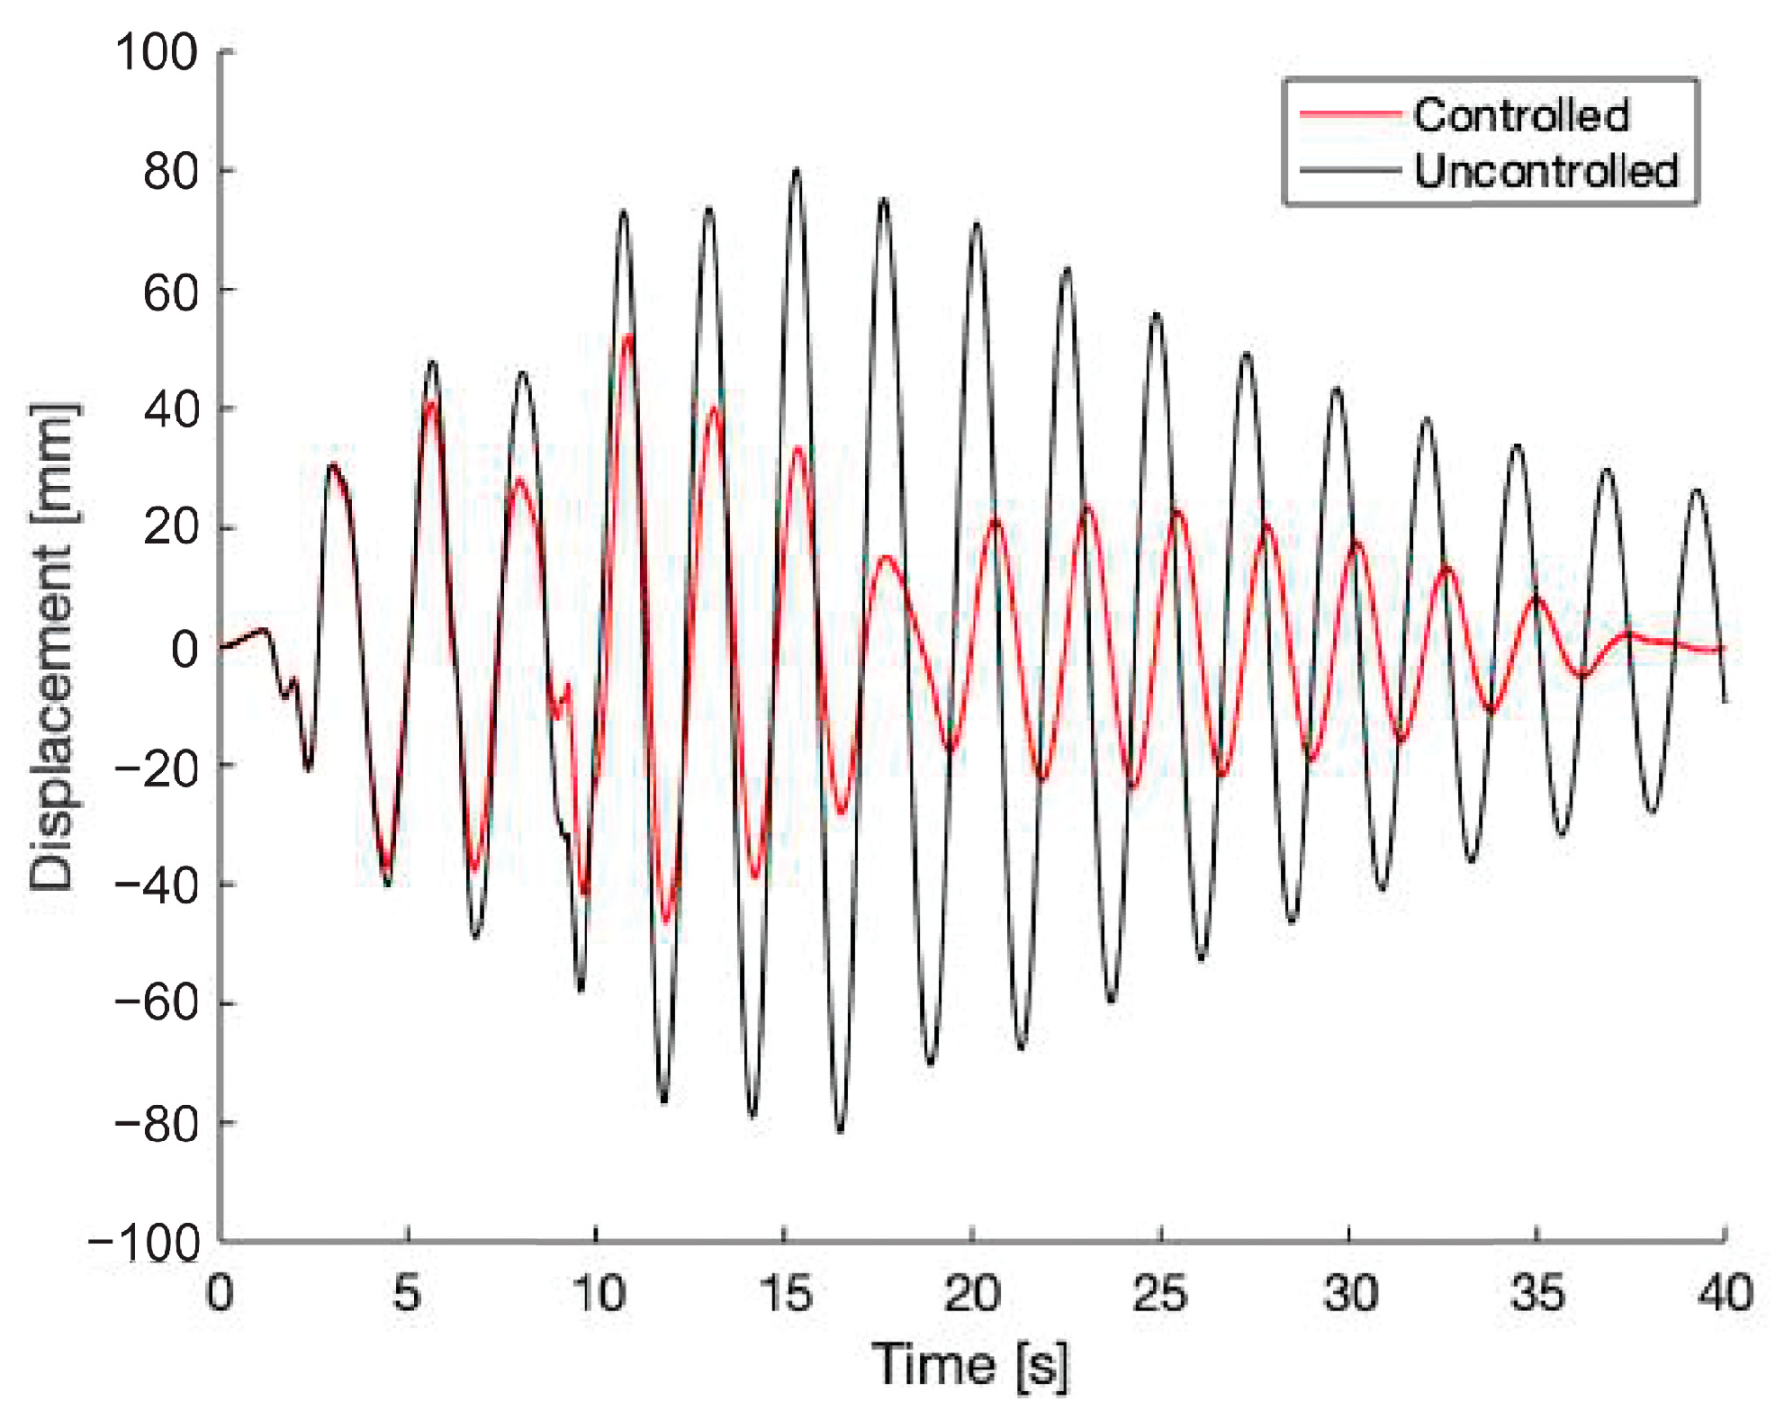
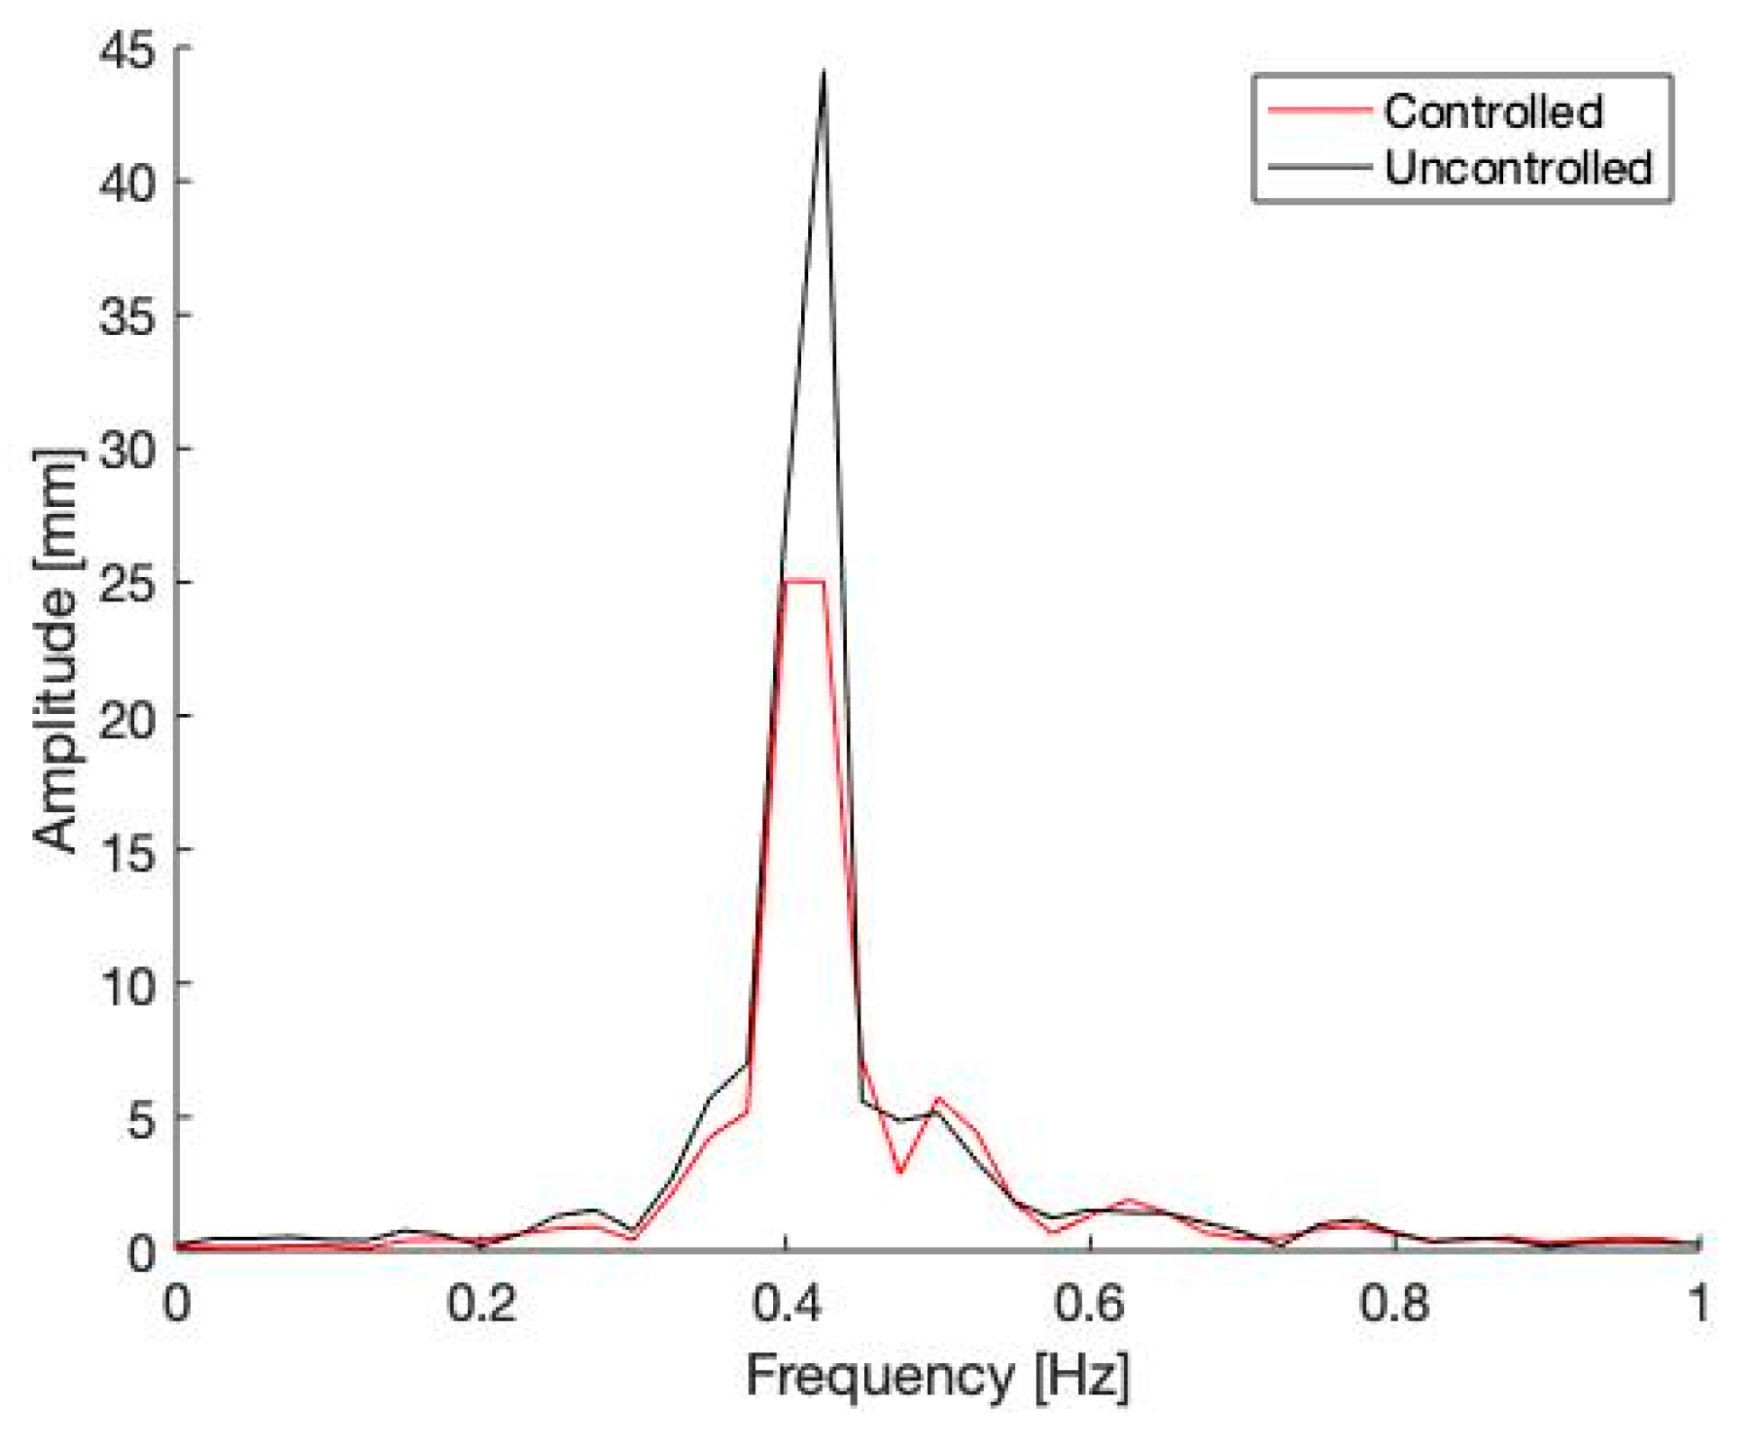
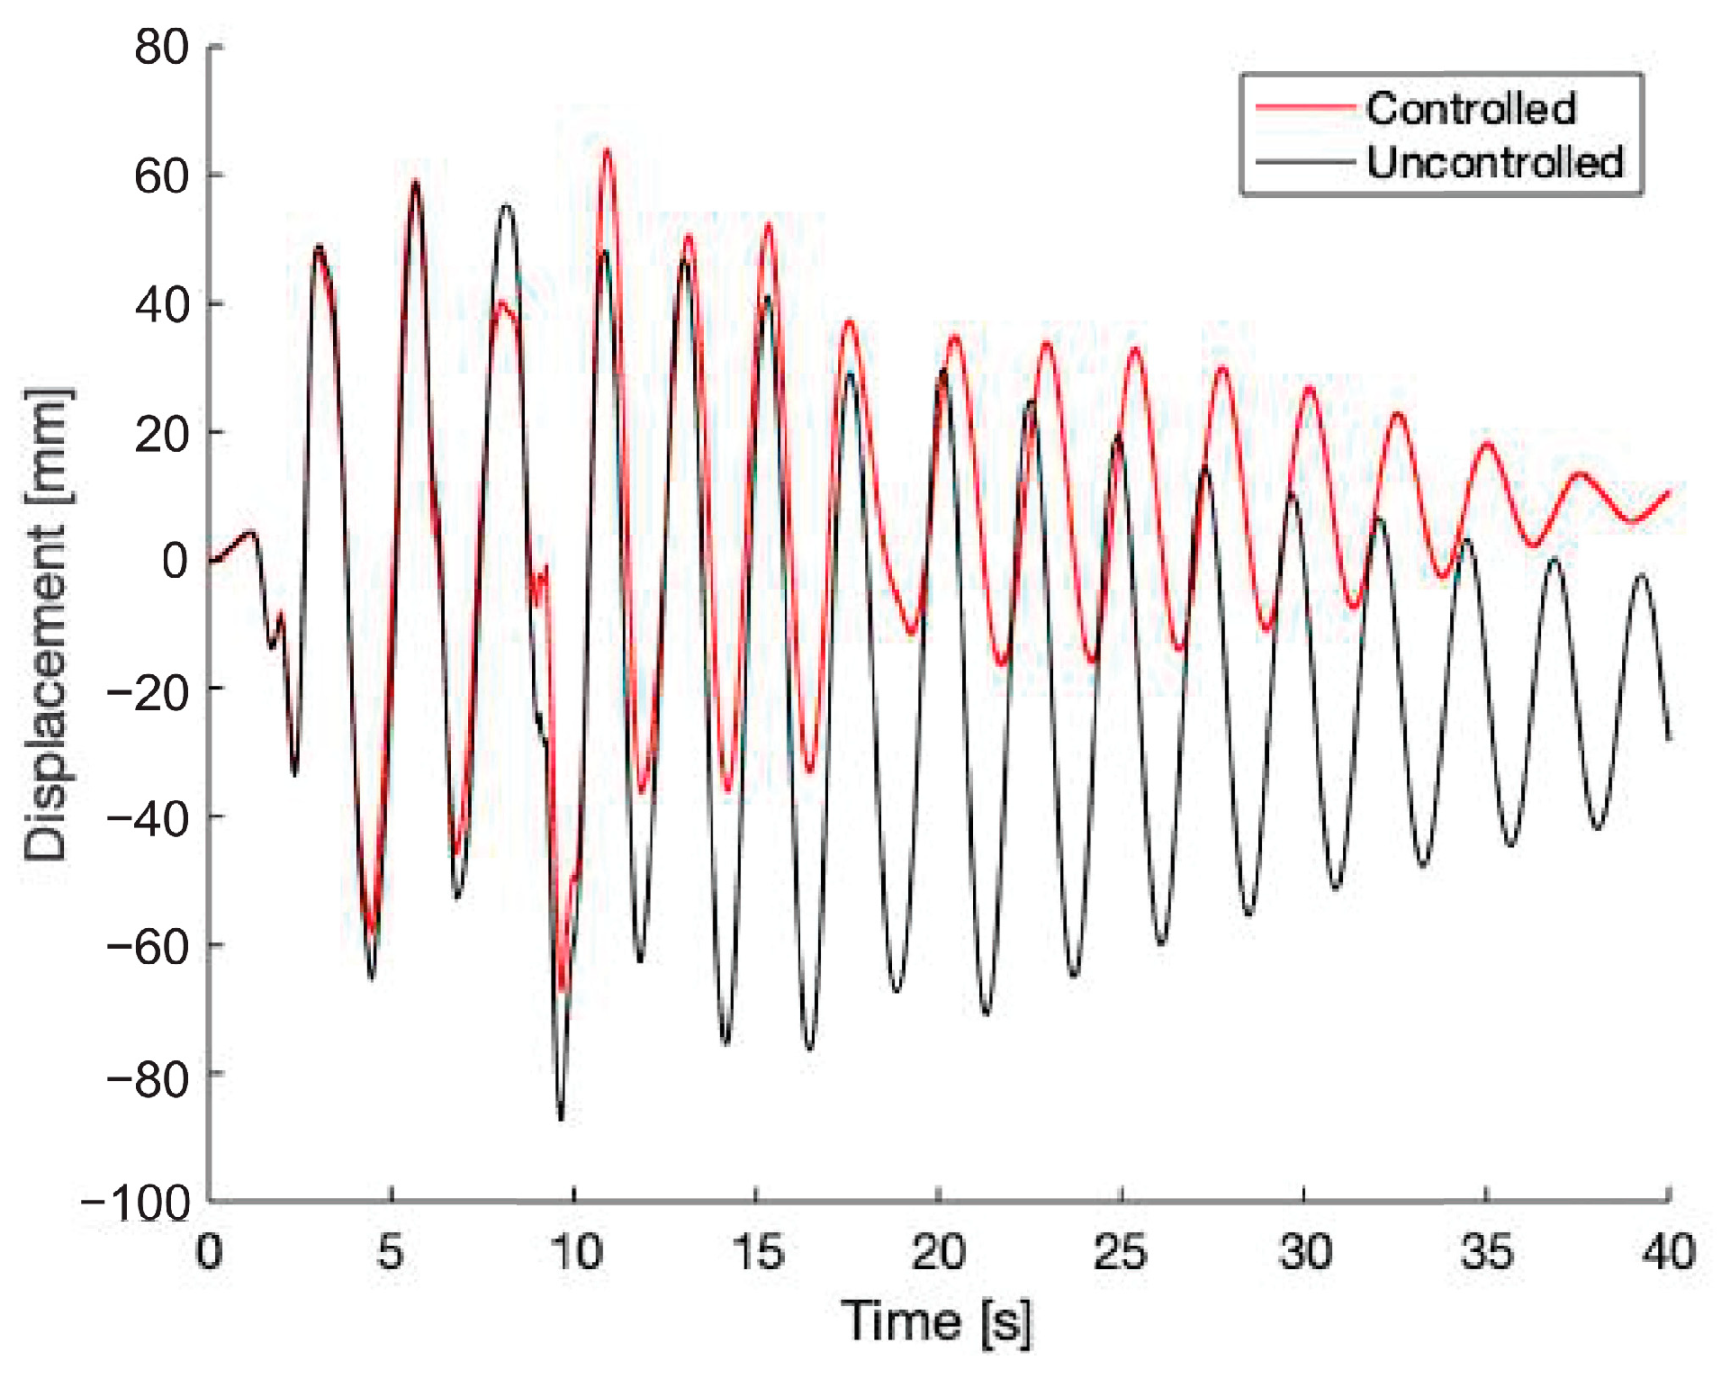
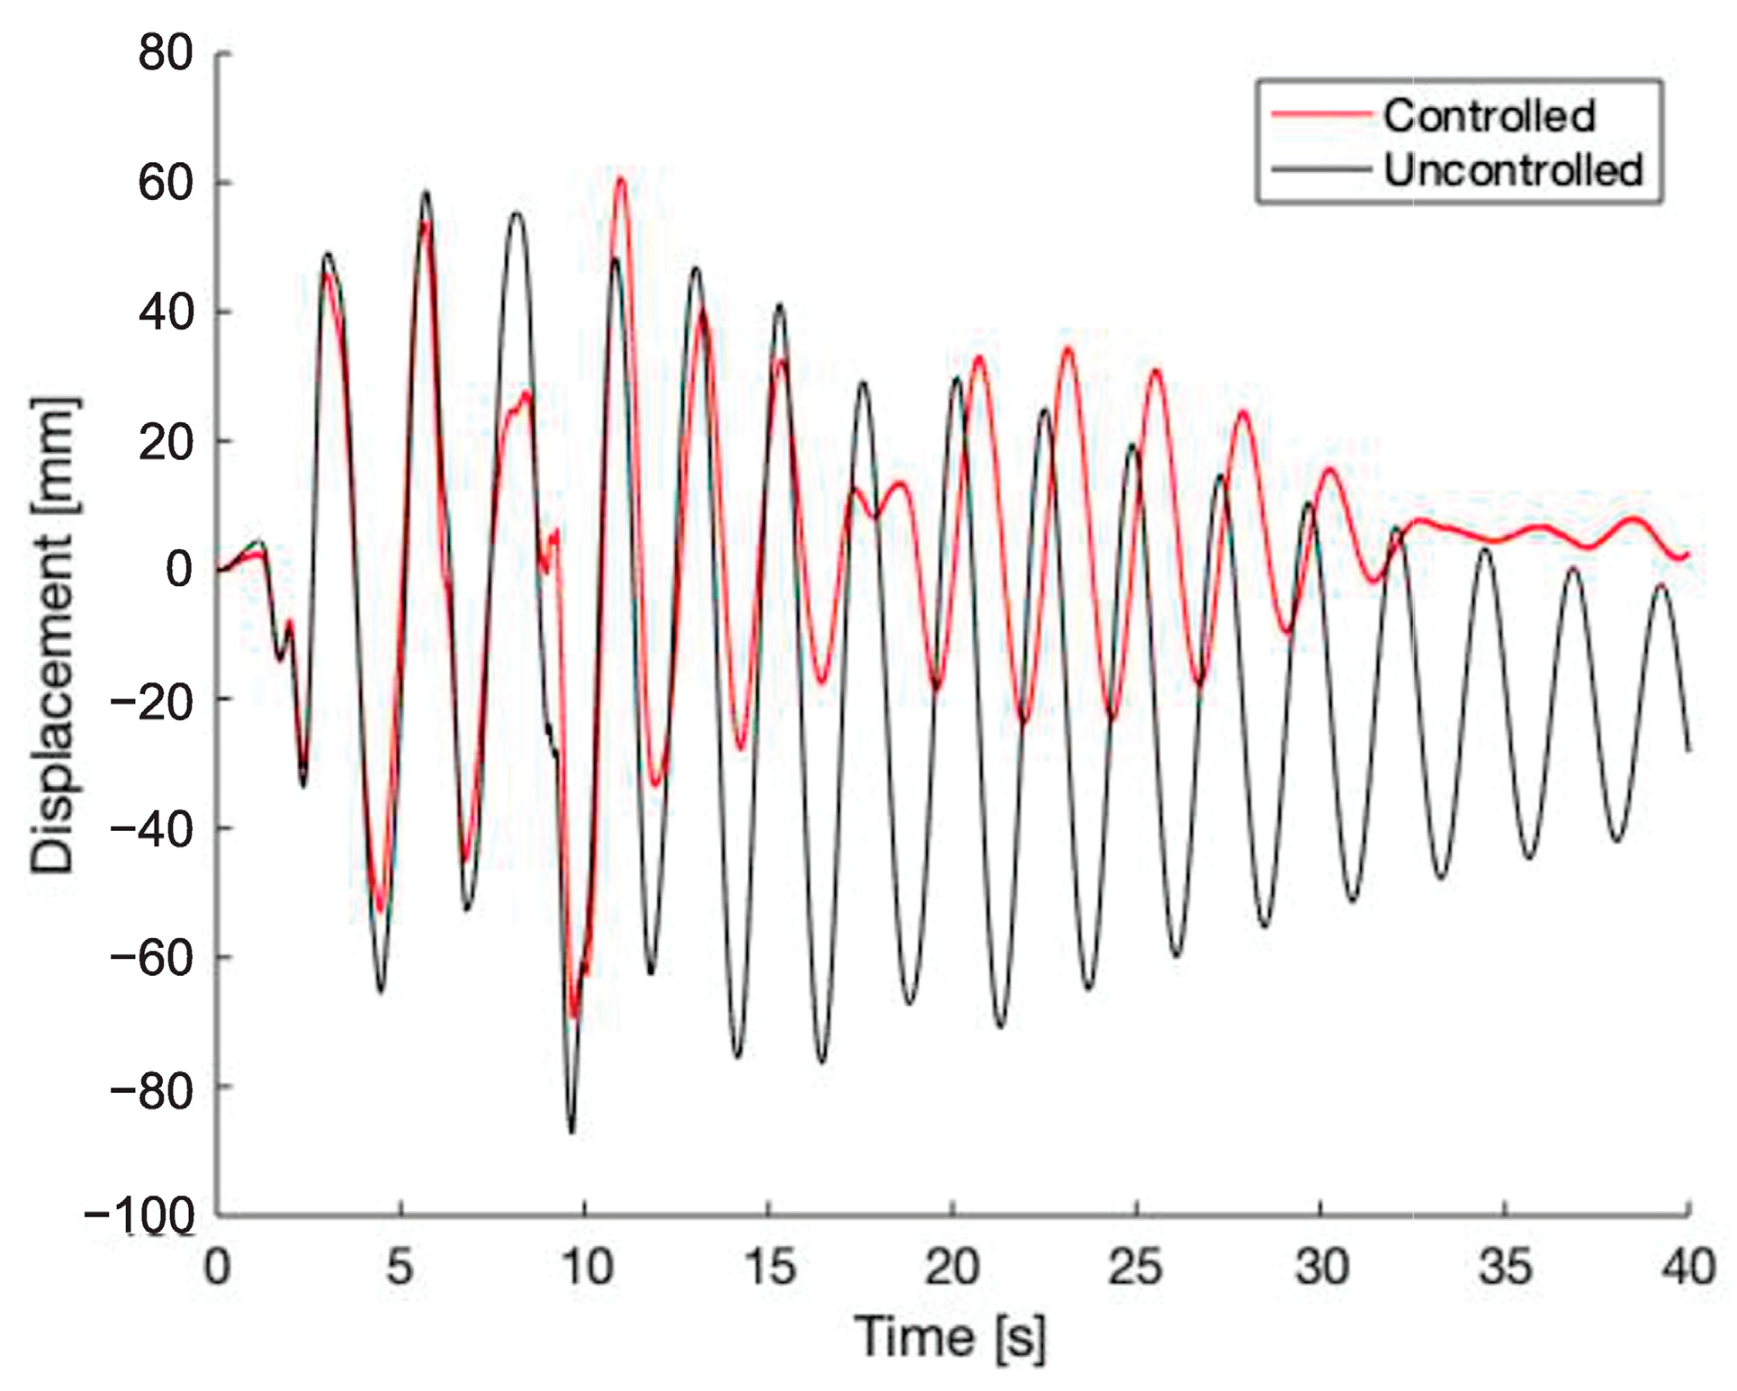
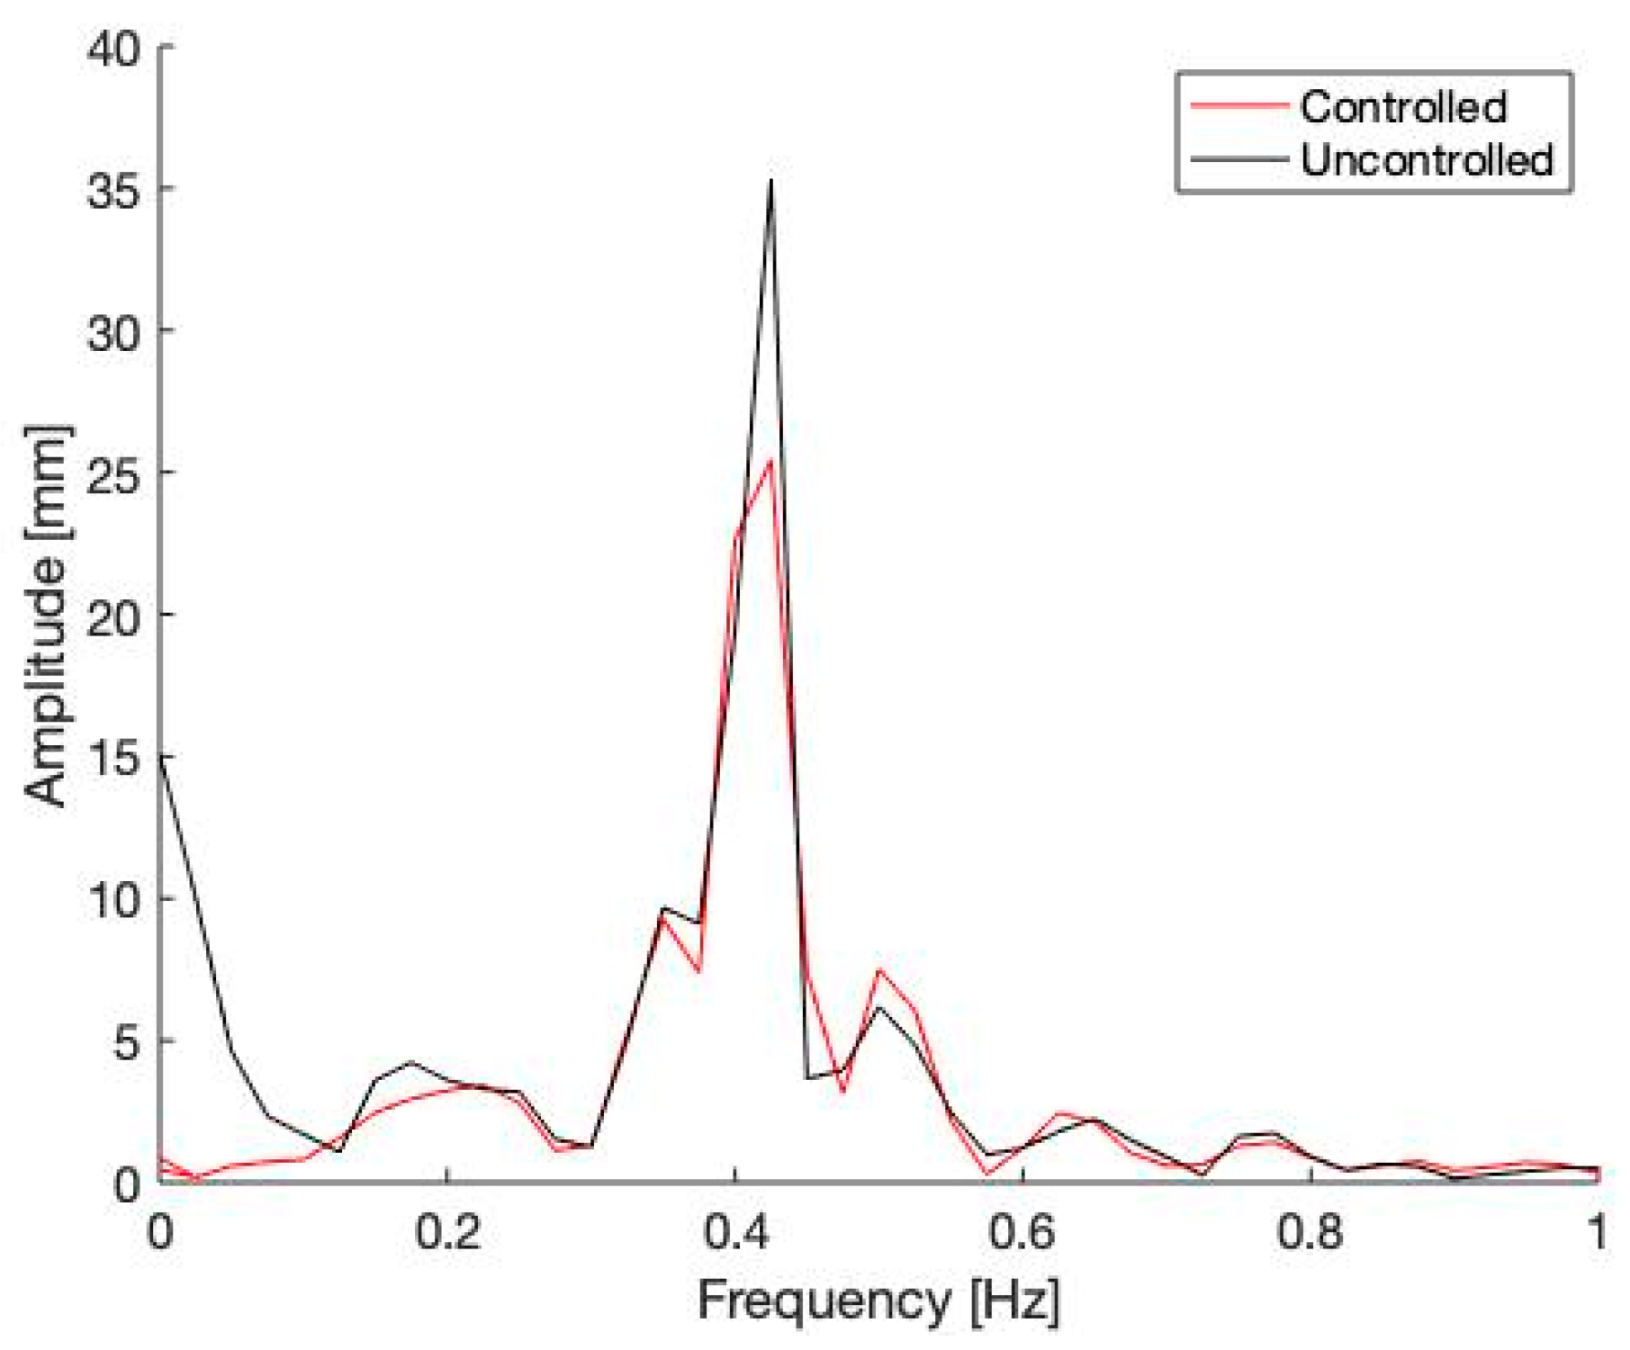
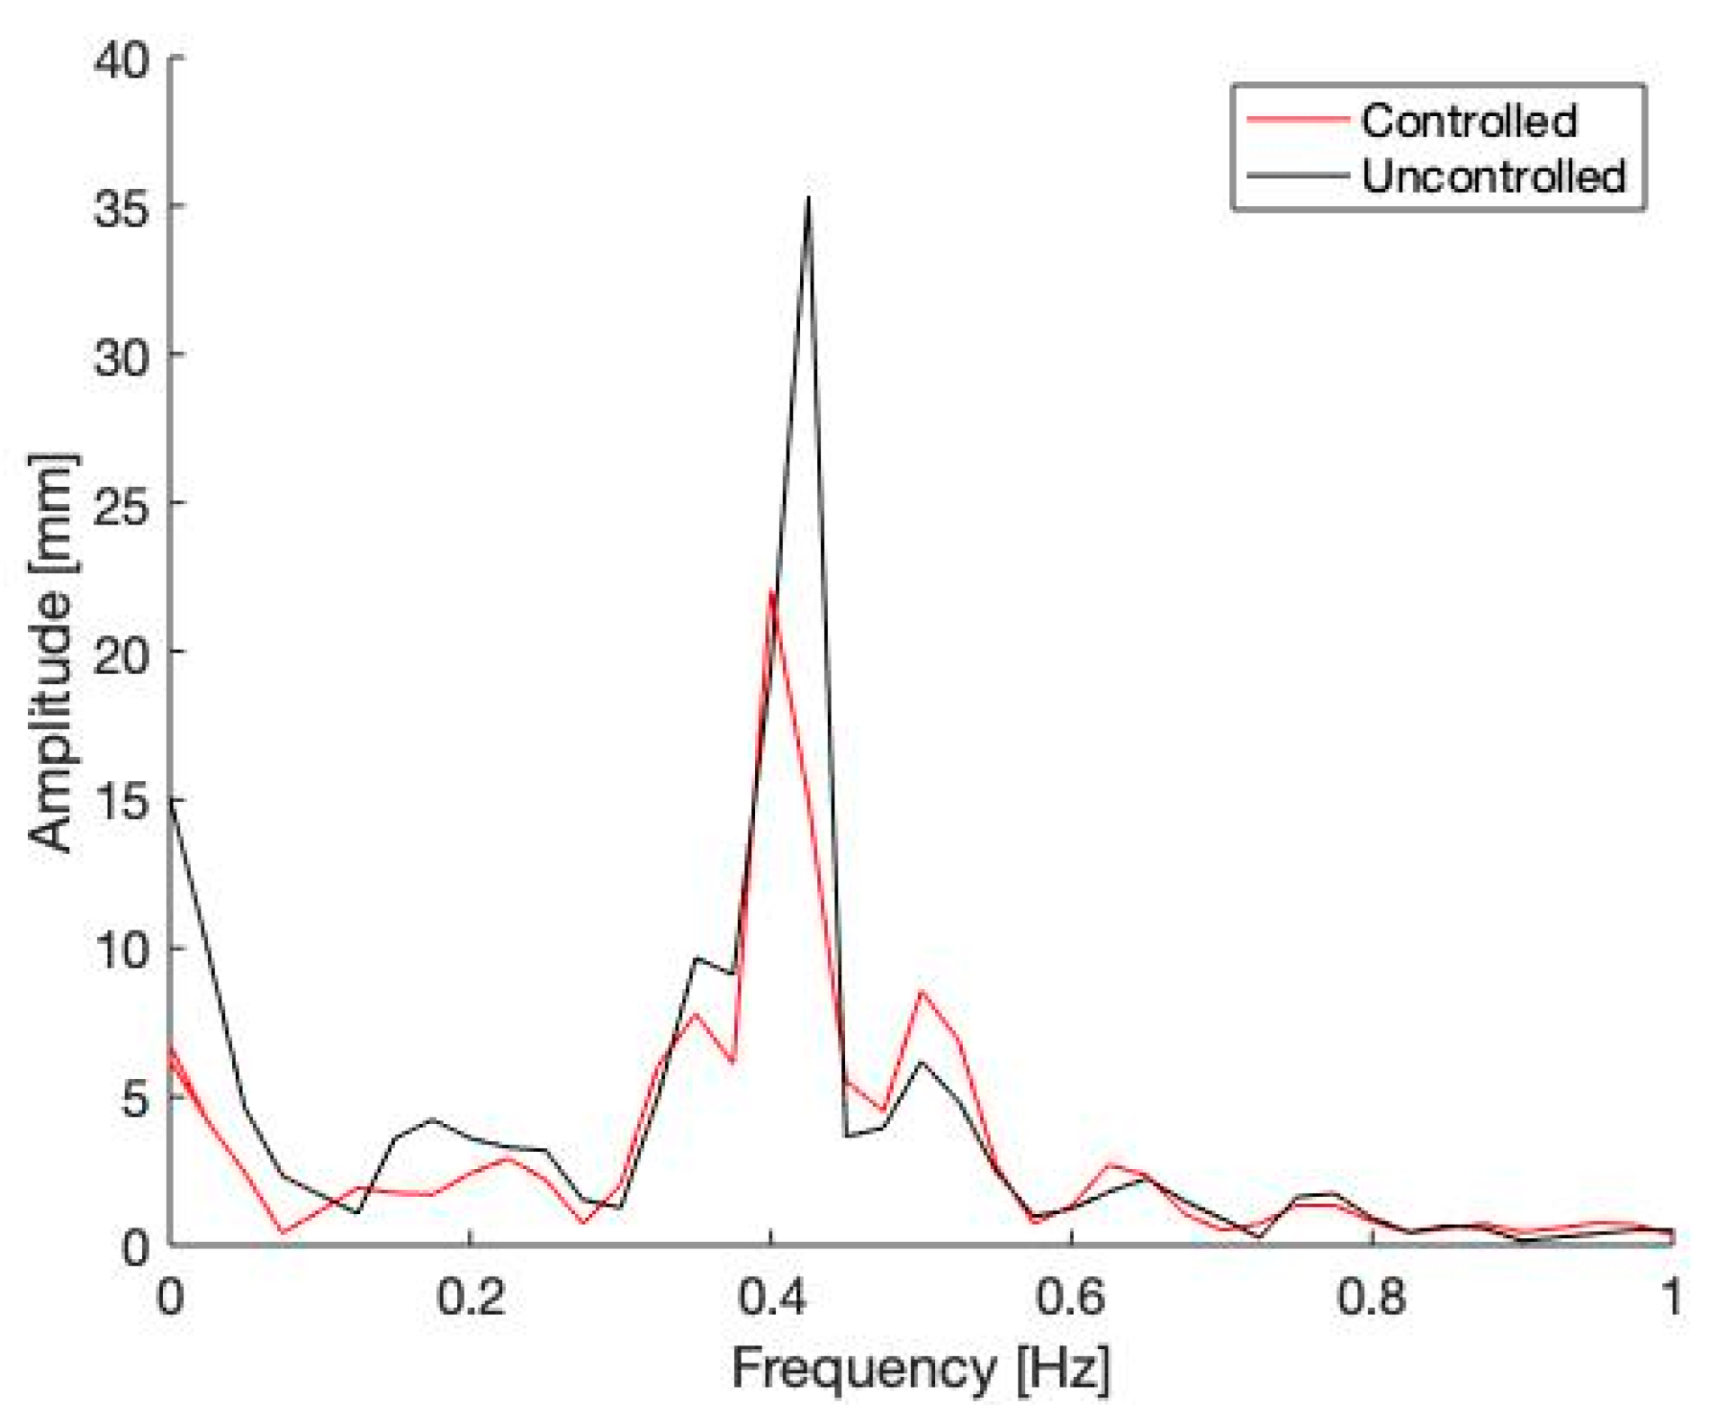
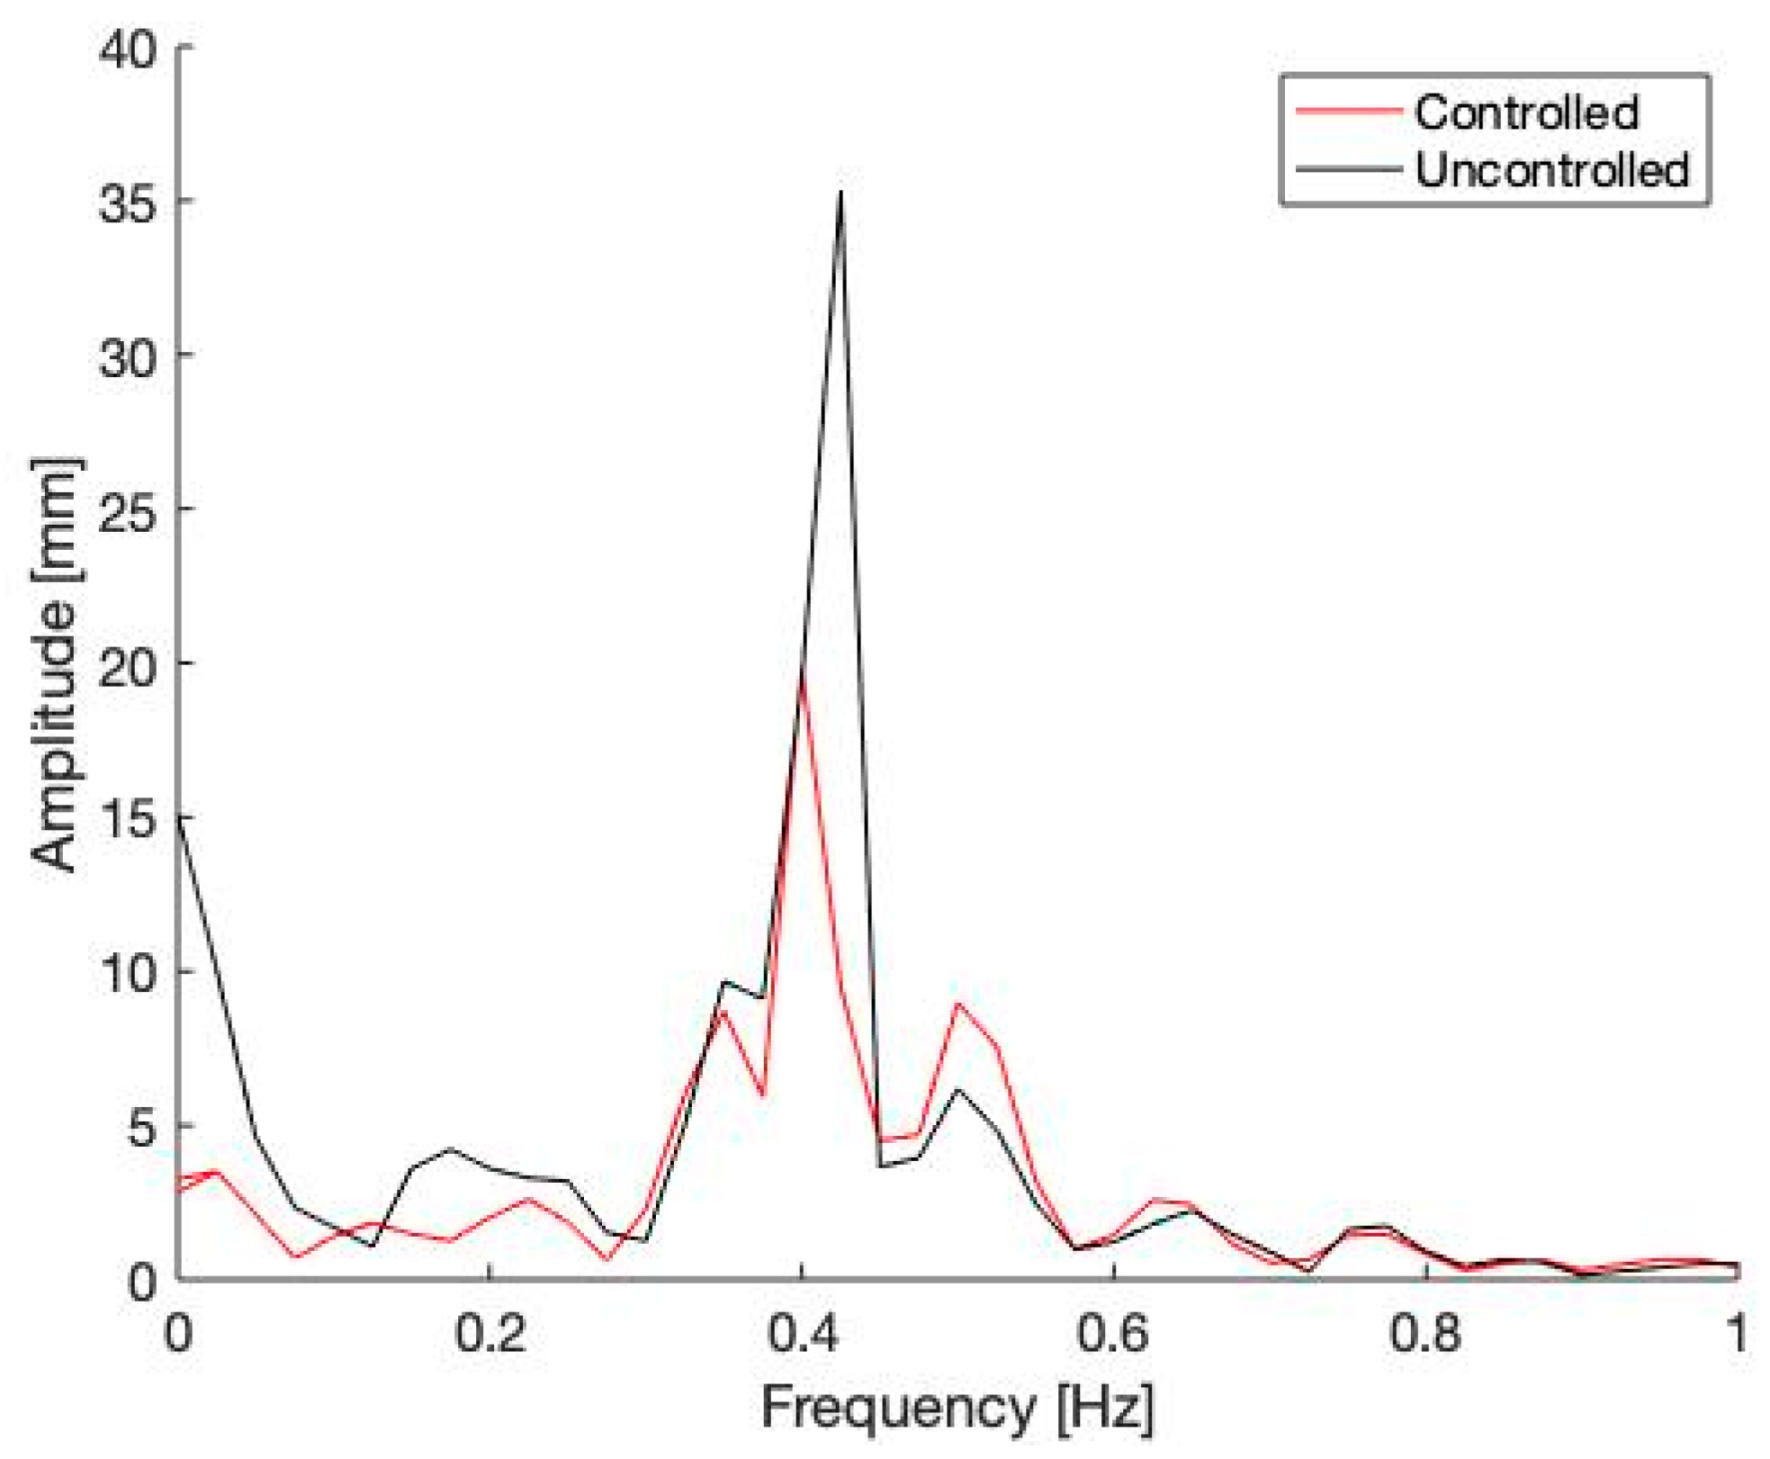
Multiple RTHSs were conducted for each earthquake event detailed in Table 1. These simulations were carried out using a linear structure with three distinct mass ratios: 1%, 3%, and 5%. Before summarizing all the results as trend charts, to illustrate the reduction in displacements in both the time and frequency domains, Figure 6, Figure 7, Figure 8, Figure 9, Figure 10 and Figure 11 specifically focus on the Nahanni Earthquake, showcasing the influence of varying mass ratios of the TLD. Specifically, reductions of 19%, 36%, and 43% were recorded for the respective mass ratios of 1%, 3%, and 5%. The root mean square (RMS) values were also calculated for each of the tests. The RMS of the displacements were reduced by 30%, 53%, and 63% respectively for each of the three mass ratios. Furthermore, each RTHS test was extended by 20 s beyond the duration of the ground motion to analyze the amplitude reduction in the free vibration region. The results indicate significant reductions in amplitude in the controlled response compared to the uncontrolled response across the free vibration region. Specifically, these reductions were 56%, 94%, and 99% for the mass ratios of 1%, 3%, and 5% respectively. To further assess the impact of the TLDs, FFT analysis was conducted on the obtained results. This analysis revealed reductions in the FFT spectrum amplitude of 36%, 47%, and 56% for the Nahanni Earthquake simulations. These findings indicate the positive effects of increasing mass ratios on various performance indicators.
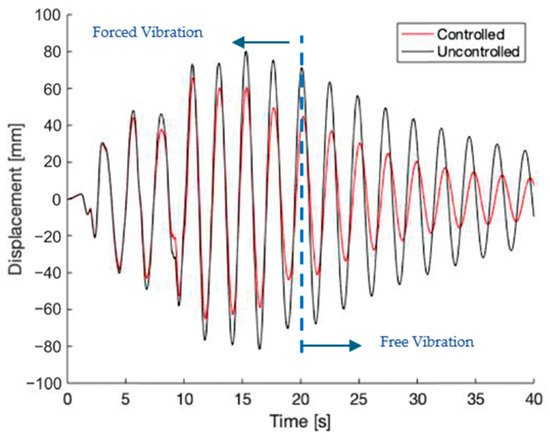
Figure 6.
Structural displacement response history for EQ#2-MR1%—0.418 Hz (Linear Substructure).
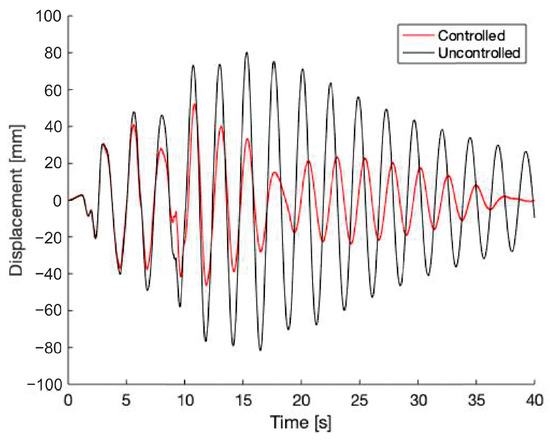
Figure 7.
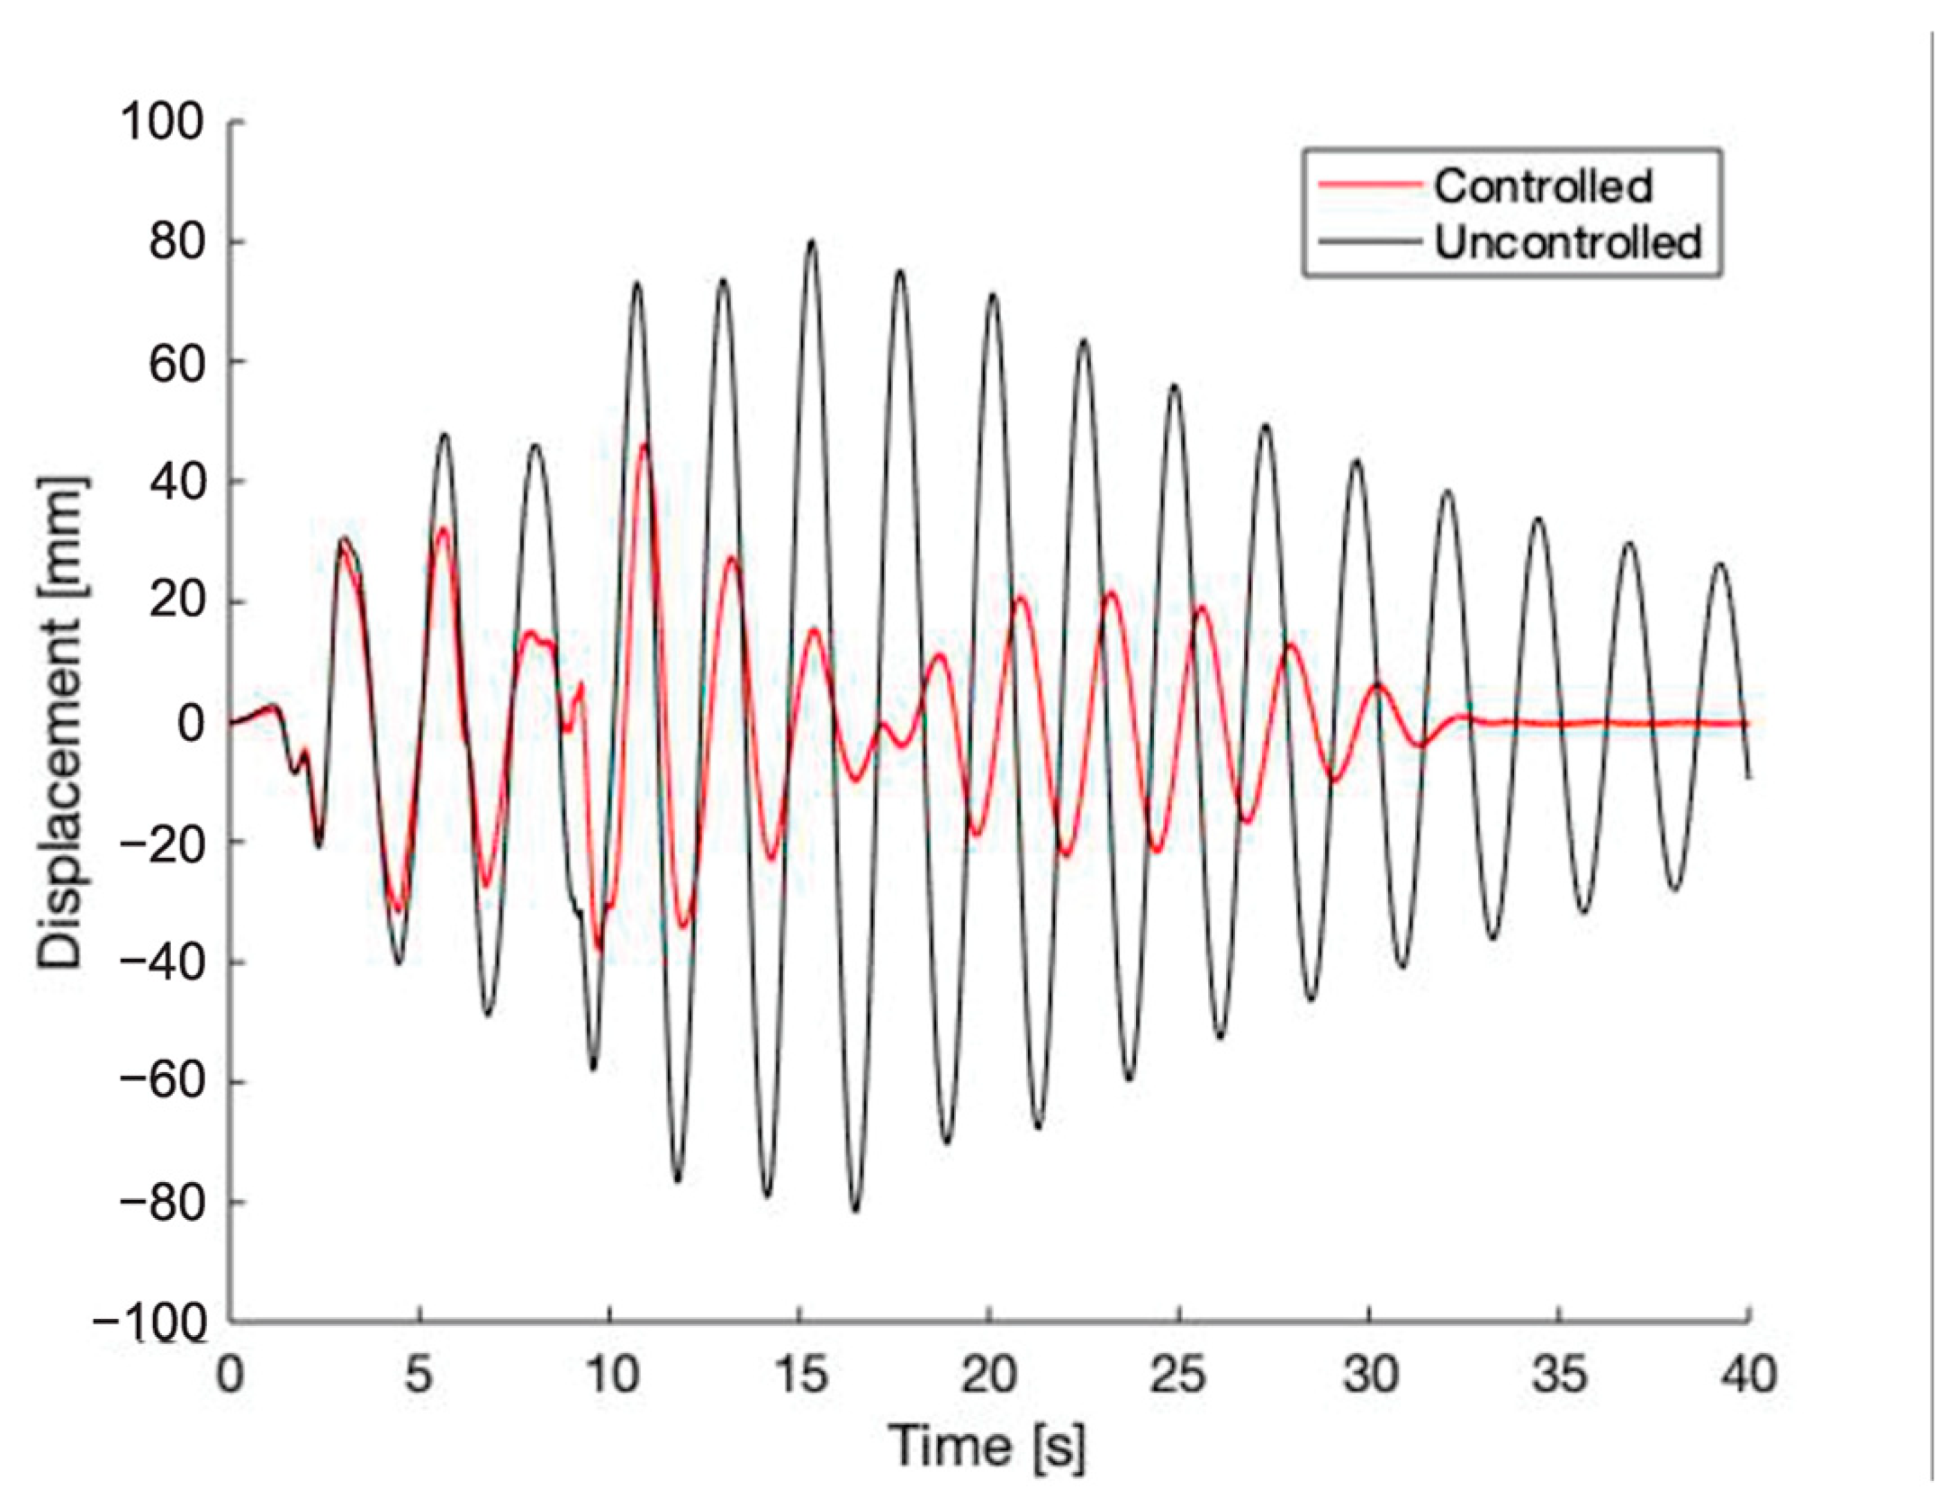
Structural displacement response history for EQ#2-MR3%—0.418 Hz (Linear Substructure).
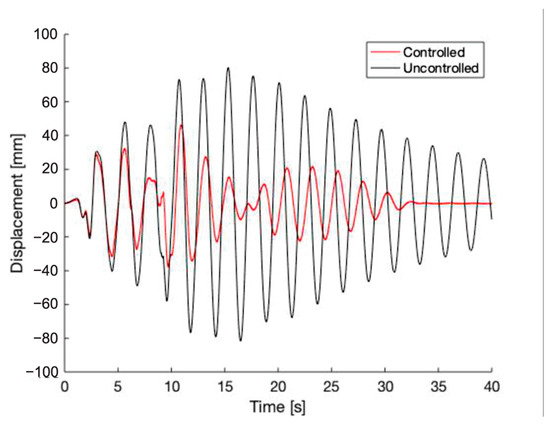
Figure 8.
Structural displacement response history for EQ#2-MR5%—0.418 Hz (Linear Substructure).

Figure 9.
FFT analysis of structural displacement response for EQ#2-MR1%—0.418 Hz (Linear Substructure).
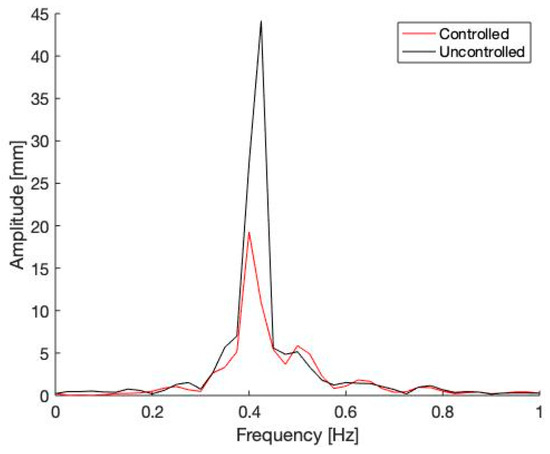
Figure 10.
FFT analysis of structural displacement response for EQ#2-MR3%—0.418 Hz (Linear Substructure).
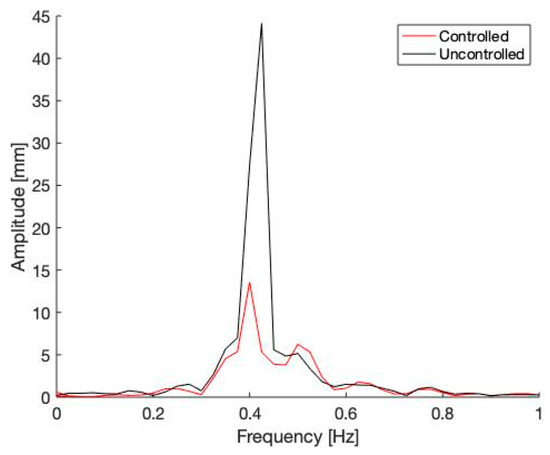
Figure 11.
FFT analysis of structural displacement response for EQ#2-MR5%—0.418 Hz (Linear Substructure).
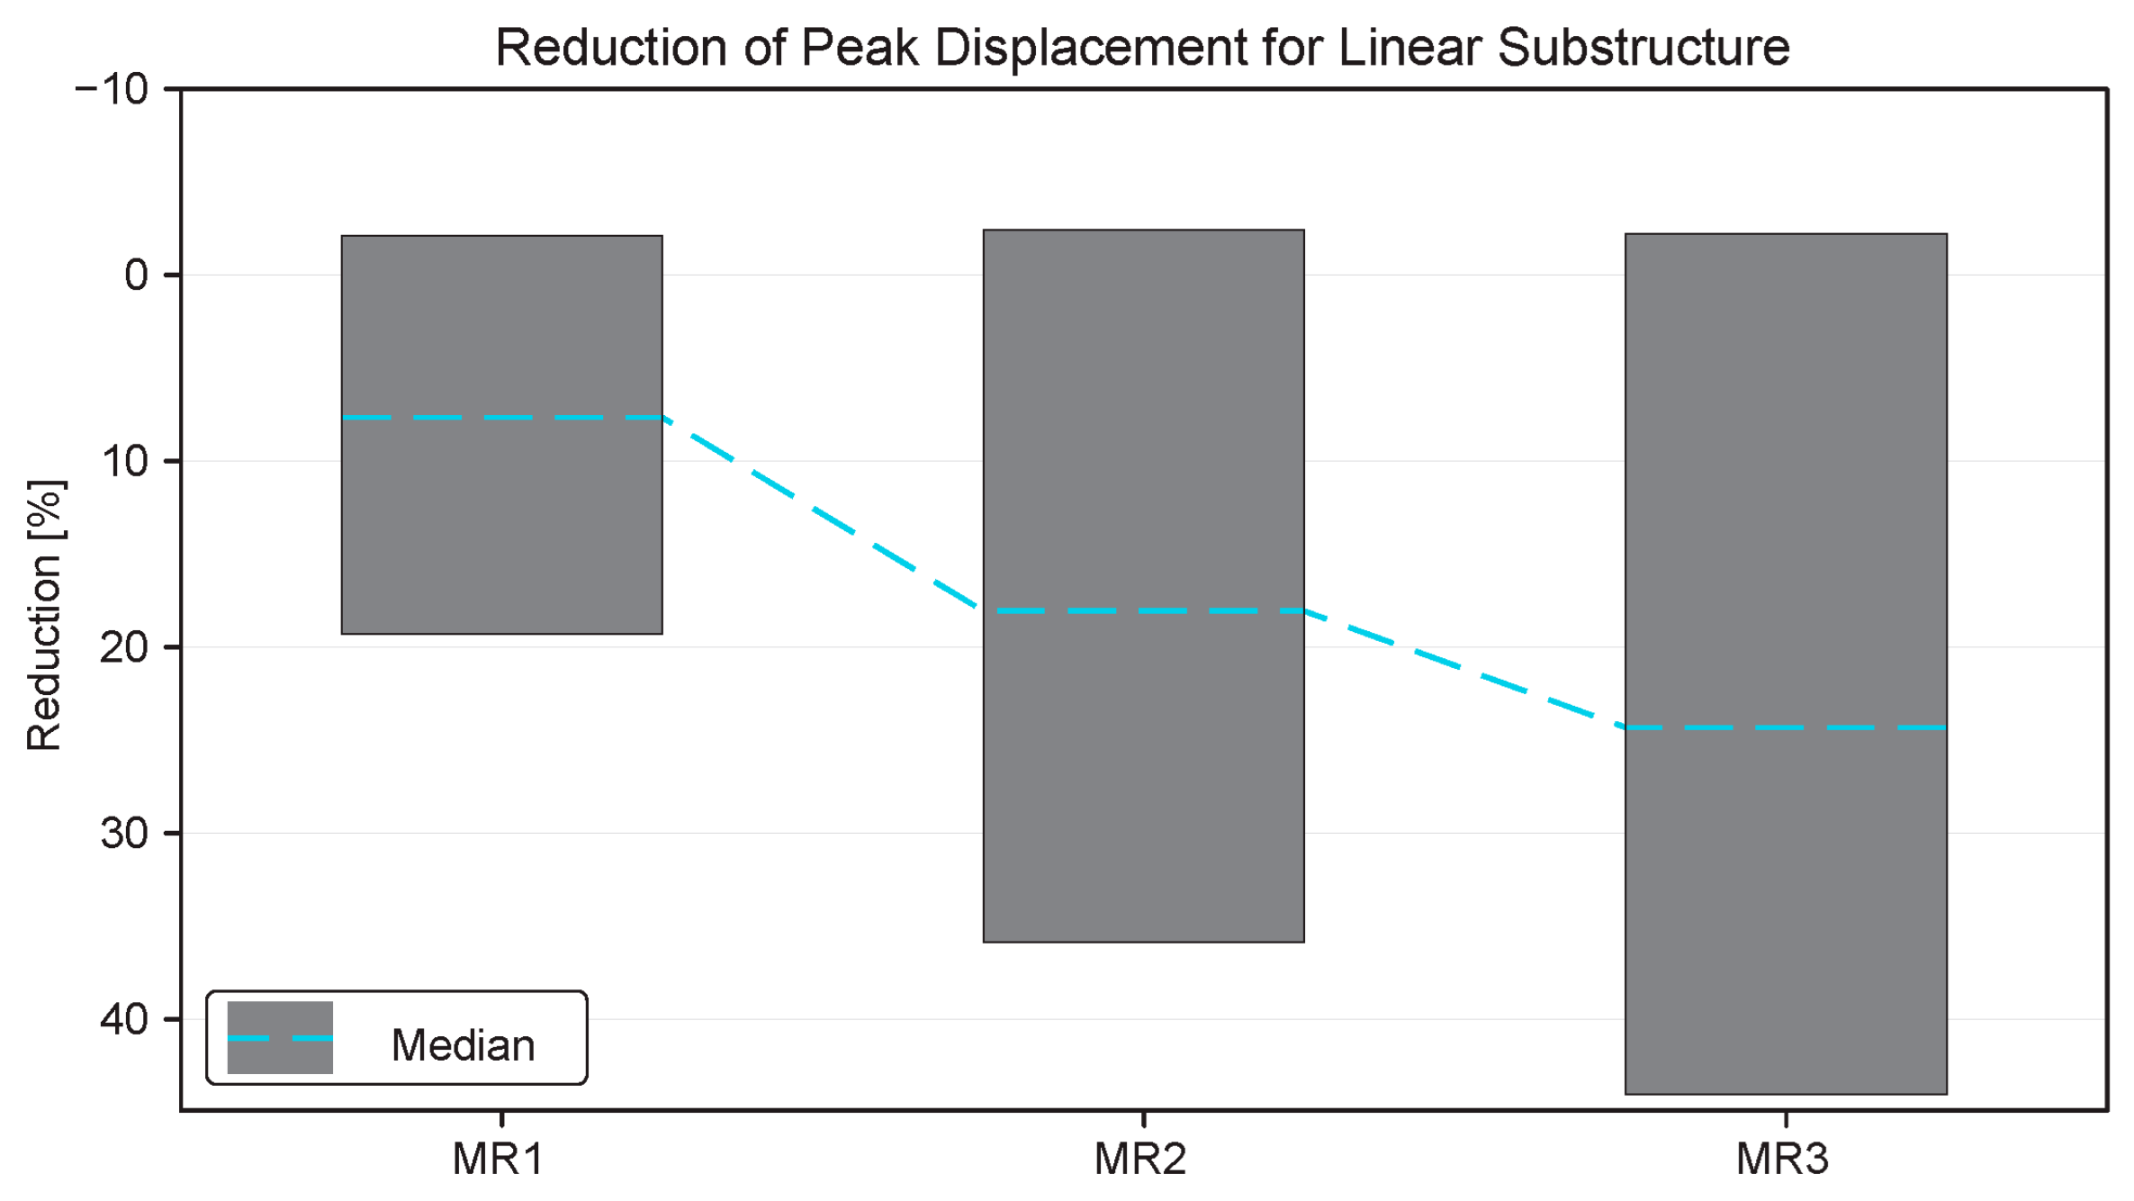
The reductions in peak displacement across all earthquakes were compiled into a trend chart and provided in Figure 12. Analysis of the data reveals that, for a mass ratio of 1%, the effectiveness of the TLD ranges from −2% to 19%. Negative values indicate instances where the peak displacement increased for certain ground motions. Similarly, for a mass ratio of 3%, the effectiveness varied between −2% and 36%, while for a mass ratio of 5%, it ranged from −2% to 44%. The slight increase in peak displacement observed in some scenarios suggests that the TLD may be ineffective under certain ground motion conditions, possibly due to a mismatch between the structural/TLD frequency and the frequency content of the earthquake.

Figure 12.
Peak displacement reduction trend chart for linear substructure.
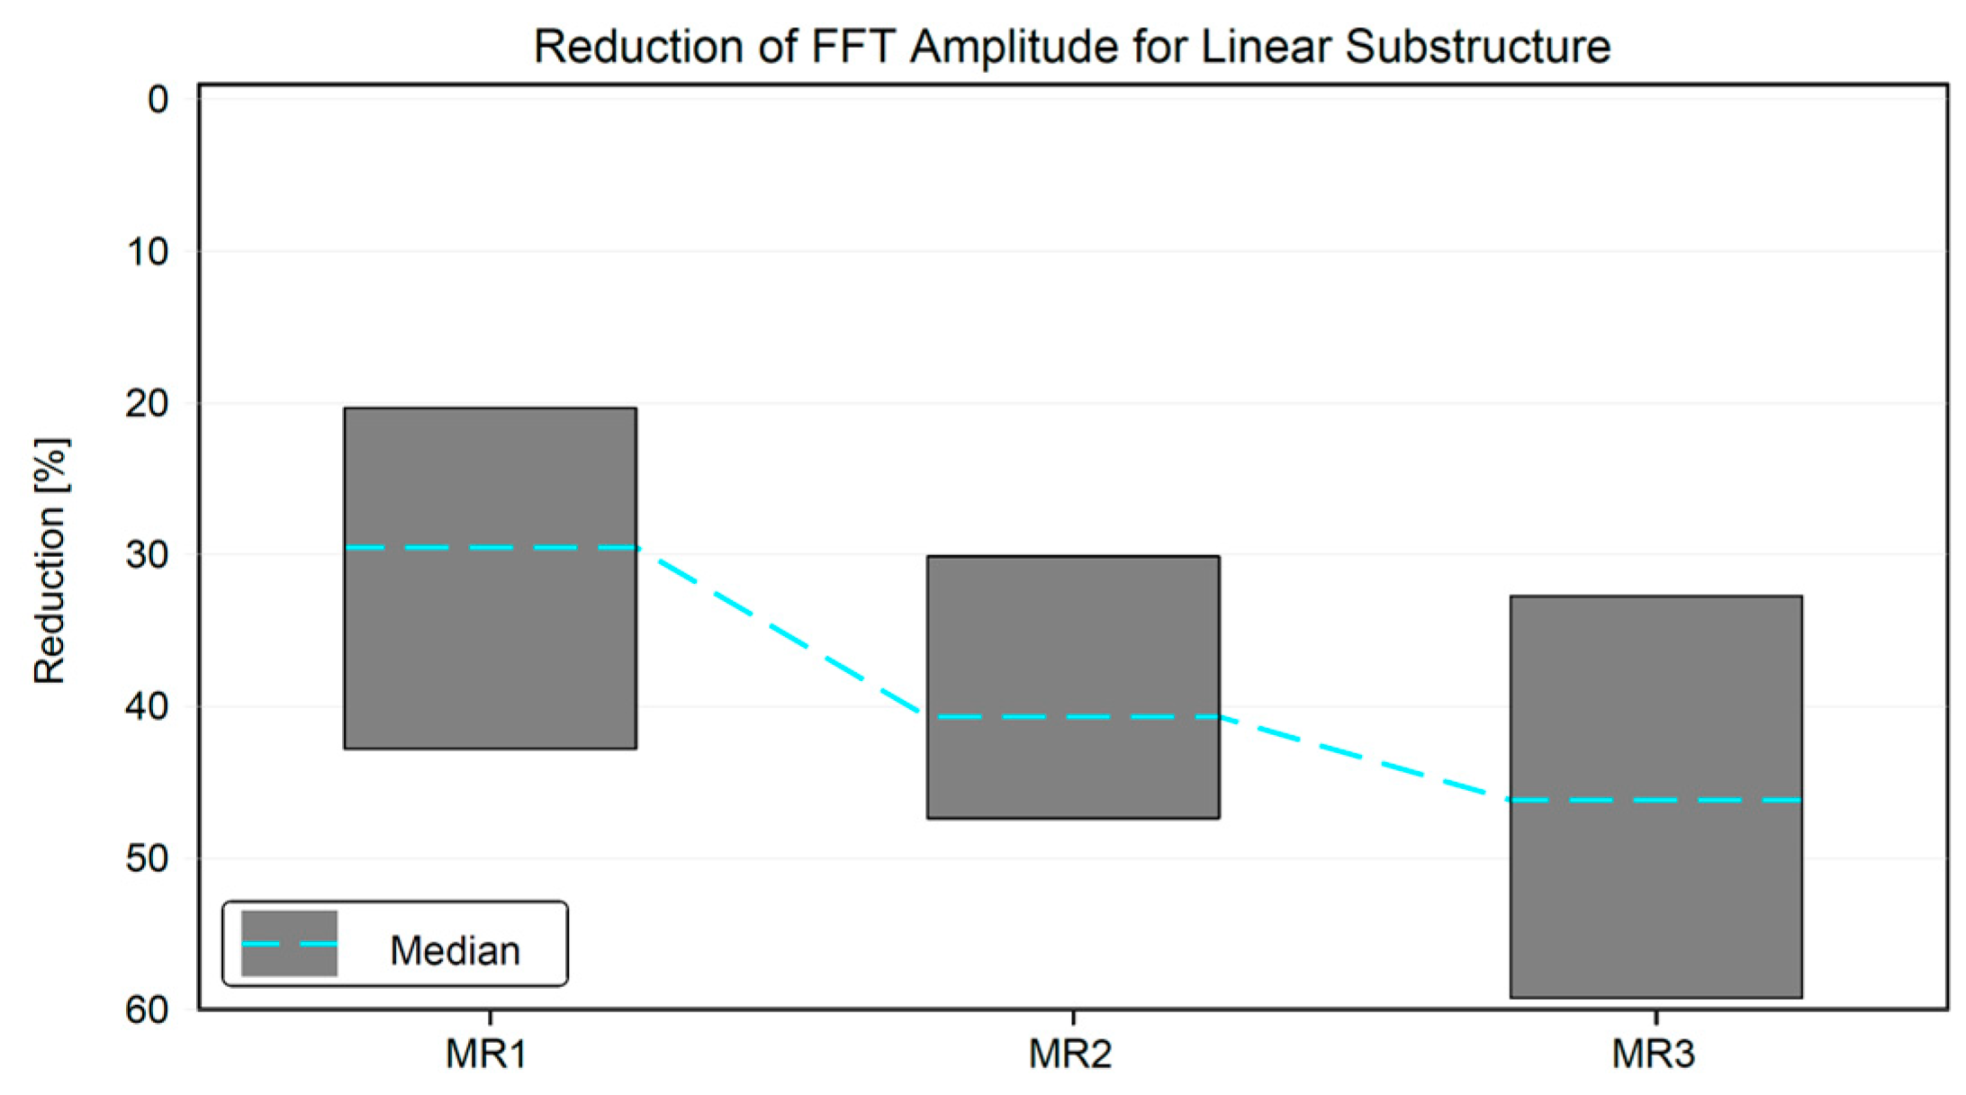
Furthermore, a similar analysis was conducted for the reduction in FFT amplitudes, as illustrated in Figure 13. For a mass ratio of 1%, the reduction ranged from 20% to 43%, for 3% it was between 30% and 47%, and for 5% it ranged from 33% to 59%.
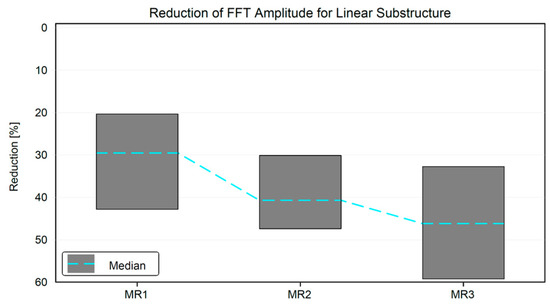
Figure 13.
FFT amplitude reduction trend chart for linear substructure.
In conclusion, the findings demonstrate a positive correlation between the increase in mass ratio and the overall performance enhancement of the TLD.
6. Nonlinear Substructure Results
Multiple RTHSs were conducted with a nonlinear substructure for the same three mass ratios, with the properties listed on Table 3. As mentioned earlier in Section 3.6 in the paper, the ground accelerations were scaled to limit the peak roof displacements to approximately 80 mm in the uncontrolled structure. Consequently, the test structures entered a nonlinear state, once the roof displacements exceeded the 55 mm yield displacement limit. This scaling enabled the assessment of TLD efficiency during the nonlinear behavior of the system.
The peak displacements were reduced by 11%, 19%, and 21% respectively for the three different mass ratios under the Nahanni ground motion. The RMS values of the displacements were reduced by 22%, 33%, and 41%. The free vibration amplitude measured 20 s after the duration of the earthquake was measured to have been reduced by 44%, 87%, and 84%. Again, the response was analyzed using FFT, revealing reductions in amplitude of 18%, 23%, and 27%. In the case of the nonlinear substructure, an additional performance indicator was also compared, since the nonlinearity in the structure allowed for residual displacements if/when the earthquake yielded the structure. The liquid damper was found to have reduced the residual displacement by 97%, 70%, and 77%. The increase in mass ratio has once again shown a positive effect on the performance indicators considered. Figure 14, Figure 15, Figure 16, Figure 17, Figure 18 and Figure 19 provide the time histories and FFTs for the test cases involving a nonlinear substructure subjected to the Nahanni ground motion.
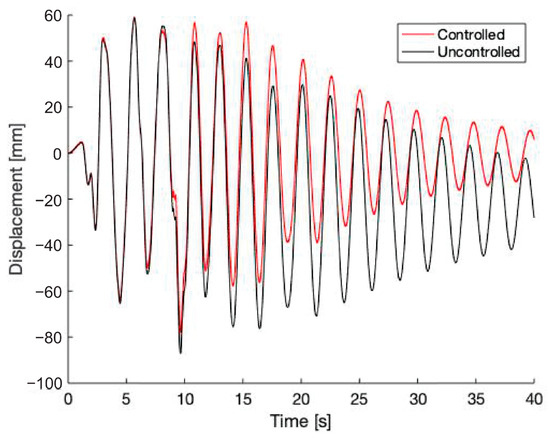
Figure 14.
Structural displacement response history for EQ#2-MR1%—0.418 Hz (Nonlinear Substructure).

Figure 15.
Structural displacement response history for EQ#2-MR3%—0.418 Hz (Nonlinear Substructure).
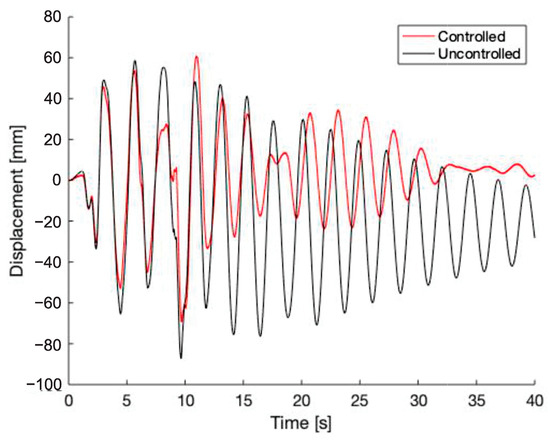
Figure 16.
Structural displacement response history for EQ#2-MR5%—0.418 Hz (Nonlinear Substructure).
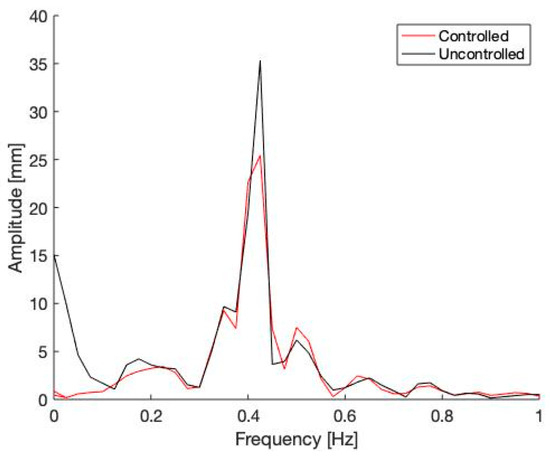
Figure 17.
FFT analysis of structural displacement response for EQ#2-MR1%—0.418 Hz (Nonlinear Substructure).

Figure 18.
FFT analysis of structural displacement response for EQ#2-MR3%—0.418 Hz (Nonlinear Substructure).

Figure 19.
FFT analysis of structural displacement response for EQ#2-MR5%—0.418 Hz (Nonlinear Substructure).
Trend charts for the nonlinear substructure were created and are presented in Figure 20 and Figure 21. For a mass ratio of 1%, the effectiveness of the TLD was between −9 and 11%. For a mass ratio of 3%, the effectiveness was between −2 and 24%. Finally, for a mass ratio of 5%, the effectiveness was between 0 and 33%. For FFT amplitude reduction, the mass ratio of 1% had a 0 to 48% reduction, the mass ratio of 3% had a reduction of 5 to 44%, and the mass ratio of 5% had a reduction of 7 to 50%.
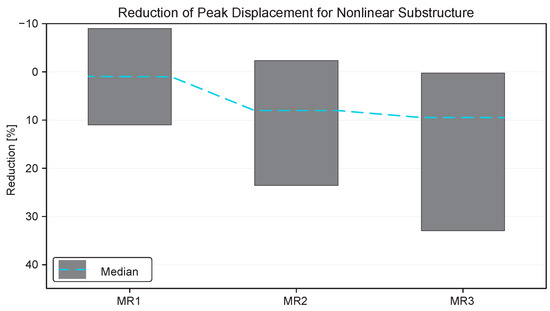
Figure 20.
Peak displacement reduction trend chart for nonlinear substructure.
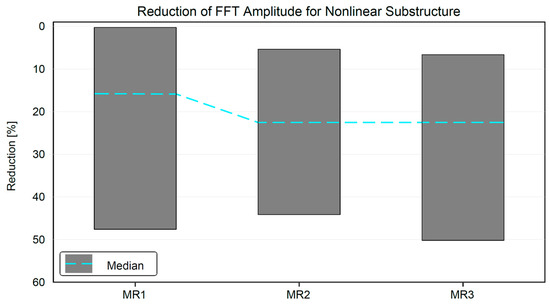
Figure 21.
FFT amplitude reduction trend chart for nonlinear substructure.
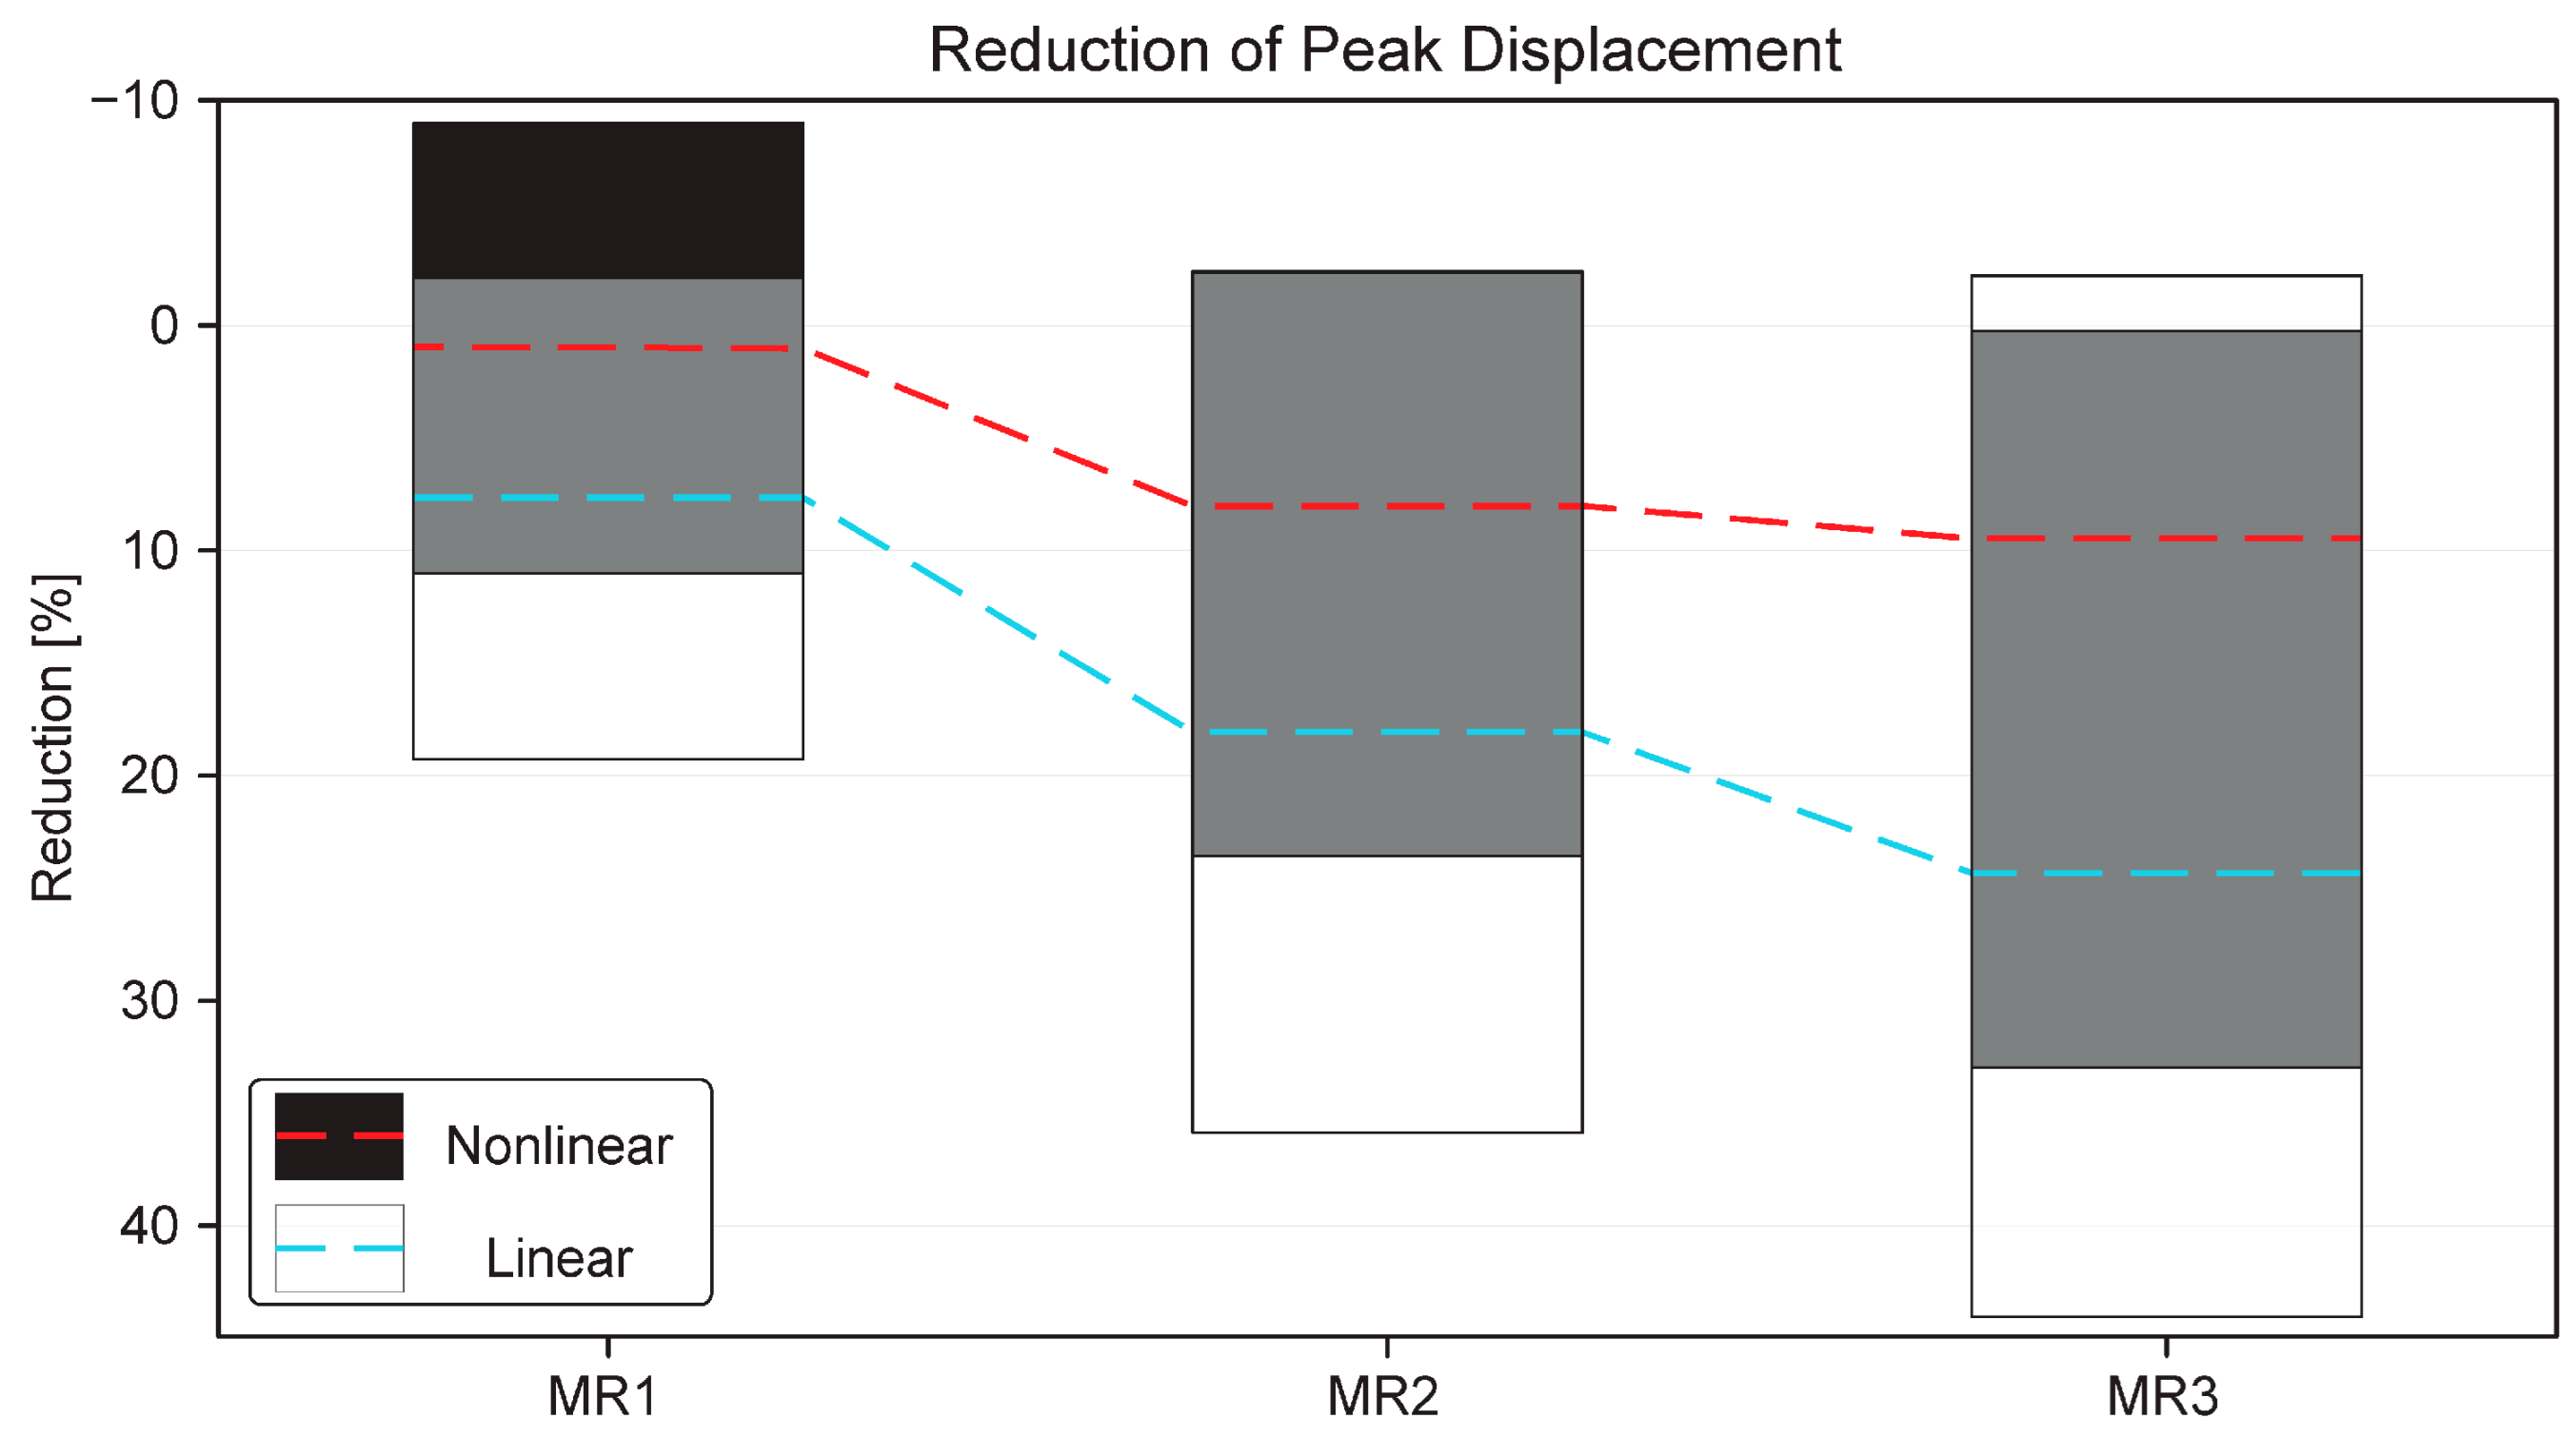
The linear and nonlinear trend charts are combined in Figure 22 and Figure 23. The results reveal a wider range of performance in peak displacement reduction for the linear substructure, yet they also indicate greater reductions compared to the nonlinear substructure. When examining the reduction in FFT peaks, it becomes evident that the nonlinear substructure exhibits significantly higher spreads in performance compared to the linear case. Nonetheless, the linear substructure continues to demonstrate greater efficiency relative to the nonlinear counterpart. It seems that, in scenarios where the structure remains within the linear–elastic range, the TLD proves more effective than in nonlinear structures.

Figure 22.
Peak displacement reduction trend chart comparison.
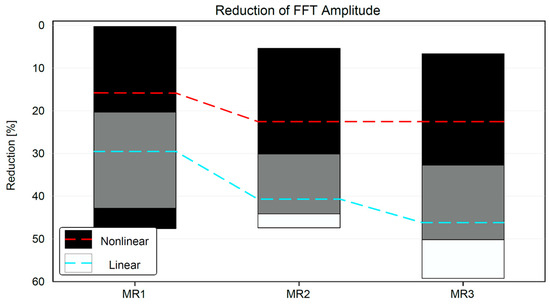
Figure 23.
FFT amplitude reduction trend chart comparison.
It is observed that the type of earthquake influences the performance of the TLD. For example, while the second load case, i.e., EQ2 (i.e., Nahanni 1985), as shown above, has a favorable performance, the third load case, i.e., EQ3 (i.e., Northridge 1994), exhibits a less favorable performance. In some cases, the results of this ground motion show a slight increase in peak values, especially for the nonlinear substructure. Based on these observations, it can be concluded that the frequency content of the earthquake is a crucial factor that affects the performance of the TLD. Moreover, certain types of earthquakes, such as pulse-type earthquakes, may diminish effectiveness as they do not allow the TLD to engage properly before the peak displacements occur. While TLDs may not be as effective in nonlinear structures compared to linear structures, they were still able to provide some effectiveness in controlling displacements. Additionally, in nearly all cases, the TLD was also able to reduce the residual displacement when compared to the uncontrolled case (the test structure only subjected to the same seismic loading).
7. Summary and Conclusions
This study has provided insights into the performance of tuned liquid dampers in suppressing vibrations of structures under seismic loading conditions. Through a series of real-time hybrid-simulation experiments, the effectiveness of TLDs was investigated on both linear and nonlinear substructures. The experimental setup, which utilized a large-scale TLD and state-of-the-art RTHS methodology, allowed for the accurate assessment of TLD performance in mitigating structural vibrations.
The results from the experiments demonstrate significant reductions in peak displacements, RMS values, and FFT spectrum amplitudes when TLDs are employed, particularly for linear structures. The effectiveness of TLDs varied depending on factors such as the mass ratio, earthquake type, and structural nonlinearity. While TLDs showed promising results in controlling displacements and reducing residual displacements, it was noted that their effectiveness could be influenced by the frequency content of the earthquake and the structural characteristics. It is important to note that these experiments with large-scale TLDs were conducted in a laboratory environment; actual structures may exhibit different dynamic behaviors due to factors such as scale, shape, and materials.
As a prospective avenue, the authors intend to investigate the utilization of multiple TLDs tuned to different operational frequencies to broaden the effectiveness range of TLDs in attenuating structural vibrations under seismic loading. Another future topic is to use the experimental results obtained in this study to validate and calibrate existing theoretical models, thereby improving their accuracy in capturing the realistic performance of TLDs under seismic loading. Additionally, a more comprehensive and systematic study to understand the effects of different earthquakes is part of the authors’ future research plans.
Author Contributions
Conceptualization, A.A.S. and O.M.; methodology, A.A.S.; software, A.A.S.; validation, A.A.S. and O.M.; formal analysis, A.A.S. and B.Q.; investigation, A.A.S.; resources, A.A.S. and O.M.; data curation, A.A.S. and B.Q.; writing—original draft preparation, A.A.S. and B.Q.; writing—review and editing, A.A.S., B.Q. and O.M.; visualization, A.A.S. and B.Q.; supervision, O.M.; project administration, O.M.; funding acquisition, O.M. All authors have read and agreed to the published version of the manuscript.
Funding
This research received no external funding.
Data Availability Statement
The data presented in this study are available upon request from the corresponding author.
Acknowledgments
The financial support from NSERC Discovery and NSERC RTI programs, as well as the Edwin Edward Hart Professorship Award are gratefully acknowledged. Any opinions, findings, conclusions, and recommendations expressed here are those of the authors and do not necessarily reflect the views of the sponsors.
Conflicts of Interest
The authors declare no conflict of interest.
References
- Xu, Y.; Chen, B. Integrated vibration control and health monitoring of building structures using semi-active friction dampers: Part I—Methodology. Eng. Struct. 2008, 30, 1789–1801. [Google Scholar] [CrossRef]
- Fujino, Y.; Pacheco, B.M.; Chaiseri, P.; Sun, L.M. Parametric studies on tuned liquid damper (TLD) using circular containers by free-oscillation experiments. Doboku Gakkai Ronbunshu 1988, 5, 381–391. [Google Scholar] [CrossRef]
- Tamura, Y.; Fujii, K.; Sato, T.; Wakahara, T.; Kosugi, M. Wind-induced vibration of tall towers and practical applications of tuned sloshing dampers. In Proceedings of the Workshop on Serviceability of Buildings (Movements, Deformations, Vibrations), Ottawa, ON, Canada, 16–18 May 1988. [Google Scholar]
- Shen, K.; Soong, T.; Chang, K.; Lai, M. Seismic behavior of reinforced concrete frame with added visco-elastic dampers. En-Gineering Struct. 1995, 17, 372–380. [Google Scholar] [CrossRef]
- Ghabraie, K.; Chan, R.; Huang, X.; Xie, Y.M. Shape optimization of metallic yielding devices for passive mitigation of seismic energy. Eng. Struct. 2010, 32, 2258–2267. [Google Scholar] [CrossRef]
- Zhang, Y.; Zhu, S. A shape memory alloy-based reusable hysteretic damper for seismic hazard mitigation. Smart Mater. Struct. 2007, 16, 1603–1613. [Google Scholar] [CrossRef]
- Ni, Y.; Chen, Y.; Ko, J.; Cao, D. Neuro-control of cable vibration using semi-active magneto-rheological dampers. Eng. Struct. 2003, 24, 295–307. [Google Scholar] [CrossRef]
- Yang, G.; Spencer, B.; Carlson, J.; Sain, M. Large-scale MR fluid dampers: Odeling and dynamic performance considerations. Eng. Struct. 2002, 24, 309–323. [Google Scholar] [CrossRef]
- Chen, Y.; Hwang, W.; Chiu, L.; Sheu, S. Flexibility of TLD to high-rise building by simple experiment and comparison. Comput. Struct. 1995, 57, 855–861. [Google Scholar] [CrossRef]
- Kim, Y.-M.; You, K.-P.; Ko, N.-H.; Yoon, S.-W. Use of TLD and MTLD for control of wind-induced vibration of tall buildings. J. Mech. Sci. Technol. 2006, 20, 1346–1354. [Google Scholar] [CrossRef]
- NatHaz Research. tuned Liquid Dampers (TLDs) and Tuned Liquid Column Dampers (TLCDs) Research at NatHaz Modeling Laboratory. Available online: https://nathaz.nd.edu/research/liquid/liq_damp.html (accessed on 30 May 2024).
- Reed, D.; Yu, J.; Yeh, H.; Gardarsson, S. Investigation of Tuned Liquid Dampers under Large Amplitude Excitation. J. Eng. Mech. 1998, 124, 405–413. [Google Scholar] [CrossRef]
- Sun, L.M.; Fujino, Y.; Pacheco, B.M.; Chaiseri, P. Modelling of tuned liquid damper (TLD). J. Wind Eng. Ind. Aerodyn. 1992, 43, 1883–1894. [Google Scholar] [CrossRef]
- Yu, J.; Wakahara, T.; Reed, D.A. A non-linear numerical model of the tuned liquid damper. Earthq. Eng. Struct. Dyn. 1999, 28, 671–686. [Google Scholar] [CrossRef]
- Banerji, P.; Murudi, M.; Shah, A.; Popplewell, N. Tuned liquid dampers for controlling earthquake response of structures. Earthq. Eng. Struct. Dyn. 2000, 29, 587–602. [Google Scholar] [CrossRef]
- Kosaka, H.; Noji, T.; Yoshida, H.; Tatsumi, E.; Yamanaka, H.; Agrawal, A. Damping effects of a vibration control damper using sloshing of water. In Proceedings of the 10th World Conference on Earthquake Engineering, Madrid, Spain, 19–24 July 1992. [Google Scholar]
- Xiao, C.; Wu, Z.; Chen, K.; Tang, Y.; Yan, Y. An experimental study on the equivalent nonlinear model for a large-sized tuned liquid damper. J. Build. Eng. 2023, 73, 106754. [Google Scholar] [CrossRef]
- Ocak, A.; Nigdeli, S.M.; Bekdaş, G.; Kim, S.; Geem, Z.W. Adaptive Harmony Search for Tuned Liquid Damper Optimization under Seismic Excitation. Appl. Sci. 2022, 12, 2645. [Google Scholar] [CrossRef]
- Tang, Z.; Sheng, J.; Dong, Y. Effects of tuned liquid dampers on the nonlinear seismic responses of high-rise structures using real-time hybrid simulations. J. Build. Eng. 2023, 70, 106333. [Google Scholar] [CrossRef]
- Malekghasemi, H.; Ashasi-Sorkhabi, A.; Ghaemmaghami, A.R.; Mercan, O. Experimental and numerical investigations of the dynamic interaction of tuned liquid damper–structure systems. J. Vib. Control. 2013, 21, 2707–2720. [Google Scholar] [CrossRef]
- Novo, T.; Varum, H.; Teixeira-Dias, F.; Rodrigues, H.; Falcao-Silva, M.; Cost, A.; Guerreiro, L. Tuned liquid dampers simula-tion for earthquake response control of buildings. Bull. Earthq. Eng. 2013, 12, 1007–1024. [Google Scholar] [CrossRef]
- Rai, K.; Reddy, G.; Venkatraj, V. Tuned liquid sloshing water damper: A robust device for seismic retrofitting. Int. J. Environ. Sci. Dev. Monit. 2013, 4, 36–44. [Google Scholar]
- Shad, H.; Bin Adnan, A.; Behbahani, H.P. Performance Evaluation of Tuned Liquid Dampers on Response of a SDOF System Under Earthquake Excitation and Harmonic Load. Res. J. Appl. Sci. Eng. Technol. 2013, 6, 3018–3021. [Google Scholar] [CrossRef]
- Wang, J.-T.; Gui, Y.; Zhu, F.; Jin, F.; Zhou, M.-X. Real-time hybrid simulation of multi-story structures installed with tuned liquid damper. Struct. Control Health Monit. 2015, 23, 1015–1031. [Google Scholar] [CrossRef]
- Jin, Q.; Li, X.; Sun, N.; Zhou, J.; Guan, J. Experimental and numerical study on tuned liquid dampers for controlling earth-quake response of jacket offshore platform. Mar. Struct. 2007, 20, 238–254. [Google Scholar] [CrossRef]
- Ghaemmaghami, A.; Kianoush, M.; Mardukhi, J. Numerical study on annular tuned liquid dampers for controlling the re-sponse of wind towers subjected to seismic loads. In Proceeding of the 15th World Conference on Earthquake Engineering, Lisbon, Portugal, 24–28 September 2012. [Google Scholar]
- Ghaemmaghami, A.R.; Kianoush, R.; Mercan, O. Numerical modeling of dynamic behavior of annular tuned liquid dampers for the application in wind towers under seismic loading. J. Vib. Control 2015, 22, 3858–3876. [Google Scholar] [CrossRef]
- Zhu, F.; Wang, J.; Jin, F.; Altay, O. Real-time hybrid simulation of single and multiple tuned liquid column dampers for con-trolling seismic-induced response. In Proceedings of the 6th International Conference on Advances in Experimental Structural Engineering, Illinoi, IL, USA, 19–21 October 2015. [Google Scholar]
- Das, S.; Choudhury, S. Seismic response control by tuned liquid dampers for low-rise RC frame buildings. Aust. J. Struct. Eng. 2017, 18, 135–145. [Google Scholar] [CrossRef]
- Zhu, F.; Wang, J.-T.; Jin, F.; Lu, L.-Q.; Gui, Y.; Zhou, M.-X. Real-time hybrid simulation of the size effect of tuned liquid dampers. Struct. Control Health Monit. 2017, 24, e1962. [Google Scholar] [CrossRef]
- Ashasi-Sorkhabi, A.; Mercan, O. Development, Implementation, and Verification of a User Configurable Platform for Re-al-time Hybrid Simulation. Smart Struct. Syst. 2014, 14, 1151–1172. [Google Scholar] [CrossRef]
- Ashasi-Sorkhabi, A. Implementation, Verification and Application of Real-Time Hybrid Simulation. ProQuest Dissertations & Theses, University of Toronto, Toronto, ON, Canada, 2015. [Google Scholar]
- Lee, S.-K.; Park, E.C.; Min, K.-W.; Lee, S.-H.; Chun, L.; Park, J.-H. Real-time hybrid shaking table testing method for the per-formance evaluation of a tuned liquid damper controlling seismic response of building structures. J. Sound Vi-Bration 2006, 302, 596–612. [Google Scholar] [CrossRef]
- Banerji, P. Tuned Liquid Dampers for Control of Earthquake Response. In Proceedings of the 13th World Conference on Earthquake Engineering, Vancouver, BC, Canada, 1–6 August 2004. [Google Scholar]
- Ruiz, R.; Taflanidis, A.; Lopez-Garcia, D. Characterization and design of tuned liquid dampers with floating roof considering abitrary tank cross-sections. J. Sound Vib. 2016, 368, 36–54. [Google Scholar] [CrossRef]
- Mahin, S.; Shing, P. Pseudodynamic method for seismic testing. J. Struct. Eng. (ASCE) 1985, 111, 1482–1503. [Google Scholar] [CrossRef]
- Dermitzakis, S.; Mahin, S. Development of Substructuring Techniques for On-Line Computer Controlled Seismic Performance Testing; Report UBC/EERC-85/04; Earthquake Engineering Research Center: Berkeley, CA, USA, 1985. [Google Scholar]
- Nakashima, M.; Kato, H.; Takaoka, E. Development of real-time pseudodynamic testing. Earthq. Eng. Struct. Dyn. 1995, 21, 79–92. [Google Scholar] [CrossRef]
- Horiuchi, T.; Inoue, M.; Konno, T.; Namita, Y. Real-time hybrid experimental system with actuator delay compensation and its application to a piping system with energy absorber. Earthq. Eng. Struct. Dyn. 1999, 28, 1121–1141. [Google Scholar] [CrossRef]
- Mercan, O.; Ricles, J. Experimental Studies on real-time pseudodynamic (PSD) and hybrid PSD testing of structures with elastomeric dampers. J. Struct. Eng. 2009, 135, 1124–1133. [Google Scholar] [CrossRef]
- Ashasi-Sorkhabi, A.; Malekghasemi, H.; Mercan, O. Implementation and verification of real-time hybrid simulation (RTHS) using a shake table for research and education. J. Vib. Control 2012, 21, 1459–1472. [Google Scholar] [CrossRef]
- Christenson, R.; Lin, Y.Z.; Emmons, A.; Bass, B. Large-Scale Experimental Verification of Semiactive Control through Real-Time Hybrid Simulation. J. Struct. Eng. 2008, 134, 522–534. [Google Scholar] [CrossRef]
- Ashasi-Sorkhabi, A.; Mercan, O. Experimental investigations of large scale TLD-structure interaction via real-time hybrid simulation. In Proceedings of the Resilient Infrastructure, CSCE, London, ON, Canada, 1–4 June 2016. [Google Scholar]


Disclaimer/Publisher’s Note: The statements, opinions and data contained in all publications are solely those of the individual author(s) and contributor(s) and not of MDPI and/or the editor(s). MDPI and/or the editor(s) disclaim responsibility for any injury to people or property resulting from any ideas, methods, instructions or products referred to in the content. |
© 2024 by the authors. Licensee MDPI, Basel, Switzerland. This article is an open access article distributed under the terms and conditions of the Creative Commons Attribution (CC BY) license (https://creativecommons.org/licenses/by/4.0/).