
Study on the Effect of Water–Binder Ratio on the Carbonation Resistance of Raw Sea Sand Alkali-Activated Slag Concrete and the Distribution of Chloride Ions after Carbonation
 ,
,
Abstract
:1. Introduction
2. Materials and Methods
2.1. Materials
2.1.1. Slag
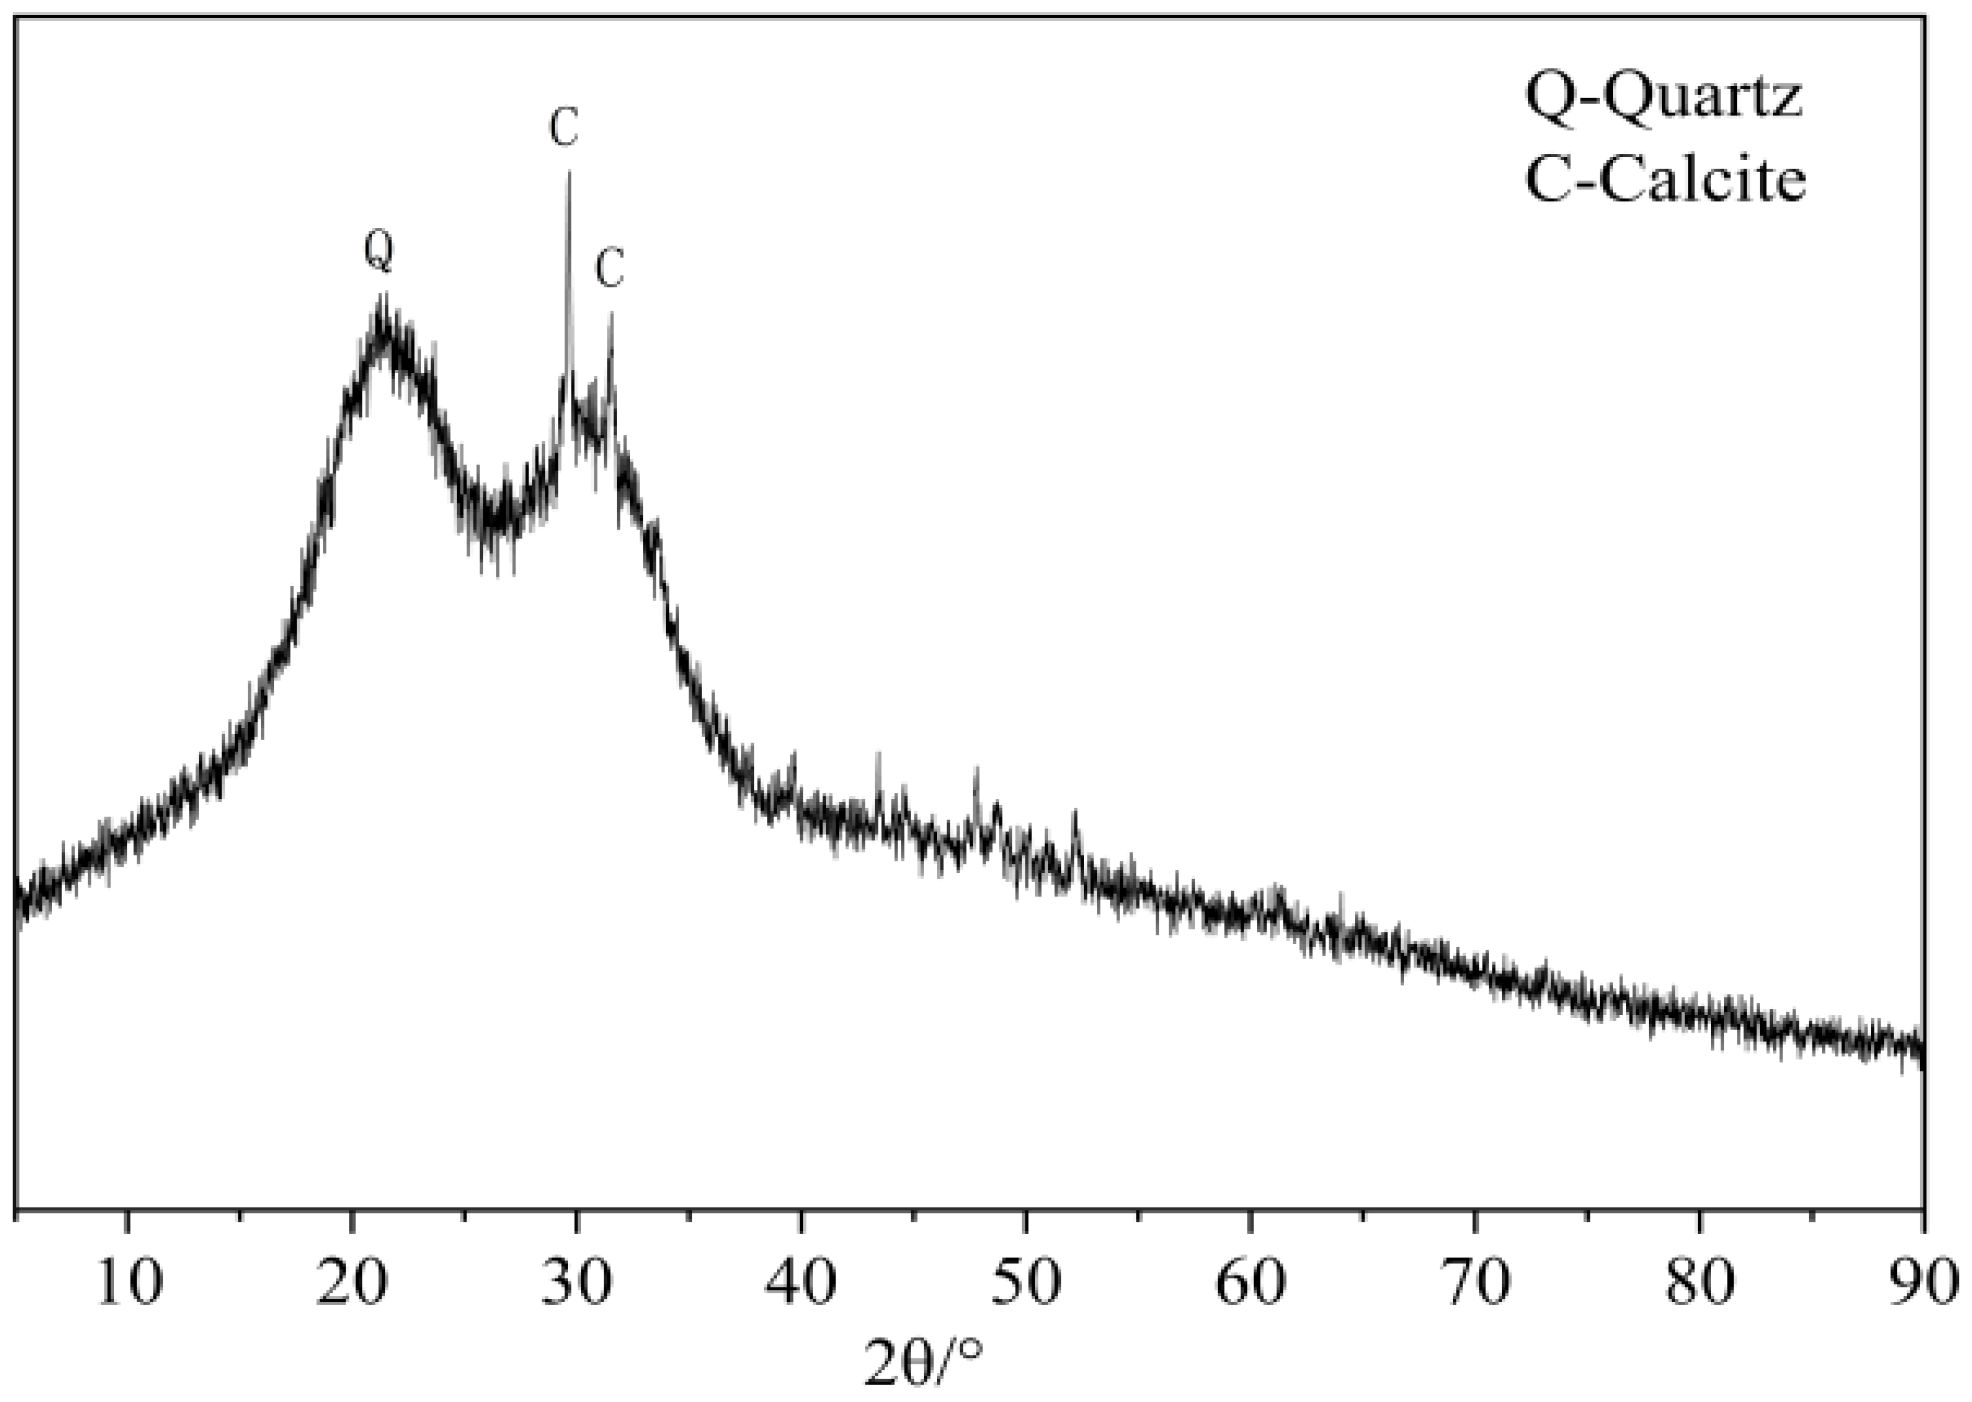
2.1.2. Sand
2.1.3. Alkali Activator
2.2. The Preparation and Mixing Ratio of Sample
2.3. Testing and Analysis
2.3.1. Fluidity Test
2.3.2. Mechanical Property Test
2.3.3. Carbonation Depth
2.3.4. Compressive Strength after Carbonization
2.3.5. Chloridion Concentration Test
2.3.6. X-ray Diffraction Test
2.3.7. Thermogravimetric Analysis
2.3.8. Mercury Intrusion Porosimetry
3. Results and Discussion
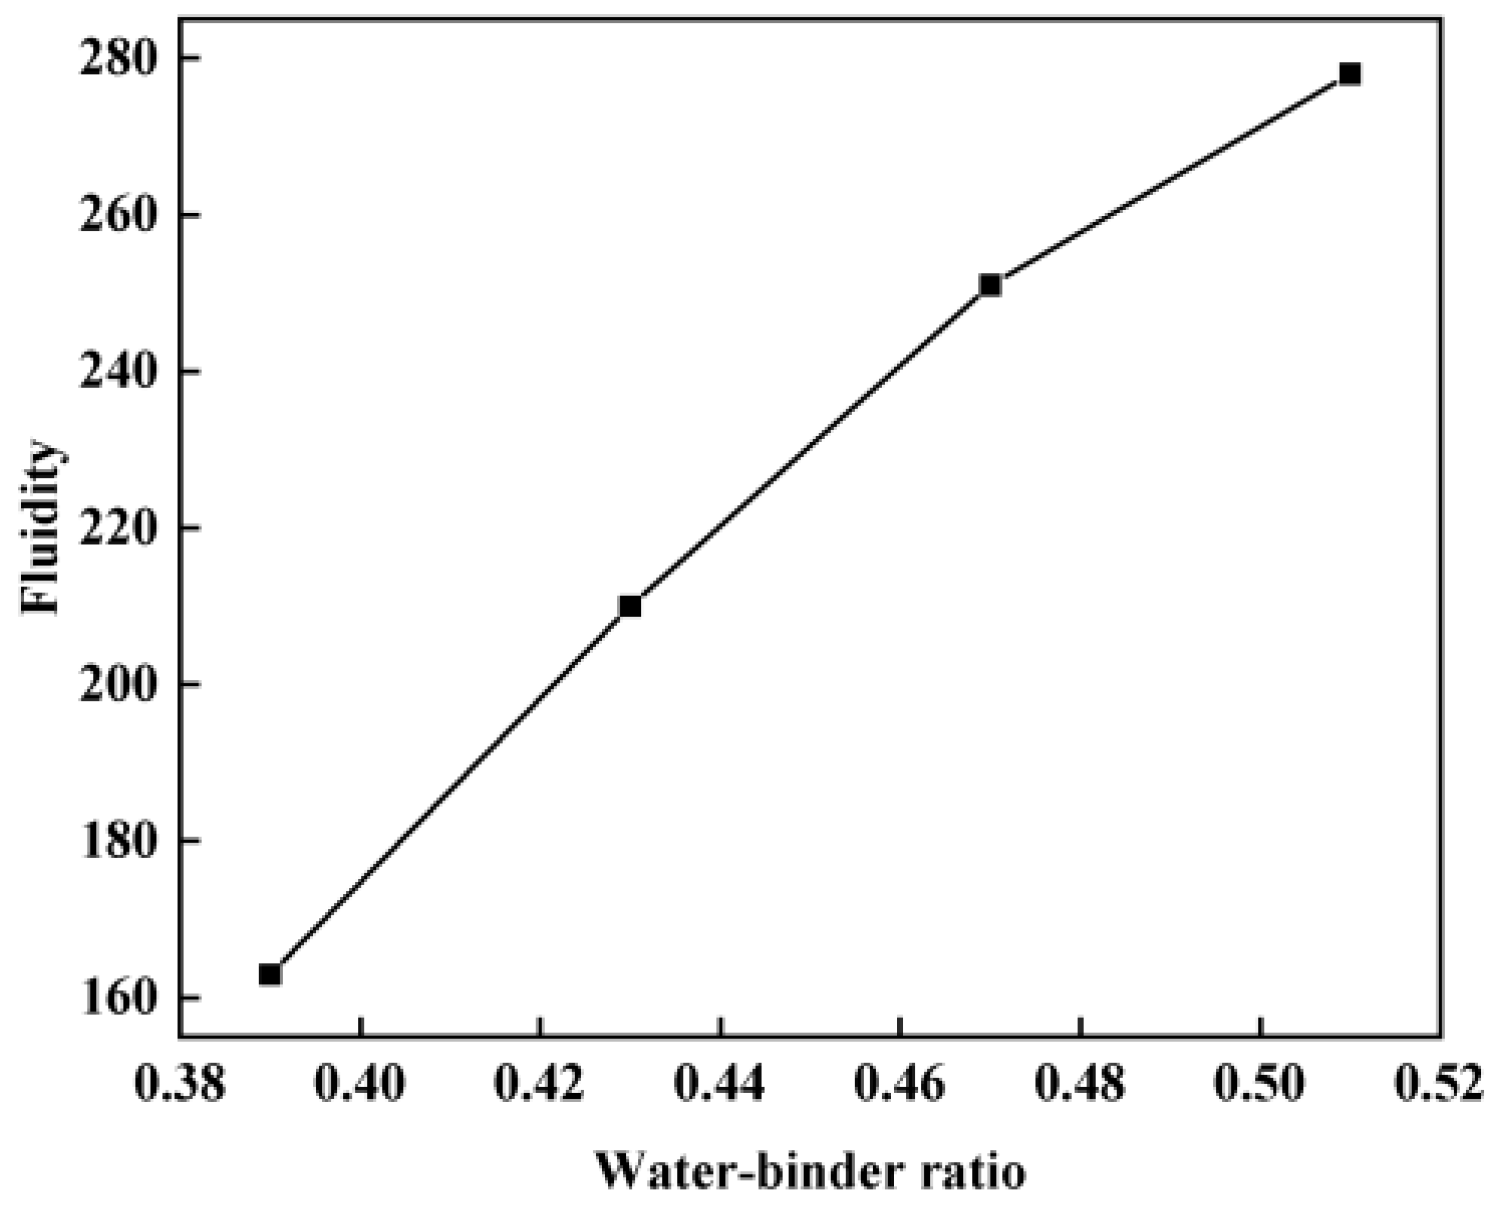
3.1. Flowability
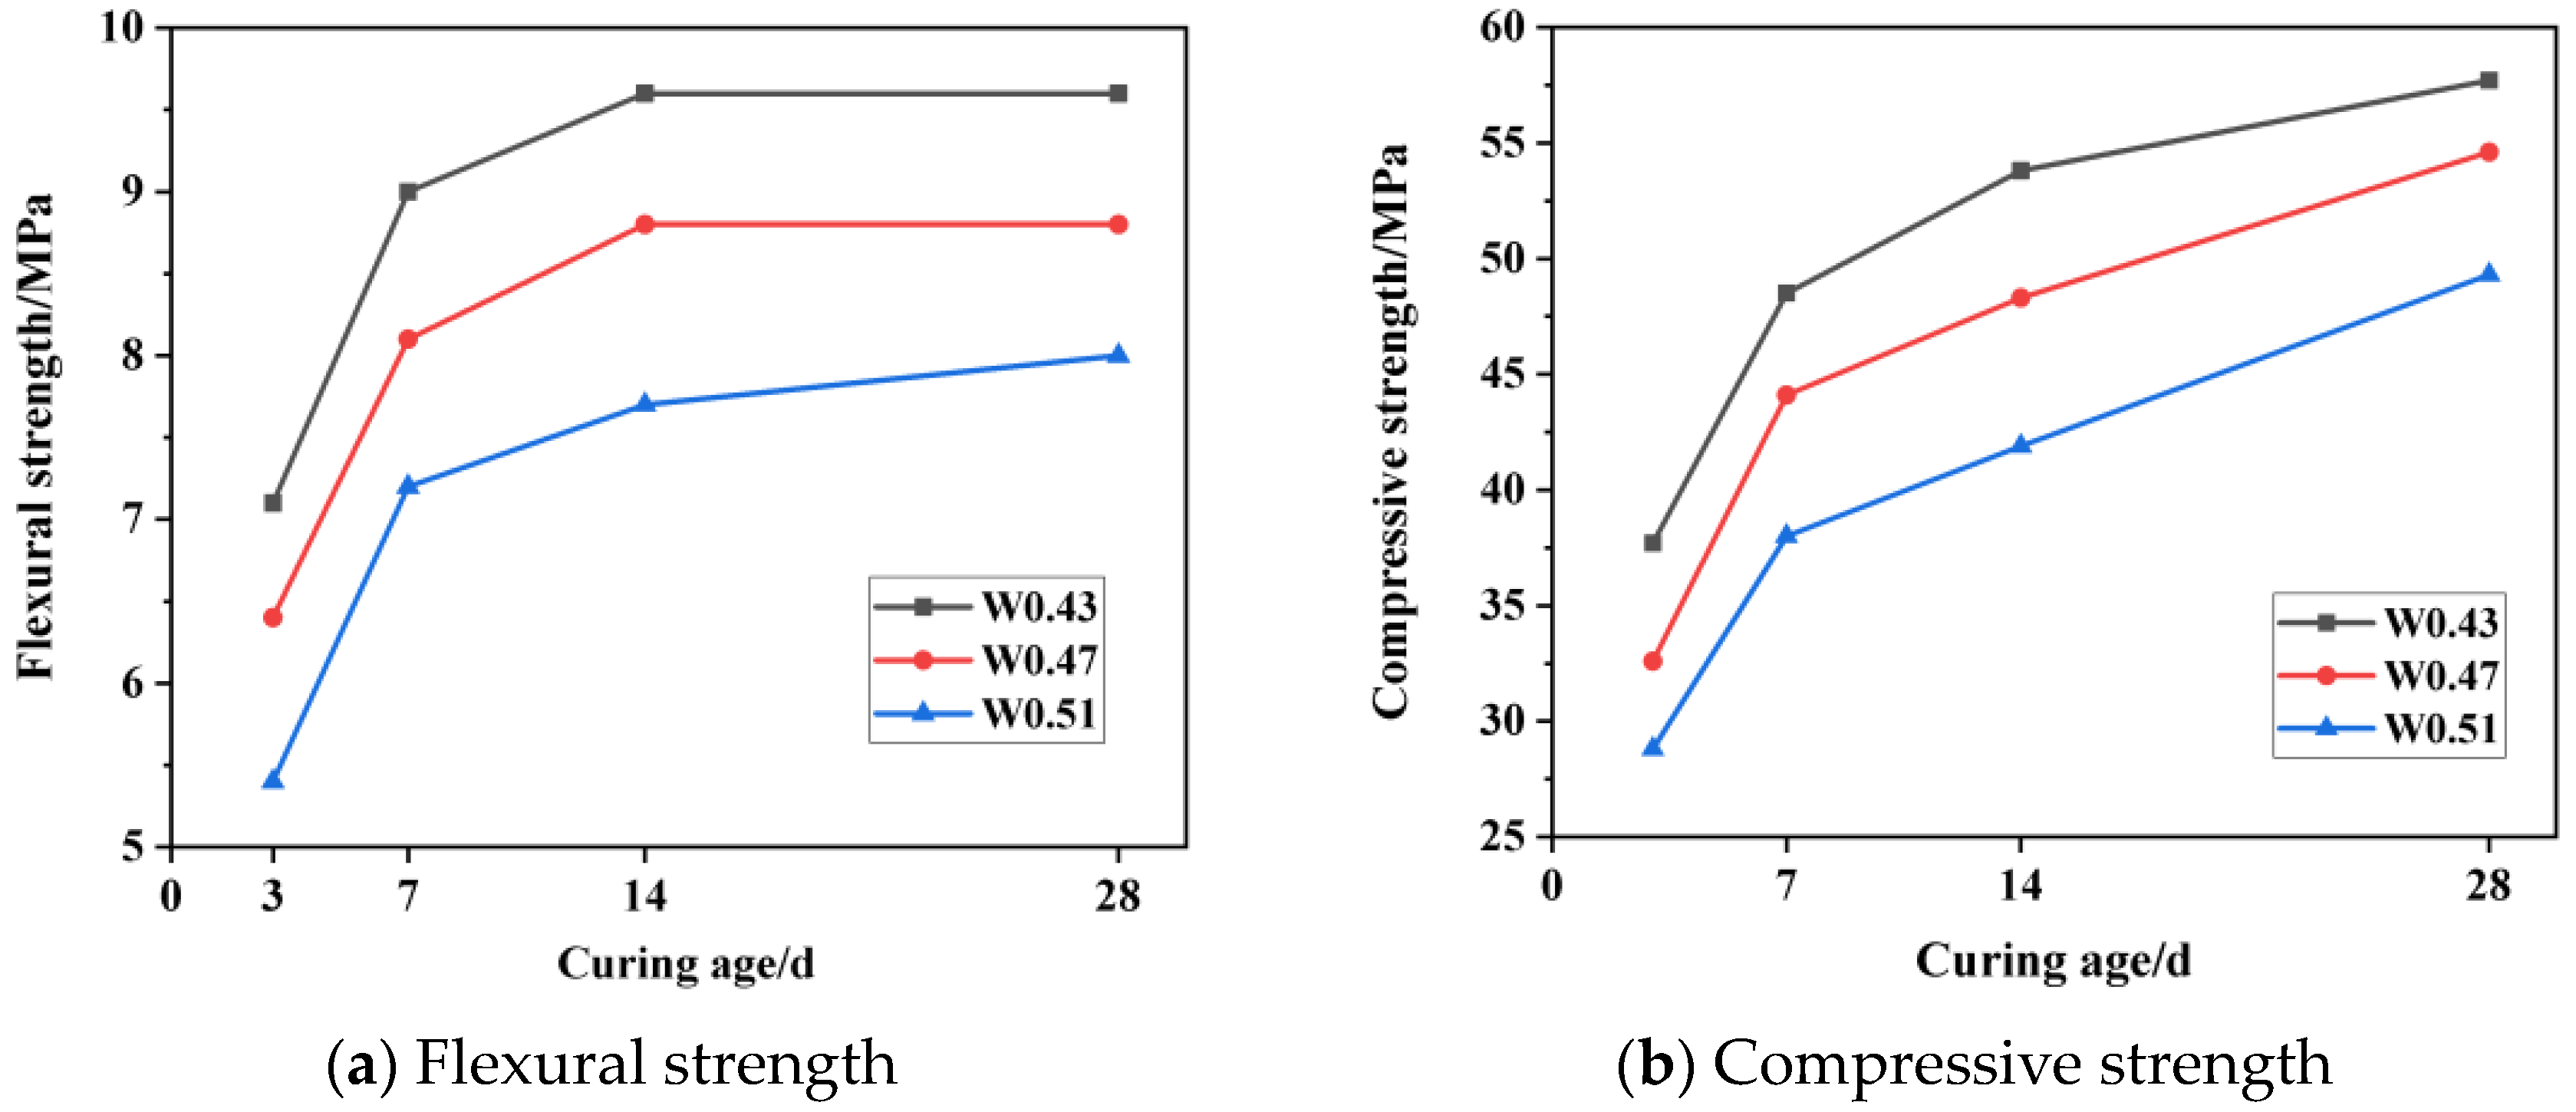
3.2. Mechanical Property
3.3. Properties after Carbonization
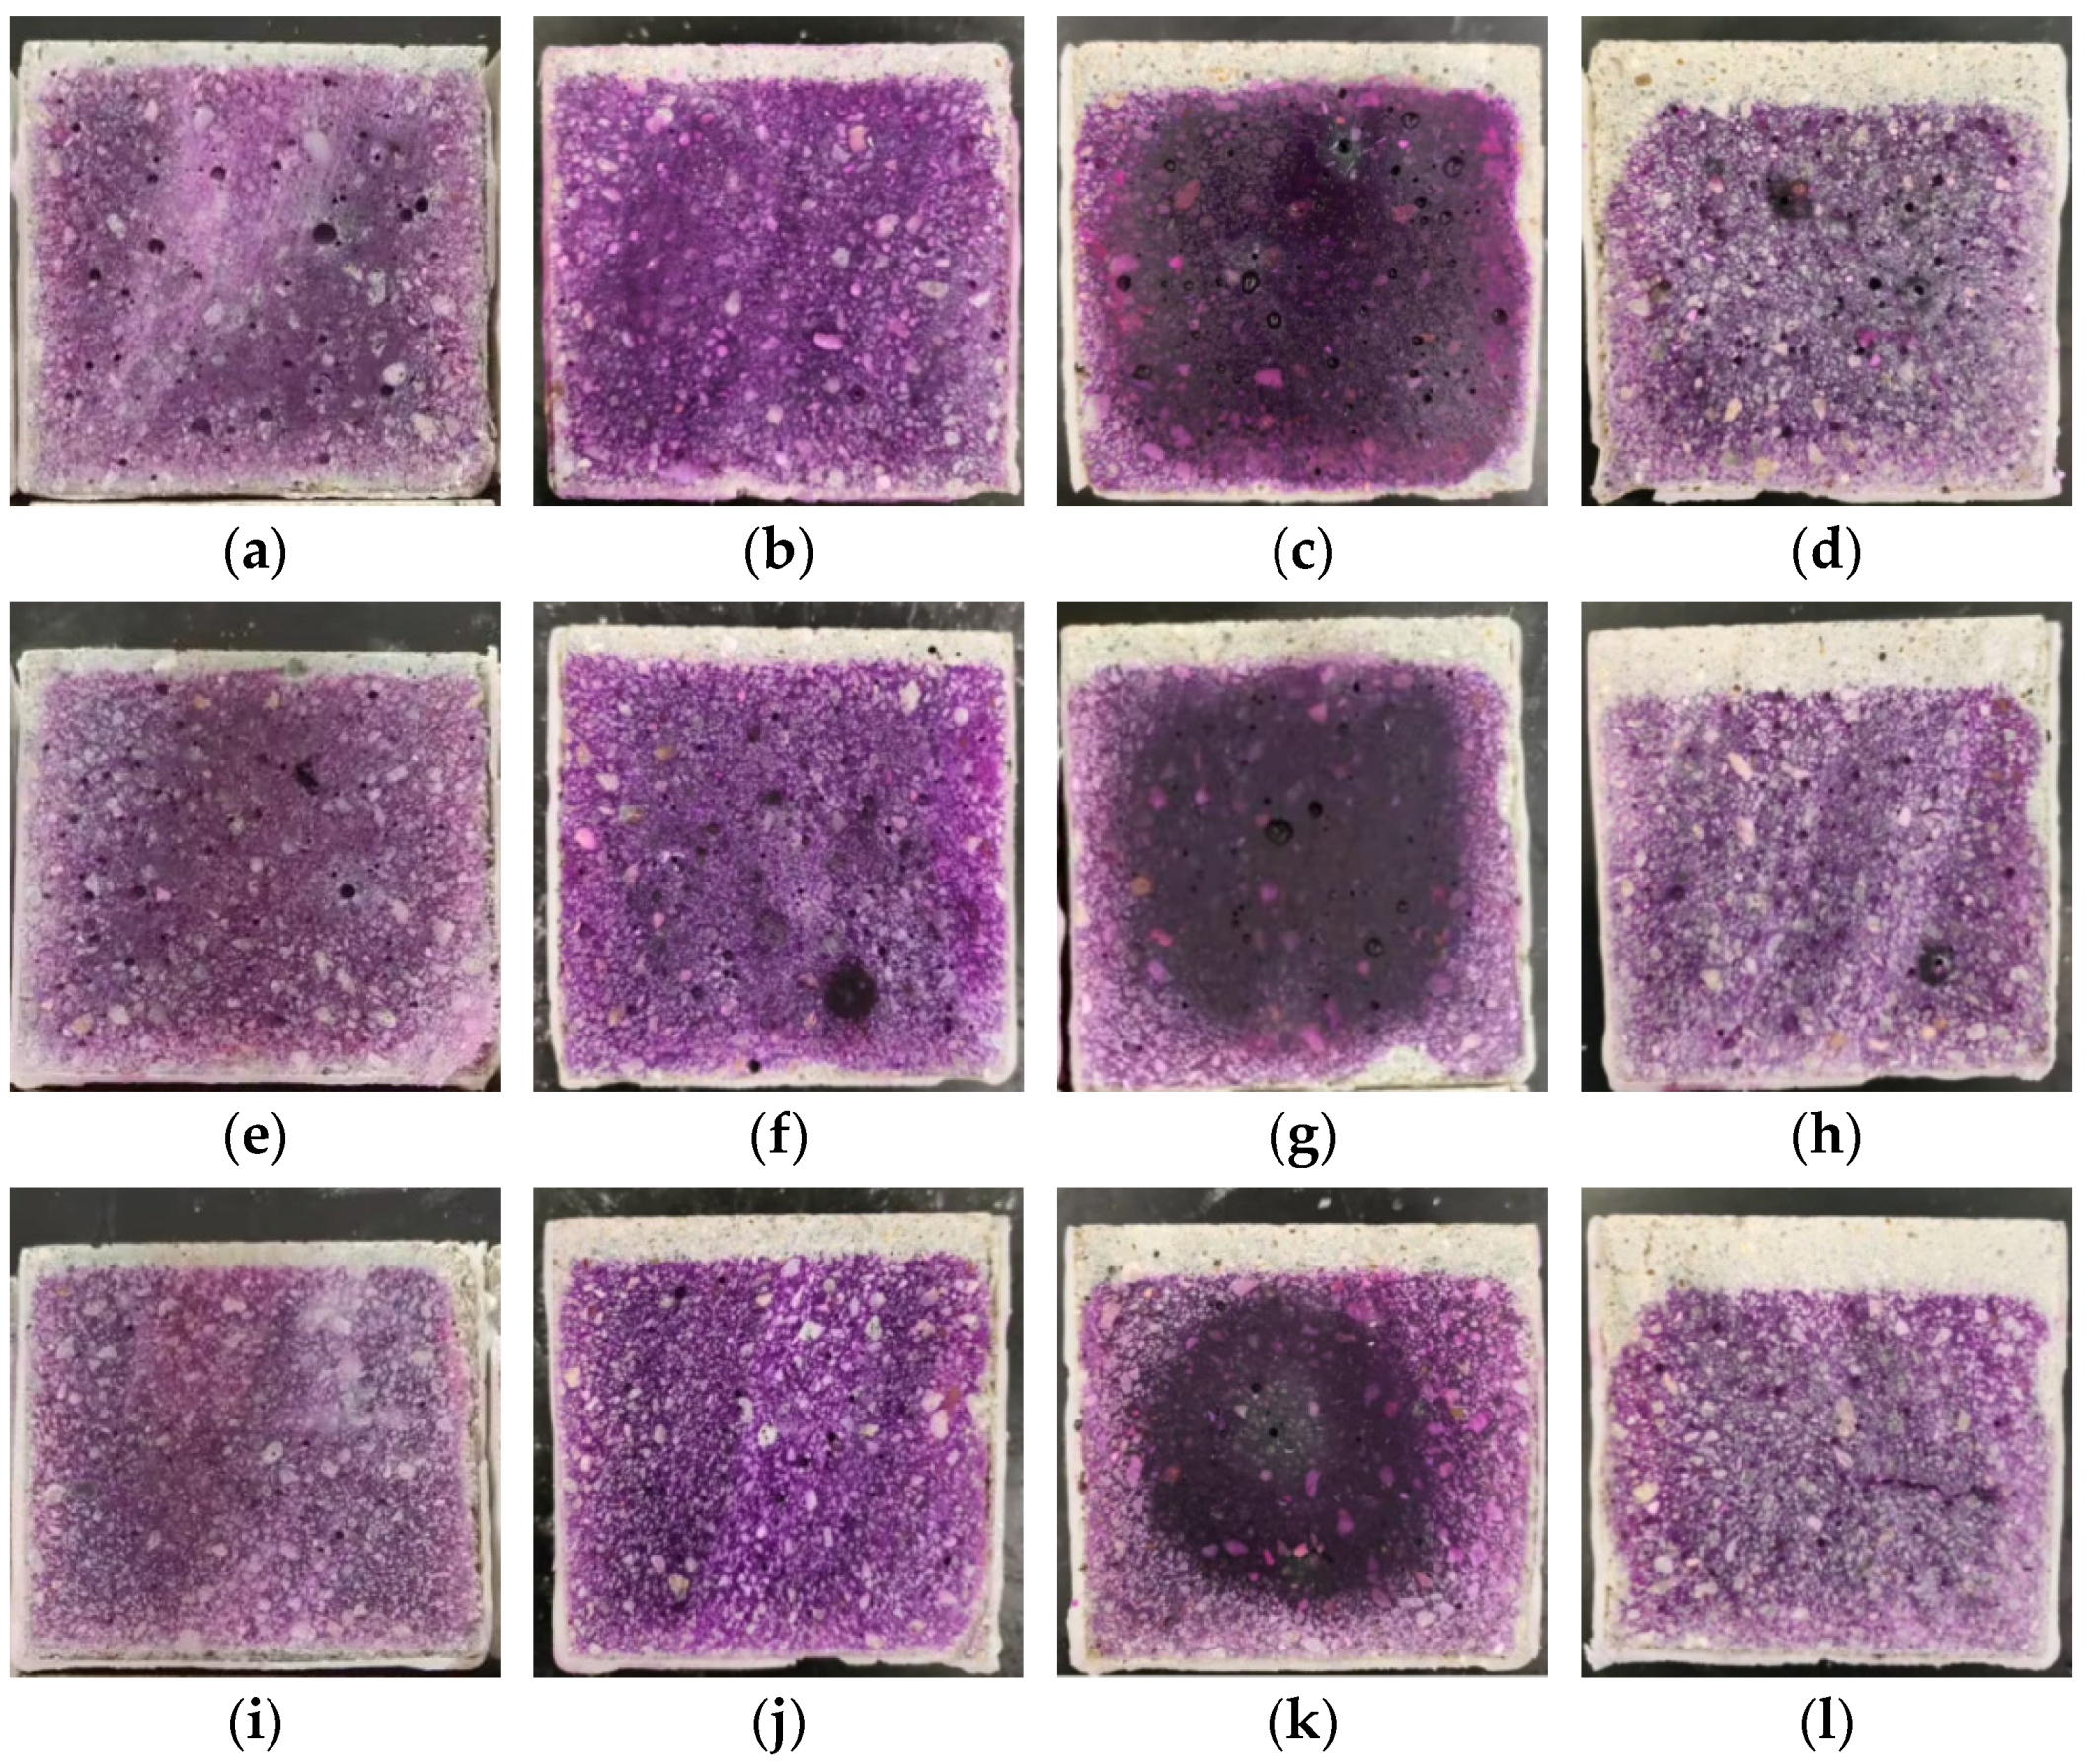
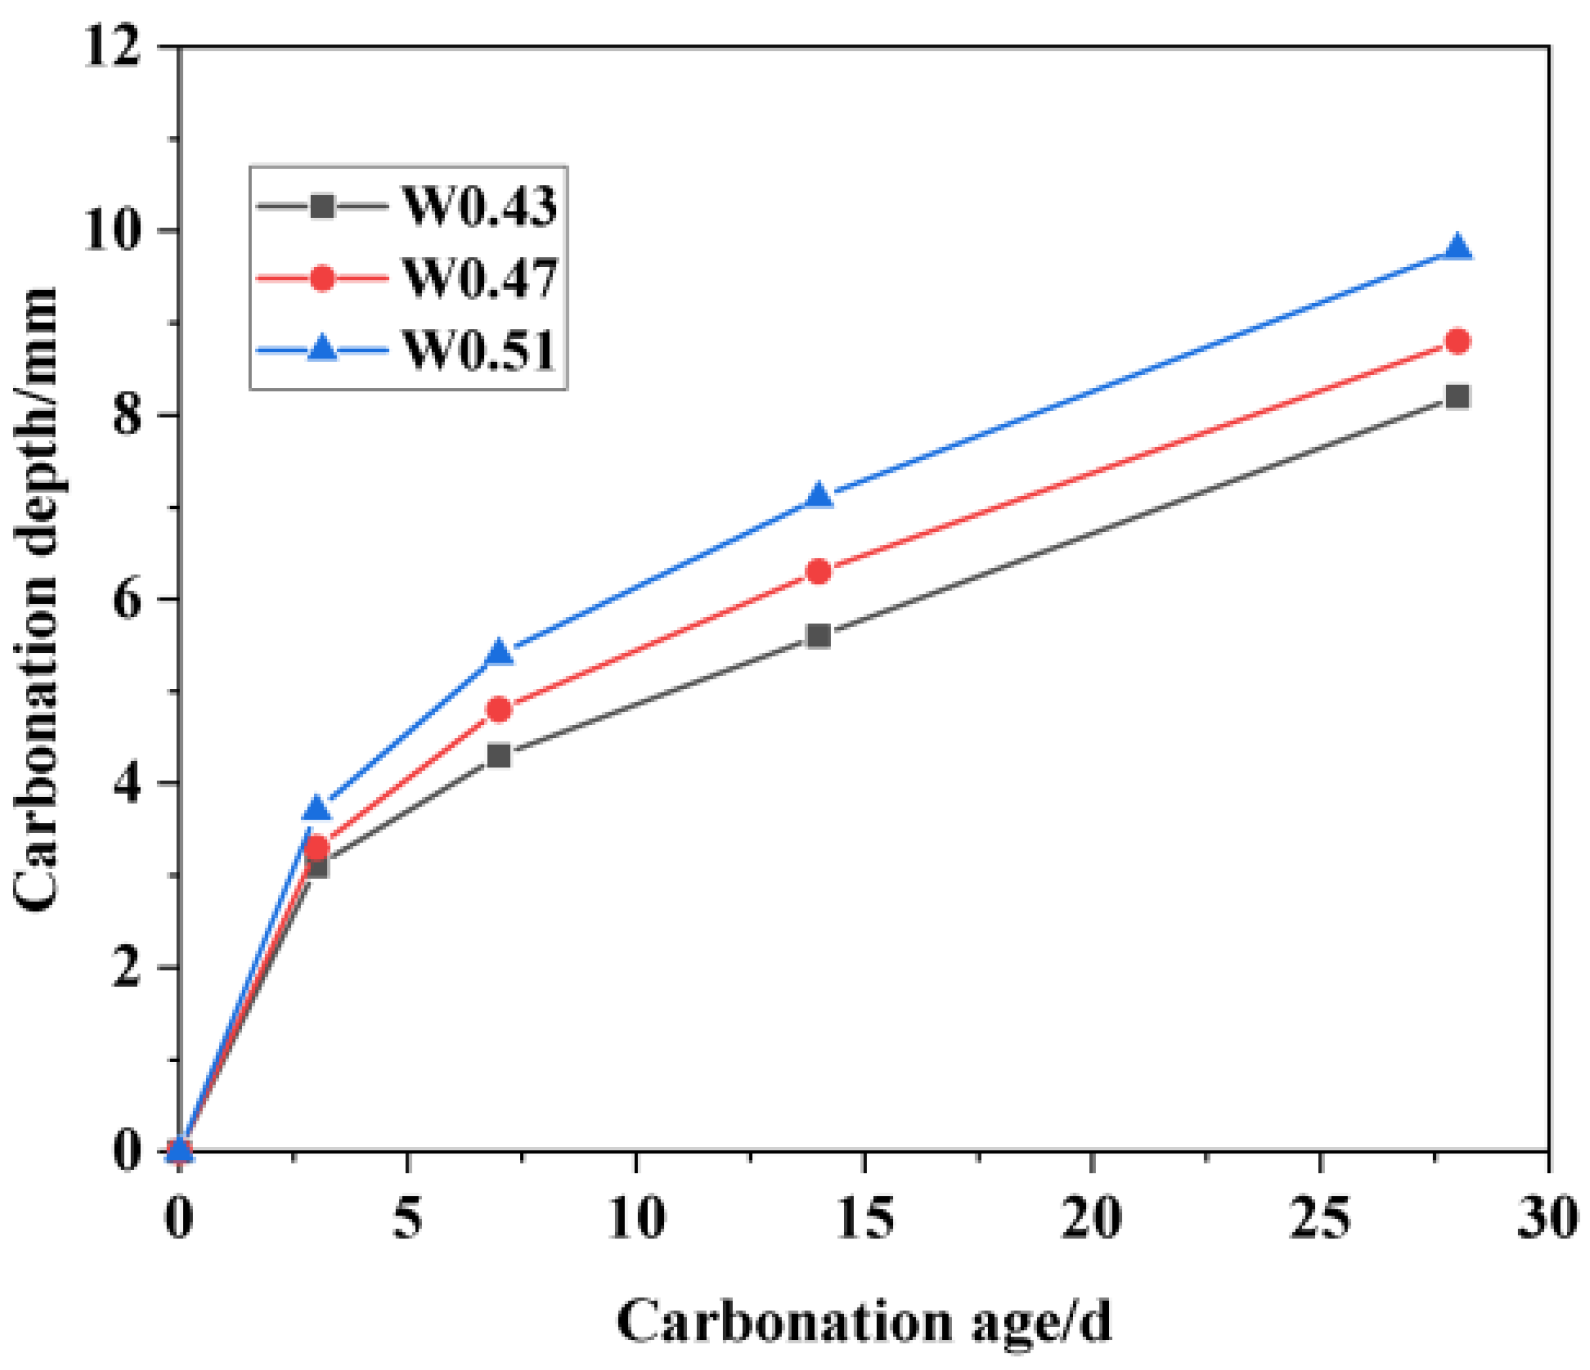
3.3.1. Carbonation Depth
3.3.2. Compressive Strength after Carbonization
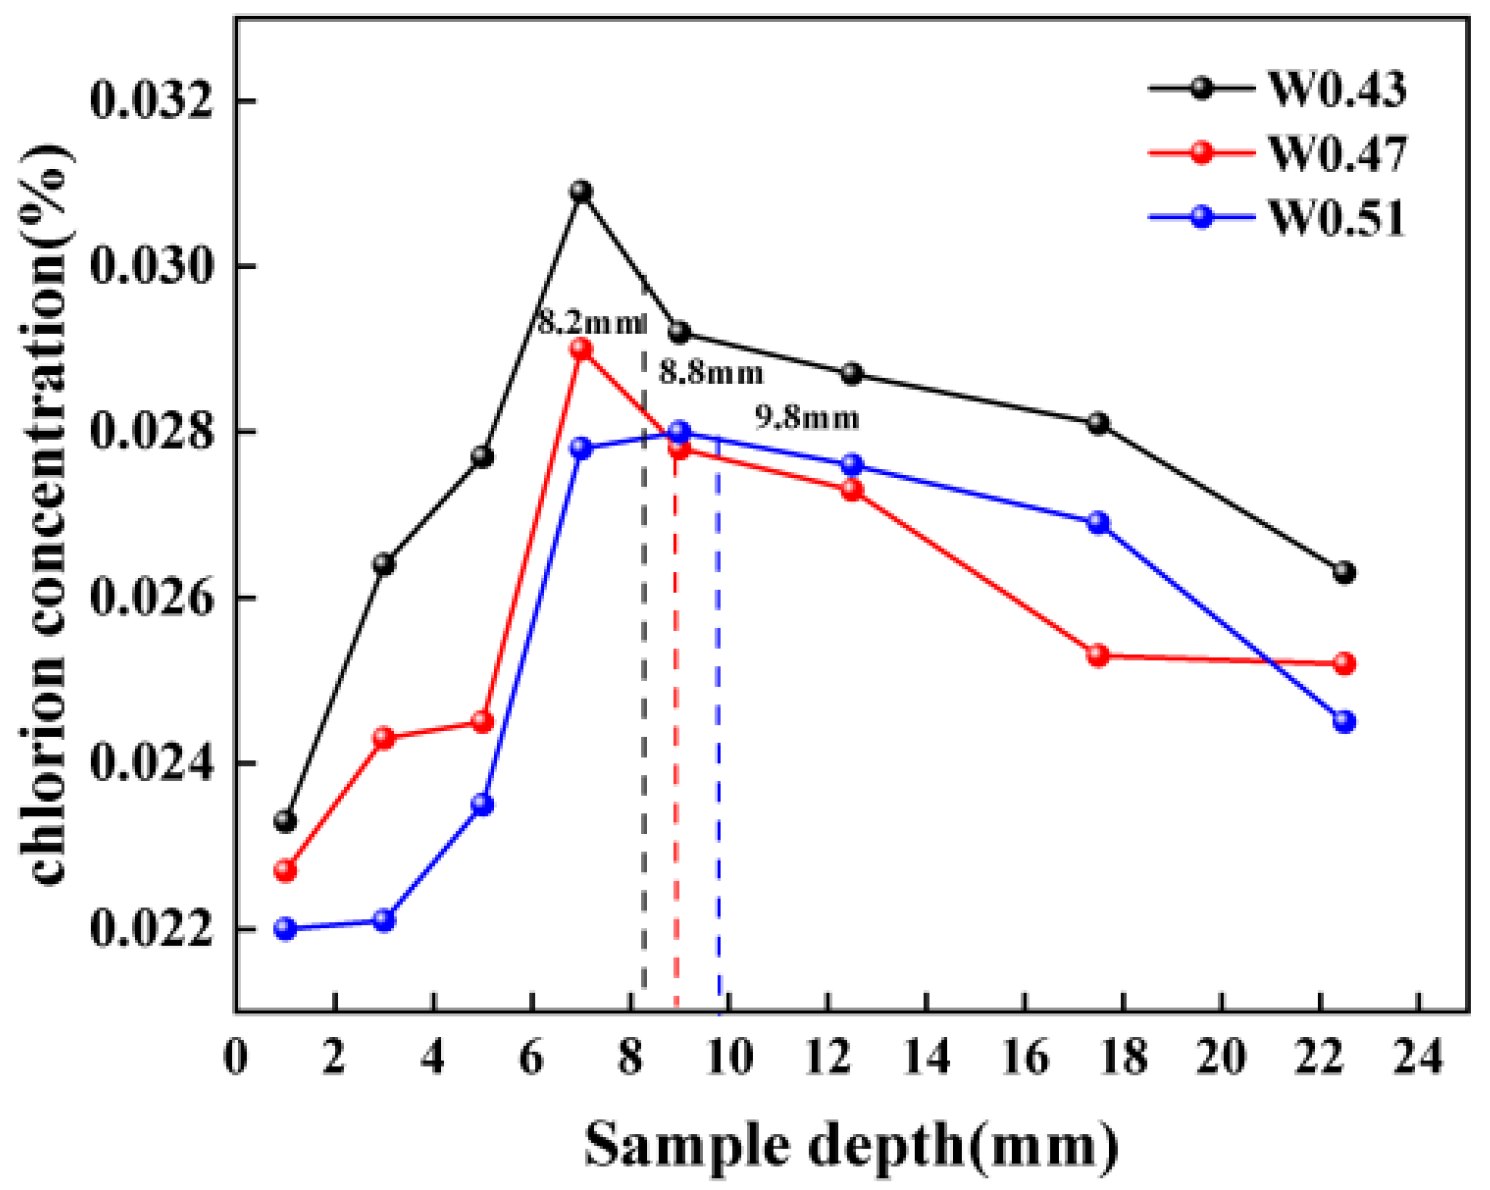
3.3.3. The Distribution of Chloridion under Carbonation
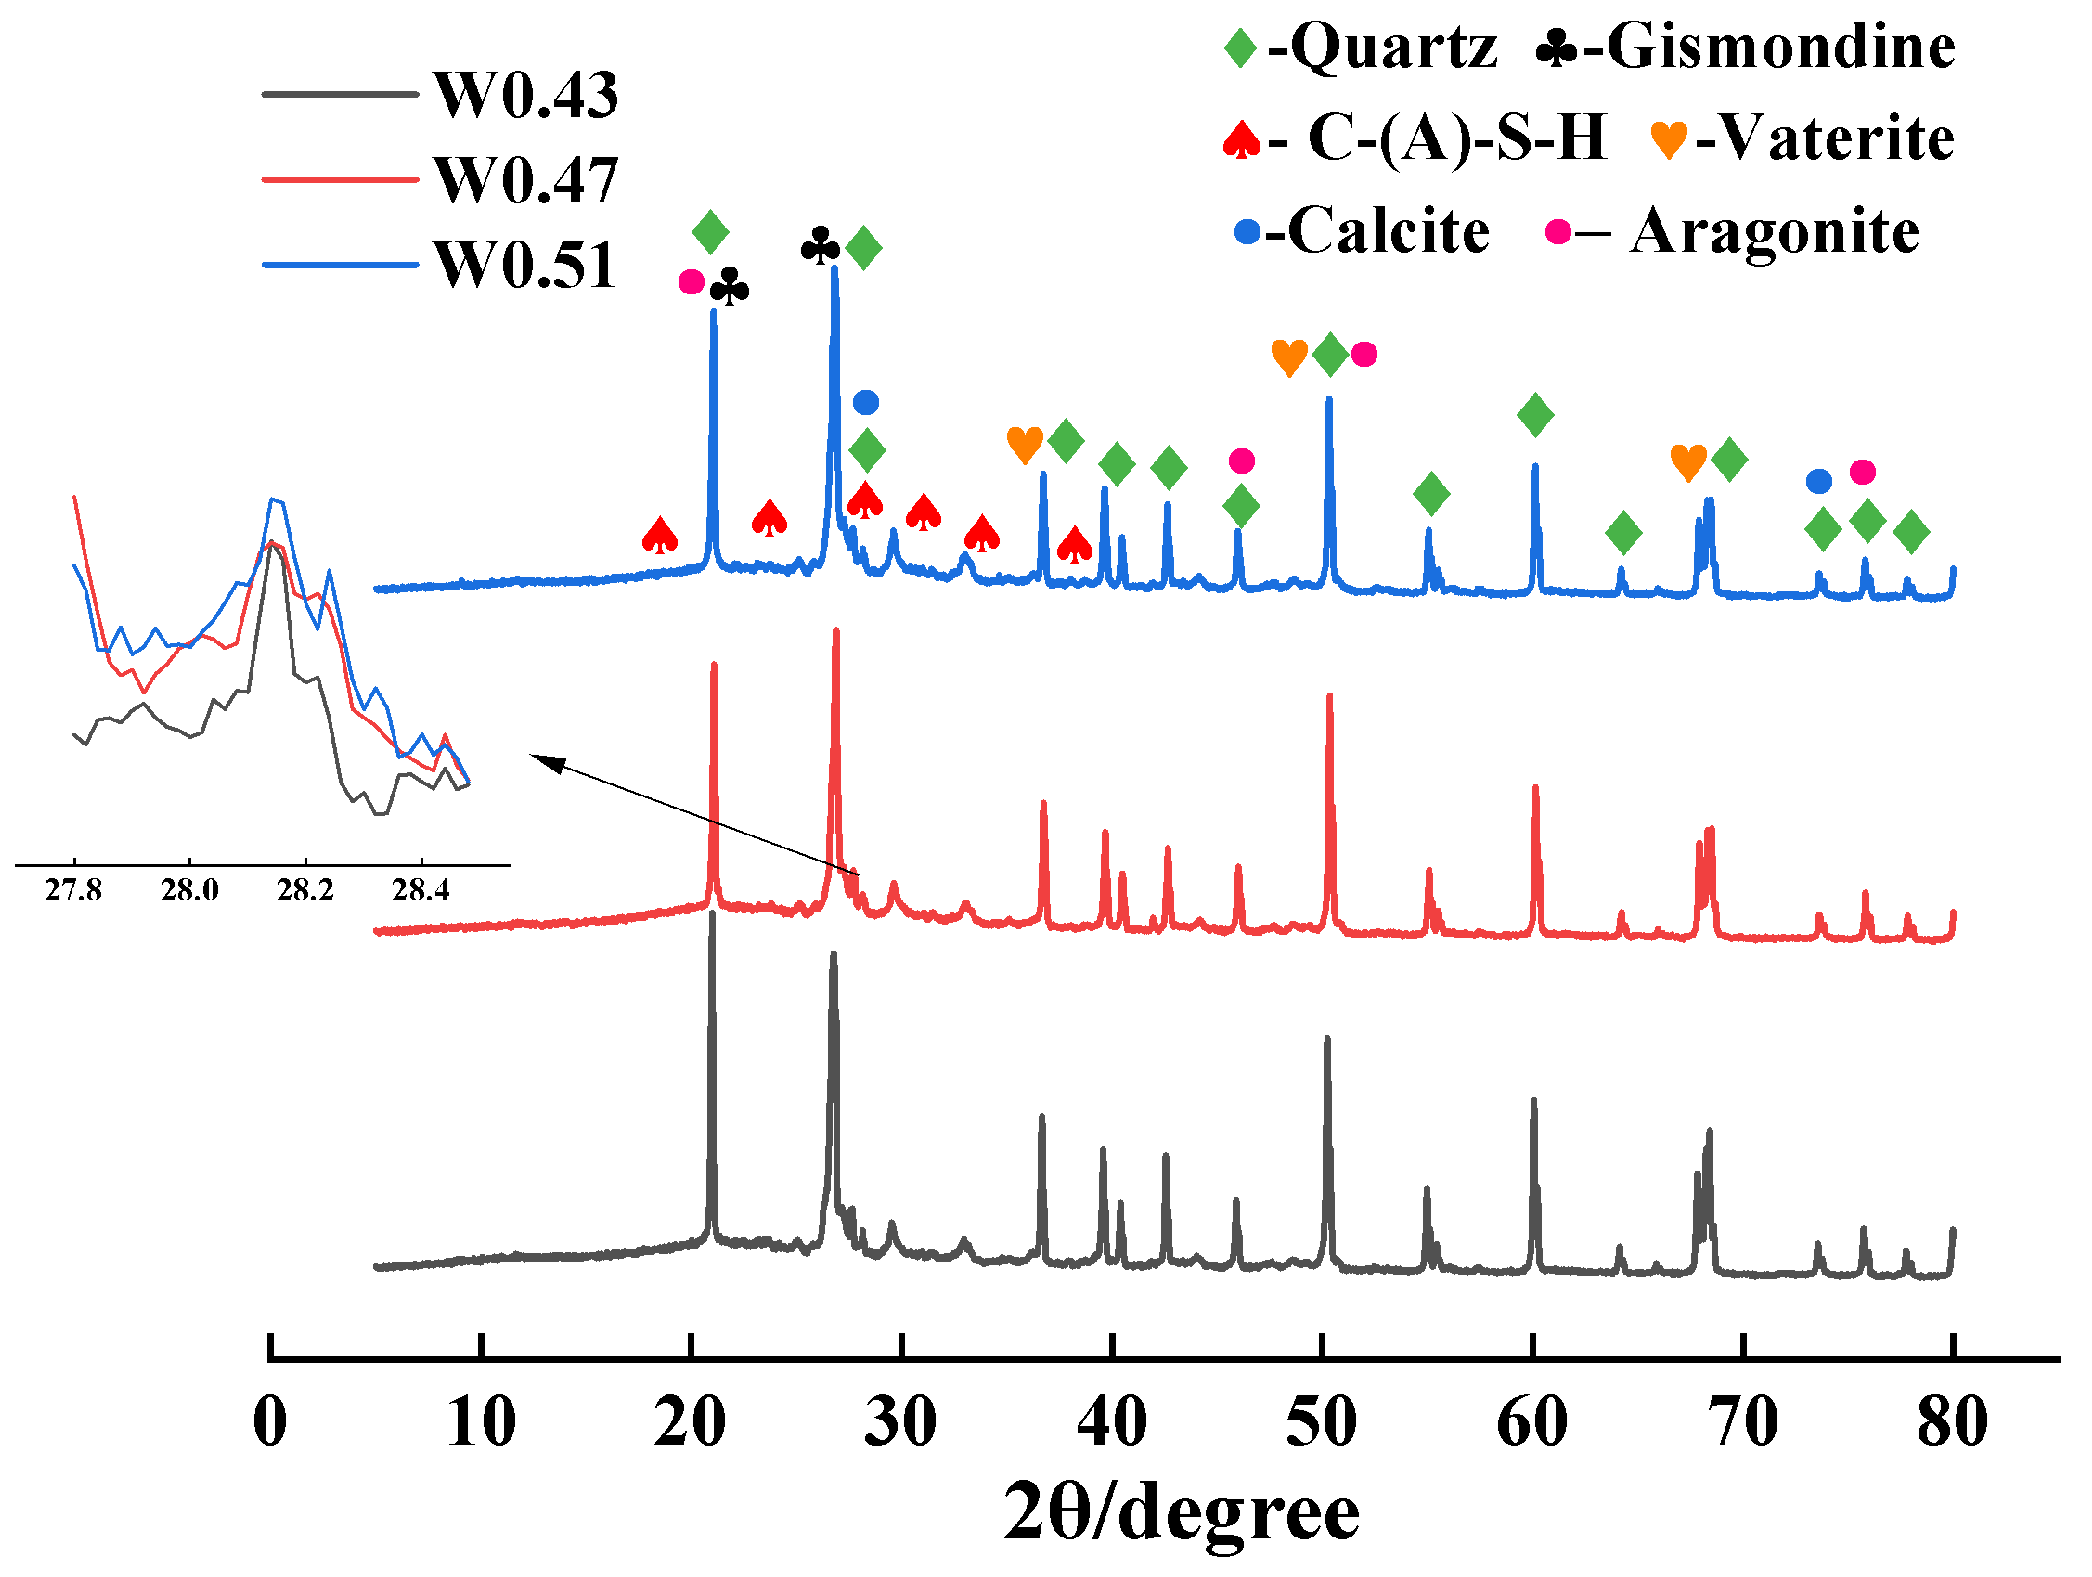
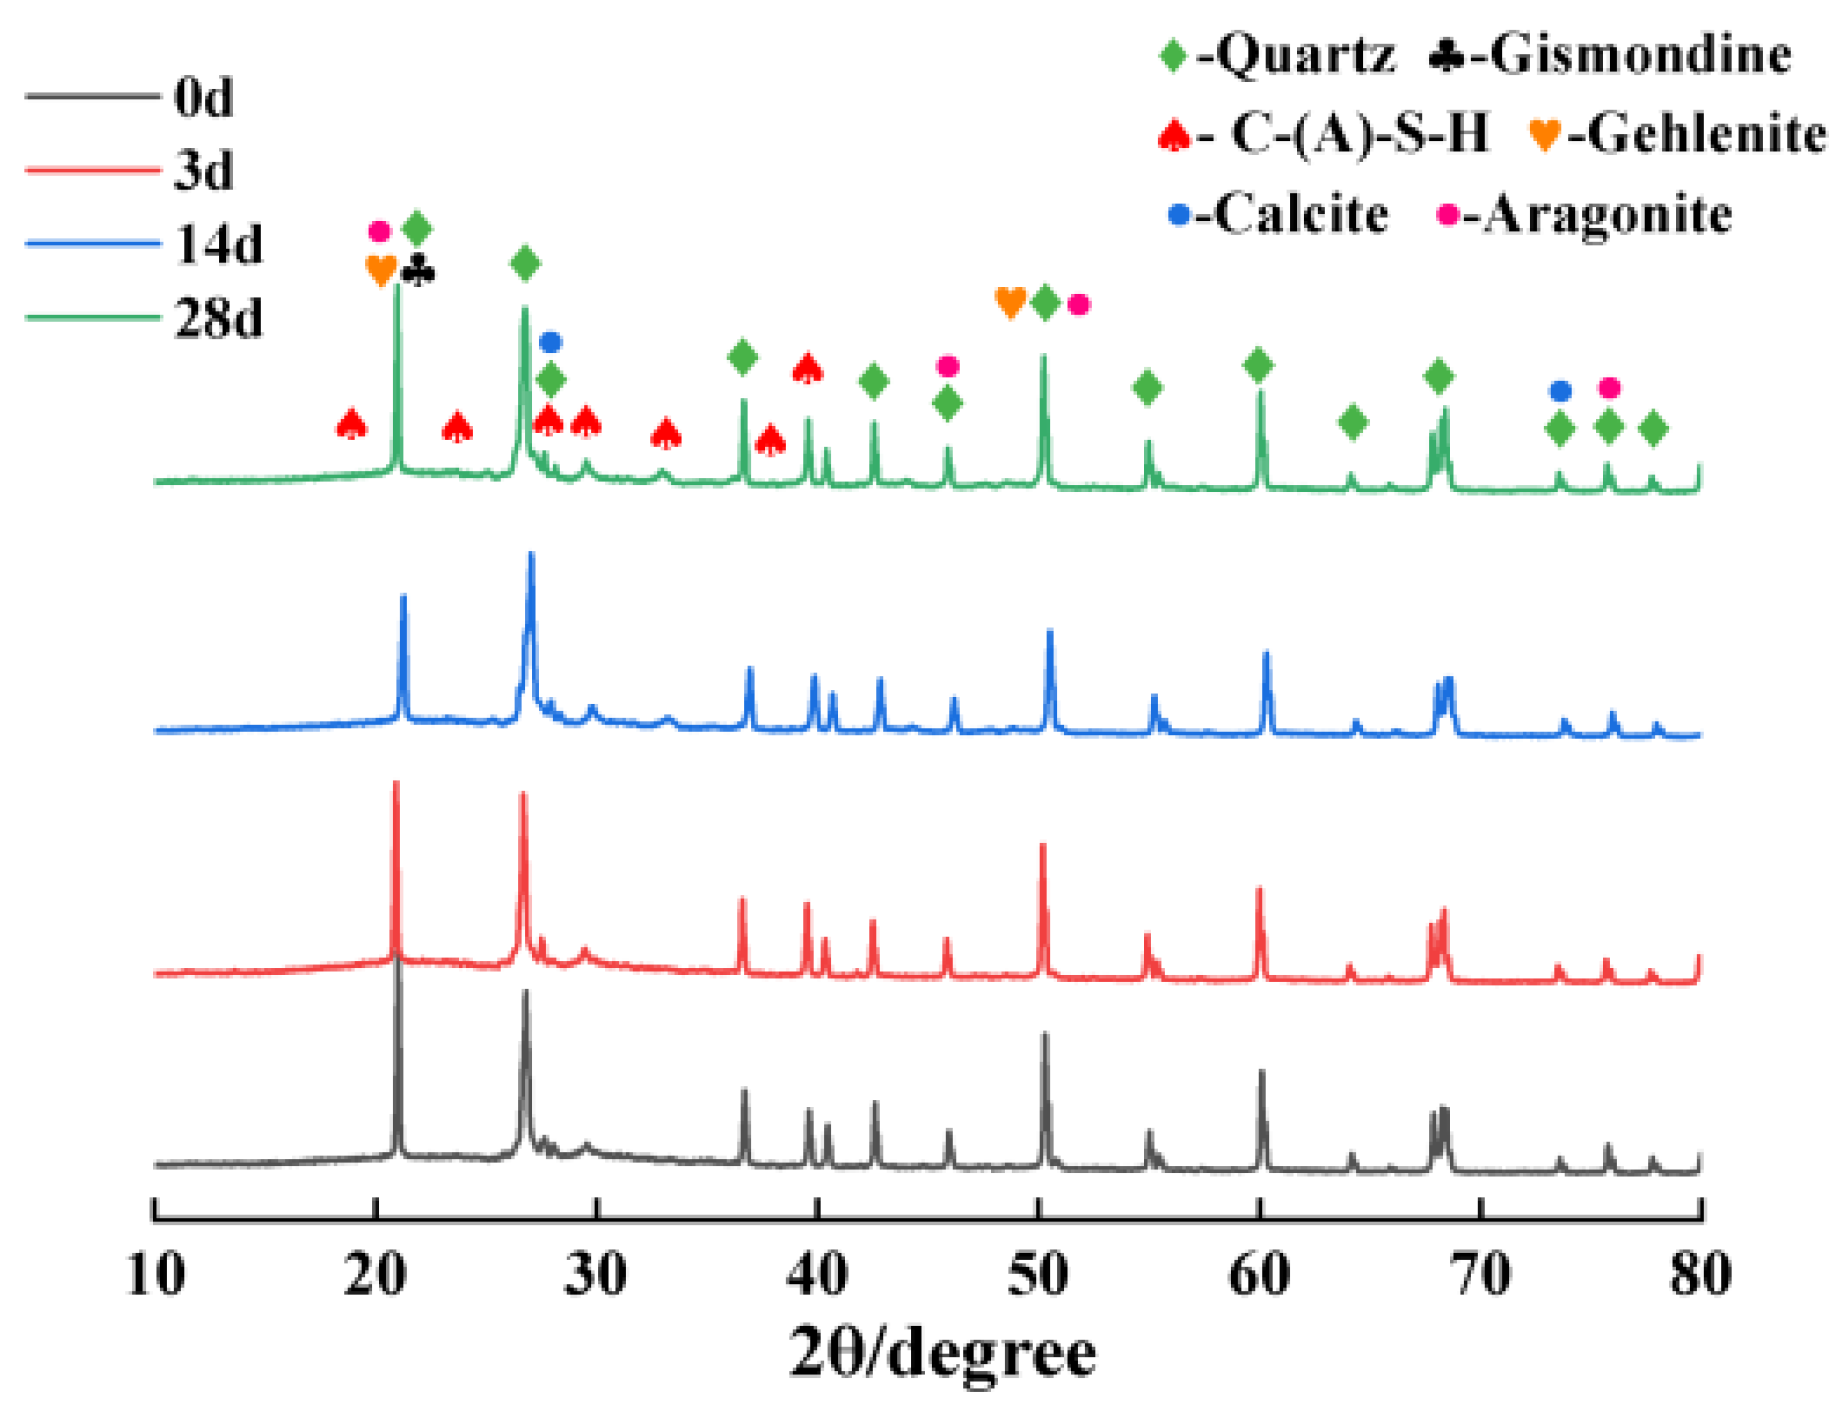
3.4. XRD
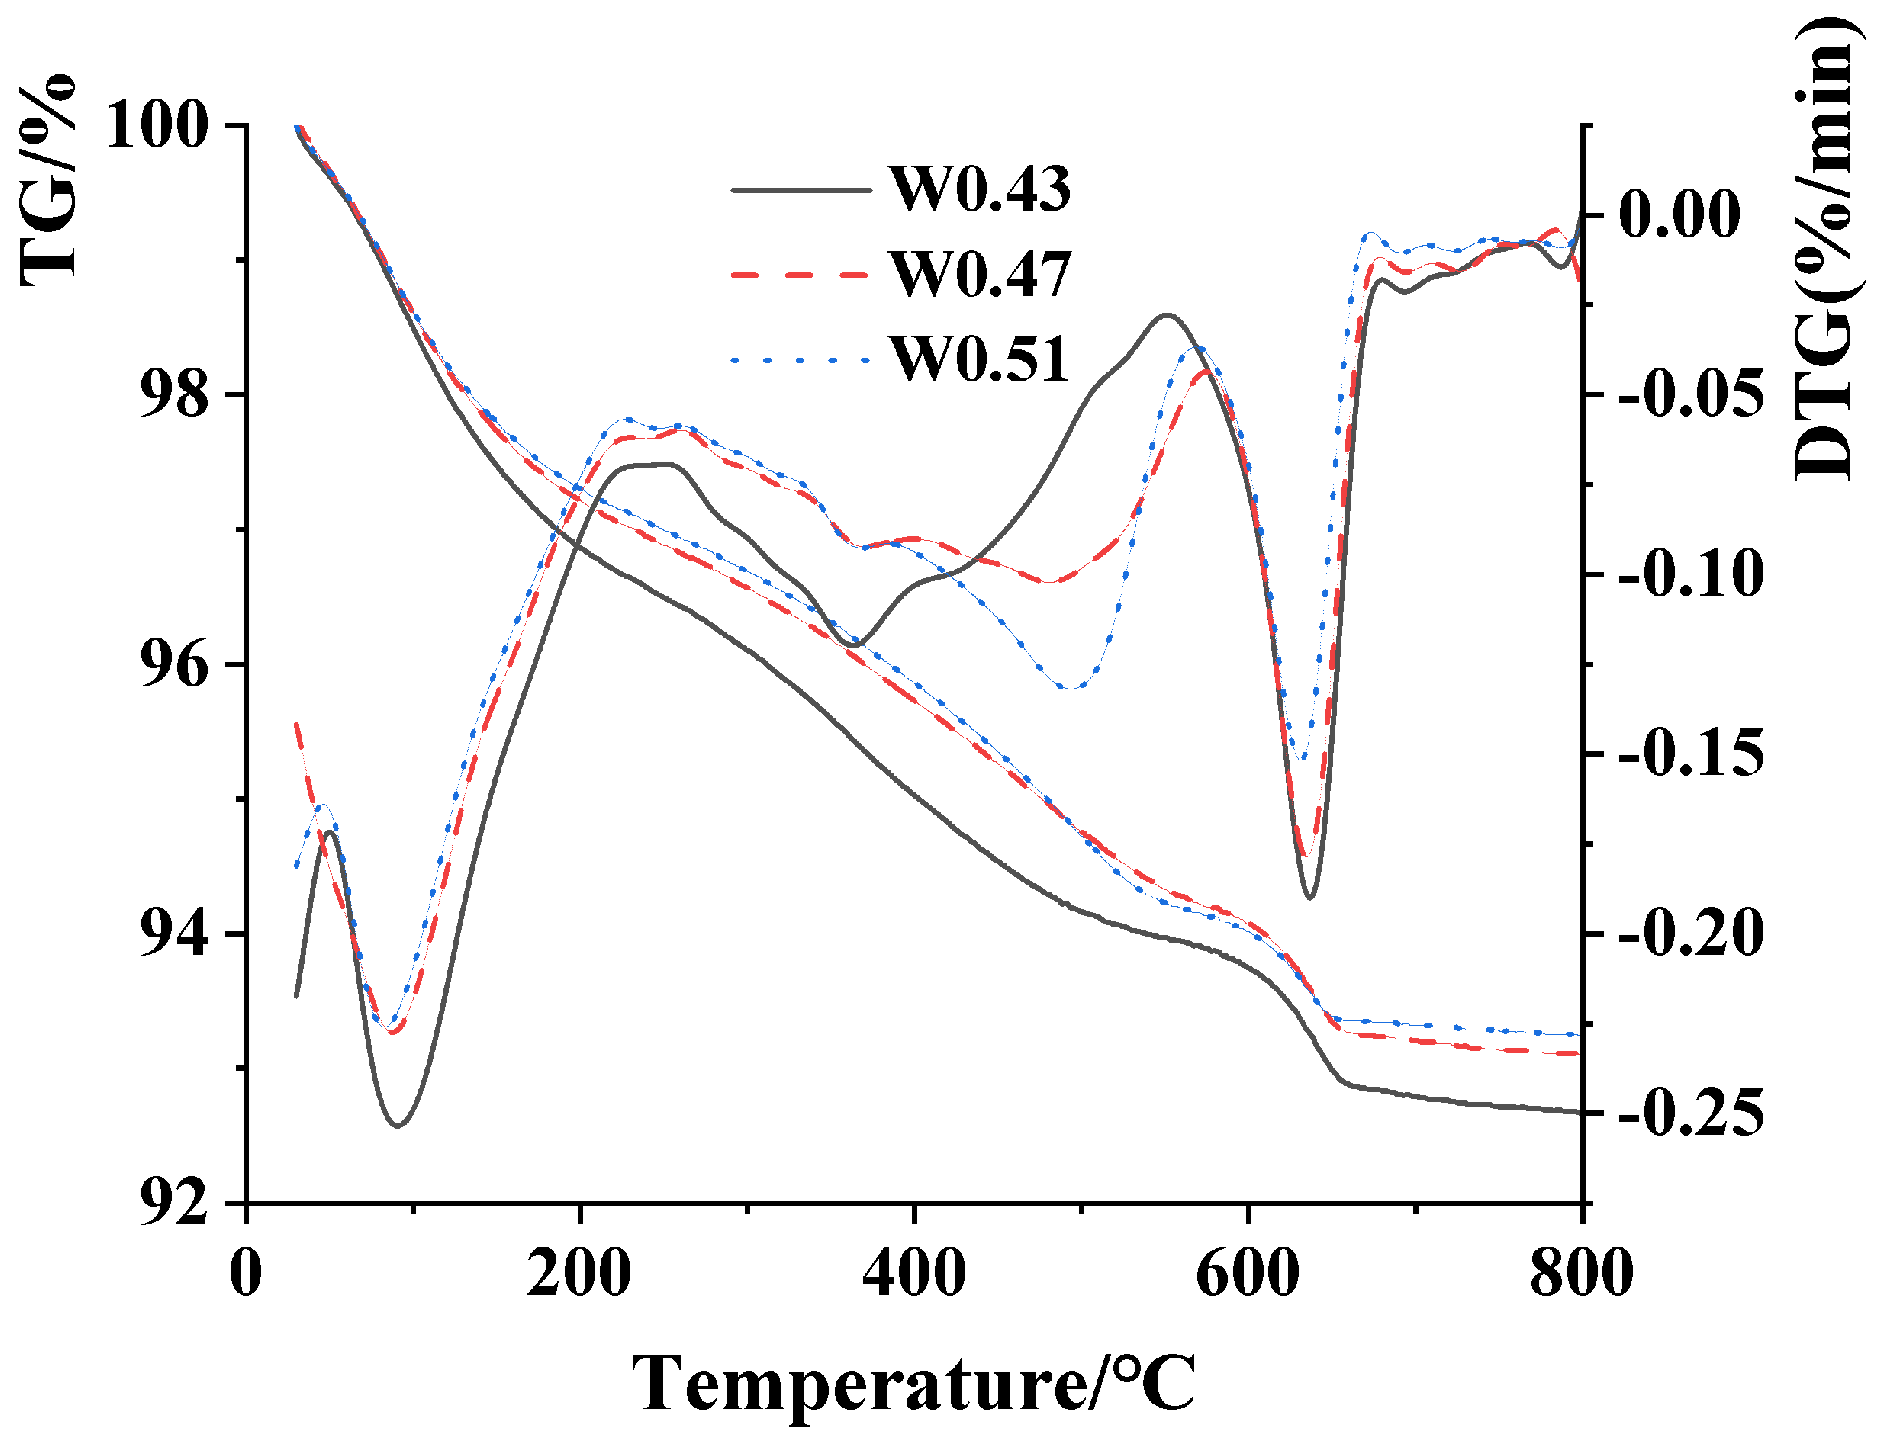
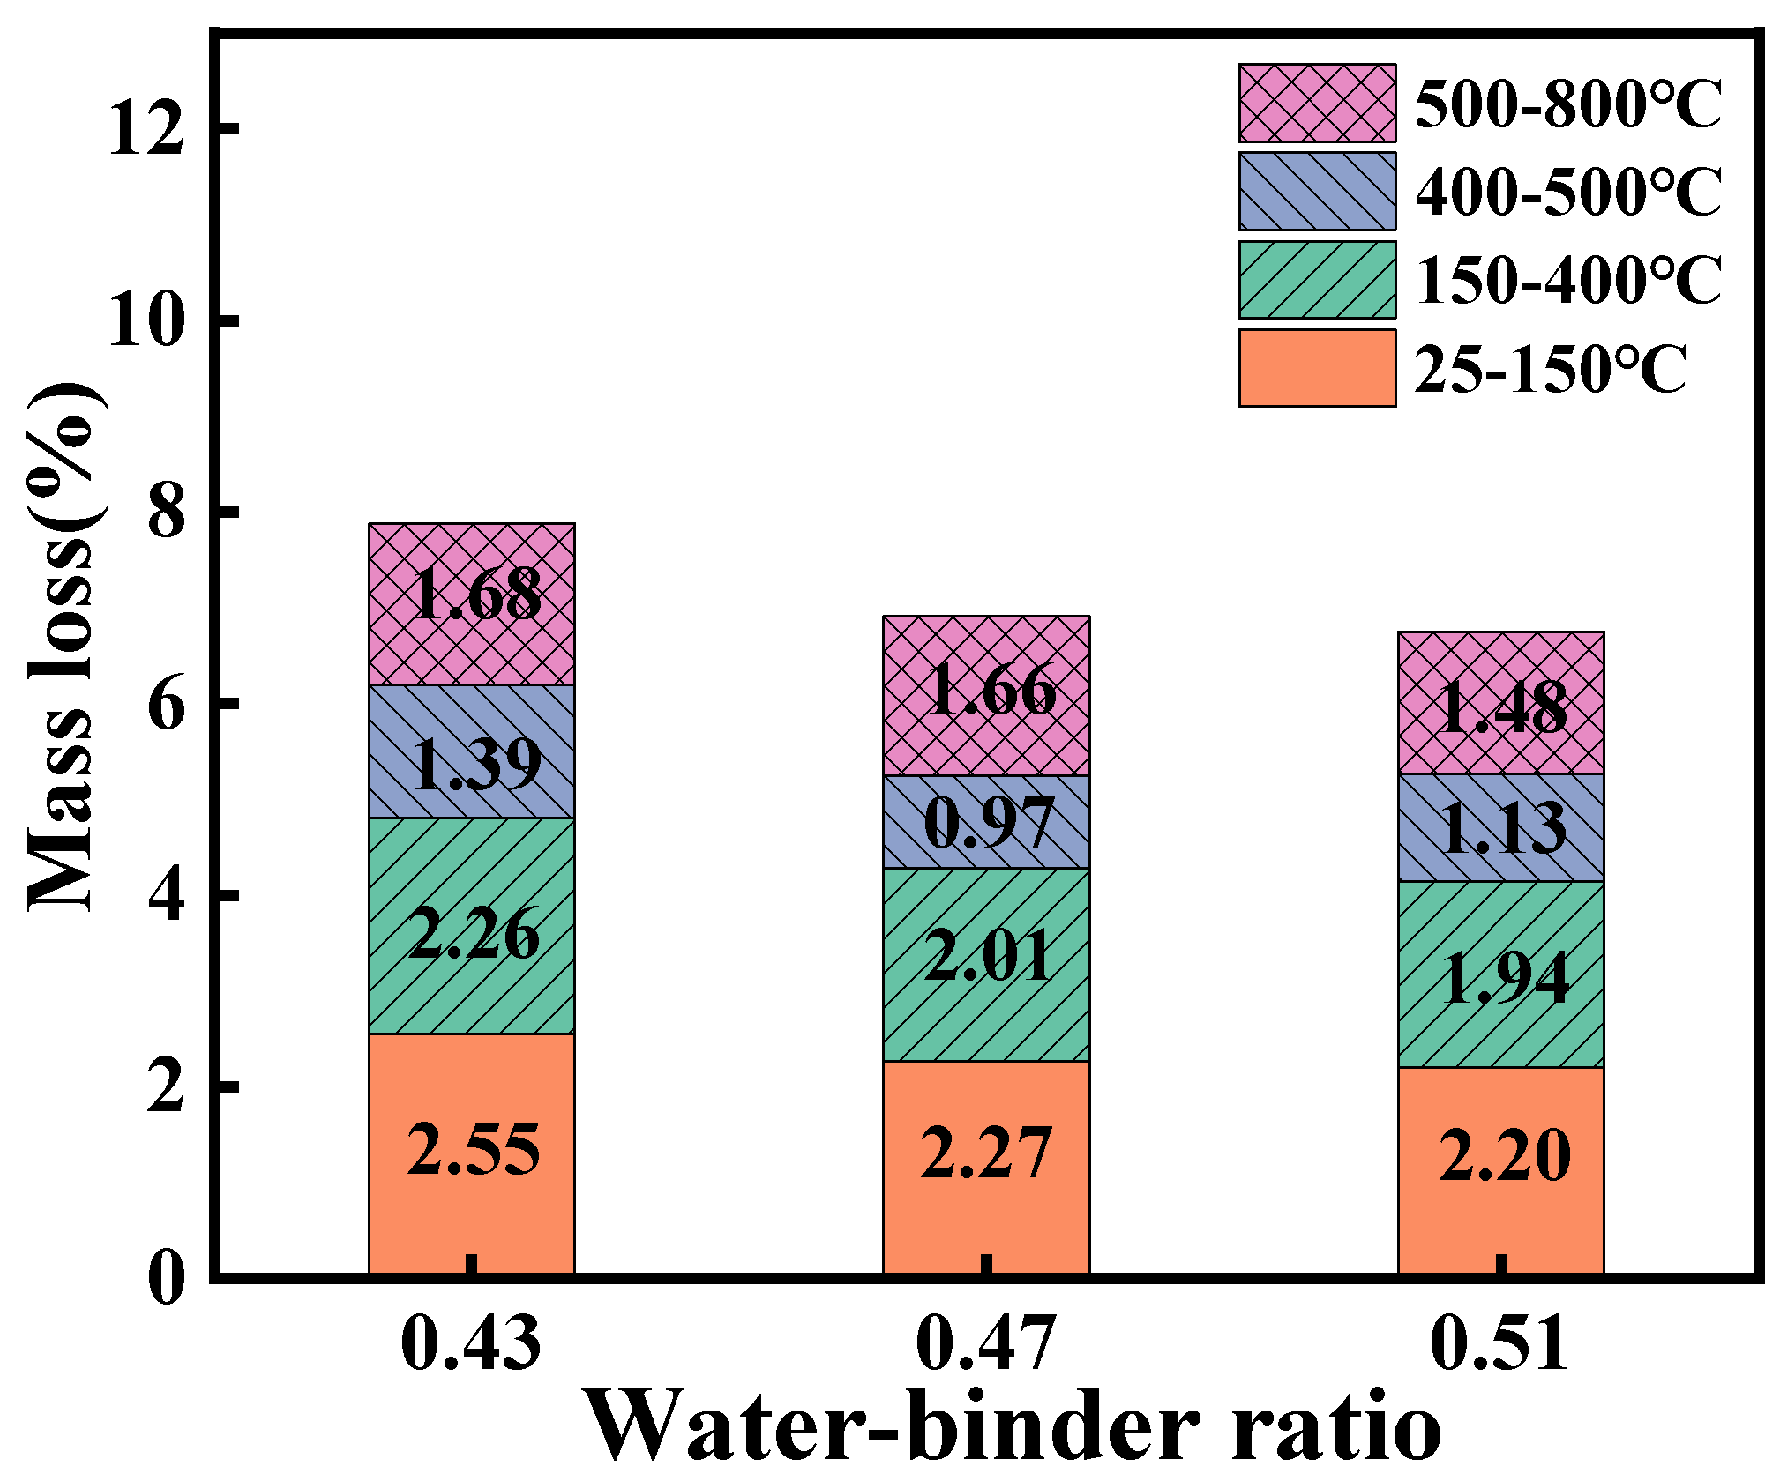
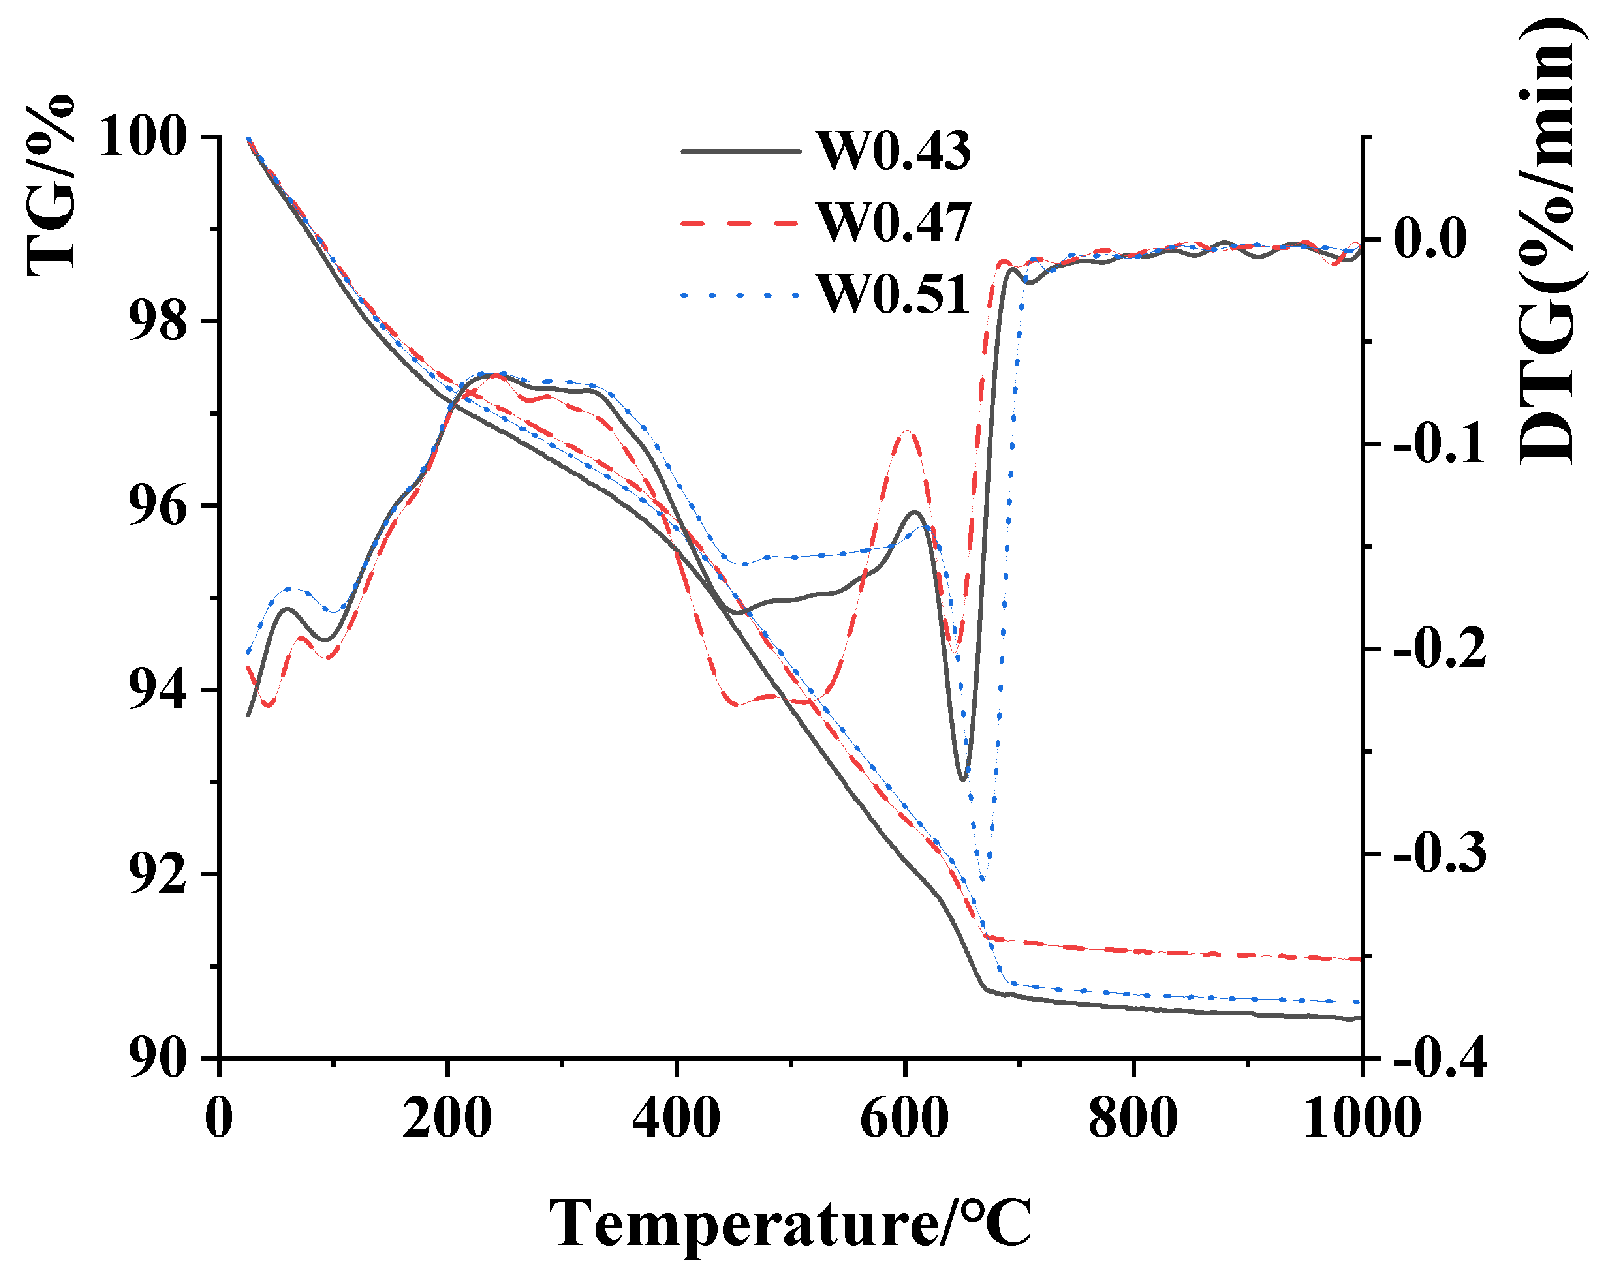
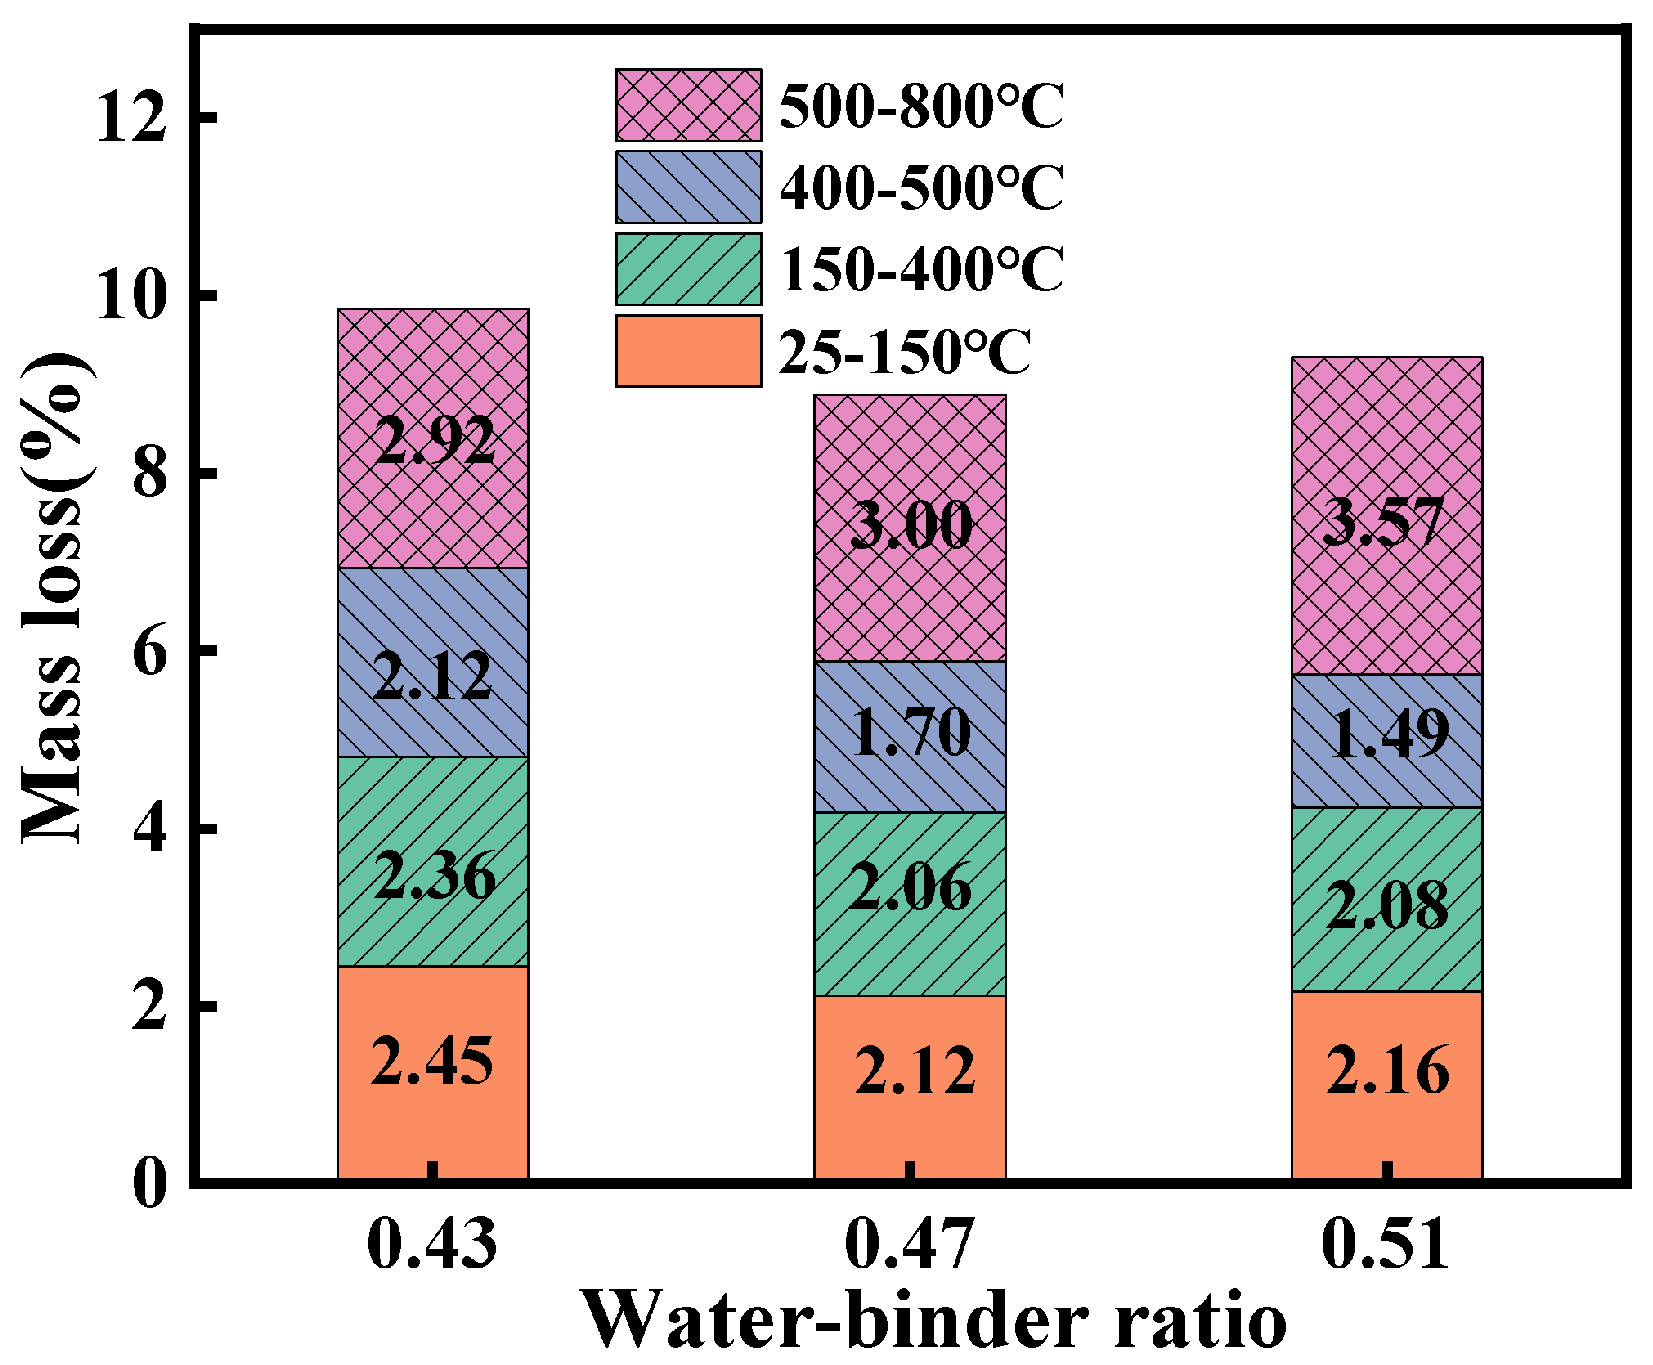
3.5. TG
3.6. Pore Structure
4. Conclusions and Prospect
- (1)
- Mortar specimens with a lower W/B ratio demonstrate more complete hydration, resulting in lower porosity and enhanced mechanical properties, though they exhibit poorer flowability.
- (2)
- Increasing the W/B ratio results in a decrease in the quantity of hydration products, higher porosity, accelerated carbonation reaction rates, and faster chloride ion transmission and release.
- (3)
- During carbonation, the C-(A)-S-H gel in the samples initially undergoes decalcification, reducing the porosity and compressive strength. As carbonation continues, the generation of CaCO3 fills the pores, which decreases porosity and gradually enhances strength.
- (4)
- The carbonation process significantly influences the Cl− distribution. In the carbonated interface area of the mortar, chloride ion concentration is substantially higher than in non-carbonated areas. This indicates that carbonation drives the transmission of Cl− from the sea sand towards the carbonation interface, resulting in a peak concentration of chloride ions just ahead of this interface. Notably, samples from groups with higher water–binder ratios exhibit higher peak concentrations and deeper peak locations, suggesting a heightened risk of chloride ion erosion.
- (5)
- Our research on the interaction between carbonation and chloride ions in SSAS concrete has significant implications for developing predictive models and service life estimation tools. By incorporating these interactions into future models, we can more accurately predict the long-term durability of SSAS concrete structures under various environmental conditions.
- (6)
- The research findings of this study have multiple potential practical applications, including the design of more durable marine structures, the development of eco-friendly building materials, and the improvement of the corrosion resistance of reinforced concrete. Future research will focus on optimizing the mix design of SSAS concrete, exploring its long-term performance under various environmental conditions, and developing advanced models for predicting the service life of SSAS concrete structures. Further studies will also investigate the use of different types of sea sand and alkali activators to enhance the performance of SSAS concrete.
Author Contributions
Funding
Data Availability Statement
Conflicts of Interest
References
- Provis, J.L.; Bernal, S.A. Geopolymers and Related Alkali-Activated Materials. Annu. Rev. Mater. Res. 2014, 44, 299–327. [Google Scholar] [CrossRef]
- Shen, Y.; Kang, S.; Cheng, G.; Wang, J.; Wu, W.; Wang, X.; Zhao, Y.; Li, Q. Effects of silicate modulus and alkali dosage on the performance of one-part electric furnace nickel slag-based geopolymer repair materials. Case Stud. Constr. Mater. 2023, 19, e02224. [Google Scholar] [CrossRef]
- Shi, K.; Deng, H.; Hu, J.; Zhou, J.; Cai, X.; Liu, Z. Effects of Steel Slag Powder Content and Curing Condition on the Performance of Alkali-Activated Materials Based UHPC Matrix. Materials 2023, 16, 3875. [Google Scholar] [CrossRef] [PubMed]
- Qaidi, S.; Najm, H.M.; Abed, S.M.; Ahmed, H.U.; Al Dughaishi, H.; Al Lawati, J.; Sabri, M.M.; Alkhatib, F.; Milad, A. Fly Ash-Based Geopolymer Composites: A Review of the Compressive Strength and Microstructure Analysis. Materials 2022, 15, 7098. [Google Scholar] [CrossRef] [PubMed]
- Jaf, D.K.I.; Abdulrahman, P.I.; Mohammed, A.S.; Kurda, R.; Qaidi, S.M.; Asteris, P.G. Machine learning techniques and multi-scale models to evaluate the impact of silicon dioxide (SiO2) and calcium oxide (CaO) in fly ash on the compressive strength of green concrete. Constr. Build. Mater. 2023, 400, 132604. [Google Scholar] [CrossRef]
- Zhang, D.; Wang, X.; Kang, S.; Cheng, G.; Wu, W. The effect of slag and fly ash content on the properties of electric furnace nickel slag-based geopolymer used for repair materials. Case Stud. Constr. Mater. 2023, 19, e02284. [Google Scholar] [CrossRef]
- Kanagaraj, B.; Anand, N.; Lubloy, E. Performance evaluation of sodium silicate waste as a replacement for conventional sand in geopolymer concrete. J. Clean. Prod. 2022, 375, 134172. [Google Scholar] [CrossRef]
- Xiao, J.; Qiang, C.; Nanni, A.; Zhang, K. Use of sea-sand and seawater in concrete construction: Current status and future opportunities. Constr. Build. Mater. 2017, 155, 1101–1111. [Google Scholar] [CrossRef]
- Li, T.; Liu, X.; Zhang, Y.; Yang, H.; Zhi, Z.; Liu, L.; Ma, W.; Shah, S.P.; Li, W. Preparation of sea water sea sand high performance concrete (SHPC) and serving performance study in marine environment. Constr. Build. Mater. 2020, 254, 119114. [Google Scholar] [CrossRef]
- Ting, M.Z.Y.; Wong, K.S.; Rahman, M.E.; Joo, M.S. Mechanical and durability performance of marine sand and seawater concrete incorporating silicomanganese slag as coarse aggregate. Constr. Build. Mater. 2020, 254, 119195. [Google Scholar] [CrossRef]
- He, X.; Zhou, J. Mechanical characteristics of sea-sand concrete in simulated marine environment. Constr. Build. Mater. 2020, 274, 122098. [Google Scholar] [CrossRef]
- Thunga, K.; Das, T.V. An experimental investigation on concrete with replacement of treated sea sand as fine aggregate. Mater. Today Proc. 2020, 27, 1017–1023. [Google Scholar] [CrossRef]
- Teng, J.G.; Xiang, Y.; Yu, T.; Fang, Z. Development and mechanical behaviour of ultra-high-performance seawater sea-sand concrete. Adv. Struct. Eng. 2019, 22, 3100–3120. [Google Scholar] [CrossRef]
- Newman, K. Sea-dredged aggregates for concrete. In Proceedings of the Symposium: Sea-dredged Aggregates for Concrete, Sand and Gravel Association Great Britain, Buckinghamshire, UK, 9 December 1968. [Google Scholar]
- Ramaswamy, S.D.; Aziz, M.A.; Murthy, C.K. Sea dredged sand for concrete. In Extending Aggregate Resources; ASTM International: West Conshohocken, PA, USA, 1982; Volume 774, pp. 167–177. [Google Scholar] [CrossRef]
- Liu, W.; Xie, Y.J.; Dong, B.Q. Study on the characteristics of dredged marine sand and the mechanical properties of concrete made with dredged marine sand. Bull. Chin. Ceram. Soc. 2014, 33, 15–22. (In Chinese) [Google Scholar]
- Zhang, Q.; Xiao, J.; Zhang, P.; Zhang, K. Mechanical behaviour of seawater sea-sand recycled coarse aggregate concrete columns under axial compressive loading. Constr. Build. Mater. 2019, 229, 117050. [Google Scholar] [CrossRef]
- Yang, E.-I.; Yi, S.-T.; Leem, Y.-M. Effect of oyster shell substituted for fine aggregate on concrete characteristics: Part I. Fundamental properties. Cem. Concr. Res. 2005, 35, 2175–2182. [Google Scholar] [CrossRef]
- Zhang, G.L.; Mo, L.W.; Chen, J.B.; Liu, J.Z.; He, Z.M. Research on influence of chloride ion in sea sand on the performance of concrete. In Advanced Building Materials and Sustainable Architecture; Shao, Y., Hao, S., Luo, Y., Xing, J., Liu, Z., Eds.; Pts 1–4; Trans Tech Publications Ltd.: Stafa-Zurich, Switzerland, 2012; pp. 444–447. [Google Scholar]
- Wei, J.; Chen, R.; Huang, W.; Bian, X.; Chen, B. Effect of endogenous chloride ion content and mineral admixtures on the passivation behavior of reinforcement embedded in sea-sand ultra-high performance concrete matrix. Constr. Build. Mater. 2022, 321, 126402. [Google Scholar] [CrossRef]
- Jiang, Y.; Liu, J.Z.; Sun, W.; Zheng, C.Y.; Wu, S.Y. Study on the Properties of Sea Sand Concrete with Fly Ash. Adv. Mater. Res. 2014, 1065–1069, 1854–1857. [Google Scholar] [CrossRef]
- Zhu, N.; Jin, F.; Kong, X.; Xu, Y.; Zhou, J.; Wang, B.; Wu, H. Interface and anti-corrosion properties of sea-sand concrete with fumed silica. Constr. Build. Mater. 2018, 188, 1085–1091. [Google Scholar] [CrossRef]
- Bakharev, T. Durability of geopolymer materials in sodium and magnesium sulfate solutions. Cem. Concr. Res. 2004, 35, 1233–1246. [Google Scholar] [CrossRef]
- Noushini, A.; Castel, A.; Aldred, J.; Rawal, A. Chloride diffusion resistance and chloride binding capacity of fly ash-based geopolymer concrete. Cem. Concr. Compos. 2019, 105, 103290. [Google Scholar] [CrossRef]
- Babaee, M.; Castel, A. Chloride diffusivity, chloride threshold, and corrosion initiation in reinforced alkali-activated mortars: Role of calcium, alkali, and silicate content. Cem. Concr. Res. 2018, 111, 56–71. [Google Scholar] [CrossRef]
- El-Didamony, H.; Amer, A.A.; Ela-Ziz, H.A. Properties and durability of alkali-activated slag pastes immersed in sea water. Ceram. Int. 2012, 38, 3773–3780. [Google Scholar] [CrossRef]
- Liu, W.; Cui, H.; Dong, Z.; Xing, F.; Zhang, H.; Lo, T.Y. Carbonation of concrete made with dredged marine sand and its effect on chloride binding. Constr. Build. Mater. 2016, 120, 1–9. [Google Scholar] [CrossRef]
- Moreno, M.; Morris, W.; Alvarez, M.G.; Duffó, G.S. Corrosion of reinforcing steel in simulated concrete pore solutions: Effect of carbonation and chloride content. Corros. Sci. 2004, 46, 2681–2699. [Google Scholar] [CrossRef]
- Huet, B.; L’hostis, V.; Miserque, F.; Idrissi, H. Electrochemical behavior of mild steel in concrete: Influence of pH and carbonate content of concrete pore solution. Electrochim. Acta 2005, 51, 172–180. [Google Scholar] [CrossRef]
- Suryavanshi, A.; Swamy, R.N. Stability of Friedel’s salt in carbonated concrete structural elements. Cem. Concr. Res. 1996, 26, 729–741. [Google Scholar] [CrossRef]
- Miron, L.E.R.D.; Koleva, D.A. Concrete Durability: Cementitious Materials and Reinforced Concrete Properties, Behavior and Corrosion Resistance; Springer: Berlin, Germany, 2017; Available online: https://link.springer.com/book/10.1007/978-3-319-55463-1 (accessed on 14 February 2023).
- Chang, H. Chloride binding capacity of pastes influenced by carbonation under three conditions. Cem. Concr. Compos. 2017, 84, 1–9. [Google Scholar] [CrossRef]
- Al-Otaibi, S. Durability of concrete incorporating GGBS activated by water-glass. Constr. Build. Mater. 2007, 22, 2059–2067. [Google Scholar] [CrossRef]
- Glasser, F.P.; Kindness, A.; Stronach, S.A. Stability and solubility relationships in AFm phases: Part I. Chloride. sulfate and hydroxide. Cem. Concr. Res. 1999, 29, 861–866. [Google Scholar] [CrossRef]
- Liu, J.; Fan, X.; Liu, J.; Jin, H.; Zhu, J.; Liu, W. Investigation on mechanical and micro properties of concrete incorporating seawater and sea sand in carbonized environment. Constr. Build. Mater. 2021, 307, 124986. [Google Scholar] [CrossRef]
- Dang, V.Q.; Ogawa, Y.; Bui, P.T.; Kawai, K. Effects of chloride ions on the durability and mechanical properties of sea sand concrete incorporating supplementary cementitious materials under an accelerated carbonation condition. Constr. Build. Mater. 2021, 274, 122016. [Google Scholar] [CrossRef]
- Wu, W.; Kang, S.; Wang, X.; Liu, H. Study on carbonation resistance and chloride ion distribution after carbonation of alkali-activated raw sea sand slag mortar. Case Stud. Constr. Mater. 2023, 19, e02649. [Google Scholar] [CrossRef]
- GB/T 14684-2011; Building Sand. General Administration of Quality Supervision, Inspection and Quarantine of the People’s Republic of China: Beijing, China, 2011.
- JGJ52-2006; Standard for Quality and Inspection Method of Sand and Stone for Ordinary Concrete Standard for Quality and Inspection Method of Sand and Stone for Ordinary Concrete. Ministry of Housing and Urban-Rural Development, PRC: Beijing, China, 2006.
- Wang, X.; Wu, W.; Zhang, L.; Fu, L.; Li, X. Preparation of one-part alkali-activated nickel slag binder using an optimal ball milling process. Constr. Build. Mater. 2022, 322, 125902. [Google Scholar] [CrossRef]
- GB/T 2419-2005; Method for Determining the Flowability of Cementitious sand. General Administration of Quality Supervision, Inspection and Quarantine of the People’s Republic of China: Beijing, China, 2005.
- GB/T 17671-1999; Test Method for Strength of Cementitious Sand (ISO Method). The State Bureau of Quality and Technical Supervision: Beijing, China, 1999.
- GB/T 50082-2009; Standard for Long-Term Performance and Durability Test Methods for Ordinary Concrete. Ministry of Housing and Urban-Rural Development, PRC: Beijing, China, 2009.
- Yuan, Q. Basic Research on the Test Method of Chloride Transport in Cementitious Materials; Central South University: Changsha, China, 2009. [Google Scholar]
- Lee, N.K.; Lee, H.K. Setting and Mechanical Properties of Alkali-Activated Fly Ash/Slag Concrete Manufactured at Room Temperature. Constr. Build. Mater. 2013, 47, 1201–1209. [Google Scholar] [CrossRef]
- Wang, X.; Wen, P.; Gao, Z.; Wang, C. Research on influence of water-cement ratio on workability and mechanical properties of geopolymer grouting material. IOP Conf. Ser. Mater. Sci. Eng. 2018, 292, 012087. [Google Scholar] [CrossRef]
- Shi, C.; Day, R.L. Some factors affecting early hydration of alkali-slag cements. Cem. Concr. Res. 1996, 26, 439–447. [Google Scholar] [CrossRef]
- Zheng, S.; Liu, T.; Jiang, G.; Fang, C.; Qu, B.; Gao, P.; Li, L.; Feng, Y. Effects of Water-to-Cement Ratio on Pore Structure Evolution and Strength Development of Cement Slurry Based on HYMOSTRUC3D and Micro-CT. Appl. Sci. 2021, 11, 3063. [Google Scholar] [CrossRef]
- Zhang, X.; Long, K.; Liu, W.; Li, L.; Long, W.-J. Carbonation and Chloride Ions’ Penetration of Alkali-Activated Materials: A Review. Molecules 2020, 25, 5074. [Google Scholar] [CrossRef] [PubMed]
- Vogler, N.; Drabetzki, P.; Lindemann, M.; Kühne, H.-C. Description of the concrete carbonation process with adjusted depth-resolved thermogravimetric analysis. J. Therm. Anal. Calorim. 2021, 147, 6167–6180. [Google Scholar] [CrossRef]
- Soroka, I.; Baum, H. Influence of Specimen Size on Effect of Curing Regime on Concrete Compressive Strength. J. Mater. Civ. Eng. 1994, 6, 15–22. [Google Scholar] [CrossRef]
- Song, H.-W.; Kwon, S.-J. Permeability characteristics of carbonated concrete considering capillary pore structure. Cem. Concr. Res. 2007, 37, 909–915. [Google Scholar] [CrossRef]
- Shi, Z.; Shi, C.; Wan, S.; Li, N.; Zhang, Z. Effect of alkali dosage and silicate modulus on carbonation of alkali-activated slag mortars. Cem. Concr. Res. 2018, 113, 55–64. [Google Scholar] [CrossRef]
- Komljenović, M.M.; Baščarević, Z.; Marjanović, N.; Nikolić, V. Decalcification resistance of alkali-activated slag. J. Hazard. Mater. 2012, 233–234, 112–121. [Google Scholar] [CrossRef] [PubMed]
- Auroy, M.; Poyet, S.; Le Bescop, P.; Torrenti, J.M.; Charpentier, T.; Moskura, M.; Bourbon, X. Impact of carbonation on unsaturated water transport properties of cement-based materials. Cem. Concr. Res. 2015, 74, 44–58. [Google Scholar] [CrossRef]
- Morandeau, A.; Thiéry, M.; Dangla, P. Investigation of the carbonation mechanism of CH and C-S-H in terms of kinetics, microstructure changes and moisture properties. Cem. Concr. Res. 2014, 56, 153–170. [Google Scholar] [CrossRef]
- Šavija, B.; Luković, M. Carbonation of cement paste: Understanding, challenges, and opportunities. Constr. Build. Mater. 2016, 117, 285–301. [Google Scholar] [CrossRef]
- Borges, P.H.; Costa, J.O.; Milestone, N.B.; Lynsdale, C.J.; Streatfield, R.E. Carbonation of CH and C–S–H in composite cement pastes containing high amounts of BFS. Cem. Concr. Res. 2010, 40, 284–292. [Google Scholar] [CrossRef]
- Zhang, D.; Shao, Y. Effect of early carbonation curing on chloride penetration and weathering carbonation in concrete. Constr. Build. Mater. 2016, 123, 516–526. [Google Scholar] [CrossRef]
- Liu, J.; Qiu, Q.; Chen, X.; Wang, X.; Xing, F.; Han, N.; He, Y. Degradation of fly ash concrete under the coupled effect of carbonation and chloride aerosol ingress. Corros. Sci. 2016, 112, 364–372. [Google Scholar] [CrossRef]
- Liu, R.; Li, J.; Xiao, H.; Yao, D.; Yang, W. Chloride ion diffusion performance of concrete and its influence on scour resistance. Structures 2024, 60, 105789. [Google Scholar] [CrossRef]
- Ruiz-Santaquiteria, C.; Skibsted, J.; Fernández-Jiménez, A.; Palomo, A. Alkaline solution/binder ratio as a determining factor in the alkaline activation of aluminosilicates. Cem. Concr. Res. 2012, 42, 1242–1251. [Google Scholar] [CrossRef]
- Bernal, S.A.; de Gutierrez, R.M.; Provis, J.L.; Rose, V. Effect of silicate modulus and metakaolin incorporation on the carbonation of alkali silicate-activated slags. Cem. Concr. Res. 2010, 40, 898–907. [Google Scholar] [CrossRef]
- Villain, G.; Thiery, M.; Platret, G. Measurement methods of carbonation profiles in concrete: Thermogravimetry, chemical analysis and gammadensimetry. Cem. Concr. Res. 2007, 37, 1182–1192. [Google Scholar] [CrossRef]
- Šauman, Z. Carbonization of porous concrete and its main binding components. Cem. Concr. Res. 1971, 1, 645–662. [Google Scholar] [CrossRef]
- Zhang, Z.; Provis, J.L.; Reid, A.; Wang, H. Fly ash-based geopolymers: The relationship between composition, pore structure and efflorescence. Cem. Concr. Res. 2014, 64, 30–41. [Google Scholar] [CrossRef]
- Ramachandran, V.S.; Paroli, R.M.; Beaudoin, J.J.; Delgado, A.H. Handbook of Thermal Analysis of Construction Materials; Noyes Publication/William Andrew Publishing: Norwich, NY, USA, 2003. [Google Scholar] [CrossRef]
- Hidalgo, A.; Domingo, C.; Garcia, C.; Petit, S.; Andrade, C.; Alonso, C. Microstructural changes induced in Portland cement-based materials due to natural and supercritical carbonation. J. Mater. Sci. 2008, 43, 3101–3111. [Google Scholar] [CrossRef]
- Zhang, G.; Lin, R.; Wang, Y.; Wang, X. Influence of K+ and CO32− in activator on high-temperature performance of alkali-activated slag-ceramic powder binary blends. Case Stud. Constr. Mater. 2022, 17, e01306. [Google Scholar] [CrossRef]
- Kumar, R.; Bhattacharjee, B. Study on some factors affecting the results in the use of MIP method in concrete research. Cem. Concr. Res. 2003, 33, 417–424. [Google Scholar] [CrossRef]
- Stroeven, P.; Hu, J.; Koleva, D. Concrete porosimetry: Aspects of feasibility, reliability and economy. Cem. Concr. Compos. 2010, 32, 291–299. [Google Scholar] [CrossRef]
- McCaslin, E.R.; White, C.E. A parametric study of accelerated carbonation in alkali-activated slag. Cem. Concr. Res. 2021, 145, 106454. [Google Scholar] [CrossRef]
- Wu, Z. Discussion on the recent development direction of concrete science and technology. J. Chin. Ceram. Soc. 1979, 3, 262–270. [Google Scholar]
- Li, Z.; Ikeda, K. Compositions and Microstructures of Carbonated Geopolymers with Different Precursors. Materials 2024, 17, 1491. [Google Scholar] [CrossRef] [PubMed]


| Density (g/cm3) | Cl− Concentration (%) | Fluidity Ratio (%) | Loss on Ignition (%) | Specific Surface Area (m2/kg) | Activity Index of 7 Days (%) | Activity Index of 28 Days (%) | Water Content (%) |
|---|---|---|---|---|---|---|---|
| 2.92 | 0.032 | 103 | 1.02 | 425 | 78 | 96 | 0.36 |
| CaO | SiO2 | Al2O3 | MgO | SO3 | TiO2 | Na2O | Fe2O3 | MnO | K2O | Cl | SrO | Others |
|---|---|---|---|---|---|---|---|---|---|---|---|---|
| 36.84 | 30.27 | 17.18 | 9.67 | 2.79 | 1.25 | 0.60 | 0.48 | 0.40 | 0.34 | 0.05 | 0.04 | 0.10 |
| RS | SS | |
|---|---|---|
| water content/% | 4.80 | 0.54 |
| soil content/% | 2.46 | 1.52 |
| Cl− content/% | 0.003 | 0.163 |
| Shell content/% | / | 11.20 |
| Cumulative Sieve Residue/% | RS | SS |
|---|---|---|
| A1 | 0.00 | 0.80 |
| A2 | 0.20 | 18.98 |
| A3 | 5.28 | 37.44 |
| A4 | 80.80 | 63.10 |
| A5 | 97.72 | 86.74 |
| A6 | 99.44 | 96.06 |
| Group | B/S (Binder/Sand) | W/B Ratio | Sea Sand Content | Alkali Dosage | Alkali Modulus |
|---|---|---|---|---|---|
| W0.39 | 1:2 | 0.39 | 30% | 6% | 1.0 |
| W0.43 | 1:2 | 0.43 | 30% | 6% | 1.0 |
| W0.47 | 1:2 | 0.47 | 30% | 6% | 1.0 |
| W0.51 | 1:2 | 0.51 | 30% | 6% | 1.0 |
| Group Number | Carbonization Age | Total Porosity/% | Harmless Pore (d ≤ 20 nm) | Less Harmful Pore (20 < d ≤ 50 nm) | Harmful Pore (50 < d ≤ 200 nm) | More Harmful Pore (d > 200 nm) |
|---|---|---|---|---|---|---|
| W0.43 | 0d | 11.20 | 7.71 | 0.31 | 0.27 | 2.91 |
| 14d | 13.34 | 4.42 | 2.09 | 2.00 | 4.83 | |
| 28d | 11.44 | 3.85 | 1.32 | 1.15 | 5.12 | |
| W0.51 | 0d | 15.47 | 11.12 | 0.86 | 0.33 | 3.16 |
| 28d | 15.50 | 4.23 | 2.37 | 2.86 | 6.04 |
Disclaimer/Publisher’s Note: The statements, opinions and data contained in all publications are solely those of the individual author(s) and contributor(s) and not of MDPI and/or the editor(s). MDPI and/or the editor(s) disclaim responsibility for any injury to people or property resulting from any ideas, methods, instructions or products referred to in the content. |
© 2024 by the authors. Licensee MDPI, Basel, Switzerland. This article is an open access article distributed under the terms and conditions of the Creative Commons Attribution (CC BY) license (https://creativecommons.org/licenses/by/4.0/).
Share and Cite
Wu, Y.; Kang, S.; Zhang, F.; Huang, H.; Liu, H.; Zhang, J.; Li, H.; Li, W.; Zheng, Z.; Wu, W. Study on the Effect of Water–Binder Ratio on the Carbonation Resistance of Raw Sea Sand Alkali-Activated Slag Concrete and the Distribution of Chloride Ions after Carbonation. Buildings 2024, 14, 2027. https://doi.org/10.3390/buildings14072027
Wu Y, Kang S, Zhang F, Huang H, Liu H, Zhang J, Li H, Li W, Zheng Z, Wu W. Study on the Effect of Water–Binder Ratio on the Carbonation Resistance of Raw Sea Sand Alkali-Activated Slag Concrete and the Distribution of Chloride Ions after Carbonation. Buildings. 2024; 14(7):2027. https://doi.org/10.3390/buildings14072027
Chicago/Turabian StyleWu, Yan, Sixiang Kang, Feng Zhang, Haisheng Huang, Haojie Liu, Jianbin Zhang, Hongze Li, Weihong Li, Zhou Zheng, and Wenda Wu. 2024. "Study on the Effect of Water–Binder Ratio on the Carbonation Resistance of Raw Sea Sand Alkali-Activated Slag Concrete and the Distribution of Chloride Ions after Carbonation" Buildings 14, no. 7: 2027. https://doi.org/10.3390/buildings14072027