Article

Evaluation of Urban Complex Utilization Based on AHP and MCDM Analysis: A Case Study of China

College of Architecture, Chang’an University, Xi’an 710064, China
*
Author to whom correspondence should be addressed.
Buildings 2024, 14(7), 2179; https://doi.org/10.3390/buildings14072179
Submission received: 18 June 2024 / Revised: 10 July 2024 / Accepted: 11 July 2024 / Published: 15 July 2024

Abstract

:
In the context of intensive urban development, urban complexes have emerged as crucial public spaces that address the needs of urban populations. However, current research on urban complexes is predominantly qualitative and lacks a rigorous scientific and quantitative analysis. Therefore, this study employs the analytic hierarchy process (AHP) to construct a standardized system encompassing five dimensions: spatial function, spatial perception, architectural style, surrounding environment, and energy-saving technology. The objective is to determine the weights of the indices that influence people’s use of urban complexes under the goal of “humanization”. Additionally, the study quantitatively analyzes key indices using spatial syntax and other analytical methods. Subsequently, we employ multi-criteria decision making (MCDM) analysis to examine three real-world cases in China, aiming to validate further the importance of the AHP + MCDM approach, which incorporates the TOPSIS method based on grey correlation. This methodology considers both the subjective factors of crowd evaluations of urban complex usage and the interrelationships among indicators, ensuring that the statistical calculations of the indicators remain objective and scientifically robust. The results indicate that (1) the degree of facility improvement has the greatest impact on the crowd’s use of urban complexes; (2) there is a discrepancy between the results of the TOPSIS method and the MCDM evaluation model, with the MCDM evaluation method aligning more closely with real-world scenarios; and (3) the Shanghai MOSCHINO received the highest evaluation score, while the Nanjing Central Emporium received the lowest. Finally, we discuss the experimental results and propose targeted strategies for optimizing the design of urban complexes to achieve the goal of “humanization”.

1. Introduction

1.1. Contexts

In the context of intensive urban development [1,2], urban complexes have become crucial public spaces that comprehensively meet the needs of the population. They serve as an effective means to enhance urban efficiency, improve the living environment, and promote sustainable development [3,4,5,6]. At the same time, the spatial properties of urban complexes can effectively prevent the land from focusing on a specific function with buildings of different functions relatively evenly distributed in lands of different natures [7].
However, in this developmental context, issues such as excessive scale and the uniformity of urban complexes [8,9] have emerged, resulting in a vicious cycle of unsatisfactory economic performance and low patronage of these spaces. Additionally, there are still significant gaps in China’s research regarding functional positioning, spatial layout, and the coordination between urban functions and the spatial organization of urban complexes [10]. These problems limit the potential of urban complexes to function effectively as public spaces. The fundamental issue lies in the fact that the design of urban complexes is predominantly macro-controlled from the perspective of urban planners and architects. This approach emphasizes the complexes’ urban functional characteristics and their significant role within the urban spatial framework system [11], but it often neglects the user perspective. Consequently, there is a mismatch between the needs of the population and the available space in urban complexes. This situation necessitates a comprehensive assessment of the current utilization status of urban complexes.
Post occupancy evaluation (POE) for user needs has now developed into a more mature and systematic approach. It offers a systematic and rigorous assessment of a building after it has been constructed and used for some time [12]. This evaluation enables architects to screen building design indicators based on user needs and harmonize the requirements of the crowd with the building space. POE encompasses more than 100 methods, including AHP analysis, TOPSIS analysis, and logistic regression analysis, among others [13].

1.2. Literature Review

Currently, many researchers and scholars utilize POE for the spatial and functional analysis of urban complexes (see Table 1). Some studies employ individual methods, such as the AHP hierarchical analysis method and the Likert scale method, to analyze the spatial use performance of urban complexes for post-use evaluation. For instance, Xiaochun Hong et al. used the AHP analysis method to evaluate the aboveground and underground spaces of urban commercial complexes. They established a targeted evaluation system for the performance of these spaces by creating a system of 22 indices and conducting expert scoring and analysis [14]. Yuchen Qin et al. proposed the Shannon–Weiner biodiversity index model and calculation index based on the functional diversity measurement model. They measured the coupled relationship between functional diversity and spatial vitality change of urban complexes, using Xiamen SM City Plaza as a case study, which is of great value for enhancing the benefits of urban complexes [15]. Černikovaitė et al. utilized a questionnaire interview method to assess the functional, emotional, and communicative consumer preferences of the Vilnius shopping center [16]. Wu, H. et al. employed an improved projection tracking model assessment method to analyze data after establishing an evaluation index system, providing a scientific and objective decision-making basis for large-scale commercial complex development enterprises. This approach helps reduce the risk of site selection and improve investment efficiency [17].
With the improvement of evaluation system methodologies, the assessment of urban complexes is no longer limited to single-method approaches. The composite use of multiple methods in POE is becoming increasingly prevalent. For instance, Rusi Zeng et al. employed the Likert scale method and logistic regression analysis to study the factors influencing user satisfaction. They discovered that users were relatively dissatisfied with the internal physical environment and that space proportion and morphology had a significant positive effect on user satisfaction. These findings are valuable for enhancing the design and utilization of urban underground complexes (UUCs) [17]. ZhongZhen Yang combined GIS and AHP analysis methods to analyze the impact of urban complexes in small cities on the environment and to determine the optimal locations for urban complexes within cities [18].
Table 1. A collection of existing reviews on the utilization evaluation of urban complexes. The table details the authors of the existing literature, the date of publication, the region where the study was conducted, the objectives of the study, and the evaluation methodology.
AuthorsDateRegionObjectivesMethodology
Xiaochun Hong et al. [14]2024Xuzhou, China, Nanjing, ChinaEstablish a targeted system for evaluating the performance of aboveground and underground spaces of urban complexes.AHP
Qin, Y. et al. [15]2022Xiamen, ChinaMeasure the coupling of functional diversity and spatial vitality changes in urban complexes.Shannon-Weiner Biodiversity Index model
Černikovaitė et al. [16]2021VilniusEvaluate functional, emotional and communicative consumer preferences in Vilnius Shopping Center.Questionnaire Interviews
Han Wu et al. [17]2024Nanchang, ChinaConduct a more scientific and objective assessment of the suitability of sites for large-scale commercial complexes.Improved projection pursuit
Sahito, N. [18]2020Hangzhou, ChinaIdentify the physical characteristics of quasi-public spaces in commercial complexes and the ways in which these characteristics contribute to the socialization of commercial complexes.Likert scale method
Rasa Gudonaviciene et al. [19]2013LithuaniaSuggest shopping center image attributes that should be emphasized in shopping center promotions and suggestions for improving shopping center customers’ perceptions of the overall center image.Survey interviews
Yimeng Wu [20]2024SingaporeProvide ideas for the economic evaluation of greening in urban complex buildings and fill the gap of CBA analysis applied to the economics of greening systems in commercial buildings.Cost-benefit analysis
Xiangmin [21]2021Chibi, ChinaConstruct a commercial complex evaluation method based on dynamic visual attractivenessVirtual reality technology
Rusi Zeng et al. [22]2024ChinaEstablish a UCC evaluation system from the user’s point of view to provide a reference for better meeting the user’s needs. Likert scale method; Logistic regression analysis
ZhongZhen Yang [23]2002Kani, JapanEvaluate the geographic distribution of shopping centers to select the best site locationsGIS; AHP
Sun.Y et al. [24]2022Dalian, ChinaOptimize the number and scale of physical shopping centers and corresponding locations to maximize retail margins under the new retail modelQuestionnaire interviews; NL modeling
POE analysis of buildings respects the needs of the population, fully embodies the design concept of “humanization” [25,26,27], and aligns with the current sustainable development goals of cities and buildings. As shown in Table 1, there is a significant amount of research on the evaluation of urban complex usage, covering aspects such as green economy, spatial performance, and site selection, among others, with corresponding results achieved. However, most of these studies employ a single methodology and primarily use data obtained from interviews for further analysis. This approach often limits the discussion of indicators to qualitative analysis, lacking the scientific rigor of quantitative methods. Additionally, most existing studies are based on one urban complex or multiple complexes within a single region, resulting in a limited study area and a lack of case discussions from a broader geographical context.

1.3. Research Objective

Therefore, to address the aforementioned issues, this manuscript aims to propose a more scientific evaluation method for urban complexes. The study employs the analytic hierarchy process (AHP) to construct a standardized system encompassing five dimensions: spatial function, spatial perception, architectural style, surrounding environment, and energy-saving technology. It investigates the weights of the indicators that influence people’s use of urban complexes with the goal of achieving “humanization”. Furthermore, it quantitatively analyzes the key indicators using spatial syntax and other analytical methods. Subsequently, we utilize the grey correlation analysis method (MCDM) based on the technique for order preference by similarity to an ideal solution (TOPSIS) to assess the importance of indicators in three actual cases in China, further determining their significance. The AHP + MCDM method not only considers the subjective factors of people’s evaluations of urban complex use and the interrelationships among indicators but also ensures the objectivity and scientific rigor of the statistical calculations. The results of this study contribute to the development and practical application of the evaluation methodology for urban complex usage. Additionally, they provide a scientific basis for case studies or the spatial renewal of other urban complexes under similar conditions.

2. Materials and Methods

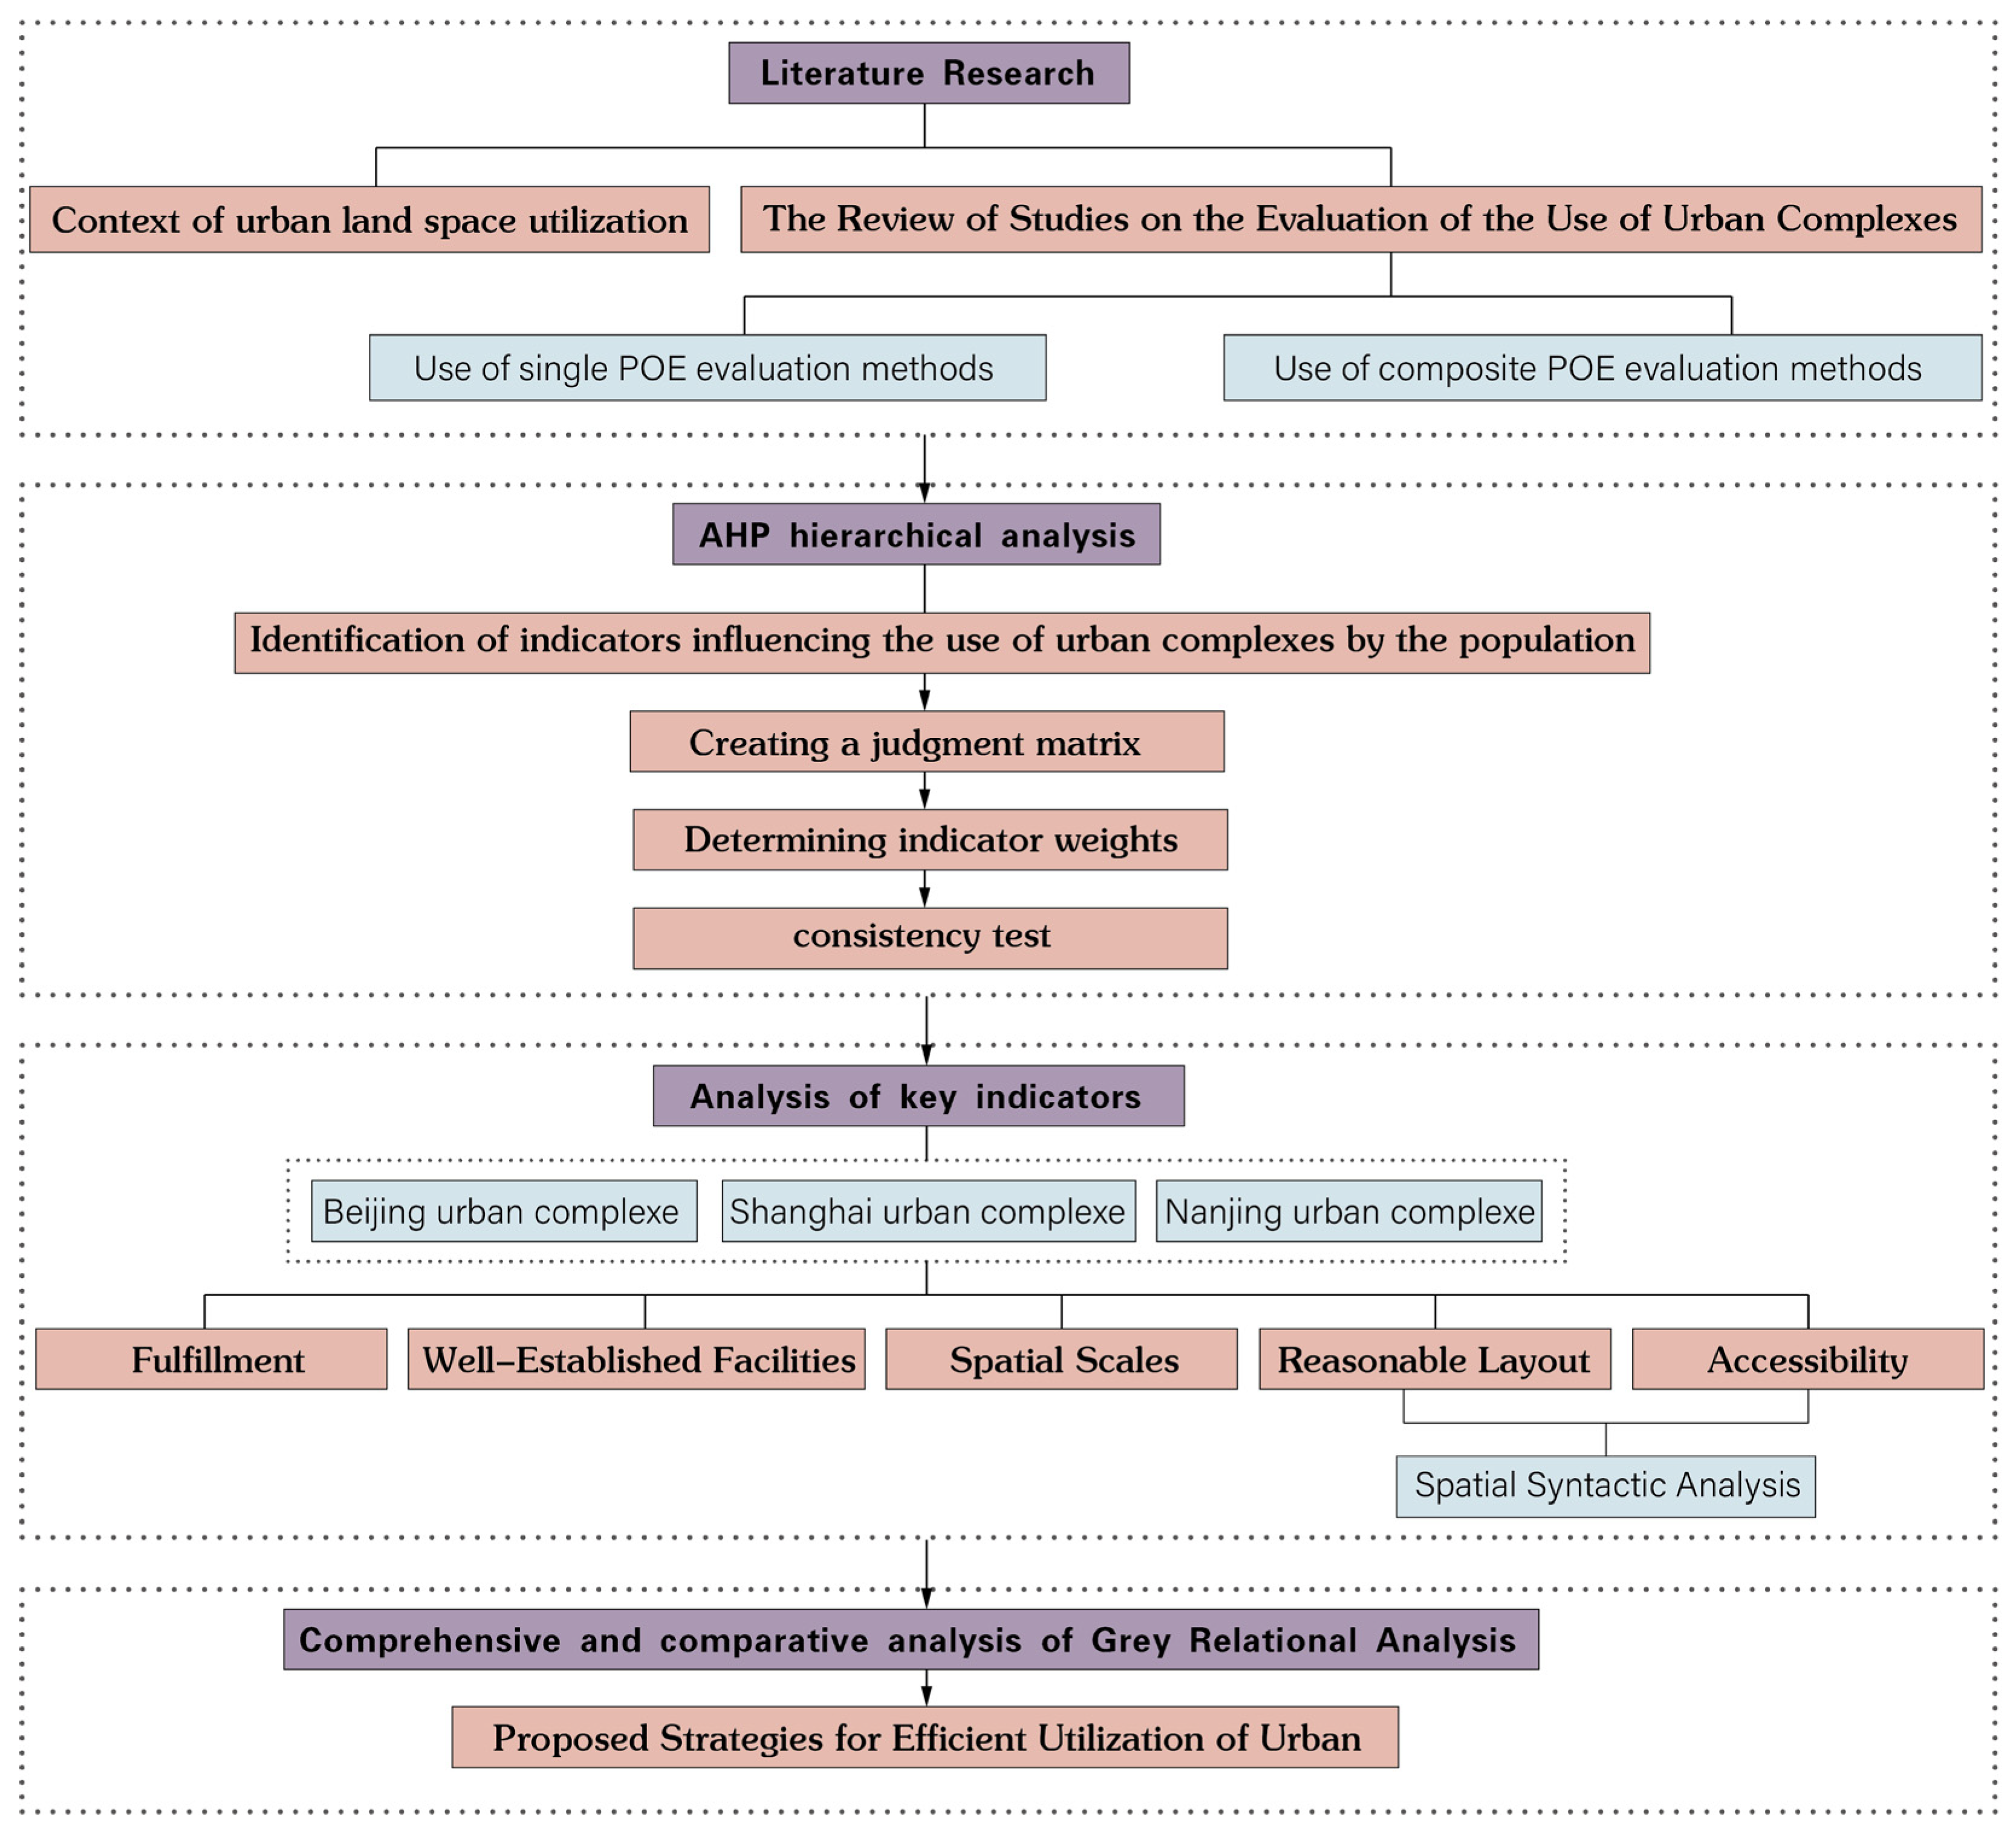
2.1. Research Framework

The research in this paper is structured into four stages (see Figure 1). The first stage involves reviewing the literature to gain an understanding of the current landscape and to clarify the research background and issues. In addition, articles on urban complexes conducting use evaluation are analyzed, and the AHP + MCDM methodology applied in this paper is presented. In the second stage, we identified and formulated 24 indicators influencing people’s usage of urban complexes through existing literature reviews. These indicators were categorized into three levels: goal level, guideline level, and indicator level. In the third stage, we disseminated questionnaires to specialists in related sectors as well as the general public, using a 1–9 scale to estimate the value of the indicators and determine their weight relationship. At the same time, urban complexes in Beijing, Shanghai, and Nanjing, China, were used as case studies to analyze the indicators with significant weight proportions. In the fourth step, we utilized MCDM analysis to thoroughly examine the study case, addressing the shortcomings in the existing literature regarding the application of the methodology. This analysis also aimed to propose optimization and enhancement strategies for urban complexes under the concept of “humanization”.

2.2. Materials

2.2.1. Beijing Hopson One Overview

As the capital of the People’s Republic of China, Beijing’s strategic positioning as a national cultural center and an international communication hub has provided significant impetus for commercial development. The growth of its commercial economy has been highly prioritized by the state and various municipalities. Beijing’s urban planning features a symmetrical layout centered around a central axis, with a road network that combines square and radial patterns. The city’s rich architectural heritage, including courtyards, hutongs, and other culturally significant structures, further enhances its unique character. Beijing Hopson One is located in the eastern Central Business District (CBD) of Chaoyang District, situated above the Golden Horn at the intersection of two major traffic arteries: Guangqiu Road and Xidawang Road (see Figure 2). It is adjacent to subway lines 7 and 14 and benefits from the radiant influence of the neighboring China World Trade Center and the two major business districts. The surrounding area, characterized by a high demand for consumption, is predominantly residential and commercial, catering to a consumer base with significant purchasing power. The overall positioning of the life experience commercial complex encompasses a total floor area of 185,000 square meters and houses over 600 merchants, including late-night bazaars, restaurants, theaters, and a variety of other establishments. It features a well-planned layout with more than 2000 parking spaces to accommodate the daily travel needs of consumers. Data obtained from the Baidu Maps open platform indicate an average annual foot traffic of 35 million people in 2023. This high visibility and influence make it a suitable representative case for studying general urban complexes.

2.2.2. Shanghai MOSCHINO Overview

Shanghai is a national central city and the core city of the Shanghai Metropolitan Area. As an international economic, financial, and trade center, Shanghai leads the country in overall business activity, significantly influencing China’s commercial economy. The city is built along the Huangpu River and Suzhou Creek, featuring an eclectic mix of Chinese and European architecture. It is a representative of eclectic architecture. Shanghai MOSCHINO is situated at the intersection of Nanjing Road Pedestrian Street East and Henan Middle Road, adjacent to the Bund, with Metro Line 2 and Line 10 crossing nearby, giving it a superior geographic location (see Figure 3). The surrounding area is primarily composed of commercial offices with a high industry density and a rich variety of functions. As a one-stop commercial complex, it boasts a total floor area of 118,000 square meters, housing nearly 500 tenants and providing more than 300 parking spaces. The average annual foot traffic in 2023, as recorded by the Baidu Maps open platform, was 37.23 million. This places the Shanghai MOSCHINO at the forefront of commercial activity among the city’s complexes, giving it a considerable degree of representativeness.

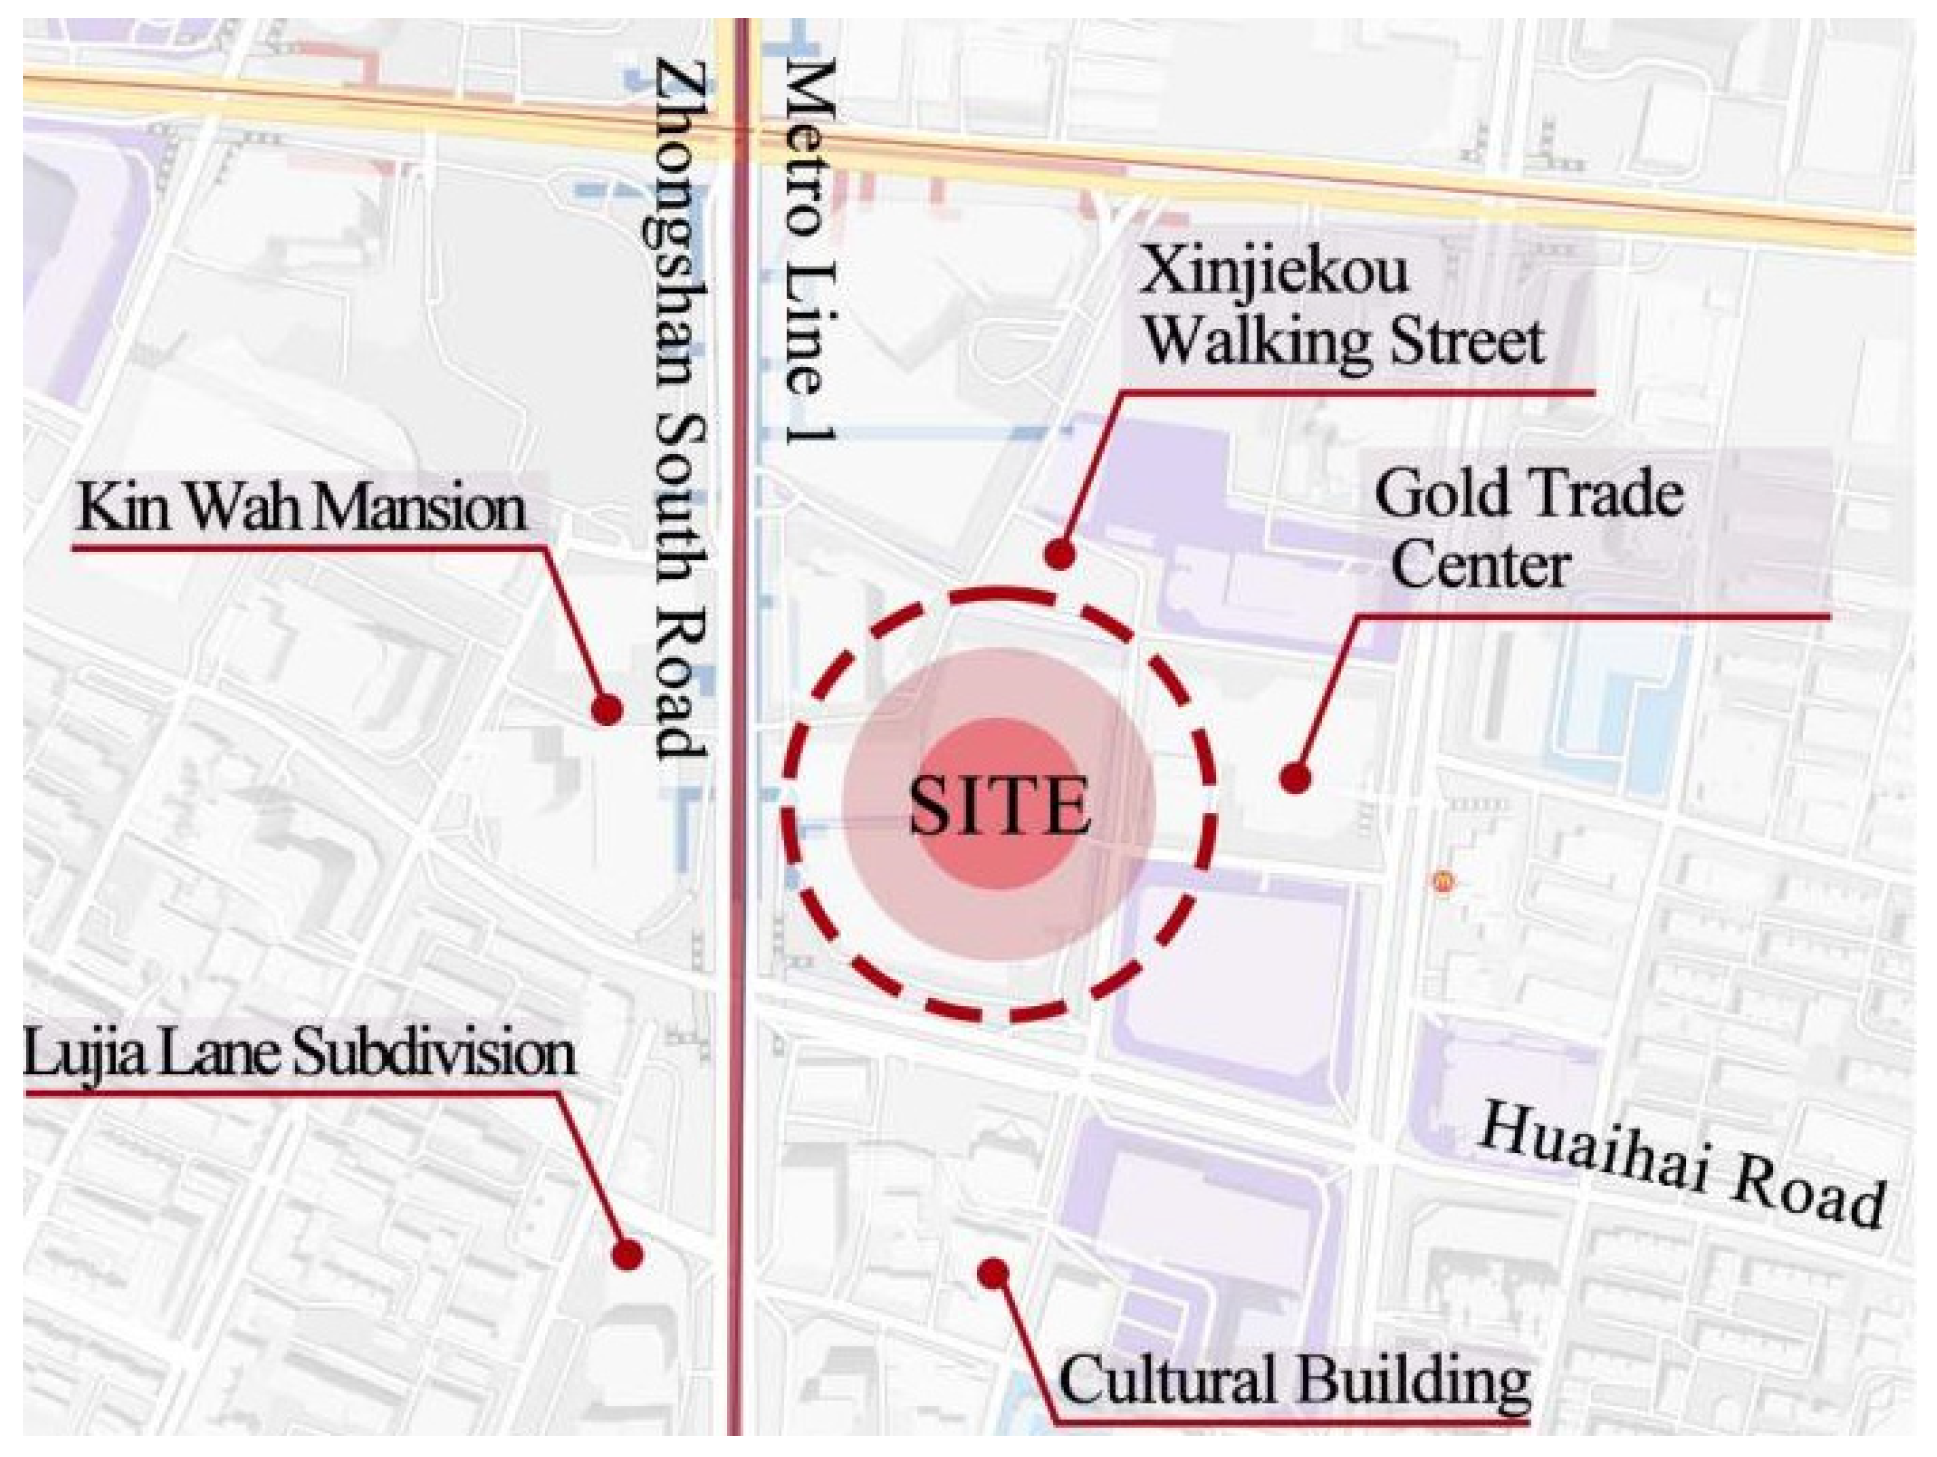
2.2.3. Nanjing Central Emporium Overview

As an important central city in eastern China and the core city of the Nanjing Metropolitan Area, Nanjing has significantly strengthened its economic power and elevated its economic prominence in recent years. With its mountainous terrain and rich historical heritage, Nanjing presents a landscape that harmoniously blends solitude with modern urban development. Nanjing Central Emporium is located at No. 79 Zhongshan South Road, at the intersection of Huaihai Road and Central South Road, near subway line 1. It is surrounded by the Xinjiekou commercial pedestrian zone, which is characterized by dense commercial buildings and high consumer spending (see Figure 4). As a large-scale comprehensive department store, it has a total construction area of 63,000 square meters and houses more than 350 tenants. Known for its long history, the complex had an average annual foot traffic of 20 million people in 2023, according to data from the Baidu Maps open platform, indicating high commercial activity.

2.3. AHP Analysis of Indicators

AHP can synthesize crowd perceptions of urban complexes and transform qualitative analysis into quantitative analysis. Commencing with the population aspect, this paper employs AHP to rank the significant factors. These factors serve as the foundation for the subsequent efficient utilization of complexes under the goal of humanization. Utilizing indicators derived from the literature review that influence people’s use of urban complexes, AHP offers a robust methodology to quantify spatial perception indicators of urban complexes [28]. AHP facilitates the prioritization of factors affecting the utilization of urban complexes by incorporating qualitative and quantitative indicators. This allows for the evaluation of potential alternatives and the selection of optimal choices to make strategic and rational building decisions. By synthesizing judgments to prioritize decision-making criteria and their corresponding sub-criteria, AHP emerges as a pivotal method for indicator analysis in this study.
In our paper, we disseminated questionnaires to both professionals in architecture and the general public with no background in architectural design or research to rate: online, we sent questionnaires to specialists in architecture; also, we distributed questionnaires to individuals at random on social media platforms like WeChat and Weibo, as well as in public areas offline. People other than architectural professionals have a certain scoring right to speak since they are the primary users of the urban complex, and experts are more skilled and specialized in spatial perception. Therefore, 50% of the findings were accounted for by the scoring of specialists and those without prior expertise in architectural research, and the geometric mean approach was used to generate the weighted results. Ultimately, all 10 of the distributed expert surveys were valid and returned. For the population without prior experience in performing architectural research, 135 online and 500 offline surveys were sent; of these, 124 online valid questionnaires and 487 offline valid questionnaires were returned. The specific population statistics are shown in Figure 5.

2.3.1. Construction of Evaluation Indicators

The factors influencing the utilization of urban complexes by the public primarily stem from evaluation criteria related to user sentiments, needs, and the architectural design itself. Consequently, this study has devised three layers of evaluation indicators (refer to Table 2):
  • Target Layer (R): Serving as an evaluation system for the utilization of urban complexes.
  • Management Layer (A): This layer serves as the primary focus of research, elucidating the key aspects of urban complex utilization.
  • The Level of Indicators (B): Encompassing specific evaluation factors such as spatial scale perception, site coordination, and transportation accessibility.
In the screening of indicators at the guideline level, reference is made to relevant norms and pertinent literature (see Table 3). The screening of indicators at the indicator level is mainly based on the suggestions from relevant experts and insights gathered through random interviews conducted. Subsequently, experts refined and validated the final classification of indicators.

2.3.2. Calculation of Indicators and Consistency Tests

  • After constructing the indicator system, a judgment matrix needs to be established. To quantitatively compare the interrelationships between the indicators, the assessment was carried out using a 1–9 scale, which indicates the relative importance of one element compared to another (see Table 4).
  • Ten questionnaires were returned from experts and 611 from the public. A judgment matrix is constructed using the geometric mean method for the results of the scoring of the recovered questionnaires. The expression is as follows.
    A = a 11 a 12 a 1 n a 21 a 22 a 2 n a m 1 a m 2 a m n
  • Hierarchical single sorting involves comparing the elements of the current layer with those of the previous layer on a pairwise basis and then expanding the sorting. The specific calculation of data is based on the previously constructed judgment matrix A. There are three main calculation steps:
First, the composite weights are calculated, mainly using the geometric mean method. where aij represents the indicators in row i and j of the matrix, n is the number of indicators in the corresponding level, W ¯ i is the geometric mean of the indicators in row i of the matrix:
W ¯ i = j = 1 n a i j i , j = 1 , 2 , , n
Second, the normalization, denoted W ¯ i , W ¯ i , represents the relative importance ranking weights of the indicators at the same level relative to their counterparts at the previous level:
W i = W ¯ i j = 1 n W ¯ j i , j = 1 , 2 , , n
Last, the maximum characteristic root λmax of the judgment matrix is calculated using the formula. Where aij represents the indicators in row i and j of the matrix and n is the number of indicators in the corresponding level:
λ max = i = 1 n A W i n w i
4.
In order to mitigate the variability of subjective evaluations by experts, the consistency of indicator weights was tested using the formula:
C I = λ n / n 1
By selecting the corresponding data in the table, the average random consistency indicator R.I. was introduced (see Table 5):
The consistency ratio C.R. was calculated and tested with the formula:
C R = C I R I
It is generally accepted that the matrix passes the consistency test if C.R. < 0.1; otherwise, the judgment matrix does not have satisfactory consistency.

2.3.3. Judgment Matrix Construction and Weighting Results

We construct judgment matrices for the indicators of each assessment level and determine whether each judgment matrix passes the consistency test. After testing, all judgment matrices satisfy consistency. For details, please refer to Table A1, Table A2, Table A3, Table A4, Table A5 and Table A6 in Appendix A.

2.4. DZDP Data Extraction
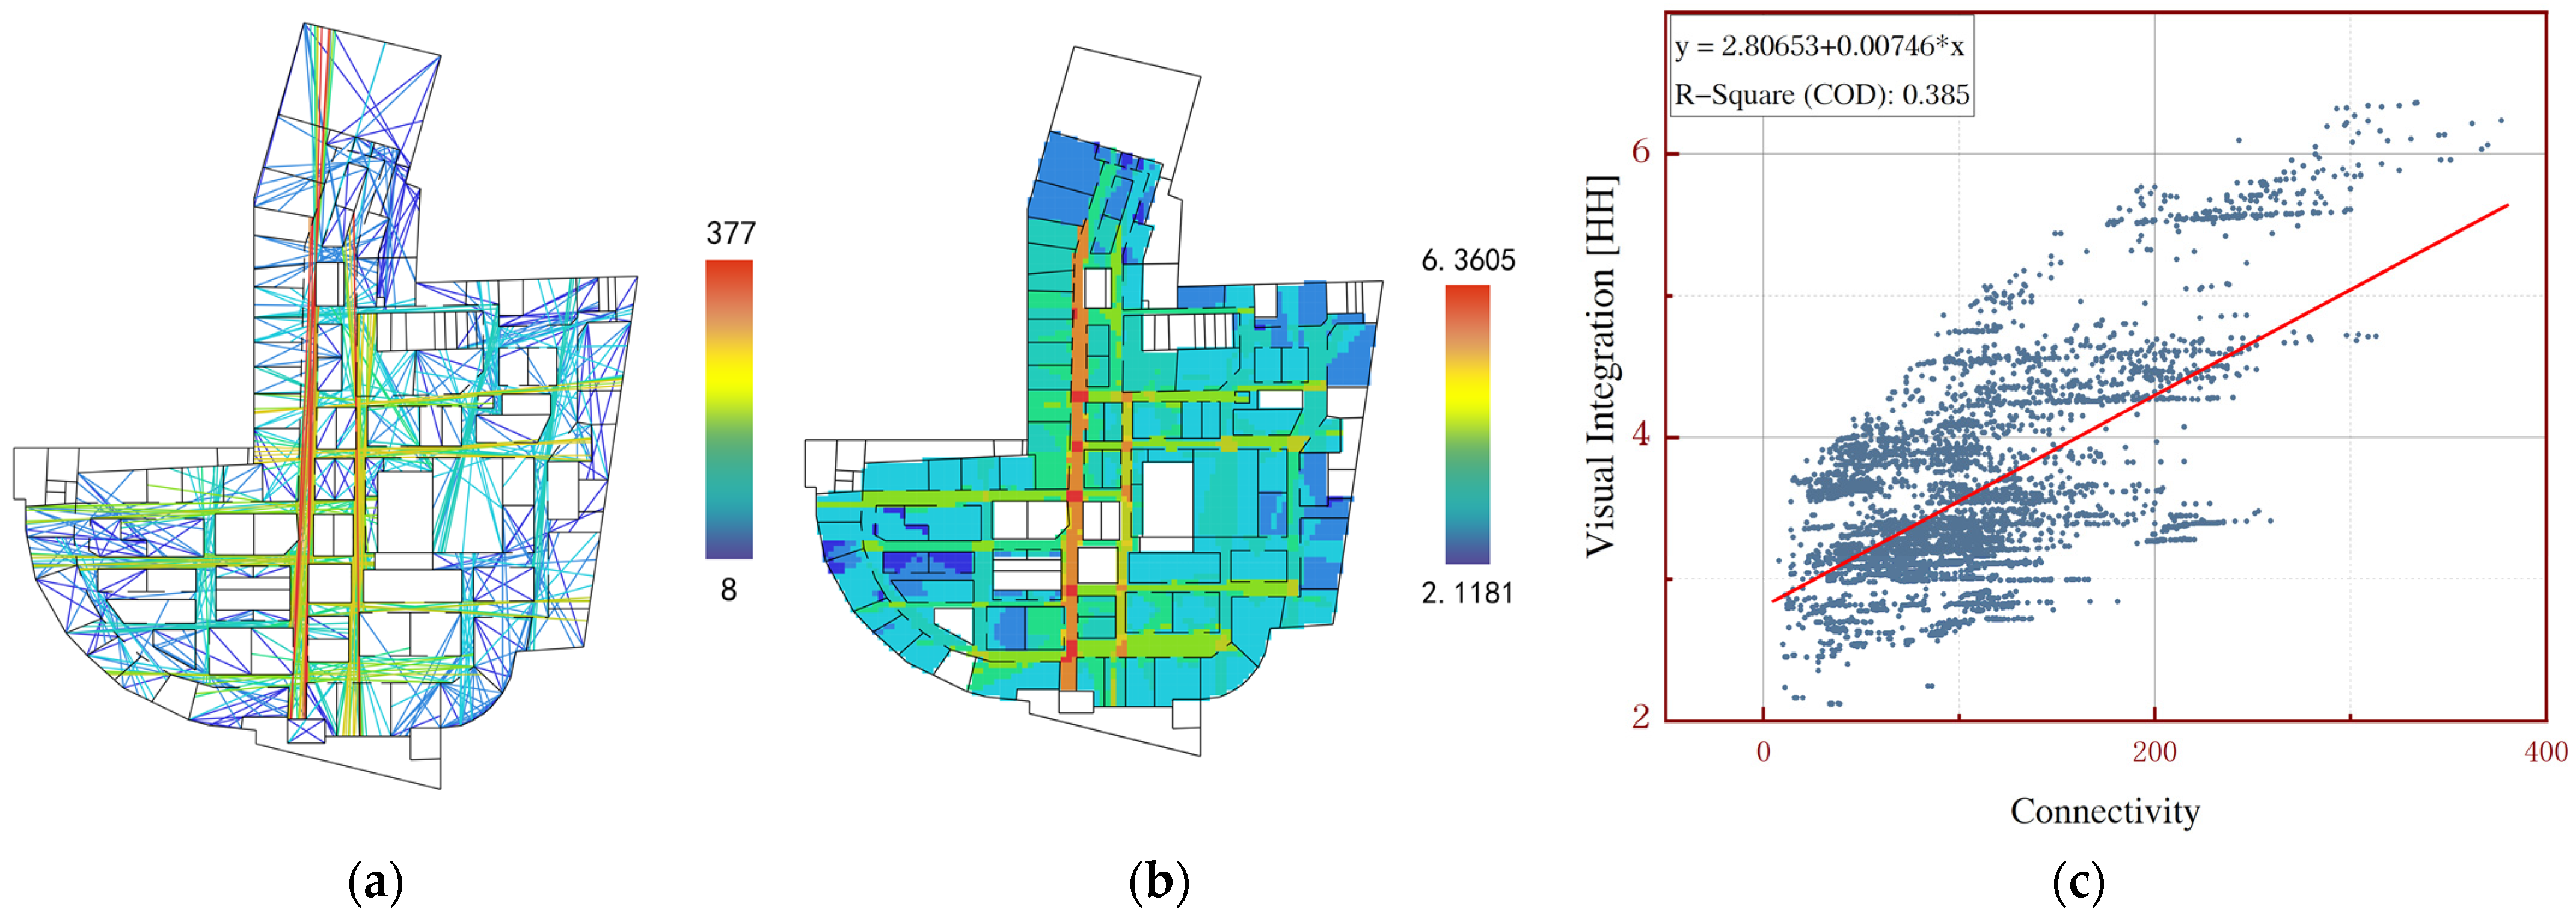
DZDP is the first independent third-party consumer review website in China that allows consumers to rate and review destinations [37]. Customer worries and satisfaction are elucidated through the collection and quantification of reviews and ratings of a location in DZDP. To use web crawlers to crawl DZDP social media platform users’ reviews of destinations, we must first search for web pages with destinations as keywords, then use inter-window cyclic web crawling lists to obtain DZDP detailed pages, and finally crawl various contents such as posting time, ratings, and contents based on the page structure [38,39]. This paper takes Beijing, Shanghai, and Nanjing as examples, focusing on the keywords “Hopson One, MOSCHINO, Central Emporium”. From these keywords, we extract 3000 comments and 50 keywords, excluding meaningless words.

2.5. Space Syntax

Spatial syntax, a method proposed by Bill Hillier based on social network theory and graph theory [40], offers a quantitative analysis for urban research. The main quantitative analysis metrics include connectivity, integration, intelligibility, selectivity, and control values. In this paper, CAD is utilized to illustrate the plan view of urban complexes and surrounding roads. The road environment within and around urban complexes is quantitatively studied in Depthmap (0.8.0) software to assess the rationality of the layout and transportation accessibility of urban complexes. Therefore, the spatial syntax metrics used in this paper are connectivity, integration, comprehensibility, and selectivity.
The degree of connectivity denotes the number of node spaces connected to the node being analyzed. The higher the degree of connectivity, the greater the accessibility and permeability of the space. This is expressed by the following formula. Where k(i) denotes the number of spaces that are directly connected to the space of node i:
C t = k i
The degree of integration indicates the degree of aggregation of the space with other spaces, the higher the degree of integration, the stronger the accessibility, which is expressed by the following formula. Where n denotes the number of space nodes and MDi is the average depth value of space node i:
I t = n log 2 n + 2 3 1 + 1 n 1 M D t 1
Intelligibility degree indicates the relationship between a node space and other spaces. The higher the intelligibility degree, the more recognizable the node space is, and the better the crowd perceives other spaces from that node. Intelligibility degree is mainly obtained by fitting the analysis of integration degree and connectivity degree. Where I l g and I ¯ g represent the global integration degree of node space i, and I l l and I ¯ l represent the local integration degree of node space i:
R 2 = I l g I ¯ g I l l I ¯ l 2 I l l I ¯ l 2 I l g I ¯ g 2
The degree of selectivity indicates the likelihood of people choosing this road for traveling, and a higher degree of selectivity indicates a higher likelihood that the road will be chosen and have higher psychological accessibility [41]. Where n represents the number of spatial nodes and n j k i represents the number of times the shortest path from node i to j has been selected, with n j k representing the number of shortest routes:
E t = 1 n 1 n 2 j = k = 1 n n j k i n j k

2.6. TOPSIS Method Based on Grey Correlation

As a multi-criteria decision analysis method [42], TOPSIS has been widely used in the comprehensive evaluation of buildings. The TOPSIS method bases its decision on the positional relationship (Euclidean distance) between each evaluation unit and the data curve of the “ideal unit”. First of all, the original matrix is composed of an evaluation object and evaluation indexes, the data are standardized, and the entropy weight method is further used to calculate the weight ratio of each index, and the weighted specification matrix is constructed to calculate the positive ideal solution and the negative ideal solution, so as to define the distance between each evaluation object and the ideal solution, and to carry out the superiority ordering of the program based on the relative affixing progress of each evaluation object. However, the traditional TOPSIS method requires the extreme values of the criteria as the positive ideal solution [43] and the negative ideal solution [44] for the multi-criteria decision-making problem. This approach only considers the relationship between factor positions, making it unscientific to determine the optimal alternatives based on extreme values, which may lead to “rank reversal”. To avoid rank reversal, a new criterion calculation method needs to be selected. Therefore, we introduce multi-objective decision analysis (MCDM) to quantitatively evaluate urban complexes, replacing the Euclidean distance of the traditional TOPSIS method with grey correlation [45]. The grey correlation analysis method judges the advantages and disadvantages of the options based on the correlation, i.e., the changing trend, between the factors of each alternative, making the physical meaning clearer [46].
The TOPSIS method and the grey correlation analysis method are utilized to establish a new comprehensive evaluation model of the complex, which has eight main steps:
  • Set up the initial evaluation matrix as X = (xij)m × n, where x ij is the value of the attributes of the i-th evaluation unit under the j-th indicator; m is the number of evaluation units; n is the number of evaluation indicators.
  • Normalize X to obtain a normalization matrix. Positive indicators are denoted as v ij = x ij min i x ij max i x ij min i x ij , and negative indicators are denoted as v ij = max i x ij x ij max i x ij min i x ij . In the evaluation index system of this paper, except for the spatial scale, which is a reverse indicator, all the others are positive indicators.
  • The entropy weight method is used to establish the weight of each indicator w j 1 × n = w 1 , w 2 , , w n . Where e j is the entropy value of the j-th indicator:
    w j = 1 e j j = 1 n ( 1 e j )
  • Calculate the weighted standardized decision matrix Y.
    Y = y i j m × n = w j v i j m × n
  • Calculate positive L j + =( f 1 + , f 2 + ,…, f n + ) and negative ideal solutions = ( f 1 , f 2 ,…, f n ).
    f j + = max i y i j , f j = min i y i j
  • Using grey correlation analysis, calculate the correlation between each evaluation unit and positive L j + and negative ideal solutions L j , which is r i + , r i . Where ρ is the discrimination coefficient, take ρ = 0.5.
    r i + = 1 n j = 1 n γ 0 i j + ; r i = 1 n j = 1 n γ 0 i j
  • Using the TOPSIS method, calculate the Euclidean distance of each evaluation unit from L j + ,   L j , which is d i + , d i .
    d i + = j = 1 n f j + y i j 2 ; d i = j = 1 n f j y i j 2
  • Calculate the comprehensive score of each evaluation unit, and then rank them according to the size of the value. The larger the value of the alternative, the higher its correlation with the positive ideal solution, indicating that the program is more optimal. Conversely, a smaller value indicates that the program is inferior. Where α and β are preference coefficients, satisfying α + β = 1, in this paper, we take α = β = 0.5.
    S i + = α R i + + β D i +
    S i = α R i + β D i
    S i = S i + / S i + + S i

3. Results

3.1. Establishment of Indicator Weights

According to the importance matrix tables for each level of indicators in Appendix A, all indicators were consolidated to ultimately derive the weight distribution table of the evaluation system (refer to Table 6).
The weights assigned to the indicators reflect their importance in the evaluation process, constituting a comprehensive measure of subjective evaluation and objective reflection [47].
Among the Criterion level indicators, it can be found that in the Management level, A2 (spatial function) > A1 (spatial feeling) > A4 (surrounding environment) > A3 (architectural style) > A5 (energy-saving technology), indicating that spatial function and spatial feeling are the two most important indicators affecting the crowd’s use of urban complexes. Furthermore, within the Level of Indicators, we found that the top five indicators in terms of weight are: meeting demand, well-established facilities, spatial scale, reasonable layout, and accessibility, indicating that these five indicators are the most concerning influencing factors.
Meanwhile, in order to further prove the validity of the weighting results, the comments and ratings of the urban complexes about Beijing Hopson One, Shanghai MOSCHINO, and Nanjing Central Emporium in our popular review platform are extracted (see Table 7), and the related keywords are obtained (see Table 8). Each city complex collected 1000 reviews and ratings as recent as 6 July 2024. The calculated average review scores reveal that people rate Beijing Hopson One at 4.497, Shanghai MOSCHINO at 4.304, and Nanjing Central Emporium at 4.192. This indicates that people are most satisfied with Beijing Hopson One. The table extracted from the keywords of the three urban complexes shows that the words on the indicator of “meeting demand” include complete, need, satisfy, have everything, etc., with a total word frequency of 1890; the words on the indicator of “perfect facilities” include toilets, facilities, escalators, etc., with a total word frequency of 726; the words on the indicator of “sense of spatial scale” include great, experience, etc., with a total word frequency of 1019; the words on the indicator of “reasonable layout” are toilet, facility. The words for “accessibility” include location, transportation, etc., with a total word frequency of 767. It can be seen that the five indicators with higher weights, as screened out by the AHP analysis, align with the main concerns of the public regarding urban complexes. This correlation proves the credibility of the results analyzed by AHP.

3.2. Analysis of Key Indicators

3.2.1. Indicator of Meeting Needs

The crowd’s demand for commercial complexes is primarily reflected in the variety of formats and the richness of categories. In our research, we found that the categories offered by Beijing Hopson One, Shanghai MOSCHINO, and Nanjing Central Emporium are essentially the same, encompassing catering, shopping, leisure and entertainment, sports and fitness, and parent–child interaction. Therefore, we use the number of businesses as an indicator to reflect the satisfaction of the crowd’s needs. Among these complexes, Beijing Hopson One has the largest number of businesses, with 637; Shanghai MOSCHINO has 309; and Nanjing Central Emporium has 350.

3.2.2. Accessibility Indicator

The study takes the urban complexes in Beijing, Shanghai, and Nanjing as the center points and conducts spatial syntactic analysis of the road network within a 2000-meter radius. This analysis focuses on both integration and selectivity.
The redder the color of the axis, the higher the corresponding value. By analyzing the integration degree of the road networks within the three urban complex areas (see Figure 6), it is found that the average integration value for the Beijing area is 1.1734, for the Shanghai area 0.9281, and for the Nanjing area 1.1425. The roads in Beijing have the highest integration degree, while those in Shanghai have the lowest.
In a comprehensive analysis, Beijing’s road planning, which is primarily laid out in vertical and horizontal directions, results in well-organized roads with high accessibility. Conversely, Shanghai’s urban complexes are located in areas with significant river and sea presence. The topography necessitates curved road planning to navigate around water bodies, and the areas on both sides of the river are mainly connected by only a few cross-river bridges, leading to a lower degree of integration in the area.
By analyzing the selectivity of the districts where the three urban complexes are located (see Figure 7), it is found that the average selectivity value is 13,597.4 in the Beijing district, 117,589 in the Shanghai district, and 36,137.6 in the Nanjing district. The Shanghai district has the highest selectivity, while the Beijing district has the lowest.
From the figure, it can be observed that the Shanghai area has the highest road network density, whereas the Beijing area has the lowest. The high density of the road network and the high selectivity of the shortest roads make them more likely to be traveled by crowds. Consequently, the roads in the Shanghai area experience a higher flow of people, making the urban complexes more likely to be patronized by crowds.

3.2.3. Indicator of Well-Established Facilities

Facility perfection primarily refers to the variety of public facility categories within the complex. Beijing Hopson One has the most categories of public facilities, including seven types: public toilets, elevators, lounge seats, parking lots, firefighting facilities, service desks, and tram charging piles. Shanghai MOSCHINO includes public toilets, elevators, lounge seats, parking, fire protection, and service desks. In comparison, Nanjing Central Emporium has fewer public facilities, comprising public toilets, elevators, lounge seats, parking, fire protection, and tram charging piles.

3.2.4. Indicator of Reasonable Layout

The internal layouts of the three urban complexes are analyzed by first selecting representative floor plans and then examining the connectivity, visual integration, and comprehensibility of these plans. In this analysis, the degree of visual integration and connectivity are taken as variables for fitting and analysis, in order to investigate the magnitude of comprehensibility.

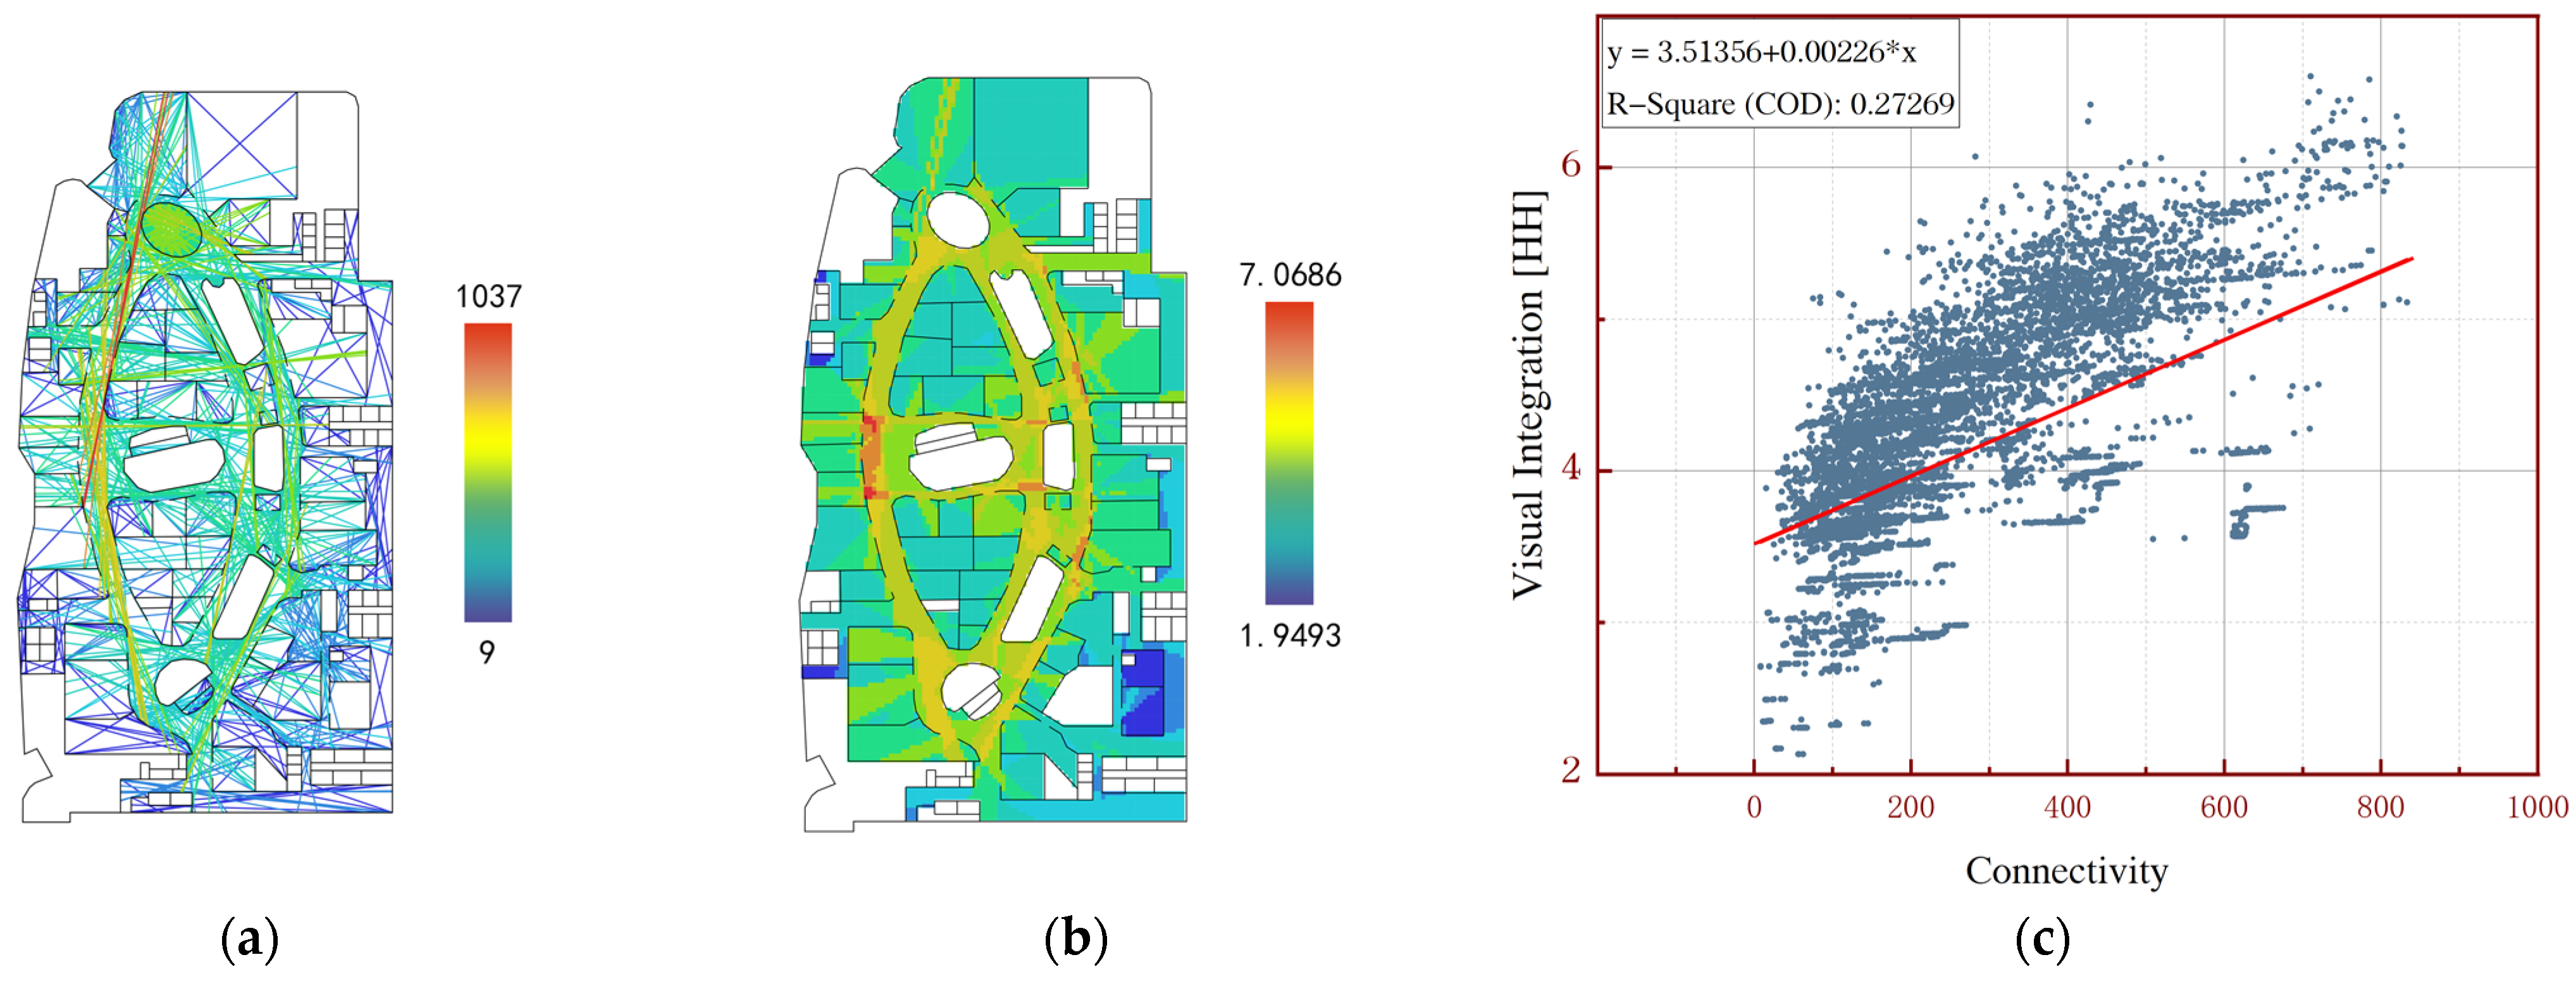
Beijing Hopson One Space Syntax Analysis Results

Taking the representative plane—the third-story floor—as an example, the average value of internal connectivity within the urban complex (see Figure 8a) is 382.76. The passageway at the atrium exhibits higher connectivity, indicating stronger spatial accessibility and permeability compared to other spaces in the vicinity. Meanwhile, the average value of visual integration (see Figure 8b) inside the urban complex is 4.26281. The passageway next to the central atrium is shown in red, indicating a high degree of visual field integration. Both connectivity and visual integration indicate that the atrium space of the urban complex has higher accessibility and serves as the transportation hub of the entire building.
Through the linear fitting analysis, it is found that the comprehensibility of the internal space of the Hopson One urban complex (see Figure 8c) has an R2 value of 0.27269, which is much smaller than 0.5. This indicates that the spatial comprehensibility of Hopson One is low, making it difficult for crowds to recognize the location and direction of the stores within the urban complex.

Shanghai MOSCHINO Space Syntax Analysis Results

Consider the representative plane of the three-story structure. The average connectivity value within the urban complex (see Figure 9a) is 176.325. The main passages exhibit higher connectivity due to the connection of internal vertical and horizontal passages to the stores, with minimal interruptions in the pathways. However, the lack of large open spaces within the interior limits connectivity to the passages alone, resulting in a lower connectivity value compared to the interior of Beijing Hopson One. The visual integration analysis of the urban complex (see Figure 9b) reveals an average visual integration value of 4.0436, with the highest values occurring at the crossing nodes of the internal passages.
Meanwhile, the comprehensibility of the urban complex space (see Figure 9c) is measured at 0.2715, which is considered low. This low value is attributed to the design of the stores, which typically have small openings and significant depths. Consequently, this creates a more distant relationship between each store space and hinders the crowd’s perception of the overall space.

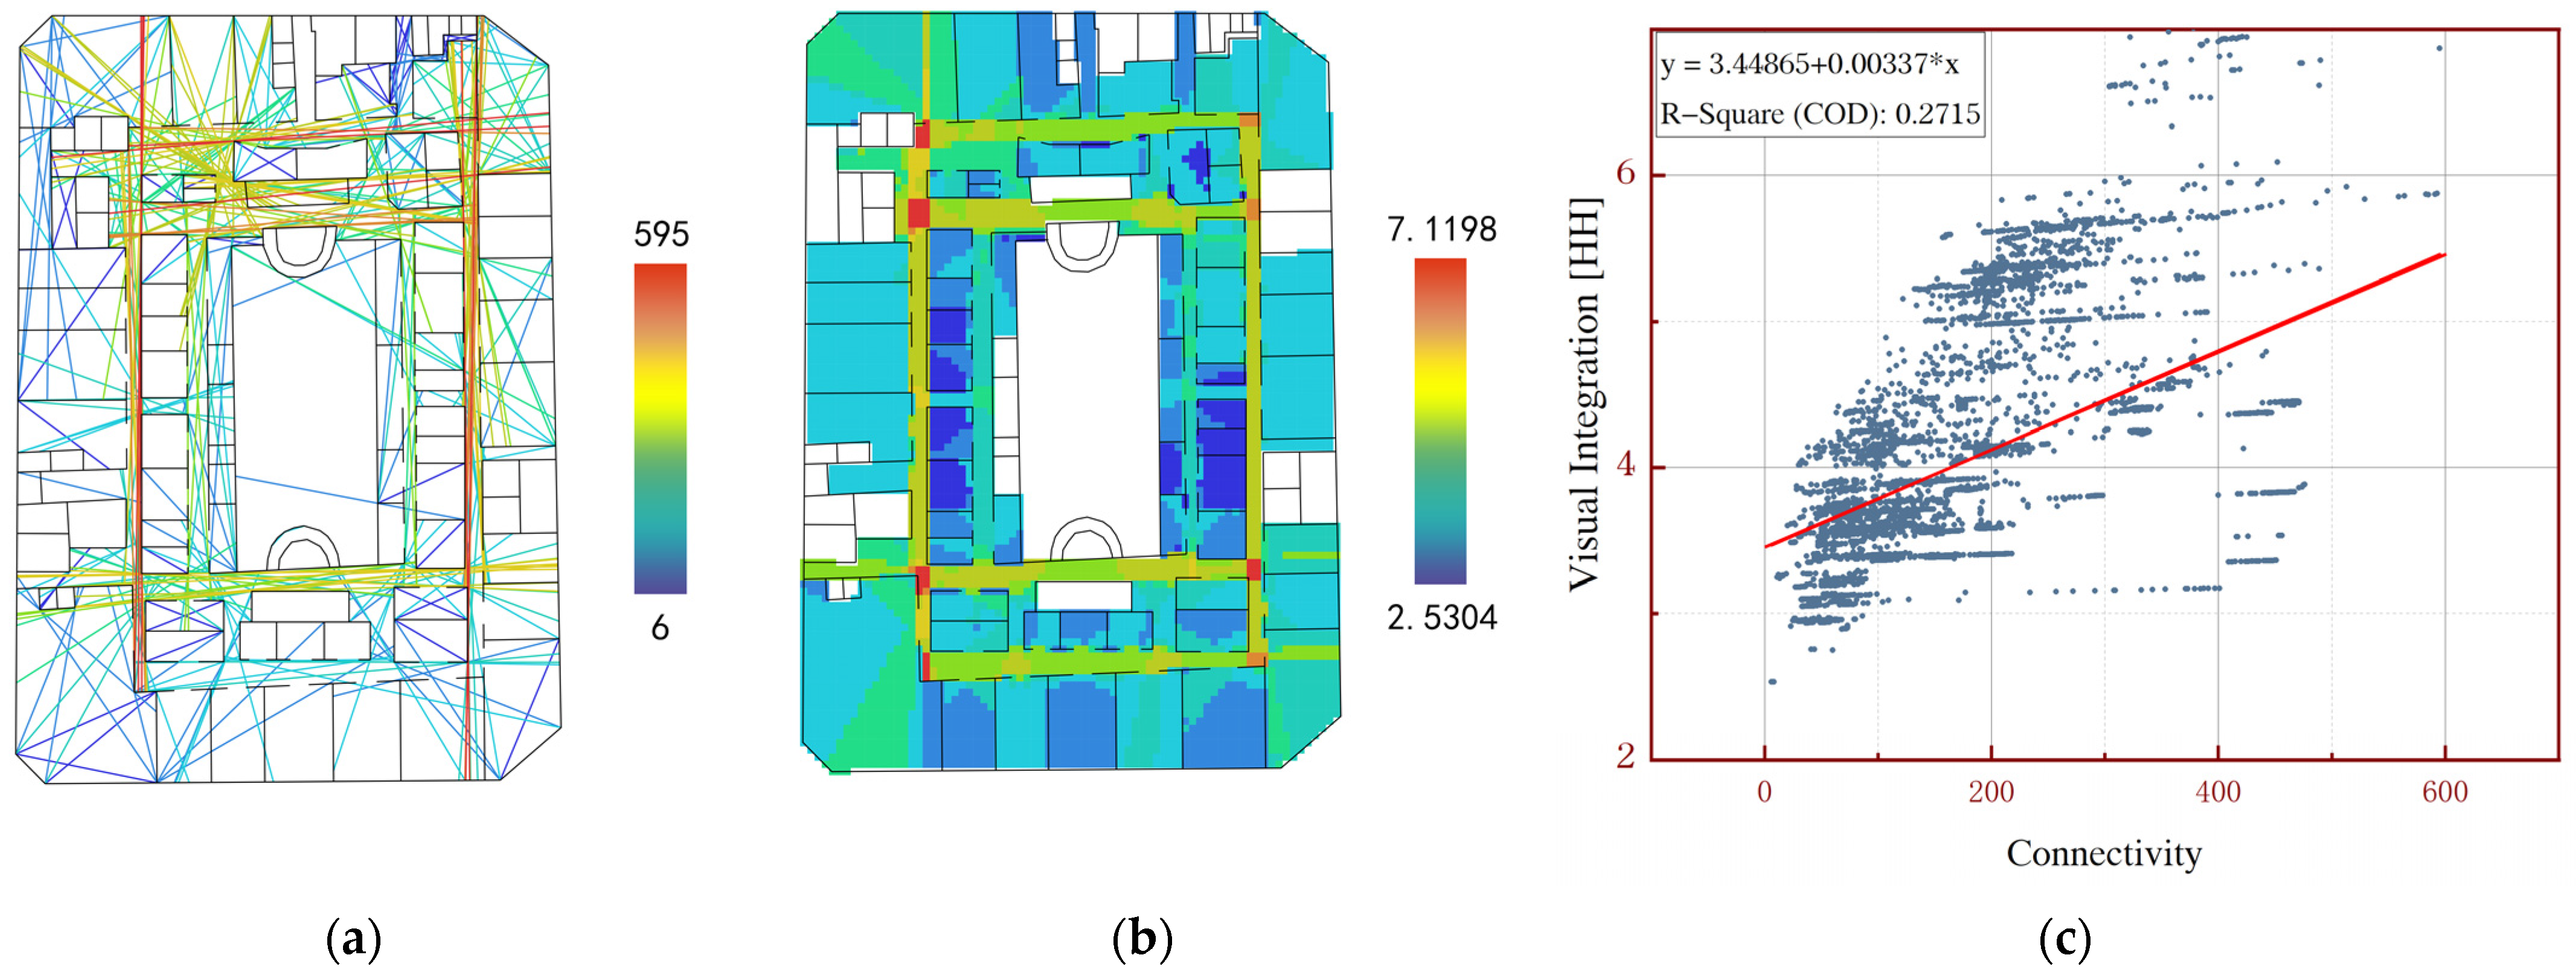
Nanjing Central Emporium Space Syntax Analysis Results

Consider the representative three-story plane as an example. The average connectivity value (see Figure 10a) within the urban complex is 103.064, while the average visual integration value (see Figure 10b) is 3.57498. The highest connectivity and visual integration values are located in the main transportation corridors running from north to south, which exhibit the strongest spatial permeability and serve as the primary transportation spaces. In contrast, the east–west corridors are primarily end-of-pipe corridors, leading to generally lower connectivity and visual integration values compared to the north–south corridors.
The comprehensibility value of the space is 0.385, which is higher than that of Beijing Hopson One and Shanghai MOSCHINO, but still below 0.5. This relatively low value is primarily due to the large construction area of the urban complex. Additionally, the stores fail to utilize the atrium space effectively to organize the flow of movement, resulting in internal traffic confusion.

3.2.5. Indicator of Spatial Scale

The concept of spatial scale is primarily reflected in the characteristics of spatial length, shape, and proportion. In a quantitative study of the geometry of commercial complexes, the width-to-height ratio (D/H) is used as a parameter [48]. According to Ashihara, a D/H value of 1 contributes to a favorable sense of spatial scale in street space [49]. The difference between the width-to-height ratio of a commercial complex and the optimal D/H was selected as an indicator to gauge the perception of spatial scale. Among them, the D/H value of Beijing Hopson One is 1.27, indicating a grander spatial scale with a difference of 0.27. The D/H value of Shanghai MOSCHINO is 0.64, reflecting a narrower sense of space with a difference of 0.36. The D/H value of Nanjing Central Emporium is 0.73, with a difference of 0.27 (see Figure 11).

3.3. Results of MCDM and TOPSIS Data Analysis

3.3.1. Results of the MCDM Analysis

The MCDM evaluation model was used to analyze the trend of people flow in three different urban complexes: Beijing Hopson One, Shanghai MOSCHINO Mall, and Nanjing Central Emporium. This analysis aims to explore the factors that have the greatest influence on the utilization of these complexes and to understand the influencing mechanisms. Data from the three complexes were collected and normalized to obtain the weights of the indexes and comprehensive scores, as shown in Table 9 and Table 10.
As shown in Table 9, the greatest influence on changes in the flow of people in the complexes is the improvement of facilities, which has a weight value of 0.3331. Perfect facilities ensure that the diverse needs of visitors are met. This is followed by the accessibility of transportation, with a weight value of 0.2897. Convenient transportation conditions allow people to quickly reach and use the urban complex, effectively increasing its utilization rate. The spatial scale and reasonable spatial layout also significantly affect people’s experiences when using the complex, with a cumulative weight value of 0.2956. Lastly, the fulfillment of demand has a weight value of 0.0816, indicating a relatively minor impact on the flow of people, as it serves more as a supplementary function of the urban complex.
As shown in Table 10, according to the MCDM evaluation model and the grey-scale correlation ideal solution, the ranking of the three urban complexes is as follows: Shanghai MOSCHINO > Beijing Hopson One > Nanjing Central Emporium. The ideal solution values are 0.5492, 0.4487, and 0.3816, respectively. Shanghai MOSCHINO demonstrates the strongest capability in attracting people flow and generates significant economic benefits. Beijing Hopson One, while second to Shanghai MOSCHINO, also shows a notable agglomeration effect. In contrast, Nanjing Central Emporium exhibits a weaker ability to attract crowds.

3.3.2. Results of the TOPSIS Synthesis Analysis

Using the quantitative calculation of the TOPSIS method (see Table 11), we analyzed the ranking of the three commercial complexes as follows: Nanjing Central Emporium > Beijing Hopson One > Shanghai MOSCHINO. Nanjing Central Emporium scored 0.506, indicating the strongest ability to attract people flow. Beijing Hopson One scored 0.498, demonstrating a slightly lower but still significant crowd-gathering ability. In contrast, Shanghai MOSCHINO scored 0.362, indicating the weakest ability to attract crowds among the three complexes.

4. Discussion

4.1. Comparative Analysis of MCDM Results and TOPSIS Results

As can be seen from Table 12, there is a difference in the analysis results between the TOPSIS method and the MCDM assessment model, specifically in rank reversal. A comprehensive analysis of the actual data shows that Shanghai MOSCHINO has a higher ability to attract and agglomerate people flow, as well as better spatial expressiveness. This indicates that the MCDM combination assessment can comprehensively consider both experts’ decision-making and objective data. It demonstrates a stronger correlation between changes in actual people flow and the indicators by analyzing the factors and the degree of similarity or dissimilarity in development. The MCDM portfolio assessment effectively combines qualitative and quantitative analysis, objectively reflecting the relationship between the relevant indicators and people flow, thus offering stronger stability and effectiveness. The actual data on people flow further supports that Shanghai MOSCHINO experiences the largest passenger flow, underscoring that the MCDM evaluation method is more aligned with reality. In contrast, the TOPSIS method focuses on analyzing the distance between each object and the optimal and worst values among all evaluation objects. This approach does not integrate changes in the actual situation well, leading to deviations in the output results from the actual conditions.

4.2. Analysis of the Evaluation Results of the Study Cases

The results of the above analysis further summarize the following:
  • Shanghai MOSCHINO: As a one-stop commercial complex, Shanghai MOSCHINO benefits from an effective combination of surrounding outdoor pedestrian streets, convergence of subway and rail transportation, and superior, convenient traffic conditions, resulting in the highest traffic accessibility. The indoor space layout is reasonable, and the industry setup and service facilities meet the needs of people’s activities, thus achieving the highest overall rating.
  • Beijing Hopson One: This complex meets people’s requirements for a mixed-use complex through its diversified industries and comprehensive public facilities. Located at the intersection of two major transportation arteries and adjacent to a subway line, it has good traffic accessibility. However, its large spatial scale creates a sense of cutoff emptiness, leading to a lower rating compared to Shanghai MOSCHINO.
  • Nanjing Central Emporium: Although it has high traffic accessibility, the industry within the complex is relatively single, with the fewest types of facilities. This results in a more monotonous and boring overall spatial feeling, leading to the lowest rating among the three complexes.

4.3. Optimization Strategy

According to the data obtained using AHP + MCDM analysis in this paper, urban complexes should be optimized in five key aspects: facility completeness, transportation accessibility, spatial scale, spatial layout, and demand satisfaction.
First, increase the number of business forms and service facility categories within the urban complex. The service facility categories should include at least five categories: rest areas, elevators, parking lots, fire-fighting facilities, and public restrooms. Additionally, second, select areas around transportation stations for urban complexes to improve transportation accessibility. Third, optimize the spatial layout to improve spatial comprehensibility. This can be achieved by reducing the visual obstructions caused by walls and other barriers, aiming to enhance spatial comprehensibility towards a value close to 1. Fourth, optimize the sense of spatial scale to achieve the optimal solution of indoor spatial scale D/H = 1.

4.4. Shortcomings and Prospects

First of all, this paper establishes a relevant evaluation system primarily based on the crowd’s usage demands. Due to the limitations in the level and number of indicators, this study focuses on only 24 indicators. However, the relevant indicators that actually affect the crowd’s use of complexes are much broader. Therefore, future research should strive to cover all aspects of these indicators to enhance the evaluation system for the use of urban complexes.
Secondly, this paper proposes a new method of AHP + MCDM to evaluate urban complexes in response to the insufficient use of methods in the existing literature. However, many methods can be used for POE, not limited to the analysis methods of AHP, TOPSIS, and grey correlation. Future research should focus more on the development and application of integrated multi-method approaches to promote the advancement of evaluation system methodologies.

5. Conclusions

Under the goal of “humanization”, this paper proposes the evaluation method of AHP + MCDM for the use of urban complexes and develops a more objective and scientific evaluation system by reflecting on the existing literature. The main conclusions of this paper are as follows:
  • Establishment of AHP Evaluation Index System: This paper proposes an evaluation index system for urban complexes that affect crowd usage. By analyzing the weights of the factors influencing the use of urban complexes through the hierarchical analysis method, a comprehensive quantitative evaluation is realized. The key indicators identified are as follows: meeting the demand (weight share 0.1212), perfect facilities (weight share 0.1045), spatial scale feeling (weight share 0.0858), reasonable layout (weight share 0.0783), and accessibility to transportation (weight share 0.0612). These are the indicators that crowds are most concerned about.
  • Proposal and Application of the AHP + MCDM Method: The combined use of AHP and MCDM methods takes into account the subjective factors in crowd evaluations of urban complex usage and the interrelationships between indicators while ensuring the objectivity and scientific validity of statistical calculations. By integrating quantitative and qualitative indicators in data processing, this approach effectively completes the dynamic evolution of the quantitative system, avoiding the limitations of single-method approaches that cannot fully explore similar data information. Initially, AHP is used for the primary analysis of indicator weights. Then, MCDM is employed for the secondary analysis of the screened high-weight indicators, significantly reducing the workload of repeated analyses for each indicator. The MCDM analysis ultimately concludes that the degree of facility improvement is the most important indicator affecting the passenger flow of urban complexes.
  • Evaluation Results for Urban Complexes: Using passenger flow as the primary metric and evaluating facility improvement, transportation accessibility, spatial scale, spatial layout, and the degree of demand fulfillment as the evaluation indexes, it is found that Shanghai MOSCHINO scores the highest, while Nanjing Central Emporium scores the lowest. This indicates that Shanghai MOSCHINO has the most reasonable spatial design under the goal of “humanization”.

Author Contributions

Conceptualization, W.L. and L.Z.; methodology, Y.L.; software, W.L.; validation, W.L. and Y.L.; formal analysis, W.L.; investigation, Y.L.; resources, L.Z.; data curation, W.L.; writing—original draft preparation, Y.L.; writing—review and editing, W.L. and L.Z.; visualization, Y.L.; supervision, L.Z.; project administration, L.Z. All authors have read and agreed to the published version of the manuscript.

Funding

This research received no external funding.

Data Availability Statement

New data were created or analyzed in this study. Data will be shared upon request and consideration of the authors.

Acknowledgments

The authors would like to thank the School of Architecture of Chang’an University for providing the research space for this experiment, and the city residents who were willing to accept the questionnaires to be filled out in this study and the experts who were consulted in the study for their valuable advice.

Conflicts of Interest

The authors declare no conflicts of interest.

Appendix A

As shown in Table A1, for the five indicators in R1 (Target level): spatial feeling, spatial function, architectural style, surroundings, and energy-saving technologies, five aspects of the 1–9 scale method of scoring evaluation, through the calculation of the average of the scores of the experts, the final importance of the matrix form was obtained. The consistency test indicator CR = 0.0503 < 0.1 of the matrix form indicates that the judgment matrix is consistent and the data are valid.
Table A1. Importance Matrix of R1 Layer Factors. This table presents the results of the indicator scoring matrix within the R1 layer.
Evaluation System for
Crowd Use in Urban Complexes (R1)
Spatial Feeling
(A1)
Spatial Function
(A2)
Architectural Style
(A3)
Surroundings
(A4)
Energy-Saving Technologies
(A5)
Spatial feeling (A1)10.69093.47330.97571.419
Spatial function (A2)1.447412.64042.81882.2633
Architectural style (A3)0.28790.378710.69581.8403
Surroundings (A4)1.02490.35481.437211.3011
Energy-saving technologies (A5)0.70470.44180.54340.76861
Λmax = 5.2253, CR = 0.0503 < 0.1
As shown in Table A2, for the five indicators in A1 (Management level): spatial interest, indoor–outdoor interactivity, spatial scales, green richness, clean and hygienic environment, five aspects of the 1–9 scale method of scoring evaluation, through the calculation of the average of the scores of the experts, the final importance of the matrix form was obtained. The consistency test indicator CR = 0.0228 < 0.1 of the matrix form indicates that the judgment matrix is consistent and the data are valid.
Table A2. Importance Matrix of A1 Layer Factors. The table summarizes the results of the indicator scoring matrix contained in the A1 layer.
Spatial Feeling (A1)Spatial Interest (B11)Indoor–Outdoor Interactivity
(B12)
Spatial Scales (B13)Green Richness (B14)Clean and Hygienic Environment
(B15)
Spatial interest (B11)10.83960.59221.11080.403
Indoor-outdoor interactivity
(B12)
1.19110.63080.71020.6363
Spatial scales (B13)1.68871.585312.3051.5705
Green richness (B14)0.90021.40810.433810.7694
Clean and hygienic environment
(B15)
2.48121.57150.63681.29981
Λmax = 5.102, CR = 0.0228 < 0.1
As shown in Table A3, for the five indicators in A2 (Management level): well-established facilities, flexibility, fulfillment, open sharing, and reasonable layout, five aspects of the 1–9 scale method of scoring evaluation, through the calculation of the average of the scores of the experts, the final importance of the matrix form was obtained. The consistency test indicator CR = 0.017 < 0.1 of the matrix form indicates that the judgment matrix is consistent and the data are valid.
Table A3. Importance Matrix of A2 Layer Factors. The table summarizes the results of the indicator scoring matrix contained in the A2 layer.
Spatial Function (A2)Well-Established Facilities (B21)Flexibility (B22)Fulfillment (B23)Open Sharing (B24)Reasonable Layout (B25)
Well-established facilities (B21)12.80820.85292.45031.3538
Flexibility (B22)0.356110.35850.80610.3603
Fulfillment (B23)1.17252.789314.97231.9743
Open sharing (B24)0.40811.24050.201110.3394
Reasonable layout (B25)0.73872.77540.50652.94661
Λmax = 5.076, CR = 0.017 < 0.1
As shown in Table A4, for the three indicators in A3 (Management level): territoriality, aesthetics, and site coordination, three aspects of the 1–9 scale method of scoring evaluation, through the calculation of the average of the scores of the experts, the final importance of the matrix form was obtained. The consistency test indicator CR = 0.0253 < 0.1 of the matrix form indicates that the judgment matrix is consistent and the data are valid.
Table A4. Importance Matrix of A3 Layer Factors. The table summarizes the results of the indicator scoring matrix contained in the A3 layer.
Architectural Style (A3)Territoriality (B31)Aesthetics (B32)Site Coordination (B33)
Territoriality (B31)12.16691.5639
Aesthetics (B32)0.461511.173
Site Coordination (B33)0.63940.85251
λmax=3.0263, CR = 0.0253 < 0.1
As shown in Table A5, for the three indicators in A4 (Management level): accessibility, figure-round relationship, and diversity of facilities, three aspects of the 1–9 scale method of scoring evaluation, through the calculation of the average of the scores of the experts, the final importance of the matrix form was obtained. The consistency test indicator CR = 0.02 < 0.1 of the matrix form indicates that the judgment matrix is consistent and the data are valid.
Table A5. Importance Matrix of A4 Layer Factors. The table summarizes the results of the indicator scoring matrix contained in the A4 layer.
Surroundings (A4)Accessibility (B41)Figure-Round Relationship (B42)Diversity of Facilities
(B43)
Accessibility(B41)14.23841.8354
Figure-round relationship (B42)0.235910.6672
Diversity of facilities (B43)0.54481.49871
Λmax = 3.0208, CR = 0.02 < 0.1
As shown in Table A6, for the three indicators in A4 (Management level): active energy-saving, passive energy-saving, and clean energy, three aspects of the 1–9 scale method of scoring evaluation, through the calculation of the average of the scores of the experts, the final importance of the matrix form was obtained. The consistency test indicator CR = 0.0042 < 0.1 of the matrix form indicates that the judgment matrix is consistent and the data are valid.
Table A6. Importance Matrix of A5 Layer Factors. The table summarizes the results of the indicator scoring matrix contained in the A5 layer.
Energy-Saving Technologies (A5)Active Energy-Saving (B51)Passive Energy-Saving (B52)Clean Energy (B53)
Active energy-saving (B51)10.59560.5126
Passive energy-saving (B52)1.67911.0502
Clean energy (B53)1.95070.95221
Λmax = 3.0044, CR = 0.0042 < 0.1

References

  1. Cao, K.; Deng, Y.; Song, C. Exploring the drivers of urban renewal through comparative modeling of multiple types in Shenzhen, China. Cities 2023, 137, 104294. [Google Scholar] [CrossRef]
  2. Cao, K.; Deng, Y.; Wang, W.; Liu, S. The spatial heterogeneity and dynamics of land redevelopment: Evidence from 287 Chinese cities. Land Use Policy 2023, 132, 106760. [Google Scholar] [CrossRef]
  3. Puchkov, M.V. Complex construction: Urban design principles and the basis of sustainable development. IOP Conf. Ser. Mater. Sci. Eng. 2020, 962, 032047. [Google Scholar] [CrossRef]
  4. Pan, W. What type of mixed-use and open? A critical environmental analysis of three neighborhood types in China and insights for sustainable urban planning. Landsc. Urban Plan. 2021, 216, 104221. [Google Scholar] [CrossRef]
  5. Wu, Y.; Wang, Z.; Wang, H. Vertical Greenery systems in commercial complexes: Development of an evaluation guideline. Sustainability 2023, 15, 2551. [Google Scholar] [CrossRef]
  6. Kim, S.; Han, J. Characteristics of urban sustainability in the cases of multi commercial complexes from the perspective of the “ground”. Sustainability 2016, 8, 439. [Google Scholar] [CrossRef]
  7. Huang, Y. Economic Periodicals. Economic 2011, 3, 11. (In Chinese) [Google Scholar]
  8. Wu, J.; Wang, Y. Uran Complex Classification Methodology under the Requirement of Refined Transportation Configuration. J. Tongji Univ. (Nat. Sci.) 2019, 47, 1735–1741. [Google Scholar]
  9. Zhang, X.; Han, H.; Shu, X. Influencing Factors on the Vitality of Five Commercial Complexes in Hangzhou:Based on the Heat Maps Analysis. J. Geo-Inf. Sci. 2019, 21, 1745–1754. [Google Scholar]
  10. Zhou, C. Study on the Functional Orientation of the Urban Complex. Appl. Mech. Mater. 2014, 488–489, 449–452. [Google Scholar] [CrossRef]
  11. Xu, S.N.; Liu, Y.B.; Chen, L.L. The city-building-complex and the shaping of urban form. Appl. Mech. Mater. 2013, 409–410, 900–903. [Google Scholar] [CrossRef]
  12. Preiser, W.F.; Rabinowitz, H.Z.; White, E.T. Post-Occupancy Evaluation; Van Nostrand Reinhold: New York, NY, USA, 1988. [Google Scholar]
  13. Gray, J.; Isaacs, N.; Kernohan, D.; Mclndoe, G. Building Evaluation Techniques; McGraw-Hill: New York, NY, USA, 1995. [Google Scholar]
  14. Hong, X.; Li, S.; Chen, T.; Ji, X.; Song, X. Spatial performance evaluation and optimization of integrated aboveground and underground spaces in urban commercial complexes. J. Asian Arch. Build. Eng. 2024, 1–27. [Google Scholar] [CrossRef]
  15. Qin, Y.; Yao, M.; Shen, L.; Wang, Q. Comprehensive evaluation of functional diversity of urban commercial complexes based on dissipative structure theory and synergy theory: A case of SM city plaza in Xiamen, China. Sustainability 2021, 14, 67. [Google Scholar] [CrossRef]
  16. Černikovaitė, M.; Karazijienė, Ž.; Bivainienė, L.; Dambrava, V. Assessing Customer Preferences for Shopping Centers: Effects of Functional and Communication Factors. Sustainability 2021, 13, 3254. [Google Scholar] [CrossRef]
  17. Wu, H.; Yu, J.; Ai, S.; Zhou, P.; Chen, Y. Site Suitability Evaluation of a Large Commercial Complex Using an Improved Projection Pursuit Model. Buildings 2024, 14, 1586. [Google Scholar] [CrossRef]
  18. Sahito, N.; Han, H.; Nguyen, T.V.T.; Kim, I.; Hwang, J.; Jameel, A. Examining the Quasi-Public Spaces in Commercial Complexes. Sustainability 2020, 12, 1830. [Google Scholar] [CrossRef]
  19. Gudonavičienė, R.; Alijošienė, S. Influence of Shopping Centre Image Attributes on Customer Choices. Econ. Manag. 2013, 18, 545–552. [Google Scholar] [CrossRef]
  20. Wu, Y.; Wang, H.; Wang, Z.; Diehl, J.A.; Xue, S. Evaluating the economic sustainability of commercial complex greening based on cost-benefit analysis: A case study of Singapore’s Shaw center. Ecol. Indic. 2024, 161, 111890. [Google Scholar] [CrossRef]
  21. Guo, X.; Cui, W.; Lo, T.; Hou, S. Research on dynamic visual attraction evaluation method of commercial street based on eye movement perception. J. Asian Arch. Build. Eng. 2021, 21, 1779–1791. [Google Scholar] [CrossRef]
  22. Zeng, R.; Shen, Z.; Luo, J. Post-occupancy evaluation of user satisfaction: Case studies of 10 urban underground complexes in China. Tunn. Undergr. Space Technol. 2024, 143, 105500. [Google Scholar] [CrossRef]
  23. Yang, Z. Microanalysis of shopping center location in terms of retail supply quality and environmental impact. J. Urban Plan. Dev. 2002, 128, 139–149. [Google Scholar] [CrossRef]
  24. Sun, Y.; Lian, F.; Yang, Z.-Z. Optimizing the location of physical shopping centers under the clicks-and-mortar retail mode. Environ. Dev. Sustain. 2022, 24, 2288–2314. [Google Scholar] [CrossRef]
  25. Hauxner, M. Open to the Sky; The Danish Architectural Press: Copenhagen, Denmark, 2003. [Google Scholar]
  26. Aalto, A. The Humanizing of Architecture; Birkhäuser Verlag: Basel, Switzerland, 1970; Volume 15. [Google Scholar]
  27. Almahmood, M.; Gulsrud, N.M.; Schulze, O.; Carstensen, T.A.; Jørgensen, G. Human-centred public urban space: Exploring how the ‘re-humanisation’ of cities as a universal concept has been adopted and is experienced within the socio-cultural context of Riyadh. Urban Res. Pract. 2018, 15, 1539512. [Google Scholar] [CrossRef]
  28. Darko, A.; Chan, A.P.C.; Ameyaw, E.E.; Owusu, E.K.; Pärn, E.; Edwards, D.J. Review of application of analytic hierarchy process (AHP) in construction. Int. J. Constr. Manag. 2018, 19, 436–452. [Google Scholar] [CrossRef]
  29. Xiu, C.; Jin, Y. Issues with Spatial Scale in Urban Research. Chin. Geogr. Sci. 2022, 32, 373–388. [Google Scholar] [CrossRef]
  30. Milosevic, S.; Aksamija, A. Sustainable Retrofit Strategies for an Existing and Historically Significant Residential Complex: Environmental Response and Facade Performance Analysis. In Interdisciplinary Advances in Sustainable Development; Tufek-Memišević, T., Arslanagić-Kalajdžić, M., Ademović, N., Eds.; ICSD 2022; Lecture Notes in Networks and Systems; Springer: Berlin/Heidelberg, Germany, 2023; Volume 529. [Google Scholar] [CrossRef]
  31. PRC.GB 50352-2019; Uniform Standards for Civil Building Design. China Architecture & Building Press: Beijing, China, 2019.
  32. Wu, C.; Ye, Y.; Gao, F.; Ye, X. Using street view images to examine the association between human perceptions of locale and urban vitality in Shenzhen, China. Sustain. Cities Soc. 2023, 88, 104291. [Google Scholar] [CrossRef]
  33. Liu, L. Urban Complex Public Space Design Method Based on Support Vector Machine. Math. Probl. Eng. 2022, 2022, 9812223. [Google Scholar] [CrossRef]
  34. Zhuang, R.; Jiang, D. Integrated evaluation and optimization on building area ratios of urban complex with distributed energy resource system in different climatic conditions. Energy Build. 2022, 261, 111949. [Google Scholar] [CrossRef]
  35. PRC.GB 50189-2015; Energy Efficiency Design Standards for Public Buildings. China Architecture & Building Press: Beijing, China, 2015.
  36. PRC.GB 55015-2021; General Specification for Energy Efficiency and Renewable Energy Use in Buildings. China Architecture & Building Press: Beijing, China, 2021.
  37. Zhang, Y.; Yan, S.; Liu, J.; Xu, P. Popularity influence mechanism of creative industry parks: A semantic analysis based on social media data. Sustain. Cities Soc. 2023, 90, 104384. [Google Scholar] [CrossRef]
  38. Qiu, Q.; Zhang, M. Using Content Analysis to Probe the Cognitive Image of Intangible Cultural Heritage Tourism: An Exploration of Chinese Social Media. ISPRS Int. J. Geo-Inf. 2021, 10, 240. [Google Scholar] [CrossRef]
  39. Shao, J.; Chang, X.; Morrison, A.M. How Can Big Data Support Smart Scenic Area Management? An Analysis of Travel Blogs on Huashan. Sustainability 2017, 9, 2291. [Google Scholar] [CrossRef]
  40. Freeman, L.C. Centrality in social networks conceptual clarification. Soc. Netw. 1978, 1, 215–239. [Google Scholar] [CrossRef]
  41. Long, Y.; Qin, J.; Wu, Y.; Wang, K. Analysis of Urban Park Accessibility Based on Space Syntax: Take the Urban Area of Changsha City as an Example. Land 2023, 12, 1061. [Google Scholar] [CrossRef]
  42. Shishegaran, A.; Safari, S.; Karami, B. Sustainability evaluation for selecting the best optimized structural designs of a tall building. Sustain. Mater. Technol. 2022, 33, e00482. [Google Scholar] [CrossRef]
  43. Sadabadi, S.A.; Hadi-Vencheh, A.; Jamshidi, A.; Jalali, M. A new index for TOPSIS based on relative distance to best and worst points. Int. J. Inf. Technol. Decis. Mak. 2020. [Google Scholar] [CrossRef]
  44. Zhou, J.; Su, W.; Baležentis, T.; Streimikiene, D. Multiple criteria group decision-making considering symmetry with regards to the positive and negative ideal solutions via the pythagorean normal cloud model for application to economic decisions. Symmetry 2018, 10, 140. [Google Scholar] [CrossRef]
  45. Shen, Y.; Shen, Y. Evaluation and Selection of Cultural and Creative Design Solutions Based on Grey Correlation Multicriteria Decision Analysis. Math. Probl. Eng. 2022, 2022, 1755728. [Google Scholar] [CrossRef]
  46. Yi, P.; Dong, Q.; Li, W.; Wang, L. Measurement of city sustainability based on the grey relational analysis: The case of 15 sub-provincial cities in China. Sustain. Cities Soc. 2021, 73, 103143. [Google Scholar] [CrossRef]
  47. Chen, T.; Luh, D.; Hu, L.; Liu, J.; Chen, H. Sustainable Design Strategy of Regional Revitalization Based on AHP–FCE Analysis: A Case Study of Qianfeng in Guangzhou. Buildings 2023, 13, 2553. [Google Scholar] [CrossRef]
  48. Xu, Y.; Chen, X. The spatial vitality and spatial environments of urban underground space (UUS) in metro area based on the spatiotemporal analysis. Tunn. Undergr. Space Technol. 2022, 123, 104401. [Google Scholar] [CrossRef]
  49. Ashihara, Y. Ashihara, Aesthetics of Streets; Baihua Literature and Art Publishing: Tianjin, China, 2007. [Google Scholar]
Figure 1. Research Framework—Presentation of the overall logic of the study.
Buildings 14 02179 g001
Figure 2. Beijing Hopson One Location Analysis.
Buildings 14 02179 g002
Figure 3. Shanghai MOSCHINO Location Map.
Buildings 14 02179 g003
Figure 4. Nanjing Central Emporium Location Analysis Map.
Buildings 14 02179 g004
Figure 5. Statistics on the composition of the general population without architectural research experience who completed the questionnaire.
Buildings 14 02179 g005
Figure 6. Results of analysis of the integration degree of three urban areas: (a) Beijing Hopson One 2000 m square road integration degree results; (b) Shanghai MOSCHINO 2000 m square road integration degree results; (c) Nanjing Central Emporium 2000 m square road integration degree results.
Buildings 14 02179 g006
Figure 7. Results of the Selectivity Analysis of Roadways: (a) Beijing Hopson One Square 2000 m Road Selectivity Results; (b) Shanghai MOSCHINO Square 2000 m Road Selectivity Results; (c) Nanjing Central Emporium 2000 m Road Selectivity Results.
Buildings 14 02179 g007
Figure 8. The results of the interior layout analysis of Beijing Hopscotch are as follows: (a) diagram illustrating internal connectivity, (b) diagram depicting the integration of the internal visual field, and (c) diagram showing the comprehensibility of the internal space.
Buildings 14 02179 g008
Figure 9. The results of the internal layout analysis of Shanghai MOSCHINO include the following diagrams: (a) diagram illustrating internal connectivity, (b) diagram depicting the integration of the internal visual field, and (c) diagram showing the comprehensibility of the internal space.
Buildings 14 02179 g009
Figure 10. The interior layout analysis results of Nanjing Central Emporium include the following: (a) internal connectivity analysis map, (b) internal visual integration analysis map, and (c) internal space comprehensibility analysis map.
Buildings 14 02179 g010
Figure 11. Description of the D/H values of Beijing Hopson One, Shanghai MOSCHINO, Nanjing Central Emporium.
Buildings 14 02179 g011
Table 2. Evaluation Indicator System for Population Communication Use in Urban Complexes. This table presents a total of 25 indicators categorized into three levels: target level, criterion level, and indicator level.
Target Level (R)Management Level (A)The Level of Indicators (B)
Evaluation System for Crowd Use of Urban Complexes (R1)Spatial Sensing (A1)Spatial Interest (B11)
Indoor–Outdoor Interactivity (B12)
Spatial Scales (B13)
Green Richness (B14)
Clean and Hygienic Environment (B15)
Spatial Function (A2)Well-Established Facilities (B21)
Flexibility (B22)
Fulfillment (B23)
Open Sharing (B24)
Reasonable Layout (B25)
Architectural Style (A3)Territoriality (B31)
Aesthetics (B32)
Site Coordination (B33)
Surroundings (A4)Accessibility (B41)
Figure-Round Relationship (B42)
Diversity of Facilities (B43)
Energy-Saving Technologies (A5)Active Energy-Saving (B51)
Passive Energy-Saving (B52)
Clean Energy (B53)
Table 3. Sources for Indicator Screening. This table outlines the sources of indicators at the Criterion level. Indicators are sourced from relevant literature, norms, and standards, and are categorized and organized comprehensively.
IndicatorReference Source
Spatial sensing[29]
Spatial function[30,31]
Architectural style[22]
Surroundings[32,33]
Energy-saving technologies[34,35,36]
Table 4. Scoring criteria for evaluation indicators refer to.
1Equally important
3Slightly important
5Clearly important
7High priority
9Extremely important
2, 4, 6, 8Intermediate values of the above adjacent judgments
Reciprocal The latter is better than the former
Table 5. Mean Consistency Index R.I. For subsequent consistency testing, the relevant R.I. value must be determined based on the matrix order and applied in the consistency test equation to determine the matrix’s consistency.
matrix order123456789
RI000.520.891.121.261.361.411.46
Table 6. Calculation Results for Evaluation System Weight Values. The weights are calculated and ranked by aggregating the indicator scores for each judgment matrix. The table includes indicator weight shares at the criterion level and indicator weight shares at the indicator level.
Target Level (R)Management Level (A)WeightsThe Level of Indicators (B)Total Weight of ElementsRanking
Evaluation System for Crowd Use in Urban Complexes (R1)Spatial Sensing (A1)0.2341Spatial Interest (B11)0.033213
Indoor–Outdoor Interactivity (B12)0.036112
Spatial Scales (B13)0.07055
Green Richness (B14)0.037711
Clean and Hygienic Environment (B15)0.05667
Spatial Function (A2)0.3488Well-Established Facilities (B21)0.09113
Flexibility (B22)0.031216
Fulfillment (B23)0.12051
Open Sharing (B24)0.030717
Reasonable Layout (B25)0.07534
Architectural Style (A3)0.1242Territoriality (B31)0.05956
Aesthetics (B32)0.032315
Site Coordination (B33)0.032414
Surroundings (A4)0.1705Accessibility (B41)0.09772
Figure-Round Relationship (B42)0.026618
Diversity of Facilities (B43)0.046110
Energy-Saving Technologies (A5)0.1224Active Energy-Saving (B51)0.026519
Passive Energy-Saving (B52)0.04769
Clean Energy (B53)0.04848
Table 7. Examples of some of the comments on the urban complex in DZDP.
Comment TimeScoring ValuesReviewerComment Data
2024-07-05
13:47
4.5Beijing Hopson OneLocated in Chaoyang District, Beijing, Hopson One is a large complex offering shopping, leisure, food, and entertainment. The facility spans six floors above ground and two floors underground. In addition to regular promotional activities at the counters, the mall also launches novel programs during the New Year holidays. Visitors often come here on their days off to enjoy the food after shopping, making it a pleasant experience.
2024-07-03
16:57
5Beijing Hopson OneThe transportation is convenient and the range of brands is comprehensive. On hot summer days, it is a great place to hang out. The overall environment of the mall is pleasant, with many dining options to choose from. The subway station provides direct access, and the parking lot is also convenient. It’s one of the top choices for a summer outing.
2024-06-13
08:00
5Shanghai MOSCHINOFrom a professional standpoint, its brand layout is diverse and well-organized, featuring both high-end luxury brands and family-friendly trend brands, thereby meeting the needs of various consumers. The spatial design of the mall is also excellent, with spacious and bright interiors that make shopping particularly comfortable and enjoyable.
2024-04-25
13:42
3.5Shanghai MOSCHINOEvery time I pass by, I take a stroll through the mall. The cosmetics section is quite comprehensive, and there are often activities to participate in. However, probably due to the mall’s age, some facilities and decorations could use improvement. Nevertheless, the location is excellent, being near the Bund.
2024-06-15
10:35
4.5Nanjing Central EmporiumThis was my first time here, and the place is enormous. The subway entrance provides direct access, giving a dazzling impression right from the start.
2023-5-07
11:25
4.5Nanjing Central EmporiumThe mall is very large and offers a wide variety of items. It’s also very lively, with many people around. The food court upstairs is popular, with lines at almost every store, befitting its status as a central mall building.
Table 8. Frequency statistics of words synthesized in DZDP for Beijing Hopson One, Shanghai MOSCHINO, and Nanjing Central Emporium.
VocabulariesFrequencyVocabulariesFrequencyVocabulariesFrequencyVocabulariesFrequency
Brand623Big248Suitable165Facilities108
Good575Clock235Stores151Satisfaction106
Events548Subway233Pedestrian Street135lively105
Department Store468Underground230Price126Fashion96
Shopping438Yummy218Worthwhile123Characteristic96
Elevator389Experience216Clean122Kids95
Environment370Eating205Escalator121Everything95
Gourmet323Shopping203Consumption121Design89
Convenience310Clothing202Neighborhood117Layout84
Cosmetics290Dining196Popularity116Photo shoot80
Rotary289Recommended169Parking112Free of charge67
Services285Transportation168Required112
Locations249Complete168Restroom108
Table 9. Results of the calculation of indicator weights.
The Level of IndicatorsWeightsRanks
Fulfillment0.08165
Well-Established Facilities0.33311
Spatial Scales0.15323
Reasonable Layout0.14244
Accessibility0.28972
Table 10. Composite Score Ranking Results.
Commercial ComplexesL−L+R+R−ScoresRanks
Beijing Hopson One0.5820 1.0000 1.0000 0.9436 0.4487 2
Shanghai MOSCHINO1.0000 0.5823 0.9279 1.0000 0.5492 1
Nanjing Central Emporium0.2634 0.9287 0.9025 0.9606 0.3816 3
Table 11. Results of the TOPSIS evaluation method.
Commercial ComplexesD+D−Composite Score IndexRanking
Beijing Hopson One0.708200080.701344820.497568272
Shanghai MOSCHINO0.838449990.476169460.362210873
Nanjing Central Emporium0.657760460.672618270.505584051
Table 12. Comparison of MCDM analysis and TOPSIS analysis ranking.
Commercial ComplexesRanks (TOPSIS)Ranks (MCDM)
Beijing Hopscotch22
Shanghai Daimaru Department Store31
Nanjing Central Mall13
Disclaimer/Publisher’s Note: The statements, opinions and data contained in all publications are solely those of the individual author(s) and contributor(s) and not of MDPI and/or the editor(s). MDPI and/or the editor(s) disclaim responsibility for any injury to people or property resulting from any ideas, methods, instructions or products referred to in the content.

