Abstract
Nano-calcium carbonate (NC) is a novel ultrafine solid powder material that possesses quantum size effects, small size effects, surface effects, and macroscopic quantum effects that ordinary calcium carbonate lacks. As a nanomaterial with superior properties, graphene oxide (GO) has been studied extensively in the field of construction. In microscopic characterization, the reaction between NC and tricalcium aluminate (C3A) formed a new hydration product, hydrated calcium aluminum carbonate (C3A·CaCO3·11H2O), which enhanced the arrangement of hydration products and optimized the distribution of pore size in the mortar. Regarding the mechanical properties, the addition of GO and NC significantly enhanced the early-age mechanical performance of the mortar. In terms of durability, the incorporation of GO and NC significantly improved the water permeability, chloride ion permeability, and resistance to sulfate attack of the cement mortar. In this study, it was found that adding 1 wt% NC and 0.02 wt% GO not only improves the mechanical and durability properties but also promotes the hydration reaction according to the microstructure analysis. With the help of NC, compared with other studies, the amount of GO is reduced, while the cost is reduced, and the application of GO in the field of cement-based materials is promoted.
1. Introduction
Cement, as one of the main binding materials in concrete, generates a significant amount of carbon emissions during its production process. This leads to resource depletion, environmental issues such as construction waste, and failure to meet the requirements for sustainable and green development of construction materials [1]. In order to reduce the consumption of cement, it is necessary to explore alternative products that can replace some of the cement, which is of great importance for environmental protection and the sustainable development of construction materials [2]. Researchers have made numerous attempts in the search for cement replacements and it has been found that incorporating small amounts of nanomaterials into cement-based materials can enhance their performance, thereby reducing the amount of cement used [3,4]. Nanomaterials refer to materials in which at least one dimension is within the nanoscale range (1–100 nm) or materials composed of such nanoscale building blocks. Based on the nanoscale effect of nanomaterials, their incorporation into concrete can significantly reduce the amount of cement used, typically achieving a reduction of 10% to 20%. Additionally, the addition of nanomaterials can improve the microstructure of concrete, enhance its mechanical and durability properties, and increase its service life [5,6], thereby reducing resource consumption and pollution caused by the disposal of concrete waste.
Graphene oxide (GO) is a derivative of graphene obtained by oxidation. As a derivative of graphene, it contains a large number of hydroxyl, carboxyl, and epoxy groups on its surface and, due to its excellent physical and chemical properties similar to graphene, it can be combined with many materials (including nanomaterials) to improve the mechanical performance and durability of cement-based materials [7,8]. In terms of mechanical performance, Fonseka et al. [9] found that adding 0.08 wt% of mechanically dispersed graphene oxide in concrete with polycarboxylate-ether-based superplasticizer (PS) increased the compressive strength by 21% and 19% at 28 days and 56 days, respectively, compared to the control. Similarly, in cement mortars, mechanical dispersion and incorporation of graphene oxide can enhance the dispersion of GO, resulting in a 56% and 38% increase in compressive strength and a 29% and 44% increase in flexural strength [10,11]. The use of ultrasonic dispersion techniques in GO processing may further enhance its performance [8]. Luo et al. [12] dispersed a 0.04 wt% GO dispersion using ultrasonic dispersion and combined it with perlite microspheres (PM), resulting in a 43% increase in compressive strength and a 25% increase in flexural strength of cement mortars at 28 days. Yu et al. [13] revealed that the combination of 0.05 wt% GO with nano-materials such as nano-SiO2 improved the performance of mortar. The compressive strength, initial fracture toughness, and unstable fracture toughness increased by 15.1%, 92.2%, and 64.7%, respectively. In terms of durability, the needle-shaped ettringite generated by GO promotes hydration and exhibits expansive properties. When filled in the pores of the cement matrix, it increases the density of the matrix and improves the corrosion resistance of the specimens, effectively altering the microstructural characteristics [13,14,15,16]. These studies have revealed the mechanism of action of GO in cementitious materials and have demonstrated its excellent compatibility with other nanomaterials. However, the aforementioned studies on GO were all conducted with loadings ranging from 0.04 to 0.16 wt%. As GO is a relatively expensive nanomaterial, we should explore methods to reduce the loading while maintaining enhanced performance, thus paving the way for a wider application of GO.
Nano-calcium carbonate (Nano-CaCO3, NC), also known as ultrafine calcium carbonate, is a novel ultrafine solid powder material. Due to the ultrafineness of NC particles, changes occur in its crystal structure and surface electron structure, resulting in quantum size effects, small size effects, surface effects, and macroscopic quantum effects that ordinary calcium carbonate lacks. The particle size of NC is fine and uniform, with a high surface energy, which provides good control over the molecular pore size gradient [17].
Currently, NC achieves uniform dispersion by breaking the van der Waals forces between layers through ultrasonic dispersion techniques [18]. In terms of mechanical performance, Liu et al. [19] found that the addition of 1 wt% of NC increased the flexural strength and compressive strength of specimens by 108.3% and 108.6%, respectively, at 28 days. Shaikh et al. [20] also observed significant enhancement effects of NC in NC-modified high-volume fly ash (HVFA) concretes and Shen et al. [21] found similar improvements in NC-modified high-strength concrete (HSC). Poudyal et al. [22,23] investigated the influence of NC on slump flow and compressive strength of Ordinary Portland Cement (OPC) concrete and Portland-limestone cement (PLC) concrete. The addition of 1 wt% NC had a minimal effect on the slump flow of OPC and PLC, while it increased the compressive strength of OPC by 52% at 56 days. Meng et al. [24] studied the effect of NC on cement paste and found that an appropriate amount of NC improved the early compressive strength of cement paste but decreased its later compressive strength. Han et al. [25] suggested that the optimum dosage of NC was 4 wt%, resulting in a 17.4% increase in compressive strength. Feng et al. [26] immobilized NC on polypropylene fibers by melting paraffin wax at 58 °C and observed the early acceleration of hydration.
In terms of durability performance, Hosan et al. [27] investigated the influence of NC on the durability of high-volume slag (HVS) and high-volume slag-fly ash (HVS-FA) concrete. The results show that the addition of 1 wt% NC reduced the water absorption by 1% and 10% in HVS and HVS-FA concrete, respectively, compared to their respective Ref groups. At a dosage of 1 wt%, NC also improved the resistance to chloride ion penetration in polypropylene fiber (PPF)-recycled concrete aggregate (RCA) by 24% [28].
Based on the above, this study incorporated GO and NC as composite additives into cement mortar and systematically investigated their effects on the mechanical performance, durability, and microstructure of cement mortars. Furthermore, while there has been extensive research on the use of graphene oxide and nano-calcium carbonate as nano-material additives in mortar, few studies have examined the combined effect of these two materials on mortar properties. Therefore, this study aims to fill in the research gap, improve the research conclusions, and provide a comprehensive understanding of the modified cement mortars using graphene oxide and nano-calcium carbonate through microstructural characterization and macroperformance evaluation, including mechanical properties and durability. Optimal dosage ratios of GO and NC in cement mortars were determined and the influencing patterns of GO and NC on micro-mechanisms were summarized, which has practical significance for the mechanistic research of cement-based materials.
2. Materials and Methods
2.1. Experimental Materials
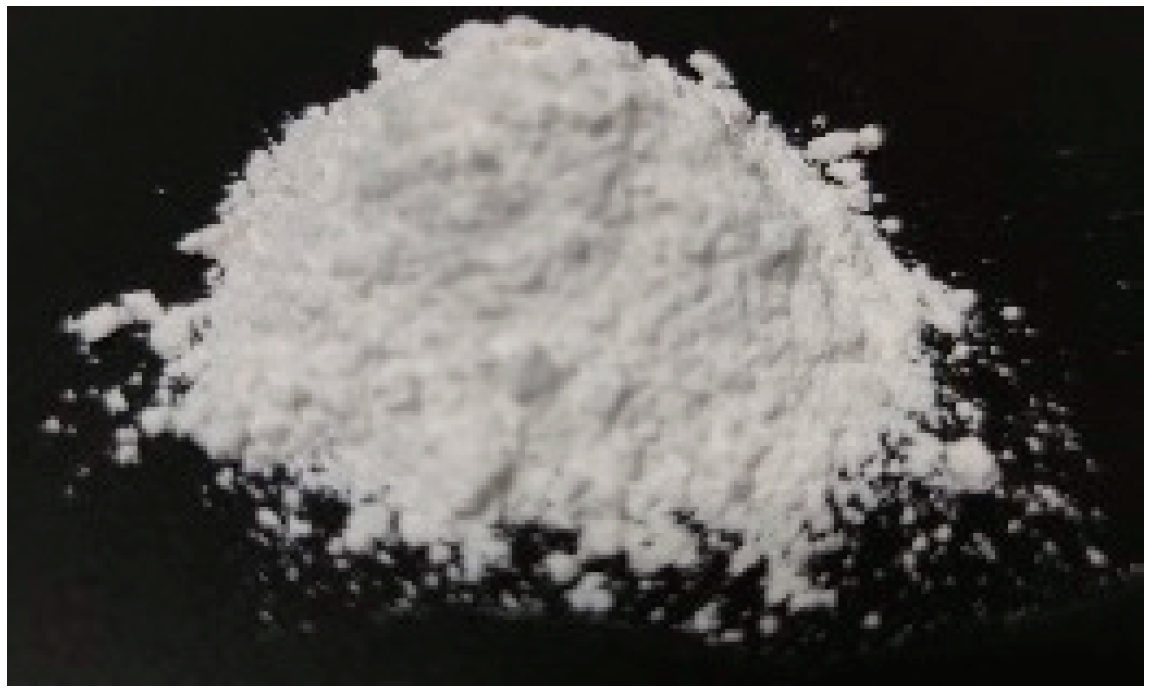
The graphene oxide dispersion used in this experiment was produced by Changzhou Sixth Element Materials Technology Co., Ltd. (Changzhou, China), with the model number SE3122-L, as shown in Figure 1 and Table 1. The nano-calcium carbonate utilized in the experiment was manufactured by Beijing Boyu Gaoke New Materials Technology Co., Ltd. (Beijing, China) and appeared as a white powdered substance, as depicted in Figure 2 and Table 2. The cement mortar was prepared using ordinary Portland cement produced by Jidong Cement Chongqing Hechuan Co., Ltd. (Chongqing, China), as shown in Table 3, machine-made sand from Chongqing Nanchuan Xianglei Mine, as shown in Table 4, and Sikament 540P superplasticizer produced by Shanghai Zongye Industry Co., Ltd. (Shanghai, China), as shown in Table 5.
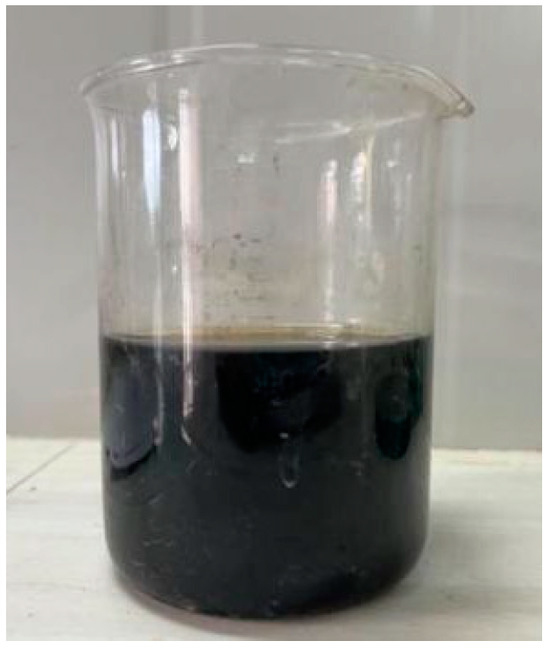
Figure 1.
Graphene oxide dispersion solution.

Table 1.
Technical parameters of graphene oxide dispersion.
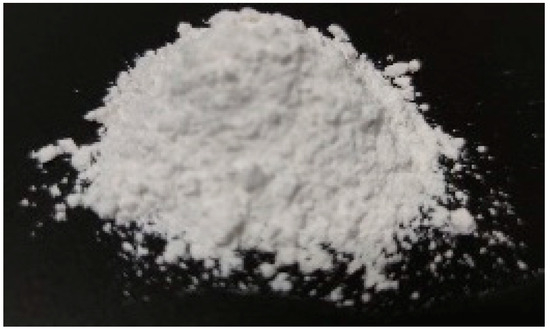
Figure 2.
Nano-calcium carbonate powder.
Table 2.
Technical parameters of nano-calcium carbonate.
Table 3.
Technical parameters of cement.
Table 4.
Technical parameters of machine-made sand.
Table 5.
Technical parameters of polycarboxylate-based water reducer.
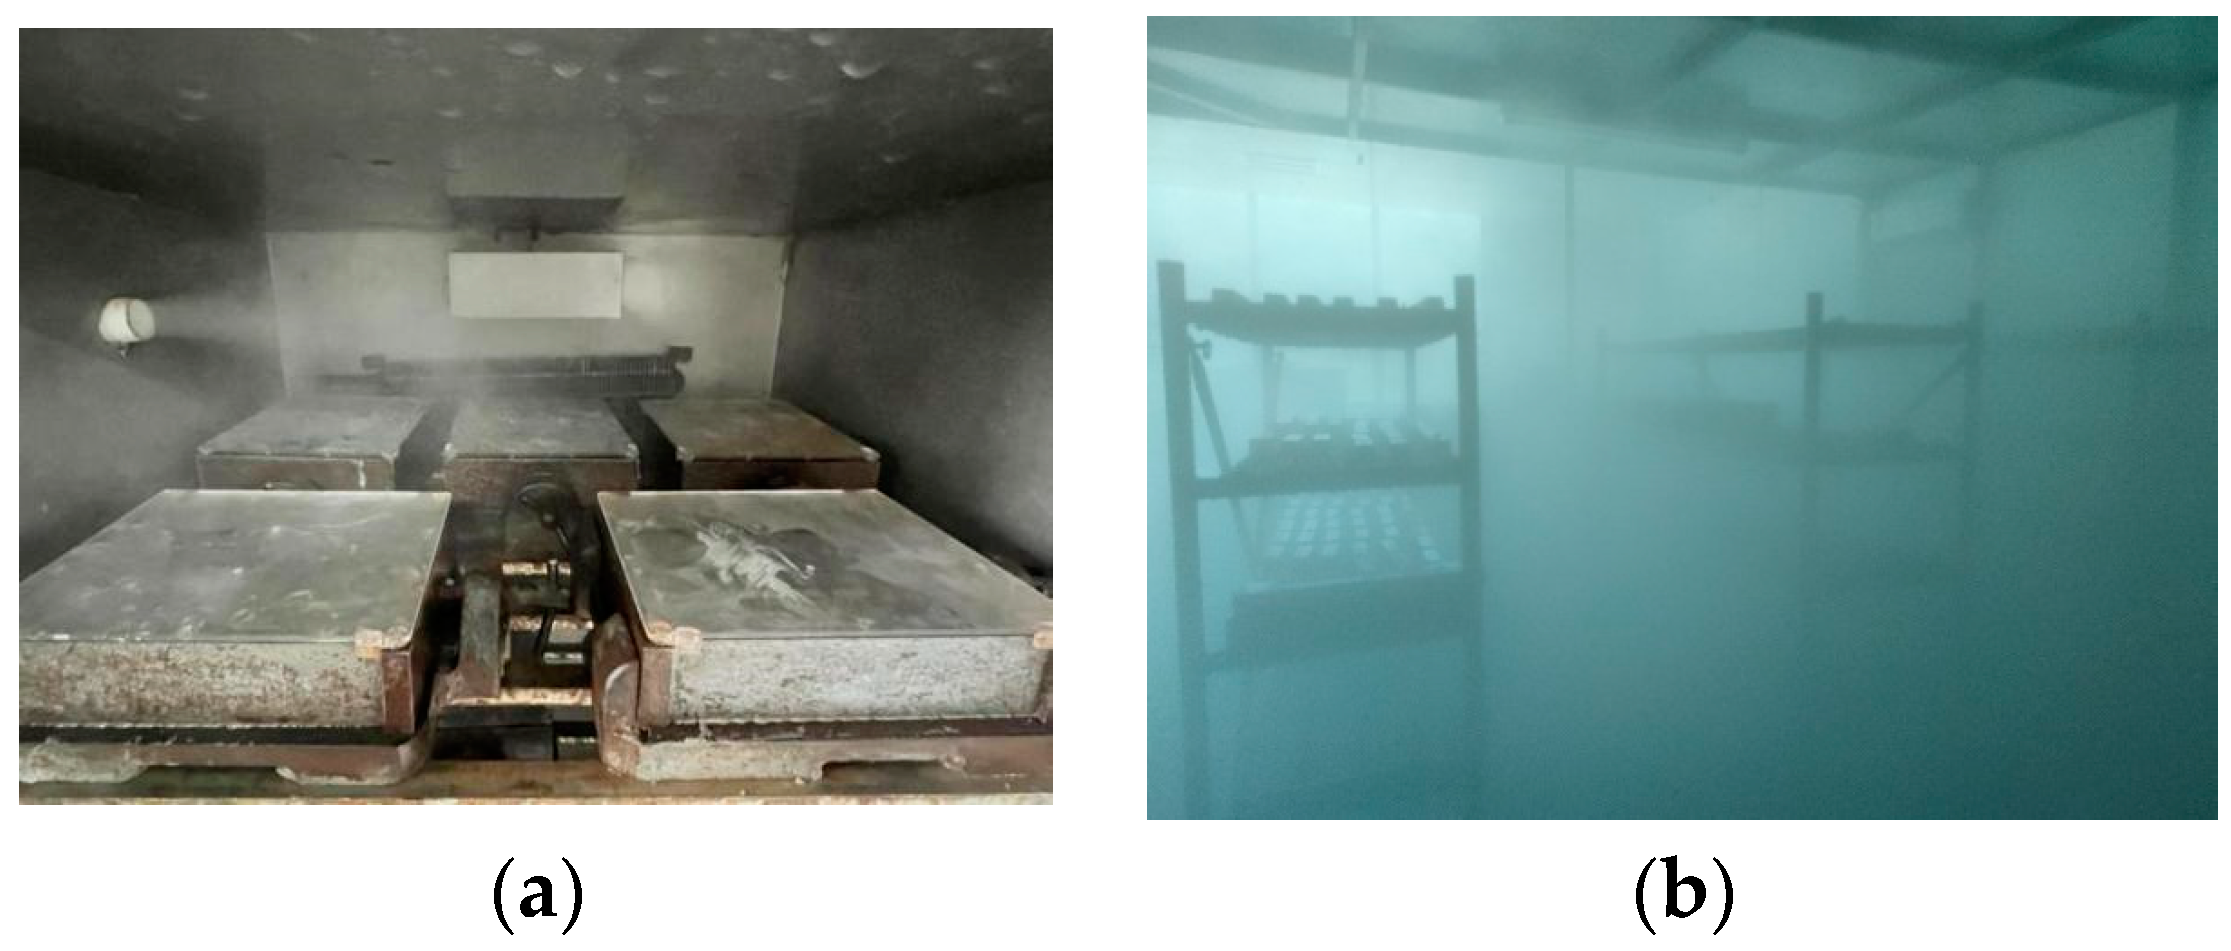
In this experiment, GO was added to deionized water and combined with a water reducer. The mixture was then placed in an ultrasonic disperser for 10 min at a power of 100 W to prepare the PCE-GO dispersion liquid [16,29]. According to the mixing ratio, the pre-weighed cement, sand, and NC (if applicable, otherwise it is not added) were mixed in a mixing bowl and then the GO dispersion liquid was added to form the specimens. The specimens were placed in a standard curing box at a temperature of 20 ± 2 °C and a humidity of 98% until the specified age, as shown in Figure 3a. In this test, three different admixtures were used and the percentages of graphene oxide (by the mass of cement) varied: 0 wt%, 0.02 wt%, 0.04 wt%, and 0.06 wt%. Similarly, the percentages of nano-calcium carbonate (by the mass of cement) varied: 0 wt%, 0.5 wt%, 0.1 wt%, and 0.15 wt%. This study was divided into several groups. The GO0NC0 group served as the Ref group for ordinary cement mortar. GO0NC0.5, GO0NC1, and GO0NC1.5 were the control groups with only NC added. GO2NC0, GO4NC0, and GO6NC0 were the control groups with only GO added. The remaining groups were the GO-NC composite groups. During the experiment, the dosage of the water reducer was adjusted to maintain the flowability of each group within the range of 180 ± 20 mm. The final mix proportions for the cement mortar are shown in Table 6.
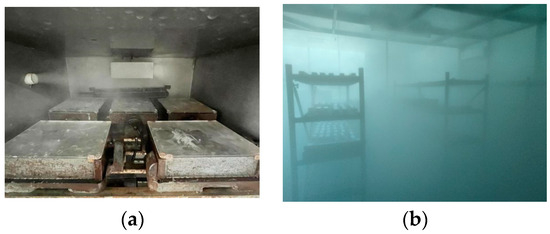
Figure 3.
Curing of cement mortar specimens. (a) Graphene oxide dispersion solution; (b) Nano-calcium carbonate powder.
Table 6.
Proportioning of cement mortar.
2.2. Experimental Methods
- Mechanical performance testing
The mechanical performance test specimens were prisms measuring 40 mm × 40 mm × 160 mm, with three specimens in each group. The testing instrument used was a YAW-300/10 automatic compressive–flexural constant stress testing machine, with a precision level of Grade 1. The flexural strength test was conducted in accordance with the Chinese standard “Test Method for Strength of Cement Mortar (ISO method)” [30]. The specimens were uniformly loaded at a rate of 50 N/s ± 10 N/s until failure. After completing the flexural strength test, the fractured specimens were used for the compressive strength test [30], uniformly loaded at a rate of 2400 N/s ± 2000 N/s until failure during the entire loading process.
The flexural strength of the specimen group was the arithmetic mean of three measurements, with a precision of 0.1 MPa. After the three specimens were subjected to flexural strength tests and broken into six specimens, these six specimens were then subjected to compressive strength tests. The compressive strength was the arithmetic mean of the six measurements, with a precision of 0.1 MPa.
- Water absorption test
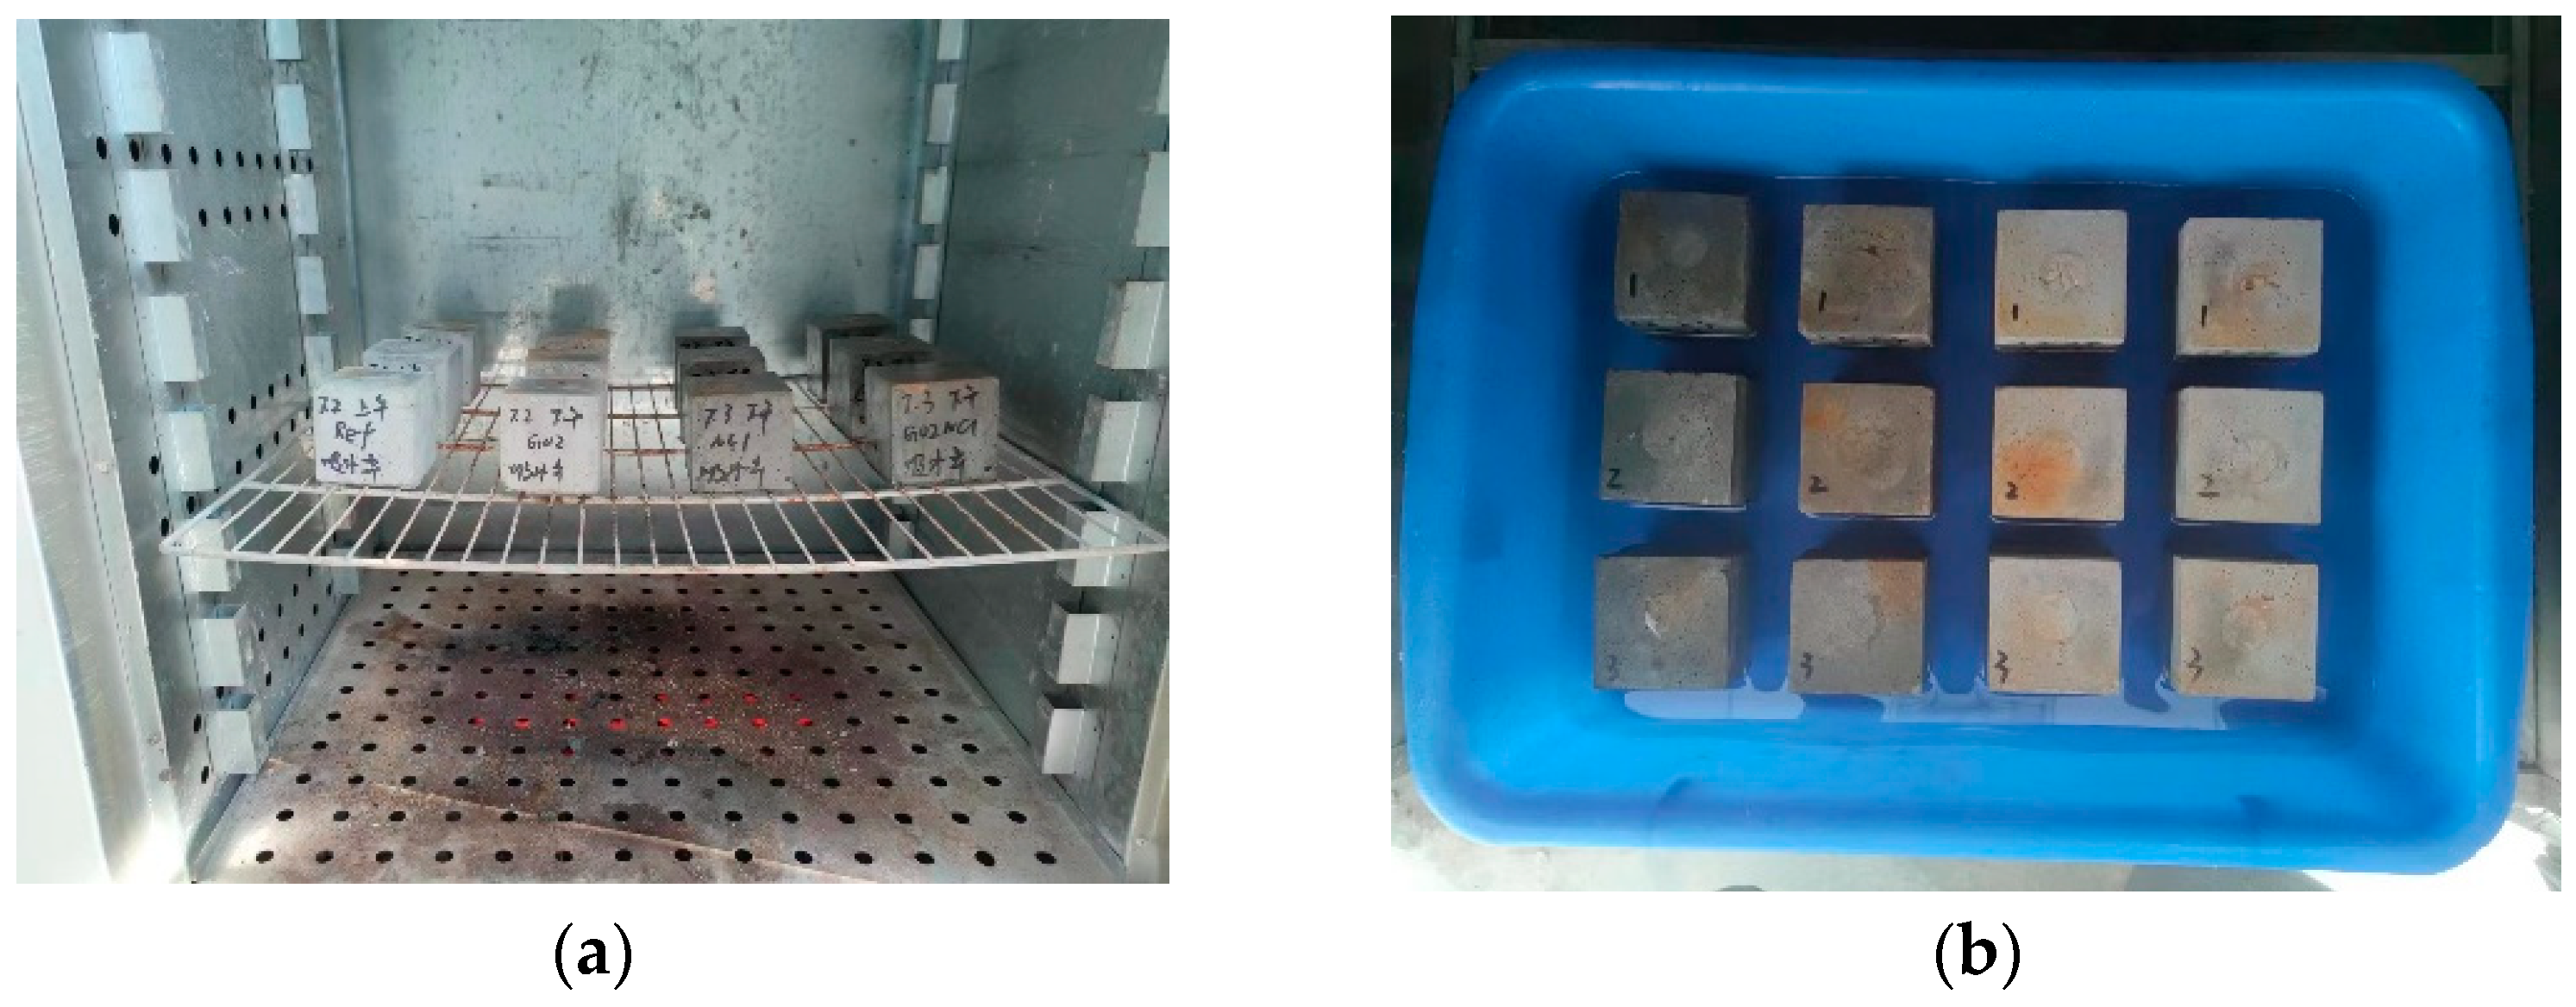
The water absorption test of cement mortar was conducted in accordance with the relevant provisions of the Chinese standard “Standard for Test Method of Basic Properties of Construction Mortar” [31]. The water absorption test specimens were cubes with dimensions of 70.7 mm × 70.7 mm × 70.7 mm, with three specimens per group, as shown in Figure 4.

Figure 4.
Treatment of water absorption test specimens. (a) Drying of cement mortar specimens; (b) Immersion of cement mortar specimens.
- Water penetration resistance test
The water penetration resistance test of cement mortar was conducted in accordance with the relevant provisions of the Chinese standard “Standard for Test Method of Basic Properties of Construction Mortar” [31]. The water penetration resistance specimens were truncated cones with an upper diameter of 70 mm, a lower diameter of 80 mm, and a height of 30 mm, with six specimens in each group.
The water penetration resistance of the cement mortar was calculated according to Formula (1), as follows:
The meaning of the different characters as shown in Appendix A.
- Chloride ion penetration resistance test
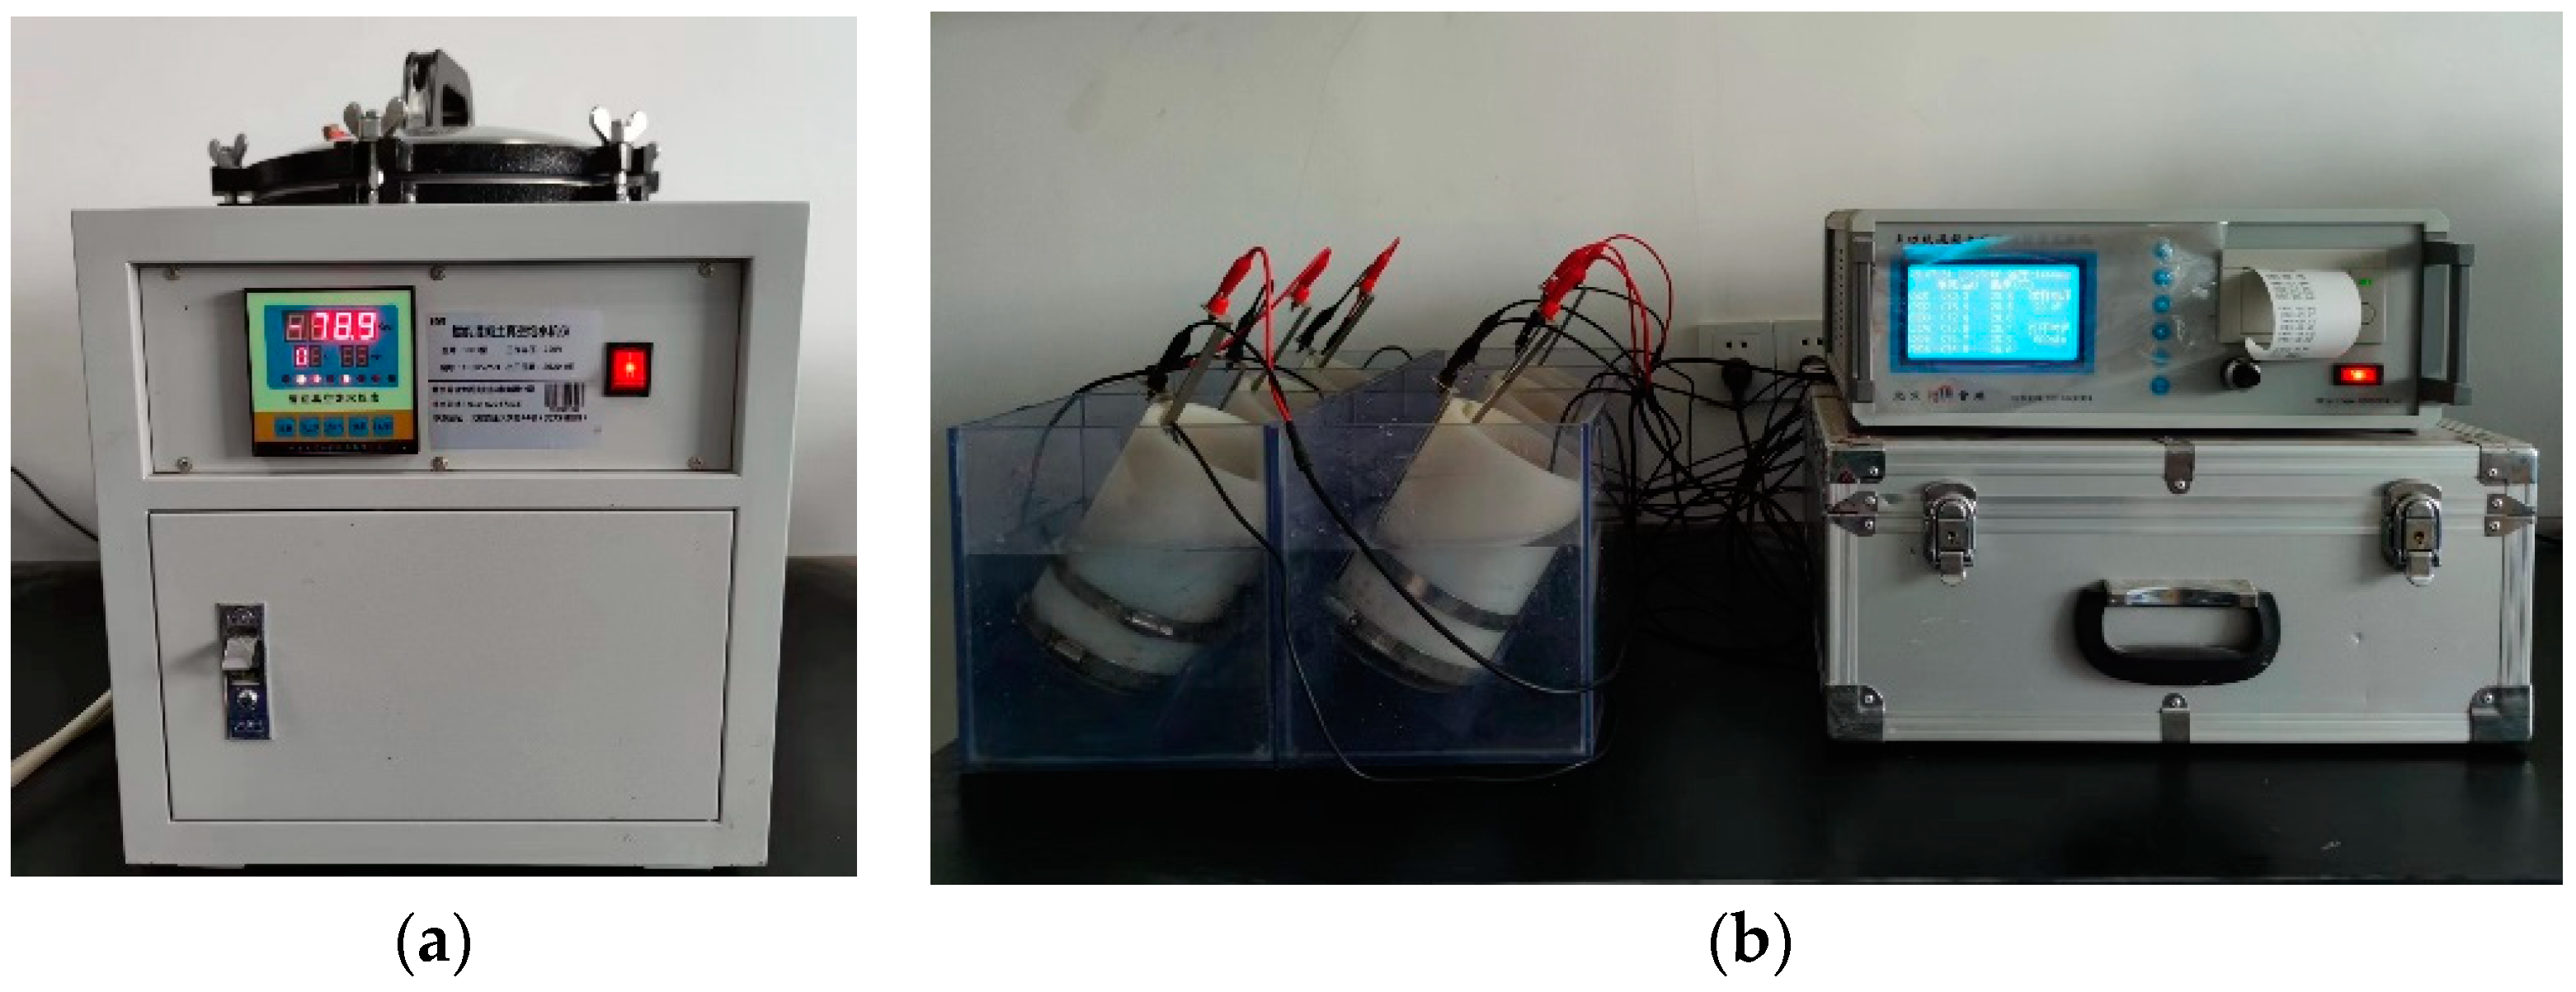
This article employed the rapid chloride migration coefficient method (RCM method), as shown in Figure 5. Prior to the experiment, the specimens should be saturated in a vacuum saturation machine for 1 day. After saturation, the specimens were installed in the RCM test device with the anode plate installed. After the test, the final temperature and final current of the anode solution were measured. The specimens were taken out of the rubber sleeve and its surface debris and moisture were wiped off. The specimens were split into two semicylinders along the axial direction using a press and then immediately sprayed with a 0.1 mol/L AgNO3 solution on the fracture surface. After 15 min, the penetration contour line was marked with a waterproof pen and divided into 10 equal parts. The 10 penetration depth values were then measured and averaged.

Figure 5.
Apparatus for the chloride ion penetration resistance test of cement mortar. (a) Vacuum saturation apparatus; (b) RCM testing instrument.
The arithmetic mean of the measurements of three specimens was taken as the chloride ion migration coefficient of the specimen group, with an accuracy of 0.1 × 10⁻¹² m2/s.
The meaning of the different characters as shown in Appendix A.
- Sulfate corrosion resistance test
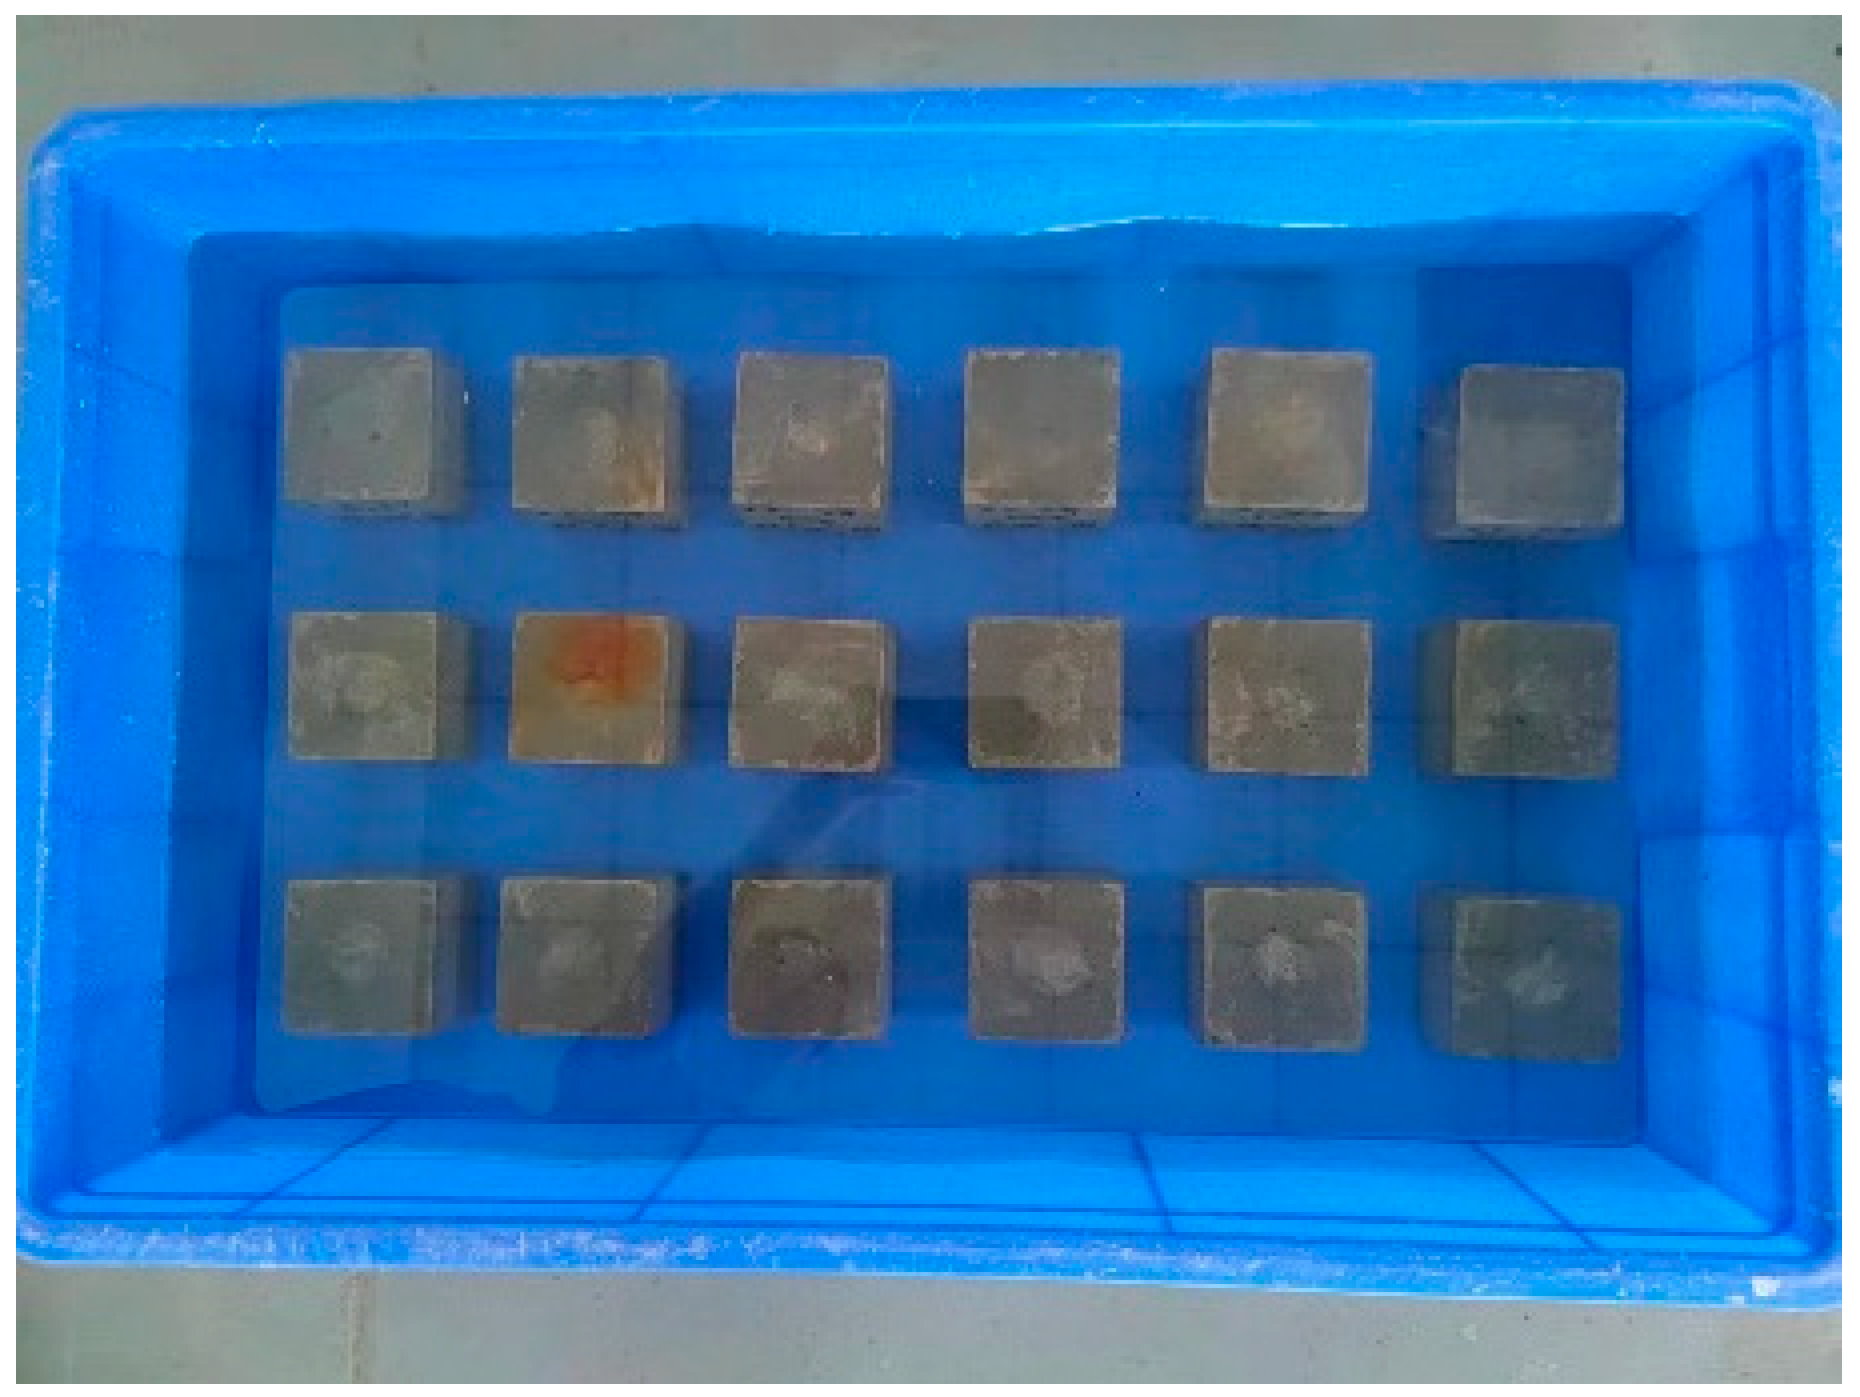
The specimens for the sulfate corrosion resistance test of cement mortar were cubes with dimensions of 70.7 mm × 70.7 mm × 70.7 mm, with three specimens per group. At 28 days of curing, the specimens were taken out and immersed in a 5% sodium sulfate solution, as shown in Figure 6. The immersion method was employed, with the sodium sulfate solution being replaced every month. The specimens were immersed for 30 days and 60 days and the compressive strength was measured.

Figure 6.
Specimens immersed in sulfate solution.
The corrosion resistance coefficient of the cement mortar was calculated according to Formula (3), as follows:
The arithmetic mean of the measurements of three specimens was taken as the compressive corrosion resistance coefficient of the specimen group.
The meaning of the different characters is shown in Appendix A.
- X-ray diffraction (XRD) phase analysis
The XRD test samples were 10 mm × 10 mm × 10 mm cement paste specimens. The water-to-binder ratio, superplasticizer dosage, nanomaterial dosage, and curing method of the specimens were consistent with those of the cement mortar mechanical performance specimens. After curing for 28 days, the specimens were removed and immersed in anhydrous ethanol to halt hydration. One day prior to the experiment, the specimens were taken out, dried, and ground to obtain powder samples with particle size ≤ 75 μm. The powder samples were scanned using an X-ray diffractometer with a scanning angle range of 5~80°.
- Scanning Electron Microscope (SEM) microstructure analysis
The SEM test samples were treated the same as those of XRD phase analysis but, after the specimens were taken out, they needed to be cut into 10 mm × 10 mm × 2 mm samples and subjected to gold coating. Subsequently, the samples were scanned using a scanning electron microscope for analysis.
- Mercury Intrusion Porosimetry (MIP) pore size distribution
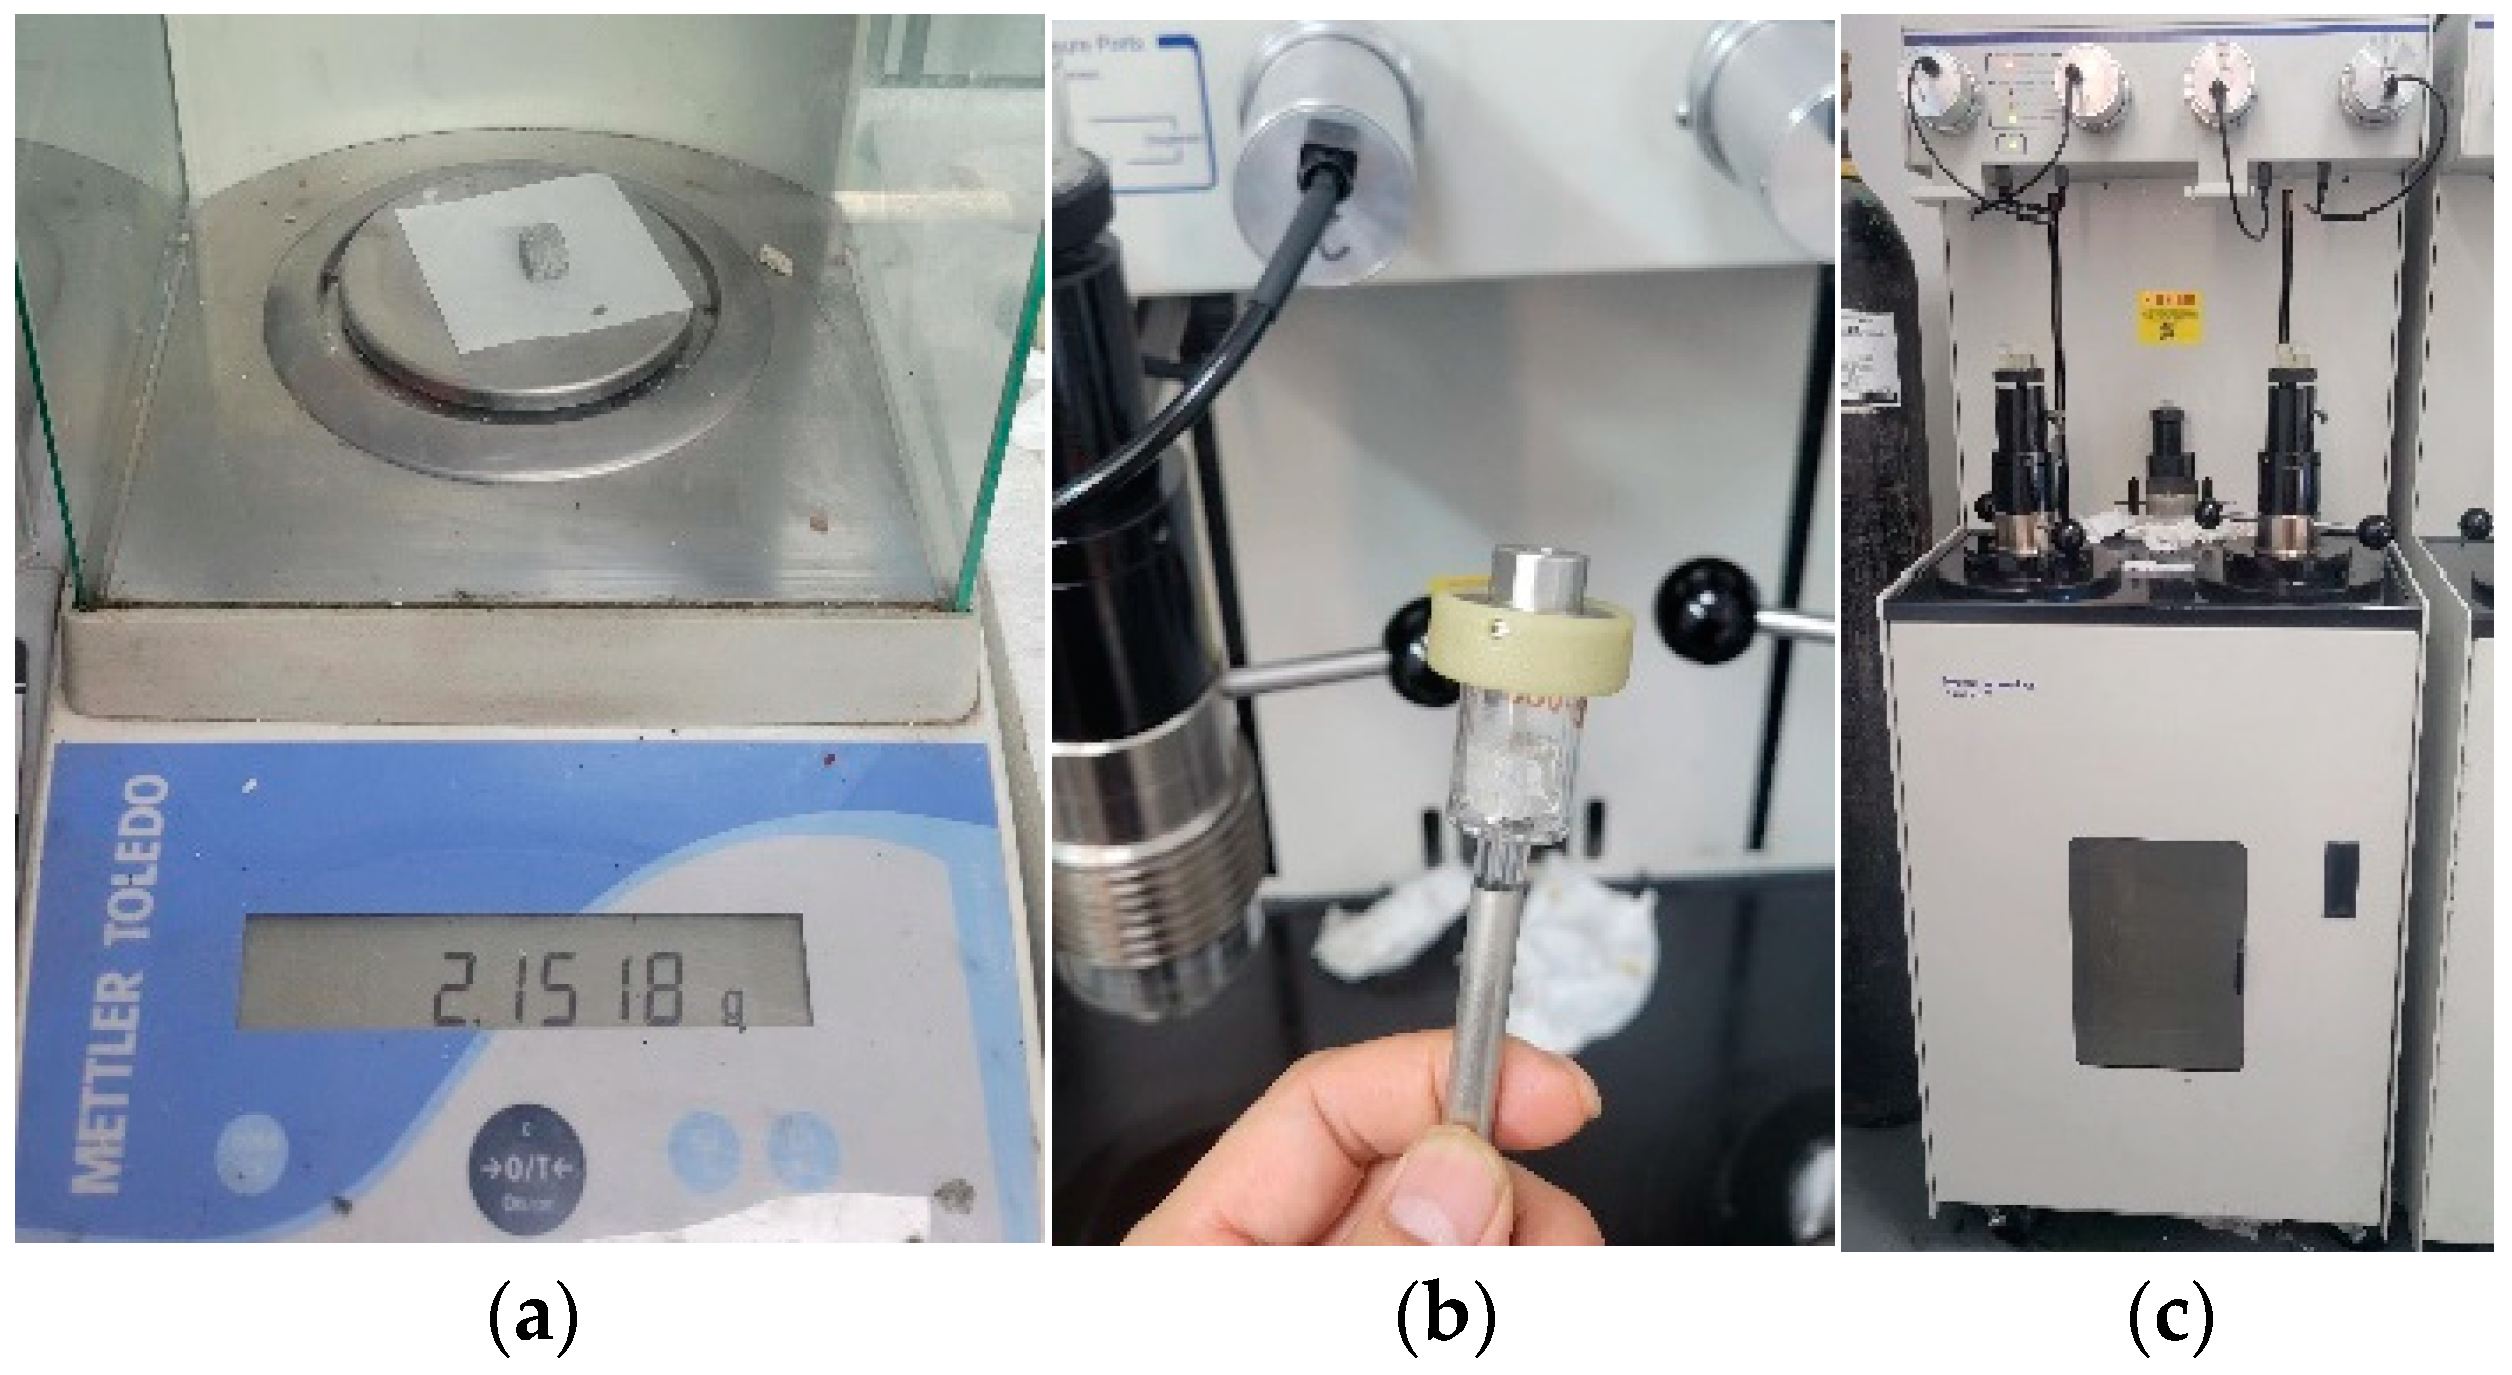
The MIP test samples were cement mortar specimens with dimensions of 10 mm × 10 mm × 10 mm. After curing for 28 days, the specimens were removed and immersed in anhydrous ethanol to halt hydration. One day prior to the experiment, the specimens were taken out, dried, and tested using a mercury porosimeter, as shown in Figure 7.
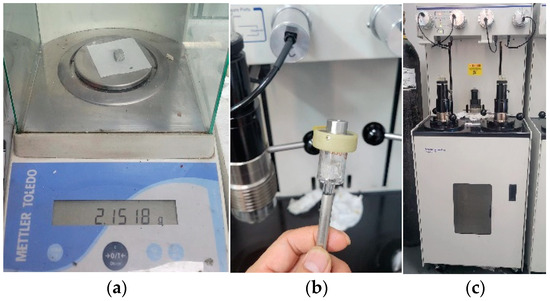
Figure 7.
MIP pore size distribution test. (a) Test samples; (b) Mercury intrusion test; (c) Mercury porosimeter.
3. Experimental Results and Discussion
3.1. Mechanical Properties
Through the mechanical performance testing of 16 sets of specimens, including flexural strength and compressive strength tests, the optimal mix proportion was determined. The mix proportion with the highest strength when incorporating NC or GO individually was identified and the mix proportion with the best performance when combining both was selected. This preparation was performed to investigate the Microscopic mechanisms of cement mortar influenced by NC and GO in subsequent research.
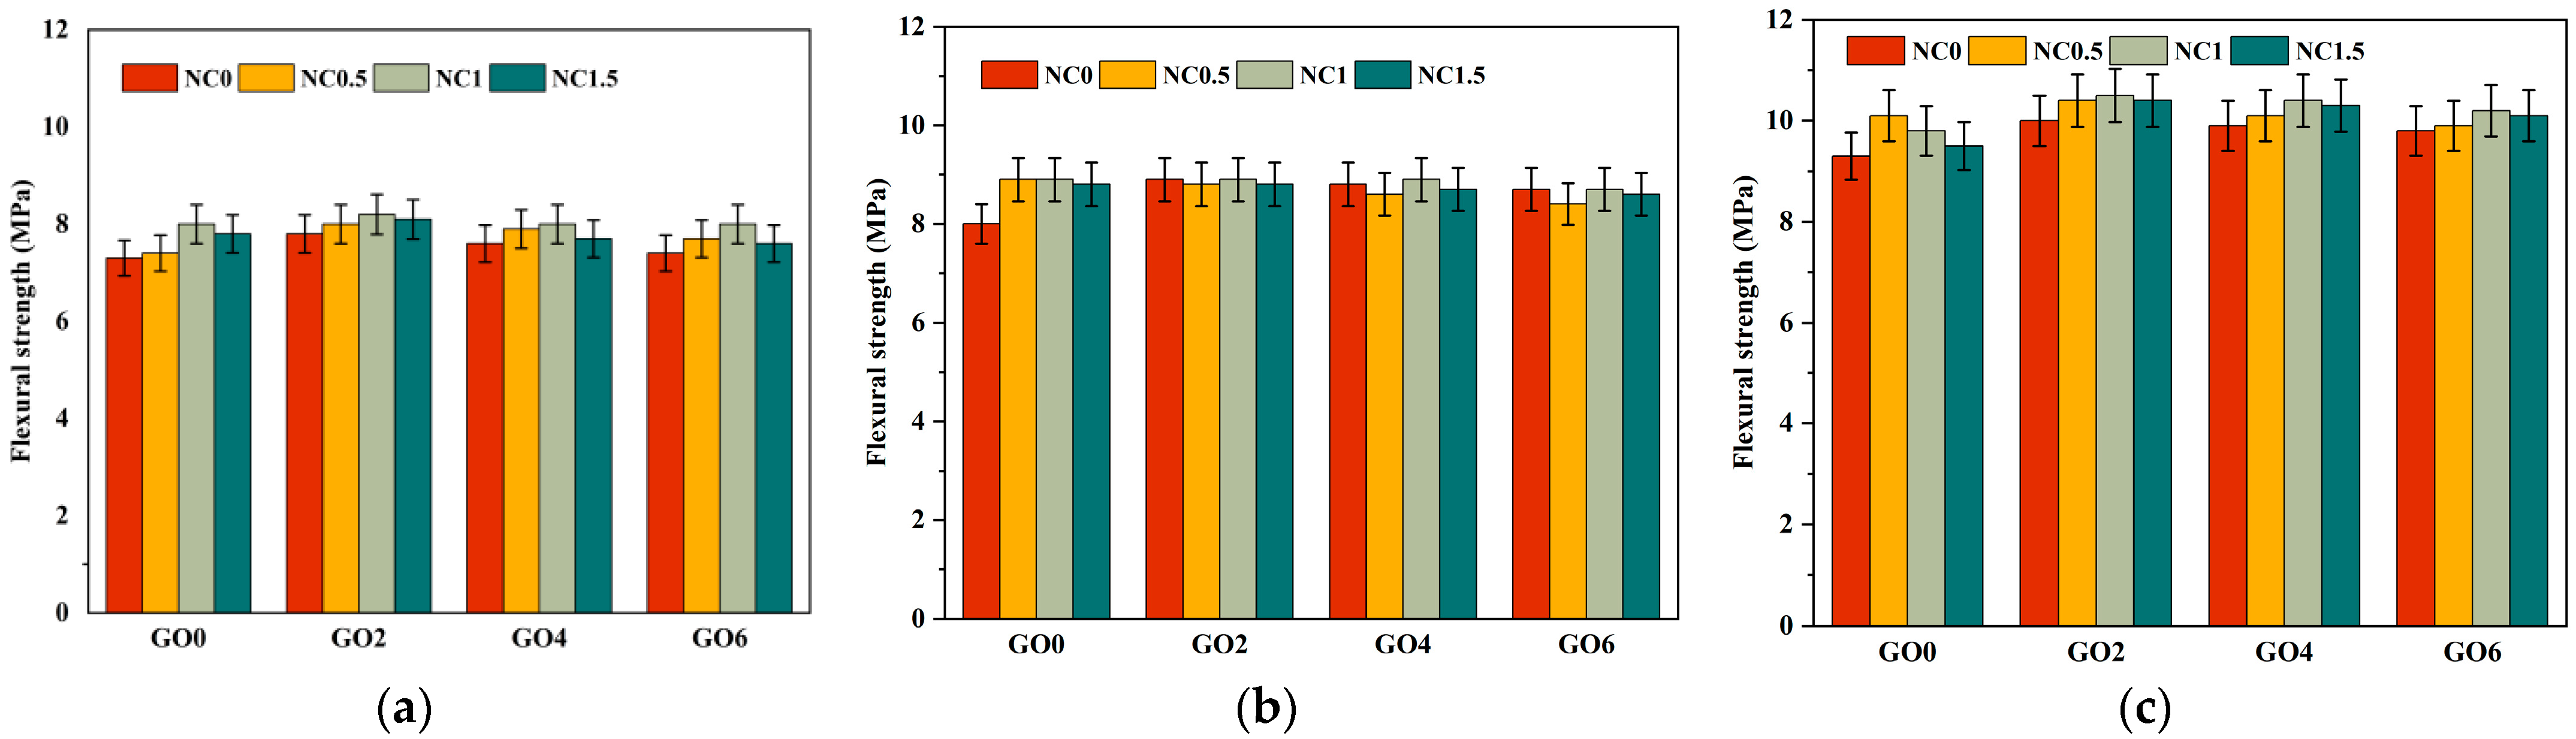
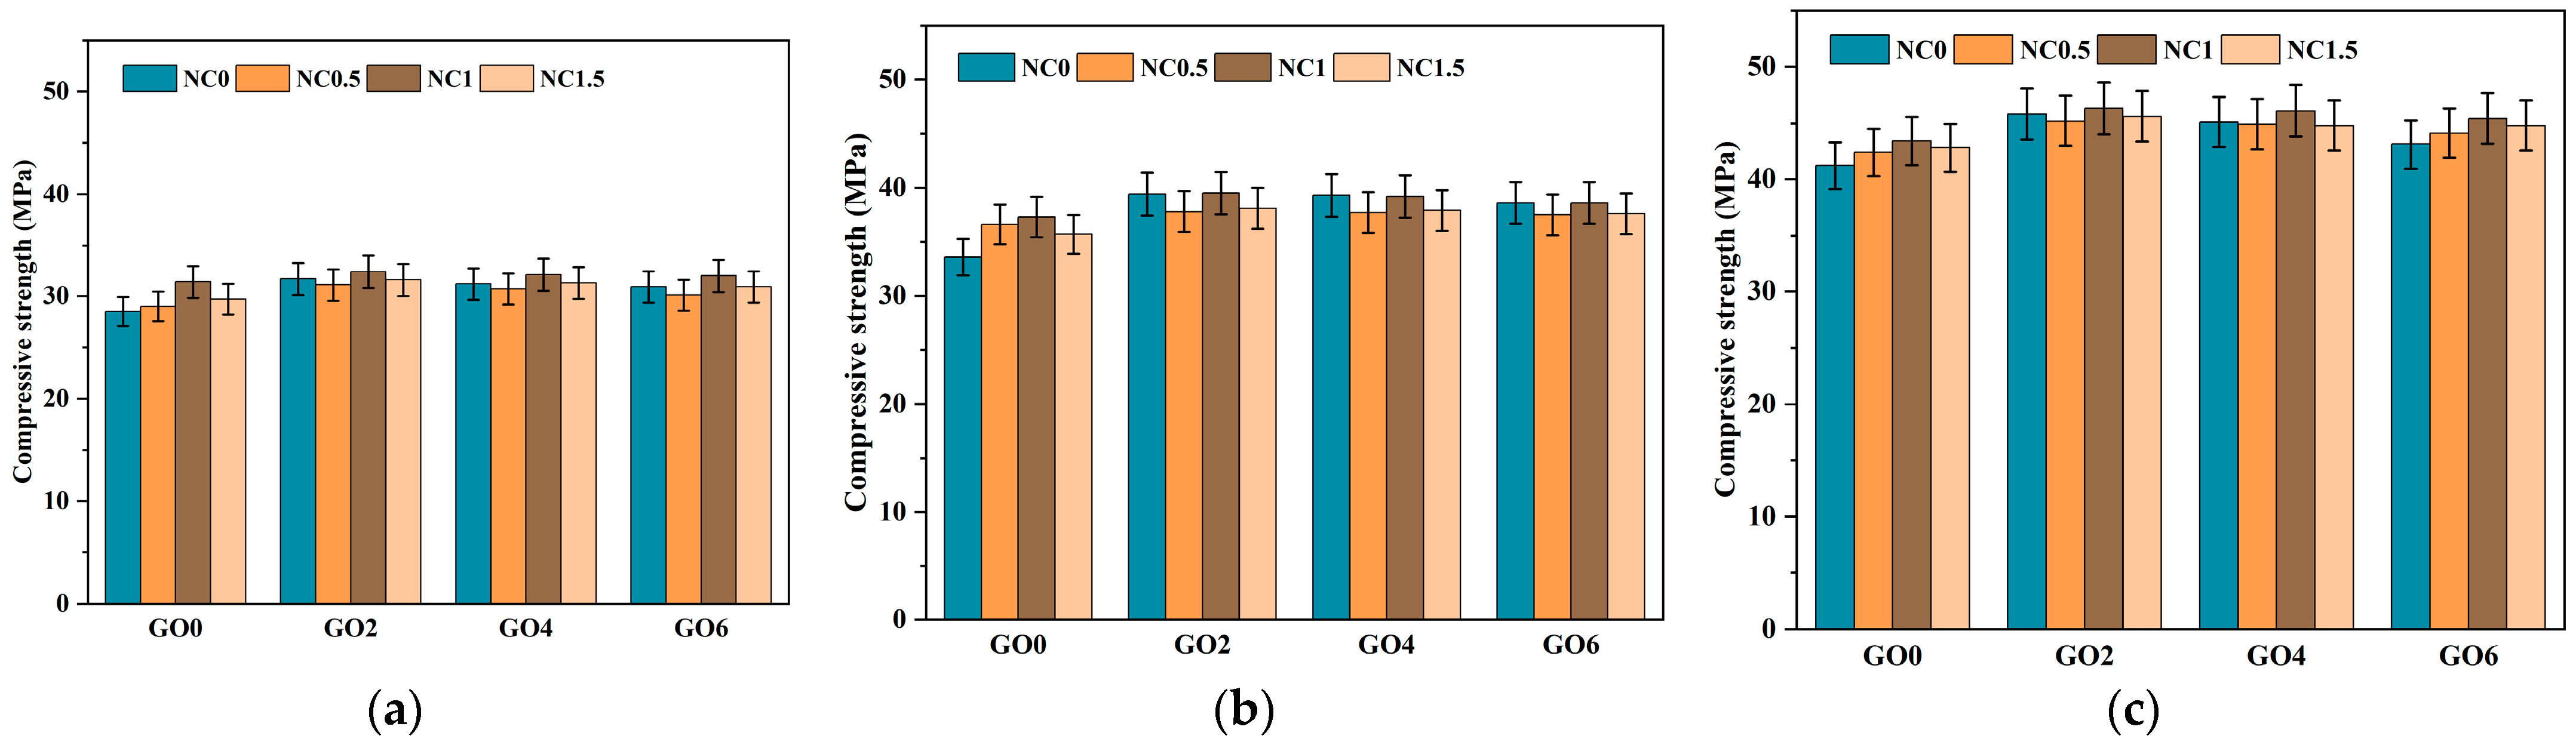
As shown in Figure 8 and Figure 9, we analyzed from three aspects. The first aspect was the effect of individual addition of GO (GO2NC0, GO4NC0, and GO6NC0) on the flexural strength of cement mortar at different ages. As the GO content increased, the flexural strength gradually decreased. When the GO content was 0.02 wt% (GO2NC0 group), the flexural strength of cement mortar at 3 days, 7 days, and 28 days reached its maximum values, which were 7.8 MPa, 8.9 MPa, and 10 MPa, respectively. Compared to the Ref group, these values showed an improvement of 6.9%, 11.3%, and 7.5%, respectively. Similarly, in the compressive strength test, when the GO content was 0.02%, the compressive strength of cement mortar at 3 days, 7 days, and 28 days reached its maximum values, which were 31.7 MPa, 39.4 MPa, and 45.8 MPa, respectively. Compared to the Ref group, these values showed an improvement of 11.2%, 17.3%, and 11.2%, respectively. The 11.2% increase in 28 days compressive strength with 0.02 wt% GO outperformed the results of Honsan et al. [27] who reported a 10.9% increase in 28 days compressive strength with 0.03 wt% GO. This is slightly different from the research of Qureshi et al. [32], who determined the optimal GO content to be above 0.04 wt%, while the optimal content in this study was 0.02 wt%, resulting in a lower cost.
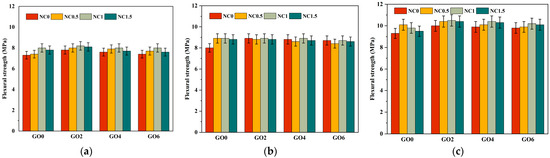
Figure 8.
Development trend of flexural strength in cement mortar. (a) The 3d flexural strength; (b) The 7d flexural strength; (c) The 28d flexural strength.

Figure 9.
Development trend of compressive strength in cement mortar. (a) The 3d compressive strength; (b) The 7d compressive strength; (c) The 28d compressive strength.
The second aspect was the effect of individual addition of NC (GO0NC0.5, GO0NC1, and GO0NC1.5) on the flexural strength and compressive strength of cement mortar. As the NC content increased, the flexural strength and compressive strength initially increased and then decreased. When the NC content was 1 wt% (GO0NC1 group), the flexural strength of cement mortar at 3 days reached its maximum value of 8 MPa, showing an improvement of 9.6% compared to the Ref group. When the NC content was 0.5 wt% and 1 wt%, the flexural strength of cement mortar at 7 days reached its peak value of 8.9 MPa, with an improvement of 11.3% compared to the Ref group. At an NC content of 0.5 wt%, the flexural strength of cement mortar at 28 days reached its maximum value of 10.1 MPa, with an improvement of 8.6% compared to the Ref group. In terms of compressive strength, the results were more consistent. When the NC content was 1 wt%, the compressive strength of cement mortar at all three ages reached its maximum value, with values of 31.4 MPa, 37.3 MPa, and 43.4 MPa, respectively, showing improvements of 10.2%, 11.0%, and 5.3% compared to the Ref group. This is consistent with the research of Liu et al. [19] and Poudyal et al. [22,23], whose studies also demonstrated that 1 wt% NC is the optimal doping amount.
The third aspect was the combined addition of GO and NC. Overall, the mechanical performance followed a trend of initial increase and subsequent decrease as the content of GO and NC increased, with the GO2NC1 group showing the most noticeable improvement. When the GO content was 0.02 wt% and the NC content was 1 wt% (GO2NC1 group), the flexural strength of specimens at 3 days, 7 days, and 28 days reached their maximum values, with values of 8.2 MPa, 8.9 MPa, and 10.5 MPa, respectively. Compared to the Ref group, these values showed improvements of 12.3%, 11.3%, and 12.9%, respectively. As shown in Figure 8 and Figure 9, the addition of GO and NC significantly enhanced the flexural strength and compressive strength of the cement mortar at different curing ages. This strengthening effect is particularly prominent in the early curing stages (3d and 7d), highlighting the positive role of nanomaterials in accelerating the hardening process of cement mortar. For the GO2NC1 group, the compressive strength of cement mortar at 3 days, 7 days, and 28 days reached its maximum values, with values of 32.4 MPa, 39.5 MPa, and 46.3 MPa, respectively, showing improvements of 13.7%, 17.6%, and 12.4% compared to the Ref group.
Combining Figure 8 and Figure 9, it could be observed that the mechanical enhancement effect of the composite GO and NC group was generally higher than that of the single GO group and the NC group. In addition, the optimal GO dosage for the flexural strength of cement mortar in the single GO group was 0.02 wt%, the optimal NC dosage for the flexural strength of cement mortar in the single NC group was 1 wt%, and the optimal GO dosage and NC dosage for the flexural strength of cement mortar in the composite GO and NC group were 0.02 wt% and 1 wt%, respectively.
Therefore, four combinations with remarkable performance were selected for subsequent related tests: the GO0NC0 group (Ref group), GO0NC1 group (1 wt% NC content), GO2NC0 group (0.02 wt% GO content), and GO2NC1 group (0.02 wt% GO and 1 wt% NC content), as shown in Table 7.
Table 7.
Proportioning of cement mortar.
3.2. Durability Performance
3.2.1. Water Absorption Test
As shown in Figure 10, the addition of GO and NC significantly reduced the water absorption of cement mortar. The water absorption of the Ref group was 4%, while the GO2NC0 group exhibited a water absorption of 3.17%, representing a decrease of 20.8% compared to the Ref group. The GO0NC1 group showed a water absorption of 3.31%, reflecting a decrease of 17.3% compared to the Ref group. The GO2NC1 group exhibited a water absorption of 3.06%, indicating a decrease of 23.5% compared to the Ref group. It can be seen that the combined addition of GO and NC yielded better results compared to the GO2NC0 and GO0NC1 groups. Specifically, the relative reduction rate of water absorption in the GO0NC1 group was 2.75% higher than that of the GO2NC0 group and 6.3% higher than that of the GO0NC1 group.
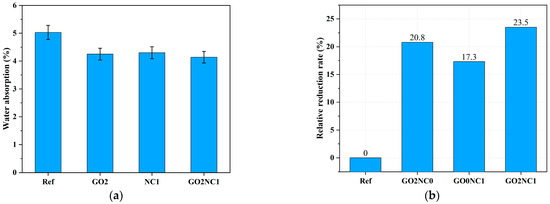
Figure 10.
Development of water absorption in cement mortar. (a) Water absorption; (b) Relative reduction rate.
3.2.2. Water Penetration Resistance Test
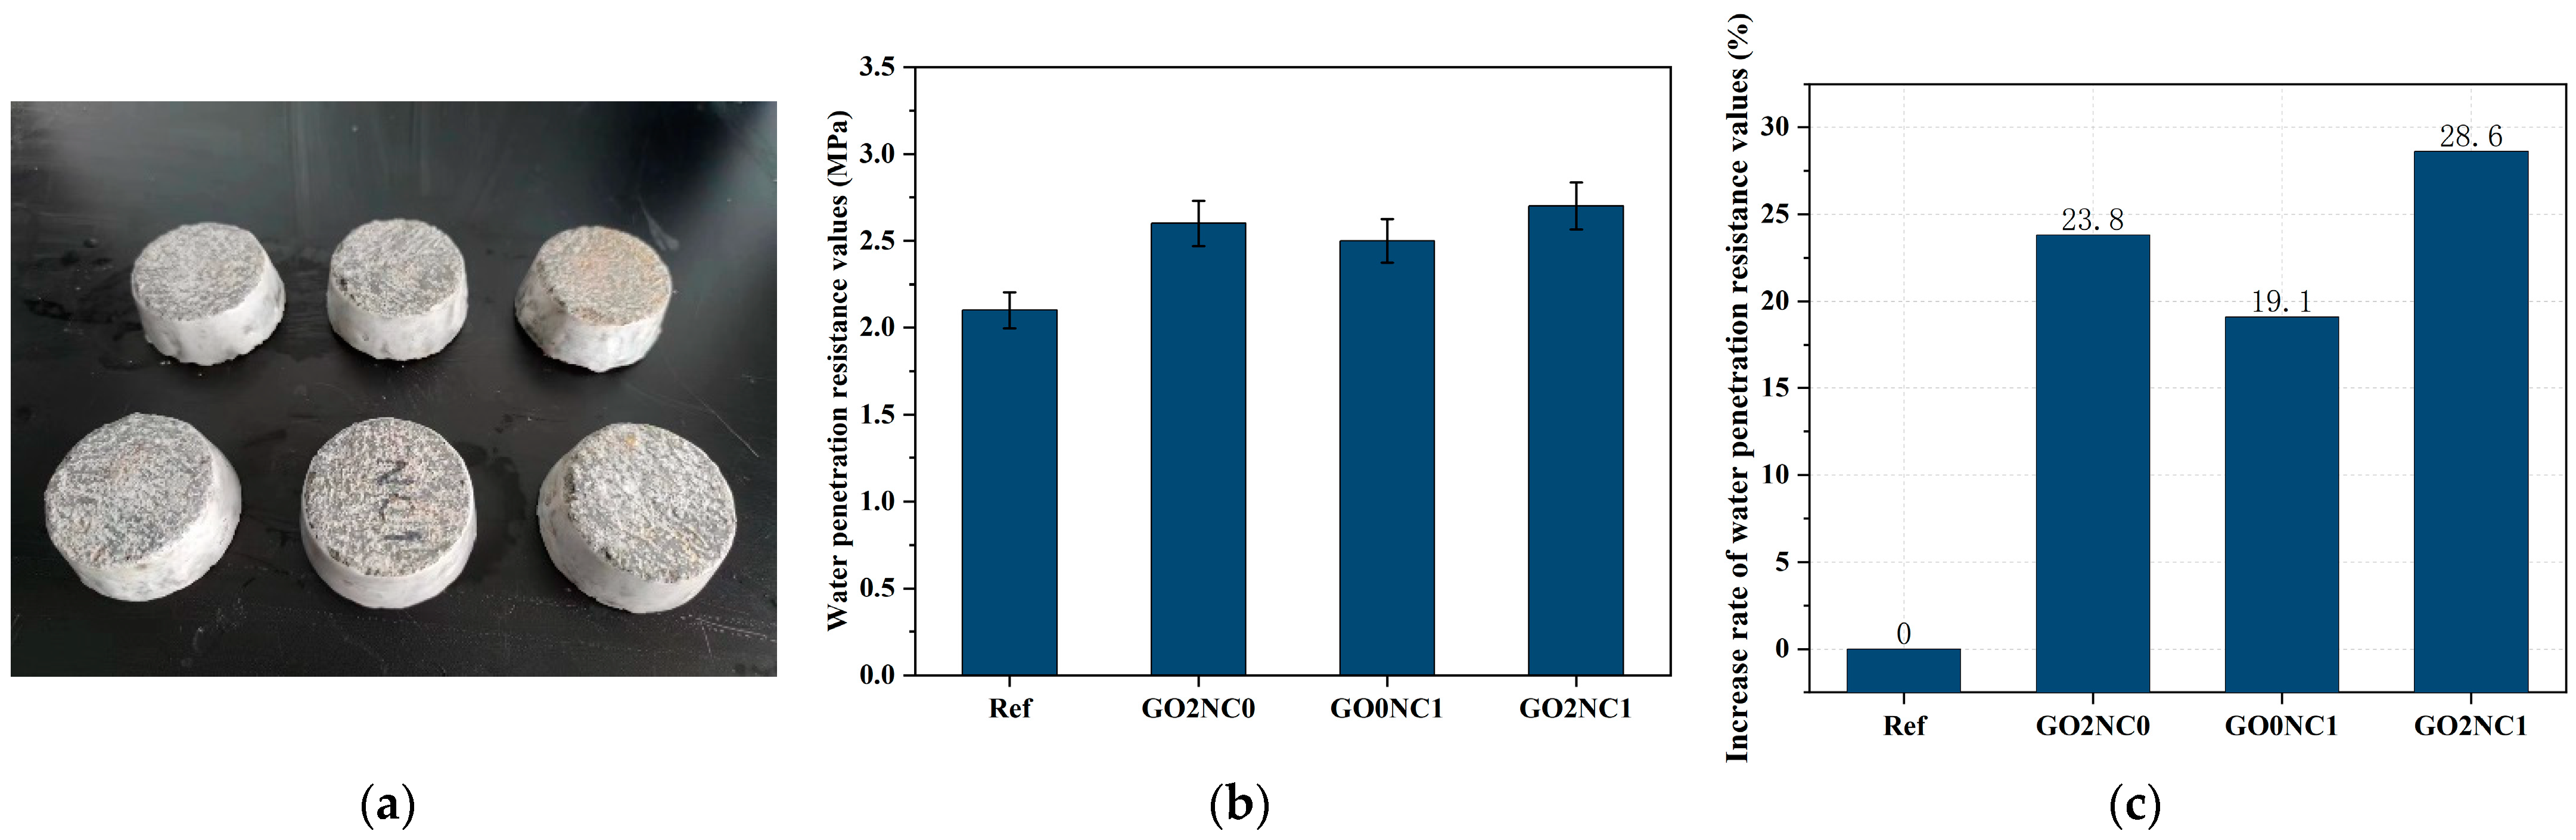
As shown in Figure 11, the addition of GO and NC significantly enhanced the water penetration resistance of cement mortar. The water penetration resistance value of the Ref group was 2.1 MPa, while the GO2NC0 group demonstrated a water penetration resistance value of 2.6 MPa. Compared to the Ref group, the GO2NC0 group increased by 23.8%. The increased rate of the GO0NC1 group was 19.1%. The GO2NC1 group had the largest rate increase of 28.6%. It can be observed that the combined addition of GO and NC yielded better results compared to the GO2NC0 and GO0NC1 groups. Specifically, the increased rate of water penetration resistance values in the GO2NC1 group was 4.8% higher than that of the GO2NC0 group and 9.5% higher than that of the GO0NC1 group.

Figure 11.
Development of cement mortar water penetration resistance. (a) Sealed specimens; (b) Water penetration resistance values; (c) Increased rate of water penetration resistance values.
3.2.3. Chloride Ion Penetration Resistance Test
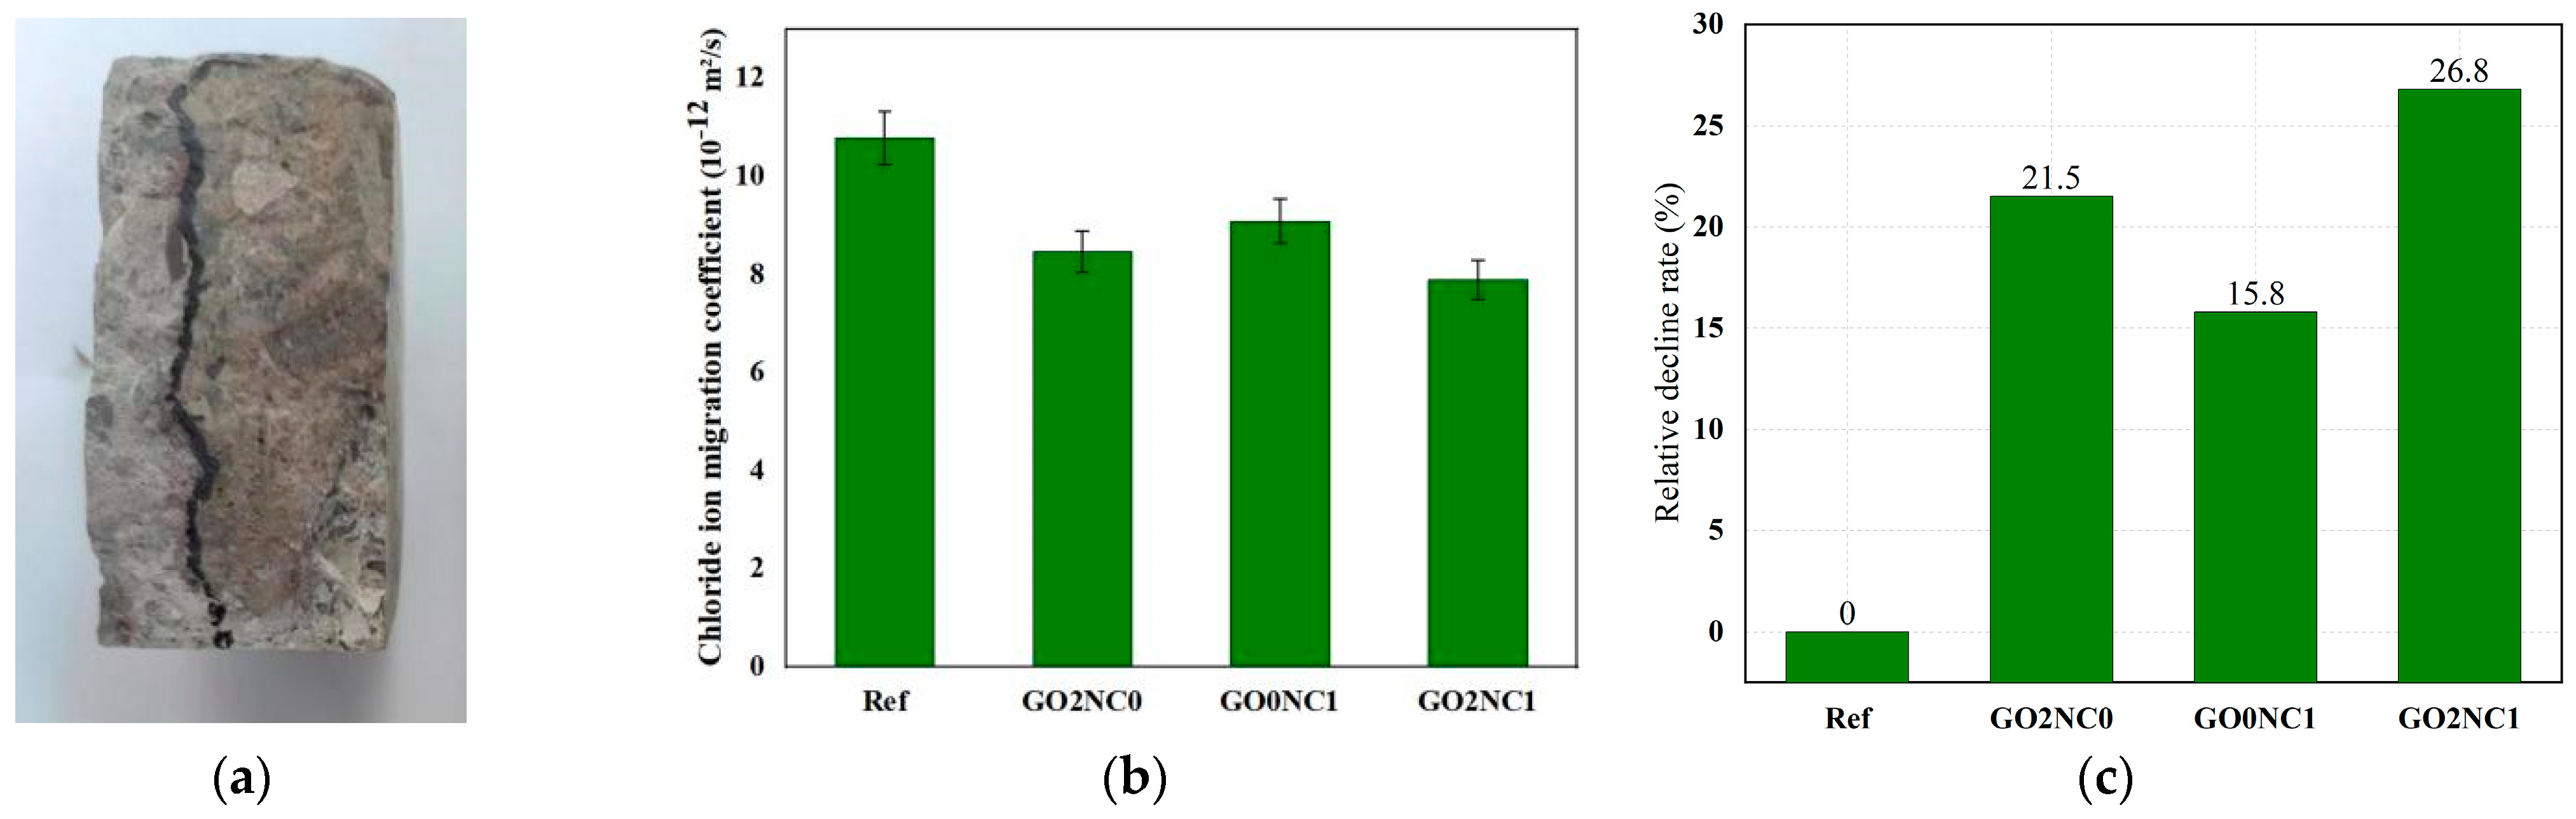
As shown in Figure 12, the addition of GO and NC significantly enhanced the chloride ion penetration resistance of cement mortar. The chloride ion migration coefficient of the Ref group was 10.78 × 10⁻¹² m2/s, while the GO2NC0 group demonstrated a chloride ion migration coefficient of 8.46 × 10⁻¹² m2/s. Compared to the Ref group, the GO2NC0 group decreased by 21.5%. The GO0NC1 group exhibited a chloride ion migration coefficient of 9.08 × 10⁻¹² m2/s, reflecting a decrease of 15.8% compared to the Ref group, which validated the experimental findings of Chen et al. [28]. The GO2NC1 group showed a chloride ion migration coefficient of 7.89 × 10⁻¹² m2/s, indicative of a decrease of 26.8% compared to the Ref group. It can be observed that the combined addition of GO and NC yielded better results compared to the GO2NC0 and GO0NC1 groups. Specifically, the relative reduction rate of the chloride ion migration coefficient in the GO2NC1 group was 5.3% higher than that of the GO2NC0 group and 11.04% higher than that of the GO0NC1 group.

Figure 12.
Development of chloride ion penetration resistance in cement mortar. (a) Spraying of AgNO3 solution on specimens; (b) Chloride ion migration coefficient; (c) Relative decline rate.
As chloride ion penetration was similar to water penetration, it permeated through the pores or gaps within the matrix and reacted with the chemical components of the cement mortar, leading to a reduction in its strength. Therefore, the improved chloride ion penetration resistance of cement mortar with the addition of GO and NC could be attributed to similar factors as in the water penetration resistance test. Both GO and NC promoted the hydration reaction of cement and their filling effects refined the pore structure of the hydration products. The effects enhanced the Specimens’ compactness and made it more difficult for chloride ions to penetrate into the cement matrix. As a result, the resistance to chloride ion penetration of the cement mortar increased. This theoretical explanation is applicable to the mechanism analysis of both the water absorption test and the water penetration resistance test.
Additionally, GO acted as a template for hydration products, regulating their morphology and making them more regular and dense, thereby enhancing the durability of cement mortar. This explained why the durability performance of the GO2NC0 group was better than that of the GO0NC1 group.
3.2.4. Sulfate Corrosion Resistance Test
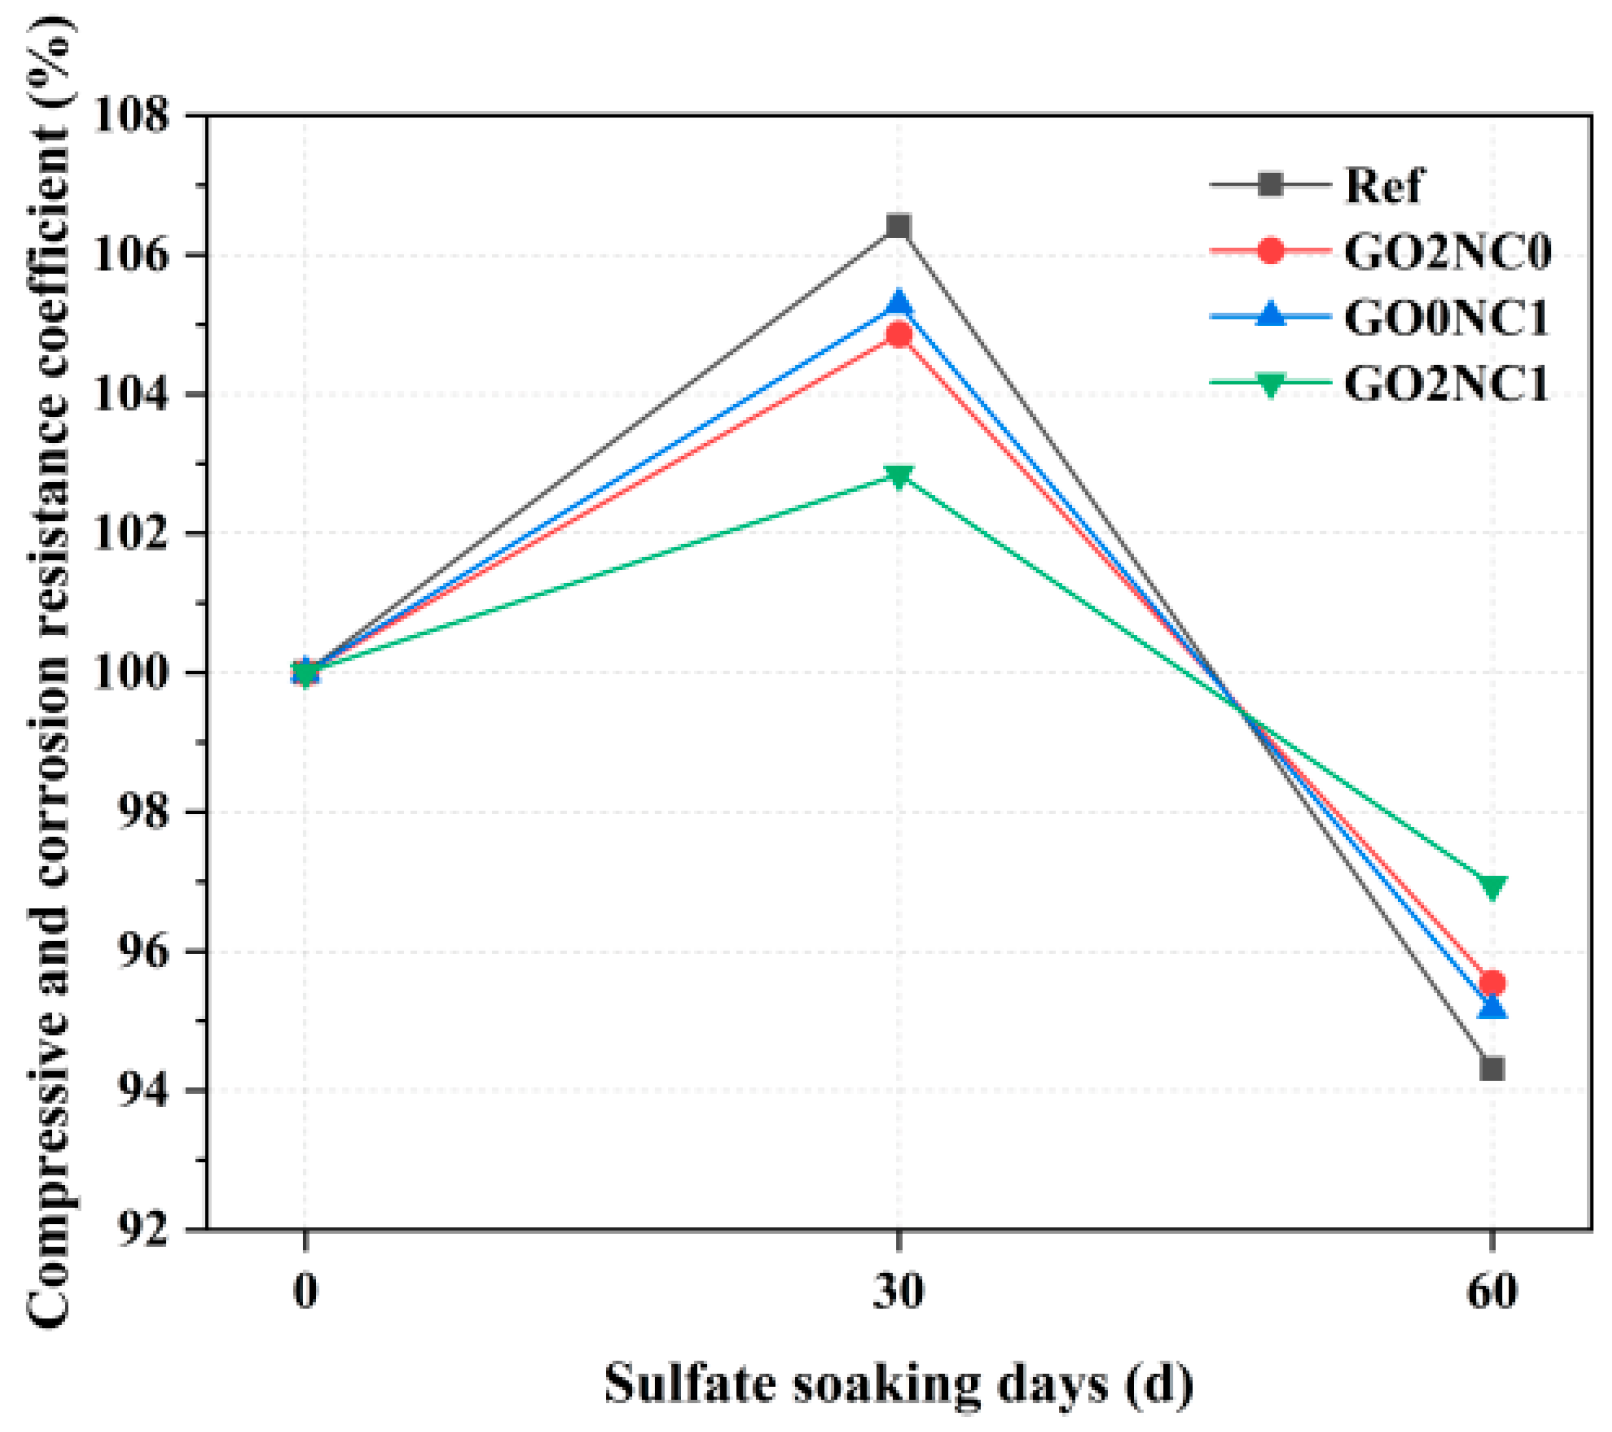
As shown in Figure 13, the compressive corrosion resistance coefficient of cement mortar showed an initial increase followed by a decrease as the number of days of sulfate immersion increased. Within the immersion period of 0–30 days, the compressive corrosion resistance coefficients of all groups gradually increased. Among them, the Ref group exhibited the highest compressive corrosion resistance coefficient at 30 days, reaching 106.4%. This was because the Ref group had a higher porosity. During the early stages of sulfate erosion, SO42− ions penetrated through the pores into the interior of the specimens and reacted with easily corroded minerals such as Ca(OH)2 in the hydration products, forming ettringite (AFt, Ca3Al2(SO4)3(OH)12·26H2O). The needle-like ettringite, which had an expanding effect, filled the pores in the hydration products, thereby increasing the compactness of the hydration products and ultimately enhancing the corrosion resistance of the specimens. However, the GO2NC1 group exhibited the lowest compressive corrosion resistance coefficient at 30 days, reaching 102.9%. The GO2NC0 and GO0NC1 groups exhibited compressive corrosion resistance coefficients between the Ref group and the GO2NC1 group. This was because the addition of GO and NC refined the pore structure of the hydration products through the filling effect, enhancing its compactness. Additionally, although GO and NC filled the pores through the filling effect, there were still some remaining pores in the hydration products. As a result, a small amount of SO42− infiltrated into the specimens and reacted with minerals such as Ca(OH)2, resulting in the formation of a small amount of ettringite, thereby leading to a smaller improvement in the compressive corrosion resistance coefficient.
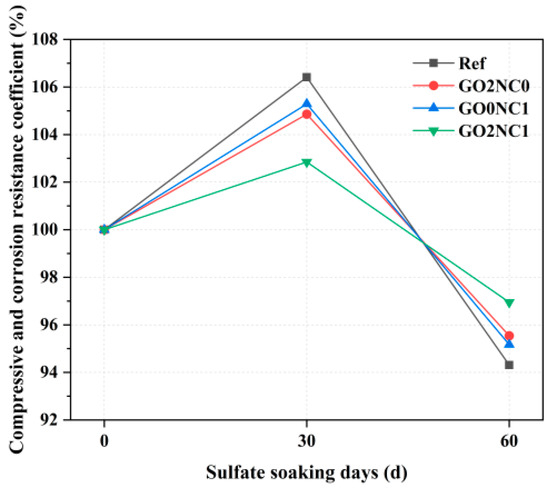
Figure 13.
Compressive corrosion resistance coefficient of cement mortar.
During the immersion period of 30–60 days, the compressive corrosion resistance coefficients of all the groups started to decrease. Among them, the compressive corrosion resistance coefficient of the Ref group decreased the most, reaching 94.3% at 60 days. This was mainly due to the continuous formation of ettringite, which led to the expansion of the filled pores and the formation of more cracks, ultimately resulting in a decrease in strength. The GO2NC1 group exhibited the highest compressive corrosion resistance coefficient at 60 days, reaching 97.0%. The GO2NC0 and GO0NC1 groups exhibited compressive corrosion resistance coefficients between the Ref group and the GO2NC1 group. This was because the filling effect of GO and NC filled the pores, improving the pore structure and compactness inside the hydration products, thereby enhancing the resistance of cement mortar to sulfate erosion.
3.3. Microscopic Characterization
3.3.1. XRD Phase Analysis
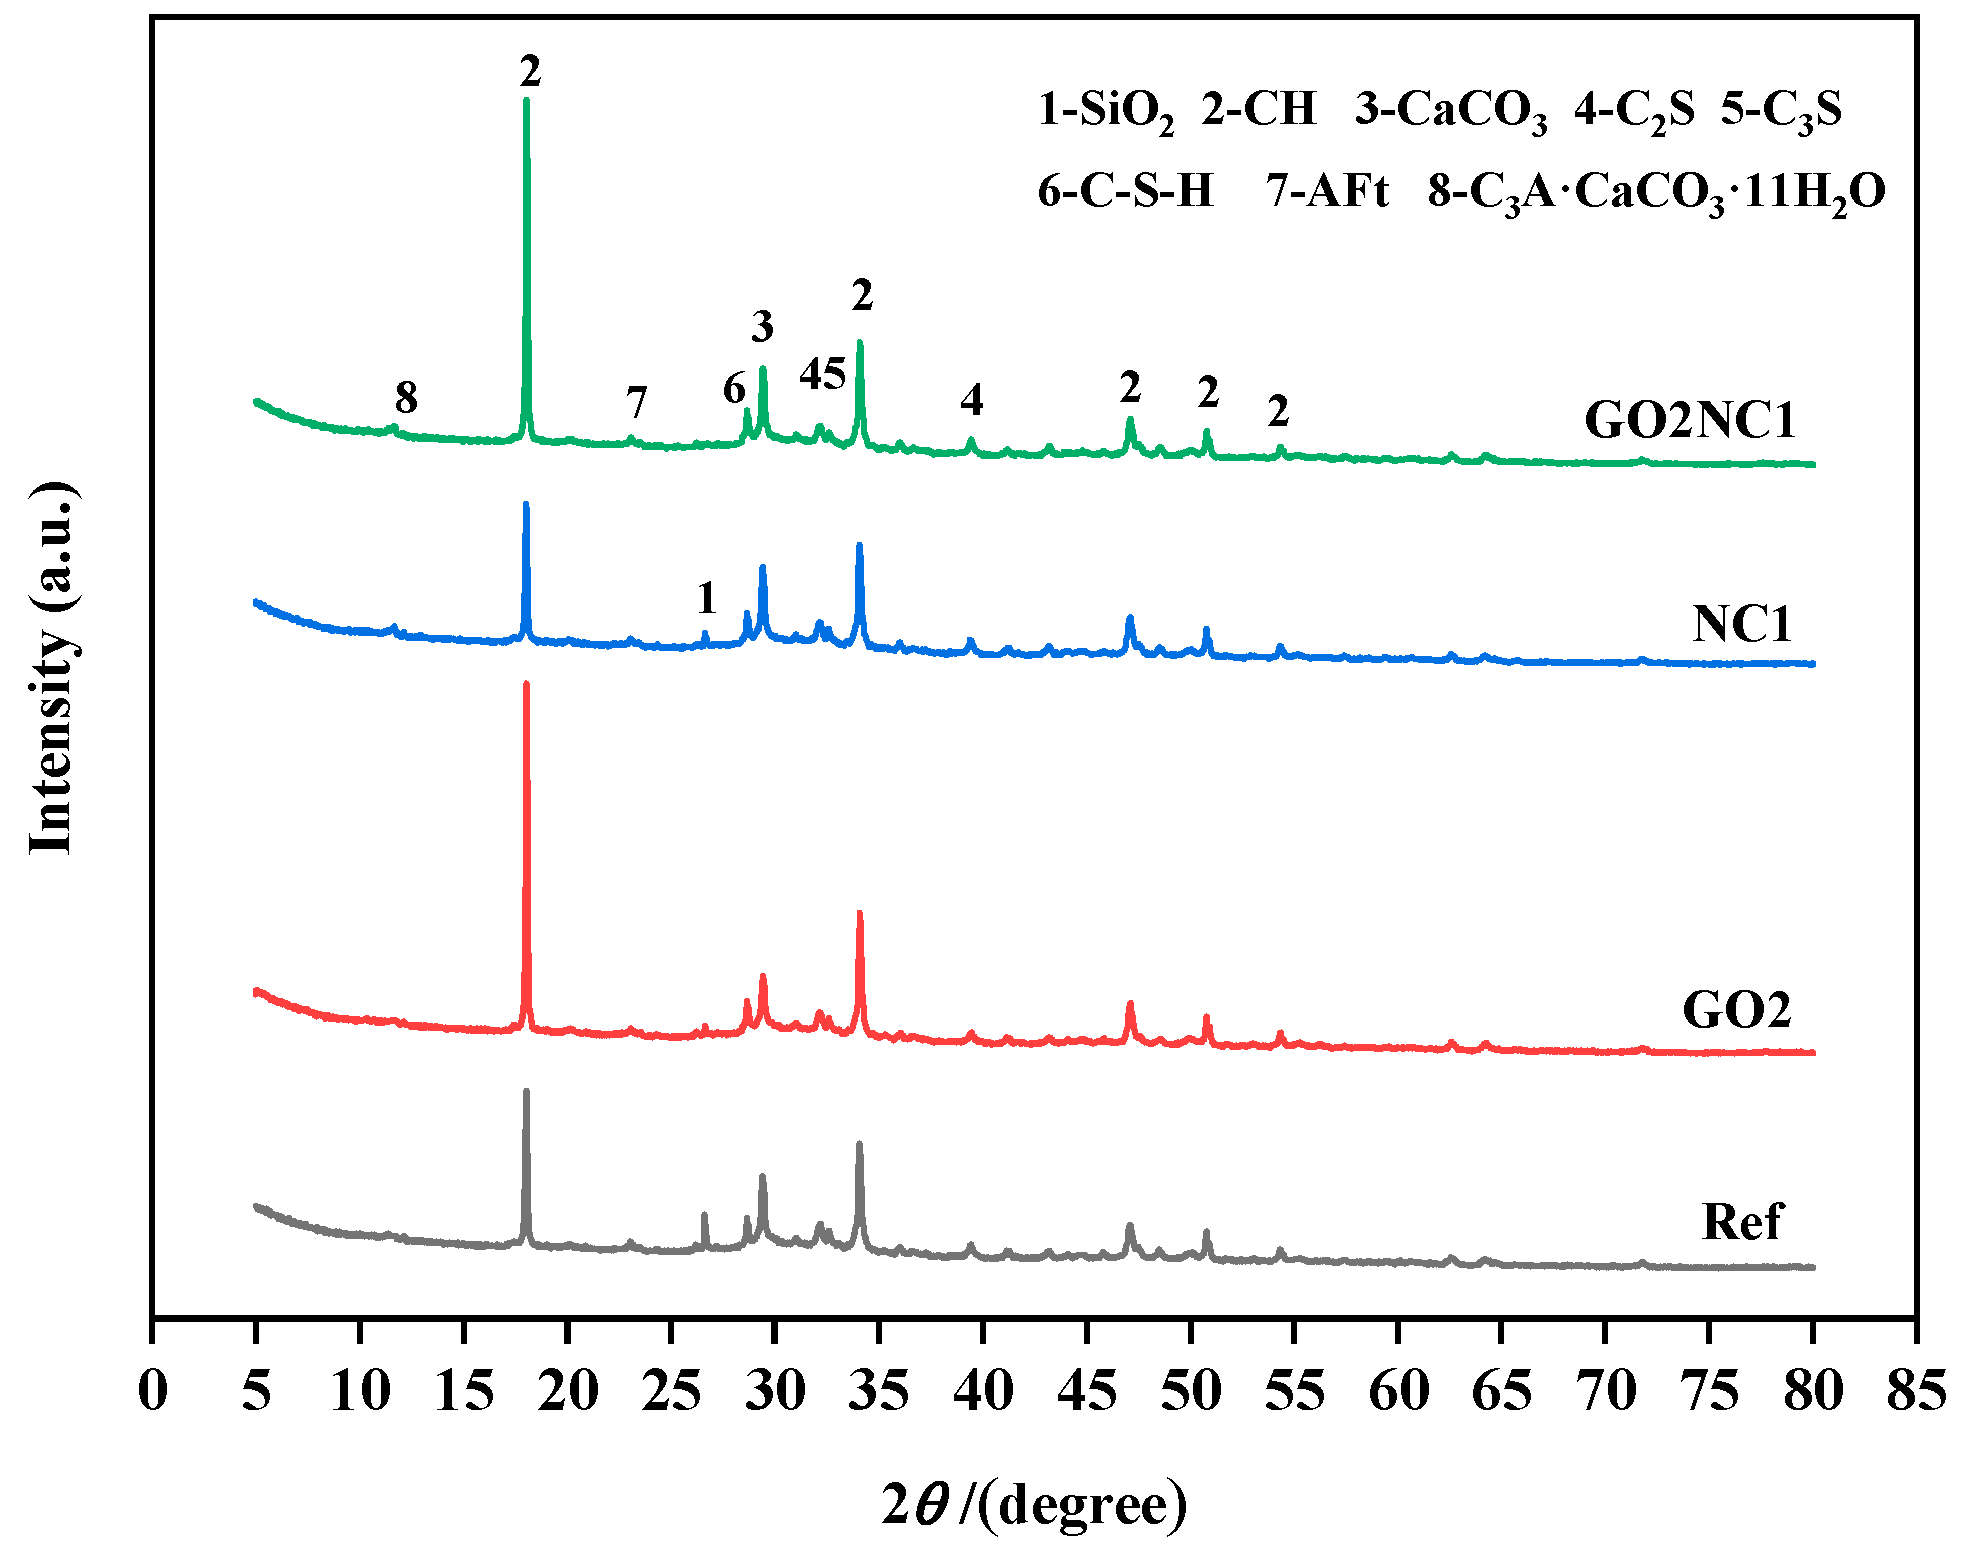
As shown in Figure 14, the main components identified in the samples of all groups included calcium hydroxide (CH), silica (SiO2), calcium carbonate (CaCO3), dicalcium silicate (C2S), tricalcium silicate (C3S), calcium silicate hydrate (C-S-H), and ettringite (Aft). Additionally, the GO0NC1 and GO2NC1 groups exhibited the presence of hydrated calcium aluminate carbonate (C3A·CaCO3·11H2O) due to the reaction between NC and tricalcium aluminate (C3A). NC reacted with C3A to form low-carbon hydrated calcium aluminate, which acted as a framework with high permeability for ion penetration and provided conditions for the diffusion or nucleation of ions in hydrated calcium aluminate [33]. This also increased the ion concentration gradient around cement particles, accelerating ion diffusion and further promoting the hydration of cement particles. The results indicated that the addition of GO did not change the types of hydration products in cement mortar but only altered their quantities, while the addition of NC generated a new hydration product: hydrated calcium aluminate carbonate. By observing the XRD patterns, it can be noticed that the diffraction peaks of SiO2, C2S, and C3S mostly disappeared, indicating a relatively complete hydration reaction in all groups. The SiO2 diffraction peak of the GO2NC1 group completely vanished, while the other groups still exhibited minimal residual peaks, indicating that the hydration was most complete in the GO2NC1 group. This also confirmed the reason as to why the GO2NC1 group had the highest mechanical properties and durability. The diffraction peaks of C-S-H were generally higher in the GO2NC0, GO0NC1, and GO2NC1 groups compared to the Ref group. The diffraction peaks of CH revealed that the GO2NC0 and GO2NC1 groups exhibited significantly higher CH peaks compared to the Ref group, indicative of the fact that the addition of GO and NC promoted hydration in cement mortar. However, the CH diffraction peak of the GO0NC1 group was lower compared to the Ref group due to the reaction between NC and CH, leading to the formation of alkaline carbonate calcium Ca3(CO3)2(OH)21.5H2O and reducing the content of CH in the GO0NC1 group. It is worth noting that this alkaline carbonate calcium enhances the interfacial transition zone of the cement hydration products.
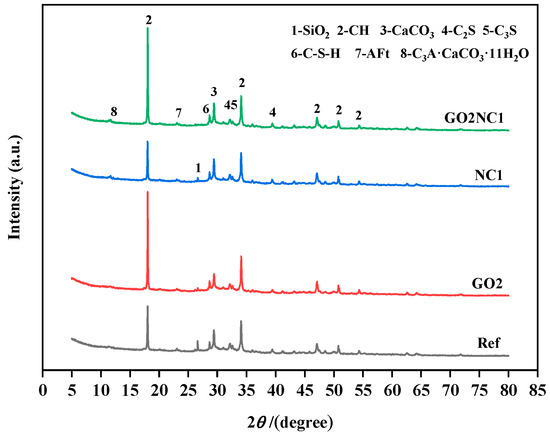
Figure 14.
XRD patterns of cement mortar after 28 days of hydration.
In the past, there were inconsistent conclusions regarding the influence of GO on the hydration process and the main hydration products of cement. Hulagabali et al. [34] indicated that the addition of GO did not significantly affect calcium hydroxide (CH) and calcium silicate hydrate (C-S-H) but it could increase the content of ettringite. However, Wang et al. [35] suggested that the addition of GO can promote cement hydration and facilitate the formation of CH crystals. Naseem et al. [36] also pointed out that the addition of GO can enhance the rate of cement hydration and accelerate CH crystal formation. The experimental results in this study tended to support the hypothesis that GO promoted cement hydration and the formation of CH crystals.
3.3.2. SEM Microstructure Analysis
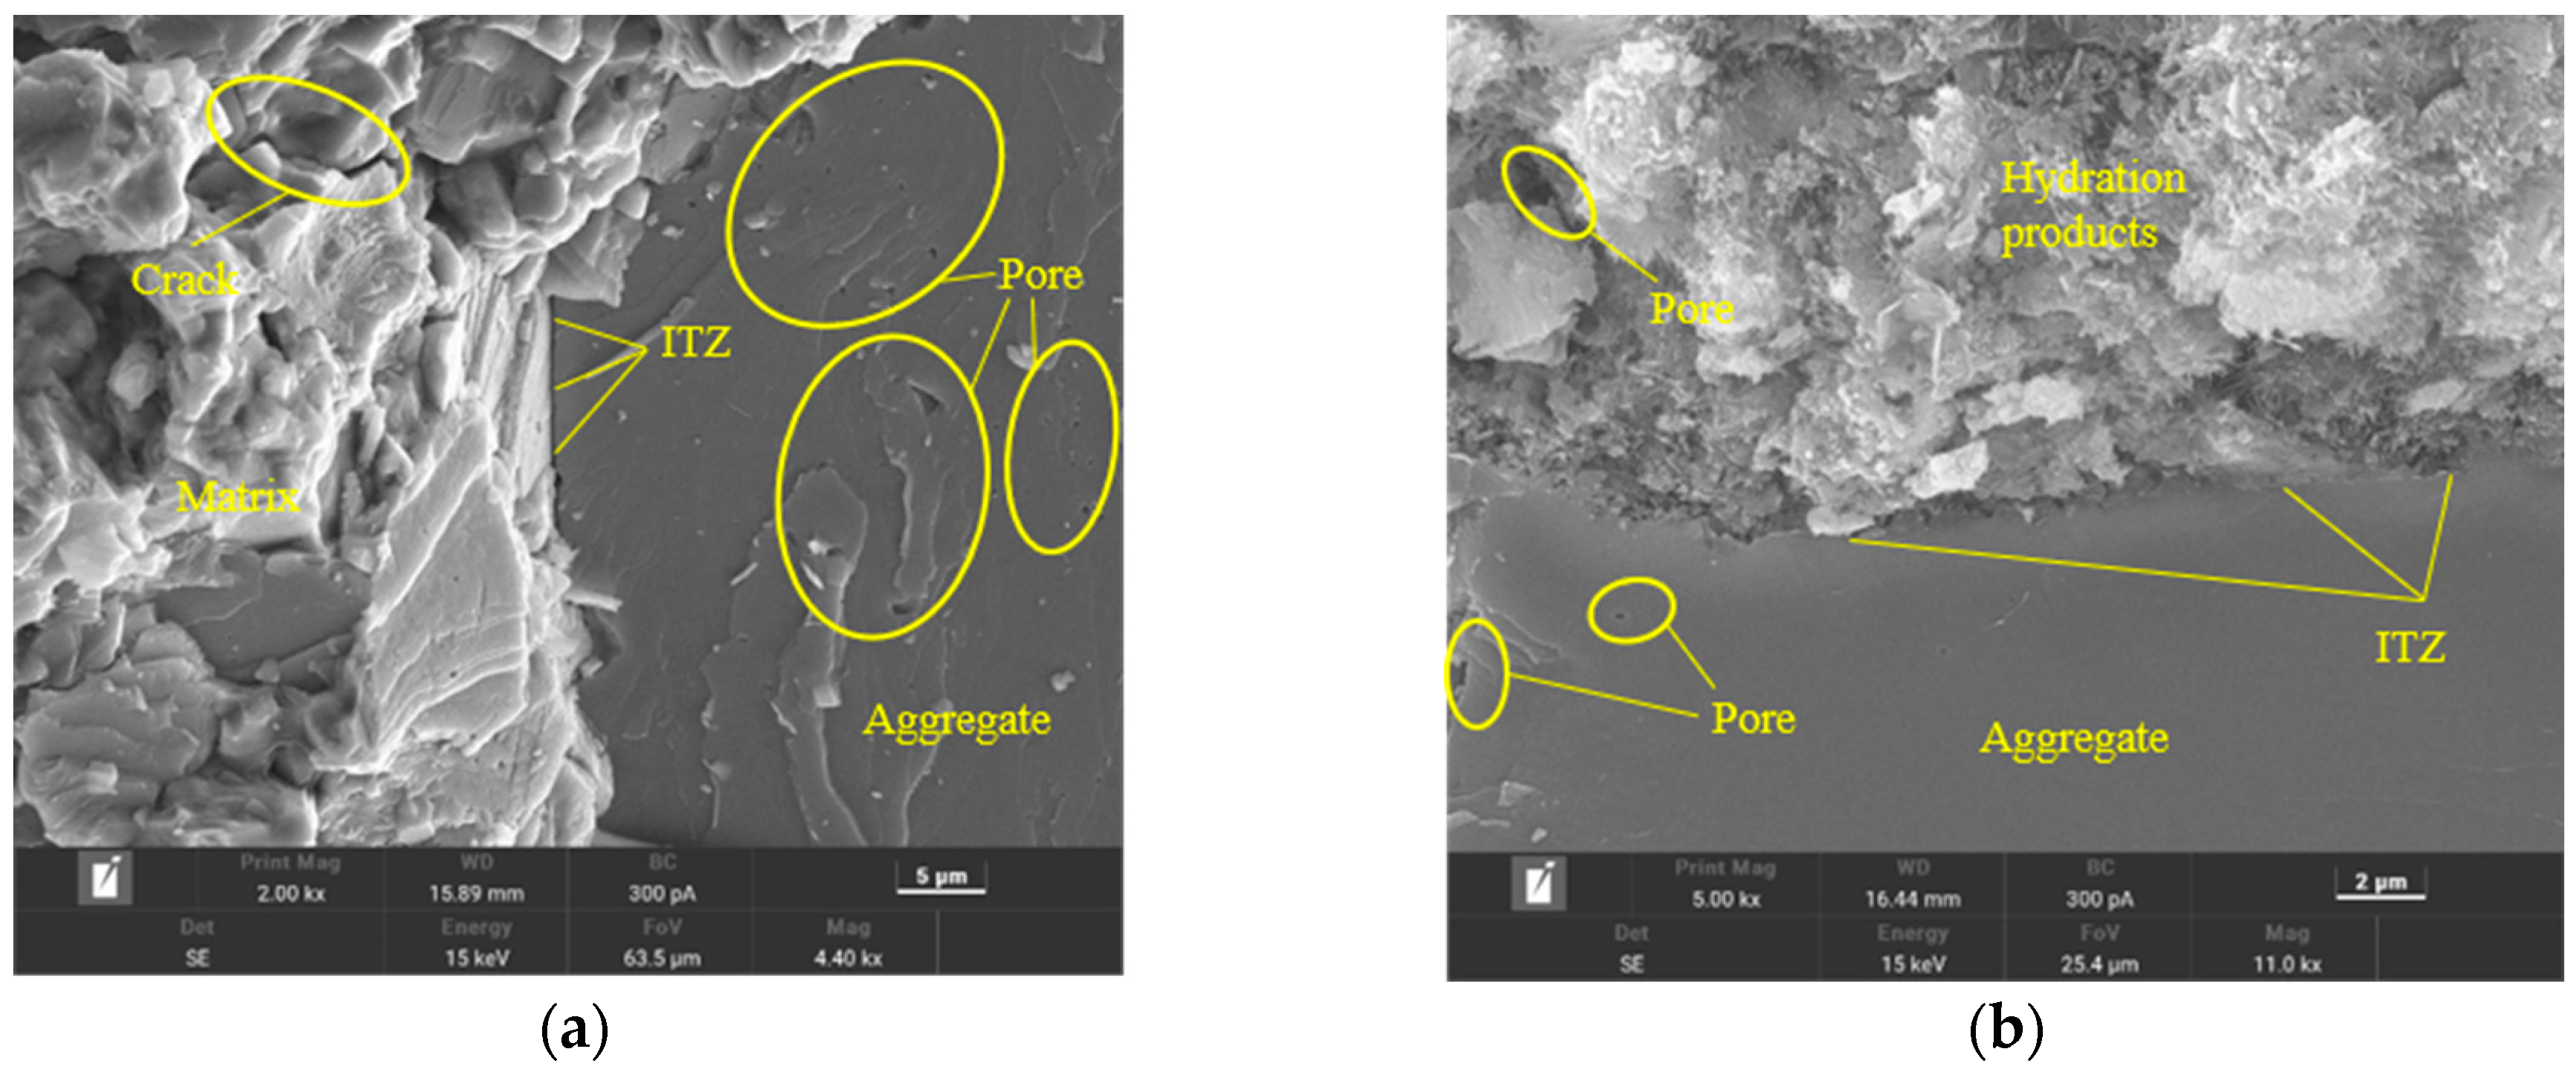
As shown in Figure 15, it was evident that the interfacial transition zone (ITZ) gaps in the Ref group were larger, indicating a less tight connection between the cement hydration products and aggregates, along with some wrinkling and unevenness in the aggregates. Additionally, there were numerous pores and cracks present in the hydration products. In comparison to the Ref group, the GO2NC0 group exhibited a denser arrangement of hydration products and a tighter connection with the aggregates, resulting in smoother and more consistent aggregates, as well as fewer pores in the hydration products. The ITZ in the GO0NC1 group was also denser compared to the Ref group, with more compact hydration products and a relatively lower number of pores in the hydration products. However, the aggregates in this group still displayed some wrinkling and unevenness. The ITZ in the GO2NC1 group showed minimal gaps, representing the most compact connection between hydration products and aggregates, resulting in smoother and more uniform aggregates, as well as relatively fewer pores in the hydration products. Microscopic analysis indicated that the addition of GO or NC was beneficial for improving the ITZ of cement mortar, enhancing bonding strength, and, ultimately, improving the mechanical properties of cement mortar.
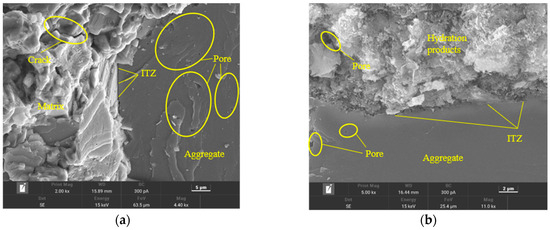
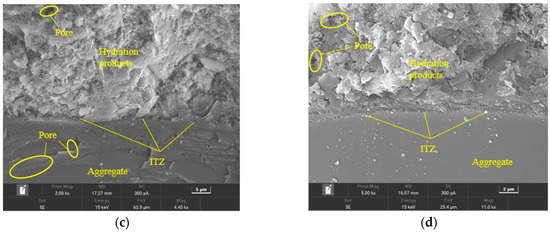
Figure 15.
Microstructure of cement mortar at 28 days. (a) Ref; (b) GO2; (c) NC3; (d) GO2NC1.
3.3.3. MIP Pore Size Distribution
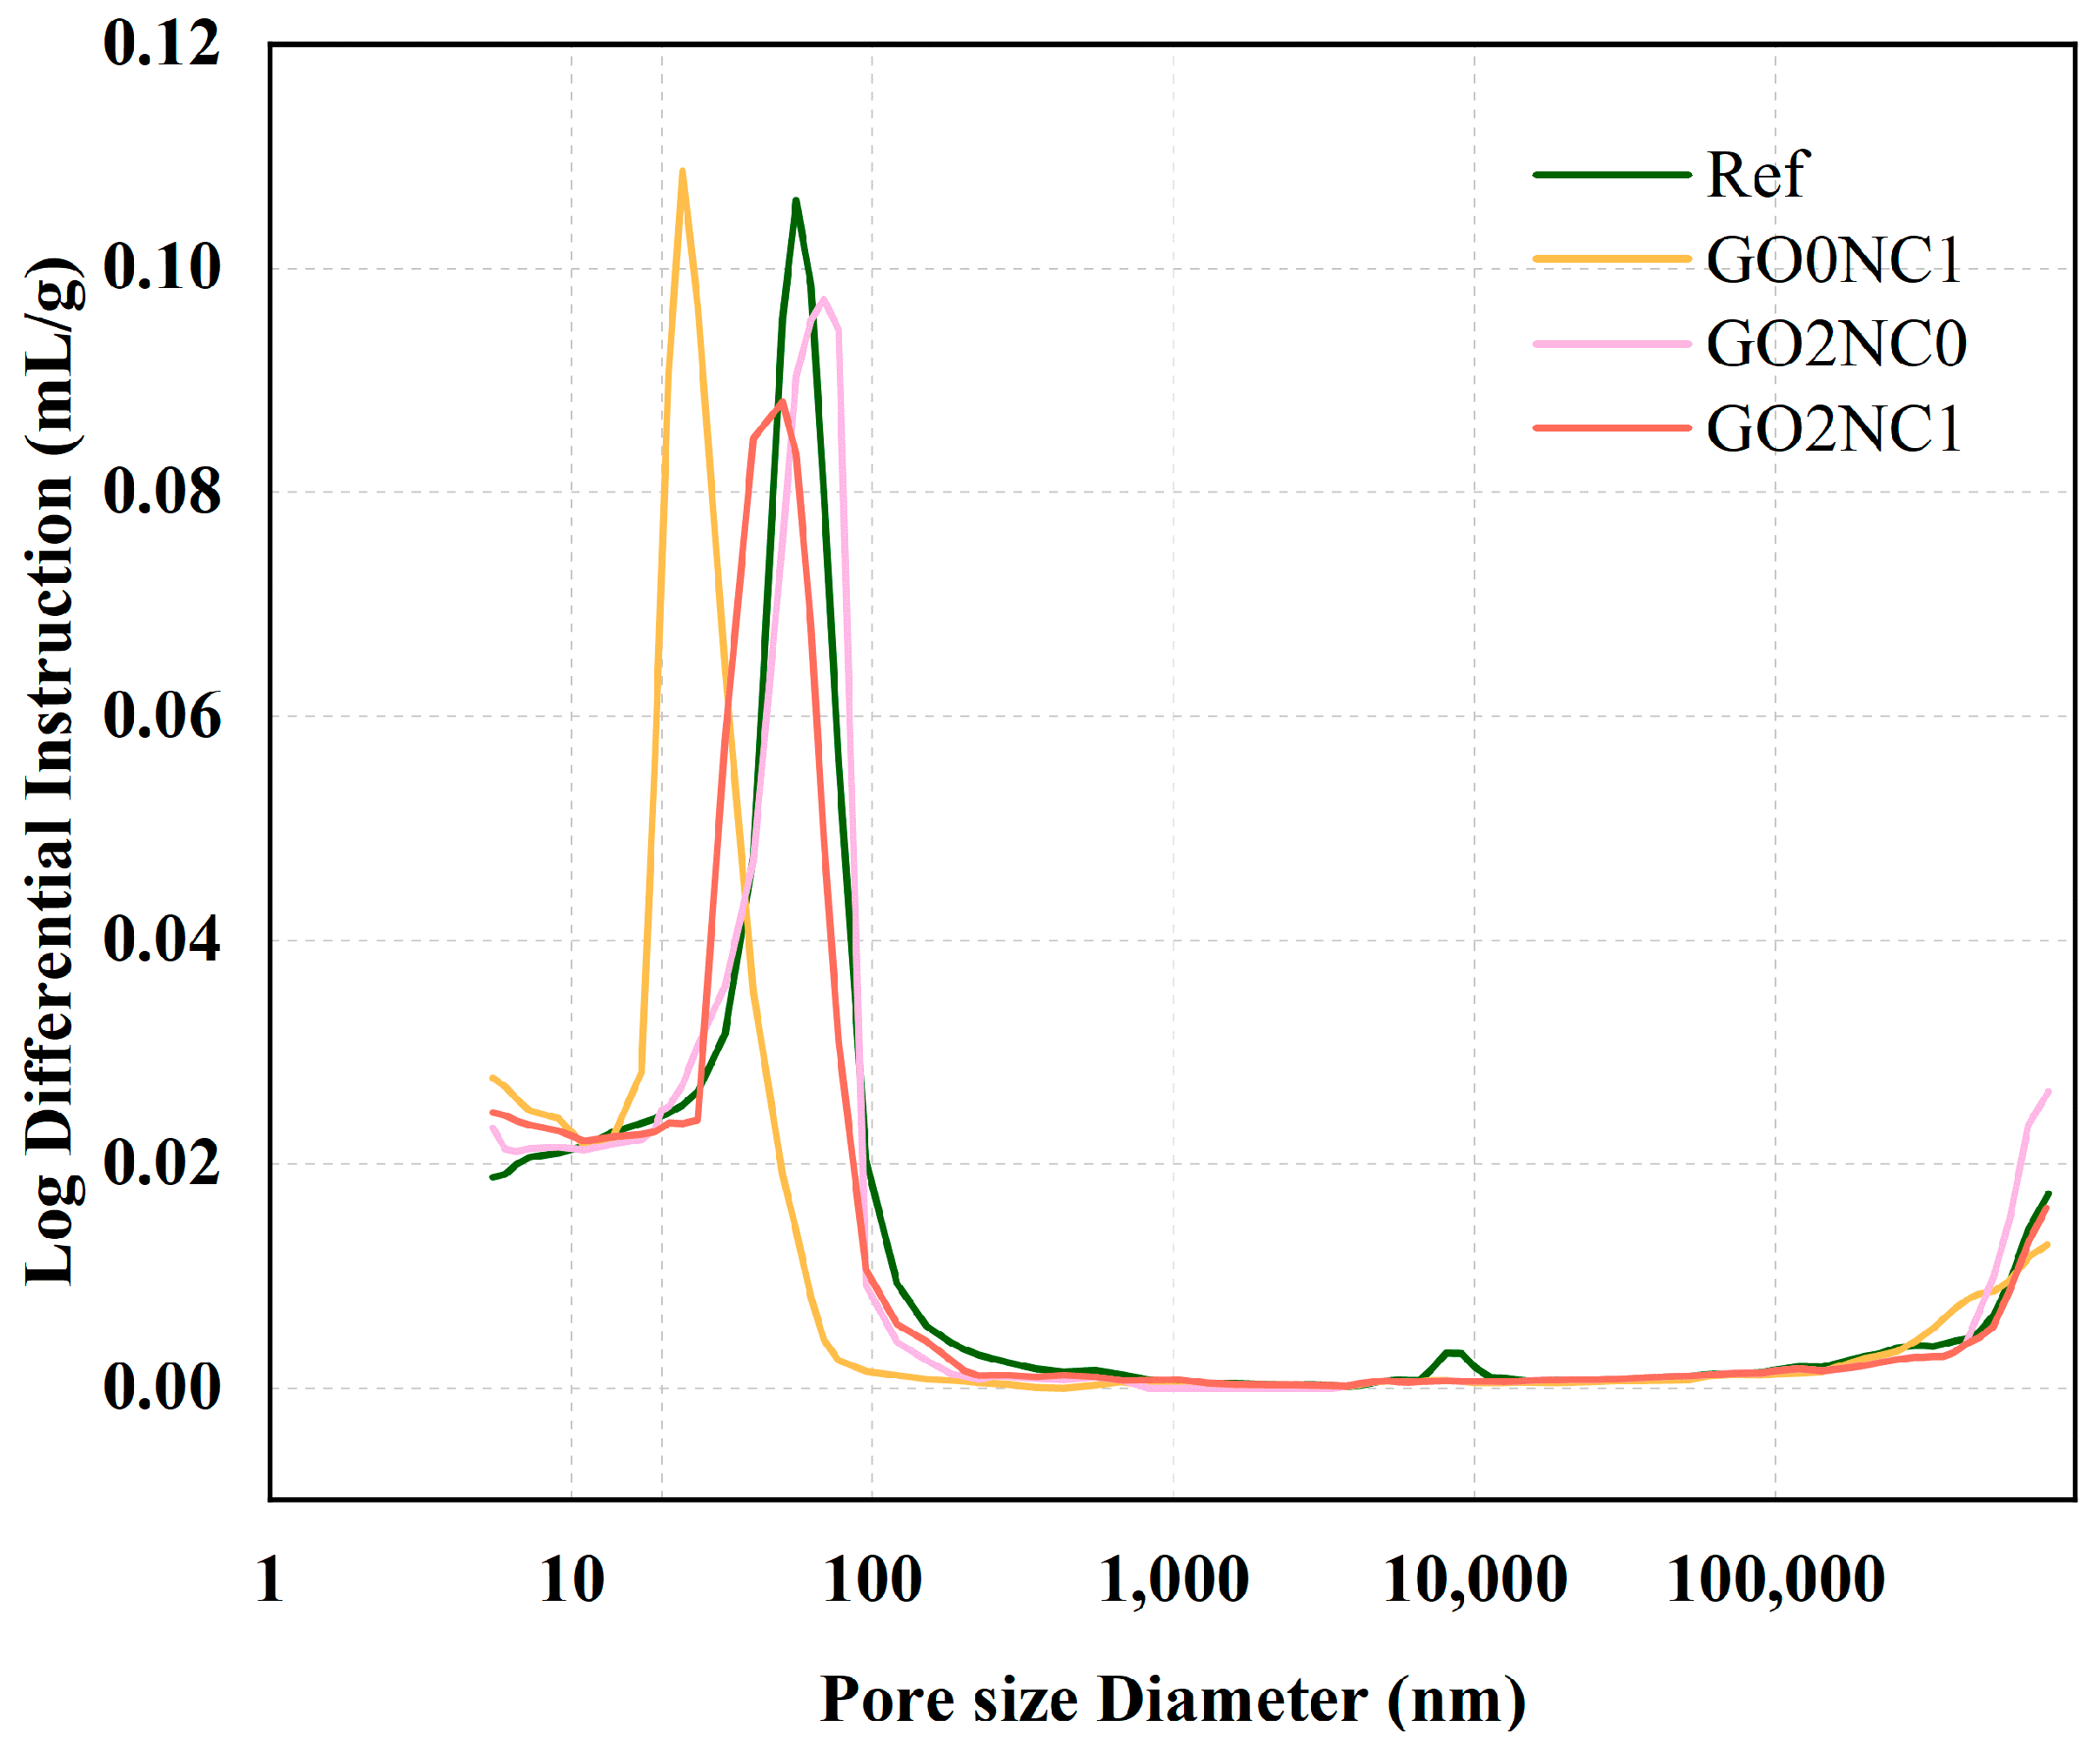
As shown in Figure 16, the GO2NC1 group slightly increased compared to the Ref group. This could be attributed to the addition of GO and NC, which increased the proportion of small pores and decreased the proportion of large pores, ultimately leading to an increase in the total porosity. In accordance with the size of pores in cement-based materials, the pore structure can be classified into four categories: harmless pores (≤20 nm), slightly harmful pores (20~50 nm), harmful pores (50~200 nm), and highly harmful pores (≥200 nm). When GO and NC were added to the mortar separately, GO effectively filled harmful pores due to its small particle size, resulting in a 4.8% reduction compared to the Ref group. However, the lack of synergistic dispersion with NC led to the agglomeration of some GO, resulting in no reduction in the number of highly harmful pores. The addition of NC resulted in a highly effective pore-filling effect, shifting the peak of the MIP test curve to 23.4 nm (compared to 55.8 nm for the Ref group) and reducing harmful pores to the lowest level of 18.5% among all specimens. Unfortunately, due to its slightly larger particle size compared to GO, NC did not significantly control harmless pores.
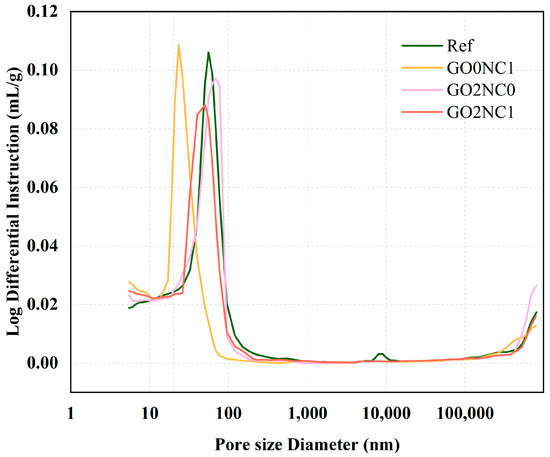
Figure 16.
Pore size distribution.
According to Table 8, the Ref group mainly consisted of harmful pores, whereas the GO2NC1 group primarily consisted of slightly harmful pores. Reducing the proportion of harmful pore sizes can effectively improve the strength of cement mortar. Furthermore, by comparing the pore size proportions of the Ref and GO2NC1, it was evident that the GO2NC1 group had increased proportions of harmless and slightly harmful pores by 4.8% and 6.70%, respectively, while the proportions of harmful and highly harmful pores decreased by 10.2% and 1.3%, respectively, compared to the Ref group. Therefore, when GO-NC acts synergistically, the curve exhibits beneficial changes. The curve peak integrates the advantages of GO2NC0 and GO0NC1, reaching 50.3 nm. Based on the mechanical and durability performance of the GO2NC1 group, the addition of GO optimized the pore size distribution [37]. The NMR test results by Chen et al. [38] also demonstrated that NC can reduce the size of larger pores, indicating that the combination of GO and NC can refine the internal pore structure of cement mortar, making the hydration products more compact.
Table 8.
Proportion of pore sizes in different categories.
4. Conclusions
By evaluating the macroscopic performance of GO-NC-modified cement mortar, the optimal blending ratio of GO and NC in cement mortar was determined. In addition, the underlying mechanisms were deduced by considering the microscopic characterization. It is expected that this study will provide valuable insights for researchers in the field;
- (1)
- The optimal mixing ratio for improving the mechanical and durability properties of the mortar was 0.02 wt% graphene oxide and 1 wt% nano-calcium carbonate. Compared with the Ref group, the 28 days of flexural strength and compressive strength of the GO-NC modified mortar increased by 12.9% and 12.4%, respectively. In all of the durability tests, the addition of both GO and NC improved the water permeability and ion penetration resistance of the mortar due to their pore-filling effect. When the two materials were combined, due to their different particle size distribution, different filling effects were observed, resulting in the most significant improvement in the mechanical and durability properties of the mortar by GO-NC.
- (2)
- XRD analysis showed that the nucleation effect of GO and NC caused Ca+ and OH− in the hydration products to be quickly absorbed. However, GO only changed the quantity of hydration products. The reason for the appearance of new hydration products was that NC reacted with tricalcium aluminate (C3A) to generate new hydration products, i.e., calcium aluminate hydrate;
- (3)
- Combining SEM analysis and MIP pore size distribution results, both graphene oxide (GO) and nano-calcium carbonate (NC) promote hydration, improve the arrangement of hydration products, and further enhance their pore-filling effect. This leads to denser hydration products, ultimately enhancing the mechanical and durability properties of the overall structure. The pore-filling effect of GO-NC reduced the percentage of harmful pores from 40.2% to 29.9%, increasing the proportion of harmless and less harmful pores. The synergistic effect of GO and NC improves the uniformity of pore size distribution in the mortar across the entire range, leading to a stronger connection between the hydration products and the aggregate interface transition zone (ITZ), resulting in a more uniform microstructure of the ITZ;
- (4)
- In most studies, the content of graphene oxide was typically 0.03 wt% to 0.08 wt% [9,16]. In this paper, the optimal content of graphene oxide was reduced to 0.02 wt%, further lowering the cost threshold of graphene oxide in construction. The experimental results promoted the application of nano-calcium carbonate and expanded the application fields of graphene oxide and nano-calcium carbonate. We hope it will be helpful for the research of other researchers.
Author Contributions
Conceptualization, C.L. and W.S.; methodology, W.B.; software, G.M.; validation, W.S. and G.M.; formal analysis, W.S.; investigation, Y.D.; resources, C.L. and Z.Z.; data curation, G.M.; writing—original draft preparation, W.S.; writing—review and editing, W.S. and C.L.; visualization, W.Y.; supervision, Z.Z.; project administration, C.L. and W.B.; funding acquisition, W.S. and C.L. All authors have read and agreed to the published version of the manuscript.
Funding
This research was funded by the Chongqing Technology Innovation and Application Development Special General Project (cstc2020jscx-msxmX0084), Chongqing Construction Science and Technology Plan Key Project (Urban Science 2021, No.1-8), Guangzhou Basic and Applied Basic Research Project (202201010750), and Graduate Innovation Ability Training Project of Guangzhou University. The APC was waived by Buildings.
Data Availability Statement
Data is contained within the article. The original contributions presented in the study are included in the article, further inquiries can be directed to the corresponding authors.
Acknowledgments
Thank you to the authors for their hard work and to Buildings for providing a platform to display our research articles.
Conflicts of Interest
The authors declare no conflict of interest.
Appendix A
Formula (1):
P: Water penetration resistance of cement mortar (MPa);
H: Water pressure at which water begins to penetrate the surface of the third specimen (MPa).
Formula (2):
DRCM: Non-steady-state chloride ion migration coefficient of cement mortar (MPa);
U: Absolute value of the applied voltage (V);
T: Absolute value of the applied voltage (V); Average of the initial and final temperatures of the anolyte solution (℃);
L: Thickness of the specimen (mm), accurate to 0.1mm;
Xd: Average depth of chloride ion penetration (mm), accurate to 0.1mm;
t: Duration of the experiment (h).
Formula (3):
Kf: Compressive resistance to corrosion coefficient of cement mortar (%);
fcn: Compressive strength test values (MPa) of a group of cement mortar specimens subjected to sulfate corrosion, with an accuracy of 0.1 MPa;
fc0: Compressive strength test values (MPa), accurate to 0.1 MPa, for a group of cement mortar specimens of the same age under standardized curing conditions in the presence of sulfate corrosion.
References
- Makul, N. Modern sustainable cement and concrete composites: Review of current status, challenges and guidelines. Sustain. Mater. Technol. 2020, 25, e00155. [Google Scholar] [CrossRef]
- Zeng, H.; Qu, S.; Tian, Y.; Hu, Y.; Li, Y. Recent progress on graphene oxide for next-generation concrete: Characterizations, applications and challenges. J. Build. Eng. 2023, 69, 106192. [Google Scholar] [CrossRef]
- Raj, R.S.; Arulraj, G.P.; Anand, N.; Kanagaraj, B.; Lubloy, E.; Naser, M. Nanomaterials in geopolymer composites: A review. Dev. Built Environ. 2023, 13, 100114. [Google Scholar] [CrossRef]
- Alvi, I.H.; Li, Q.; Hou, Y.; Onyekwena, C.C.; Zhang, M.; Ghaffar, A. A critical review of cement composites containing recycled aggregates with graphene oxide nanomaterials. J. Build. Eng. 2023, 69, 105989. [Google Scholar] [CrossRef]
- de Souza, F.B.; Yao, X.; Lin, J.; Naseem, Z.; Tang, Z.Q.; Hu, Y.; Gao, W.; Sagoe-Crentsil, K.; Duan, W. Effective strategies to realize high-performance graphene-reinforced cement composites. Constr. Build. Mater. 2022, 324, 126636. [Google Scholar] [CrossRef]
- Alateah, A.H. Graphene concrete: Recent advances in production methods, performance properties, environmental impact and economic viability. Case Stud. Constr. Mater. 2023, 19, e02653. [Google Scholar] [CrossRef]
- Salami, B.A.; Mukhtar, F.; Ganiyu, S.A.; Adekunle, S.; Saleh, T.A. Graphene-based concrete: Synthesis strategies and reinforcement mechanisms in graphene-based cementitious composites (Part 1). Constr. Build. Mater. 2023, 396, 132296. [Google Scholar] [CrossRef]
- Abdalla, J.A.; Hawileh, R.A.; Bahurudeen, A.; Jittin; Kabeer, K.S.A.; Thomas, B. Influence of synthesized nanomaterials in the strength and durability of cementitious composites. Case Stud. Constr. Mater. 2023, 18, e02197. [Google Scholar] [CrossRef]
- Fonseka, I.; Mohotti, D.; Wijesooriya, K.; Lee, C.-K.; Mendis, P. Influence of Graphene oxide on abrasion resistance and strength of concrete. Constr. Build. Mater. 2023, 404, 133280. [Google Scholar] [CrossRef]
- Lu, D.; Shi, X.M.; Zhong, J. Interfacial nano-engineering by graphene oxide to enable better utilization of silica fume in cementitious composite. J. Clean. Prod. 2022, 354, 131381. [Google Scholar] [CrossRef]
- Lu, D.; Shi, X.M.; Zhong, J. Nano-engineering the interfacial transition zone in cement composites with graphene oxide. Constr. Build. Mater. 2023, 356, 129284. [Google Scholar] [CrossRef]
- Luo, J.; Zhou, C.; Li, W.; Chen, S.; Korayem, A.H.; Duan, W. Using graphene oxide to improve physical property and control ASR expansion of cement mortar. Constr. Build. Mater. 2021, 307, 125006. [Google Scholar] [CrossRef]
- Yu, L.B.; Bai, S.; Guan, X.C. Graphene oxide-silica nanocomposites reinforced mortars: Mechanical properties, permeability and microstructure. Constr. Build. Mater. 2022, 344, 128290. [Google Scholar] [CrossRef]
- Liu, C.; Huang, X.; Wu, Y.-Y.; Deng, X.; Zheng, Z. The effect of graphene oxide on the mechanical properties, impermeability and corrosion resistance of cement mortar containing mineral admixtures. Constr. Build. Mater. 2021, 288, 123059. [Google Scholar] [CrossRef]
- Tatineni, Y.S.; Putta, J. Enhanced Strength, Durability, and Microstructural Attributes of Graphene Oxide-Modified Ultrafine Slag Cement Mortar. Buildings 2022, 12, 2199. [Google Scholar] [CrossRef]
- Kaur, R.; Bhatrola, K.; Kumar, A.; Kaur, J.; Suhag, S.; Maurya, S.K.; Kothiyal, N. Durability of cementitious mortar: Incorporation of highly dispersed superplasticizer modified graphene oxide in fly ash blended mortar. J. Build. Eng. 2023, 80, 107888. [Google Scholar] [CrossRef]
- Cheng, X.; Zhou, J.; Luo, L.; Shen, S.; Zhang, J. Boosting Bulk Oxygen Transport with Accessible Electrode Nanostructure in Low Pt Loading PEMFCs. Small 2024, 20, 2308563. [Google Scholar] [CrossRef] [PubMed]
- Fu, Q.; Zhang, Z.; Zhao, X.; Xu, W.; Niu, D. Effect of nano calcium carbonate on hydration characteristics and microstructure of cement-based materials: A review. J. Build. Eng. 2022, 50, 104220. [Google Scholar] [CrossRef]
- Liu, X.; Chen, L.; Liu, A.; Wang, X. Effect of Nano-CaCO3 on Properties of Cement Paste. Energy Procedia 2012, 16, 991–996. [Google Scholar] [CrossRef]
- Shaikh, F.U.A.; Supit, S.W.M. Mechanical and durability properties of high volume fly ash (HVFA) concrete containing calcium carbonate (CaCO3) nanoparticles. Constr. Build. Mater. 2014, 70, 309–321. [Google Scholar] [CrossRef]
- Shen, D.; Kang, J.; Shao, H.; Liu, C.; Li, M.; Chen, X. Cracking failure behavior of high strength concrete containing nano-CaCO3 at early age. Cem. Concr. Compos. 2023, 139, 104996. [Google Scholar] [CrossRef]
- Poudyal, L.; Adhikari, K.; Won, M. Nano Calcium Carbonate (CaCO3) as a Reliable, Durable, and Environment-Friendly Alternative to Diminishing Fly Ash. Materials 2021, 14, 3729. [Google Scholar] [CrossRef] [PubMed]
- Poudyal, L.; Adhikari, K.; Won, M. Mechanical and Durability Properties of Portland Limestone Cement (PLC) Incorporated with Nano Calcium Carbonate (CaCO3). Materials 2021, 14, 905. [Google Scholar] [CrossRef] [PubMed]
- Meng, T.; Ying, K.; Yang, X.; Hong, Y. Comparative study on mechanisms for improving mechanical properties and microstructure of cement paste modified by different types of nanomaterials. Nanotechnol. Rev. 2021, 10, m370–m384. [Google Scholar] [CrossRef]
- Han, Y.; Yang, B.; Meng, L.-Y.; Oh, S.; Kim, T.; Wang, X.-Y. Innovative use of wet carbon conversion in alkali-activated slag: Improved microstructures and mechanical characteristics. Constr. Build. Mater. 2024, 411, 134487. [Google Scholar] [CrossRef]
- Feng, J.H.; Yang, F.; Qian, S.Z. Improving the bond between polypropylene fiber and cement matrix by nano calcium carbonate modification. Constr. Build. Mater. 2021, 269, 121249. [Google Scholar] [CrossRef]
- Hosan, A.; Shaikh, F.U.A. Compressive strength development and durability properties of high volume slag and slag-fly ash blended concretes containing nano-CaCO3. J. Mater. Res. Technol. 2021, 10, 1310–1322. [Google Scholar] [CrossRef]
- Chen, X.; Ai, Y.; Wu, Q.; Cheng, S.; Wei, Y.; Xu, X.; Fan, T. Potential use of nano calcium carbonate in polypropylene fiber reinforced recycled aggregate concrete: Microstructures and properties evaluation. Constr. Build. Mater. 2023, 400, 132871. [Google Scholar] [CrossRef]
- Li, J.Q.; Zheng, Q. The first experimental evidence for improved nanomechanical properties of calcium silicate hydrate by polycarboxylate ether and graphene oxide. Cem. Concr. Res. 2022, 156, 106787. [Google Scholar] [CrossRef]
- GBT 17671-2021; Test Method for Strength of Cement Mortar (ISO Method). Standards Press of China: Beijing, China, 2021; pp. 2–18.
- JGJ/T 70-2009; Standard for Test Method of Basic Properties of Construction Mortar. China Architecture & Building Press: Beijing, China, 2009; pp. 20–21.
- Qureshi, T.S.; Panesar, D.K. Nano reinforced cement paste composite with functionalized graphene and pristine graphene nanoplatelets. Compos. Part B 2020, 197, 108063. [Google Scholar] [CrossRef]
- Wu, Z.; Khayat, K.H.; Shi, C.; Tutikian, B.F.; Chen, Q. Mechanisms underlying the strength enhancement of UHPC modified with nano-SiO2 and nano-CaCO3. Cem. Concr. Compos. 2021, 119, 03992. [Google Scholar] [CrossRef]
- Hulagabali, M.M.; Vesmawala, G.R.; Patil, Y.D. Synthesis, characterization, and application of graphene oxide and reduced graphene oxide and its influence on rheology, microstructure, and mechanical strength of cement paste. J. Build. Eng. 2023, 71, 106586. [Google Scholar] [CrossRef]
- Wang, L.; Zhang, S.; Zheng, D.; Yang, H.; Cui, H.; Tang, W.; Li, D. Effect of Graphene Oxide (GO) on the Morphology and Microstructure of Cement Hydration Products. Nanomaterials 2017, 7, 429. [Google Scholar] [CrossRef] [PubMed]
- Naseem, Z.; Shamsaei, E.; Sagoe-Crentsil, K.; Duan, W. Microstructural and polymer film interaction mechanisms: Insights of GO-reinforced polymer-modified cement composites. J. Build. Eng. 2023, 80, 107962. [Google Scholar] [CrossRef]
- Zhang, R.; Long, Z.; Long, G.; Wang, J.; Wang, X.; Zhang, X.; Jiang, Y. Mechanism of graphene oxide concrete macro-micro properties evolution under large temperature difference freeze-thaw action. Constr. Build. Mater. 2024, 415, 135019. [Google Scholar] [CrossRef]
- Chen, Q.; Yan, G.; Zhuang, X.; Pain, A. Dynamic characteristics and microstructural study of nano calcium carbonate modified cemented soil under different salt water solutions. Transp. Geotech. 2022, 32, 100700. [Google Scholar] [CrossRef]


Disclaimer/Publisher’s Note: The statements, opinions and data contained in all publications are solely those of the individual author(s) and contributor(s) and not of MDPI and/or the editor(s). MDPI and/or the editor(s) disclaim responsibility for any injury to people or property resulting from any ideas, methods, instructions or products referred to in the content. |
© 2024 by the authors. Licensee MDPI, Basel, Switzerland. This article is an open access article distributed under the terms and conditions of the Creative Commons Attribution (CC BY) license (https://creativecommons.org/licenses/by/4.0/).