
Flexural Behavior of Self-Compacting PVA-SHCC Bridge Deck Link Slabs


Abstract
:1. Introduction
2. Materials and Methods
2.1. Mechanical Properties of PVA-SHCC
2.1.1. Materials
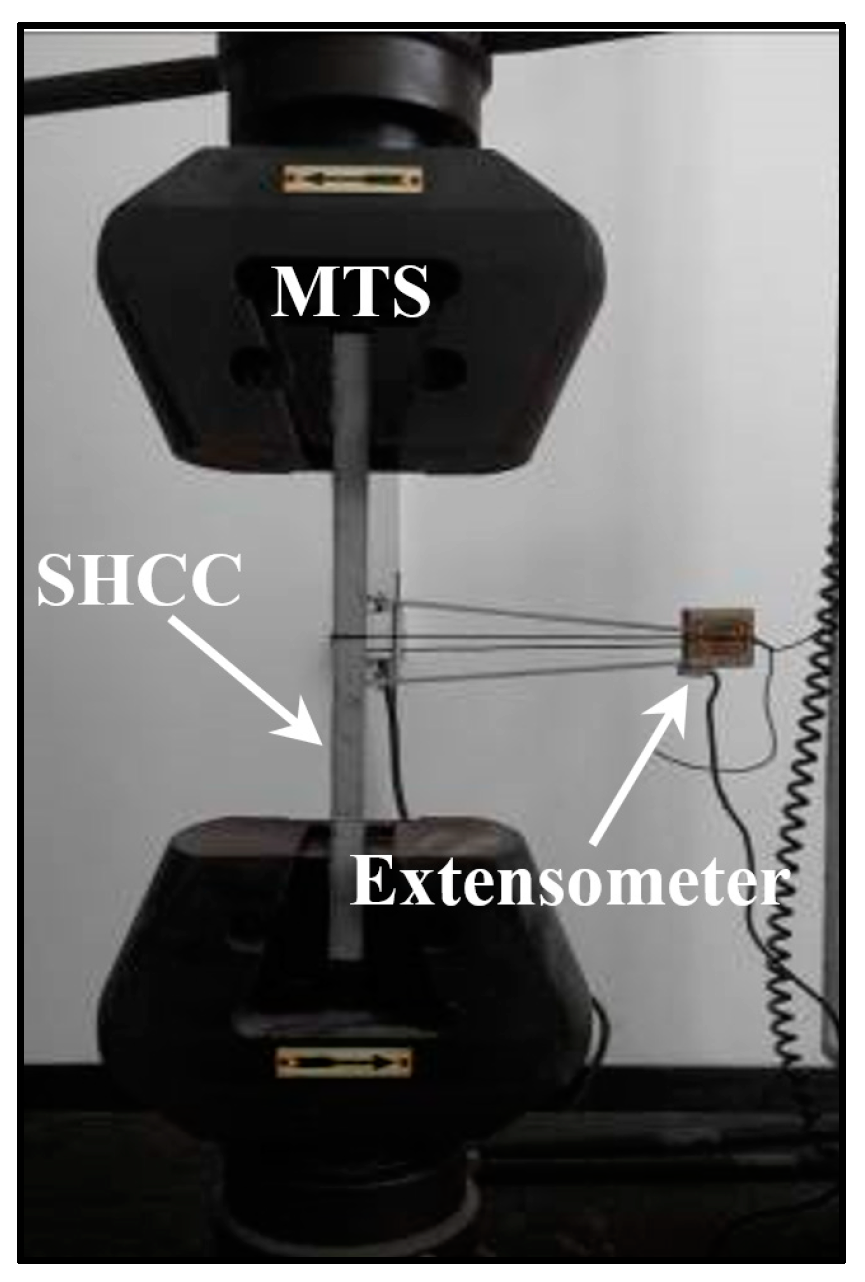
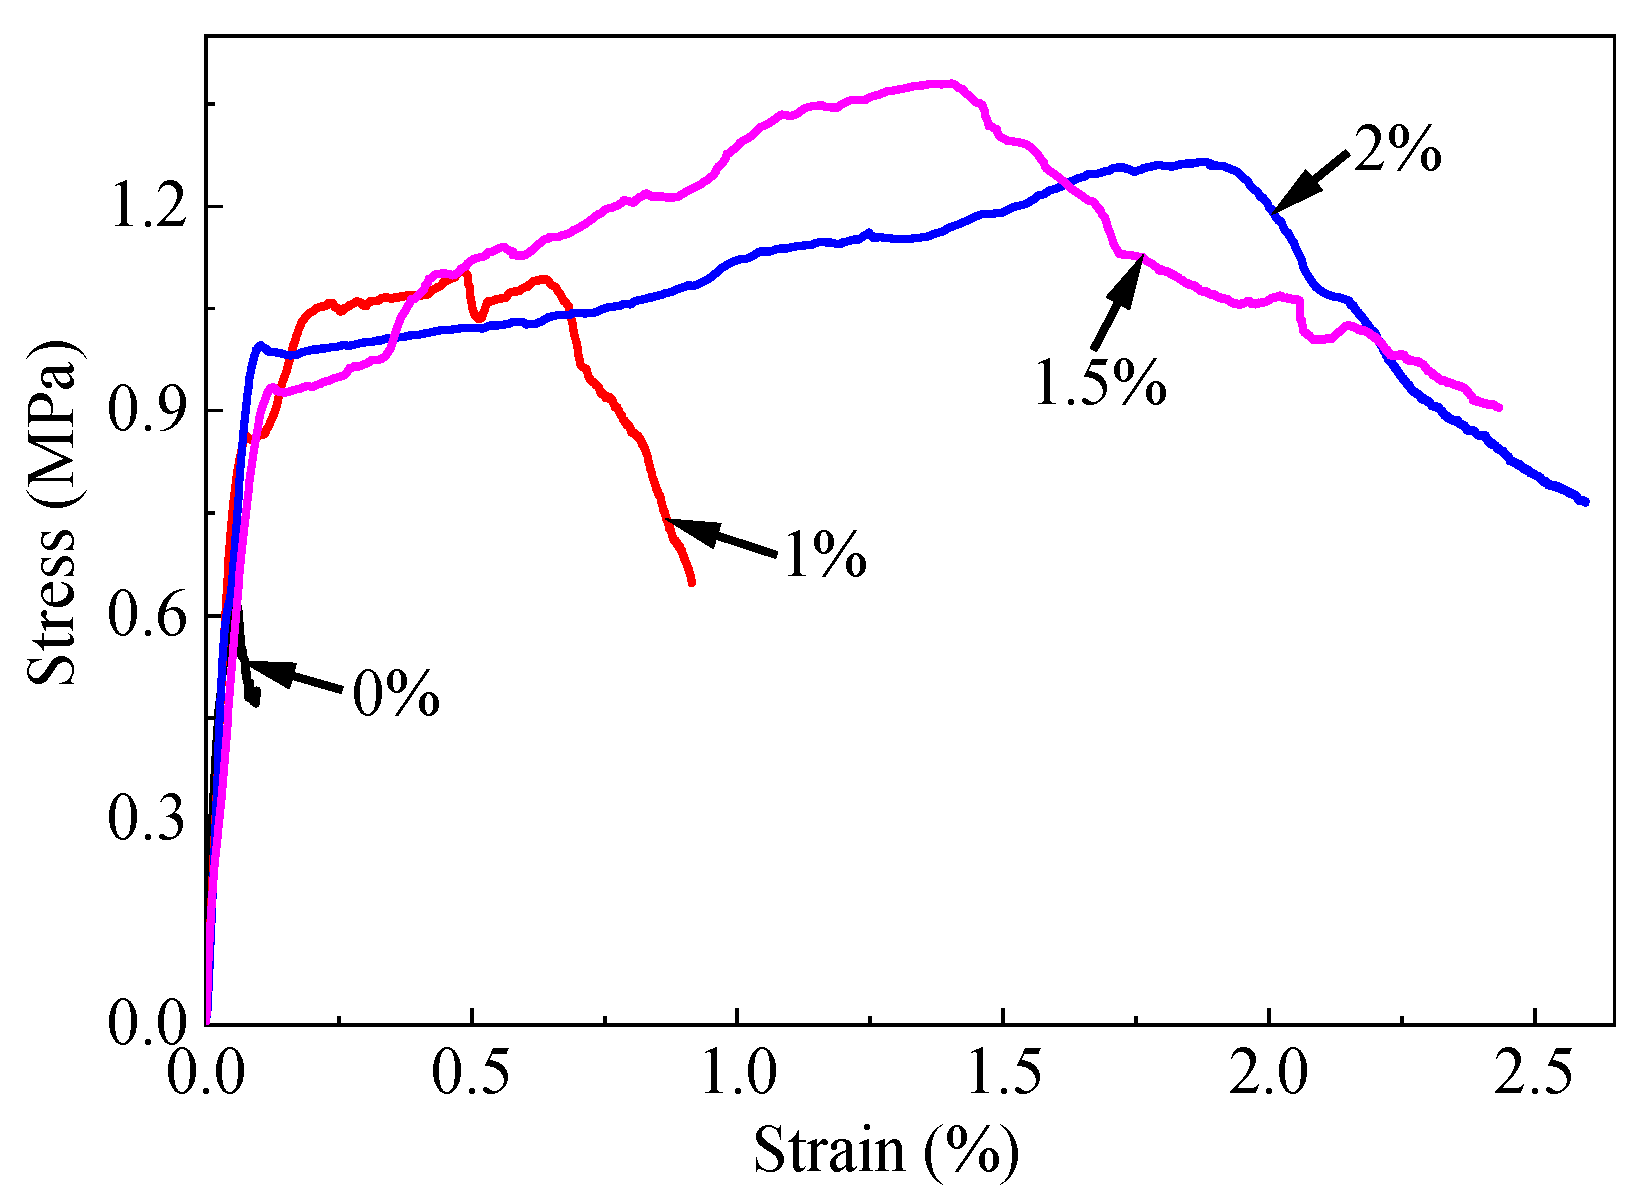
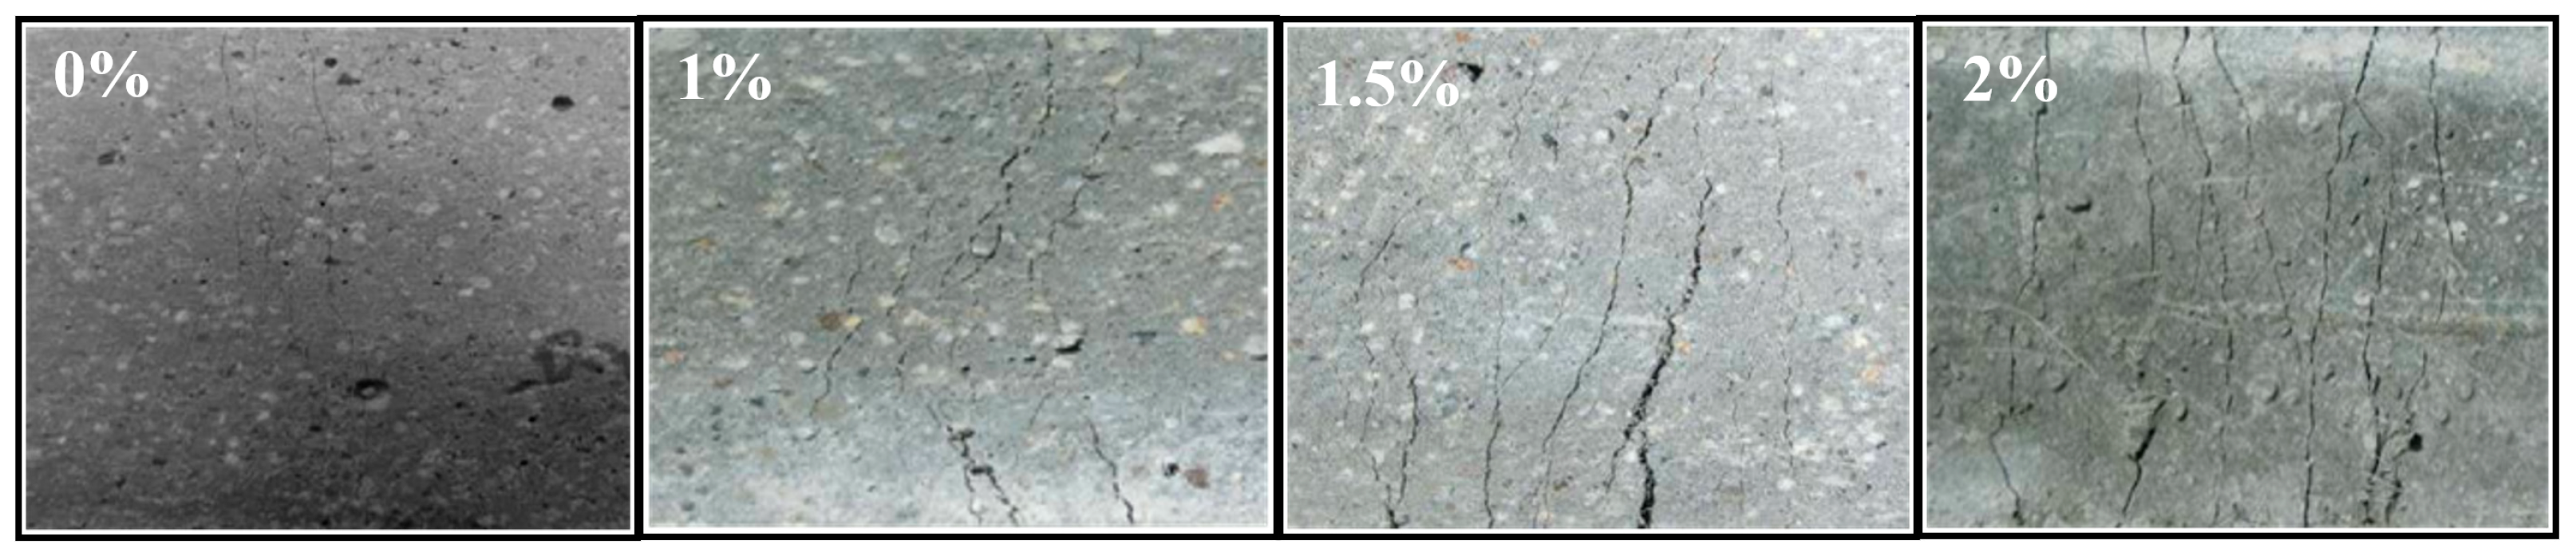
2.1.2. Tensile Properties
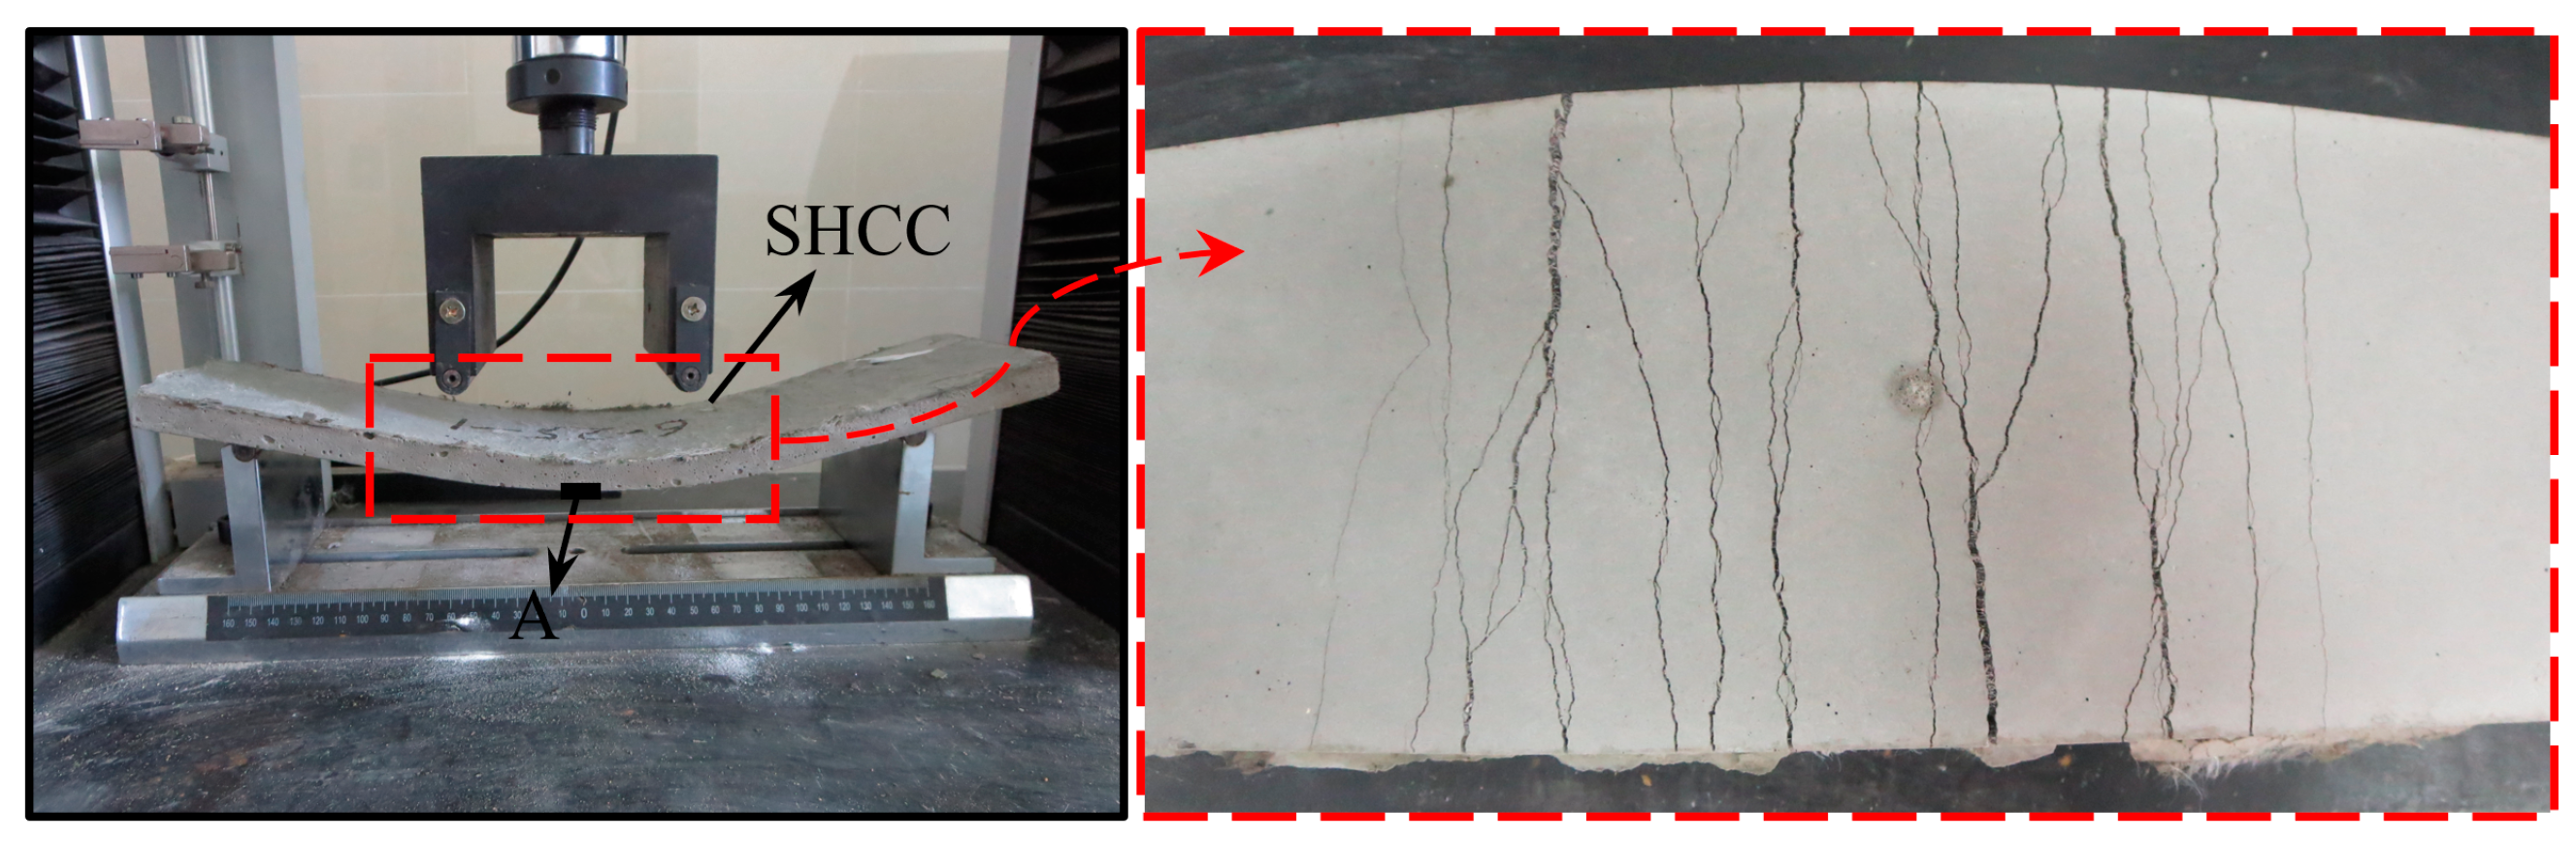
2.1.3. Flexural Behavior
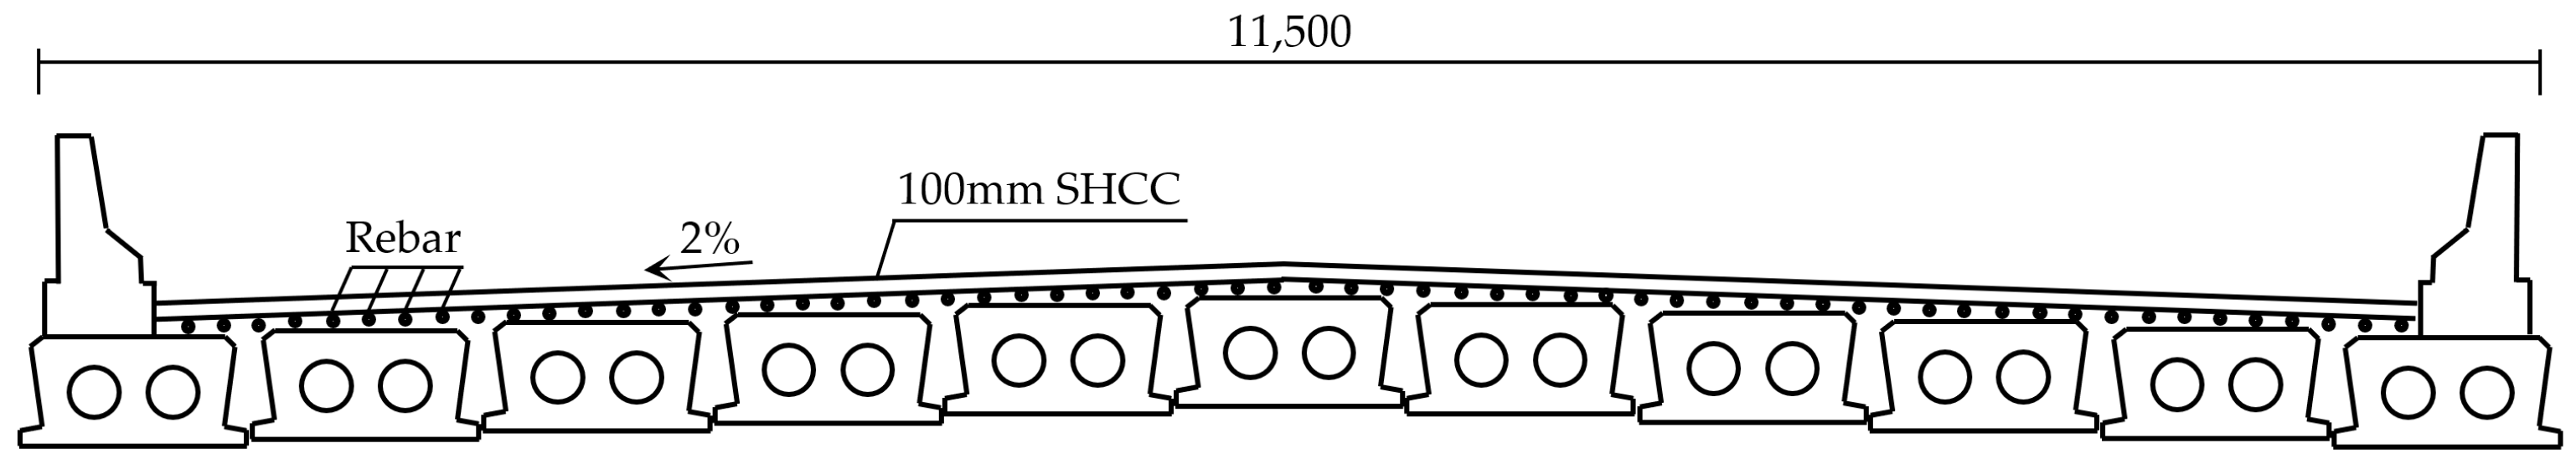
2.2. Design of Composite Models
2.2.1. Similarity Design
2.2.2. Design of Composite Models
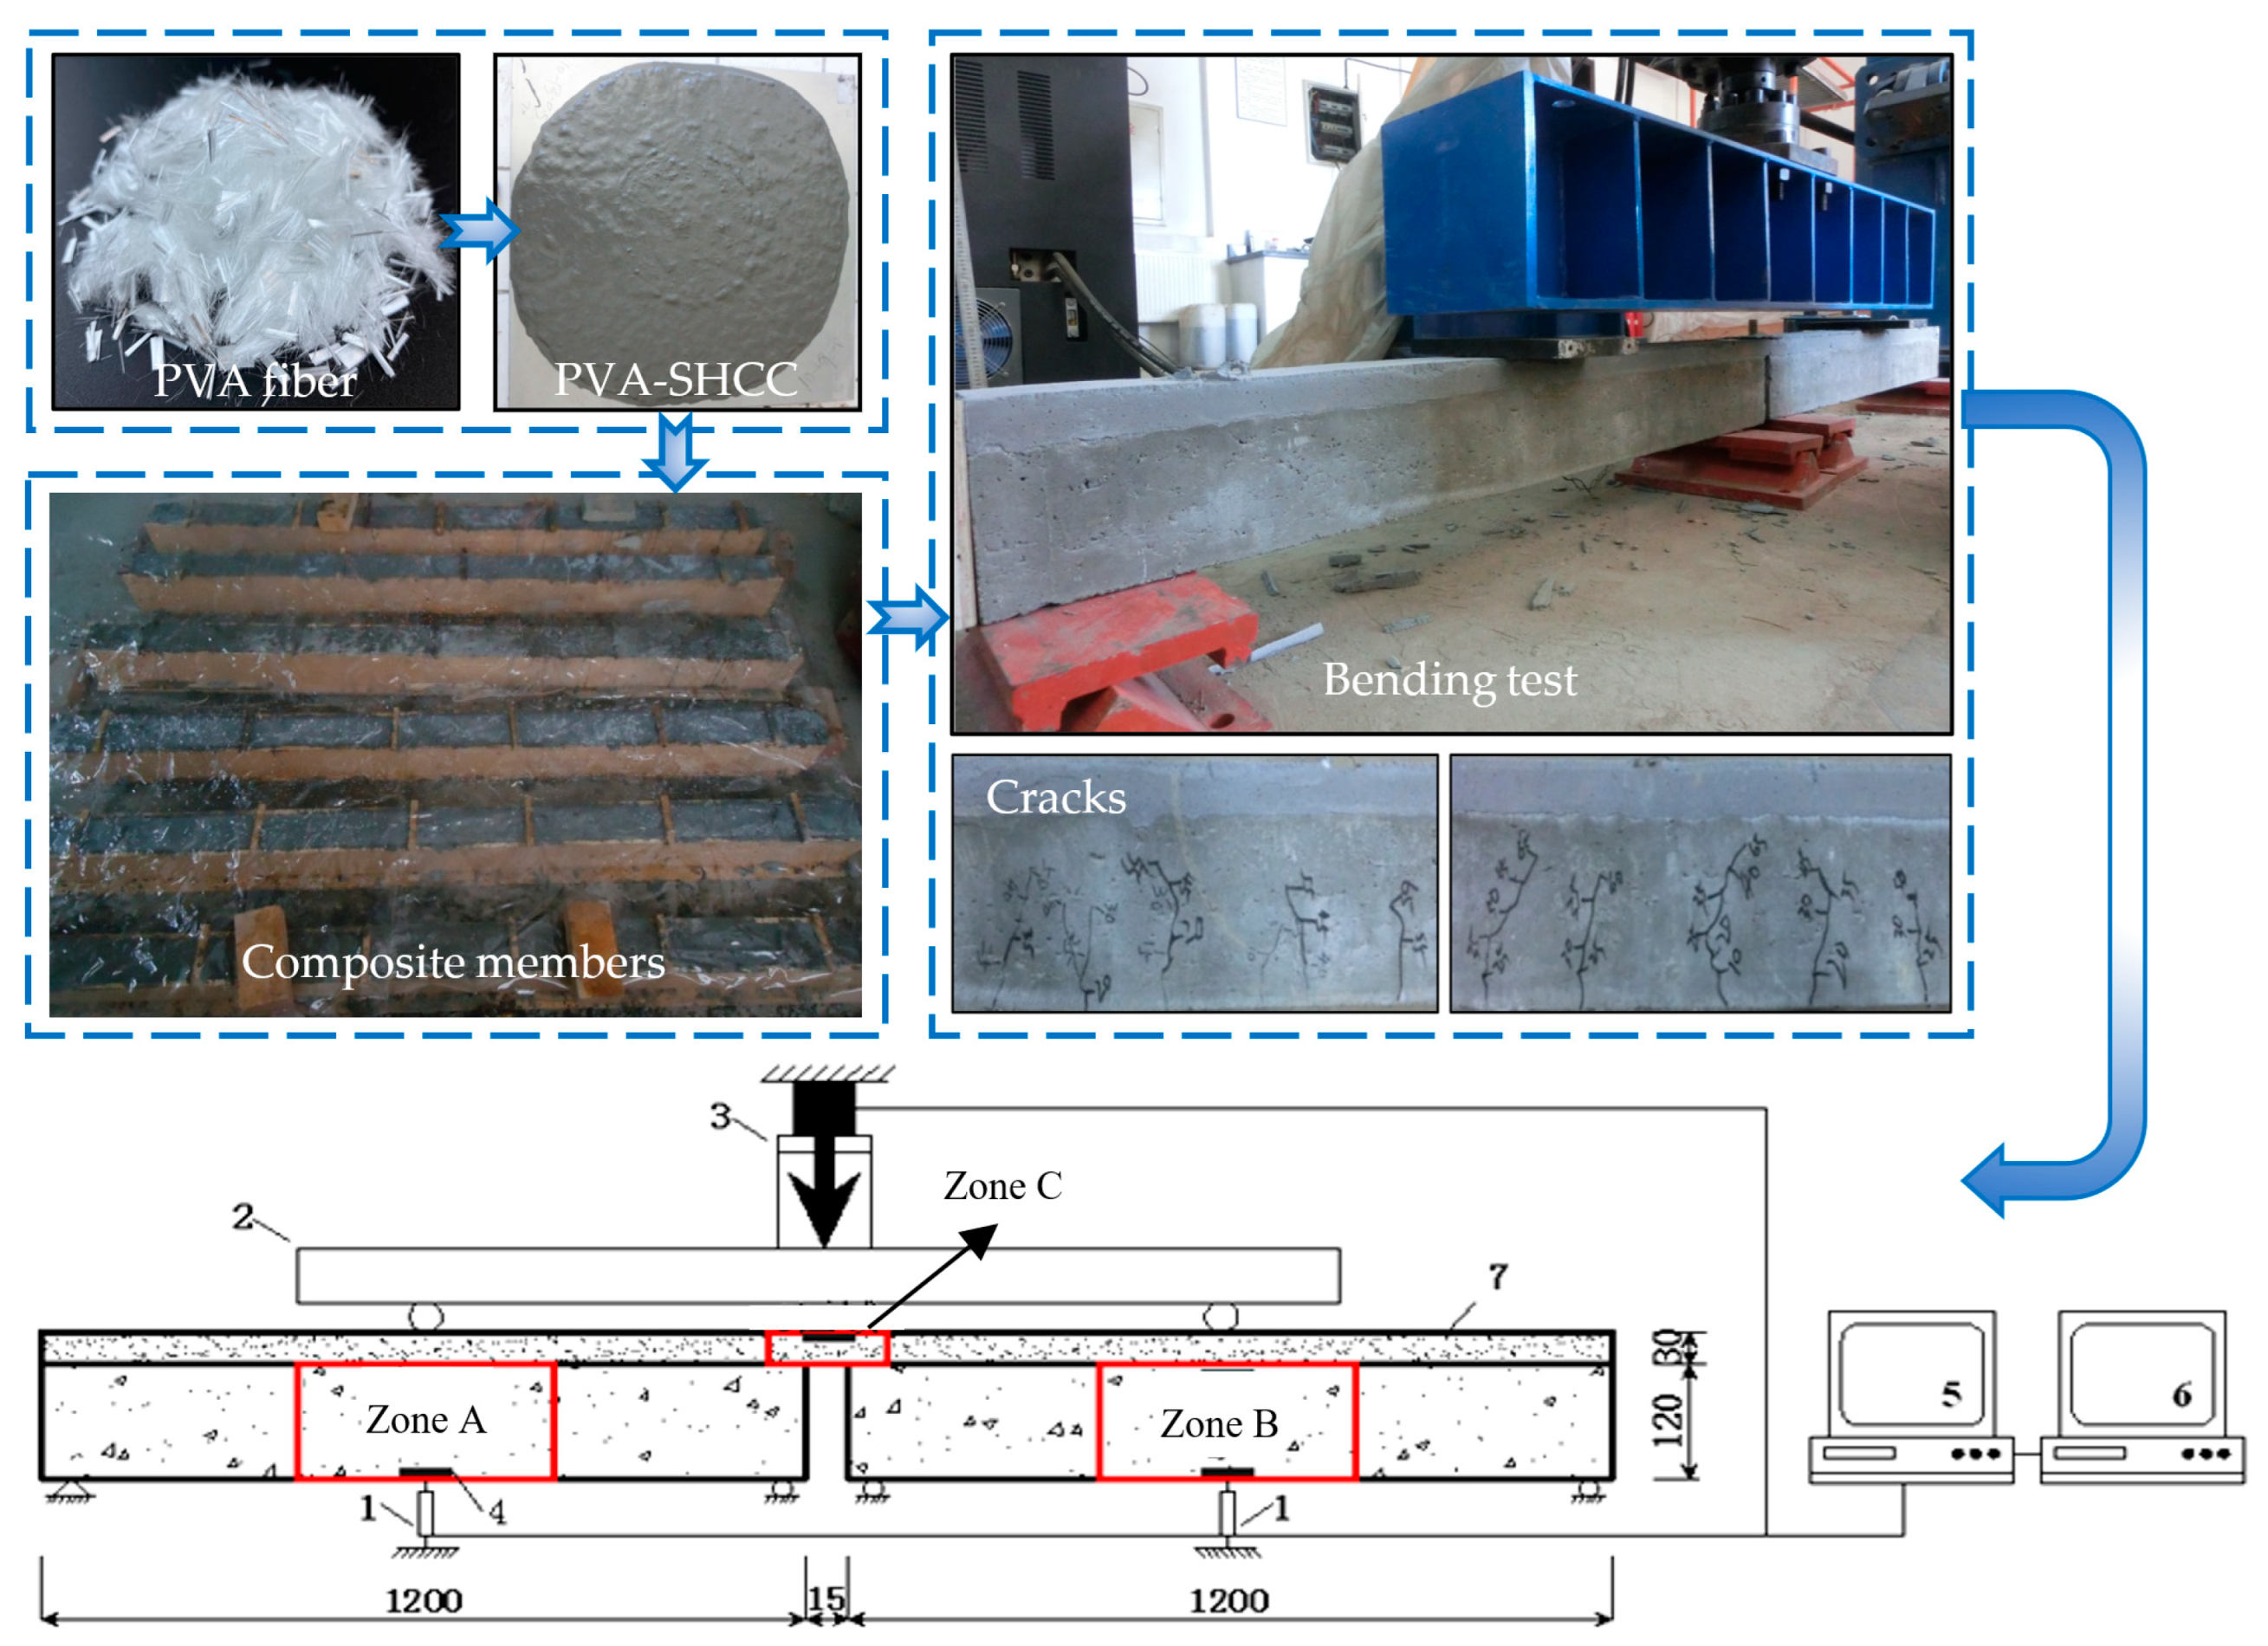
2.3. Experimental Investigation
2.3.1. Test Setup
2.3.2. Test Procedures
3. Results and Discussions
3.1. Load–Deflection Relationships
3.2. Ductility
3.3. Cracking and Ultimate Loads
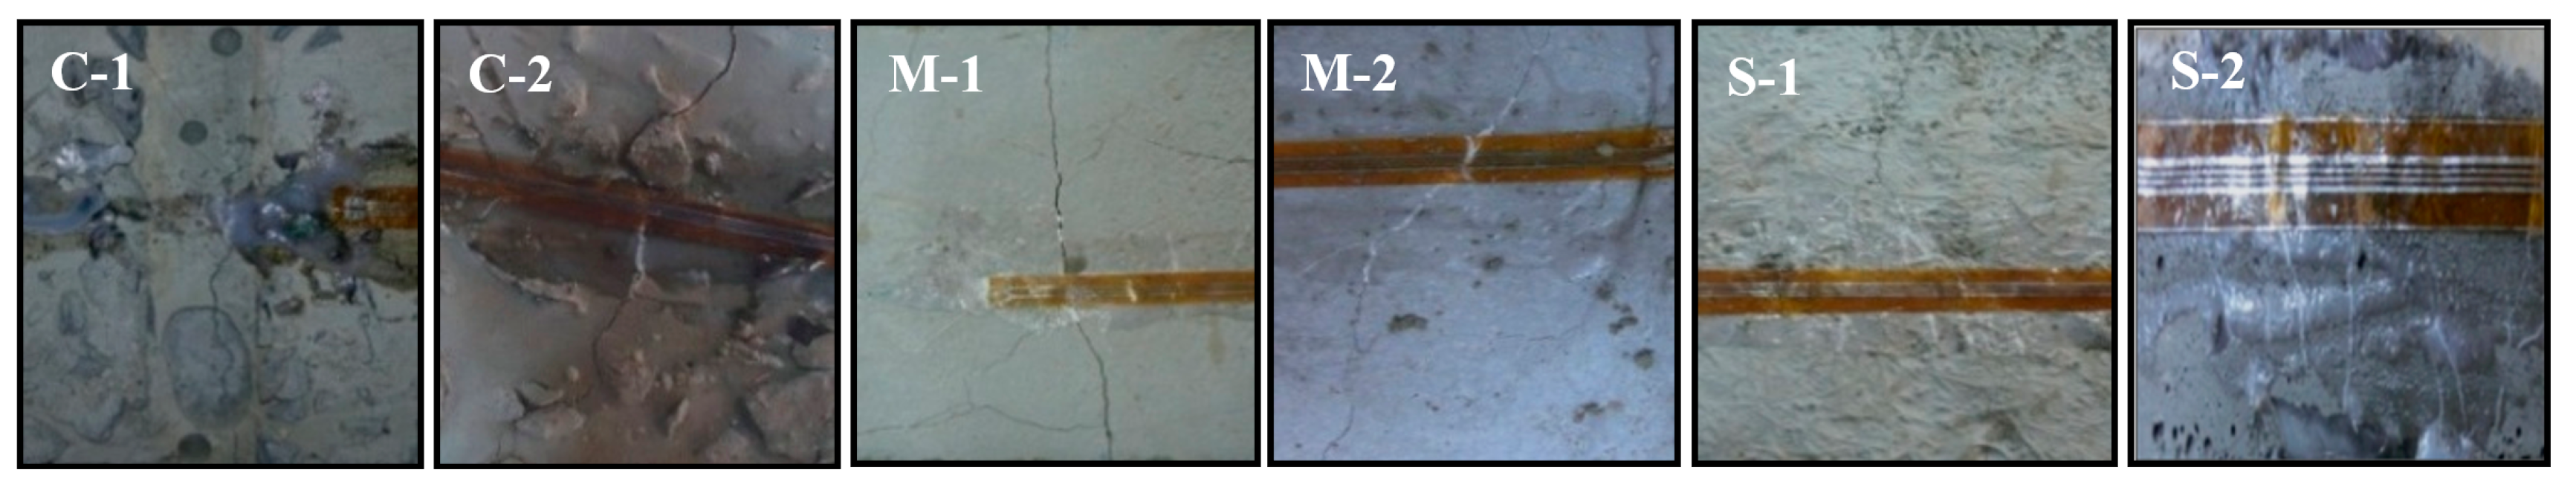
3.4. Cracks and Failure Modes
3.5. Cracking Characteristics of Jointless Link Slabs
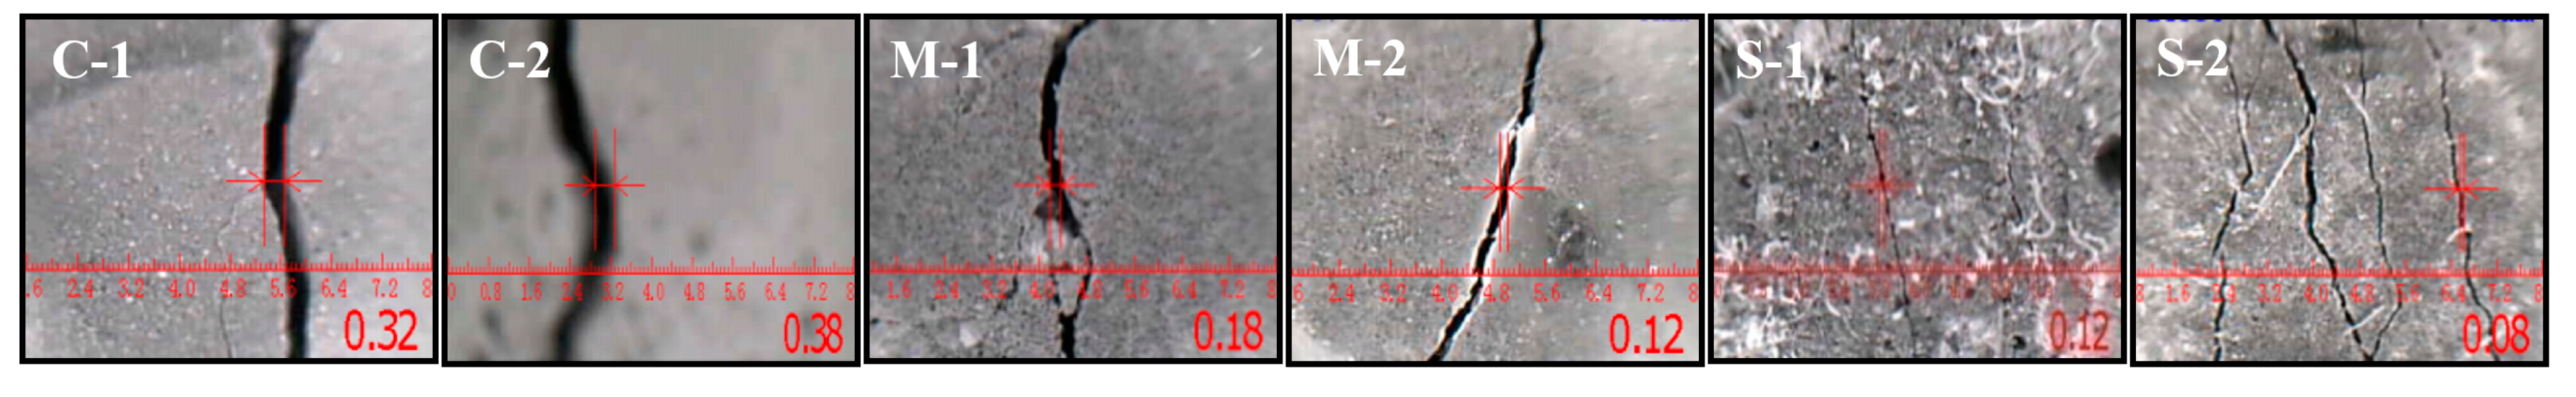
3.5.1. Descriptions of Cracks
3.5.2. Width and Depth of Cracks
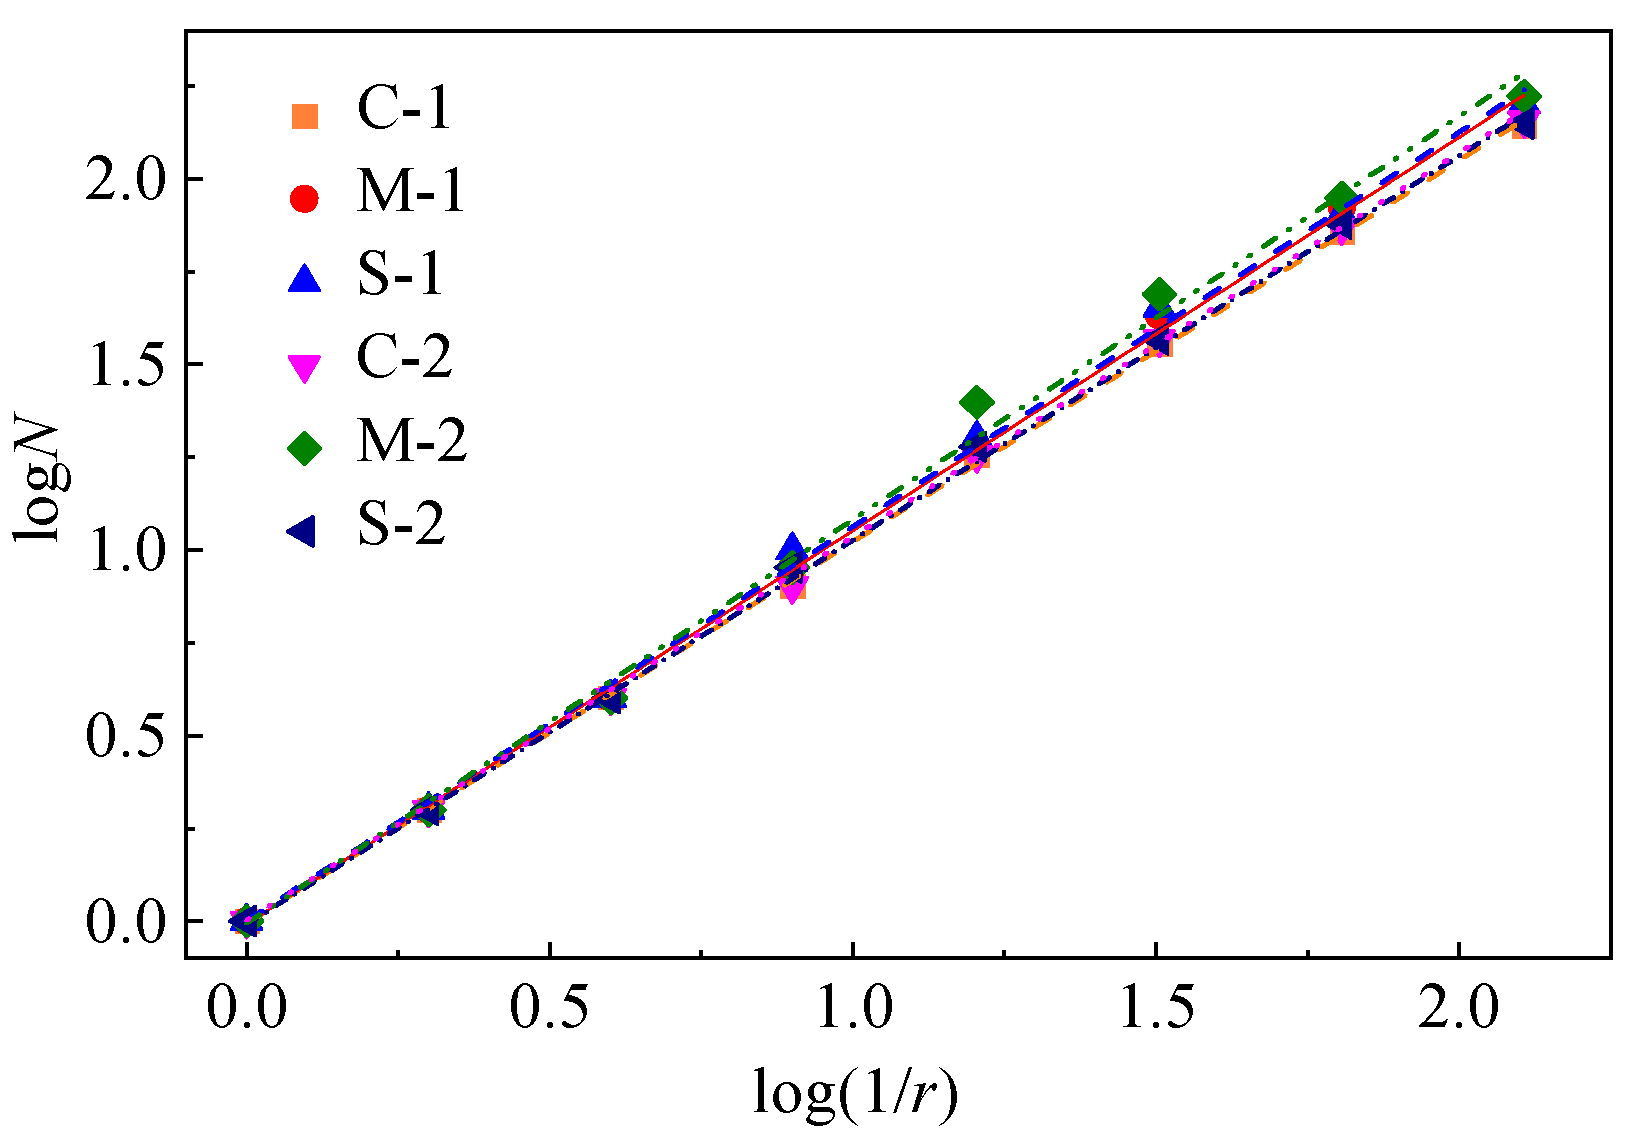
3.5.3. Fractal Characteristics of Cracks
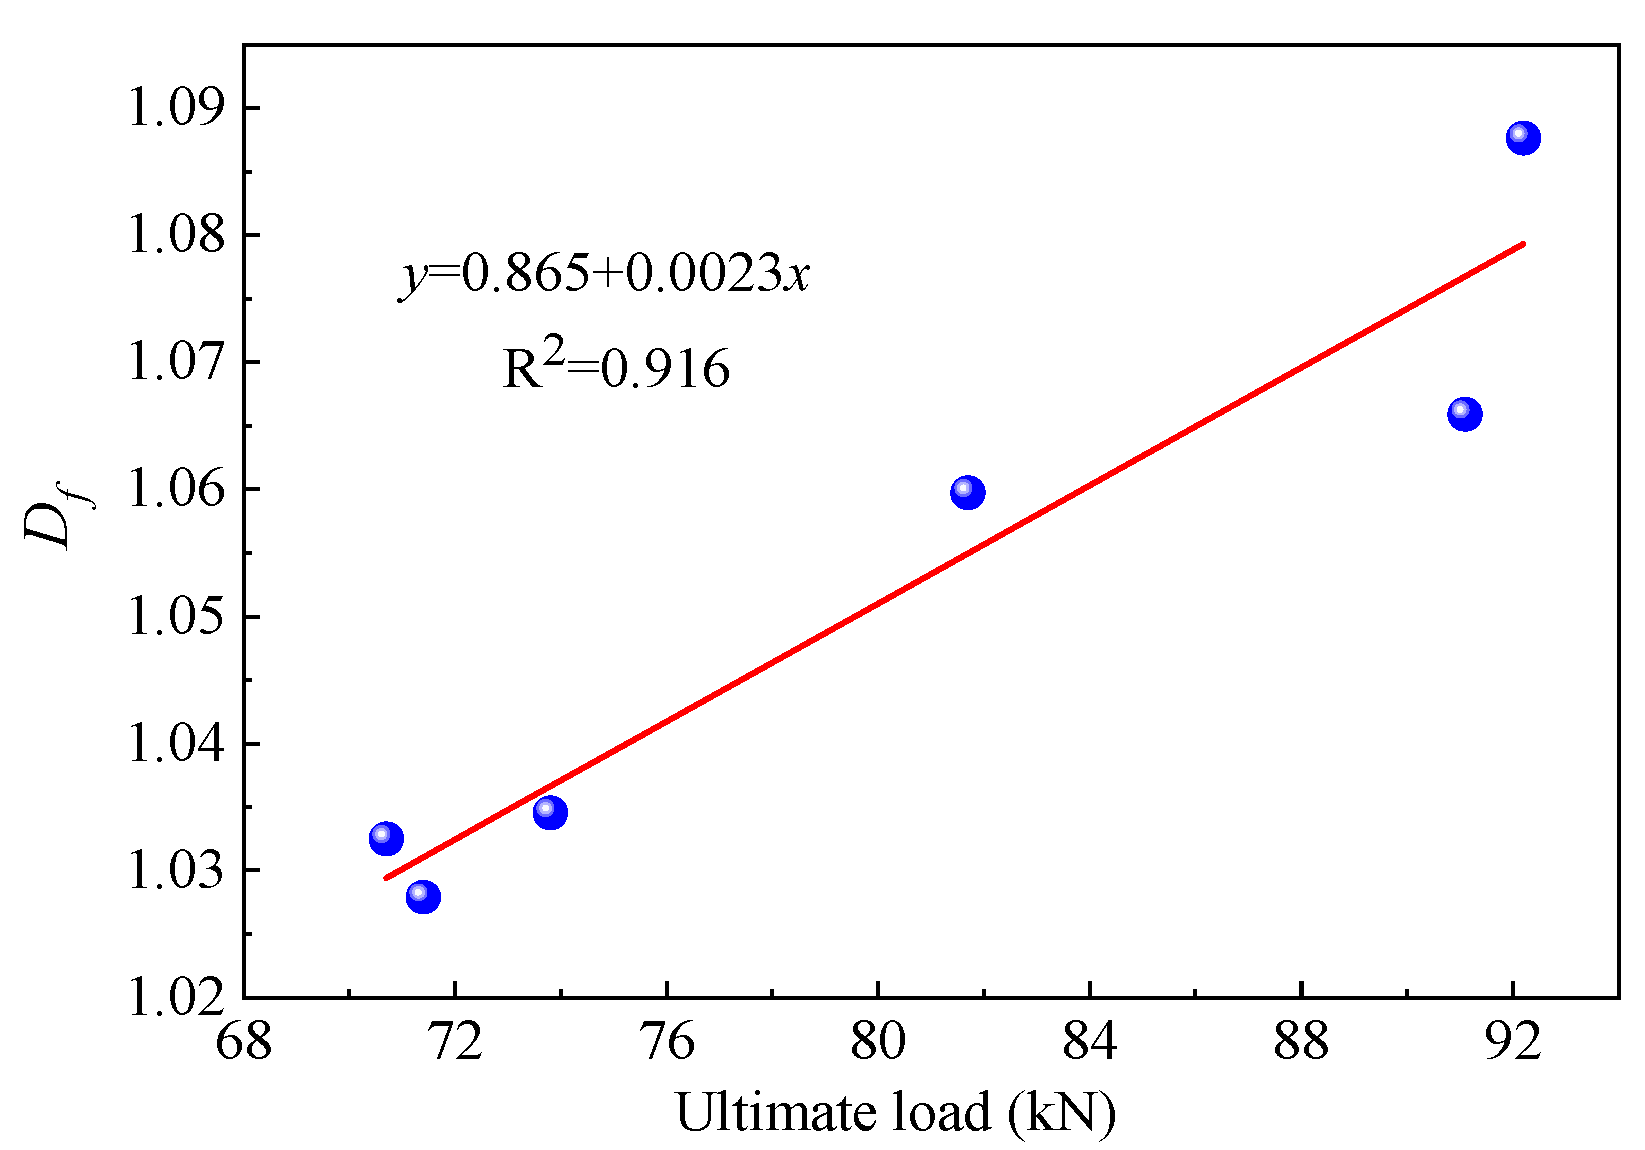
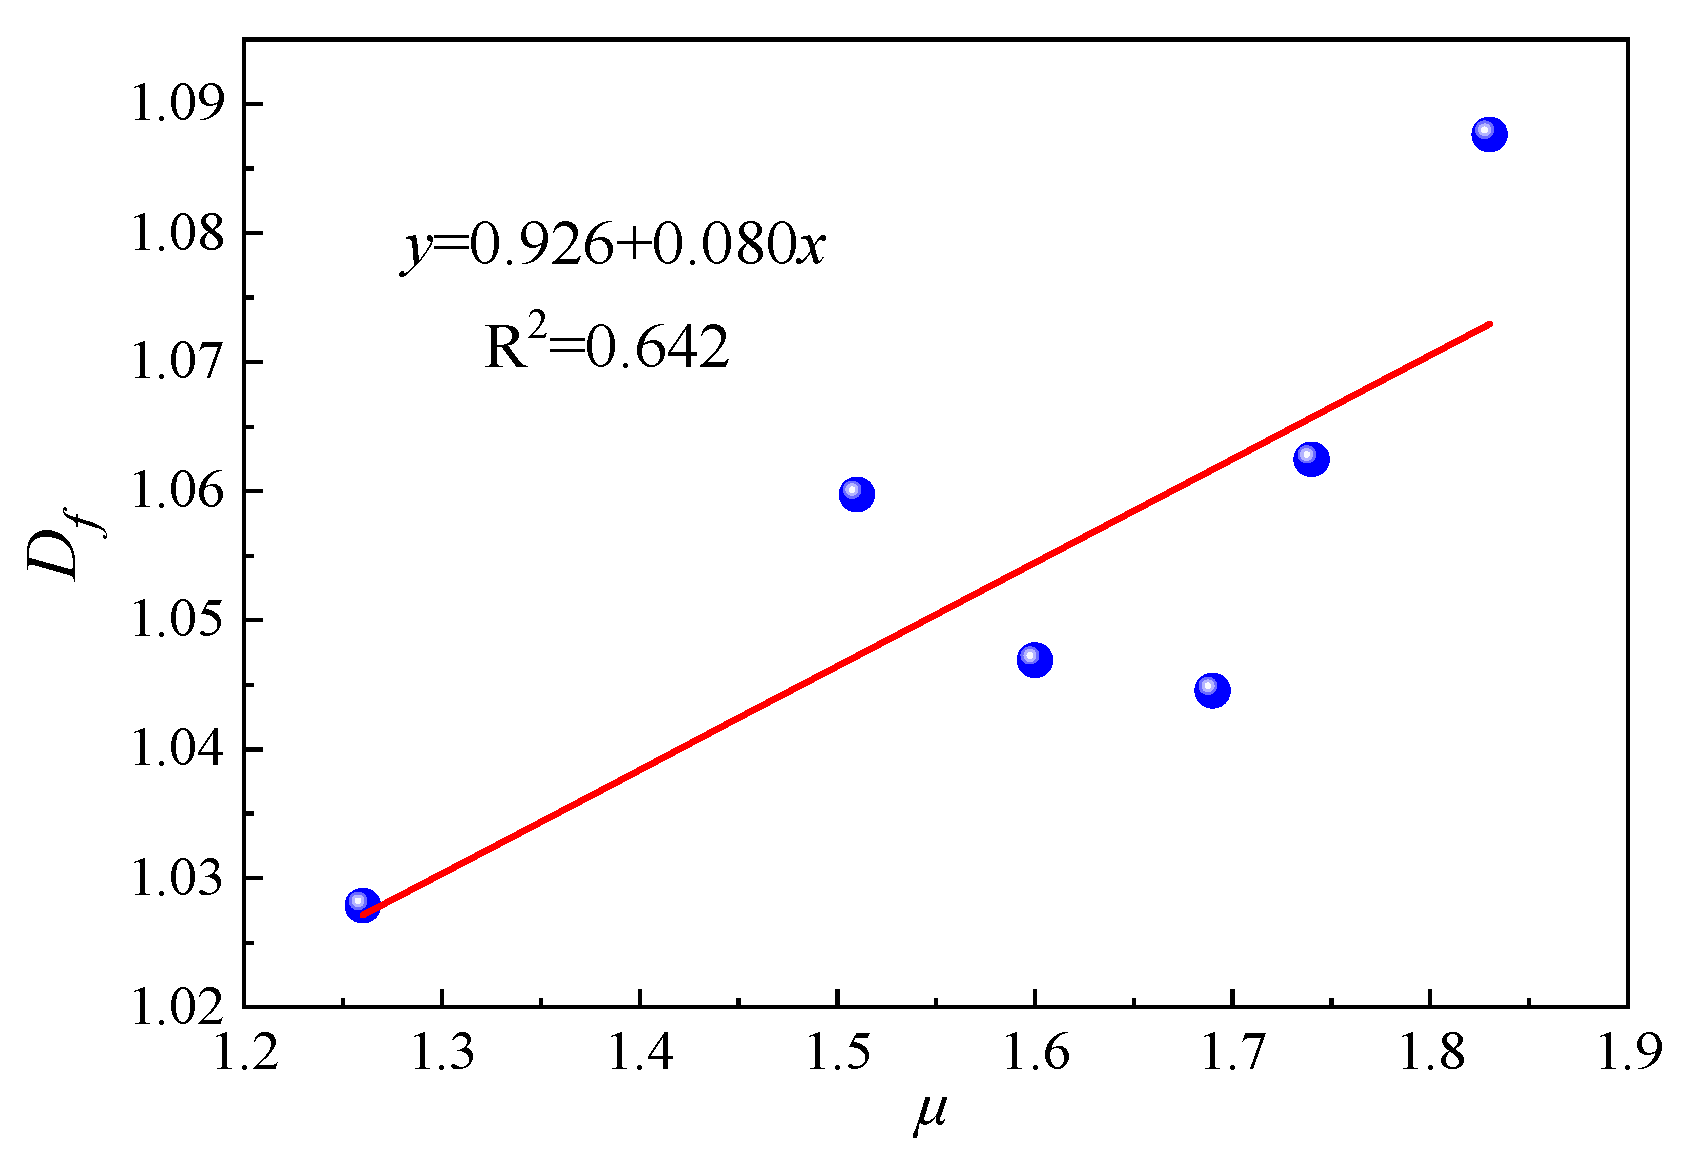
3.5.4. Relationships between Df and Bending Behavior
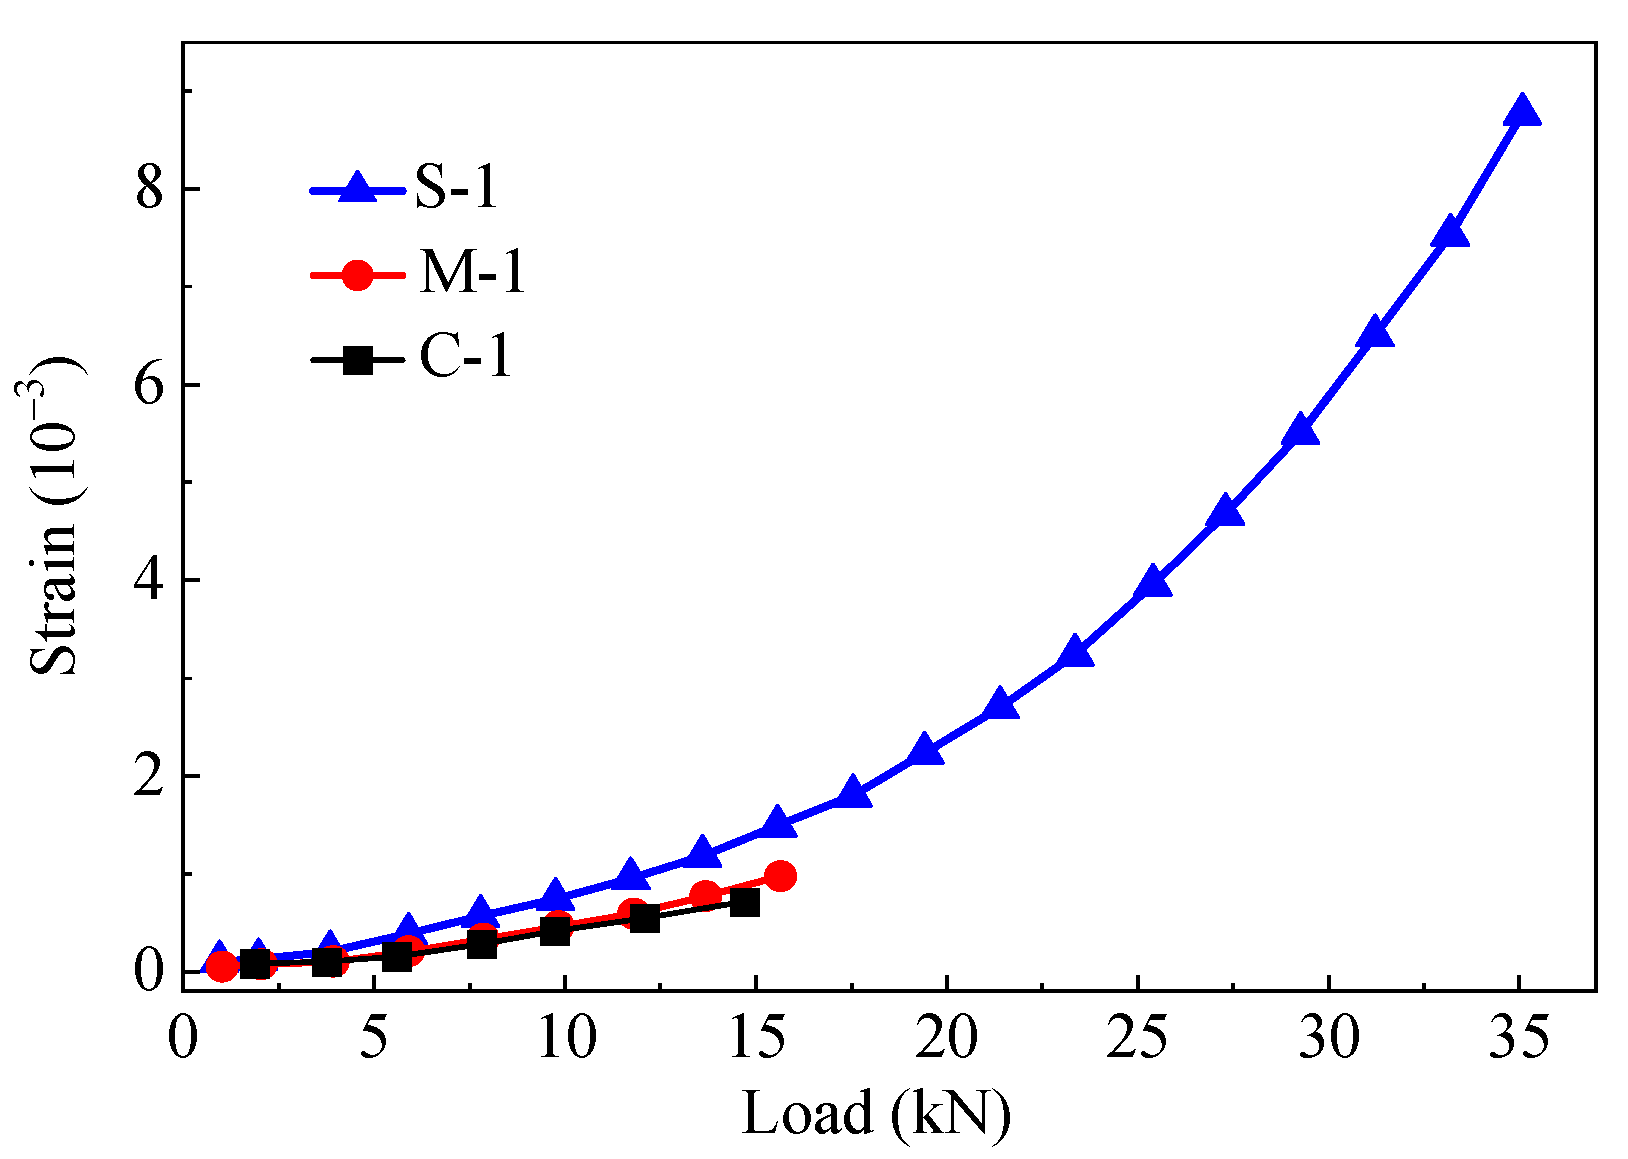
3.6. Distribution of Strain
4. Finite Element Analysis
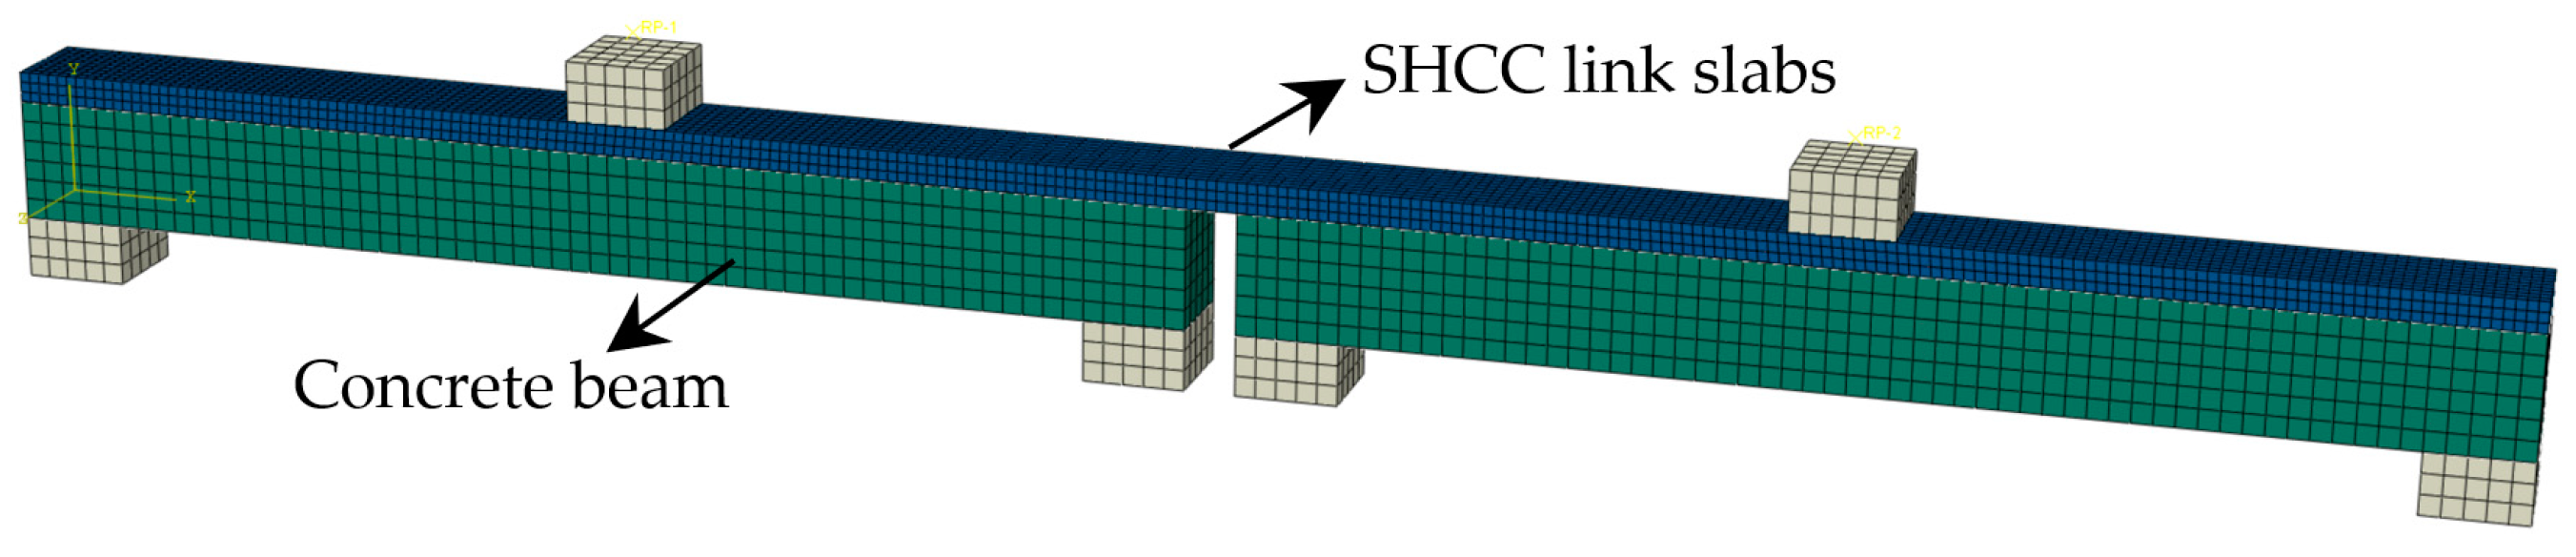
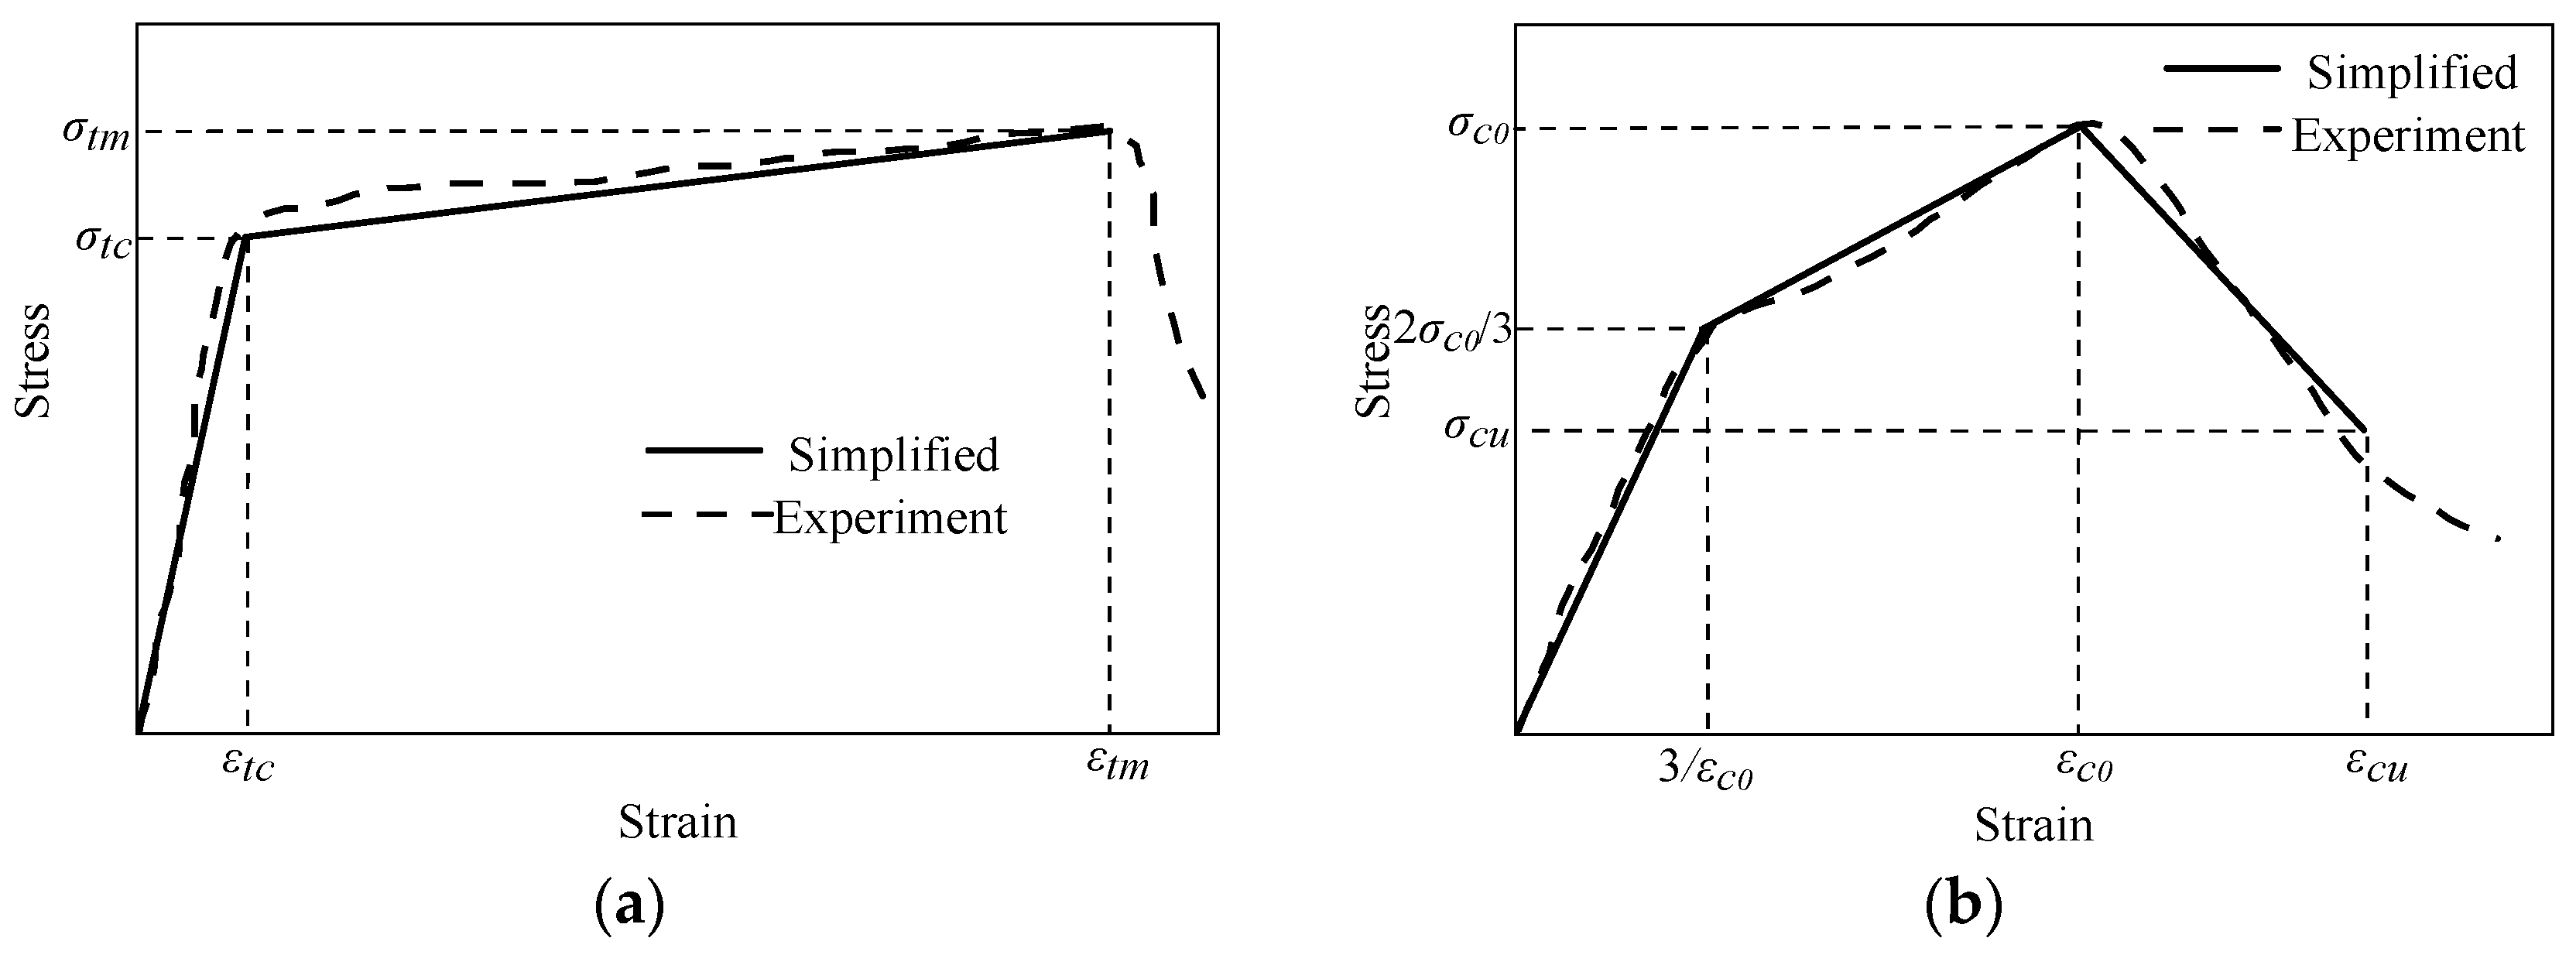
4.1. Finite Element Models
4.2. Convergence Study
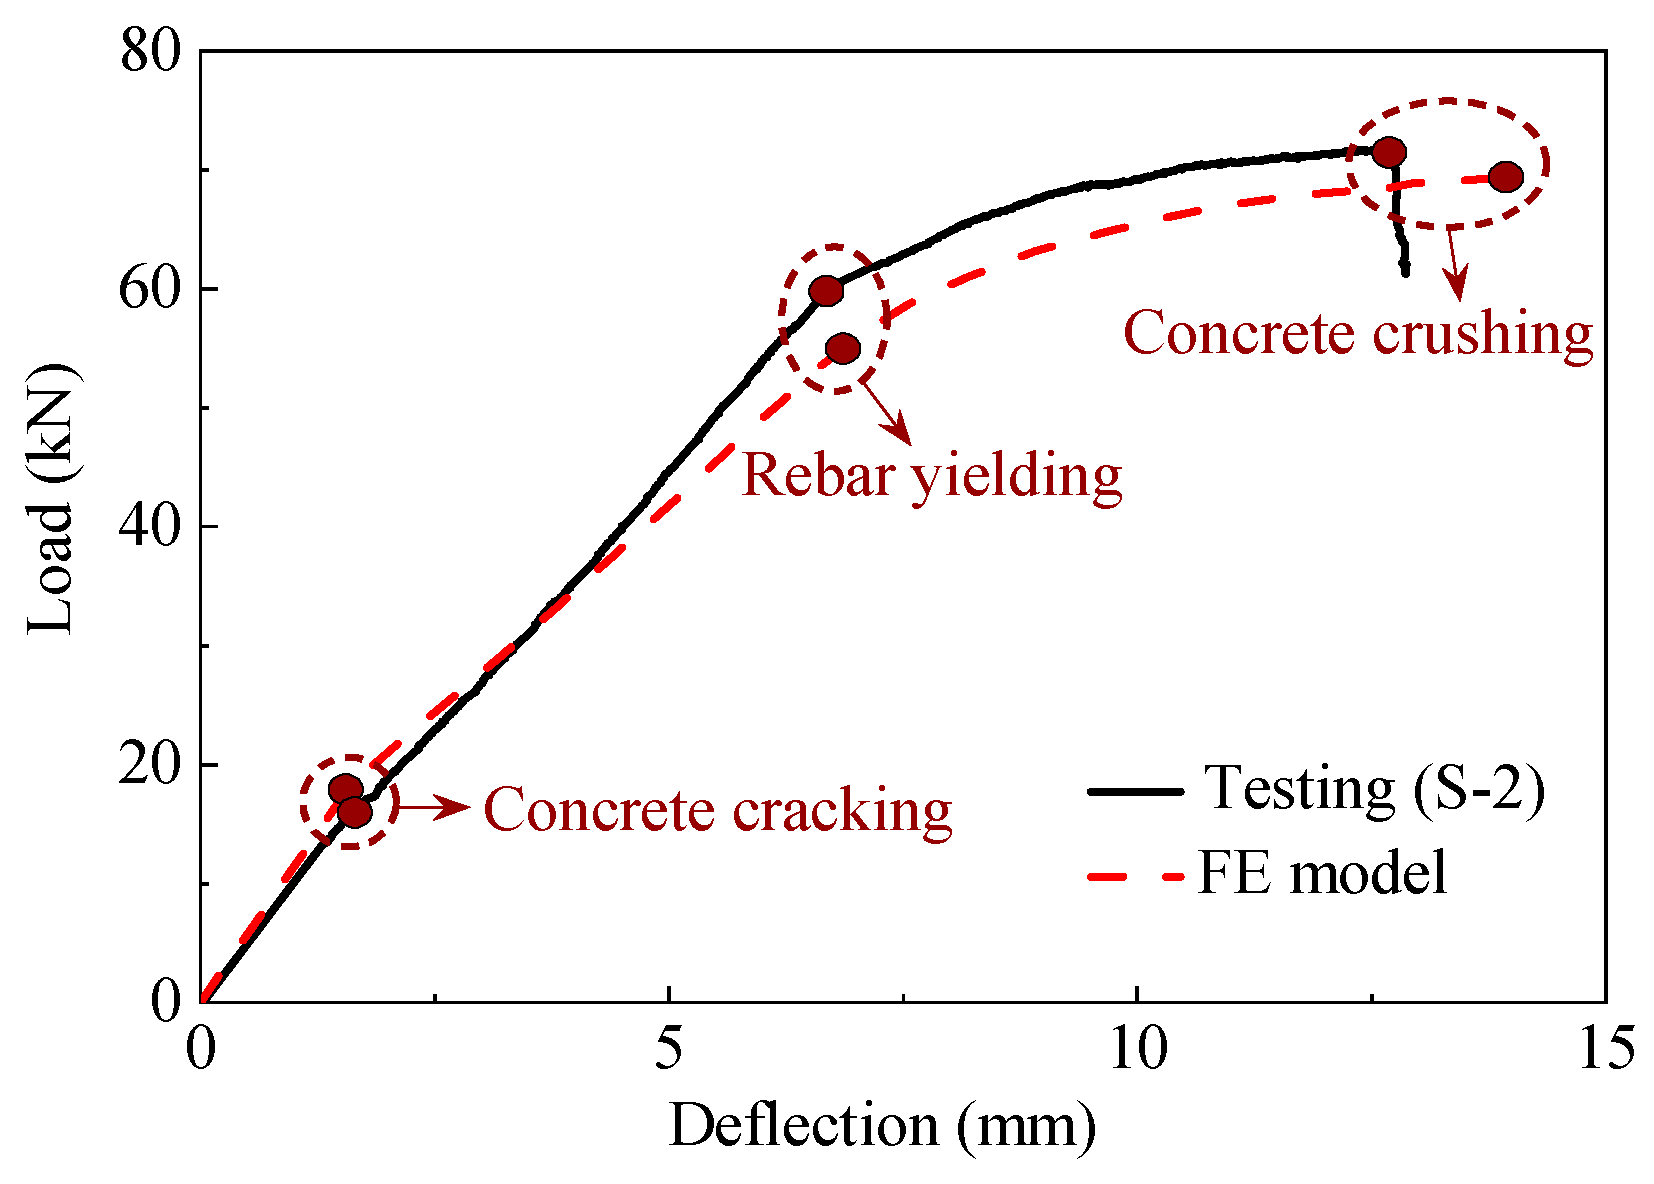
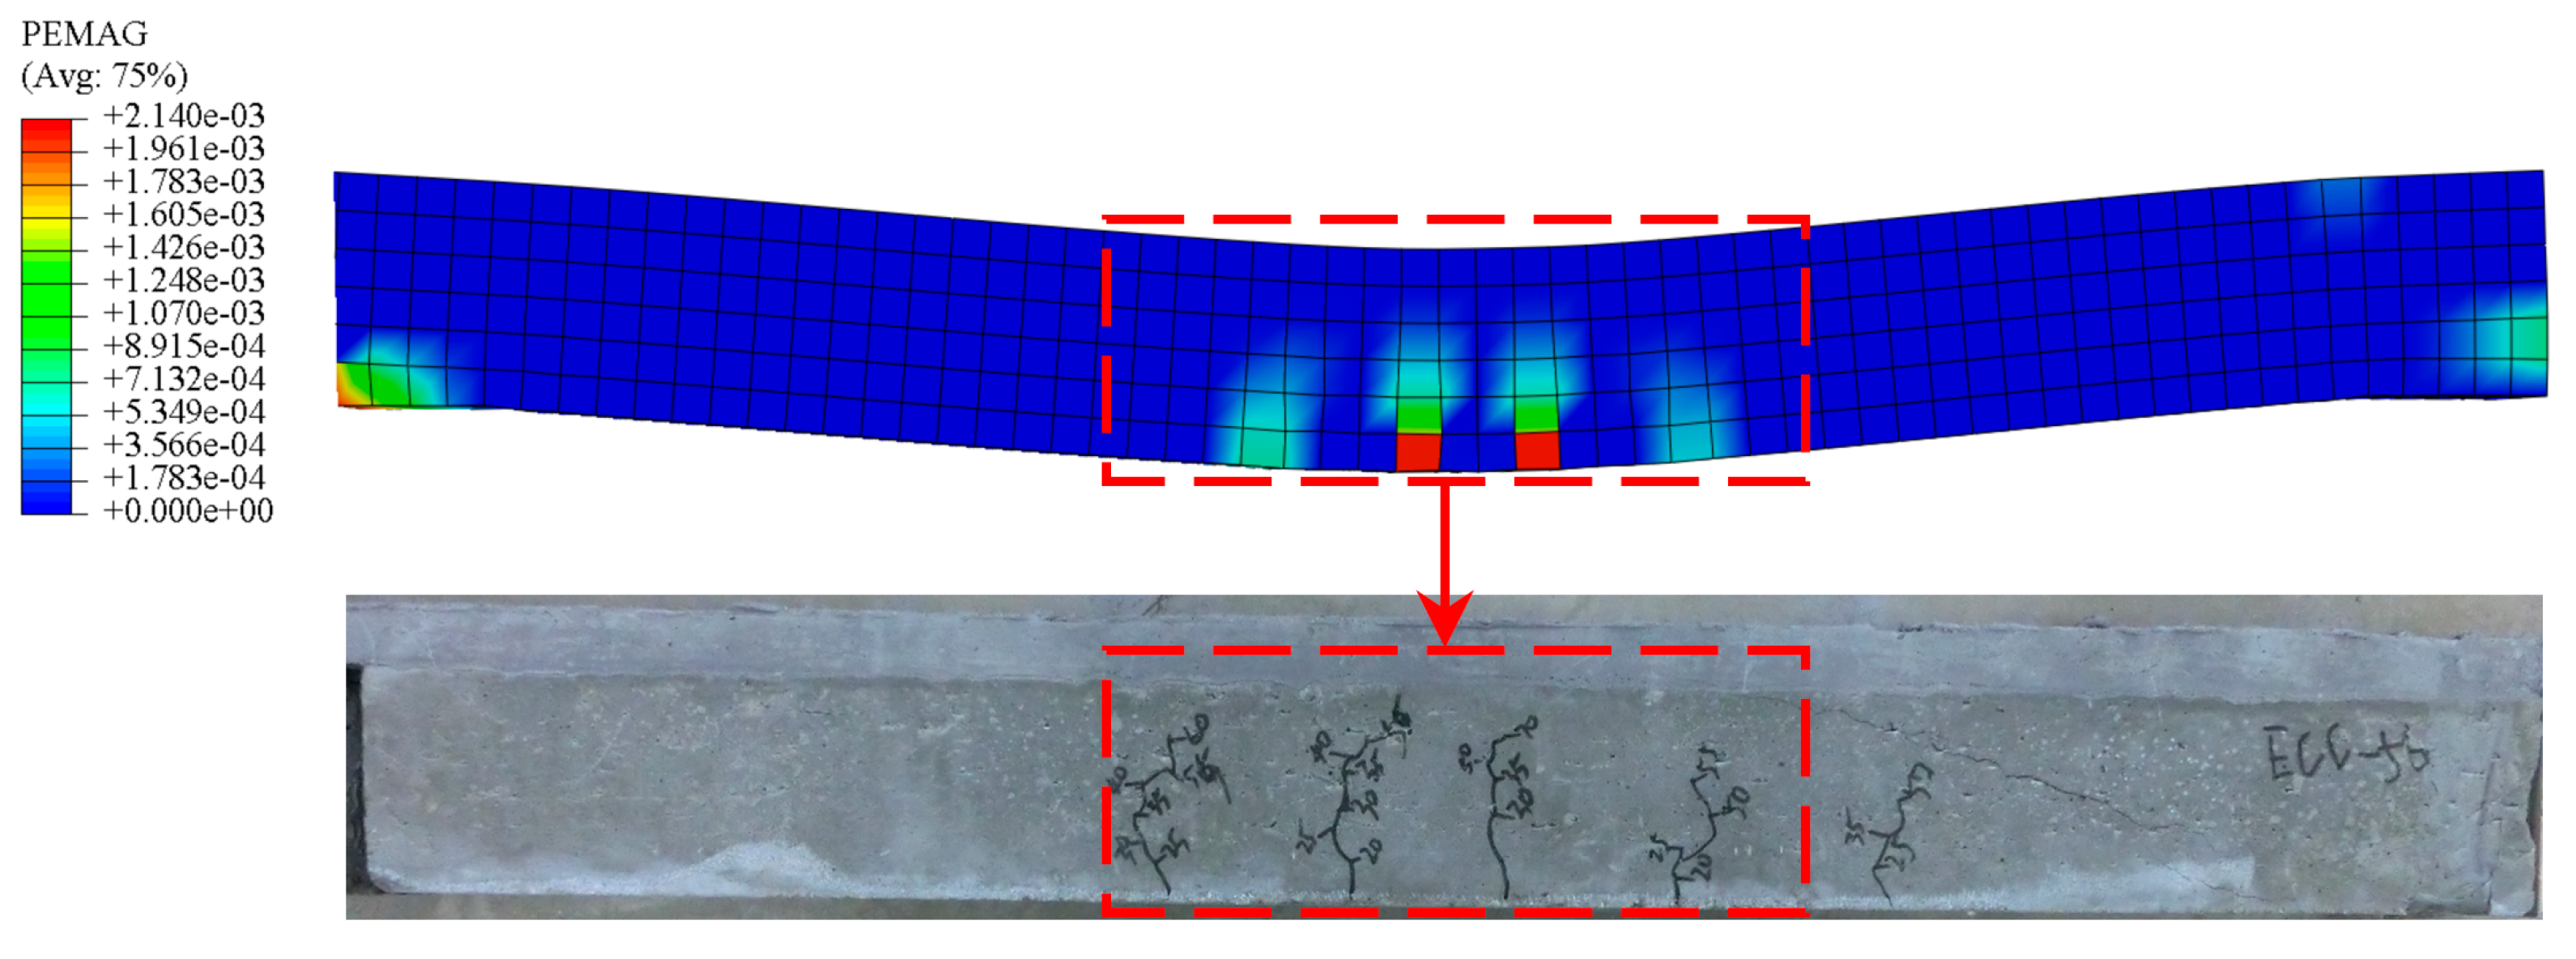
4.3. Comparisons between the Experimental and Modeling Results
4.4. Distributions of Stress and Strain in Beams
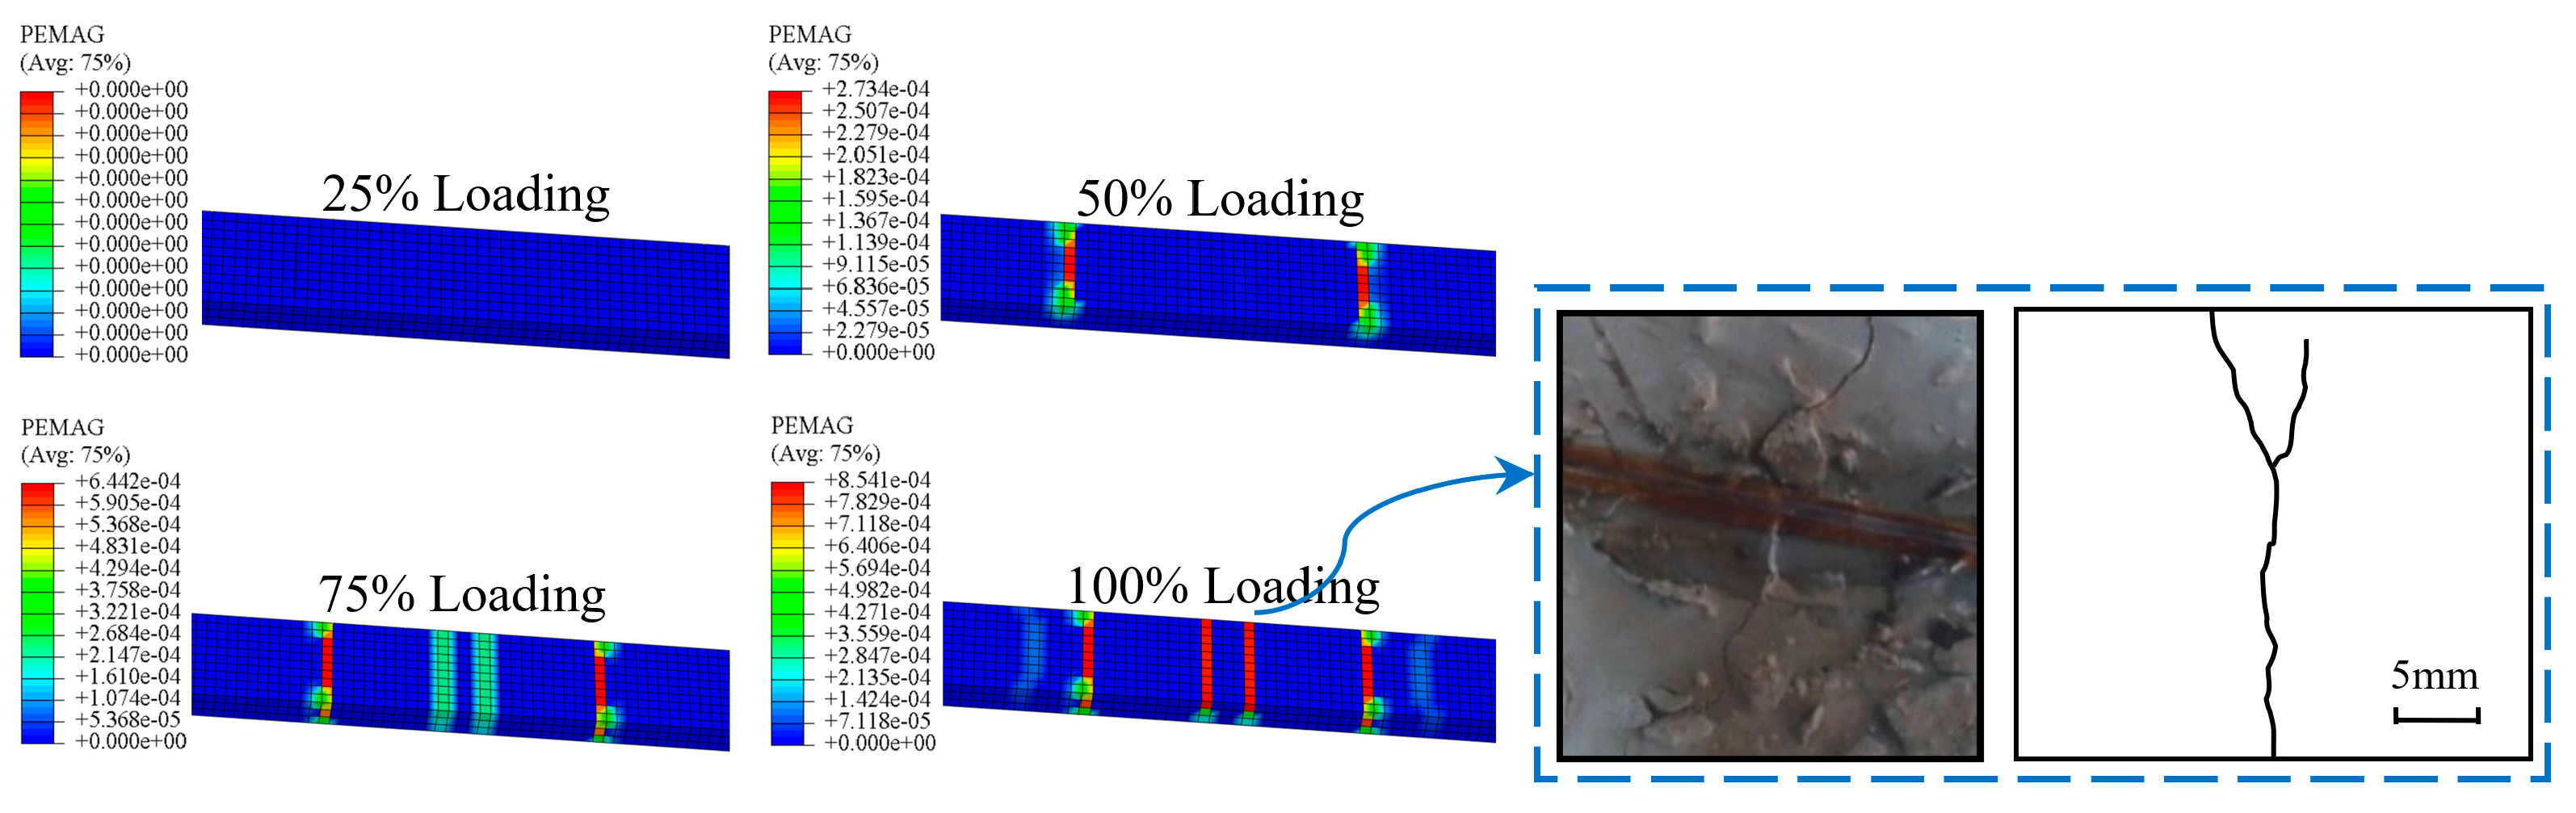
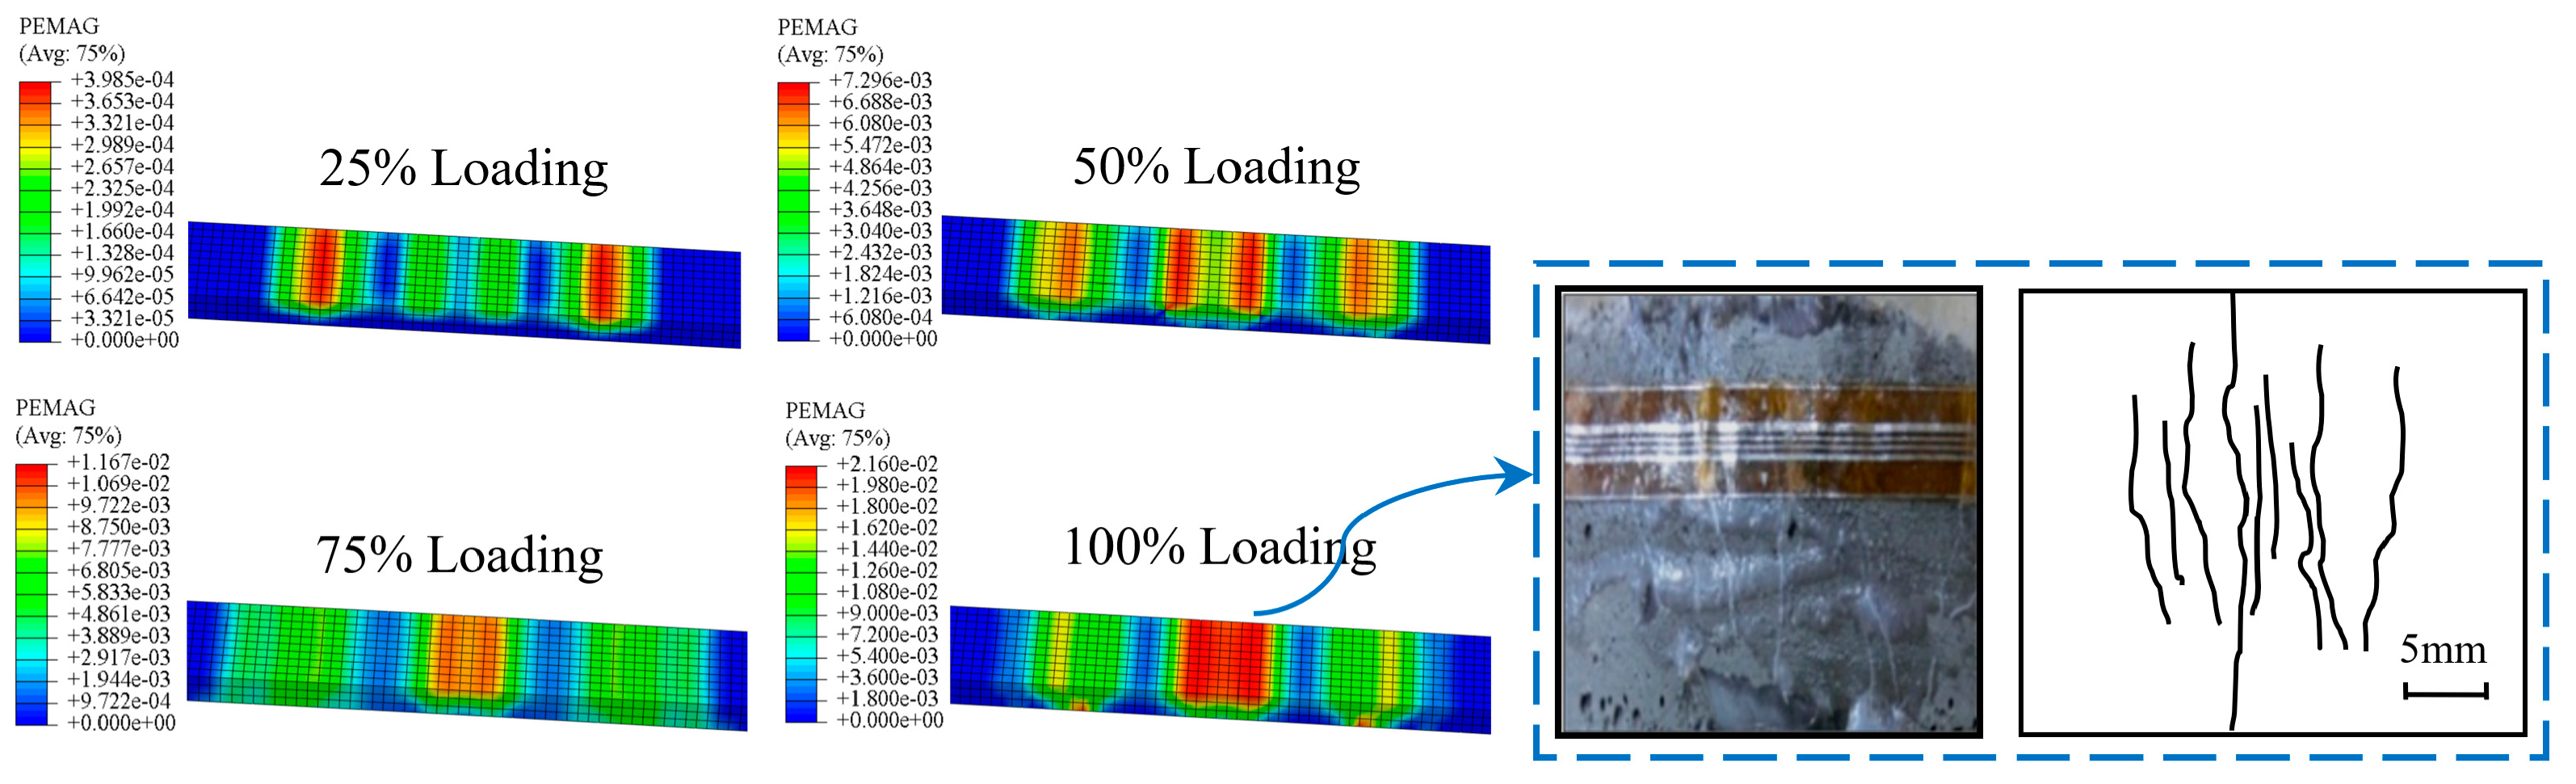
4.5. Distributions of Strain in Link Slabs
5. Conclusions
Author Contributions
Funding
Data Availability Statement
Conflicts of Interest
References
- Okeil, A.M.; ElSafty, A. Partial continuity in bridge girders with jointless decks. Pract. Period. Struct. 2005, 10, 229–238. [Google Scholar] [CrossRef]
- Val, D.V.; Stewart, M.G.; Melchers, R.E. Life-cycle performance of RC bridges: Probabilistic approach. Comput-Aided. Civ. Inf. 2000, 15, 14–25. [Google Scholar] [CrossRef]
- Kobayashi, K.; Ahn, D.L.; Rokugo, K. Effects of crack properties and water-cement ratio on the chloride proofing performance of cracked SHCC suffering from chloride attack. Cem. Concr. Compos. 2016, 69, 18–27. [Google Scholar] [CrossRef]
- Zhao, A.; Yang, J.; Yang, E. Self-cleaning engineered cementitious composites. Cem. Concr. Compos. 2015, 64, 74–83. [Google Scholar] [CrossRef]
- Moradi, M.; Valipour, H.; Foster, S.J.; Brad, M.A. Deconstructable steel-fibre reinforced concrete deck slabs with a transverse confining system. Mater. Des. 2016, 89, 1007–1019. [Google Scholar] [CrossRef]
- Lin, Y.; Yan, J.; Wang, Z.; Zou, C. Effects of steel fibers on failure mechanism of S-UHPC composite beams applied in the Arctic offshore structure. Ocean Eng. 2021, 234, 109302. [Google Scholar] [CrossRef]
- Li, V.C.; Leung, C.K.Y. Theory of steady state and multiple cracking of random discontinuous fiber reinforced brittle matrix composites. J. Eng. Mech. 1992, 118, 2246–2264. [Google Scholar] [CrossRef]
- Kanda, T.; Li, V.C. New micro-mechanics design theory for pseudo strain hardening cementitious composite. J. Eng. Mech. 1999, 125, 373–381. [Google Scholar] [CrossRef]
- Li, Z.; Lu, B.; Feng, J.; Zhao, H.; Qian, S.Z. Development of engineered cementitious composites/strain-hardening cementitious composites (ECC/SHCC) with waste granite fine powders. Constr. Build. Mater. 2023, 409, 133883. [Google Scholar] [CrossRef]
- Xu, S.; Wan, N.; Li, Q. Experimental study on the flexural performance of concrete beam strengthened with ultra high toughness cementitious composites. Chin. Civ. Eng. J. 2010, 43, 17–22. [Google Scholar] [CrossRef]
- Xu, S.; Xie, H.; Li, Q.; Hong, C.; Liu, J.; Wang, Q. Bending performance of RC slabs strengthened by CFRP sheets using sprayed UHTCC as bonding layer: Experimental study and theoretical analysis. Eng. Struct. 2023, 292, 116575. [Google Scholar] [CrossRef]
- Pan, Z.; Wu, C.; Liu, J. Study on mechanical properties of cost-effective polyvinyl alcohol engineered cementitious composites (PVA-ECC). Constr. Build. Mater. 2015, 78, 397–404. [Google Scholar] [CrossRef]
- Pan, Z.; Qiao, Z.; Si, D.; Shang, J. Experimental investigation and numerical simulation on uniaxial tensile behavior of hybrid PVA-ECC. Constr. Build. Mater. 2023, 398, 132517. [Google Scholar] [CrossRef]
- Zhang, S.; Liu, J.; Duan, S.; Du, L.; Zhang, Z.; Zhang, M.; Jiang, D.; Wu, X. Investigation into the strength and toughness of polyvinyl alcohol fiber-reinforced fly ash-based geopolymer composites. J. Build. Eng. 2024, 90, 109371. [Google Scholar] [CrossRef]
- Jun, P.; Mechtcherine, V. Behaviour of strain-hardening cement-based composites (SHCC) under monotonic and cyclic tensile loading: Part I-experimental investigations. Cem. Concr. Compos. 2010, 32, 801–809. [Google Scholar] [CrossRef]
- Mechtcherine, V.; Millon, O.; Butler, M.; Thoma, K. Mechanical behaviour of strain-hardening cement-based composites under impact loading. Cem. Concr. Compos. 2011, 33, 1–11. [Google Scholar] [CrossRef]
- Altmann, F.; Sickert, J.U.; Mechtcherine, V.; Kaliske, M. A fuzzy-probabilistic durability concept for strain-hardening cement-based composites (SHCC) exposed to chlorides: Part II-Application example. Cem. Concr. Compos. 2012, 34, 763–770. [Google Scholar] [CrossRef]
- Paul, S.C.; Pirskawetz, S.; van Zijl, G.P.A.G.; Schmidt, W. Acoustic emission for characterising the crack propagation in strain-hardening cement-based composites (SHCC). Cem. Concr. Res. 2015, 69, 19–24. [Google Scholar] [CrossRef]
- Hou, L.; Zhou, B.; Guo, S.; Aslani, F.; Chen, D. Corrosion behavior and flexural performance of reinforced concrete/ultrahigh toughness cementitious composite (RC/UHTCC) beams under sustained loading and shrinkage cracking. Constr. Build. Mater. 2019, 198, 278–287. [Google Scholar] [CrossRef]
- Zhang, C.; Guan, X.; Tian, J.; Li, Y.; Lyu, J.J. Corrosion resistance of RC/UHTCC beams with various healing promoters in marine environment. Cem. Concr. Compos. 2022, 131, 104604. [Google Scholar] [CrossRef]
- Lepech, M.; Li, V.C. Design and field demonstration of ECC link slabs for jointless bridge decks. In Proceedings of the ConMat’05, Vancouver, BC, Canada, 22–24 August 2005; Available online: https://acemrl.engin.umich.edu/wp-content/uploads/sites/412/2018/10/15-Design-And-Field-Demonstration-Of-ECC-Link-Slabs-For-Jointless-Bridge-Decks.pdf (accessed on 15 October 2018).
- Lepech, M.; Li, V.C. Application of ECC for bridge deck link slabs. Mater. Struct. 2009, 42, 1185–1195. [Google Scholar] [CrossRef]
- Hisseine, O.A.; Tagnit-Hamou, A. Shear-bond behavior of nanocellulose-modified SHCC composite slabs: Translating material-level capacity into improved structural performance. Eng. Struct. 2023, 291, 116394. [Google Scholar] [CrossRef]
- Kim, Y.Y.; Fischer, G.; Li, V.C. Performance of bridge deck link slabs designed with ductile ECC. ACI Struct. J. 2004, 101, 792–801. [Google Scholar] [CrossRef]
- Qian, S.; Zhou, J.; Rooij, M.R.de.; Schlangen, E.; Ye, G.; van Breugel, K. Self-healing behavior of strain-hardening cementitious composites incorporating local waste materials. Cem. Concr. Compos. 2009, 31, 613–621. [Google Scholar] [CrossRef]
- He, S.; Mustafa, S.; Chang, Z.; Liang, M.; Schlangen, E.; Lukovi’c, M. Ultra-thin strain hardening cementitious composite (SHCC) layer in reinforced concrete cover zone for crack width control. Eng. Struct. 2023, 292, 116584. [Google Scholar] [CrossRef]
- Liu, B.; Lu, W. Surrogate models in machine learning for computational stochastic multi-scale modelling in composite materials design. Int. J. Hydromechatron. 2022, 5, 336–365. [Google Scholar] [CrossRef]
- Du, H.; Du, S.; Li, W. Probabilistic time series forecasting with deep non-linear state space models. CAAI Trans. Intell. Technol. 2023, 8, 3–13. [Google Scholar] [CrossRef]
- Mahjoubi, S.; Barhemat, R.; Guo, P.; Meng, W.; Bao, Y. Prediction and multi-objective optimization of mechanical, economical, and environmental properties for strain-hardening cementitious composites (SHCC) based on automated machine learning and metaheuristic algorithms. J. Clean. Prod. 2021, 329, 129665. [Google Scholar] [CrossRef]
- Malik, U.J.; Khokhar, S.A.; Hammad, M.; Khushnood, R.A.; Najam, F.A.; Ali, F.; Shahid, M. ANN-based predictive mimicker for the constitutive model of engineered cementitious composites (ECC). Constr. Build. Mater. 2024, 420, 135530. [Google Scholar] [CrossRef]
- Altayeb, M.; Wang, X.; Musa, T.H. An ensemble method for predicting the mechanical properties of strain hardening cementitious composites. Constr. Build. Mater. 2021, 286, 122807. [Google Scholar] [CrossRef]
- Guo, P.; Meng, W.; Bao, Y. Intelligent characterization of complex cracks in strain-hardening cementitious composites based on generative computer vision. Constr. Build. Mater. 2024, 411, 134812. [Google Scholar] [CrossRef]
- Xu, K.; Jin, Q.; Li, J.; Ushizima, D.M.; Li, V.C.; Kurtis, K.E.; Monteiro, P.J.M. In-situ microtomography image segmentation for characterizing strain-hardening cementitious composites under tension using machine learning. Cem. Concr. Res. 2023, 169, 107164. [Google Scholar] [CrossRef]
- ACI 237R-07; Self-Consolidating Concrete. American Concrete Institute, Farmington Hills: Farmington Hills, MI, USA, 2019. Available online: https://www.concrete.org/store/productdetail.aspx?ItemID=23707&Format=DOWNLOAD&Language=English&Units=US_AND_METRIC (accessed on 1 September 2021).
- ACI 544.1R-96; Report on Fiber Reinforced Concrete. American Concrete Institute, Farmington Hills: Farmington Hills, MI, USA, 2009. Available online: https://www.concrete.org/store/productdetail.aspx?ItemID=544196&Format=DOWNLOAD&Language=English&Units=US_AND_METRIC (accessed on 1 September 2021).
- Kim, N.S.; Lee, J.H.; Chang, S.P. Equivalent multi-phase similitude law for pseudodynamic test on small scale reinforced concrete models. Eng. Struct. 2009, 31, 834–846. [Google Scholar] [CrossRef]
- ACI 343R-95; Analysis and Design of Reinforced Concrete Bridge Structures. American Concrete Institute, Farmington Hills: Farmington Hills, MI, USA, 2004. Available online: https://www.concrete.org/store/productdetail.aspx?ItemID=34395&Format=DOWNLOAD&Language=English&Units=US_AND_METRIC (accessed on 1 September 2021).
- Lin, H.; Chang, S. Forced responses of cracked cantilever beams subjected to a concentrated moving load. Int. J. Mech. Sci. 2006, 48, 1456–1463. [Google Scholar] [CrossRef]
- Nikkhoo, A.; Banihashemi, S.; Kiani, K. On non-stationary response of cracked thin rectangular plates acted upon by a moving random force. Sci. Iran. Trans. A. 2023, 30, 860–876. [Google Scholar] [CrossRef]
- ACI 437.2-13; Code Requirements for Load Testing of Existing Concrete Structures and Commentary. American Concrete Institute, Farmington Hills: Farmington Hills, MI, USA, 2013. Available online: https://www.concrete.org/store/productdetail.aspx?ItemID=4372U13&Format=DOWNLOAD&Language=English&Units=US_Units (accessed on 1 September 2021).
- Fantilli, A.P.; Chiaia, B.; Gorino, A. Fiber volume fraction and ductility index of concrete beams. Cem. Concr. Compos. 2016, 65, 139–149. [Google Scholar] [CrossRef]
- Yoo, D.Y.; Banthia, N. High-performance strain-hardening cementitious composites with tensile strain capacity exceeding 4%: A review. Cem. Concr. Compos. 2022, 125, 104325. [Google Scholar] [CrossRef]
- Erdem, S.; Blankson, M.A. Fractal-fracture analysis and characterization of impact-fractured surfaces in different types of concrete using digital image analysis and 3D nano-map laser profilometery. Constr. Build. Mater. 2013, 40, 70–76. [Google Scholar] [CrossRef]
- Liu, Y.; Dai, K.; Li, D.; Luo, M.; Liu, Y.; Shi, Y.; Xu, J.; Huang, Z. Structural performance assessment of concrete components based on fractal information of cracks. J. Build. Eng. 2021, 43, 103147. [Google Scholar] [CrossRef]
- Wei, J.; Liu, H.; Leung, C.K.Y. Application of high-strength strain-hardening cementitious composites (SHCC) in the design of novel inter-module joint. Constr. Build. Mater. 2022, 359, 129491. [Google Scholar] [CrossRef]
- Ji, J.; He, L.; Jiang, L.; Zhang, Y.; Liu, Y.; Li, Y.; Zhang, Z. Numerical study on the axial compression behavior of composite columns with steel tube SHCC flanges and honeycombed steel web. Eng. Struct. 2023, 283, 115883. [Google Scholar] [CrossRef]
- Zhang, J.; Wang, Z.; Ju, X.; Shi, Z. Simulation of flexural performance of layered ECC-concrete composite beam with fracture mechanics model. Eng. Fract. Mech. 2014, 131, 419–438. [Google Scholar] [CrossRef]


| Density (g/cm3) | Diameter (μm) | Length (mm) | Strength (MPa) | Elasticity Modulus (GPa) | Elongation (%) |
|---|---|---|---|---|---|
| 1.3 | 40 | 12 | 1560 | 41 | 6.5 |
| No. | Sand | Cement | Fly Ash | Water | Water Reducer | PVA | Cellulose |
|---|---|---|---|---|---|---|---|
| 1 | 525.6 | 477.6 | 716.4 | 417.9 | 4.8 | 0 (0%) | 0.333 |
| 2 | 520.3 | 472.8 | 709.3 | 404.2 | 11.8 | 13 (1%) | 0.333 |
| 3 | 517.7 | 470.4 | 705.7 | 411.6 | 16.5 | 19.5 (1.5%) | 0.333 |
| 4 | 515.1 | 468.1 | 702.1 | 396.4 | 16.4 | 26 (2%) | 0.333 |
| Volume Addition Rates (%) | Ultimate Tensile Stress (MPa) | Yield Strain (%) | Ultimate Tensile Strain (%) | Ductility (μ = εu/εy) |
|---|---|---|---|---|
| 0 | 0.623 | 0.051 | 0.095 | 1.86 |
| 1 | 1.108 | 0.083 | 0.913 | 11.02 |
| 1.5 | 1.201 | 0.112 | 2.596 | 23.18 |
| 2 | 1.359 | 0.102 | 2.431 | 23.76 |
| Items | Deflection (mm) | Quantity of Cracks | Max Width of Cracks (μm) | Ductility (μ = εu/εy) | |
|---|---|---|---|---|---|
| Vol. (%) | |||||
| 1.0 | 4.6 | 14 | 98 | 10.15 | |
| 1.5 | 5.0 | 17 | 105 | 14.32 | |
| 2.0 | 5.3 | 19 | 102 | 15.60 | |
| Types | Physical Quantity | Affinity Constants | Types | Physical Quantity | Affinity Constants |
|---|---|---|---|---|---|
| Physical | σ | 1 | Geometrical | l | 1/5 |
| ε | 1 | x | 1/5 | ||
| E | 1 | θ | 1 | ||
| ν | 1 | A | 1/25 | ||
| Boundary condition | f | 5 | W | 1/125 | |
| P | 1/25 | I | 1/625 | ||
| M | 1/125 | k | 1/5 | ||
| J | 1/125 |
| Cement (kg/m3) | Sand (kg/m3) | Stone (kg/m3) | Water (kg/m3) | Fly Ash (kg/m3) | Water Reducer (kg/m3) | W/C | W/B |
|---|---|---|---|---|---|---|---|
| 450 | 678 | 1040 | 159 | 60.0 | 12.8 | 0.353 | 0.304 |
| Series | No. | Materials of Decks | Curing Age (Days) |
|---|---|---|---|
| C | C-1 | Concrete | 7 |
| C-2 | 56 | ||
| M | M-1 | Cement mortar | 7 |
| M-2 | 56 | ||
| S | S-1 | Self-compacting PVA-SHCC | 7 |
| S-2 | 56 |
| No. | Cracking Load (kN) | Ultimate Capacity (kN) | Ductility (μ = Δu/Δy) |
|---|---|---|---|
| C-1 | 20 | 71.4 | 1.26 |
| C-2 | 15 | 81.7 | 1.51 |
| M-1 | 17 | 64.3 | 1.74 |
| M-2 | 10 | 91.1 | 1.60 |
| S-1 | 17 | 73.8 | 1.69 |
| S-2 | 15 | 92.2 | 1.83 |
| No. | Materials | Quantities of Cracks | Width of Major Crack (mm) | Average Width of Cracks (mm) | Average Distance of Cracks (mm) | Ultimate Depth of Cracks (mm) | Df |
|---|---|---|---|---|---|---|---|
| C-1 | Concrete | 1 | 0.32 | 0.320 | - | 33.1 | 1.028 |
| C-2 | Concrete | 1 | 0.38 | 0.380 | - | 30.5 | 1.060 |
| M-1 | Cement mortar | 5 | 0.18 | 0.145 | - | 31.3 | 1.062 |
| M-2 | Cement mortar | 2 | 0.22 | 0.160 | - | 23.6 | 1.036 |
| S-1 | PVA-SHCC | 7 | 0.12 | 0.087 | 1.360 | 28.0 | 1.035 |
| S-2 | PVA-SHCC | 9 | 0.14 | 0.105 | 1.473 | 25.5 | 1.087 |
| No. | Materials of Decks | Cracking Load (kN) | Cracking Strain (10−3) |
|---|---|---|---|
| C-1 | Concrete | 14.70 | 0.715 |
| M-1 | Cement mortar | 16.63 | 0.931 |
| S-1 | Self-compacting PVA-SHCC | 38.34 | 8.963 |
| Materials | Density (kg·m−3) | Elasticity Modulus (GPa) | Poisson’s Ratio | Yield Stress (MPa) | Plastic Strain (%) | Ultimate Tensile Stress (MPa) | Ultimate Tensile Strain (%) |
|---|---|---|---|---|---|---|---|
| Concrete | 2400 | 32.5 | 0.2 | N.A. | N.A. | 1.150 | 0.010 |
| Reinforcing steel | 7800 | 210 | 0.3 | 300 | 0 | N.A. | N.A. |
| PVA-SHCC | 1900 | 21.0 | 0.25 | N.A. | N.A. | 1.201 | 2.596 |
| No. of Elements | Ultimate Load (kN) | Ultimate Deflection (mm) |
|---|---|---|
| 2184 | 52.02 | 9.16 |
| 4294 | 72.08 | 13.73 |
| 6980 | 70.05 | 13.96 |
| 9832 | 69.76 | 14.07 |
| 12,766 | 69.47 | 14.11 |
| Materials | Ultimate Principal Stress (MPa) | Ultimate Plastic Strain (%) |
|---|---|---|
| PVA-SHCC | 3.187 | 2.32 |
| Concrete | 3.336 | 0.098 |
Disclaimer/Publisher’s Note: The statements, opinions and data contained in all publications are solely those of the individual author(s) and contributor(s) and not of MDPI and/or the editor(s). MDPI and/or the editor(s) disclaim responsibility for any injury to people or property resulting from any ideas, methods, instructions or products referred to in the content. |
© 2024 by the authors. Licensee MDPI, Basel, Switzerland. This article is an open access article distributed under the terms and conditions of the Creative Commons Attribution (CC BY) license (https://creativecommons.org/licenses/by/4.0/).
Share and Cite
Luan, H.; Fan, Y.; Wang, Y. Flexural Behavior of Self-Compacting PVA-SHCC Bridge Deck Link Slabs. Buildings 2024, 14, 2469. https://doi.org/10.3390/buildings14082469
Luan H, Fan Y, Wang Y. Flexural Behavior of Self-Compacting PVA-SHCC Bridge Deck Link Slabs. Buildings. 2024; 14(8):2469. https://doi.org/10.3390/buildings14082469
Chicago/Turabian StyleLuan, Haiyang, Yingfang Fan, and Yin Wang. 2024. "Flexural Behavior of Self-Compacting PVA-SHCC Bridge Deck Link Slabs" Buildings 14, no. 8: 2469. https://doi.org/10.3390/buildings14082469