Abstract
This study, based on the perspective of supply and demand coupling between parks and living circles, divides spatial units by introducing the Thiessen polygon method with urban parks as the core. Simultaneously, the coefficient of variation (CV) was used to evaluate the distribution characteristics of these spatial units. The suitability of the spatial units was comprehensively evaluated through the three indicators of park service support, functional concentration of living circle, and management and development level. The Node–Place (NP) model was used to quantify the coupling relationship between the park and the living circle, and the characteristics of the coupling units were deeply analyzed from the aspects of supply and demand services, coupling configuration relationship, development management, etc. The results are empirically applied to four national-level new areas, thereby providing a new evaluation method and perspective for urban planning and management.
1. Spatial Unit Evaluation and Division: A Comprehensive Review
The understanding of parks’ function exhibits a phased characteristic, beginning with the enlightenment stage of park greenery (i.e., during the Qin and Han dynasties in China and the ancient Greek period in the West) when urban gardens and green spaces emerged in cities. During this period, gardens were entirely dependent on the needs of urban design, and both the form and content of the gardens were products of sensibility. [1]. They served as places for appreciation and mostly existed in the form of private properties of wealthy individuals. With the advent of the industrial revolution, to alleviate issues such as urban congestion and environmental degradation, the modern concept of publicly accessible urban parks began to emerge, starting from Birkenhead Park in Liverpool [2]. At that time, green spaces generally acquired five values: ensuring public health, nurturing moral spirits, emphasizing romanticism, improving labor efficiency, and promoting land value appreciation [3]. These values were mostly recognized from the perspectives of landscape and recreational functions. Parks are not only the lungs of cities but also provide recreational places. They play an important role in improving the urban environment and enhancing the quality of life for urban residents. On the other hand, the living circle refers to the spatial range involved in meeting the survival, development, and communication needs of urban residents and engaging in various production and living activities [4,5]. As an important concept in urban planning, it aims to achieve the convenience and efficiency of residents’ lives through optimizing the layout of service facilities and transportation networks. Parks in urban living circles (Le Corbusier, a pioneer of modern architecture, introduced the “circle of life” to describe the functional and aesthetic integration of living spaces, aiming to improve the quality of life through thoughtful urban planning and building design), as social spaces, not only gather crowds to promote social interaction and community cohesion but also alleviate tension, enhance happiness, and promote tolerance and integration among different social groups through shared and cooperative activities, thereby improving the quality of life for urban residents [6]. Therefore, the effective coupling of parks and urban living circles can promote the rational organization of urban space, improve urban spatial utilization efficiency, and thereby promote urban sustainable development. With the accelerated urbanization process and the expansion of urban space in recent years, the planning and construction of urban parks and living circles have received increasing attention.
In recent years, with the development of Geographic Information Systems (GIS) and remote sensing technology, spatial unit division and evaluation methods have been widely applied and researched. By selecting appropriate spatial units, the high accuracy and reliability of urban spatial structure analysis can be ensured, providing a scientific basis for urban planning and management [7]. The analysis can assist urban planners in gaining a deeper comprehension of the distribution of urban green spaces, the requirements of various social groups, and the availability of green spaces across diverse regions. This, in turn, can offer a scientific foundation and guidance for urban development, facilitating the strategic development of urban planning and policies [8]. In the research on the coupling of parks and urban living circles, reasonable spatial unit division can not only reveal the interaction between park green spaces and surrounding urban spaces but also provide a scientific basis for evaluating the contribution of parks to improving the quality of urban living circles. However, existing studies mostly focus on single aspects of parks or urban living circles. How to scientifically divide spatial units and evaluate the coupling effects is still an urgent problem that needs to be solved in current research. Especially in special urban spaces such as national-level new areas, because of their large scale, complex functions, and dynamic development, the division and evaluation of spatial units for the coupling of parks and urban living circles face more challenges.
Currently, spatial unit division plays a crucial role in urban planning and GIS (Table 1). Liang et al. [9] proposed a multiscale dynamic partitioning system using a spatial unit hierarchical zoning method and further developed an interactive unit grid partitioning method. These methods collectively enhance the efficiency of spatial unit design and meet the requirements of urban analysis applications, emphasizing the importance of meeting high-precision and multiscale analysis needs in urban management and planning. Luo et al. [10] explored the influence of spatial grid division on the analysis of urban functional area layout and found that grids of 200 × 200 m and 500 × 500 m are most suitable for identifying single and mixed functional areas, providing a basis for refined management of urban functional areas. Huang et al. [11] shifted the research focus to specific environments, proposing a spatial evaluation unit division technique suitable for small-scale marine areas. They constructed a marine spatial ecological attribute division index system based on chemical, physical, and biological attributes and divided Dongshan Bay into 67 basic spatial evaluation units, demonstrating the application of spatial unit division methods in specific environments. Pang [12] further expanded the application scope of spatial unit division by selecting and evaluating multiple dimensions of evaluation factors such as natural environment, built space, and historical culture, emphasizing the importance of multidimensional analysis in spatial unit division. Luo and Zhou [13] proposed a multiscale spatial unit regional partitioning method, which, by considering the multiscale nature of spatial units and their interactions, increased the interdependence of spatial units and facilitated the integration of spatial units with highly spatial interdependence as the spatial scale increased, resulting in regional partitioning results at different spatial scales. This method provides a new perspective for understanding the dynamic changes in spatial units at different scales. Chen et al. [14] focused on children’s outdoor activity spaces, analyzing service coverage and coverage rates by dividing and measuring outdoor activity spaces of different levels for children, providing data support for the planning of urban children’s activity spaces. Hao et al. [15] used a spatial clustering-based method to construct an objective function to determine the optimal number of partitions and their distribution, reducing engineering costs and improving flatness compared to traditional empirical methods, providing a new tool for land use planning. Ji and Gao [16], starting from the perspective of behavioral geography, proposed a new method to identify living space units based on the assumption of spatial stability and used K-Means spatial clustering analysis to partition a living space unit range in Beijing, providing important references for understanding the process and mechanism of spatial formation within cities. Dong et al. [17] employed three different basic units based on blocks, grids, and objects to divide urban land use types, demonstrating the diversity and practicality of spatial unit division methods in urban planning.

Table 1.
Related research on spatial unit division.
In terms of spatial unit evaluation (Table 2), Cheng et al. [18] developed an evaluation index system through geographic information data processing and simulation techniques and proposed a technical route for urban planning meteorological GIS demonstration evaluation. By introducing meteorological models using GIS data, they established applicable models for simulating urban planning atmospheric, water, and noise environments based on spatial units, providing a scientific basis for optimizing overall urban planning and local layout. Bao et al. [19] regarded landscape feature evaluation as an advanced method. By dividing complex and continuous landscapes into multiscale, tangible, and identifiable whole spatial units and considering the connection between landscape features and ecosystem services, they provided a new perspective for the protection and management of ecosystem services. Yan et al. [20] proposed a new planning simulation evaluation method focusing on urban spatial performance and the matching problem between different urban functions. By integrating various models to simulate the spatial distribution of supply and demand and constructing an index system based on spatial performance-related research, they systematically evaluated the supply-demand matching performance of planning schemes, providing a new framework for performance evaluation in urban planning. Grădinaru et al. [21] proposed a framework including four dimensions: construction efficiency, agricultural land protection, landscape protection, and quality of life, used to assess the consistency between planning objectives and actual development patterns, demonstrating the actual achievements of national spatial planning objectives in urban landscapes. Peng and Peng [22] proposed a UUS resource evaluation index system based on construction suitability and latent value. This system was quantified using the Analytic Hierarchy Process (AHP), Multi-User Grid Market (MUGM), EM, and other analytical tools. Additionally, overlay analysis was conducted using GIS. This framework provides theoretical support and a structure for urban underground space planning and resource assessment. It demonstrates the application and significance of spatial unit evaluation methods in urban underground space planning.
Table 2.
Related Research on Spatial Unit Evaluation.
These studies collectively advance the development of spatial unit evaluation methods. Meanwhile, the crucial role of spatial unit division and evaluation methods in urban planning and management can be observed. By providing multi-scale, multi-dimensional analysis and evaluation tools, these studies effectively help urban planners and managers better understand and optimize the functions and efficiency of urban spaces. Division methods emphasize the importance of accurately dividing spatial units at different scales and fields, while evaluation methods focus on assessing the role and effectiveness of these spatial units in achieving urban planning goals. These studies provide important theoretical and practical foundations for the scientific management and sustainable development of urban spaces.
2. Evaluation Method of Spatial Units Based on Supply and Demand Coupling Relationships
2.1. Basic Categories and Division Methods of Spatial Units
This study selects parks and green spaces with an area exceeding 5 hectares as the research objects because, according to the relevant standards and design specifications, the minimum area of a comprehensive park is 10 hectares (<Urban Green Space Planning Standards> (GB/T 51346-2019)), and the minimum area of a 15-min residential park is 5 hectares (<Urban Residential Area Planning and Design Standards> (GB50180-2018)). Therefore, the selected park green spaces, in principle, include comprehensive urban parks and 15-min residential parks in the current living circle planning covering composite urban parks and parks within a 15-min living circle area. The service boundaries of parks are divided into maximum service boundaries and intuitive service boundaries. The former is determined through the Thiessen polygon algorithm, while the latter is based on service aggregation analysis within a certain radius outside the park boundary. The service scope is considered from three angles: park service characteristics, living circle area service attributes, and the management and development of spatial units, exploring the supply and demand relationship between parks and living circle areas (Table 3).
Table 3.
Basic categories of spatial units.
Given that the Thiessen polygon is a set of continuous polygons formed by connecting the perpendicular bisectors of lines between adjacent points. The principle is to connect points on a plane according to the nearest neighbor principle, resulting in an optimal Delaunay triangulation. Perpendicular bisectors are then drawn on each side of the triangles to generate Thiessen polygons. The polygons obtained contain only one discrete point datum inside, and any position within the polygon is closest to the corresponding discrete point. Therefore, this paper introduces the Thiessen polygon method, using the geometric centroid of urban parks as discrete points to divide spatial units, ensuring that the distance from any point within each spatial unit to the urban park is minimized. The spatial units determined by the centroid of each central urban park and its boundary are considered living circle area units under the supply and demand coupling of parks and living circle areas. This method was effectively applied in the article [23]; it used the Thiessen polygon method based on the ArcGIS platform to calculate the regional average rainfall, which solved the problem of calculating the area and area weight coefficient of Thiessen polygons by traditional methods and improved the timeliness and accuracy of the regional average rainfall.
2.2. Distribution Evaluation of Spatial Units
The Coefficient of Variation (CV) is an indicator used to characterize the relative variation in a dataset in space, calculated by the ratio of the standard deviation of these data to the mean. Spatial distribution is typically classified into three types: uniform, random, and clustered, which can be judged based on the value of CV: when the CV value is less than 33%, the point set is considered to be uniformly distributed; between 33% and 64%, it is considered random; and when it exceeds 64%, it indicates a clustered distribution. A smaller CV value indicates less dispersion of spatial units, while a larger CV value indicates greater dispersion [24]. This study introduces CV (Table 4) to quantitatively analyze and compare the distribution characteristics of spatial units divided based on the geometric centroids of existing parks and planned parks. Due to differences and lag between planning goals and park construction status, a cross-sectional comparison of the differences in basic unit division resulting from this can be conducted. Under the premise of other conditions being unchanged, it is examined whether planning goals have a potential optimizing effect on the coupling units of existing parks and living circle areas.
Table 4.
Evaluation methods for spatial units based on supply-demand coupling relationships.
2.3. Measurement of Park Services
The park service level aims to describe the degree of service provided by urban parks located at the geometric center of spatial units. Three indicators are selected for measurement in this study (Table 4). Among them, park service efficiency measures the allocation of limited park resources to each spatial unit; effective park service refers to the service area covered within a 1000-m walking acceptable range, and the level of effective service reflects the extent of coverage; park accessibility measures the degree of integration of the heterogeneous park space with surrounding urban functions, reflecting one of the two orientations proposed earlier, “dissolving parks”—the coupling relationship, and park accessibility is also directly related to accessibility.
2.4. Measurement of Living Circle Activities
Living circle area activity measurement can be used to describe the level of service supply, spatial vitality, land development value, management status, and other activity levels of living circle area units. Starting from the demand side of the living circle area, the indicators for measuring living circle area activity can be divided into two categories: those related to general activities and those related to economic and management activities (Table 4). For indicators related to general activities in living circle areas, this study selects the mixed-use status of land, coverage, and accessibility of basic public services, and the degree of aggregation of service facilities within the effective service radius of parks to reflect the general activity measurement under the interaction between parks and living circle areas. For indicators related to economic and management activities in living circle areas, the relative increase in land development intensity within the effective service radius of parks, the relative increase in average land value within the effective service radius, and the status of grassroots government management organizations are used to reflect the economic and management activities of living circle areas under the interaction between parks and living circle areas.
2.5. Construction of Spatial Suitability Index System
2.5.1. Construction Method and Hierarchical Structure of Indicators
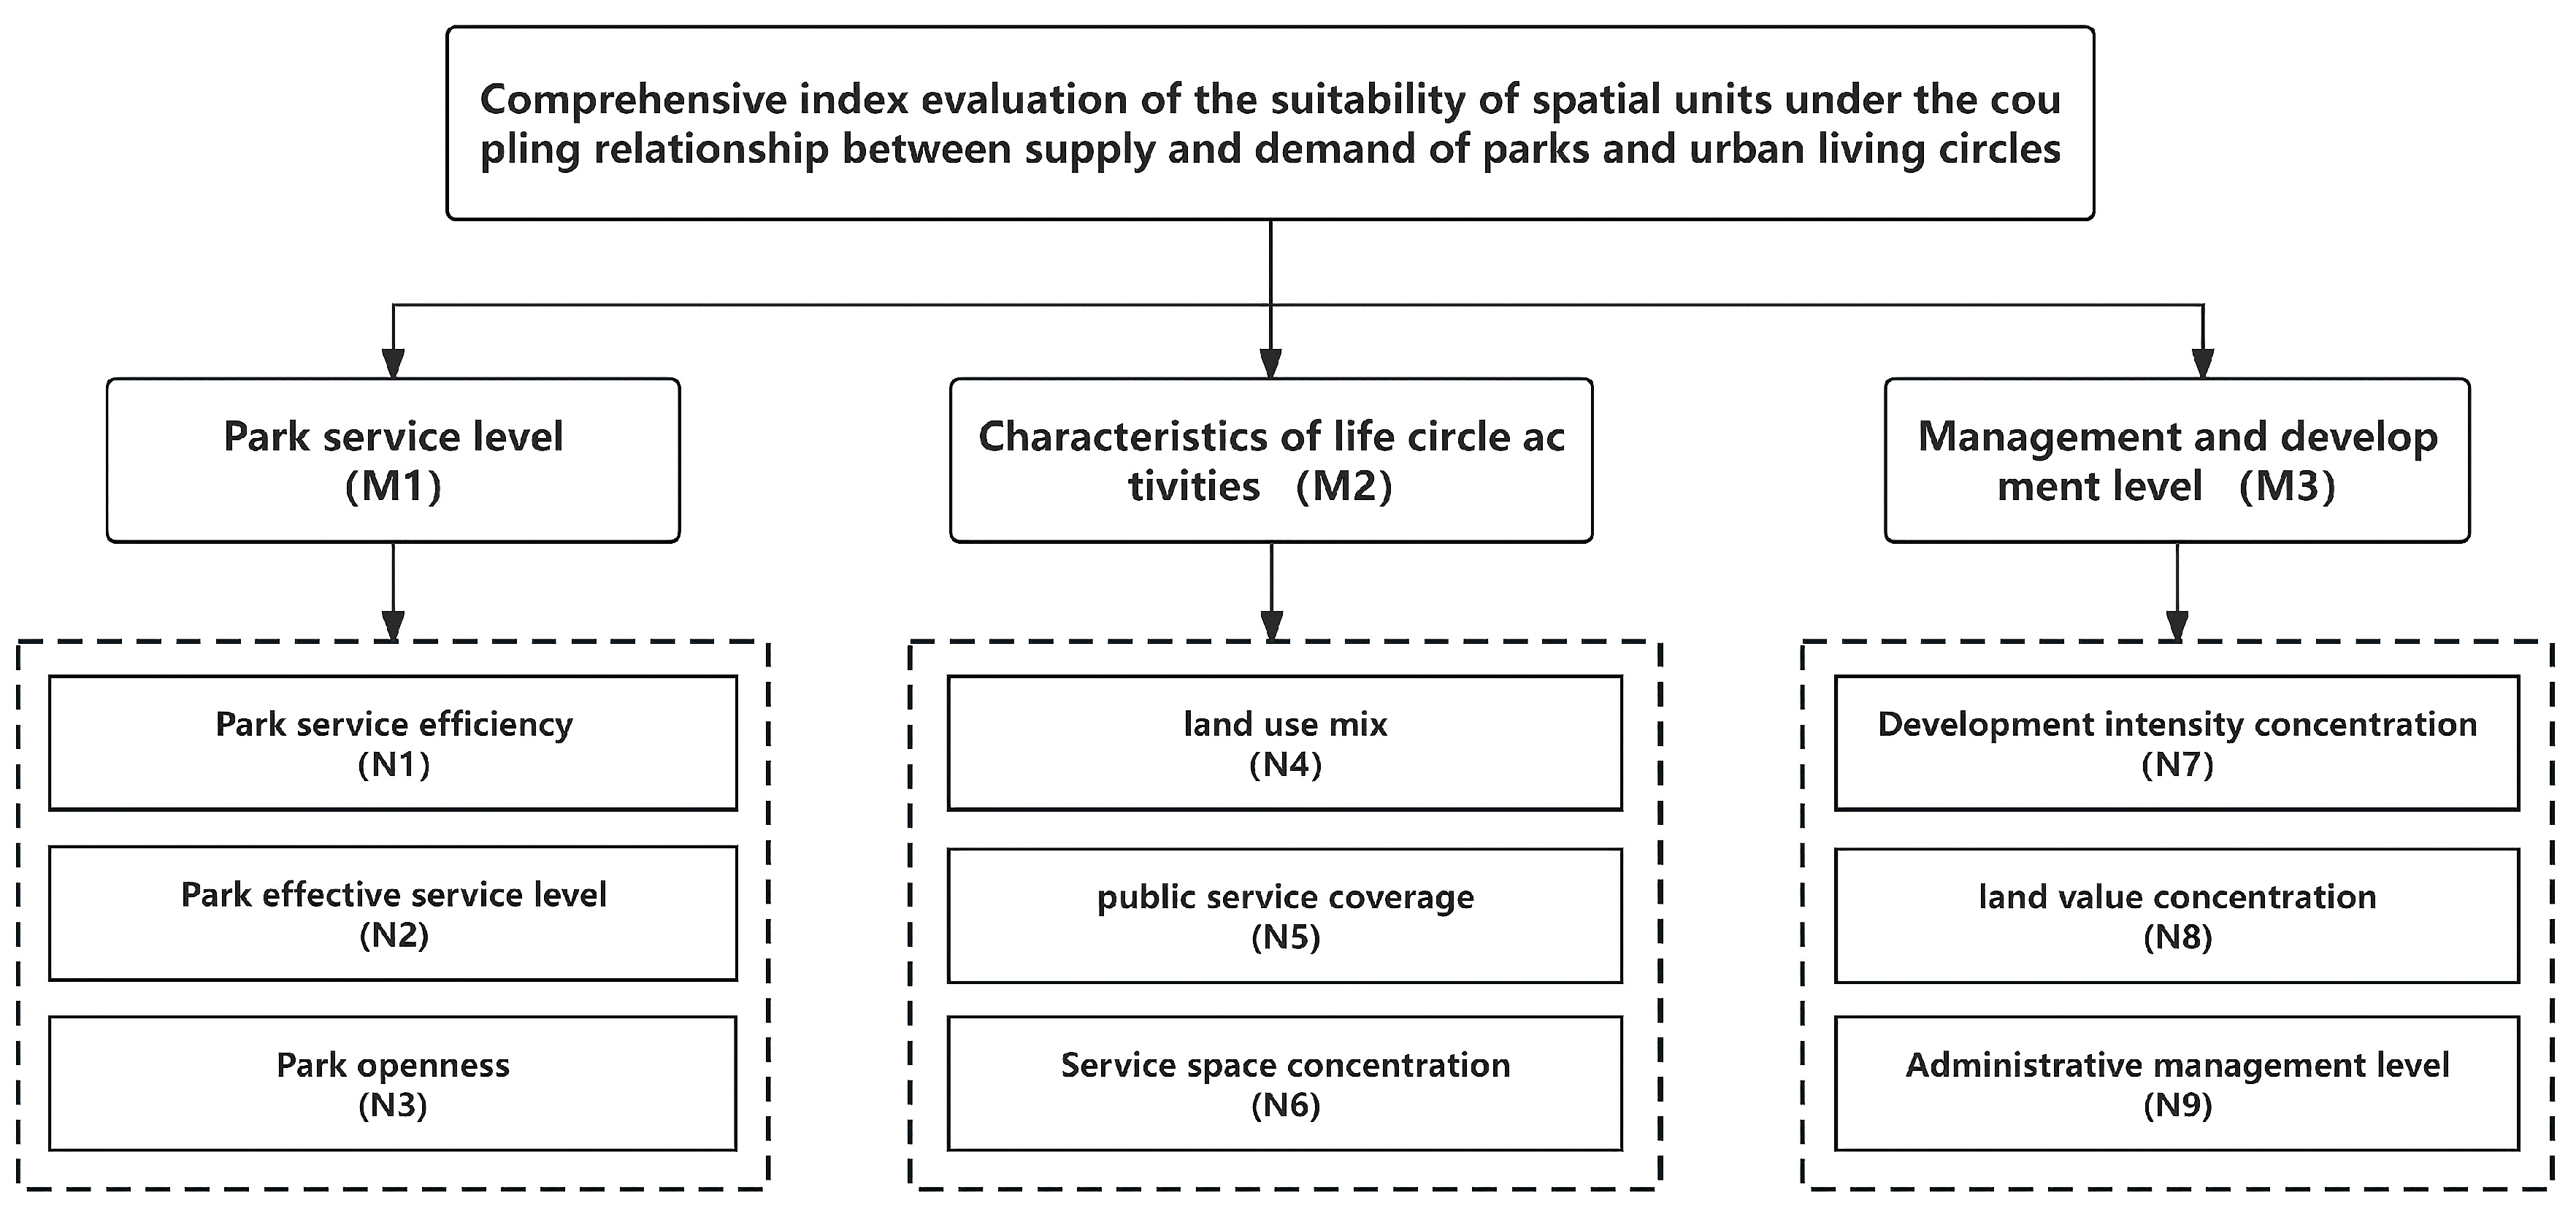
This study uses AHP to construct a three-level hierarchical model (Figure 1), including the goal level, criterion level, and indicator level. The purpose of the goal level is to evaluate the suitability of spatial units under the coupling relationship between parks and living circle areas. The criterion level is induced based on park supply, living circle area demand, and management and development levels. The indicator level is further refined into specific indicators of park service, living circle area activity characteristics, and management and development levels, such as park service efficiency, land use mix, and land development intensity concentration.
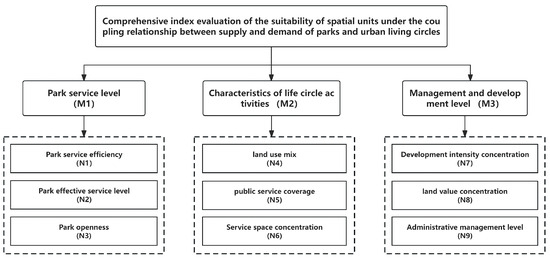
Figure 1.
Spatial unit suitability evaluation structural model.
2.5.2. Indicator Weighting
Based on the above evaluation index system, in order to improve the scientific validity of the evaluation results, this study uses the analytic hierarchy process (AHP) combined with expert scoring to assign subjective weights to each indicator. The selection criteria for experts include master’s or doctoral degrees in relevant fields and practitioners in relevant design institutes. In order to obtain experts’ evaluation of the importance of relevant indicators, we designed and distributed a detailed questionnaire, which included expert background information, importance scores of each indicator, and open opinions and suggestions. The feedback from these experts provided valuable data support for our research and enhanced the scientificity and reliability of the research.
The specific operation process is given as follows: 1. According to the determined index hierarchical structure, judgment matrices are constructed in AHP-assisted software yaanp; 2. The generated questionnaire is distributed to experts, who then judge the pairwise comparison matrix of each factor based on Saaty’s 1~9 scale; 3. The expert scoring results are input into yaanp, and the software conducts consistency checks and weight calculations for the pairwise comparison results of each factor; 4. After inputting all expert scoring results, group decision-making calculations are performed through arithmetic averaging, and the weights of each level of indicator are finally comprehensively obtained (Table 5).
Table 5.
Weights of spatial unit suitability evaluation indicators.
2.6. Measurement of Coupling Relationship between Park and Living Circle Services within Units
2.6.1. Introduction of Node–Place (NP) Model
NP model (Table 4) considers railway transit stations as both nodes in the transportation network and places with specific functions, emphasizing the interaction between stations and surrounding land. A positive feedback mechanism is formed between node value and place value, mutually reinforcing each other. This model is mainly used to study transportation hub areas, analyzing the relationship between nodes and place functions and their development trends. In recent years, Lu et al. [25] proposed extending this model’s application to broader spatial interaction research, such as the synergy between nodes and place functions in tourist attractions.
In this study, parks serve as the basis for spatial unit division, located at the geometric center of spatial units. On the one hand, parks act as tools to integrate this spatial unit and provide responses to three layers of demand, attracting flows of people (reflected in the daily behavioral needs of crowds), flows of information (reflected in information exchange and social interaction in crowd activities and interactions), and flows of capital (reflected in promoting land development value and intensity in the surrounding area), which gather around them and affect a certain range of spatial places. On the other hand, the exploration and promotion of functions in the neighborhood (the affected spatial places) place higher demands on park nodes for service efficiency, service levels, and accessibility. Therefore, it is believed that the coupling relationship between parks and neighborhoods is similar to the relationship described by the NP model.
2.6.2. Selection and Determination of Measurement Indicators
Bertolini defined node value as a comprehensive evaluation reflecting the level of transportation services provided by stations and place value as a composite indicator reflecting the level of regional activities. When scholars use the NP model for NP synergy analysis, they construct primary indicators starting from the support of the transportation system (i.e., the services provided by nodes) and the concentration of land functions (i.e., land development and utilization vitality) and refine them into secondary indicators. Referring to relevant academic achievements and selecting indicators based on the connotations of park service measurement and neighborhood activity measurement mentioned earlier, this study evaluates the degree of coordination between parks and neighborhoods from the perspectives of park service support and neighborhood functional aggregation. The specific measurement indicators for the coupling relationship between parks and neighborhoods are shown in Table 6.
Table 6.
Measurement indicators of coupling relationship between parks and living circles.
2.6.3. Composite Indicator Weights
Referring to Bertolini’s original model, the composite indicators are calculated with each individual indicator weight set as 1. When applying the NP model to a study of Swiss railway stations, Reusser et al. [26] suggested that the results of expert scoring weighting were not significantly different from the results with each individual indicator weight set as 1. Yang [27] also achieved academic results by assigning a weight of 1 to individual indicators. Therefore, in this study, when studying node and place indicators, each individual indicator is weighted as 1. That is, the place value of the NP model is obtained by summing up the secondary indicators within the neighborhood functional aggregation, and the node value is obtained by summing up the secondary indicators within the park service support.
2.6.4. Calculation Method and Explanation of Composite Indicators
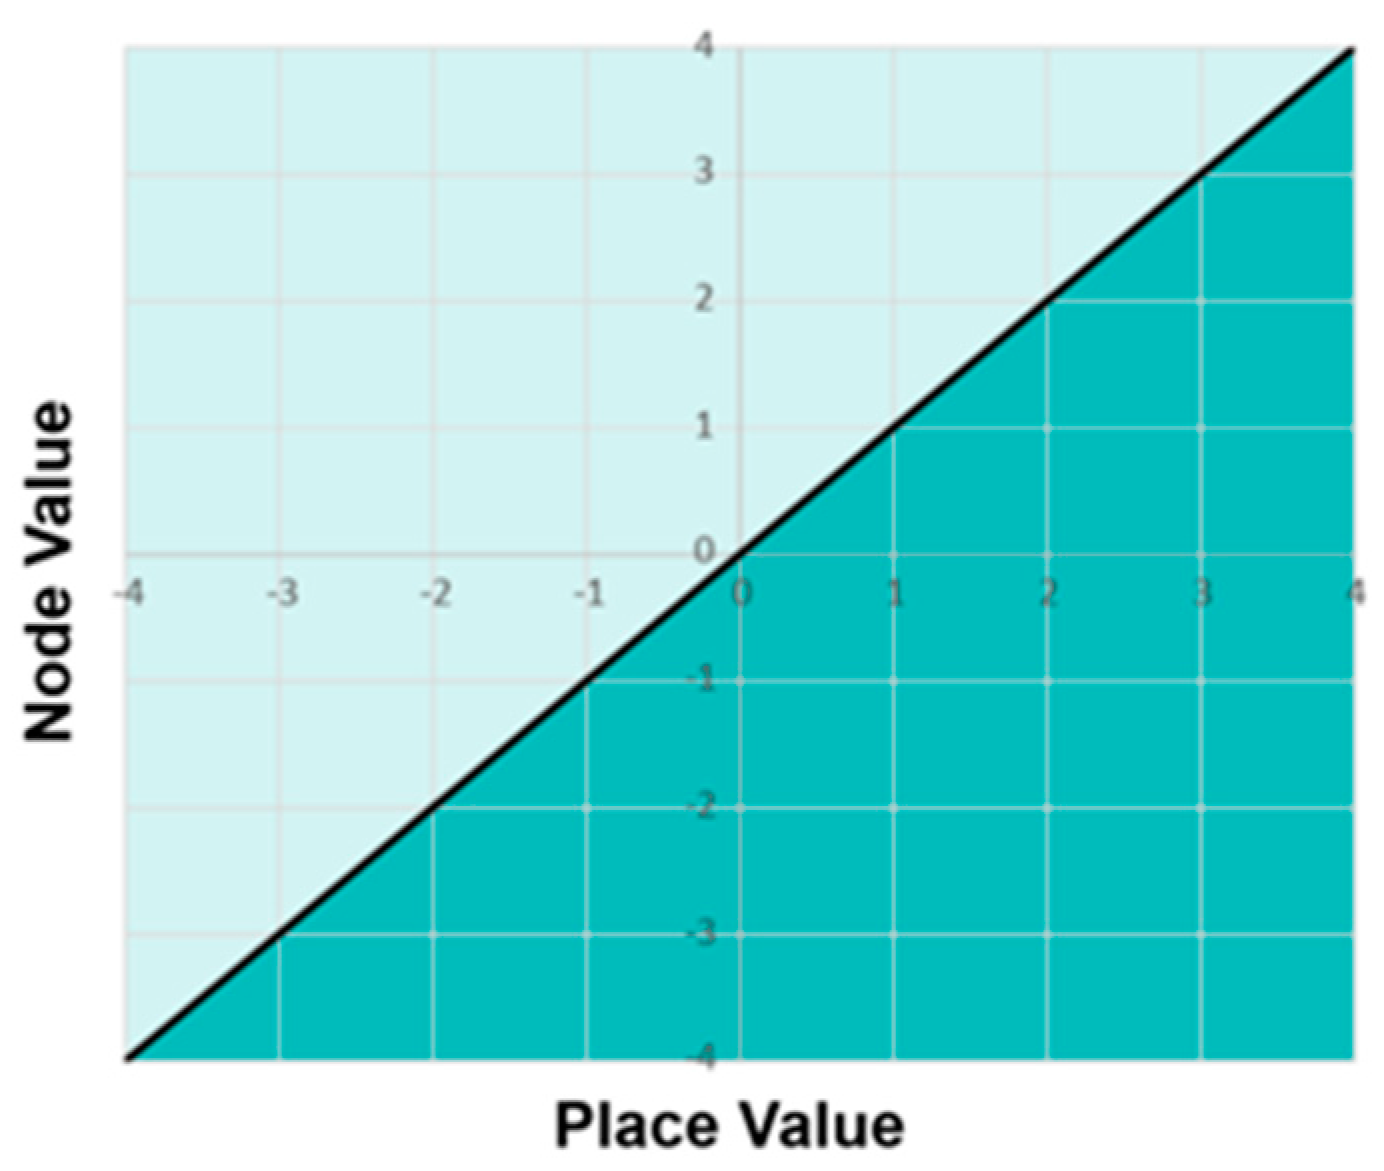
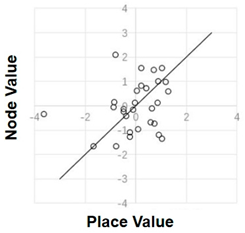
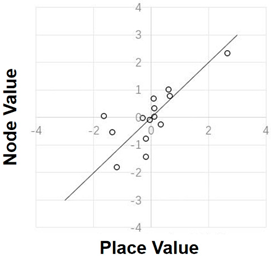
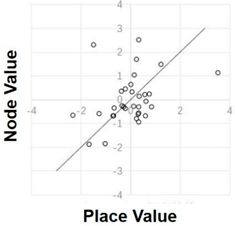
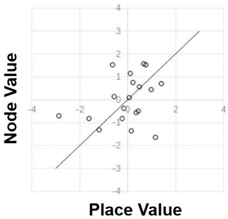
The indicators within each unit’s neighborhood functional aggregation are summed up to calculate the composite place indicator, while the indicators within each unit’s park service support are summed up to calculate the composite node indicator. The Z-Score standardization process (Table 4) is applied to both composite values. With the Z-Score of the composite place indicator as the horizontal axis and the Z-Score of the composite node indicator as the vertical axis, the scatter plot obtained illustrates the relative sizes of neighborhood functional aggregation (place value) and park service support (node value) for each unit (Figure 2).
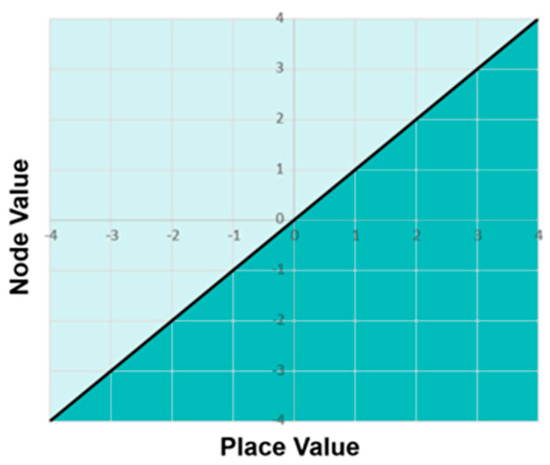
Figure 2.
Illustration of place value and node value composite indicator.
After the preliminary explanation of the scatter plot obtained from the normalization of composite indicators, the points plotted on the horizontal and vertical axes, if their values are greater than 0, indicate positions above the average level; if less than 0, they indicate positions below the average level. Simultaneously, if the results fall on the line with a slope of 1, it signifies that the spatial unit represented by that point exhibits a relative balance between the level of functional aggregation of the living circle and the level of park service support within the overall context. In other words, the coupling relationship between the living circle and the park within that spatial unit is the most harmonious. The points falling above the line indicate (relatively) higher node values than (relatively) site values, while those below the line indicate (relatively) higher site values than (relatively) node values.
3. Spatial Unit Evaluation Empirical Analysis: A Case Study of Four National-Level New Areas
3.1. Research Scope and Overview of New Areas
Chinese cities face the challenge of unreasonable park distribution, primarily because of early planning that focused on constructing a limited number of parks within urban administrative areas. As urban populations grew and central areas became more densely populated, the availability of land for new parks in these central zones decreased. Consequently, urban planners began to develop new parks in the outskirts or peripheral areas of the cities. This outward expansion of park locations, driven by land scarcity in central urban zones, has led to an imbalance in the distribution of green spaces, with a higher concentration of parks in suburban areas and insufficient green spaces in central urban zones. Furthermore, structural problems in the park system, such as the mismatch between park service provision and citizen needs and the lack of integration with urban planning, have exacerbated this imbalance and affected the overall accessibility and functionality of urban parks. In contrast, national-level new areas, because of their forward-looking planning and innovation, provide opportunities to optimize the coupling of parks and neighborhoods. The development of new areas shows stage characteristics, experiencing three development stages from 1992 to the present. The mature experience of early new areas has guiding value for subsequent new areas. Internal development in new areas also shows stage characteristics, with areas adjacent to old urban areas usually prioritized for development, providing experience for the development of other areas in new areas. These factors collectively point to the importance of conducting an analysis of the supply and demand coupling between parks and neighborhoods in new areas and providing optimization suggestions, especially in addressing the practical difficulties of land optimization and promoting urban-park integration. Therefore, this study selects Chongqing Liangjiang New Area, Chengdu Tianfu New Area, Shanghai Pudong New Area, and Tianjin Binhai New Area as empirical case studies. The basic profiles of the new areas are as follows (Table 7).
Table 7.
Overview of new areas.
3.2. Data Processing and Method Flow
3.2.1. Workflow and Data Acquisition
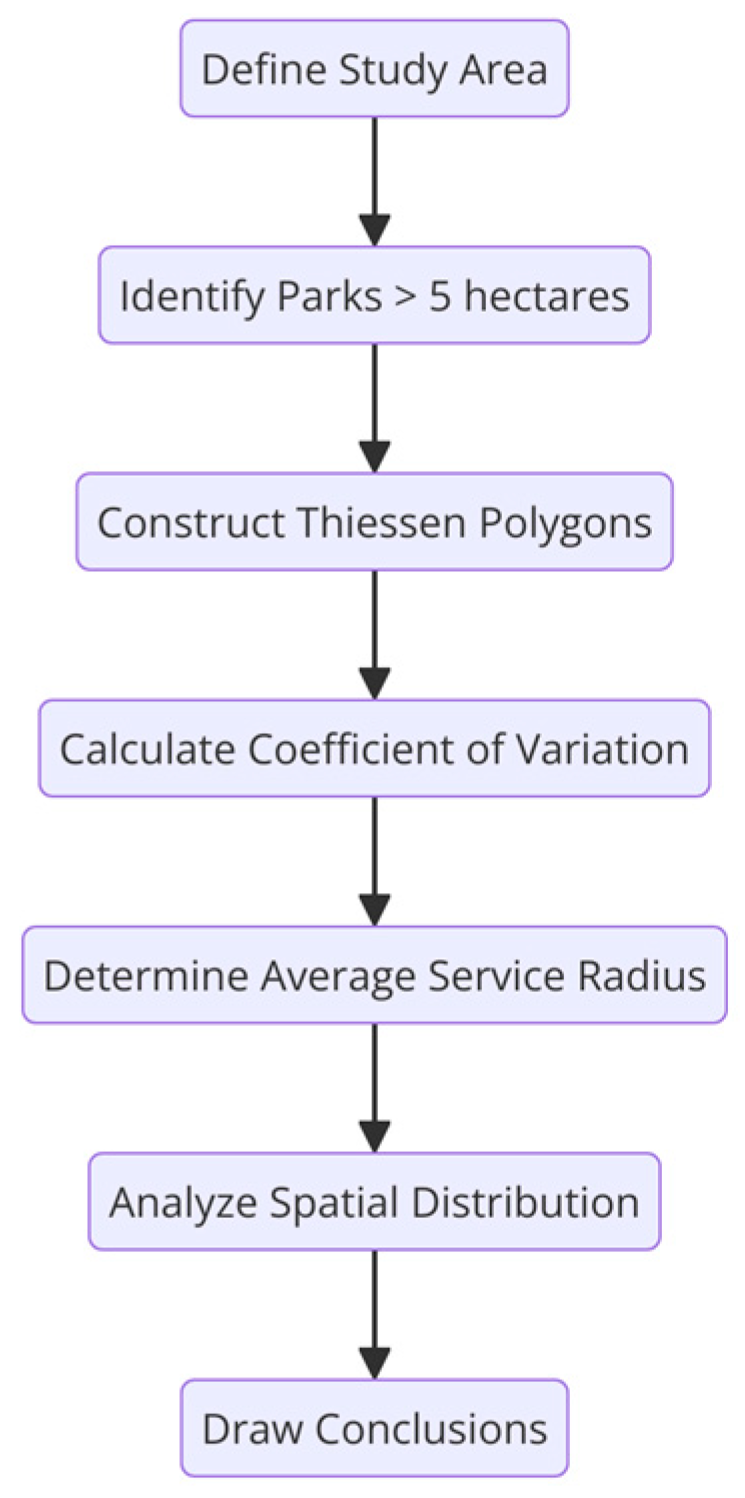
Based on the workflow constructed above, an empirical study was conducted on four national-level new areas (Figure 3). Data for this paper mainly come from the following sources: ① Relevant materials provided by government departments: General planning, planning texts and explanations, green space special planning, and other planning data and drawings provided by local planning departments. ② Internet data collection: Including image data, street view data, internet electronic map data, local statistical yearbooks, and government affairs disclosure. ③ Part of the research and measurement data: Field surveys are conducted for certain content, such as park locations, surrounding land use status, and accessibility. These specific data used in the actual calculations are shown in Table 8.
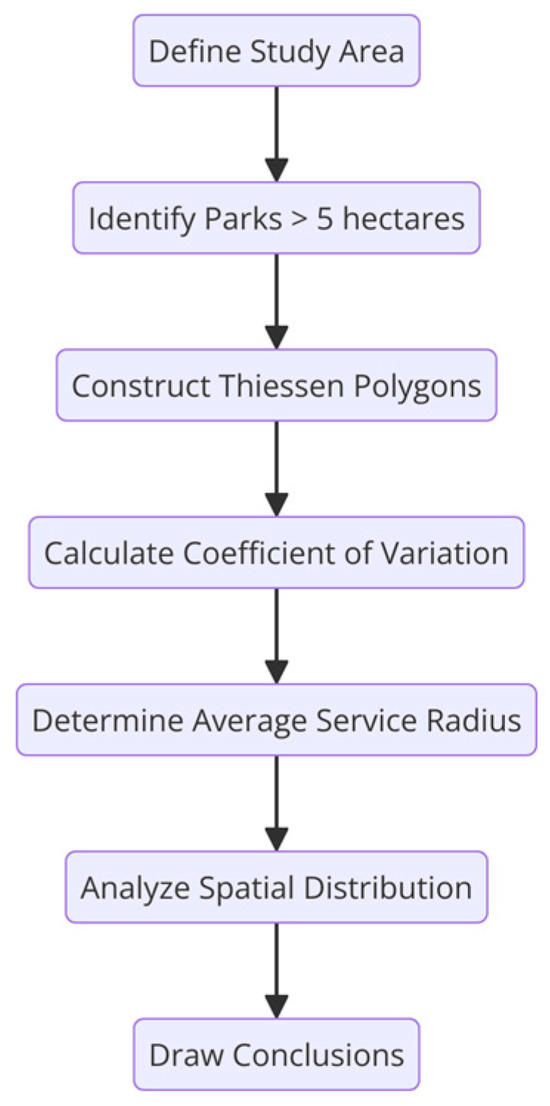
Figure 3.
Empirical research workflow.
Table 8.
Classification and selection of land database types.
3.2.2. Data Preprocessing
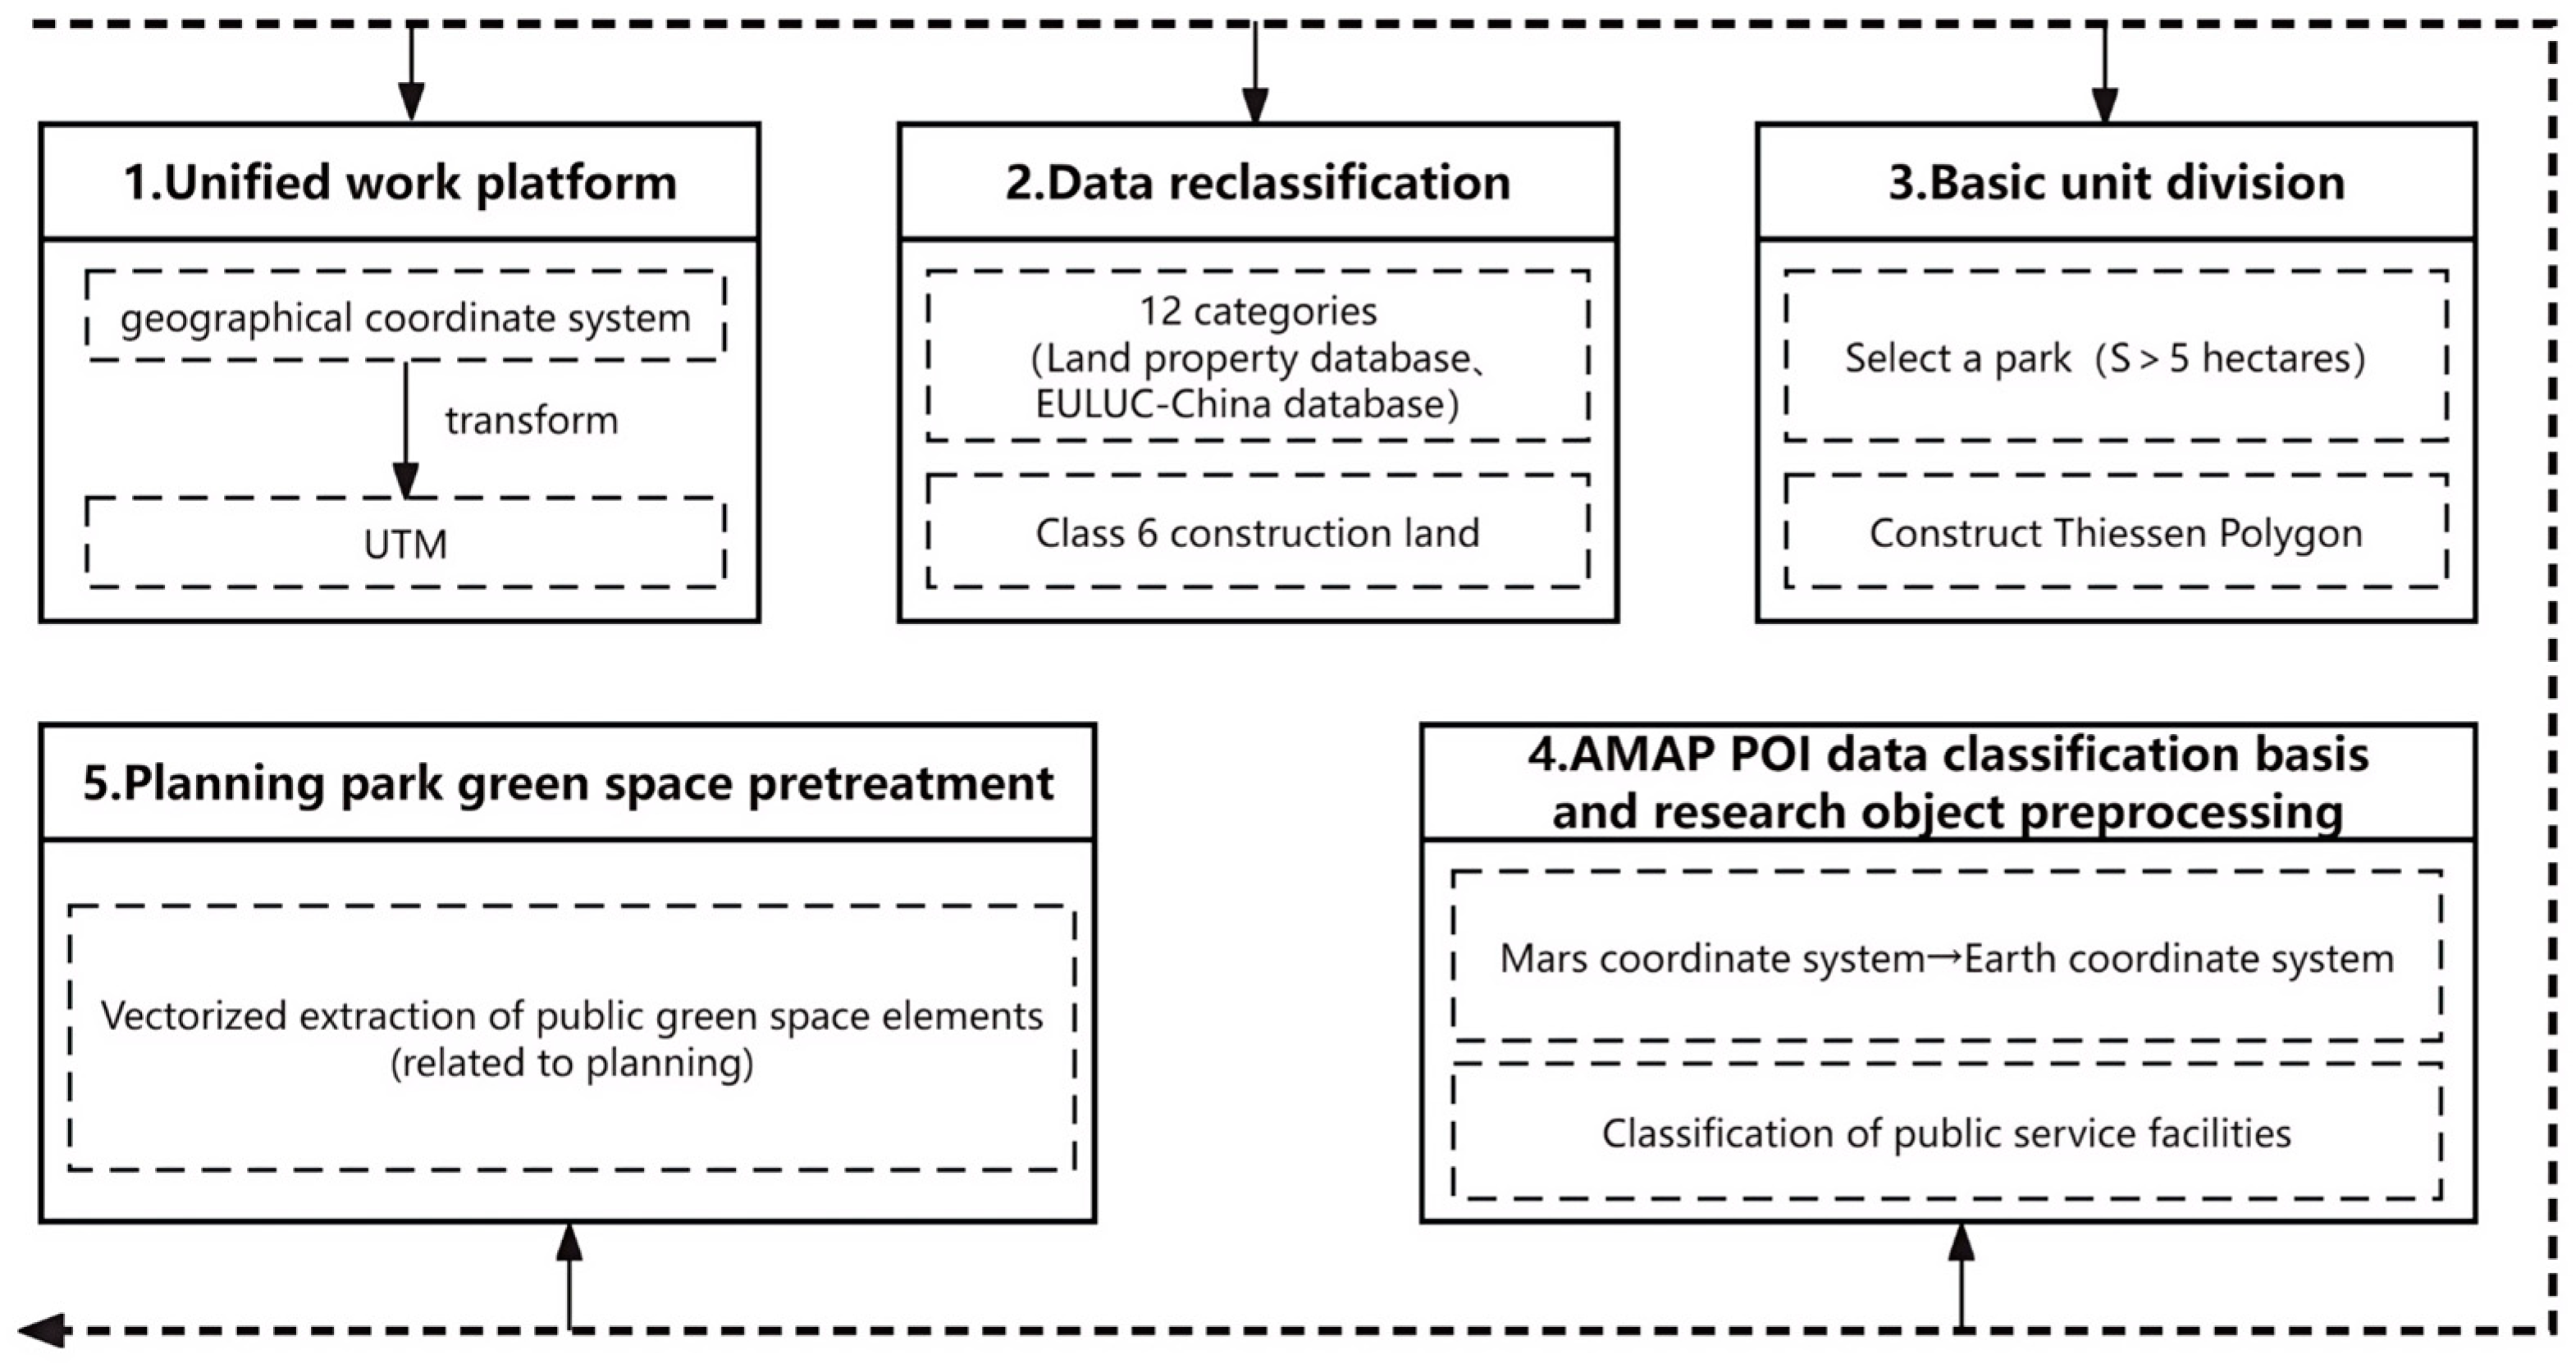
The data preprocessing process is shown in Figure 4. This study integrates the empirical process into the ArcGIS platform, transforms data coordinate systems, and performs zone-based projection based on the location of the new areas. For example, Liangjiang New Area and Tianfu New Area are in Zone_48N, Pudong New Area is in Zone_51N, and Binhai New Area is in Zone_50N. Then, the land attribute database is simplified from twelve categories to six categories of construction land (Table 8) and combined with Google Maps, Baidu Street View, and EULUC database for screening and merging, especially selecting scenic spots with high compatibility with urban parks. Subsequently, through field investigations and map analysis, parks larger than 5 hectares are selected, and the neighborhood is divided using Thiessen polygons. The boundaries of spatial units are clipped in ArcGIS to ensure consistency between the analysis scope and reality. Points of Interest (POI) data from Amap is converted from the Mars coordinate system to the Earth coordinate system, and public service facilities are classified into six categories according to community living circle standards, and service coverage and aggregation are calculated (Table 9 and Table 10). Finally, vectorized documents such as “Overall Plan of Chongqing Liangjiang New Area” and “Overall Plan of Chengdu Tianfu New Area” were used to extract public green space elements. Urban parks were defined based on the plan to ensure alignment with actual needs, thereby enhancing research accuracy and decision support effectiveness.
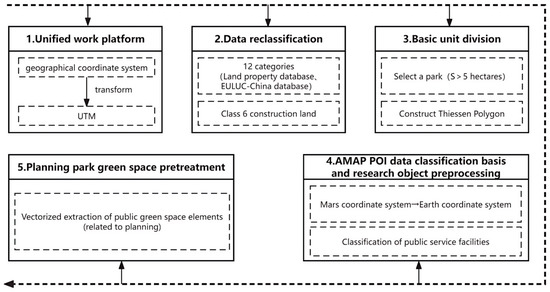
Figure 4.
Data preprocessing flowchart.
Table 9.
Basic public service facilities POI screening results.
Table 10.
Necessary public service facility POI screening results.
3.3. Empirical Research Results of Four National-Level New Areas
3.3.1. Spatial Unit Characteristics
Based on the calculation results (Table 11 and Table 12) and by comparing the above differences between the construction status and the planning scheme, the following conclusions can be drawn:
Table 11.
Spatial unit-related characteristics of four new national areas.
Table 12.
Spatial unit-related characteristics of four new national areas.
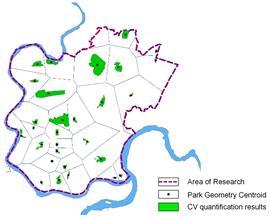
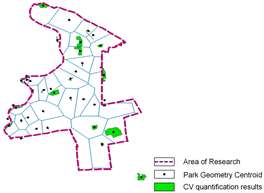
(1) Using the current parks as geometric centroids, 29 Thiessen polygons (spatial units) were constructed. The coefficient of variation for these spatial units in the Liangjiang New Area is 58.82%, indicating a tendency towards random distribution. Assuming these spatial units are circular with an average area of 707 hectares, the average radius is approximately 1500 m. Using planned parks as geometric centroids, 44 Thiessen polygons were constructed. The coefficient of variation for these spatial units is 49.66%, suggesting a tendency towards random distribution for parks larger than 5 hectares. The average radius of these spatial units, based on the planning scheme, is approximately 1200 m.
When analyzing the spatial layout of urban parks in Chongqing Liangjiang New Area, it was observed that under the construction status, the number of urban parks larger than 5 hectares is insufficient, and their distribution is uneven. Specifically, when using 5 hectares as a screening criterion, urban parks under the current situation exhibit greater spatial dispersion than the planning scheme, which is reflected in the more significant differences in the area of spatial units, resulting in poor balance in the area of each unit and thereby affecting service fairness. Additionally, the average service radius of existing constructed spatial units is greater than that in the planning scheme. However, both maintain a service radius within 1500 m, consistent with the reasonable range of a fifteen-minute living circle and acceptable walking distance. In comparison, the service radius of urban parks in the planning scheme is approximately 1200 m, indicating a more reasonable consideration of the service space for urban parks during the planning process to achieve higher-quality living circle units.
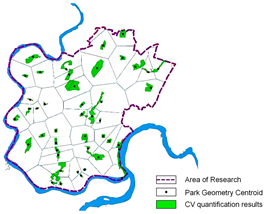
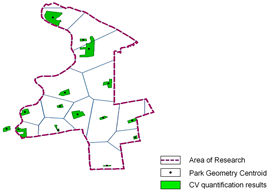
(2) Within the study area, 14 Thiessen polygons (spatial units) were constructed using the centroids of existing parks larger than 5 hectares, defined as urban parks. The coefficient of variation for these spatial units is 74.16%, indicating a tendency towards clustered distribution. Assuming these spatial units are circular with an average area of 817 hectares, the average radius is approximately 1600 m. Using the centroids of planned parks, 50 Thiessen polygons were constructed. The coefficient of variation for these spatial units is 52.97%, indicating a tendency towards random distribution. Based on the calculated average, the average service radius of these spatial units is approximately 900 m.
After analyzing Chengdu Tianfu New Area, it was found that urban parks larger than 5 hectares are insufficient in number and exhibit uneven distribution under the current situation, especially with concentrated and clustered distribution phenomena in certain areas. For urban parks screened with 5 hectares as the criterion, spatial units under the current situation show greater dispersion than the planning scheme, indicating poor balance in the area of spatial units and poor service fairness between units under the current situation. Additionally, the average service radius of spatial units under the current situation exceeds that of parks in the planning scheme, but both maintain a service radius within the reasonable range of a fifteen-minute living circle. In the planning scheme, the average service radius of urban parks is approximately 900 m (the standard walking distance is 800–1000 m), which meets the standard of a fifteen-minute living circle, indicating a reasonable consideration of the service space for urban parks during the planning process.
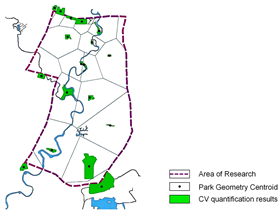
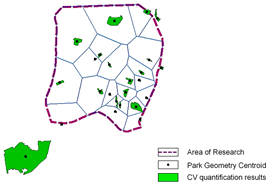
(3) In the Pudong New Area study region, 32 Thiessen polygons (spatial units) were constructed using the centroids of existing parks larger than 5 hectares, defined as urban parks. The coefficient of variation for these spatial units is 50.97%, indicating a tendency towards random distribution. The average service radius of these spatial units is approximately 1900 m. Using the centroids of planned parks, 14 Thiessen polygons were constructed. The coefficient of variation for these spatial units is 42.28%, indicating a tendency towards random distribution for planned urban parks larger than 5 hectares. The average service radius of these spatial units is approximately 3000 m.
In the urban park planning scheme of Pudong New Area, it was observed that the number of urban parks is relatively small and mainly concentrated in contiguous ecological green spaces such as waterfront corridors, wedge-shaped green spaces, and outer ring green belts. Compared with the planning scheme, urban parks screened with 5 hectares as the criterion exhibit greater spatial dispersion under the current situation, indicating poorer balance in the area of spatial units compared to the latter, resulting in poorer service fairness between units. Further analysis revealed that the average service radius of spatial units in the planning scheme is greater than that under construction, but both significantly exceed the 15-min walking length. Specifically, the average radius of spatial units under construction is approximately 1900 m, which is more in line with the service radius standard of current urban composite parks (approximately 2000 m). In contrast, the average radius of spatial units in the planning scheme is approximately 3000 m, which not only far exceeds the service radius in previous studies but also matches the service radius suggested in urban green space planning standards (“Urban Green Space Planning Standards” GB/T51346-2019) [28] for composite parks serving populations exceeding 500,000 people. Approximately 86% of the planned park areas exceed 50 hectares, demonstrating a macroscopic perspective in planning and a response to large-scale service demand.
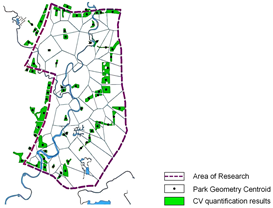
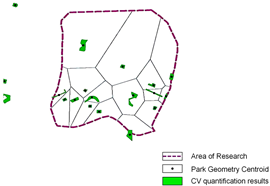
(4) In the Binhai New Area study region, 19 Thiessen polygons (spatial units) were constructed using the centroids of existing parks larger than 5 hectares, defined as urban parks. The coefficient of variation for these spatial units is 82.11%, indicating a tendency towards clustered distribution. The average service radius of these spatial units is approximately 1700 m. Using the centroids of planned parks, 16 Thiessen polygons were constructed. The coefficient of variation for these spatial units is over 100%, indicating a tendency towards clustered distribution. The average service radius of these spatial units is approximately 2000 m.
The number of urban parks in the Binhai New Area planning scheme is slightly less than the construction status and is mostly distributed in the southwest. In terms of construction status, urban parks screened with 5 hectares as the lower threshold exhibit obvious spatial clustering characteristics, indicating a lower balance between units. In contrast, the distribution of spatial units divided in the planning scheme exhibits more significant clustering characteristics and poorer balance, resulting in lower service fairness between units. However, the average service radius of the planning scheme is larger than the construction status, and both are slightly larger than the maximum suitable walking distance of 1500 m, which is more consistent with the composite service radius of current urban composite parks (2000 m) at this stage.
3.3.2. Evaluation of Spatial Unit Suitability
Based on the relevant content of the spatial suitability index system determined in the previous sections and the results of data preprocessing, spatial analysis, and calculations were conducted on the spatial units divided in the construction status of the four national-level new areas, resulting in the evaluation of spatial unit suitability (Table 11 and Table 13). The evaluation results are analyzed and interpreted from two aspects: quantity characteristics and spatial distribution characteristics. The quantity characteristics are classified into five levels based on the natural breakpoint grading method.
Table 13.
Grading of spatial unit suitability evaluation results for four national-level new areas.
- (1)
- Quantity Characteristics
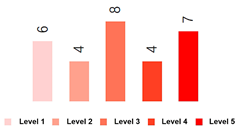
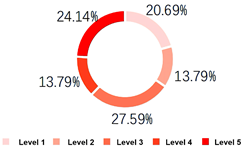
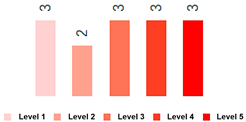
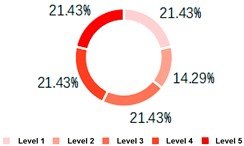
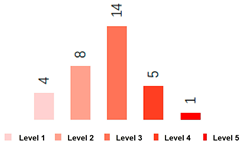
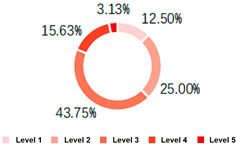
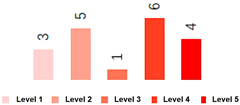
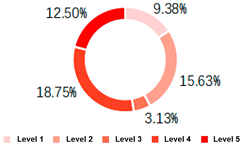
According to the results (Table 13 and Table 14), regarding the quantity characteristics, the Liangjiang New Area in Chongqing has the highest number of spatial units classified in level 3, accounting for approximately 28%, while spatial units classified in levels 3, 4, and 5 together account for about 66% of the total. The distribution of spatial units in the Tianfu New Area is relatively even across all levels, with levels 3, 4, and 5, which scored higher, accounting for about 64% of the total. In the Pudong New Area, the highest number of spatial units is classified in level 3, accounting for about 44% of the total, while spatial units classified in levels 3, 4, and 5 together account for about 62% of the total. The planning scheme for Binhai New Area has the highest number of spatial units classified in levels 4 and 5, totaling approximately 31%.
Table 14.
Spatial unit suitability evaluation results for four national-level new areas.
- (2)
- Spatial Distribution Characteristics
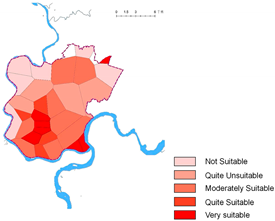
In the evaluation of spatial unit suitability in the Liangjiang New Area (Table 15), the scores are distributed with higher scores in the south and lower scores in the north, higher scores in the east and lower scores in the west, with the highest scores located in the central part. The overall score distribution (In the division of characteristic urban landscapes, Liangjiang New Area is classified into four zones at the overall urban scale: urban style, mountainous characteristic style, ecological dominant style, and natural mountain landscape style) correlates with the maturity of area development. Areas with higher suitability are mainly distributed in the densely developed areas of the new area, such as urban-style areas guided by overall urban design. The most suitable development units are mainly located in commercial service-concentrated areas such as Jiangbeizui New Business District, Ranjiaba Business District, and the Financial Center, which have a higher concentration of commercial services and have been developed for a longer time. These areas correspond to the layout of the urban main centers and cluster centers in the overall planning (Overall Plan of Liangjiang New Area 2010–2020) of Liangjiang New Area, such as Jiangbeizui and Guanyinqiao as the two main urban centers, and the Financial Center to the south of Chaotianmen Park as the cluster center.
Table 15.
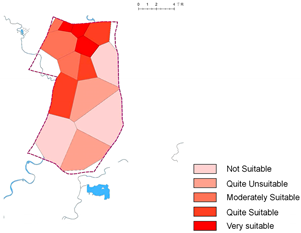
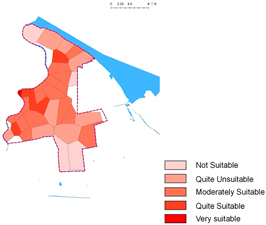
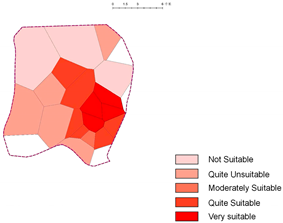
Spatial distribution of spatial suitability evaluation results of four national-level new areas.
A comprehensive evaluation score of spatial suitability in the Chengdu Tianfu New Area shows a pattern of higher scores in the north and lower scores in the south, and higher scores in the west and lower scores in the east, correlating with the maturity of the area’s construction. Areas with higher spatial suitability are mainly distributed in existing developed areas outside the main urban area of Chengdu at the beginning of the overall planning of the Tianfu New Area, such as the High-tech Zone and Huayang Street. Furthermore, the areas with higher suitability from the north to the central part align with the planned important landscape nodes (Source: Overall Landscape Characteristic Planning Map of Chengdu Tianfu New Area 2010–2030, Sichuan Province) for finance and commerce, as well as recreation and commerce, respectively. The two highest-scoring development units are located in Zhonghe Subdistrict and Guixi Subdistrict, consistent with the planned municipal service center (i.e., financial and commercial center: Source: “Public Facilities Planning of Chengdu Tianfu New Area Overall Plan 2010–2030, Sichuan Province”) and important landscape nodes for finance and commerce. Along the north segment of Tianfu Avenue extending to the southeast, the scores of units gradually decrease. The three low-scoring spatial units on the east side correspond to the designated area of Xinchuan Innovation and Technology Park (Source: “Industrial Land Layout of Chengdu Tianfu New Area Overall Plan 2010–2030, Sichuan Province”), while the unit in the northwest corner corresponds to Zhengxing Town, both exhibiting lower spatial suitability scores. This indicates significant deficiencies in the development of park services, community services, and management activities in the aforementioned technology park and Zhengxing Town.
In the Shanghai Pudong New Area, the comprehensive evaluation of spatial unit suitability scores is distributed with higher scores in the west, central, and south and lower scores in the north. The distribution of scores correlates with the maturity of area development. Areas with higher suitability are mainly distributed around the central activity area of Shanghai’s 2035 plan, with Lujiazui Central Activity Area being the highest-scoring node. The area is well developed with functions such as finance and business and a high concentration of construction activities. Extending southeast along Century Avenue to Huamu-Longyang Road Urban Sub-center, the suitability is relatively high, indicating good construction and high regional vitality. The two areas with the second-highest suitability are consistent with the locations of district centers (The delineation of regional centers is derived from “Shanghai Urban Master Plan 2017–2035”) planned in the area, namely, Shibao-Qiantan-Gaoqing Road District Center and Senlan District Center. Other areas with relatively high suitability are consistent with other district centers planned (such as Jinyang District Center, Jinko District Center) and urban sub-centers planned (such as Jinqiao Urban Sub-center, Chuansha Urban Sub-center, Zhangjiang Urban Sub-center), indicating that district centers, as aggregation points for public services and commerce, have good prerequisites for construction and development and a high degree of compatibility with the suitability indicators based on the coupling relationship between parks and living circles. The southern units of Zhangjiang have a large area of ecological restoration, and the units at the confluence of the Yangtze River and Huangpu River have large areas of park green space, strategic reserve areas, and public infrastructure areas, indicating lower levels of construction activities such as park services, living circle services, organization, management, and development. In addition, the suitability of units at the edge of the research area is relatively low, which is also related to the division of spatial units. The research area is the main urban area, and the peripheral areas are mostly non-urban spaces, namely restricted construction areas, with almost no urban park construction. Therefore, the accuracy of spatial unit division based on urban parks as geometric centers is relatively low.
In the Tianjin Binhai New Area, the comprehensive evaluation of spatial unit suitability scores is distributed in a layered manner, with the highest scores in the eastern clusters spreading outward. Areas with higher suitability are distributed on both sides of the Haihe River, mainly on the north bank. The highest-scoring area is located north of the mouth of the Haihe River, existing in a clustered form, with areas of slightly lower suitability surrounding it. The distribution of the two coincides with the spatial scope of the Central Integrated Zone (CIZ) city-level public center in Binhai, which is the core carrying area for composite regional services and a concentrated area of construction activities integrating various urban functions. At the same time, this area is close to the Tianjin Economic and Technological Development Zone, which was first approved in 1984 (a national-level economic and technological development zone). The northern part of the research area is planned as an industrial warehousing area, with relatively low levels of park services, living circle services, organization, management, and development. Additionally, because this area is close to the Yongding River and is surrounded by various suburban parks, it is mainly focused on low-intensity development and ecological construction, resulting in lower scores for comprehensive suitability evaluations.
3.3.3. Coupling Relationship between Parks and Living Circles
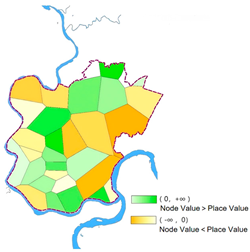
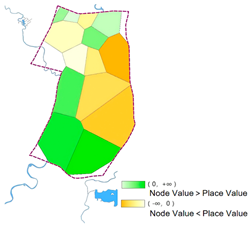
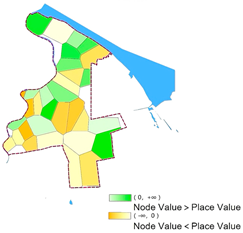
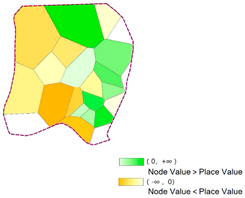
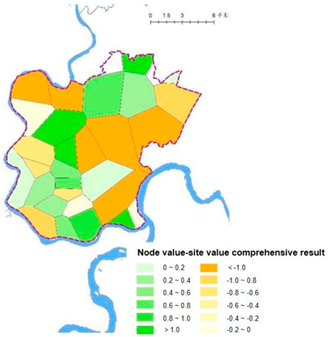
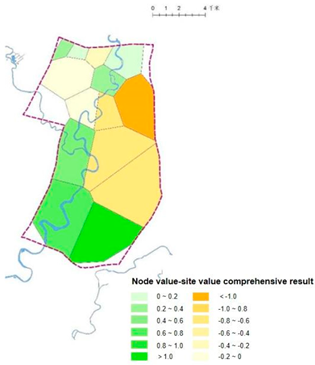
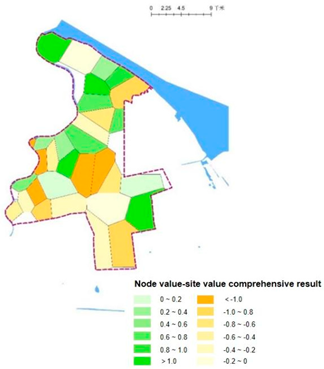
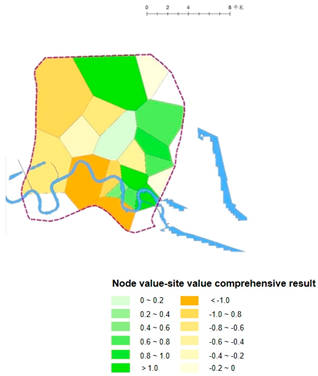
Building upon the previously established metrics for measuring the coupling relationship between parks and living circle services within spatial units, and based on the results of data preprocessing, spatial analysis and calculations were conducted on the spatial units delineated in the construction status of the four national-level new areas to obtain the coupling relationship results (Table 16 and Table 17). Subsequently, the differences in the composite indicators of place value and node value for each spatial unit in the four new areas were visualized. The results were categorized into two color schemes: the green scheme represents spatial units where the level of park service support exceeds the vitality of living circle function aggregation, while the yellow scheme represents spatial units where the vitality of living circle function aggregation exceeds park service support. Furthermore, the lighter the color, the more balanced the levels of living circle function aggregation and park service support, while the deeper the color, the greater the difference between them (Table 18).
Table 16.
Relative size information of place value (living circle function agglomeration) and node value (park service support).
Table 17.
Spatial unit suitability evaluation results for four national−level new areas.
Table 18.
Spatial unit suitability evaluation results for four national−level new areas.
The spatial distribution of coupling differences in the Liangjiang New Area in Chongqing exhibits a certain degree of scattering, especially from the northern part of the Jialing River along Longxi to the Ranjiaba Business District and Financial Center. The living circle function aggregation in these areas is similar to the level of park service support, especially near Panxi River Park. The park service level in the Longtousi Railway Station area is slightly higher, possibly because of its prominent function as a transportation hub. The spatial units in Liangjia and eastern Renhe clusters show relatively high levels of living circle function aggregation, which is related to early large-scale real estate development. The spatial distribution in the Tianfu New Area in Chengdu is similar to the suitability evaluation, with a more balanced distribution of living circle function and park service support in the northern part, while the differences are greater in the eastern and southern parts. Especially in the areas related to the Xin Chuan Innovation and Technology Park in the east, the park service level needs to be improved to match the vitality of living circle functions. The park service level in the southwest is higher than the vitality of living circle functions, indicating the need for further strengthening of urban construction and related services. In the Shanghai Pudong New Area, the spatial distribution is scattered, with less difference between living circle function and park service in the peripheral areas, while the differences are greater in the central areas, indicating an uneven coupling of node and place values. In the Tianjin Binhai New Area, most of the high-suitability areas exhibit small differences in function and service, but there are also a few spatial units with significant value differences, especially in the financial district and ecological protection areas, where park services need to be strengthened to improve the environment and vitality of living circle functions.
3.4. Cross-Sectional Comparative Analysis
3.4.1. Comparative Analysis of Spatial Unit Characteristics
Through the cross-sectional comparison of the construction status and planning schemes of the four national-level new areas (Table 19), there are significant differences in the number of parks between the western Liangjiang New Area and Tianfu New Area, indicating that these areas are still undergoing rapid development. In contrast, the number of parks in the longer-established Pudong New Area and Binhai New Area exceeds the planned figures. Regarding the coefficient of spatial variation, the current parks’ spatial units in Liangjiang, Tianfu, and Pudong are more dispersed than those in the plans, indicating a more balanced distribution of planned parks’ spatial units. In terms of average area and service radius, the planned park spatial units’ average area and average radius in the Liangjiang and Tianfu New Areas are smaller than those in the construction status, reflecting the emphasis on park spatial distribution and service suitability during planning. As construction progresses, the spatial division of parks and living circles in these areas will become more reasonable and better adapted to pedestrian characteristics. The larger scale of spatial units and average service radius in the Pudong New Area may be due to extensive zoning in the study area and the grid layout of urban parks. In the planned scheme of the Binhai New Area, the spatial unit scale and average service radius are also larger, possibly due to limitations in green space extraction in the planning scheme.
Table 19.
Cross-sectional comparison of spatial units related information for four national-level new areas.
3.4.2. Comparative Analysis of Spatial Suitability Evaluation
Based on the principle of cross-sectional comparability, the suitability evaluation results of each new area were reclassified using a uniform interval of 0.2 (Table 20). All four new areas have no units scoring below 0.2, so the smallest classification is 0.2–0.4. The classification results were unified into four levels: 0.2–0.4, 0.4–0.6, 0.6–0.8, and >0.8. Due to differences in the maximum and minimum values of the evaluation results in each new area, the number and specific values of the classifications obtained for each new area are different.
Table 20.
Grading of spatial unit suitability evaluation results for four national-level new areas.
- (1)
- Quantity Characteristics
In the spatial unit suitability evaluation of the four national-level new areas, scores are mainly concentrated in the 0.4–0.8 range. In the results of spatial unit suitability evaluation in the Liangjiang New Area, Tianfu New Area, and Pudong New Area, the proportion of units in the 0.6–0.8 range is the highest, while the Binhai New Area has the highest proportion in the 0.4–0.6 range. Scores above 0.8 are rare, with only one unit in the Tianfu New Area and one in the Pudong New Area exceeding 0.8. Trendline analysis shows that the suitability evaluation of the Tianfu New Area, Pudong New Area, and Binhai New Area shows a decreasing curve, indicating that the potential for improvement in the suitability of spatial units in these new areas is not significant. In contrast, Liangjiang New Area shows an upward curve, suggesting a trend of continuous improvement in the suitability of spatial units.
- (2)
- Spatial Distribution Characteristics
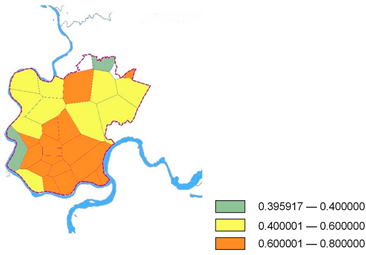
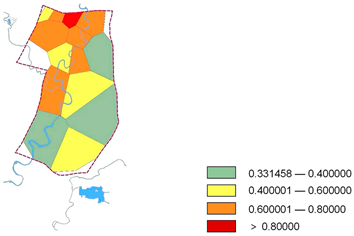
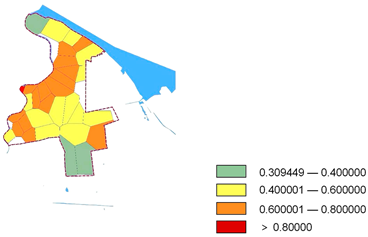
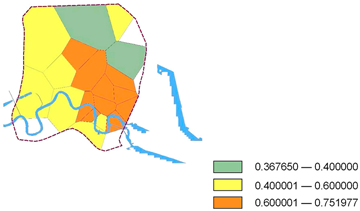
In the four national-level new areas (Table 21), spatial units in the 0.6–0.8 score range are closely related to rivers and lakes: spatial units in the Liangjiang New Area are located in the east, near the Yuzhong Peninsula and Jialing River; spatial units in the Tianfu New Area are distributed along the Fu River from north to south, near the central urban area; spatial units in the Pudong New Area extend along the Huangpu River; spatial units in the Binhai New Area are concentrated along the Hai River. These high-scoring intervals are closely related to the planned areas of urban centers, sub-centers, regional centers, cluster centers, and urban service centers, indicating relatively complete development in key planned areas and high compatibility with the spatial unit assessment under the coupling relationship between parks and living circles. Therefore, the spatial suitability evaluation scores are higher. As construction progresses, the spatial suitability of non-key planned areas is also expected to improve. For spatial units scoring in the 0.2–0.4 range, they are mainly distributed in the peripheral zones of each new area, which are close to urban inefficiently developed land or undeveloped construction land, usually belonging to restricted development areas with relatively lower service levels. In addition, when delineating spatial units, peripheral areas may not fully consider peripheral urban parks, resulting in the division of units being greater than the actual units, thereby affecting the evaluation results.
Table 21.
Spatial distribution of spatial suitability evaluation results for four national-level new areas.
3.4.3. Comparative Analysis of Coupling Relationship between Parks and Living Circles
- ➀
- Quantitative Characteristics
When studying the coupling relationship between parks and living circle services in the four national-level new areas, an analysis based on the NP model revealed certain key quantitative and spatial distribution characteristics (Table 21). In terms of quantity, the proportion of spatial units in each new area where the concentration of living circle functions is relatively balanced with park service support is roughly the same, ranging from 20% to 30%, indicating that approximately one-quarter of spatial units perform well in terms of coupling relationship. Additionally, the proportion of spatial units where node value is higher than place value is roughly balanced with the opposite situation, both approximately 50%, suggesting no significant regional differences within each new area in terms of park service and living circle vitality. Spatial distribution characteristic analysis shows that the differences in coupling relationships in each new area are finely graded based on the difference between node value and place value, using ±0.2 as the boundary for defining balanced coupling and further subdividing the degree of difference into six levels, thereby providing a clear perspective for understanding and comparing the coupling differences within each new area.
Summarizing and comparing the measurement results of the park and living circle service coupling relationships based on NP model in the four national-level new areas (Table 22), it is concluded that: (1) In the spatial units within the research areas of the four national-level new areas, although the level of concentration of living circle functions and park service support varies, the proportion of such units in the total number of units is between 20% and 30%, indicating that approximately one-quarter of spatial units have good park and living circle coupling relationships. (2) In the spatial units within the research areas of the four national-level new areas, the proportion of spatial units where the node value is greater than the place value is roughly balanced with the proportion of spatial units where the node value is less than the place value, both approximately 50%. This indicates that overall, there are no prominent phenomena of poor park service support or weak living circle vitality within each new area. The differences mainly exist within each spatial unit.
Table 22.
Horizontal comparison of information related to the coupling relationship between parks and living areas in four national-level new areas.
- ➁
- Spatial Distribution Characteristics
When analyzing the spatial distribution characteristics of the coupling relationship for the aforementioned new areas, visualization diagrams were created based on the difference in composite scores between the node value and the place value for each unit (Table 23). In conducting a cross-sectional comparison of the four new areas, based on the principle of comparability and considering the spatial units within ±0.2 as being near the X=Y reference line, indicating units where the level of living circle development is relatively balanced with the service support level of urban parks, the degree of coupling difference between parks and living circles for each new area was reclassified using a uniform interval of 0.2. For spatial units with differences greater than ±1, they were uniformly considered to have significant differences. The spatial units in the four new areas were divided into two categories: for units where the node value > the place value, the difference results were divided into six levels: 0–0.2, 0.2–0.4, 0.4–0.6, 0.6–0.8, 0.8–1.0, and >1.0; for units where place value > node value, the difference results were divided into six levels: <−1, −1.0~−0.8, −0.8~−0.6, −0.6~−0.4, −0.4~−0.2, and −0.2~0. The reclassified graded spatial distributions are shown in Table 22.
Table 23.
Spatial distribution of spatial suitability evaluation results for four national−level new areas.
4. Conclusions and Discussion
4.1. Conclusions
Through empirical analysis, this study explores the evaluation of spatial units in four national-level new areas under the coupling relationship between parks and living circles. This study clarifies the specific research areas of these new areas and elaborates on the methods of data acquisition and preprocessing in detail. By analyzing and comparing the characteristics of spatial units divided by existing parks and planned park schemes, as well as evaluating the quantity characteristics and spatial distribution characteristics of spatial units divided by existing parks and the coupling relationship between parks and living circles, this study establishes unified evaluation criteria and division bases and conducts a cross-sectional comparative analysis of the four new areas. The main conclusions are outlined as follows:
➀ The construction status and planned spatial unit average radius of the two western new areas are close to the ideal living circle spatial unit scale, showing a large CV and average service radius. This indicates that with the implementation of planning schemes, the area and average radius of these spatial units will be optimized to meet the acceptable walking distance better, thus better achieving the goals of the spatial units proposed in this study.
➁ The suitability scores of spatial units in the four new areas are mainly concentrated in the 0.6–0.8 range, consistent with the location of urban functional centers, indicating that the spatial suitability of priority construction and high-density construction areas is better. With continued development, it is expected that the suitability of other areas will also improve. In addition, spatial units with higher scores are generally associated with rivers and lakes.
➂ In terms of coupling relationship evaluation, the proportion of units in each new area where park service levels are well coupled with living circle activity levels is similar, accounting for approximately one-quarter. The difference between node value and place value is not significant within each new area, roughly balanced at approximately 50%. The spatial distribution of the two new western areas is similar to the suitability evaluation results, showing a higher degree of coupling. However, in the riverside spatial units of the Two Rivers, Pudong, and Binhai, especially the units planned as urban functional centers, there is a significant phenomenon of node value being significantly higher than place value, indicating that the park service level in these areas is high, but further optimization of living circle function organization and vitality is necessary.
4.2. Discussion
- ➀
- Method Limitations
In the construction of the evaluation model and the selection of indicators, further refinement and improvement of pertinence are needed. At the same time, the selection of some indicators is based on the purpose of data accessibility and convenient statistics, and there is a lack of indicator generalization. For example, in the evaluation of the service characteristics of the living circle, the service space agglomeration only uniformly divides the screened living circle service facilities POI, studies the density of facilities within the effective service radius (i.e., 1000 m) of the urban park, and does not classify and count the different service radii of the basic public service facilities and general life service facilities (in this article, other “necessary public service facilities” excluding “basic public service facilities”) (basic public service facilities are 500 m in the relevant standards and the ideal spatial unit diagram that this article attempts to construct, and general life service facilities are 1000 m in the relevant standards and basic diagrams).
- ➁
- Future Research Directions
Future research should incorporate dynamic analysis methods to track regional development changes more comprehensively. Increasing data source diversity and integrating more automated analysis tools can improve data accuracy and analysis objectivity. Moreover, further optimization and adjustment of evaluation standards and methods tailored to the specific characteristics of different regions can enhance their applicability and accuracy. Expanding the research sample to include more types of cities and new areas will increase the representativeness and generalizability of the research findings. These improvements will enable future studies to more comprehensively and accurately assess the coupling relationship between urban parks and living circles, providing more scientific evidence for urban planning and management.
Author Contributions
C.W.: Conceptualization, Investigation, Validation, Data Curation, Writing—Original Draft, Writing—Review and Editing, Visualization; Y.Y.: Investigation, Software, Validation; G.L.: Methodology, Software, Formal analysis; S.Y.: Project administration, Funding acquisition, Supervision. All authors have read and agreed to the published version of the manuscript.
Funding
This research is supported by National key R&D plan “Joint Research and Demonstration for Carbon Reduction Key Technologies in Urban areas and Neighborhoods” (NO.2022YFE0208700).
Data Availability Statement
The original contributions presented in the study are included in the article, further inquiries can be directed to the corresponding author.
Conflicts of Interest
The authors declare no conflict of interest.
References
- Wu, X.Q. Research on the Layout Structure of Green Space System in Mountainous Cities. Southwest University: Chongqing, China, 2009. [Google Scholar] [CrossRef]
- Wu, R.W. Hyde Park in the UK—The first urban park in the history of world gardens. Garden 2000, 3, 41–49. [Google Scholar]
- Zhang, X.L. Research on the Service Radius of Urban Park Green Space Based on GIS—A Case Study of Laohekou City; Huazhong Agricultural University: Wuhan, China, 2007. [Google Scholar] [CrossRef]
- Yuan, J.D.; Sun, Z.J.; Zhang, N.; Zhao, Z. Reconstruction of China’s urban regional system based on “daily life circle”. Geogr. Sci. 2005, 25, 17–22. [Google Scholar]
- Sun, D.F.; Shen, S.; Wu, T.H. Research on the allocation of county public service facilities from the perspective of life circle theory: Taking Pizhou City, Jiangsu Province as an example. Planner 2012, 28, 68–72. [Google Scholar]
- Waitt, G.; Knobel, H. Embodied geographies of liveability and urban parks. Urban Stud. 2018, 55, 3151–3167. [Google Scholar] [CrossRef]
- Stehman, S.V.; Wickham, J.D. Pixels, blocks of pixels, and polygons: Choosing a spatial unit for thematic accuracy assessment. Remote Sens. Environ. 2011, 115, 3044–3055. [Google Scholar] [CrossRef]
- Barbosa, O.; Tratalos, A.J.; Armsworth, R.P.; Davies, R.G.; Fuller, R.A.; Johnson, P.; Gaston, K.J. Who benefits from access to green space? A case study from Sheffield, UK. Landsc. Urban Plan. 2007, 83, 187–195. [Google Scholar] [CrossRef]
- Liang, T.; Jing, C.; Zhuo, F.; Feng, Y.; Zhang, H.; Fu, Y. Multi-Scale Dynamic Partitioning System of Urban Spatial Units. ISPRS Ann. Photogramm. Remote Sens. Spat. Inf. Sci. 2023, 10, 405–411. [Google Scholar] [CrossRef]
- Luo, S.; Liu, Y.; Du, M.; Gao, S.; Wang, P.; Liu, X. The Influence of Spatial Grid Division on the Layout Analysis of Urban Functional Areas. ISPRS Int. J. Geo-Inf. 2021, 10, 189. [Google Scholar] [CrossRef]
- Huang, Y.Y.; Lin, T.; Hu, D.J.; Xue, X.Z.; Zhang, G.Q. Research on the division technology of small-scale sea area spatial evaluation unit—Taking Dongshan Bay in Fujian Province as an example. Acta Ecol. Sin. 2021, 41, 707–716. [Google Scholar]
- Pang, W.Y. Research on the Division and Control of National Spatial Landscape Style Units from the Perspective of Overall Urban Design; Huazhong University of Science and Technology: Wuhan, China, 2022. [Google Scholar]
- Luo, J.C.; Zhou, C.H.; Liang, Y.; Zhang, J.S.; Huang, Y.F. Multi-scale spatial unit regional division method. Geogr. J. 2002, 2, 167–173. [Google Scholar]
- Chen, S.S.; Yang, G.; Liang, R.; Liu, L. Social performance evaluation of children’s outdoor activity space configuration in Beibei old city area of Chongqing. China Gard. 2020, 36, 87–91. [Google Scholar]
- Hao, X.Y.; Pan, Y.C.; Tang, X.M.; Qiu, H.; Liu, Y.; Ren, Y.M. Division method of land leveling unit in plain dry farming area based on spatial clustering. J. Agric. Eng. 2015, 31, 301–307. [Google Scholar]
- Ji, J.; Gao, X.L. Division of living space units based on residents’ daily travel. Prog. Geogr. 2012, 31, 248–254. [Google Scholar]
- Dong, X.; Xu, Y.; Huang, L.; Liu, Z.; Xu, Y.; Zhang, K.; Hu, Z.; Wu, G. Exploring Impact of Spatial Unit on Urban Land Use Mapping with Multisource Data. Remote Sens. 2020, 12, 3597. [Google Scholar] [CrossRef]
- Cheng, X.; Shen, Z.F.; Yang, B.H.; Liu, Y.; Zhang, Z.G. GIS simulation and evaluation analysis of environmental impact of urban master planning. J. Earth Inf. Sci. 2011, 13, 513–519. [Google Scholar]
- Bao, Z.T.; Jiang, D.Z.; Zhou, J.Y.; Huang, Y.X. Spatial unit delineation for national scale landscape planning management based on landscape feature assessment. China Gard. 2023, 39, 46–52. [Google Scholar]
- Yan, L.X.; Chen, J.N.; Zhang, S.W.; Wang, D.; Li, X.; Yin, Z.X.; Dou, Y. Planning simulation and evaluation oriented to spatial performance: Taking the unit planning of Hongqiao main city area in Shanghai as an example. Urban Plan. J. 2023, 5, 37–44. [Google Scholar]
- Grădinaru, S.R.; Iojă, C.I.; Pătru-Stupariu, I.; Hersperger, A.M. Are spatial planning objectives reflected in the evolution of urban landscape patterns? A framework for the evaluation of spatial planning outcomes. Sustainability 2017, 9, 1279. [Google Scholar] [CrossRef]
- Peng, J.; Peng, F.L. A GIS-based evaluation method of underground space resources for urban spatial planning: Part 1 methodology. Tunn. Undergr. Space Technol. 2018, 74, 82–95. [Google Scholar] [CrossRef]
- Wang, Y.D. Calculation of Regional Average Rainfall Using Thiessen Polygon Method Based on ArcGIS. Jilin Water Resour. 2024, 58–60+63. [Google Scholar] [CrossRef]
- Song, J.H.; Li, S.W.; Zhao, Z.Z.; Wu, S.L. Application of Thiessen Polygon in the Analysis of Spatial Distribution Characteristics of Residential Points: A Case Study of Lingao County, Hainan Province. J. Hainan Norm. Univ. (Nat. Sci. Ed.) 2013, 26, 223–226. [Google Scholar]
- Lu, L.; Deng, H.B. Research progress and prospect of node-place model and its application. Geogr. Sci. 2019, 39, 12–21. [Google Scholar]
- Reusser, D.E.; Loukopoulos, P.; Stauffacher, M.; Scholz, R.W. Classifying Railway Stations for Sustainable Transitions—Balancing Node and Place Functions. J. Transp. Geogr. 2008, 16, 191–202. [Google Scholar] [CrossRef]
- Yang, J.Y. Research on the Coordination Relationship between Land Use and Transportation in Shenzhen Based on the Node-Place Model; Harbin Institute of Technology: Harbin, China, 2017. [Google Scholar] [CrossRef]
- GB/T 51346-2019; Near Zero Energy Building Technical Standard. China Architecture & Building Press: Beijing, China, 2019.
Disclaimer/Publisher’s Note: The statements, opinions and data contained in all publications are solely those of the individual author(s) and contributor(s) and not of MDPI and/or the editor(s). MDPI and/or the editor(s) disclaim responsibility for any injury to people or property resulting from any ideas, methods, instructions or products referred to in the content. |
© 2024 by the authors. Licensee MDPI, Basel, Switzerland. This article is an open access article distributed under the terms and conditions of the Creative Commons Attribution (CC BY) license (https://creativecommons.org/licenses/by/4.0/).