Article

Durability Requirements for Reinforced Concrete Structures Placed in a Hostile Tropical Coastal Environment

by
Abel Castañeda Valdés
1,*,
Francisco Corvo Pérez
2,
Ildefonso Pech Pech
2,
Rigoberto Marrero Águila
3 and
Emilio Bastidas-Arteaga
4,*
1
Material Protection Laboratory, Environment Division, National Center for Scientific Research, Havana 6412, Cuba
2
Corrosion Research Center, Autonomous University of Campeche, San Francisco de Campeche, Campeche 24039, Mexico
3
Engineering Chemistry School, Technological University of Havana, Havana 19390, Cuba
4
Laboratory of Engineering Sciences for Environment (LaSIE) UMR CNRS 7356, La Rochelle University, Avenue Michel Crépeau, 17042 La Rochelle, France
*
Authors to whom correspondence should be addressed.
Buildings 2024, 14(8), 2494; https://doi.org/10.3390/buildings14082494
Submission received: 28 June 2024 / Revised: 24 July 2024 / Accepted: 7 August 2024 / Published: 12 August 2024
(This article belongs to the Collection Advanced Concrete Materials in Construction)

Abstract

:
In this work, a series of durability requirements are proposed for the construction of long-service-life reinforced concrete (RC) structures in a coastal environment with extreme atmospheric corrosivity. RC specimens were exposed in a coastal outdoor site in Cuba for three years. Carbon steel corrosion evaluation revealed an annual average atmospheric corrosion rate over the maximum limit established (ISO 9223:2012) for extreme (CX) atmospheric corrosivity. The service life of the RC structures, considered as the sum of the time-to-corrosion-initiation and time-to-corrosion-induced concrete cracking, was determined as a function of durability requirements. The most important durability requirements to achieve a long service life (>70 years) in RC structures subjected to a CX corrosivity category were defined as follows: water/cement ratio, compressive strength, percentage of effective capillary porosity, and concrete cover thickness. Under these hostile environments, the expansion of the corrosion products formed on the reinforcement steel and the induced cracking of the concrete could be attributed partially to the formation of the akaganeite phase in reinforcement steel, which revealed a different morphology compared to the akaganeite typically formed in bare carbon steels.

1. Introduction

Reinforced concrete (RC) dominates global construction due to its cost-effectiveness, streamlined manufacturing, and capacity to create a wide array of sections and structural elements [1,2]. Instances of a short service life ( S l ) for these assets are frequently documented, particularly in coastal environments, where atmospheric corrosion of rebar stands as the primary factor influencing the premature degradation of these structures [3,4,5,6,7,8]. Since maintaining the aesthetic, functional, and safety aspects of RC structures in coastal environments are major challenges, establishing concrete durability prerequisites to ensure a suitable S l for coastal RC structures becomes crucial to avoid direct and indirect economic losses [9,10].
Different research studies related to the durability of concrete and Sl of RC structures have been carried out under laboratory and on-site conditions during the few last years. Laboratory conditions generally simulate accelerated coastal environments. In [11,12,13,14], concrete and RC specimens were placed in salinity chambers and/or under total immersion in a NaCl solution simulating seawater. In addition, samples were exposed to the open atmosphere in rural and urban sites in Cuba. To simulate a short distance to the shoreline, a direct salt spray was applied [15,16]. Other research studies have been carried out in simulated concrete pore solutions [17,18,19,20,21]. To measure the corrosion rate of reinforcement steel at the time of exposure, different electrochemical techniques were used. In the research studies reported above, durability requirements in the concrete were not considered.
Regarding on-site diagnostic studies, durability requirements in the concrete are determined when the RC structures have reached a high level of deterioration due to the atmospheric corrosion of rebar in coastal environments [22,23,24,25,26].
Durability requirements are directly related to the concrete quality parameters determined before the construction of coastal RC structures as follows: water/cement (w/c) ratio, compressive strength (fck-MPa), ultrasonic pulse velocity (UPS-m s−1), effective capillary porosity (εe-%), density (D-kg m−3), and concrete cover thickness (CCth-mm). After construction, the electrochemical corrosion rate (Ic-μA cm−2) is an indicator of the atmospheric corrosion of the rebar in RC.
According to Tuuti’s model, the time-to-corrosion-initiation (ti) and the time-to-corrosion-induced concrete cracking (tcc) allow for the estimation of the Sl in RC structures [27,28]. These two stages constitute durability requirements that depend on concrete and exposure characteristics. Both stages can be assessed as a function of the atmospheric corrosion rate of reinforcement steel in RC. ti is reached when a certain threshold of the free chloride ion concentration (% in mass of concrete or % in mass of cement) is reached on the reinforcement steel surface. However, the free chloride ion concentration capable of initiating the atmospheric corrosion of the rebar and the ingress of chloride ion salts into concrete from outdoor exposure conditions in coastal zones are controversial worldwide [5,29,30]. To guarantee the expected Sl in RC structures, each country has criteria to achieve durability targets. The Sl depends on the concrete quality and the corrosivity category of the atmosphere. A fundamental engineering tool in the establishment and confirmation of the durability requirements for concrete, as well as for the proper selection of primary and secondary protection systems based on mortars and paints, is the estimation and determination of the corrosivity categories of the atmosphere, mainly in coastal environments and particularly at short distances to the shoreline. At these sites, RC and metallic structures can be considered [31,32]. It is important to remark new trends in ISO standards, including paint protection systems for steel offshore and related structures [33]. This standard was approved in 2018 and is the first time that protective paint systems have been recommended particularly for very aggressive coastal and marine environments. The corrosivity categories of the atmosphere are defined according to the ISO 9223:2012 standard [34].
In order to predict the Sl in RC structures, different mathematical–statistical models have also been proposed. However, few models have been developed for studying the placement of RC specimens in zones with tropical coastal environments at a very short distance to the shoreline and for considering the durability requirements obtained for different concretes [23,24,35].
Few reports concerning the determination of durability requirements in concrete to guarantee a long Sl in RC structures have been carried out in Havana or in all Cuban coastal environments. This location is characterized by a very hostile environment where corrosion starts and propagates quickly. As a result, many RC structures built at a short distance to the shoreline in Havana and in other coastal environments in Cuba have presented a short Sl [36]. Therefore, the main objective of this paper is to define the durability requirements for concrete to guarantee an adequate Sl for RC structures placed in these hostile Cuban coastal environments.
RC specimens with w/c ratios varying between 0.4 and 0.6 and with cover thicknesses of 20 and 40 mm were placed in a coastal outdoor exposure site (COES) for three years. The COES was situated 10 m from the shoreline in Havana, Cuba. Concretes were prepared in a concrete production plant. During the first year of the study, we determined the corrosivity category of the atmosphere. In addition, we also determined the following other concrete properties: fck-MPa, UPS-m s−1, εe-%, and D-kg m−3.
The Ic-μAcm−2 measured was our indicator of the magnitude of atmospheric corrosion. ti and tcc were obtained according to the behavior and prediction of the atmospheric corrosion of the reinforcement steel at the time of exposure. Hence, the Sl as a function of the durability requirements of the concrete was determined and predicted for the RC structures in the Cuban coastal environment. The results were confirmed with visual observations. To further deepen the obtained results, microstructural analysis techniques (DRX, SEM, and EDS) were used to characterize the rust layers in the third year of the study.

2. Experimental Procedure

2.1. Coastal Outdoor Exposure Site (COES)

RC specimens were exposed 10 m from the shoreline in Havana, Cuba, without a shielding effect (Figure 1a,b). The COES was located at a height of 11 m above sea level and placed at 23°07′18.0″ NL and 82°25′45.0″ WL.
During the first year of exposure, we determined the deposition of aggressive agents. We placed two dry plates (an absorbent cloth with dimensions of 320 mm × 220 mm [37]) and two cellulose filter plates (porous filter paper with an alkaline surface with dimensions of 150 mm × 100 mm [35]) on a wooden rack (Figure 1c). The dry plate device was used to assess the chloride deposition rate (ClDR-mg m−2d). The cellulose filter plate device was used to measure the deposition rate of sulfur compounds (SOxDR-mg m−2d). We positioned the four devices at a 45° angle from horizontal on the wooden rack, which was oriented toward the predominant wind direction to ensure the impaction of marine aerosols onto the surface. We placed these devices 3 m above the ground under a shed with a gabled roof, and they were protected from rain [37].
We exposed three RC specimens, each with a different w/c ratio, in the same open atmospheric conditions for three years: from 2008 to 2010 (Figure 1d).

2.2. Characterization of the Atmospheric Corrosivity Categories

The characterization of the atmospheric environment was carried out from October 2007 to September 2008 (first year). Two values of ClDR and SOxDR were determined monthly. The average values of the depositions of the two aggressive agents were monitored monthly. Monthly averages of meteorological parameters such as the relative humidity, RH, in %, air temperature, T, in °C, and wind speed, WS, in m s−1, were provided by the Meteorological Center (MC) in Havana, located 500 m from the COES (Figure 1b).
We used dose–response functions established in the ISO 9223:2012 standard to determine the annual atmospheric corrosion rate (rcorr-μm y−1) and to therefore establish the atmosphere corrosivity category for both exposed zinc and carbon steel at the COES [34]. The annual average values of T, RH, ClDR, and SOxDR were also monitored.
Regarding the dose–response functions, a wet candle device was used to determine the annual average ClDR. Thus, we recalculated the annual average ClDR data with the wet candle device (Swc) based on the annual average ClDR obtained from the dry plate device (Sdp) following the guidelines of the ISO 9225:2013 standard [34]:
S w c = 2.4   S d p

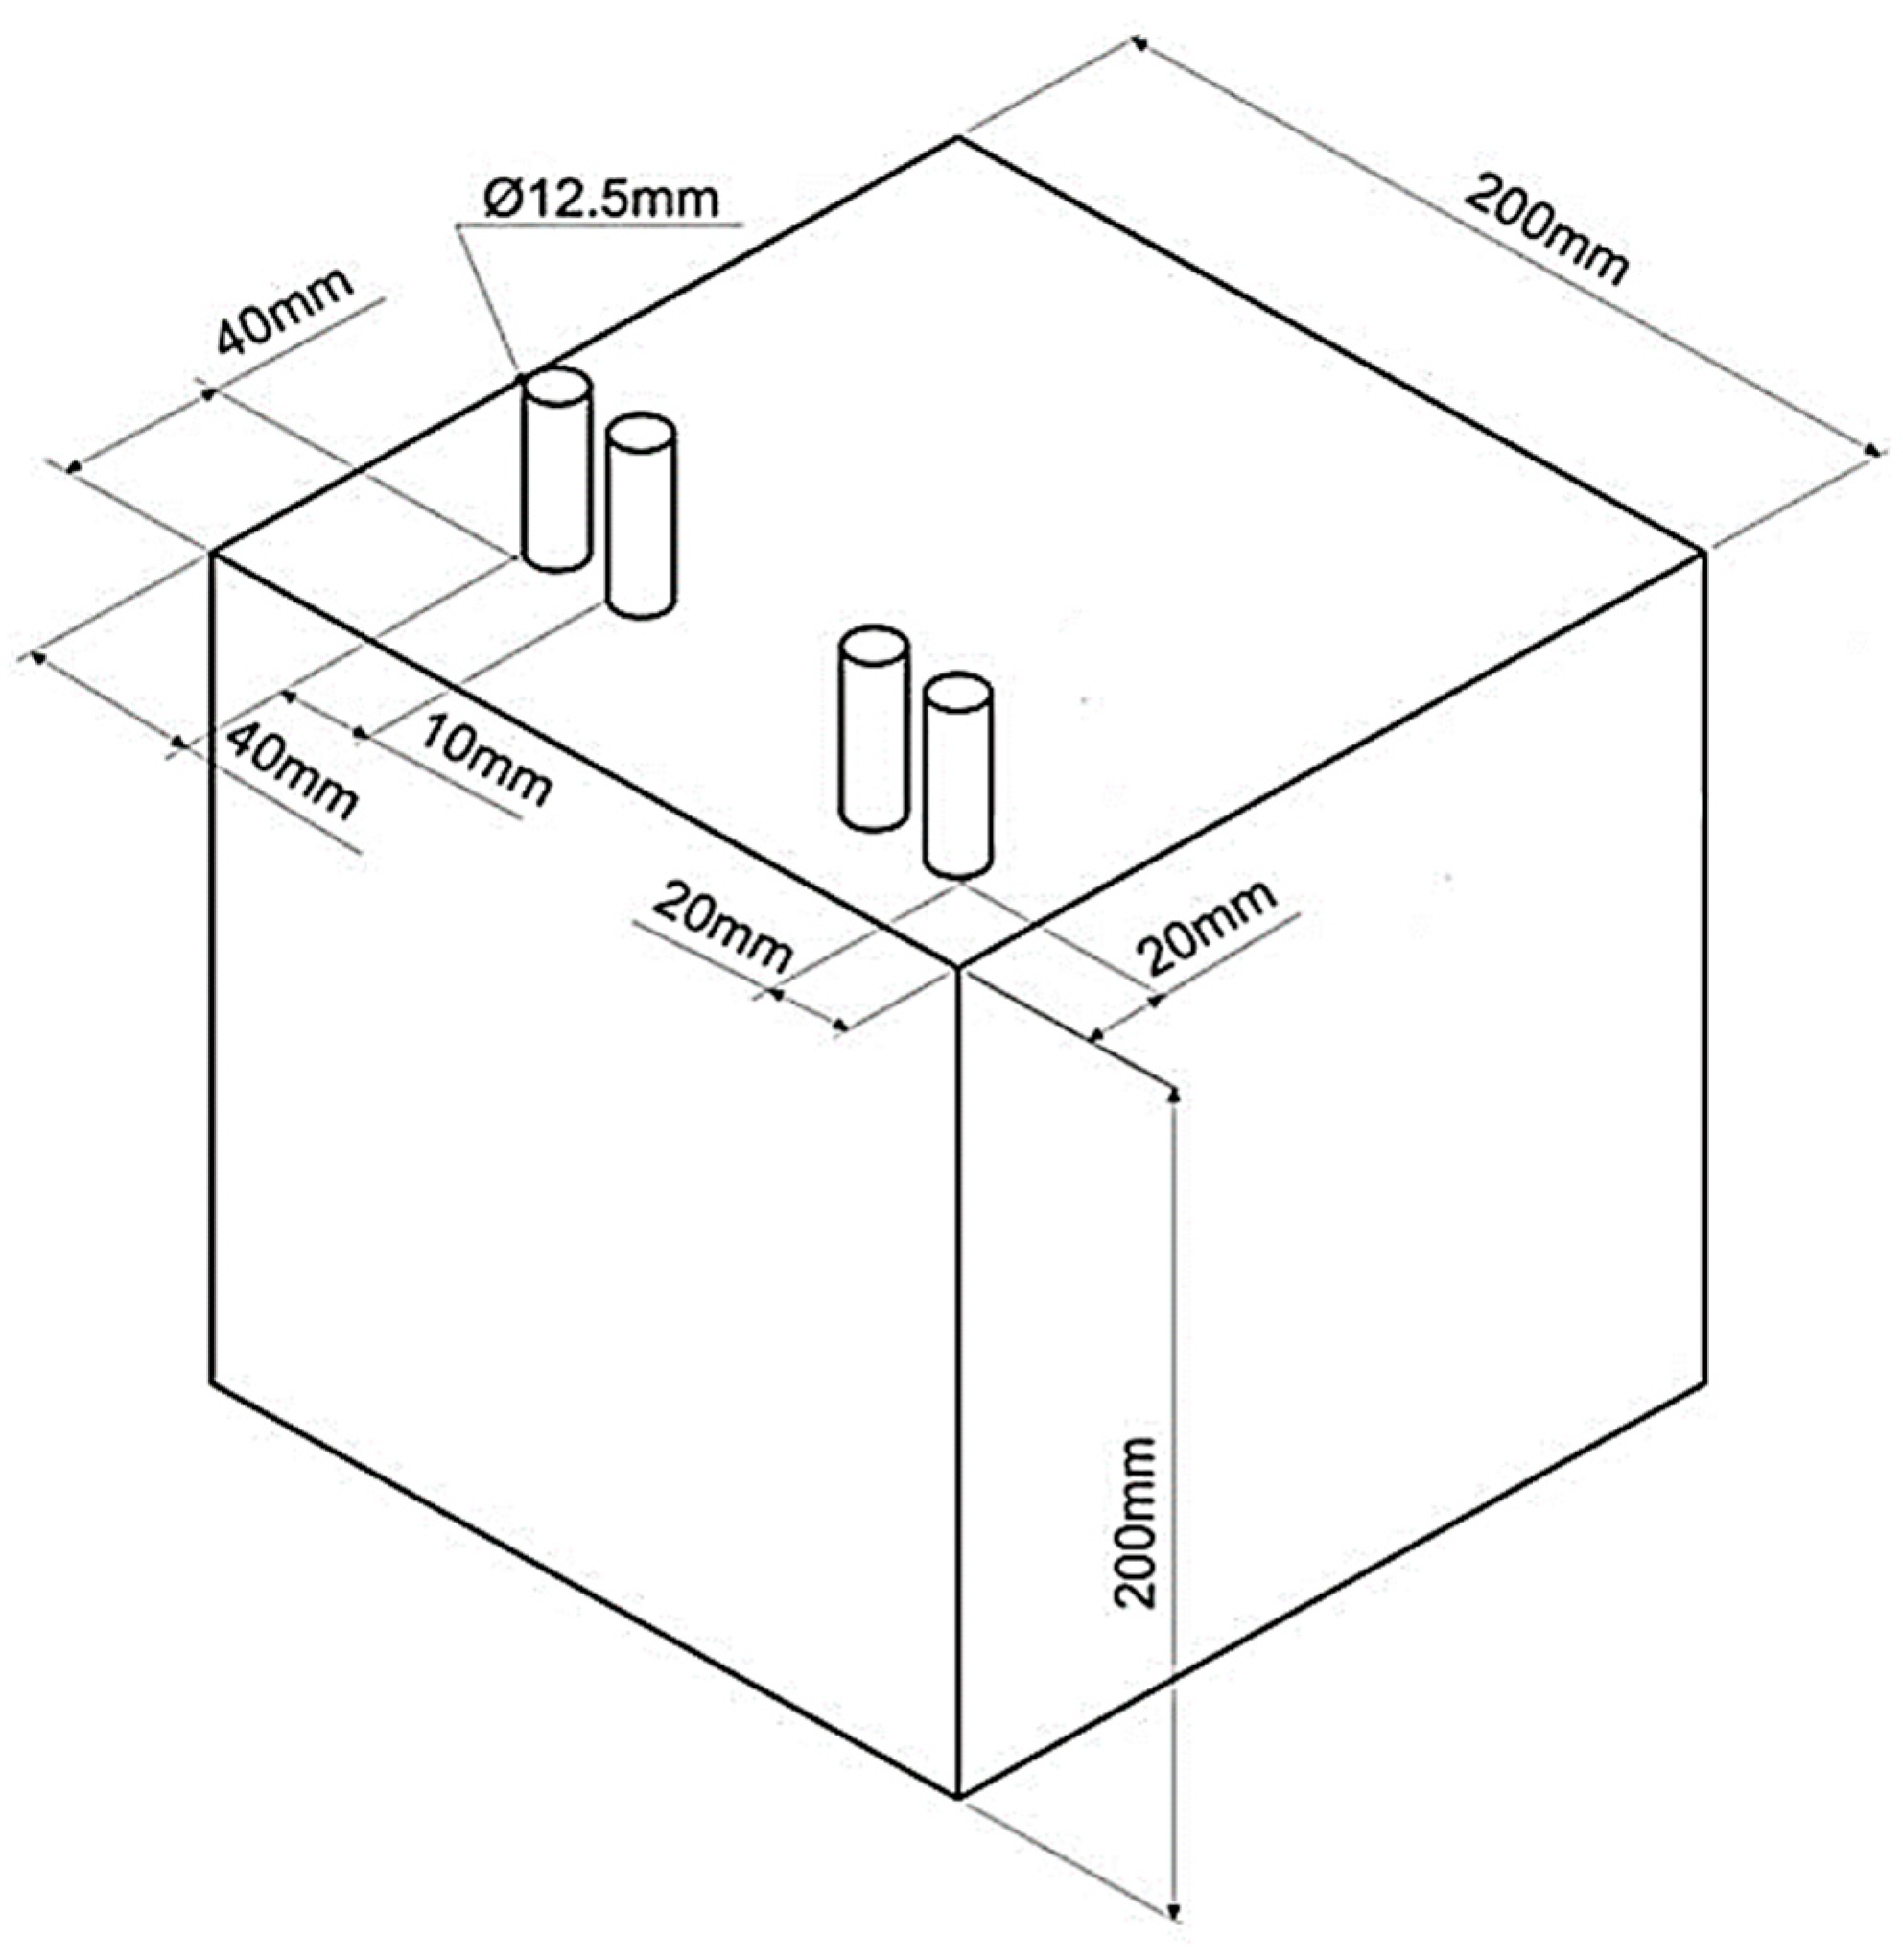
2.3. Preparation of Concrete and Reinforced Concrete (RC) Specimens

We used calcareous sand (modulus of fineness of 3.62) and ordinary Portland cement to produce the concrete. It also contained hard limestone gravel (nominal size of 19 mm) as its fine and coarse aggregates. Table 1 gives the chemical compositions of these materials.
Table 2 presents the three concrete mixtures considered in this study. Each mixture was characterized by a different water-to-cement ratio. All mixtures contained 365 kg/m3 of cement, 1030 kg/m3 of fine aggregate (sand from a river), and 750 kg/m3 of coarse aggregate. These formulations aimed at reducing the voids between the fine and coarse aggregates, thus providing fluid consistency and ensuring good compaction.
We prepared all the specimens according to Cuban standards [38]. Figure 2 shows the geometry of the specimens used in this study. A total of six specimens (two for each considered w/c ratio) were cast using carbon steel molds. Each specimen had rebars with different cover depths (CCTh of 20 and 40 mm). We placed three RC specimens with different w/c ratios at the COES. The remaining specimens were stored in the laboratory as references.
We used carbon steel bars as the reinforcements (200 mm in length and 12.5 mm in diameter). Before immersion in the fresh concrete mixture, the rebars were subjected to chemical cleaning. To remove poor corrosion products from the rebar surface, we used a solution consisting of 500 mL of concentrated hydrochloric acid (ρ = 1.19 g ml−1) and 3.5 g of hexamethylenetetramine diluted in distilled water up to 1000 mL. Afterwards, we cleaned the rebars with a high-pressure water jet, dried them with a cloth, and placed them in an oven at 50 °C for 45 min. Subsequently, we stored the rebars in desiccators [38]. The rebars were immersed in the concrete mixture. We left 40 mm of each rebar outside the specimens to be connected to electrochemical instruments. We protected the exposed parts of the rebars with adhesive tape.
We also prepared six concrete specimens, two for each considered w/c ratio, with the same form and dimensions as those in Figure 2 but without reinforcement steel. Additionally, we prepared 36 cylindrical concrete specimens (height = 300 mm and diameter = 150 mm), twelve for each w/c ratio, using carbon steel molds.
We used a vibrating table to compact both the RC and concrete specimens, ensuring the removal of entrapped air in the concrete mixture for each cubic and cylindrical mold. All molds were moistened before pouring in the concrete mixture.
The casted specimens remained in the molds for 24 h. Subsequently, they were cured for 28 days, with the average water temperature maintained at 23 °C [39].

2.4. Concrete Quality Analysis

We considered the procedures recommended by the DURAR net (CyTED program [40]) for ensuring concrete quality assessment. They refer to recommendations for the compressive strength, density, ultrasonic pulse velocity, and effective capillary porosity.

2.4.1. Compressive Strength (fck)

We used cylindrical concrete specimens and a testing machine with a maximum axial compression force of 2000 kN mm−2 to obtain 12 values of fck for all the considered w/c ratios using the method from [41] with a curing time of 28 days.

2.4.2. Density (D)

We determined 12 values of D in the fresh concrete for each w/c ratio. We measured the weight of each cubic carbon steel mold before pouring in the concrete mixtures. An AVERY balance, with a measuring range of from 200 g to 50 kg, was used to determine the density.

2.4.3. Ultrasonic Pulse Velocity (UPS)

We determined twelve UPS values (for each w/c ratio) using the three cubic unreinforced concrete specimens at a curing time of 28 days. We used the direct transmission method, obtaining four values between each pair of opposite sides [42]. We applied a thin layer of grease (petrolatum) to ensure good coupling and electric wave transmission between the transducers. We used a Tico Proceq Testing Instrument to perform these measurements. This equipment has a range of from 15 μs to 6550 μs (10−6 s) and a bandwidth of 54 Hz. Before starting the measurements, we calibrated the instrument using concrete reference bars.

2.4.4. Effective Capillary Porosity (εe-%)

We extracted three cylindrical concrete cores from the unreinforced cubic concrete specimens. We cut these cores using tungsten to obtain twelve cylindrical concrete specimens (diameter = 62 mm and thickness = 20 mm). This allowed us to determine twelve values of εe (for each w/c ratio) using the Göran Fagerlund methodology based on determining the capillary water absorption [43].

2.5. Electrochemical Characterization

We measured six electrochemical corrosion rate values (Ic in μA cm−2) for each rebar, i.e., for the two concrete cover depths (20 and 40 mm) and for the three exposed RC specimens, every year. These measures served as indicators of atmospheric corrosion. We measured the electrochemical corrosion rate for the reference specimens (stored in the laboratory) only during the first year.
We used a GECOR-8™ brand GEOCISA corrosimeter to measure the electrochemical corrosion rate. To enhance the electric conductivity of the measurement system, we placed a dampened cloth between the surfaces of the RC specimens and the instrument’s sensor. We positioned the sensor on the surface of the RC specimens by pressing it by hand (Figure 1e). The polarized surface area introduced to the instrument was 65.25 cm2. The potential range was ±20 mV with a sweep speed of 12 mV s−1. The instrument enabled the determination of the electrochemical corrosion rate using the Stern–Geary equation.
I c = B A R p
where A is the rebar polarized surface (critical) area, B is a constant equal to 26 mV, and R p is the polarization resistance. DURAR net (CyTED program) [40] provides various criteria regarding the electrochemical corrosion rate magnitude for the service life of RC structures.
To determine the RC structures’ durability requirements, we studied twelve values of Ic obtained during the third exposure year when considering twelve values of D, UPS, fck, and εe for all the contemplated concrete covers and w/c ratios.

2.6. Statistical Analysis

To determine which of the parameters defining the concrete quality were the most influential in terms of Ic for both concrete covers during the entire study, two statistical methods were used in this research work: multiple regression fitting and a comparison from multiple range tests.
For both statistical analyses, Ic (atmospheric corrosion indicator) was taken as the dependent variable. Parameters defining the concrete quality (w/c, fck-MPa, εe-%, D-kg m−3, UPS-m s−1) were taken as the independent variables.
The multiple regression used for the fit (n = 36) can be written as follows:
I c = a ± b w / c ± c f c k ± d ε e ± e U P V ± f D ,
where a, b, c, d, e, and f are coefficients that measure the increase or decrease in the effect of the independent variables on the dependent variable.
Regarding to the comparison from the multiple range tests (DUNCAN), homogeneous groups between the durability requirements (Ic-μA-cm−2, w/c ratio, εe-%, fck-MPa, D-kg m−3, and UPV-m s−1) were obtained according to the alignment on X homogeneous groups for both concrete covers during the entire duration of the study (n = 36). In order to confirm the result obtained, statistically significant differences between each pair of means were estimated (pairs: Ic-w/c, Ic-fck, Ic-εe, Ic-UPV, Ic-D, w/c-fck, w/c-εe, w/c-UPV, w/c-D, fcke, fck-UPV, fck-D, εe-UPV, and εe-D, UPV-D) for a limit of ±24.86 in both values of CCTh.

2.7. Prediction of Service Life (Sl)

To predict the Sl in the RC structures based on the estimation of ti and tcc, Ic was determined in the RC with a w/c ratio = 0.4 and values of CCTh = 20 and 40 mm, fitting the following linear power regression:
I c = r c o r r t k
where t (years) is the exposure time (from 1 to 66 years), Ic (μAcm−2) is the electrochemical corrosion rate (rebar atmospheric corrosion indicator), and r c o r r is the average Ic corresponding to the first year of study for the RC specimens with a w/c ratio of 0.4 and CCTh values of 20 and 40 mm exposed at the COES. According to ISO-9224:2012 [44], k is a time exponent equal to 0.52.

2.8. Microstructural Characterization

2.8.1. Scanning Electron Microscopy (SEM)

We obtained a sample of the rust layer from a rebar in the RC specimen with a w/c ratio of 0.6 and a CCTh of 20 mm after three years of exposure. The sample was observed by scanning electron microscopy and analyzed using an energy-dispersive X-ray detector to determine the chemical composition.

2.8.2. X-ray Diffraction (XRD)

We scraped off a powder sample from the same rust layer. We identified the crystalline phases using X-ray diffraction (XRD) with a Bragg–Brentano geometry and CuKα1 radiation (λ = 1.54056 Å). We obtained the X-ray diffractogram by scanning from 5 to 80° () in 0.02° steps with a time per step of 12 s.

3. Results

3.1. Description of the Typical Atmospheric Environment in the COES
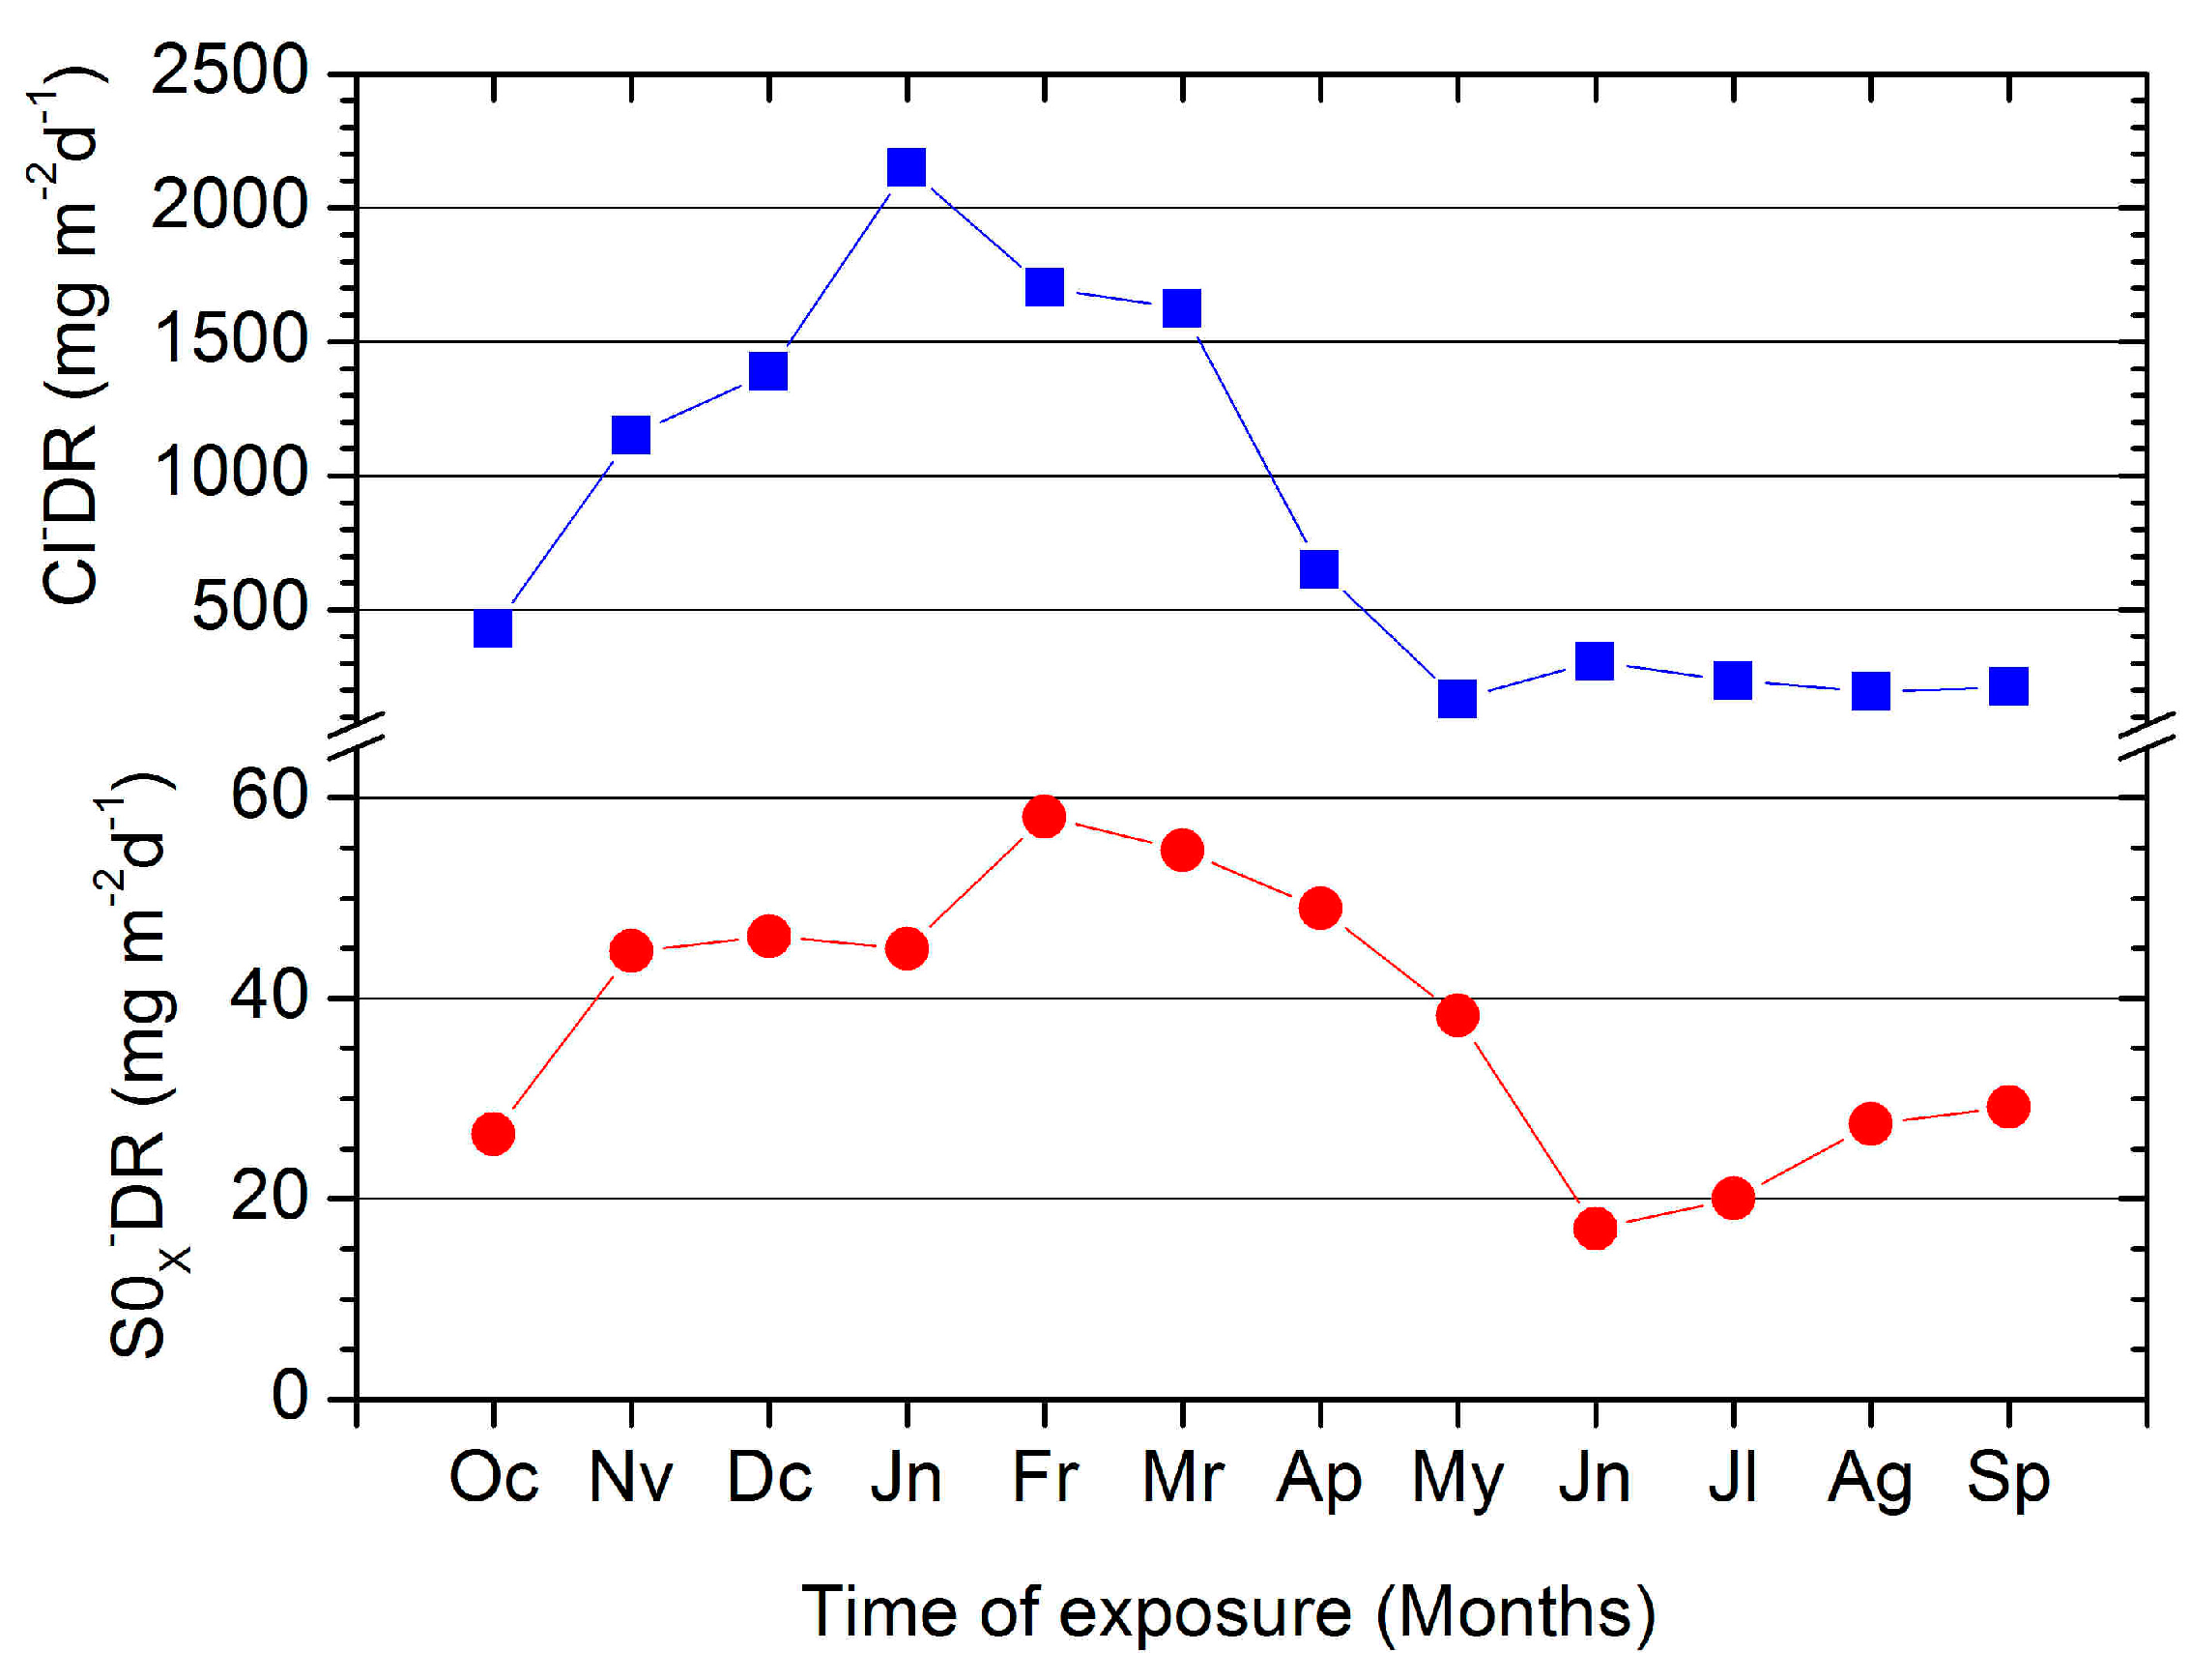
3.1.1. Monthly Mean Values of ClDR and SOxDR

A difference in the behavior of the monthly mean values of ClDR and SOxDR between the cold (dry) and summer (wet) seasons was observed at the COES located at a 10 m distance from the shoreline during the first year of the study (Figure 3). Due to the entry of frontal systems (cold fronts) coming from the north, higher values were obtained during the cold season (November–April). Therefore, the marine aerosols in the coastal environment of Havana, mainly at a short distance from the shoreline, carried both aggressive agents.
A fundamental factor in the early deterioration of metallic structures built using the most common metallic materials in the construction industry (carbon and galvanized steels, copper, and aluminum) caused by atmospheric corrosion in the Cuban coastal environment is the combination of ClDR and SOxDR [43]. High (C4) and very high (C5) corrosivity categories of the atmosphere were determined for each metallic material [45].
Despite the fact that during the summer season (May–October) the entry of frontal systems (cold fronts) coming from the north does not occur, the monthly values of ClDR and SOxDR can be considered high (Figure 3). In this way, existing and new RC structures could be exposed to high (C4), very high (C5), extreme (CX), and maybe higher-than-extreme (>CX) atmospheric corrosivity categories almost permanently. In order to ensure a long Sl in RC structures in Cuban coastal environments and worldwide, it is very necessary to consider the corrosivity categories of the atmosphere in terms of the durability requirements.

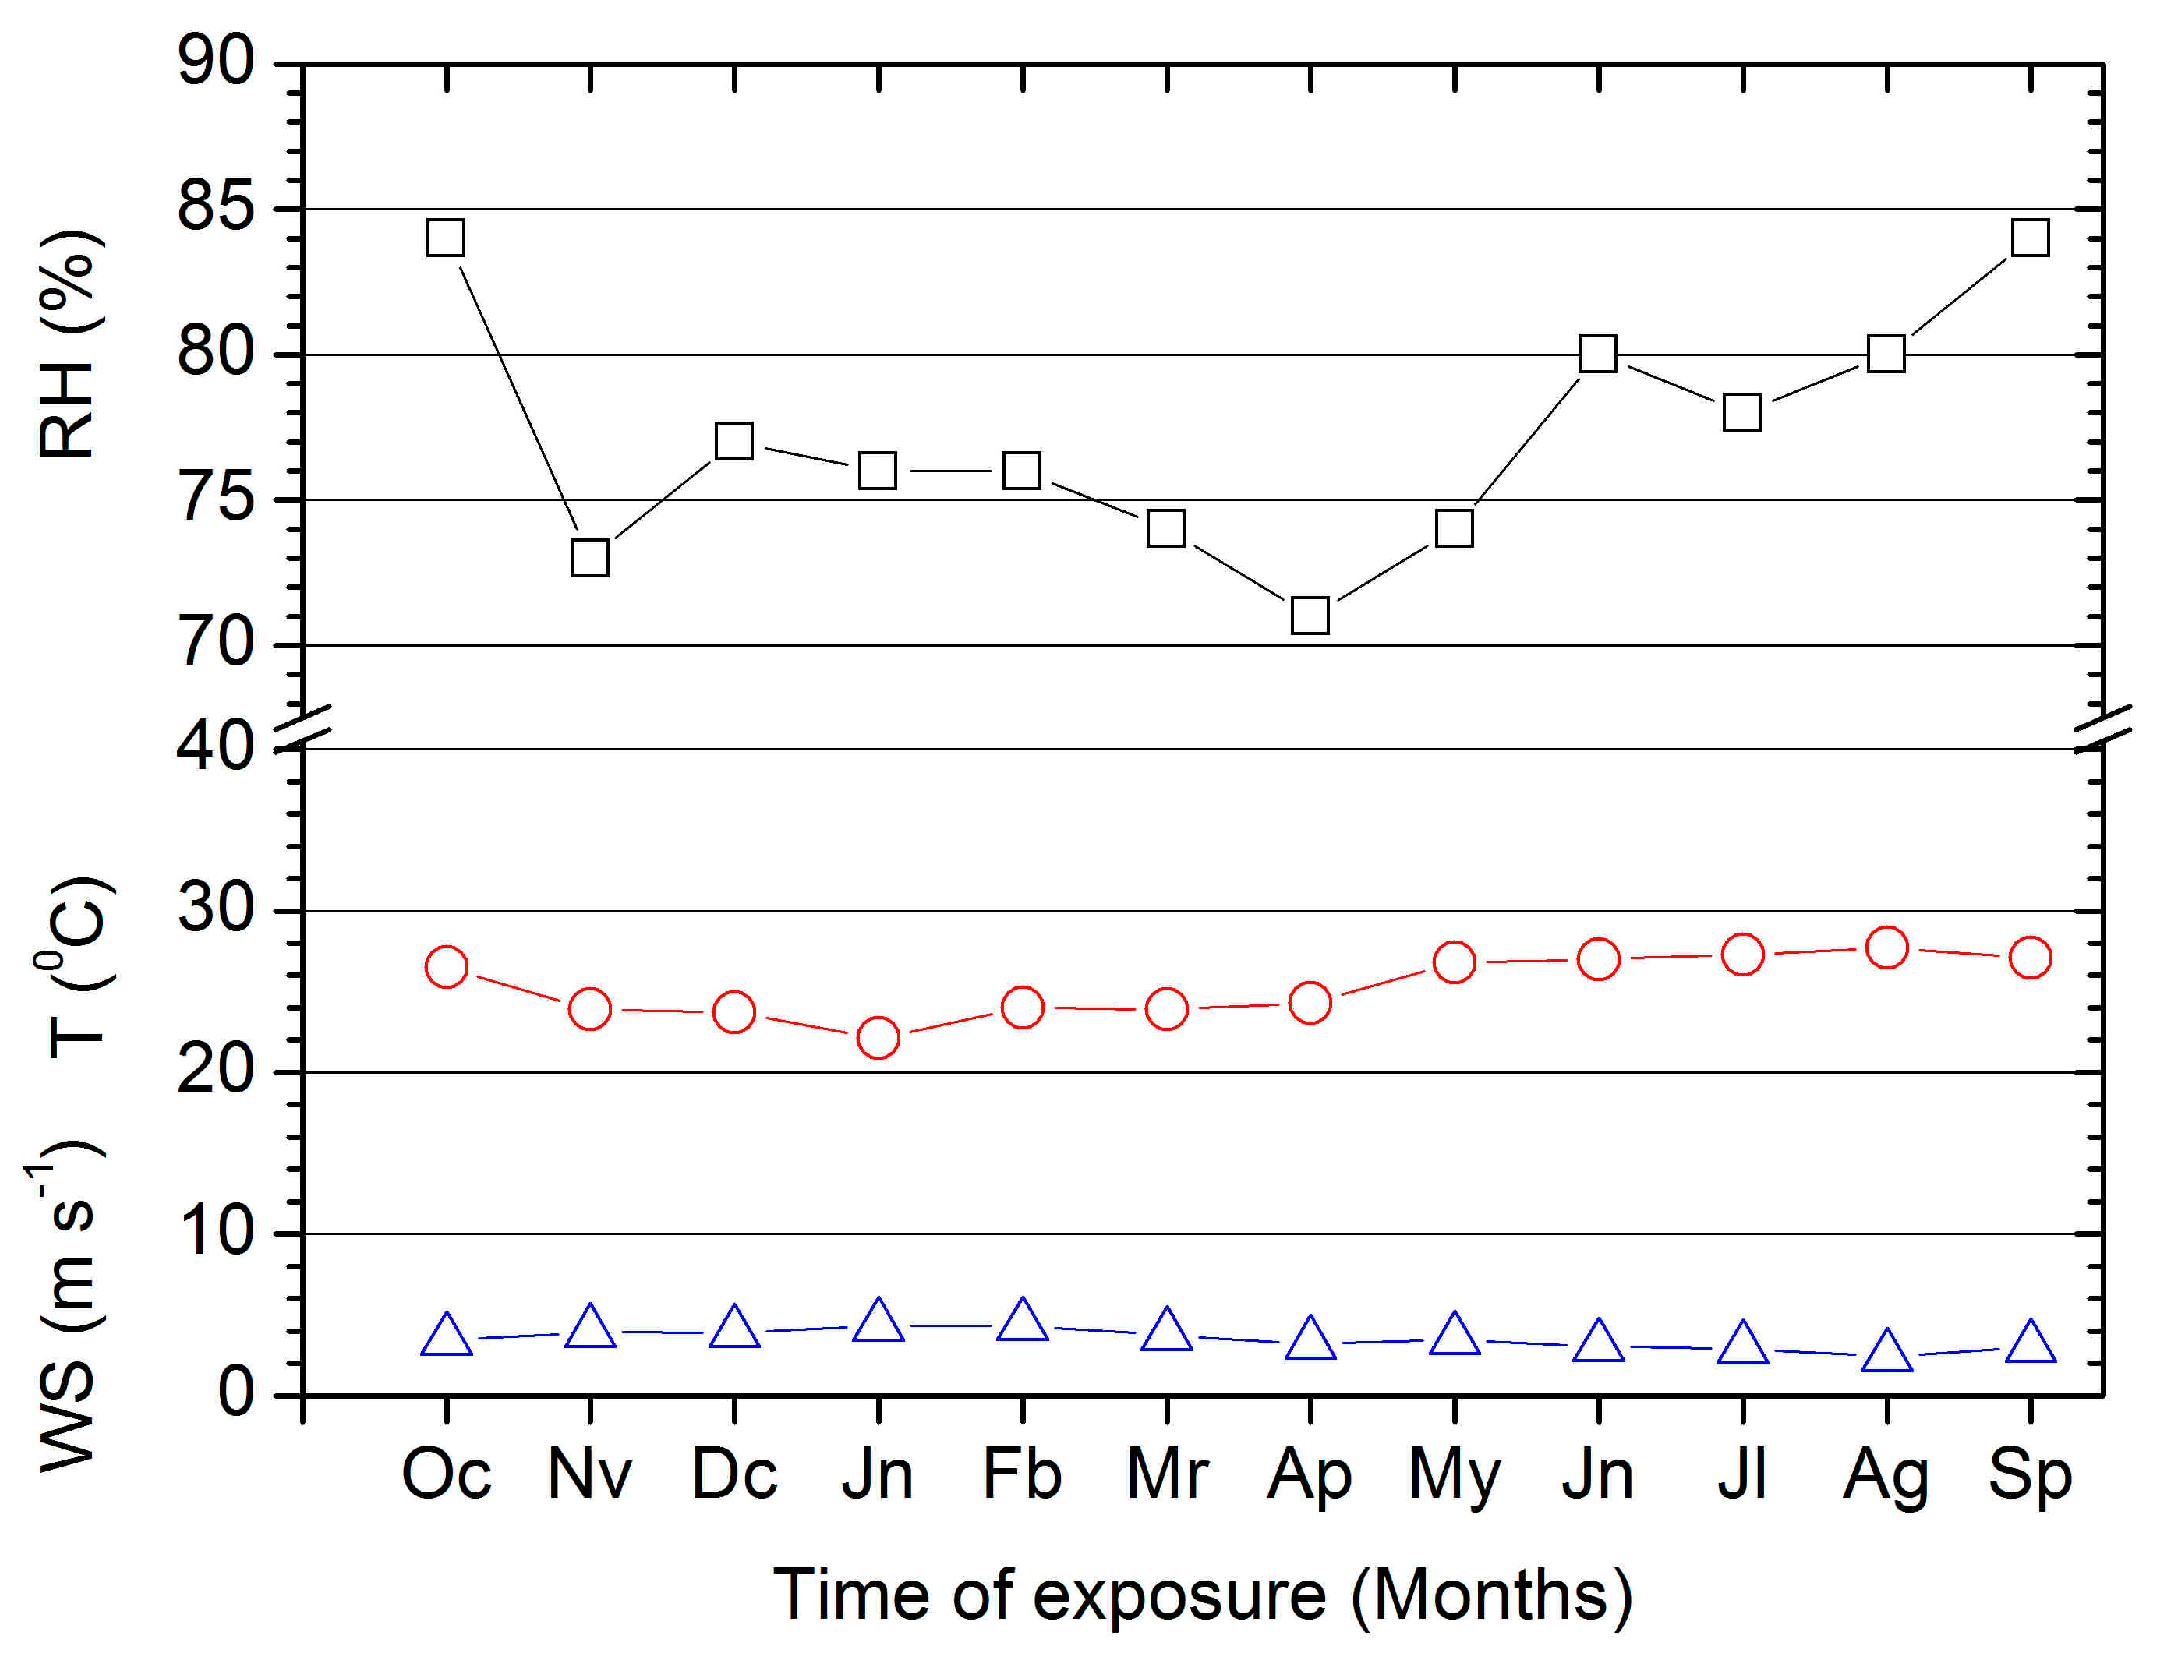
3.1.2. Monthly RH, T, and WS

The monthly average RH can be considered high due to the strong permanent impact of marine aerosols in the COES. The monthly average RH was higher in the summer season (May–October) due to the abundant rainfall (Figure 4). The annual average RH and T values were 78%, and 25.5°C, respectively. Very similar averages have been obtained in the last five years in the coastal city of Havana [46,47]. Thus, chloride ion salts coming from the sea, transported by marine aerosols, were deposited onto the RC structures as a saline solution and not in the form of dry salt crystals. This situation was also reported in the coastal city of Recife, Brazil [48,49]. In this way, a higher penetration of chloride ion salts into concrete should occur, mainly in RC structures made of low-quality concrete, which present a high percentage level of the effective capillary porosity (εe).
On the other hand, a higher monthly average WS and a lower monthly average T were determined in the cold season (November–April). Hence, the highest monthly average ClDR, and SOxDR were determined in the cold season due to the entry of cold fronts coming from the north (Figure 4).
A total of 17 cold fronts penetrated Havana City from October to April during the first year of the study, according to data from the Meteorological Centre of Havana (MC in Figure 1). Seven of these cold fronts were moderate. The monthly maximum sustained wind speed exceeded 9 m/s from November to March. Additionally, the monthly average ClDR was over 1000 mg m−2 d−1 (Figure 3).
The monthly average behavior of the above meteorological parameters during the first year of the study was consistent with the determination of high (C4), very high (C5), extreme (CX), and maybe higher-than-extreme (>CX) atmospheric corrosivity categories for RC structures.

3.2. Corrosivity Categories of the Atmosphere

According to the rcorr determined by the dose/response function, an extreme (CX) atmospheric corrosivity category was classified for carbon steel and galvanized steel (Table 3). In the case of galvanized steel, this involves the atmospheric corrosion of zinc. To build RC structures in coastal zones worldwide, galvanized steel (zinc coating thickness higher than 21 μm) has been used as reinforcement steel [50,51,52]. Therefore, RC structures in the coastal city of Havana, mainly at a short distance from the shoreline, are exposed to an extreme (CX) atmospheric corrosivity category. Hence, the phenomenon of the atmospheric corrosion of rebar has been or will be developed very intensively in RC structures built in this area, mainly those built with very-low-quality concrete. Therefore, the corrosivity category of the atmosphere can be taken as a durability requirement.

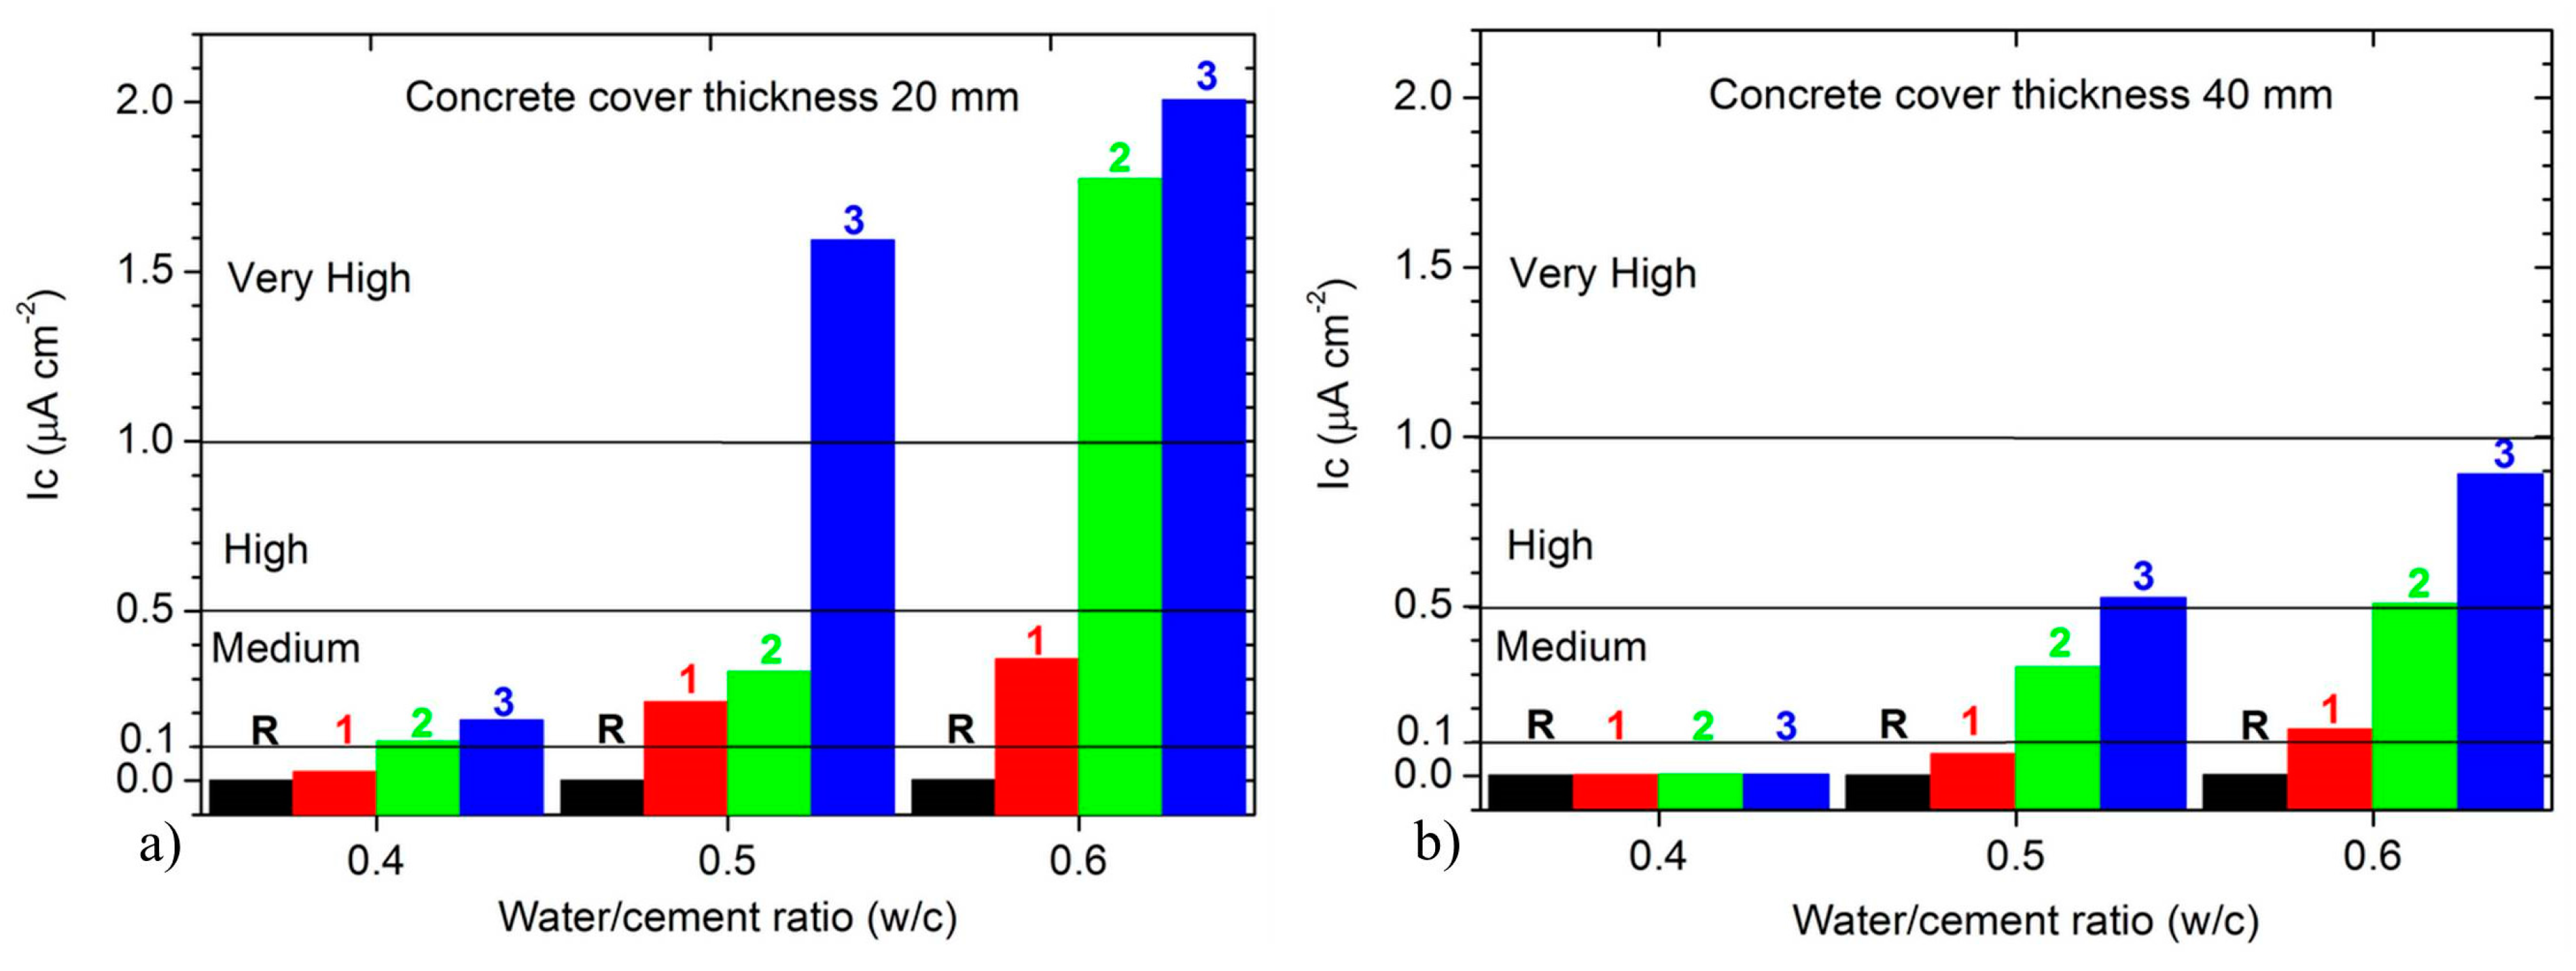
3.3. Electrochemical Corrosion Rate (Ic) and Durability Requirements

The behavior of the annual average Ic plotted versus the time of exposure determined for the six types of RC specimens (w/c ratio 0.4, 0.5, and 0.6 and CCTh of 20 mm and 40 mm) is presented in Figure 5. For a CCTh value of 20 mm, the increase was more marked (Figure 5a,b). The influence of the w/c ratio and CCTh on the electrochemical corrosion rate as an indicator of the atmospheric corrosion of the rebar in the RC specimens under the real exposure conditions and those exposed to the extreme (CX) corrosivity category of the atmosphere in the coastal environment at a short distance from the shoreline can be clearly observed. Ic increased for large values of the w/c ratio and for a small concrete cover thickness. These are the same factors that influence the R p as well as the Sl of RC structures.
Based on the criteria established in the DURAR net (CyTED program) about the Ic magnitude for the Sl of RC structures, the ti and tcc were obtained. The ti was considered when a medium level (0.1 < Ic < 0.5) was reached, and the tcc was considered when high (0.5 < Ic < 1) and very high levels (Ic > 1) were reached for the annual average values of Ic in the RC specimens. According to Tuuti’s model, the sum of both times allows for the estimation of the Sl in RC structures as a function of the concrete quality.
In this way, for the RC specimen with a w/c ratio 0.4 and with a CCTh of 20 mm, ti was reached in the second year of exposure (ti = 2 years). This is a very low value of the ti. However, the tcc was not reached during the three years of the study (Figure 5a). To predict the Sl when building RC structures, tcc can be determined from the prediction of Ic as an indicator of atmospheric corrosion using the model (Equation (4)). According to the model obtained, the tcc could be reached between six (tcc = 6 years) and ten years (tcc = 10 years) of exposure (0.5 < Ic < 1) (Figure 6). Costly repair works must be initiated between these values of the tcc. Hence, the Sl of RC structures made from concrete with a w/c ratio of 0.4 and a CCTh of 20 mm exposed to an extreme (CX) atmospheric corrosivity category should be between eight and twelve years. A long Sl in RC structures is not ensured.
In the RC specimens with w/c ratios of 0.5 and 0.6, the ti was reached in the first year (ti = 1 year). The tcc was reached in the third (tcc = 3 years) and second year (tcc = 2 years), respectively (Figure 5a). Therefore, the Sl of RC structures made from concrete with w/c ratios of 0.5 (Sl = 4 years) and 0.6 (Sl = 3 years) with a CCTh of 20 mm and exposed to an extreme corrosivity category (CX) does not exceed five years.
On the other hand, for the concrete with a w/c ratio of 0.4 and a CCTh of 40 mm, it seems that the reinforcement steels remained in a passive state during the three years of the study. An increase in the Ic was not obtained. The annual average Ic remained at a negligible level (Ic < 0.1), as happened in the RC specimens taken as references and kept in the laboratory (Figure 5b). However, the Sl could be predicted using the model (Equation (4)). According to the model obtained, the ti could be reached after 42 years of exposure (ti = 42 years) (Figure 6). Maintenance works, although less costly than repair works, could be initiated from that ti in RC structures. Therefore, a long Sl higher than 70 years can be ensured in RC structures exposed to a CX corrosivity category in the Cuban coastal environment.
For the RC specimens with w/c ratios of 0.5 and 0.6, ti was reached in the first (ti = 1 year) and second year (ti = 2 year), respectively. For both RC specimens, the tcc was reached in the third (ti = 3 year) and second year (ti = 2 year) (Figure 5b). Therefore, the Sl for RC structures with w/c ratios of 0.5 (Sl = 5 years) and 0.6 (Sl = 3 years) and with a value of CCTh of 40 mm exposed to extreme (CX) corrosivity does not exceed five years. A similar result was obtained for a CCTh value of 20 mm.
Concretes elaborated with w/c ratios = 0.5 and 0.6 and CCTh = 20 and 40 mm correspond to the most used design conditions for Cuban RC structures [53,54]. A short Sl, due to the atmospheric corrosion of rebar, has been determined for many RC structures in all Cuban coastal environments [55]. Hence, to ensure a long Sl in RC structures built in Cuban and other tropical coastal environments worldwide, it is very necessary to define appropriate concrete durability requirements.
Based on the behavior of the Ic determined in the third year of exposure for the RC specimens as a function of the w/c ratios, CCTh, and the corresponding values of fck, εe, UPS, and D, durability requirements were obtained.
The Ic decreased as function of fck, UPS, and D, while the opposite happened for the εe (Figure 7). It was observed that for a CCTh value of 40 mm and a w/c ratio of 0.4, the Ic was lower than 0.1 μA cm−2; this is an indicator of the atmospheric corrosion of the rebar in the RC specimens exposed for the three years (Figure 7).
Therefore, it was confirmed that the rebars remained in a passive state for the different values of fck, εe, UPS, and D. To ensure a long Sl in RC structures that are currently under construction in Cuban coastal environments exposed to high (C4), very high (C5), extreme (CX), and above-extreme (>CX) atmospheric corrosivity categories, Table 4 provides the ranges of these parameters directly linked with concrete quality that should be taken as durability requirements. In addition, ti = 42 years must be taken as another durability requirement.

3.4. Macroscopic Analysis

High induced cracking caused by the expansion of the corrosion products of the rebar was observed in the RC specimens when the w/c ratios increased for both CCTh values used in the third year of the study (Figure 8). Concrete cracking, as expected, was more noticeable for a CCTh of 20 mm. However, cracking began after two years in the RC specimens with w/c ratios of 0.5 and 0.6 for both values of CCTh. The appearance of cracks coincided with the tcc values obtained in the RC specimens with w/c ratios of 0.5 and 0.6 and for both CCTh values. The influence of the CX corrosivity category on the RC structures (with w/c of 0.5 and 0.6 and CCTh values of 20 mm and 40 mm) was confirmed.
A higher penetration of chloride ions was caused by the induced cracking. The RC specimens with w/c ratios of 0.5 and 0.6 and with CCTh values of 20 mm and 40 mm did not ensure suitable primary protection as a physical barrier for the protection of the rebars. In this way, the RC structures did not maintain their initial design conditions over time in the entire Cuban coastal environment.
The induced cracking confirms that the Sl for RC structures already built and exposed to extreme (CX) atmospheric corrosivity categories does not exceed five years. Therefore, concrete that does not meet the defined durability requirements cannot ensure a long Sl for RC structures in the Cuban coastal environment.

4. Discussion

4.1. Corrosivity of the Atmosphere

According to research works carried out in all Cuban coastal environments during the last century, an extreme (CX) atmospheric corrosivity category was obtained for carbon steel (rcorr = 443.72 μm y−1, for CX: 200 < rcorr < 700) in the coastal city of Havana. The annual average value of ClDR determined by the dry plate device was 919.3 mg m−2 d−1. The COES was placed at a 10 m distance from the shoreline and was very close to the COES used in this study [56,57].
Taking into account some of the research work carried out in the last 20 years and over the last century (ISOCORRAG, ICP/UNECE, and MICAT Databases) worldwide, an extreme (CX) atmospheric corrosivity category for carbon steel was obtained [58]. The annual average values of ClDR were determined using a wet candle device in different coastal cities. It should be noted that this annual value of the atmospheric corrosion rate for carbon steel (443.72 μm y−1, for CX: 200 < rcorr < 700) is only lower than those determined in Iran and Saudi Arabia (Table 5).
The monthly ClDR has been determined using a dry plate device in all Cuban coastal environments [56,57]. Regarding to the behavior of the monthly mean values of ClDR, the annual average was determined to be 851.04 mg m−2 d−1 (Figure 3). Despite the fact that a dry plate device was used, both the annual average values of ClDR determined in the COES placed in the coastal city of Havana (919.3 mg m−2d−1 and 851.04 mg m−2d−1) can be considered very high. The annual ClDR average was lower than that determined in the coastal environments of Mexico [59] (Table 5).
According to the relationship established in the ISO standard, i.e., Equation (1), the annual average values of ClDR determined by the wet candle device were 2206.32 mg m−2d−1 (919.3 mg m−2d−1) and 2042.49 mg m−2d−1 (851.04 mg m−2d−1). No reports have been found where the annual average values of ClDR have turned out to be greater than those determined in this work. Annual average values of ClDR closer to those determined in this study have been reported in the coastal cities of Sherman, Panama (1909.11 mg m−2d−1), and Cabo Villano, Spain (1906.0 mg m−2d−1) [60]. However, the wet candle devices remained for one month at the two COESs for a time of exposure of six months.
On the other hand, a research study about the atmospheric corrosion of carbon steel was carried out over the entire coastal environment of Havana for one year (April/2018–March/2019). Ten COESs were placed at a distance of 10–20 m from the shoreline. The annual average atmospheric corrosion rate determined for two carbon steel specimens placed at one of the COESs was 849.23 μm y−1 (200 < CX < 700). A value over the maximum limit established in the ISO 9223:2012 standard for the classification of an extreme (CX) atmospheric corrosivity category for carbon steel was obtained. A new corrosivity category of a higher-than-extreme atmosphere (>CX) or an increase in the range of CX corrosivity could be considered. Visual observation of the two specimens allowed for confirming the very high annual average corrosion rate determined. Intense deterioration due to atmospheric corrosion was observed (Figure 9). In addition, due to the occurrence of pitting corrosion, some of the carbon steel specimens were pierced. These results indicated that the coastal city of Havana is among the most corrosive sites worldwide, mainly in the coastal environments at a short distance from the shoreline. Many RC structures have presented a short Sl due to atmospheric corrosion of rebar. To ensure a long Sl in RC structures exposed to a CX corrosivity category, the definition of durability requirements becomes paramount.

4.2. Durability Requirements

The model used (Equation (4)) to predict the Sl in the RC structures based on their behavior is established in the ISO 9224:2012 standard [44], which is designed for the atmospheric corrosion of metals. In our case, the Ic in addition to the requirement for durability is used as an indicator of the atmospheric corrosion of rebar. According to the theoretical Ic values predicted from the model, atmospheric corrosivity categories were predicted for times of exposure higher than one year for metallic materials that are most often used in the construction industry (carbon steel and galvanized steel). High (C4), very high (C5), and extreme (CX) atmospheric corrosivity categories were considered for both metallic materials as durability requirements for metallic structures in Cuban coastal environments and in Ecuador [61,62]. The annual atmospheric corrosion rate of carbon steel and galvanized steel specimens was obtained during the first year of the study. The COESs were placed at a short distance from the shoreline.
Considering the experimental values obtained for the Ic as an indicator of the atmospheric corrosion of the reinforcement steel in the RC specimens with w/c = 0.4 and with CCTh values of 20 mm (rcorr = 0.065 μA cm−2) and 40 mm (rcorr = 0.002 μA cm−2) that were exposed during the first year, a prediction was made for the RC structures using the same model, i.e., Equation (4) (Figure 6). In this way, the tcc was obtained for a CCTh of 20 mm, and the ti was obtained for a CCTh of 40 mm. According to the specifications established in the ISO 9224-2012 standard, the value “n” in the model was established to be equal to the average time exponents reported in the regression analysis of the carbon steel specimens exposed for a long time in the ISO CORRAG project [58].
Worldwide, few studies have been carried out to establish durability requirements that guarantee a long Sl in RC structures based on exposure to the atmosphere in real coastal conditions. A comparative study of different electrochemical techniques used to measure the corrosion rate of reinforcement steel in RC specimens placed in marine environments is reported [63]. The different electrochemical techniques were as follows: galvanostatic pulse, electrical resistivity, and half-cell potential. Exposure to the atmosphere in coastal environments was not considered. Corrosion of the reinforcement steel under splash conditions was higher than under tide conditions. The methodology used was not very accurate for the determination of the ti. The evaluation was carried out only for one CCTh value. A clear relationship between the ti determined in the tidal environment and in the splash environment was not observed. However, the ti decreased when the w/c ratio increased from 0.35 to 0.5. The tcc was not determined, and the Sl of the RC structures exposed to the marine environment was not presented. Durability requirements directly related to the parameters that characterize the concrete quality were not considered.
On the other hand, an international research project involving 11 Ibero-American countries was conducted to study the effect of coastal environments on RC structures over one year of exposure. RC specimens were prepared using locally available materials in each country [64]. A description of the typical atmospheric environments of the eleven COESs located in coastal cities was given. Two types of RC specimens (w/c = 0.45 and 0.65, CCTh = 10, 20, and 30 mm) were exposed at each site, with the atmospheric corrosivity categories estimated as high (C4) and very high (C5). The fck, elastic modulus, permeability to free chloride ion concentrations, and εe were measured for the concrete quality characterization. The time taken to initiate depassivation, considered as ti, was determined only from the behavior of the electrochemical corrosion rate of the reinforcement steels in the RC specimens with a w/c ratio of 0.65 at the time of exposure in two countries (Portugal and Venezuela). However, the tcc was not determined. In this way, the Sl of RC structures exposed to coastal environments was not obtained.
To predict the Sl for RC structures built in coastal environments worldwide, nine models were obtained via multiple regression fitting [65]. The Ic was measured using different electrochemical techniques under laboratory and on-site conditions. The Ic determined in the reinforcement steel was highly sensitive to three parameters related to concrete quality: the corrosion time, concrete resistivity, and concrete chloride content. To predict the Sl in RC structures, the ti, and tcc determined from the behavior and the prediction of the Ic could be included in the corrosion time, depending on the concrete quality.
According to the behavior observed during the third year of this study (Figure 7), the data were fitted to a multiple regression model (Table 6). The w/c ratio, fck, and εe were the most significant parameters related to the Ic measured in the reinforcement steel for both values of CCTh during the three years of this study.
Multiple regression fitting has been widely used to define factors that are more statistically significant in the atmospheric corrosion of metallic structures in the tropical coastal climate of Cuba and worldwide; ClDR, a high RH, and T are the factors that most often influence atmospheric corrosion [66].
Regarding the comparison from the multiple range test method, following the same behavior shown during the third year of this study (Figure 7), two homogeneous groups were identified according to the alignment of the X column (Table 7). Thus, there were no significant differences between the groups sharing the same column. The w/c ratio and εe for both concrete cover thicknesses fell into the first homogeneous group (X column). The fck and εe fell into the second homogeneous group (Table 7).
Table 8 provides the estimated differences between each pair of means. The asterisks next to the 11 pairs indicate that these pairs showed statistically significant differences at the 95.0% confidence level for a limit of ±24.863 in both values of CCTh. No report was found where the comparison from the multiple range test method has been applied to determining which durability requirements are the most sensitive to the Ic in reinforcement steel.
Due to the fact that the sample sizes were equal (n = 36) and the treatments presented an ordinal relationship (Figure 7), the multiple range test method was performed. According to the two statistical methods applied, the w/c ratio, fck, and εe were the parameters that were the most sensitive to the Ic as an indicator of atmospheric corrosion in the reinforcement steel for both values of CCTh.
The nine models chosen did not consider these last two parameters [65]. The fck was only considered in the predictive models proposed by Lu and Vu in their research works about the modelling of corrosion propagation for the Sl prediction of chloride-contaminated RC structures and in measuring the structural reliability of concrete bridges, including improved chloride-induced corrosion models, respectively [67,68]. Therefore, to ensure a long Sl in RC structures in the Cuban coastal environment exposed to extreme (CX) and above-extreme (>CX) atmospheric corrosivity categories, the most important durability requirements are a w/c ratio of 0.4, fck, and εe, with a CCTh of 40 mm. In this way, a free chloride ion concentration of less than 0.05 (% m.c.) could be achieved. The same free chloride ion concentration (% in m.c.) was considered in a case study of the deterioration of RC docks in a marine environment in Portugal [69].

4.3. Microstructure of Rust Layers

Different crystalline phases such as lepidocrocite ( γ F e O O H ) , goethite ( α F e O O H ) , magnetite ( F e 3 O 4 ) , and akaganeite ( β F e O O H ) were identified in the rust layers of the reinforcement steel embedded in the RC specimen with a w/c ratio of 0.6 and a CCTh value of 20 mm placed at the COES until the third year of exposure (Figure 10).
Similar crystalline phases have been identified in carbon steel specimens freely exposed to high (C4) and very high (C5) atmospheric corrosivity categories in the entire Cuban coastal environment and worldwide [70,71]. Induced cracking in the CCTh due to the atmospheric corrosion of the reinforcement steel tends to further accelerate this process.
The morphology of the crystalline phases identified in the oxide layer formed on the reinforcement steel was observed using the scanning electron microscopy microstructural analysis technique (Figure 11a–d).
Lepidocrocite in a foam form, flower-shaped goethite, and ring-shaped magnetite showed a similar morphology compared to the oxide layers identified in the carbon steel specimens freely exposed to high (C4) and very high (C5) atmospheric corrosivity categories all Cuban coastal environments and worldwide [70,71]. The EDS analysis carried out on the morphologies associated with lepidocrocite, goethite, and magnetite (Figure 11b) revealed high percentages of iron (>90 wt.%) and low concentrations of oxygen (<5 wt.%) as well as the absence of the chlorine element (Cl). Therefore, these results corroborate the fact that these morphologies identified were associated with different iron phases and that none of these phases were associated with the akaganeite phase.
Due to the high concentration of chloride ion sand and the lack of oxygen, akaganeite is formed in reinforcement steel/oxide/concrete interfaces, as happened in the carbon steel specimens freely exposed to high (C4) and very high (C5) atmospheric corrosivity categories in the entire Cuban coastal environment and worldwide. In this sense, the akaganeite formed in the reinforcement steel showed Cl percentages of between 4.3 and 6.4 wt.% (Figure 11e,f). The Cl content varied according to the formation conditions, and percentages of up to 47 wt.% have been found in carbon steel exposed to tropical marine environments [72]; however, the theoretical maximal concentration of chloride ions that this phase can contain in its structure is approximately 7 wt.%, meaning that excess chloride ions are often associated with the absorption of these ions onto the akaganeite surface, while concentrations lower than 7 wt.% are associated with a framework containing tunnels partially filled with chloride anions [73].
Therefore, the high Cl percentages (up to 6.4 wt% in Figure 11f) found in akaganeite suggest a high occupancy of Cl sites within the tunnels in the framework of this phase or the presence of some unoccupied vacancy sites or the fact that some vacant Cl sites are occupied by impurities or oxygenated species such as hydroxyl groups or water [73,74,75]. These results are consistent with previous works, where Cl percentages between 2 and 7 mol% have been found for this phase [76].
On the other hand, akaganeite formed in freely exposed carbon steel specimens β F e O O H typically shows cotton ball, cigar, and rosette morphologies [77,78]; however, Morcillo and collaborators reported the formation of akaganeite constituted of aggregates of elongated cylindrical crystals with lengths and widths of between 100–200 nm and 60–80 nm, respectively [79]; they suggested that this cylindrical-type morphology could be a typical morphology of akaganeite formed under marine conditions because it differs from the spindle-type morphology that akaganeite shows when synthesized under laboratory conditions. Interestingly, our results obtained by SEM revealed the formation of highly agglomerated akaganeite crystals with an elongated morphology and right-angled edges (Figure 11a,c,d). The growth of akaganeite on carbon steel with a cylindrical or rod-type morphology has also been documented by Juan C. Guerra and collaborators [62]; however, the morphology similar to bars with right-angled edges found in this work has not been reported previously. The change in morphology could be associated with different factors such as pH and the chloride ion concentration.
In this sense, a more alkaline environment should be present in specimens protected by concrete compared to the pH typically found in freely exposed specimens [80]. Also, surface-absorbed chloride ions on freely exposed carbon steel specimens can be solubilized by rainfall events [80]; consequently, it is expected that the effect of rainfall on the washing of chloride ions will be lower due to the barrier effect of the concrete. Therefore, a higher pH and a more constant chloride concentration should be expected at the steel/concrete interface compared with freely exposed samples.
On the other hand, Emily and collaborators found that akaganeite structures can be modified by the crystallization microenvironment [81]; they reported that the akaganeite length, the presence of twinned forms, and the number of arms are affected by factors such as the content of chloride ions and the pH. Therefore, the above works suggest that the concentration and stability of chloride ions, as well as the pH in the crystallization microenvironment, could contribute to the formation of this type of morphology, i.e., elongated with right-angled edges. On the other hand, concrete is a product rich in silicon (Si). One of the main components of cement is tricalcium silicate, which produces a gel when it is hydrated. In the akaganeite structure, the release of chloride ions and the absorption of Si-based compounds are favored at an alkaline pH [81]. Also, the formation of akaganeite as a three-dimensional assembly was reported when this structure came into contact with a Si-based hydrogel, in contrast to the discrete rods formed in solution [82]. Therefore, the different phases of Si that can contain concrete could modify the morphology of akaganeite; however, more detailed studies should be carried out to corroborate this hypothesis. On the other hand, due to the highly agglomerated morphology of this crystalline phase, it is possible that it is one of the reasons for the corrosion product expansion of concrete, as happened in the freely exposed carbon steel specimens, which subsequently led to cracking, with CCTh values of 20 and 40 mm in the RC with w/c ratios = 0.5 and 0.6.

5. Conclusions

A comprehensive research study was carried out to obtain durability requirements for RC structures in hostile tropical coastal environments. The following conclusions were drawn:
  • According to the annual average chloride deposition rate and atmospheric corrosion rate for the metallic materials most commonly used in the construction industry (mainly for carbon steel), the coastal city of Havana can be considered among the coastal cities with the highest atmospheric corrosivity categories worldwide. An annual average atmospheric corrosion rate over the maximum limit established in the ISO 9223:2012 for the extreme (CX) atmospheric corrosivity category for carbon steel was determined. An increase in the range established for the extreme (CX) atmospheric corrosivity category in a coastal environment at a short distance from the shoreline could be considered. This result was confirmed from the visual observation of the carbon steel specimens.
  • According to the behavior and prediction of the annual average Ic, considered as an indicator of the atmospheric corrosion rate of reinforcement steel in RC versus the time of exposure, the Sl from the sum of the time-to-corrosion-initiation (ti) and the time-to-corrosion-induced concrete cracking (tcc) was determined and predicted as a function of the durability requirements. The model established in the ISO 9224-2012 to predict the corrosivity category of the atmosphere for the metallic materials that are most often used in the construction industry (carbon steel, galvanized steel) for times of exposure over one year can be used to predict the Sl in RC structures in the coastal city of Havana and in all Cuban coastal environments.
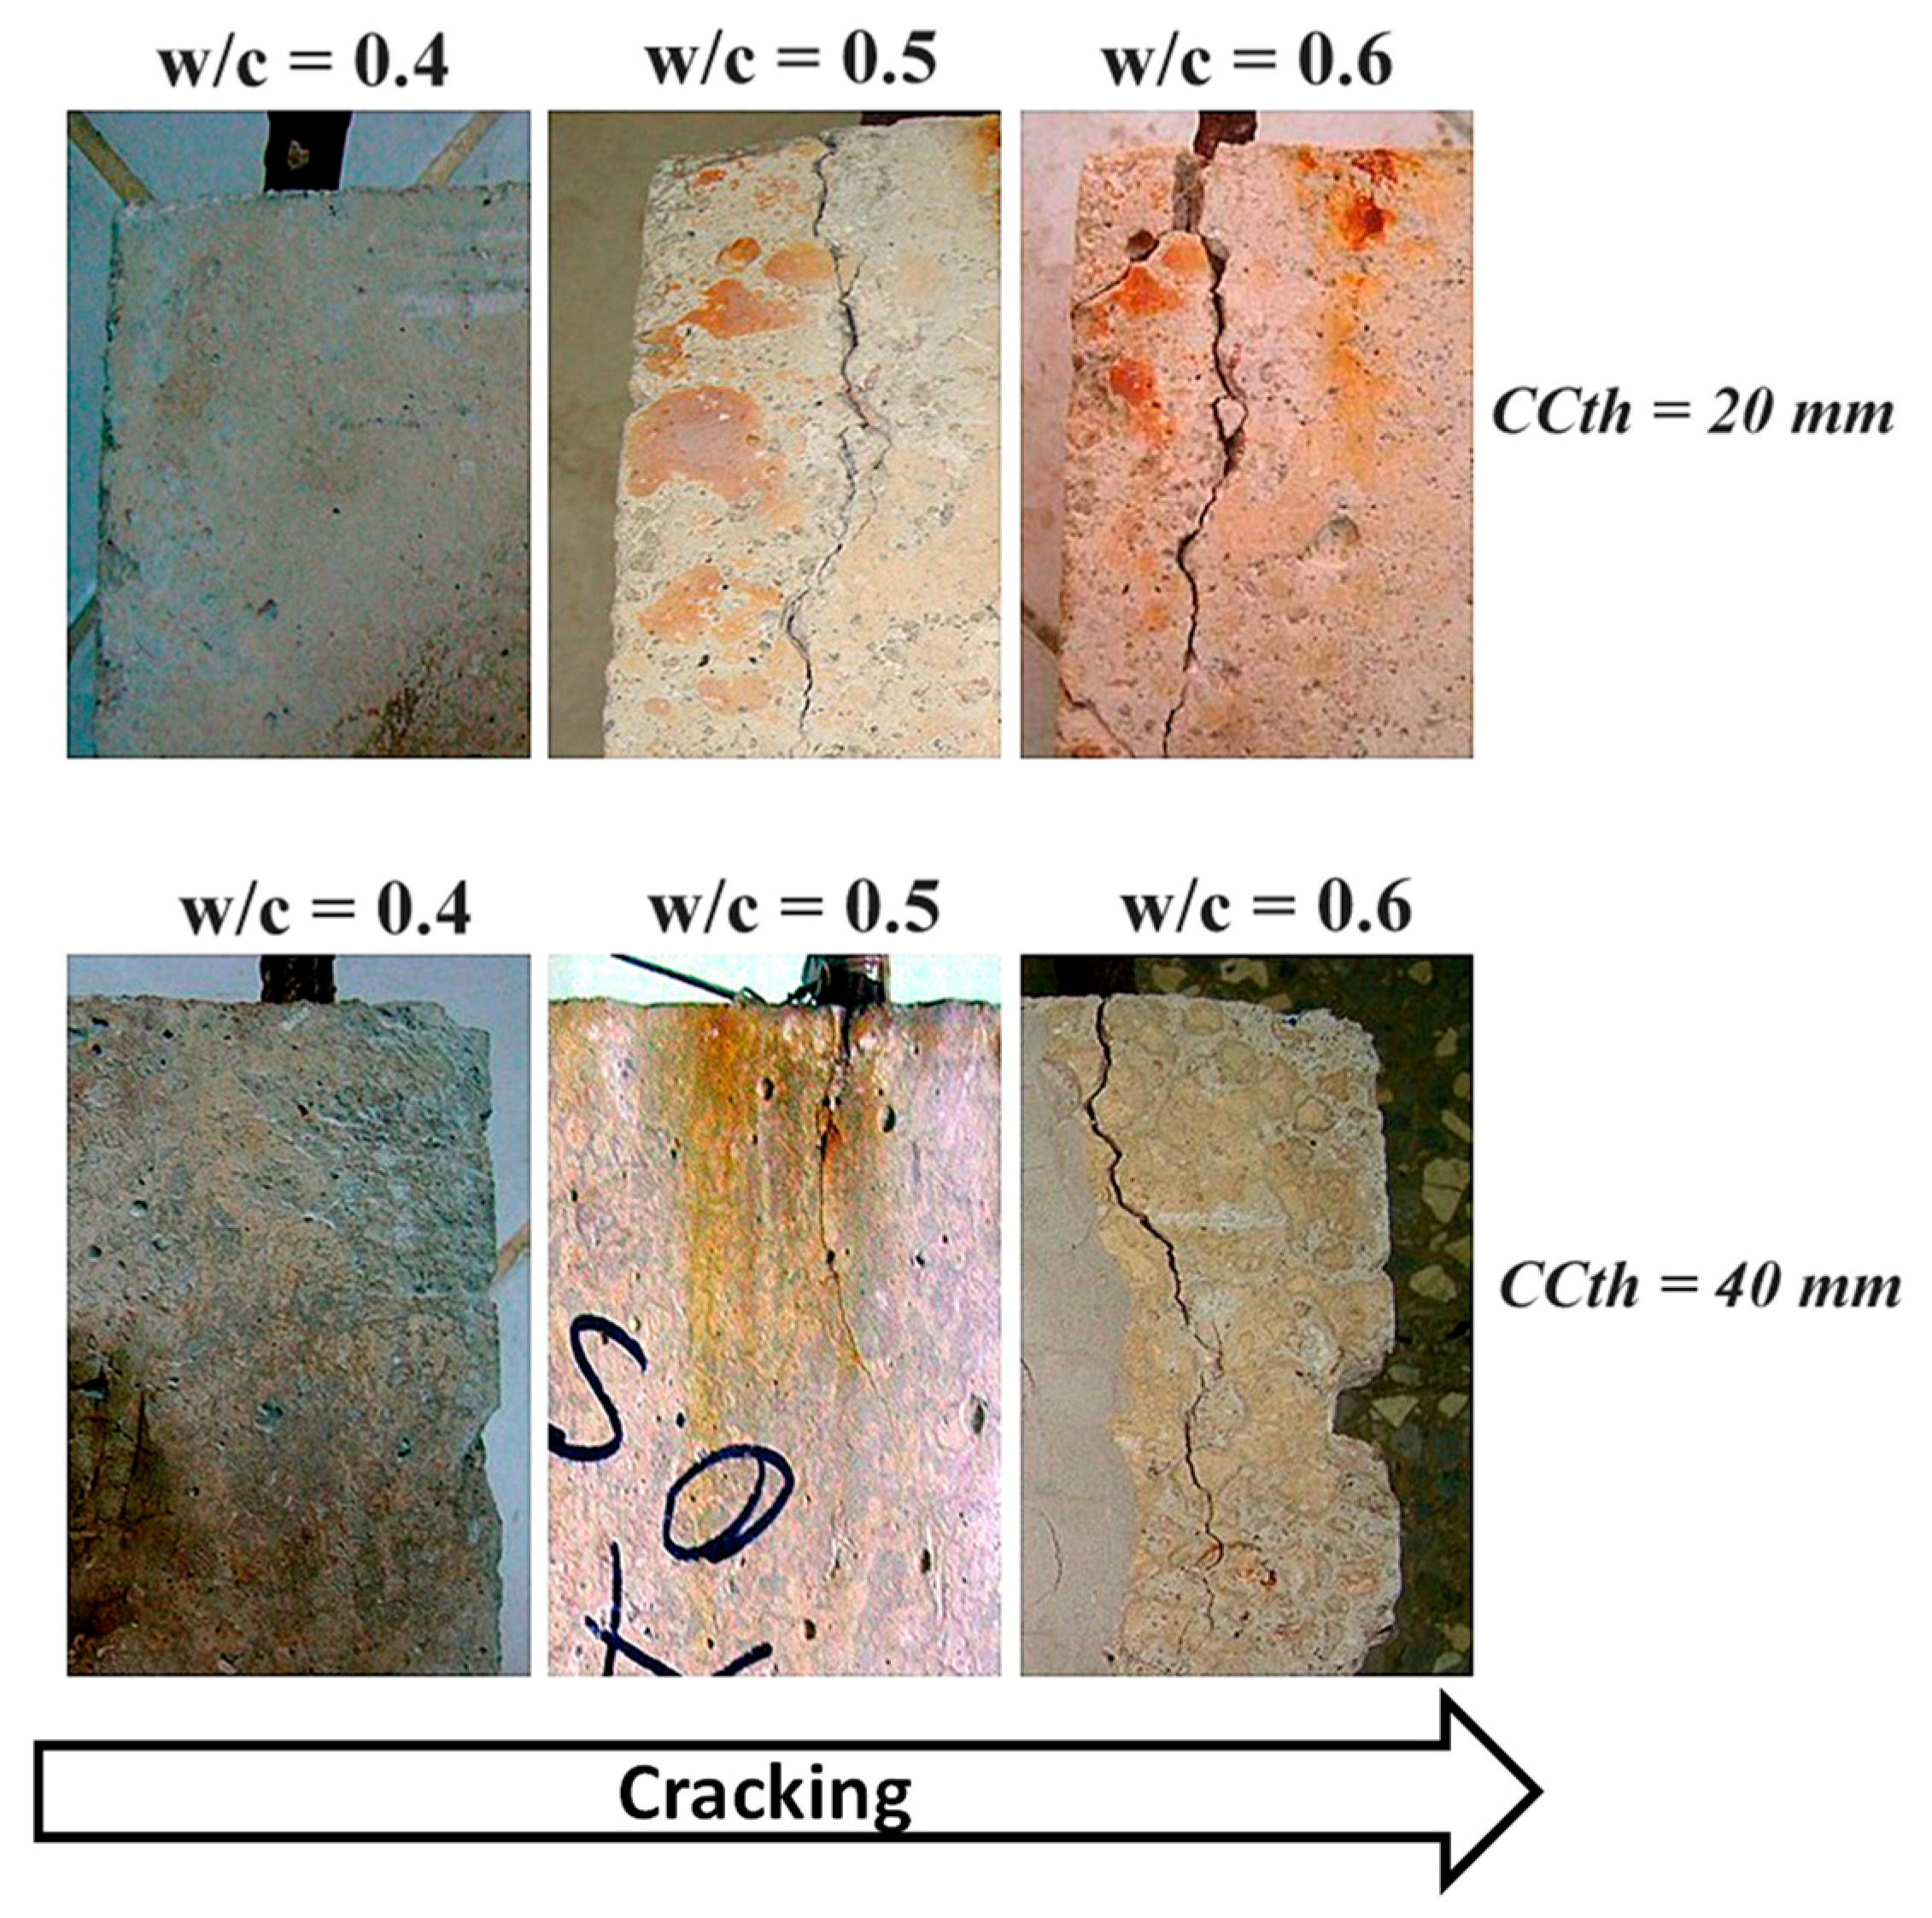
  • The two statistical methods used allowed for the demonstration of the most important durability requirements to ensure a long Sl of more than 70 years in RC structures in the Cuban coastal environment exposed to extreme (CX) and above-extreme (>CX) corrosivity categories. This requirement is as follows: w/c ratio of 0.4, fck, and εe, with a CCTh of 40 mm.
  • It was confirmed that the occurrence of cracking in the RC specimens with w/c ratios of 0.5 and 0.6 for both CCTh values tested is an indicator of the end of the Sl, in less than five years, for RC structures exposed to very high (C5) and extreme (CX) atmospheric corrosivity categories in the coastal city of Havana. The results were confirmed by the visual observation of the RC specimens placed at the COES during the three years of this study.
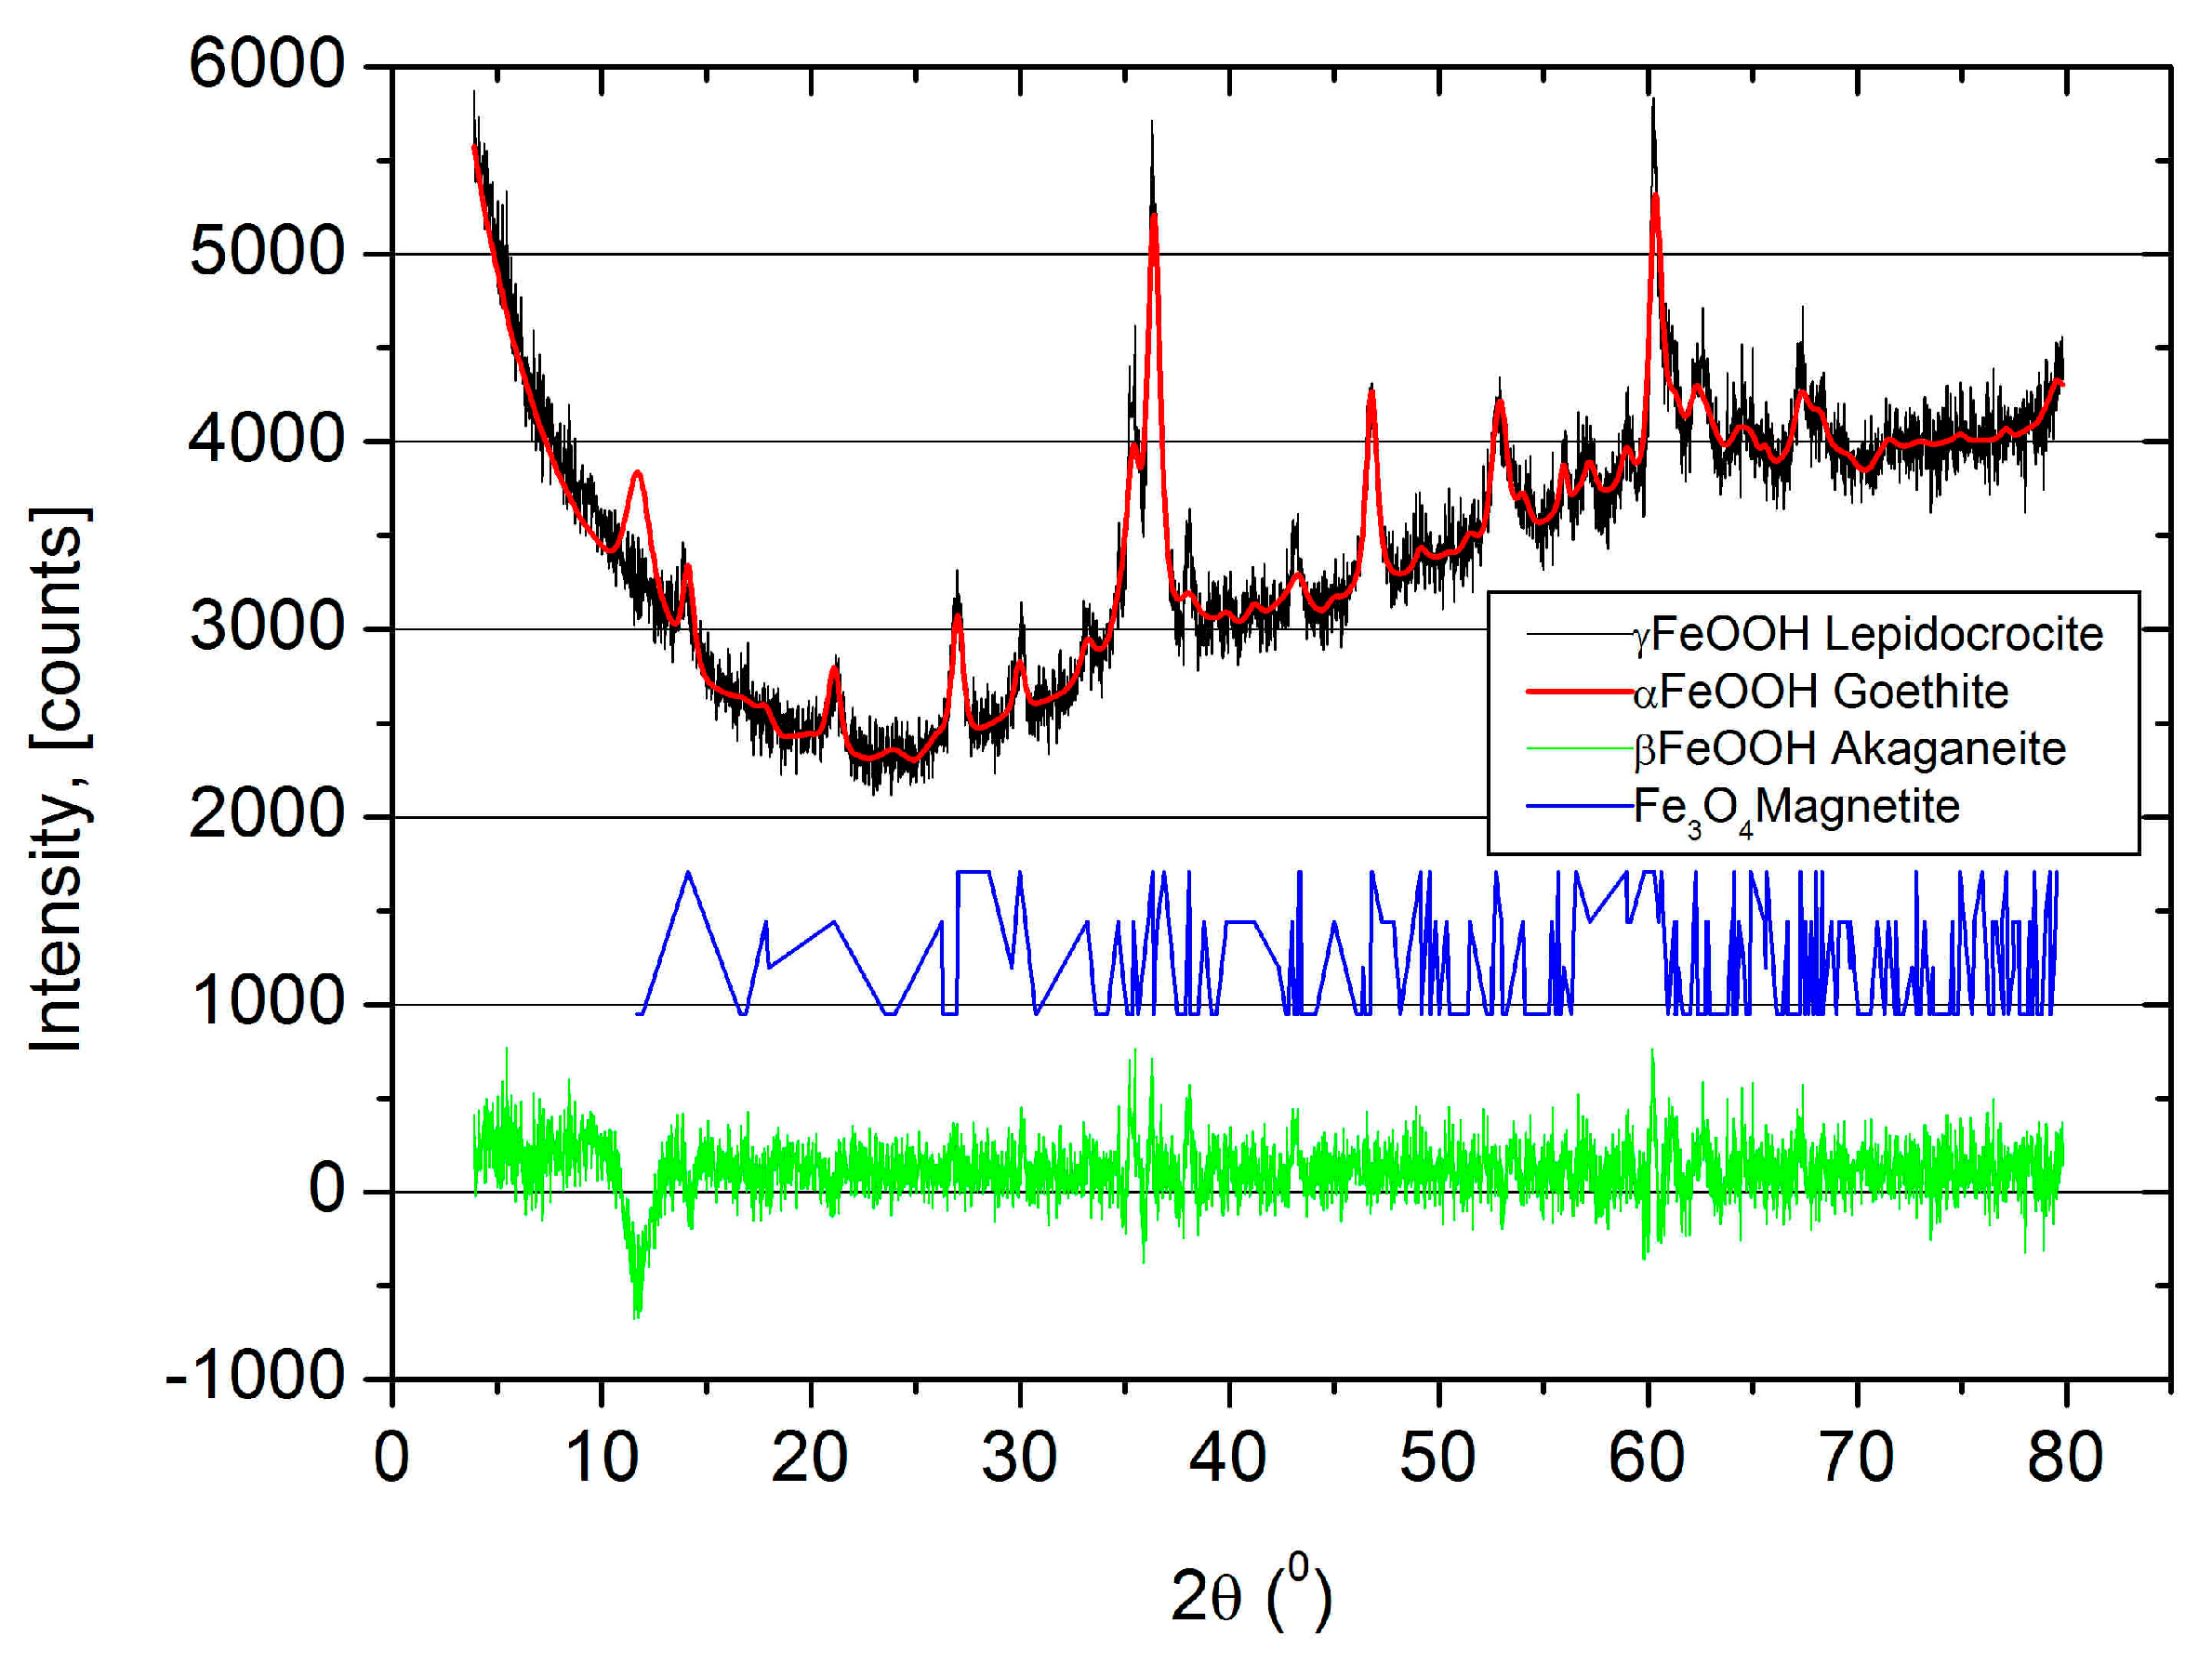
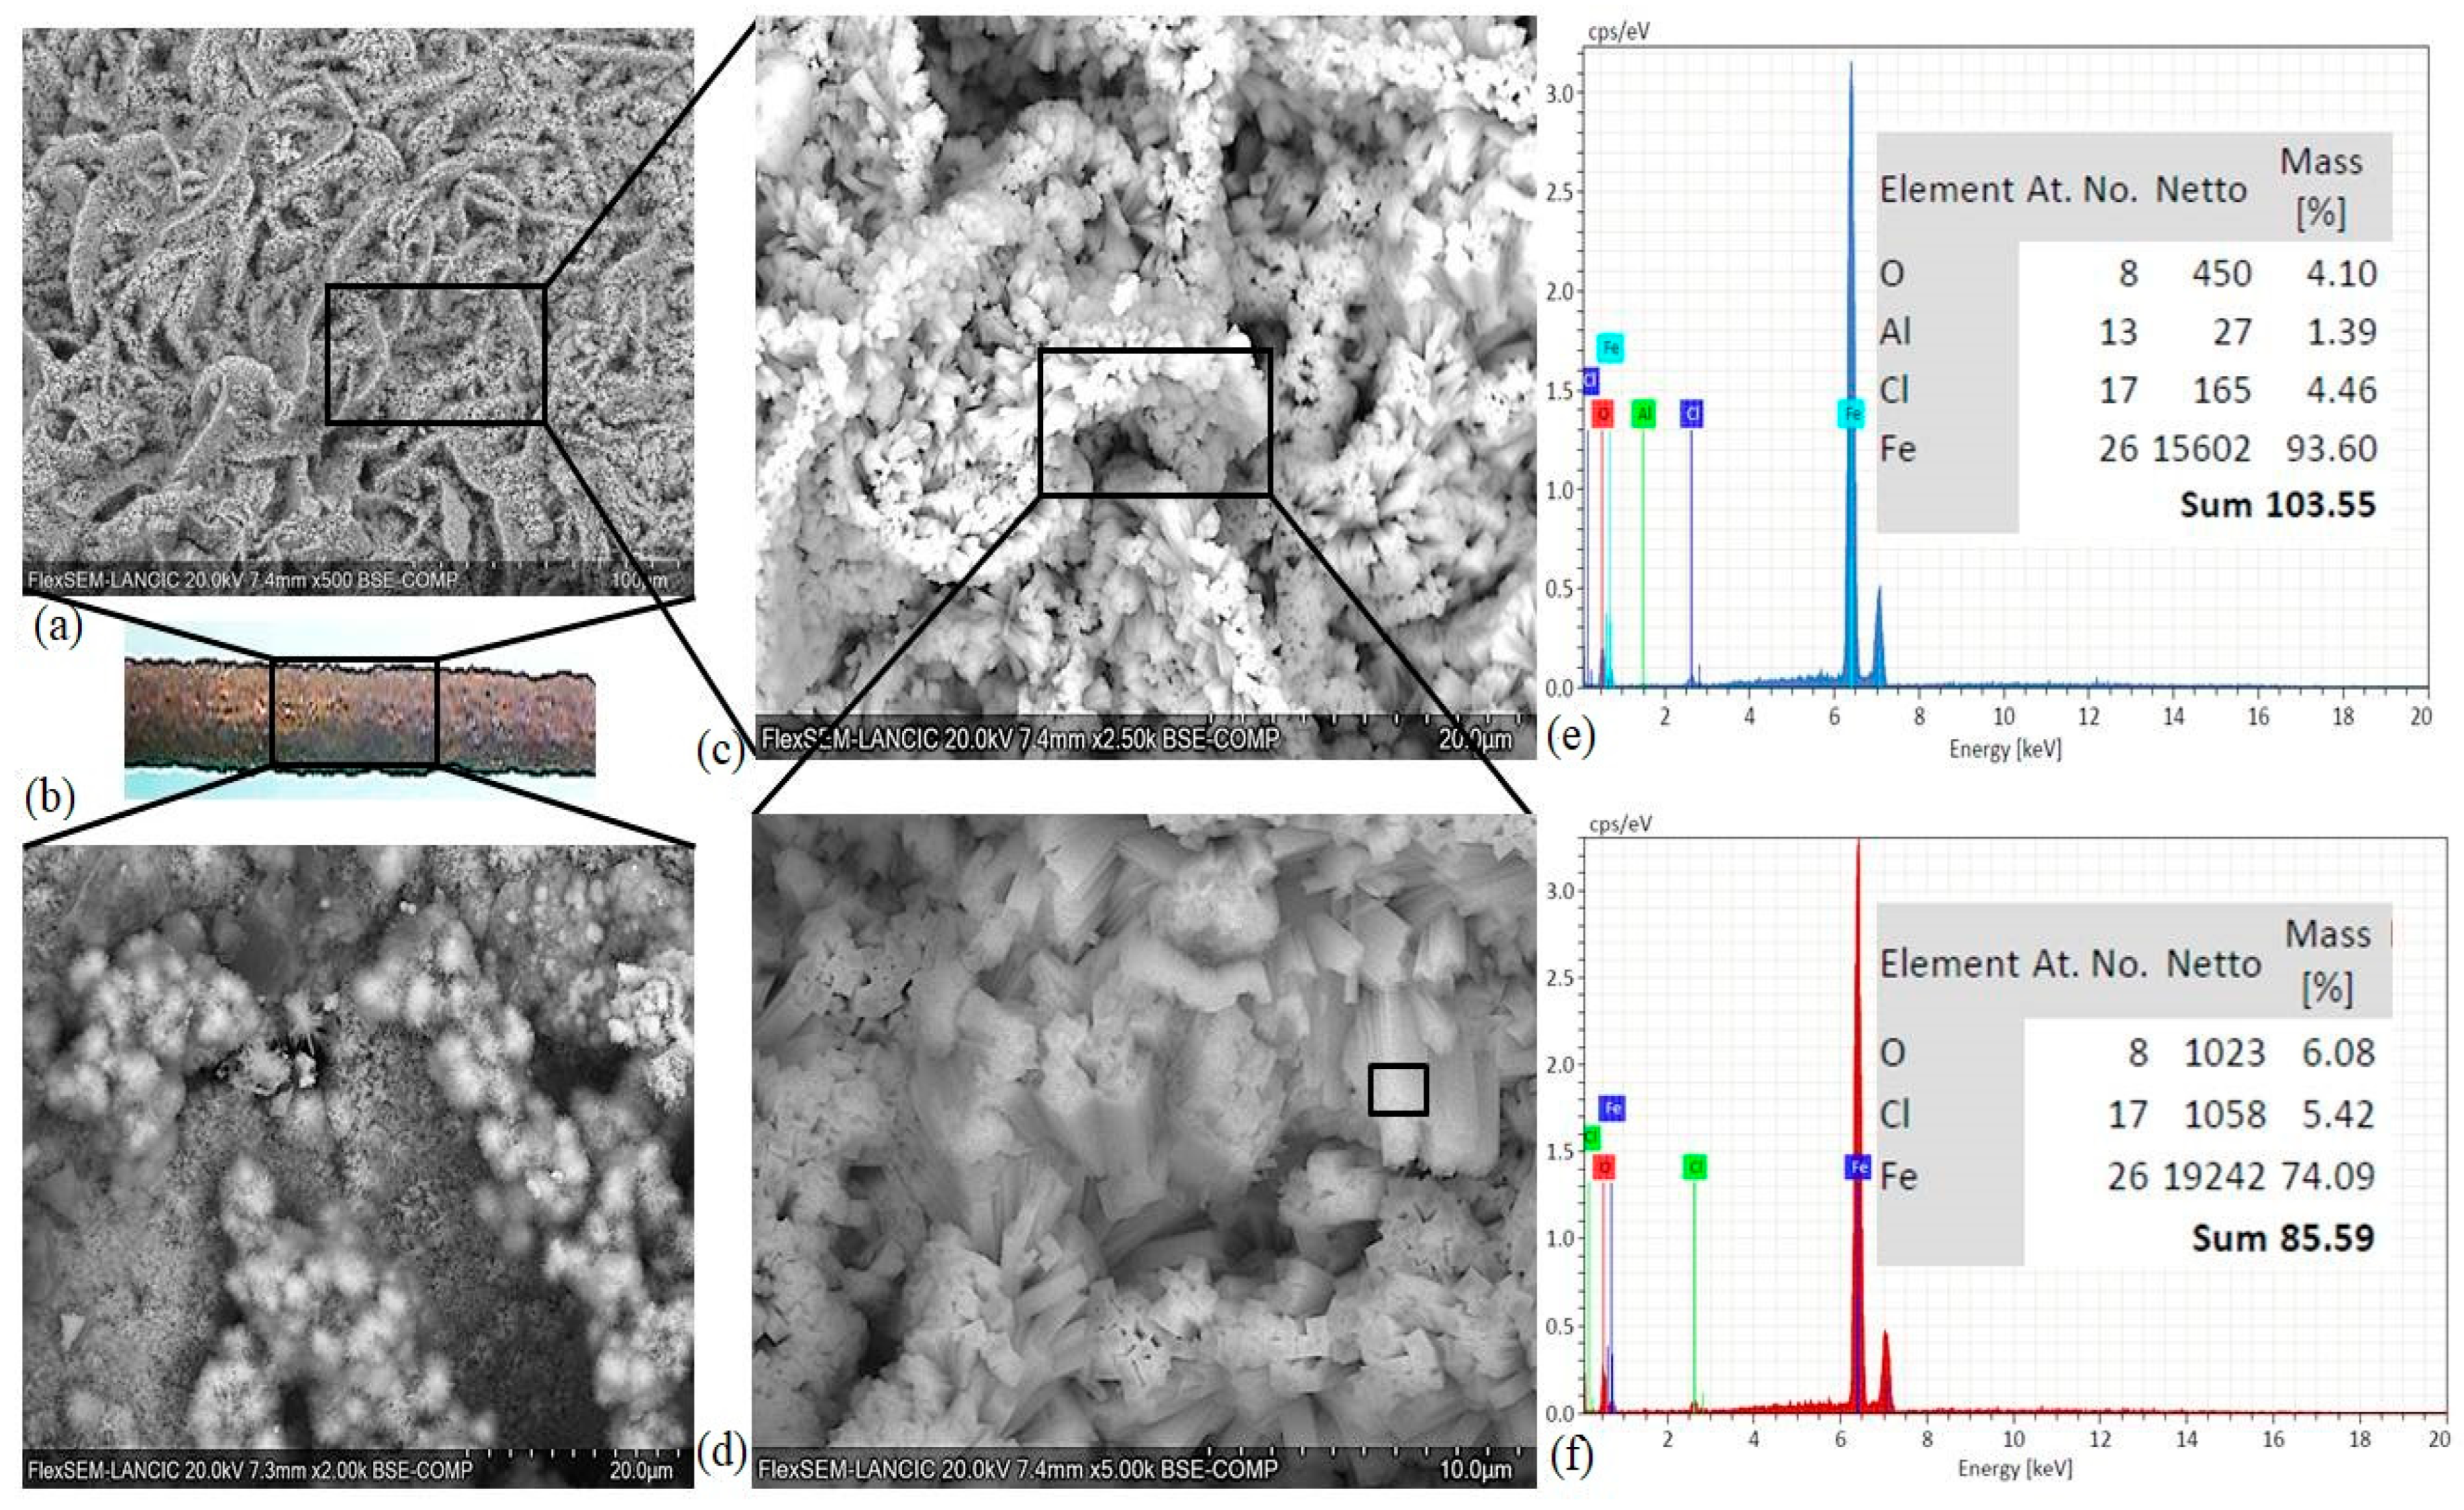
  • A significant difference between the chemical composition of the oxide layers developed in the freely exposed carbon steel specimens and the reinforcement steel embedded in the RC was not observed, but the presence of akaganeite with different morphologies was reported for the reinforced steel. It seems that crystalline-phase akaganeite could be one of the reasons for the corrosion product expansion of the reinforcement steel, which subsequently led to cracking in the specimens with a CCTh of 20 and 40 mm in the RC prepared with w/c ratios of 0.5 and 0.6.
  • Since only one type of cement was considered in this work, the proposed protocol could be applied in future research to study the durability of RC containing supplementary cementitious materials or made using green formulations, recycled concrete aggregates, and/or sand to provide a large variety of solutions to ensure the sustainability and durability of constructions in these tropical environments.

Author Contributions

Conceptualization, A.C.V., F.C.P., and I.P.P.; methodology, A.C.V., F.C.P., and R.M.Á.; software, I.P.P.; validation, A.C.V.; formal analysis, F.C.P. and E.B.-A.; investigation, A.C.V. and R.M.Á.; resources, A.C.V., F.C.P., and R.M.Á.; data curation, A.C.V.; writing—original draft preparation, A.C.V., F.C.P., I.P.P., and E.B.-A.; writing—review and editing, E.B.-A.; visualization, E.B.-A.; supervision, F.C.P. and E.B.-A.; project administration, A.C.V.; funding acquisition, A.C.V. All authors have read and agreed to the published version of the manuscript.

Funding

This research was supported by the Mortars and Concretes Branch Program of the Ministry of Construction of Cuba.

Data Availability Statement

The data provided in this study did not lead to the development of patents. Therefore, they are not subject to any kind of privacy. They can be used publicly.

Acknowledgments

The authors wish to thank the Ministry of Construction of Cuba for its financial support and for guaranteeing the necessary materials and resources during the execution of this research. The author Ildefonso Pech Pech thanks the LANCIC Project LN315853 and LN 314846 for SEM/EDS analysis.

Conflicts of Interest

The authors declare no conflicts of interest.

References

  1. Abosrra, L.; Ashour, A.F.; Youseffi, M. Corrosion of steel reinforcement in concrete of different compressive strengths. Constr. Build. Mater. 2011, 25, 3915–3925. [Google Scholar] [CrossRef]
  2. Zhao, Y.; Yu, J.; Wu, Y.; Jin, W. Critical thickness of rust layer at inner and out surface cracking of concrete cover in reinforced concrete structures. Corr. Sci. 2012, 59, 316–323. [Google Scholar] [CrossRef]
  3. Shi, X.; Xie, N.; Fortune, K.; Gong, J. Durability of steel reinforced concrete in chloride environments: An overview. Constr. Build. Mater. 2012, 37, 125–138. [Google Scholar] [CrossRef]
  4. Pradhan, B.; Bhattacharjee, B. Rebar corrosion in chloride environment. Constr. Build. Mater. 2011, 25, 2565–2575. [Google Scholar] [CrossRef]
  5. Ann, K.Y.; Ahn, J.H.; Ryou, J.S. The importance of chloride content at the concrete surface in assessing the time to corrosion of steel in concrete structures. Constr. Build. Mater. 2009, 23, 239–245. [Google Scholar] [CrossRef]
  6. Narasimhan, H.; Chew, M.Y. Integration of durability with structural design: An optimal life cycle cost based design procedure for reinforced concrete structures. Constr. Build. Mater. 2009, 23, 918–929. [Google Scholar] [CrossRef]
  7. Liu, P.; Yu, Z.; Lu, Z.; Chen, Y.; Liu, X. Predictive convection environment depth of chloride in concrete under chloride environment. Cem. Concr. Compos. 2016, 72, 257–267. [Google Scholar] [CrossRef]
  8. Cheewaket, T.; Jaturapitakkul, C.; Chalee, W. Initial corrosion presented by chloride threshold penetration of concrete up to 10 year-results under marine site. Constr. Build. Mater. 2012, 37, 693–698. [Google Scholar] [CrossRef]
  9. Castañeda, A.; Rodríguez, M. Las pérdidas económicas causadas por el fenómeno de la corrosión atmosférica del acero de refuerzo embebido en el hormigón armado. Resultadospreliminares. Rev. CENIC. Chem. Sci. 2014, 45, 52–59. [Google Scholar]
  10. Rincon, L.F.; Moscoso, Y.M.; Hamami, A.E.A.; Matos, J.C.; Bastidas-Arteaga, E. Degradation Models and Maintenance Strategies for Reinforced Concrete Structures in Coastal Environments under Climate Change: A Review. Buildings 2024, 14, 562. [Google Scholar] [CrossRef]
  11. Muralidharan, S.; Vedalakshmi, R.; Saraswathi, V.; Joseph, J.; Palaniswamy, N. Studies on the aspects of chloride ion determination in different types of concrete under macro-cell corrosion conditions. Build. Environ. 2005, 40, 1275–1281. [Google Scholar] [CrossRef]
  12. Güneyisi, E.; Özturan, T.; Gesoglu, M. Effect of initial curing on chloride ingress and corrosion resistance characteristics of concretes made with plain and blended cements. Build. Environ. 2007, 42, 2676–2685. [Google Scholar] [CrossRef]
  13. Yiğiter, H.; Yazıcı, H.; Aydın, S. Effects of cement type, water/cement ratio and cement content on sea water resistance of concrete. Build. Environ. 2007, 42, 1770–1776. [Google Scholar] [CrossRef]
  14. Mohamed, N.; Boulfiza, M.; Evitts, R. Corrosion of Carbon Steel and Corrosion-Resistant Rebars in Concrete Structures Under Chloride Ion Attack. J. Mater. Eng. Perform. 2012, 22, 787–795. [Google Scholar] [CrossRef]
  15. Castañeda, A.; Corvo, F.; O’Reilly, V. Comparación entre el pronóstico de corrosiónbasado en la medición de potenciales y la determinación de la velocidad de corrosión de la barra de refuerzomediantetécnicaselectroquímicas. Mater. Construcción 2003, 53, 155–164. [Google Scholar]
  16. Castañeda, A.; Corvo, F.; González, J. Estudiocomparativo de la corrosióndelacero de refuerzo en el hormigónarmadoa partir de técnicaselectroquímicas y convencionales. Rev. CENIC. Chem. Sci. 2010, 41, 1–9. [Google Scholar]
  17. Behera, P.K.; Misra, S.; Mondal, K. Corrosion Behavior of Strained Rebar in Simulated Concrete Pore Solution. J. Mater. Eng. Perform. 2020, 33, 1939–1954. [Google Scholar] [CrossRef]
  18. Poursaee, A. Corrosion of Steel Bars in Saturated Ca(OH)2 and Concrete Pore Solution. Concr. Res. Lett. 2010, 3, 90–97. [Google Scholar]
  19. Mundra, S.; Criado, M.; Bernal, S.A.; Provis, J.L. Chloride-Induced Corrosion of Steel Rebars in Simulated Pore Solutions of Alkali Activated Concretes. Cem. Concr. Res. 2017, 100, 385–397. [Google Scholar] [CrossRef]
  20. Hussain, R.R.; Singh, J.K.; Alhozaimy, A.; Al-Negheimish, A.; Bhattacharya, C.; Pathania, R.S.; Singh, D.D.N. Effect of Reinforcing Bar Microstructure on Passive Film Exposed to Simulated Concrete Pore Solution. ACI Mater. J. 2018, 115, 181. [Google Scholar] [CrossRef]
  21. Williamson, J.; Isgor, O.B. The Effect of Simulated Concrete Pore Solution Composition and Chlorides on the Electronic Properties of Passive Films on Carbon Steel Rebar. Corros. Sci. 2016, 106, 82–95. [Google Scholar] [CrossRef]
  22. De Rincón, O.T.; Castro, P.; Moreno, E.I.; Torres-Acosta, A.A.; De Bravo, O.M.; Arrieta, I.; Martínez-Madrid, M. Chlorideprofiles in two marine structures—Meaning and somepredictions. Build. Environ. 2004, 39, 1065–1070. [Google Scholar] [CrossRef]
  23. Pang, L.; Li, Q. Service life prediction of RC structures in marine environment using long term chloride ingress data: Comparison between exposure trials and real structure surveys. Constr. Build. Mater. 2016, 113, 979–987. [Google Scholar] [CrossRef]
  24. Cui, Z.; Alipour, A. Concrete cover cracking and service life prediction of reinforced concrete structures in corrosive environments. Constr. Build. Mater. 2018, 159, 652–671. [Google Scholar] [CrossRef]
  25. Vieira, D.R.; Moreira, A.L.R.; Calmon, J.L.; Dominicini, W.K. Service life modeling of a bridge in a tropical marine environment for durable design. Constr. Build. Mater. 2018, 163, 315–325. [Google Scholar] [CrossRef]
  26. Castañeda, A.; Corvo, F.; Marrero, R.; Fernández, A.; Del Angel-Meraz, E. The service life of reinforced concrete structures in an extremely aggressive coastal city. Influence of concrete quality. Mater. Struct. 2023, 56, 12. [Google Scholar] [CrossRef]
  27. De Vera, G.; Anton, C.; Lopez, M.P.; Climent, M.A. Depassivation time estimation in reinforced concrete structures exposed to chloride ingress: A probabilistic approach. Cem. Concr. Compos. 2017, 79, 21–33. [Google Scholar] [CrossRef]
  28. Samindi, S.M.; Samarakoon, M.; Jan Sælensminde, K. Condition assessment of reinforced concrete structures subject to chloride ingress: A case study of updating the model prediction considering inspection data. Cem. Concr. Compos. 2015, 60, 92–98. [Google Scholar]
  29. Angst, U.; Elsener, B.; Larsen, C.K.; Vennesland, F. Critical chloride content in reinforced concrete—A review. Cem. Concr. Res. 2009, 39, 1122–1138. [Google Scholar] [CrossRef]
  30. Zacchei, E.; Bastidas-Arteaga, E. Multifactorial Chloride Ingress Model for Reinforced Concrete Structures Subjected to Unsaturated Conditions. Collection Advanced Concrete Structures in Civil Engineering. Buildings 2022, 12, 107. [Google Scholar] [CrossRef]
  31. Anwar Hossain, K.M.; Easa, S.M.; Lachemi, M. Evaluation of the effect of marine salts on urban built infrastructure. Build. Environ. 2009, 44, 713–722. [Google Scholar] [CrossRef]
  32. Trocónis, O.; Duracon Collaboration. Durability of concrete structures: DURACON, an Iberoamerican project. Preliminary results. Build. Environ. 2006, 41, 952–962. [Google Scholar] [CrossRef]
  33. ISO 12944-9:2018; Paints and Varnishes-Corrosion and Protection of Steel Structures by Protective Paint Systems. Part 9. Protective Paint Systems and Laboratory Performance Test Methods for Offshore and Related Structures. Beuth: Berlin, Germany, 2018.
  34. ISO 9223:2012; Corrosion of Metals and Alloys—Corrosivity of Atmospheres—Classification, Determination and Estimation. ISO: Geneva, Switzerland, 2012.
  35. Jiang, J.H.; Yuan, Y.S. Development and prediction strategy of steel corrosion rate in concrete under natural climate. Constr. Build. Mater. 2013, 44, 287–292. [Google Scholar] [CrossRef]
  36. Castañeda, A.; Rivero, C.; Corvo, F. Evaluación de sistemas de protección contra la corrosión en la rehabilitación de estructurasconstruidas en sitios de elevadaagresividadcorrosiva en Cuba. Rev. Construcción 2012, 11, 49–61. [Google Scholar] [CrossRef]
  37. ISO 9225: 2012; Corrosion of Metals and Alloys—Corrosivity of Atmosphere—Measurement of Environmental Parameters Affecting Corrosivity of Atmosphere. International Organization for Standardization: Geneva, Switzerland, 2012.
  38. Cuban Standard. 120:2014; Reinforced Concrete. Specifications. Cuban National Bureau of Standards: La Habana, Cuba, 2014.
  39. ISO 8407: 2009; Corrosion of Metals and Alloys—Removal of Corrosion Products from Corrosion Tests Specimens. International Organization for Standardization: Geneva, Switzerland, 2009.
  40. Troconis de Rincon, O. Manual for Inspecting, Evaluating and Diagnosing Corrosion in Reinforced Concrete Structures; NACE: Houston, TX, USA, 2000. [Google Scholar]
  41. Cuban Standard 724:2009; Test on Concrete. Resistance of Hardened Concrete. Cuban National Bureau of Standards: La Habana, Cuba, 2009.
  42. Cuban Standard 231:2012; Test on Concrete. Determination, Interpretation and Application of Ultrasonic Pulse Velocity in Concrete. Cuban National Bureau of Standards: La Habana, Cuba, 2012.
  43. Fagerlund, G. On the Capillarity of Concrete. Nord. Concr. Res. 1986, 1. [Google Scholar]
  44. ISO 9224:2012; Corrosion of Metals and Alloys—Corrosivity of Atmospheres—Guiding Values for the Corrosivity Categories. ISO: Geneva, Switzerland, 2012.
  45. Castañeda, A.; Corvo, F.; Fernández, D.; Valdés, C. Outdoor-indoor atmospheric corrosion in a coastal wind farm located in a tropical island. Eng. J. 2017, 21, 43–62. [Google Scholar] [CrossRef]
  46. Corvo, F.; Pérez, T.; Dzib, L.; Martín, Y.; Castañeda, A.; González, E.; Pérez, J. Outdoor-Indoor corrosion of metals in tropical coastal atmospheres. Corros. Sci. 2008, 50, 220–230. [Google Scholar] [CrossRef]
  47. Castañeda, A.; Corvo, F.; Howland, J.J.; Marrero, R. Penetration of marine aerosol in a tropical coastal City: Havana. Atmósfera 2018, 31, 87–104. [Google Scholar] [CrossRef]
  48. Meira, G.R.; Andrade, C.; Alonso, C.; Padaratz, I.J.; Borba, J.C. Modelling sea-salt transport and deposition in marine atmosphere environment—A tool for corrosion studies. Corros. Sci. 2008, 50, 2724–2731. [Google Scholar] [CrossRef]
  49. Meira, G.R.; Andrade, C.; Alonso, C.; Borba, J.C., Jr.; Padilha, M., Jr. Durability of concrete structure in marine atmosphere environment. The use of chloride deposition rate on wet candle as an environment indicator. Cem. Concr. Compos. 2010, 32, 427–435. [Google Scholar] [CrossRef]
  50. Molina, L.; Alonso, F.J.; Alonso, M.C.; Sánchez, M.; Jarabo, R. Corrosion protection of galvanized rebars in ternary binder concrete exposed to chloride penetration. Constr. Build. Mater. 2017, 156, 468–475. [Google Scholar] [CrossRef]
  51. Zheng, H.; Dai, J.G.; Li, W.; Poon, C.S. Influence of chloride ion on depassivation of passive film on galvanized steel bars in concrete pore solution. Constr. Build. Mater. 2018, 156, 572–580. [Google Scholar] [CrossRef]
  52. Wang, Y.; Kong, G. Corrosion inhibition of galvanized steel by MnO4 ion as a soluble inhibitor in simulated fresh concrete environment. Constr. Build. Mater. 2020, 257, 119532. [Google Scholar] [CrossRef]
  53. Castañeda, A.; Howland, J.J.; Corvo, F.; Marrero, R. Concrete quality assessment before building structures submitting to environmental exposure conditions. Rev. Constr. 2017, 16, 374–387. [Google Scholar]
  54. Castañeda, A.; Howland, J.J.; Corvo, F.; Marrero, R. Concrete quality assessment before submitting to environmental exposure conditions in Cuba. Rev. Acta Microscópica 2017, 26. [Google Scholar] [CrossRef]
  55. Carvajal, M.; Vera, R.; Corvo, F.; Castañeda, A. Diagnosis and rehabilitation of real reinforced concrete structures in coastal areas. Corros. Eng. Sci. Technol. 2011, 47, 70–77. [Google Scholar] [CrossRef]
  56. Corvo, F.; Pérez, T.; Martin, Y.; Reyes, J.; Dzib, L.R.; González, J.A.; Castañeda, A. Corrosion research frontiers. Atmospheric corrosion in tropical climate. On the concept of Wetness and its interaction with contaminants deposition. In Electroanalytical Chemistry: New Research; Nova Science Publishers: New York, NY, USA, 2008; Chapter 2. [Google Scholar]
  57. Corvo, F.; Pérez, T.; Martin, Y.; Reyes, J.; Dzib, L.R.; González-Sánchez, J.; Castañeda, A. Atmosphericcorrosion in tropical humidclimates. Environmental Degradation of Infrastructure and Cultural Heritage in Coastal Tropical Climate; Transworld Research Network: Kerala, India, 2009. [Google Scholar]
  58. Chico, B.; De la Fuente, D.; Díaz, I.; Simancas, J.; Morcillo, M. Annual Atmospheric Corrosion of Carbon Steel Worldwide. An Integration of ISOCORRAG, ICP/UNECE and MICAT Databases. Materials 2017, 10, 601. [Google Scholar] [CrossRef] [PubMed]
  59. Mariaca, L.; Menchaca, C.; Sarmiento, E.; Sarmiento, O.; Ramírez, J.L.; Uruchurtu, J. Atmospheric Corrsion Dose/Response Functions from Statistical Data Analysis for Different Sites of Mexico. Innov. Corros. Mater. Sci. 2014, 4, 11–20. [Google Scholar]
  60. Alcántara, J.; Chico, B.; Diaz, I.; De la Fuente, D.; Morcillo, M. Airborne chloride deposit and its effect on marine atmospheric corrosion of mild steel. Corros. Sci. 2015, 97, 74–88. [Google Scholar] [CrossRef]
  61. Castañeda, A.; Valdés, C.; Corvo, F. Atmospheric corrosion study in a harbor located in a tropical island. Mater. Corros. 2018, 69, 1462–1477. [Google Scholar] [CrossRef]
  62. Guerra, J.C.; Castañeda, A.; Corvo, F.; Howland, J.J.; Rodríguez, J. Atmospheric corrosion of low carbon steel in a coastal environment of Ecuador: Anomalous behavior of chloride deposition versus distance from the sea. Mater. Corros. 2018, 69, 444–460. [Google Scholar]
  63. Valipour, M.; Shekarchi, M.; Ghods, P. Comparative studies of experimental and numerical techniques in measurement of corrosion rate and time-to-corrosion-initiation of rebar in concrete in marine environments. Cem. Concr. Compos. 2014, 48, 98–107. [Google Scholar] [CrossRef]
  64. Trocónis, O.; Duracon Collaboration. Effect of the marine environment on reinforced concrete durability in Iberoamerican countries: DURACON project/CYTED. Corros. Sci. 2007, 49, 2832–2843. [Google Scholar] [CrossRef]
  65. Siamphukdee, K.; Collins, F.; Zou, R. Sensitivity Analysis of Corrosion Rate Prediction Models Utilized for Reinforced Concrete Affected by Chloride. J. Mater. Eng. Perform. 2012, 22, 1530–1540. [Google Scholar] [CrossRef]
  66. Corvo, F.; Pérez, T.; Martin, Y.; Reyes, J.; Dzib, L.R.; González-Sánchez, J.; Castañeda, A. Time of wetness in tropical climate: Considerations on the estimation of TOW according to ISO 9223 standard. Corros. Sci. 2008, 50, 206–219. [Google Scholar] [CrossRef]
  67. Lu, Z.-H.; Zhao, Y.-G.; Yu, K. Stochastic Modeling of Corrosion Propagation for Service Life Prediction of Chloride Contaminated RC Structures. In Proceedings of the 1st International Symposium on Life-Cycle Civil Engineering, Lake Como, Italy, 11–14 June 2008; pp. 195–201. [Google Scholar]
  68. Vu, K.A.T.; Stewart, M.G. Structural reliability of concrete bridges including improved chloride-induced corrosion models. Struct. Saf. 2000, 22, 313–333. [Google Scholar] [CrossRef]
  69. Costa, A.; Appleton, J. Case studies of concrete deterioration in a marine environment in Portugal. Cem. Concr. Compos. 2002, 24, 169–179. [Google Scholar] [CrossRef]
  70. Morcillo, M.; Chico, B.; De la Fuente, D.; Simancas, J. Looking Back on Contributions in the Field of Atmospheric Corrosion Offered by the MICAT Ibero-American Testing Network. Int. J. Corros. 2012, 2012, 824365. [Google Scholar] [CrossRef]
  71. Castañeda, A.; Corvo, F.; Pech, I.; Valdés, C.; Marrero, R.; Del Angel-Meraz, E. Atmospheric Corrosion in an Oil Refinery Located on a Tropical Island under New Pollutant Situation. J. Mater. Eng. Perform. 2021, 30, 4529–4542. [Google Scholar] [CrossRef]
  72. Li, S.; Hihara, L.H. A micro-Raman spectroscopic study of marine atmospheric corrosion of carbon steel: The effect of Akaganeite. J. Electrochem. Soc. 2015, 162, C495. [Google Scholar] [CrossRef]
  73. Reguer, S.; Mirambet, F.; Dooryhee, E.; Hodeau, J.L.; Dillmann, P.; Lagarde, P. Structural evidence for the desalination of Akaganeite in the preservation of iron archaeological objects, using synchrotron X-ray powder diffraction and absorption spectroscopy. Corros. Sci. 2009, 51, 2795–2802. [Google Scholar] [CrossRef]
  74. Ståhl, K.; Nielsen, K.; Jiang, J.; Lebech, B.; Hanson, J.C.; Norby, P.; Van Lanschot, J. On the akaganéite crystal structure, phase transformations and possible role in post-excavational corrosion of iron artifacts. Corros. Sci. 2003, 45, 2563–2575. [Google Scholar] [CrossRef]
  75. Mazeina, L.; Deore, S.; Navrotsky, A. Energetics of bulk and nano-Akaganeite, β-FeOOH: Enthalpy of formation, surface enthalpy, and enthalpy of water adsorption. Chem. Mater. 2006, 18, 1830–1838. [Google Scholar] [CrossRef]
  76. Cornell, R.M.; Schwertmann, U. The Iron Oxides: Structure, Properties, Reactions, Occurrence and Uses; VCH: Weinheim, Germany, 1996. [Google Scholar]
  77. de la Fuente, D.; Díaz, I.; Simancas, J.; Chico, B.; Morcillo, M.J. Long-term atmospheric corrosion of mild steel. Corros. Sci. 2011, 53, 604–617. [Google Scholar] [CrossRef]
  78. De la Fuente, D.; Alcántara, J.; Chico, B.; Díaz, I.; Jiménez, J.A.; Morcillo, M. Characterisation of rust surfaces formed on mild steel exposed to marine atmospheres using XRD and SEM/Micro-Raman techniques. Corros. Sci. 2016, 110, 253–264. [Google Scholar] [CrossRef]
  79. Morcillo, M.; González-Calbet, J.M.; Jiménez, J.A.; Díaz, I.; Alcántara, J.; Chico, B.; De la Fuente, D. Environmental conditions for Akaganeite formation in marine atmosphere mild steel corrosion products and its characterization. Corrosion 2015, 71, 872–886. [Google Scholar] [CrossRef] [PubMed]
  80. Huet, B.; L’Hostis, V.; Miserque, F.; Idrissi, H. Electrochemical behavior of mild steel in concrete: Influence of pH and carbonate content of concrete pore solution. Electrochim. Acta 2005, 51, 172–180. [Google Scholar] [CrossRef]
  81. Asenath-Smith, E.; Lara, E. Role of Akaganeite (β-FeOOH) in the growth of hematite (α-Fe2O3) in an inorganic silica hydrogel. Cryst. Growth Des. 2015, 15, 3388–3398. [Google Scholar] [CrossRef]
  82. Naren, G.; Ohashi, H.; Okaue, Y.; Yokoyama, T. Adsorption kinetics of silicic acid on Akaganeite. J. Colloid Interface Sci. 2013, 399, 87–91. [Google Scholar] [CrossRef]
Figure 1. Location of the COES in Havana, Cuba (a,b). MC means Meteorological Center in b. Dry plates and cellulose filters placed on a wooden rack (c). RC specimens (d). Ic measurement device (e).
Buildings 14 02494 g001
Figure 2. Geometry of RC specimens considered in this study.
Buildings 14 02494 g002
Figure 3. Behavior of monthly mean values of ClDR and SOxDR between the cold and summer seasons during the first year of study.
Buildings 14 02494 g003
Figure 4. Monthly behavior of RH, T, and WS during the first year of study.
Buildings 14 02494 g004
Figure 5. Behavior of annual average values of the twelve Ic values versus time of exposure (R = reference, 1 = first year, 2 = second year, and 3 = third year). CCTh = 20 mm (a). CCTh = 40 mm (b).
Buildings 14 02494 g005
Figure 6. Prediction of Ic for concrete with w/c ratio of 0.4 versus exposure time according to the fitted model.
Buildings 14 02494 g006
Figure 7. Behavior of the twelve Ic values determined in the third year of exposure in the RC specimens as a function of the w/c ratios, CCTh, and the twelve values of fck, εe, UPS, and D. Changes in Ic vs. compressive strength (a), percentage of effective capillary porosity (b), ultrasonic pulse velocity (c), and density (d) for different w/c ratios and CCTh.
Buildings 14 02494 g007
Figure 8. Visual observation of RC specimens placed at COES during the three years of study.
Buildings 14 02494 g008
Figure 9. Visual observation of two specimens of carbon steel. Intense deterioration due to atmospheric corrosion is observed. The metal has been perforated by atmospheric corrosion.
Buildings 14 02494 g009
Figure 10. Different crystalline phases identified in the rust layers of reinforcement steel embedded in the RC specimen with a w/c ratio of 0.6 and a CCTh value of 20 mm placed at the COES until the third year of exposure.
Buildings 14 02494 g010
Figure 11. Morphology of the crystalline phases identified in the oxide layer formed on reinforcement steel surface. Lepidocrocite in foam form, goethite in flower form, and magnetite in ring form (b). Akaganeite in reinforcement bars formed with right-angled edges (a,c,d), EDS (e,f).
Buildings 14 02494 g011
Table 1. Chemical composition of materials.
Components (%)SiO2Al2O3Fe2O3CaOMgOSO3Na2OK2OL.O.I
Cement20.644.833.2763.641.261.940.560.453.41
Gravel7.860.581.0245.153.960.150.010.3440.93
Sand1.420.680.3045.463.52-0.070.0548.50
Table 2. Concrete mixtures considered in this study (cement content was 365 kg/m3 for all mixtures).
w/cWater (kg m−3)Superplasticiser (kg m−3)Slump (cm)
0.62221.018
0.51861.517
0.41481.715
Table 3. Atmospheric corrosivity categories for carbon steel and zinc.
MaterialCorrosion Rate (µm y−1)Range per Category (µm y−1)Category
Carbon Steel452.45200 > rcorr > 700CX
Zinc24.338.4 > rcorr > 25CX
Table 4. Durability requirements directly linked with concrete quality parameters for CX corrosivity category.
w/cConcrete Cover Thickness (mm)fck (MPa)εe (%)UPV
(m s−1)
D
(kg m−3)
Ic
(μA cm−2)
ti
(Years)
0.440[23,24,35][5–9][4220–4300][2340–2360][0.001–0.002]42
Table 5. Extreme atmospheric corrosivity category (CX: 200 < rcorr < 700) estimated for carbon steel for various coastal cities.
Coastal City/CountryClDR
(mg m−2d−1)
Corrosivity Category (C)
rcorr (μm y−1)
Coatzacoalcos/Mexico1040.37320.24
Minatitlán/Mexico763.54294.58
Veracruz/Mexico1483.00294.58
Tuxpan/Mexico671.37263.84
Laguna Verde/Mexico826.8216.98
Tampico/Mexico1307.69327.49
Tulúm/Mexico513.48202.59
Refinery/Irán1409.96450.24
Saudi Arabia608.00472.0
Choshi/Japan324.66323.0
Limón/Costa Rica220.00371.5
Sines/Portugal203.00365.0
Table 6. Multiple regression fitting for the data collected during the three years of this study (Equation (3)).
Number of Samples (n)Concrete Cover Thickness of (mm)RelationshipR2
(%)
p
(≤0.0000)
3620 I c = 0.06 + 0.28 w / c 0.23 f c k + 0.002 ε e 940.0000
3640 I c = 1.66 + 0.08 w / c 0.05 f c k + 0.02 ε e 990.0000
Table 7. Comparison from the multiple range test method.
Durability
Requirements
CCTh of 20 mmCCTh of 40 mm
nAverageHomogeneity GroupAverageHomogeneity Group
X ColumnX Column
Ic (μA-cm−2)361.260X 0.486X
w/c ratio360.5X 0.5X
εe (%)3613.7XX 13.7XX
fck (MPa)3630 X 30 X
D (kg m−3)362333 X 2333 X
UPV (m s−1)364097 X4097 X
Table 8. Estimated differences between each pair of means.
ContrastCCTh of 20 mmCCTh of 40 mm
Sig.Difference±LimitSig.Difference±Limit
Ic-w/c 0.76024.863 −0.01324.863
Ic-fck*−29.158*−29.932
Ic-εe −12.499 −13.273
Ic-UPV*−4095.8*−4096.57
Ic-D*−2331.43*−2332.21
w/c-fck*−29.9194*−29.919
w/ce −13.260 −13.260
w/c-UPV*−4096.56*−4096.56
w/c-D*−2332.19*−2332.19
fck-εe 16.659 16.659
fck-UPV*−4066.64*−4066.64
fck-D*−2302.28*−2302.28
εe-UPV*−4083.3*−4083.3
εe-D*−2318.93*−2318.93
UPV-D*1764.36*1764.36
Disclaimer/Publisher’s Note: The statements, opinions and data contained in all publications are solely those of the individual author(s) and contributor(s) and not of MDPI and/or the editor(s). MDPI and/or the editor(s) disclaim responsibility for any injury to people or property resulting from any ideas, methods, instructions or products referred to in the content.

