Article

Full-Scale Lateral Load Test of Large-Diameter Drilled Shaft for Building Construction on Marine Deposits

1
School of Civil, Environmental, and Architectural Engineering, Korea University, Seoul 02841, Republic of Korea
2
Department of Civil Engineering, Chungnam National University, Daejeon 34134, Republic of Korea
*
Author to whom correspondence should be addressed.
Buildings 2024, 14(9), 2596; https://doi.org/10.3390/buildings14092596
Submission received: 19 July 2024 / Revised: 15 August 2024 / Accepted: 21 August 2024 / Published: 23 August 2024
(This article belongs to the Special Issue Advances in Foundation Engineering for Building Structures)

Abstract

:
The construction of buildings and infrastructure on marine deposits is challenging. The impact of the horizontal behavior of structures on reclaimed areas is critical. This study investigated the behavior of laterally loaded drilled shafts in marine deposits through a comprehensive analysis and full-scale lateral load test conducted in Songdo, South Korea. It identified various critical pile characteristics for designing and constructing architectural and civil structures in marine environments, focusing on a 2.5 m diameter, 40 m long drilled shaft. At a 900 kN design load, the test pile experienced a maximum moment of 3520.2 kN·m and a lateral deflection of 2.32 mm, with anticipated failure at a load of 1710 kN and 11.30 mm displacement. Fiber Bragg Grating (FBG) sensors enabled precise displacement and strain measurements, essential for constructing accurate load–displacement curves and understanding lateral load responses. Inverse analysis with validated data from a commercial software (LPILE) showed good alignment of maximum moment and displacement but highlighted challenges at failure loads. The study developed depth-dependent p-y curves for marine deposits, crucial for predicting soil–pile interaction and optimizing shaft design. Practical implications include using derived p-y curves and an empirical equation using Standard Penetration Test (SPT) results to predict the coefficient of horizontal subgrade reaction (kh) with high accuracy. Overall, this research emphasizes the importance of advanced instrumentation and analytical techniques for optimizing drilled shaft design and ensuring structural stability in challenging marine geological conditions.

1. Introduction

The structural integrity of different civil engineering constructions is largely dependent on the effectiveness and stability of deep foundations in the field of geotechnical engineering. Drilled shafts, known for their capability to transfer loads to deeper, more stable soil or rock layers, are commonly used to support heavy structures such as bridges and high-rise buildings [1,2,3,4,5,6]. Understanding the lateral behavior of these drilled shafts is crucial for optimizing their design and ensuring their reliability in diverse geological conditions [7,8,9,10,11]. Particularly, research on reclaimed land foundations is of utmost importance due to the unique challenges and opportunities that reclaimed land presents.
In the case of the Korean peninsula, which has a relatively small territory compared to other countries, land reclamation projects play a crucial role in expanding and developing land for various purposes [12,13,14,15]. Investigating the subground in a land reclamation project is crucial for ensuring the structural stability, environmental sustainability, and cost-effective construction of the reclaimed area [16,17,18]. This process involves assessing the load-bearing capacity of soils, geotechnical properties, and potential environmental impacts. The information gathered guides the design of infrastructure, helps mitigate risks associated with the reclaimed land, and ensures compliance with regulations. Overall, a thorough investigation of the subground conditions is integral to making informed decisions at every stage of the land reclamation project, ultimately contributing to its success and long-term viability.
The lateral behavior of pile foundations is crucial for the stability and performance of structures subjected to horizontal loads such as earthquakes, wind, and soil pressure [19,20,21,22,23]. Pile foundations play a key role in redistributing these lateral forces to the surrounding soil, impacting load distribution, structural stability, and overall resilience [24,25]. Understanding this is vital in the design of retaining structures, bridge foundations, and systems for stabilizing slopes, as well as optimizing foundation design to ensure cost-effectiveness. Additionally, the knowledge of lateral behavior aids in assessing the foundation’s performance over time through monitoring, contributing to maintenance and retrofitting strategies [26,27,28,29]. Ultimately, a comprehensive understanding of the horizontal behavior of pile foundations is essential for securing the safety, stability, and long-term functionality of diverse buildings and infrastructures.
Evaluating the behavior of pile foundations under lateral loading involves a multidimensional approach. The p-y method, introduced by McClelland and Focht [30], is a widely used approach for analyzing lateral soil–structure interaction; the coefficient of horizontal subgrade reaction is crucial in studying how pile foundations behave laterally [31,32]. These approaches provide essential insights on how lateral resistance is distributed along the pile shaft, allowing for a comprehensive understanding of the sophisticated interactions between the soil around it and the pile foundation. Accurate assessments of lateral displacements, strains, and the response of the p-y curves under different conditions are crucial for refining design criteria and optimizing construction methodologies. In addition to the p-y method, back analysis is also used to refine design parameters based on the observed lateral behavior of pile foundations [27,33,34]. Numerous studies on the lateral behavior of pile foundations are being conducted using numerical analysis [35,36,37]. Field testing, including lateral load tests and instrumentation such as inclinometers, offers direct measurements of pile responses to lateral forces [38,39,40,41]. Continuous field monitoring, including settlements and inclinations, provides real-time data for ongoing performance assessment of the lateral behavior of pile foundations [42].
The implementation of fiber optic sensors in geotechnical monitoring has gained significant traction due to their precision, durability, and ability to provide real-time data [43,44,45]. Optical fiber sensors are highly valued for measuring the behavior of pile foundations due to their high sensitivity, durability, and ability to perform in harsh environments. These sensors can detect minute deformations and strains, offering a precise measure of structural integrity crucial for the early detection of potential issues. Their immunity to electromagnetic interference and multiplexing capability allow for detailed, interference-free data collection at various points along the pile, even in locations with electromagnetic disturbances. Additionally, the small size and flexibility of optical fibers facilitate their integration into structures without compromising strength, while their capacity for remote data transmission supports monitoring in inaccessible locations. This makes optical fiber sensors an excellent choice for non-destructive testing and evaluation, ensuring ongoing assessment of pile foundation health and safety without structural interruption. Fiber Bragg Grating (FBG) sensors are a specific type of fiber optic sensor that is widely used in various structural health monitoring applications, including in civil engineering for the monitoring of structures like pile foundations. FBG sensors utilize the unique properties of optical fibers to measure strain, temperature, and other physical parameters with high precision [46,47].
Consequently, the combination of these methods offers a comprehensive evaluation of the lateral behavior of pile foundations, essential for ensuring their stability, resilience, and optimal design. Consulting with experienced geotechnical and structural engineers is crucial for selecting and interpreting appropriate evaluation methods.
The rationale for undertaking this study arises from the necessity to improve our comprehension of the intricate interplay between drilled shafts and the encompassing soil. This research focuses on the lateral behavior of a specifically designed 2.5 m drilled shaft, employing state-of-the-art FBG optical sensors. By integrating FBG sensors into the drilled shaft, we aim to capture detailed information about its lateral response under varying loading conditions, soil types, and environmental factors. There is a particular focus on elucidating the significance of the p-y method and the coefficient of horizontal subgrade reaction. This paper presents the experimental setup, methodology, and preliminary findings from monitoring a 2.5 m drilled shaft equipped with FBG optical sensors, with a particular focus on the application of the p-y method and the coefficient of horizontal subgrade reaction. This comprehensive research aims to provide a deeper understanding of lateral soil–structure interaction, ultimately contributing to the overall safety and performance of deep foundation systems.

2. Site Description and Soil Profile
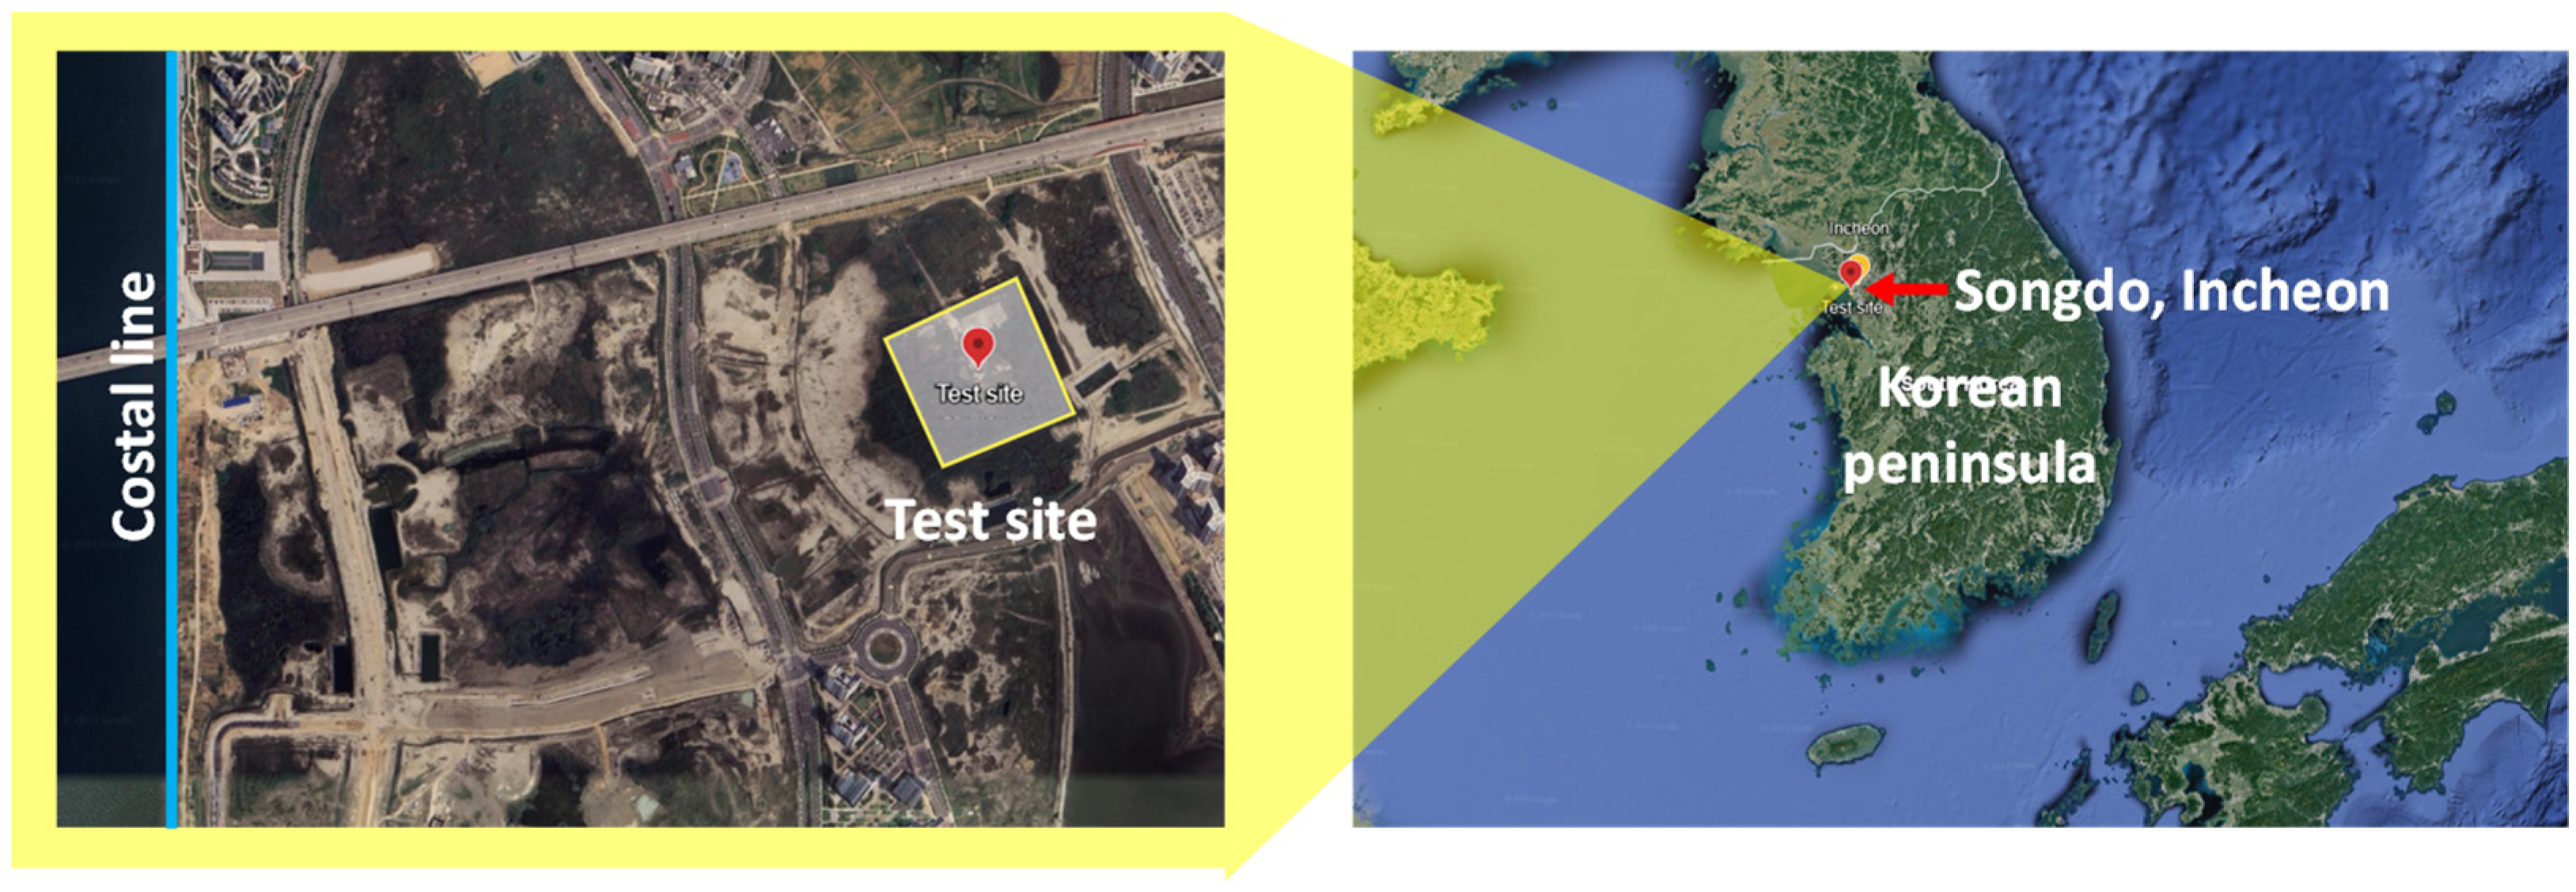
2.1. Test Site

Songdo, officially designated as the Songdo International Business District (Songdo IBD), is a smart city located on about 6,000,000 m2 of reclaimed land along the waterfront of Incheon in South Korea (see Figure 1) [48].
It is linked to Incheon Internal Airport by an approximately 12 km long bridge, Incheon Bridge. Along with the Yeongjong and Cheongna regions, Songdo forms part of the Incheon Free Economic Zone (IFEZ) [49]. Remarkable buildings in Songdo IBD include the completed Northeast Asia Trade Tower and G-tower, as well as the planned Incheon Tower. The district is designed to host office buildings, hospitals, schools, apartments, and cultural facilities. Songdo IBD includes about 100 buildings and 200,000,000 m2 of Leadership in Energy and Environmental Design (LEED)-certified space, representing approximately 40% of all LEED-certified space in South Korea, as recognized by the United States Green Building Council. According to data from 2023, Songdo has a population of over 210,000 people. Additionally, the planned iCore City is expected to be a 103-story (420-m) structure, making it the second tallest in Korea after the 123-story Lotte World Tower (555-m) in the Jamsil region of South Korea. Beginning in 2024, several facilities will undergo construction in phases, with these projects being scheduled for completion by 2030. The designs will incorporate elements modeled after Central Park in New York City and the canals of Venice.

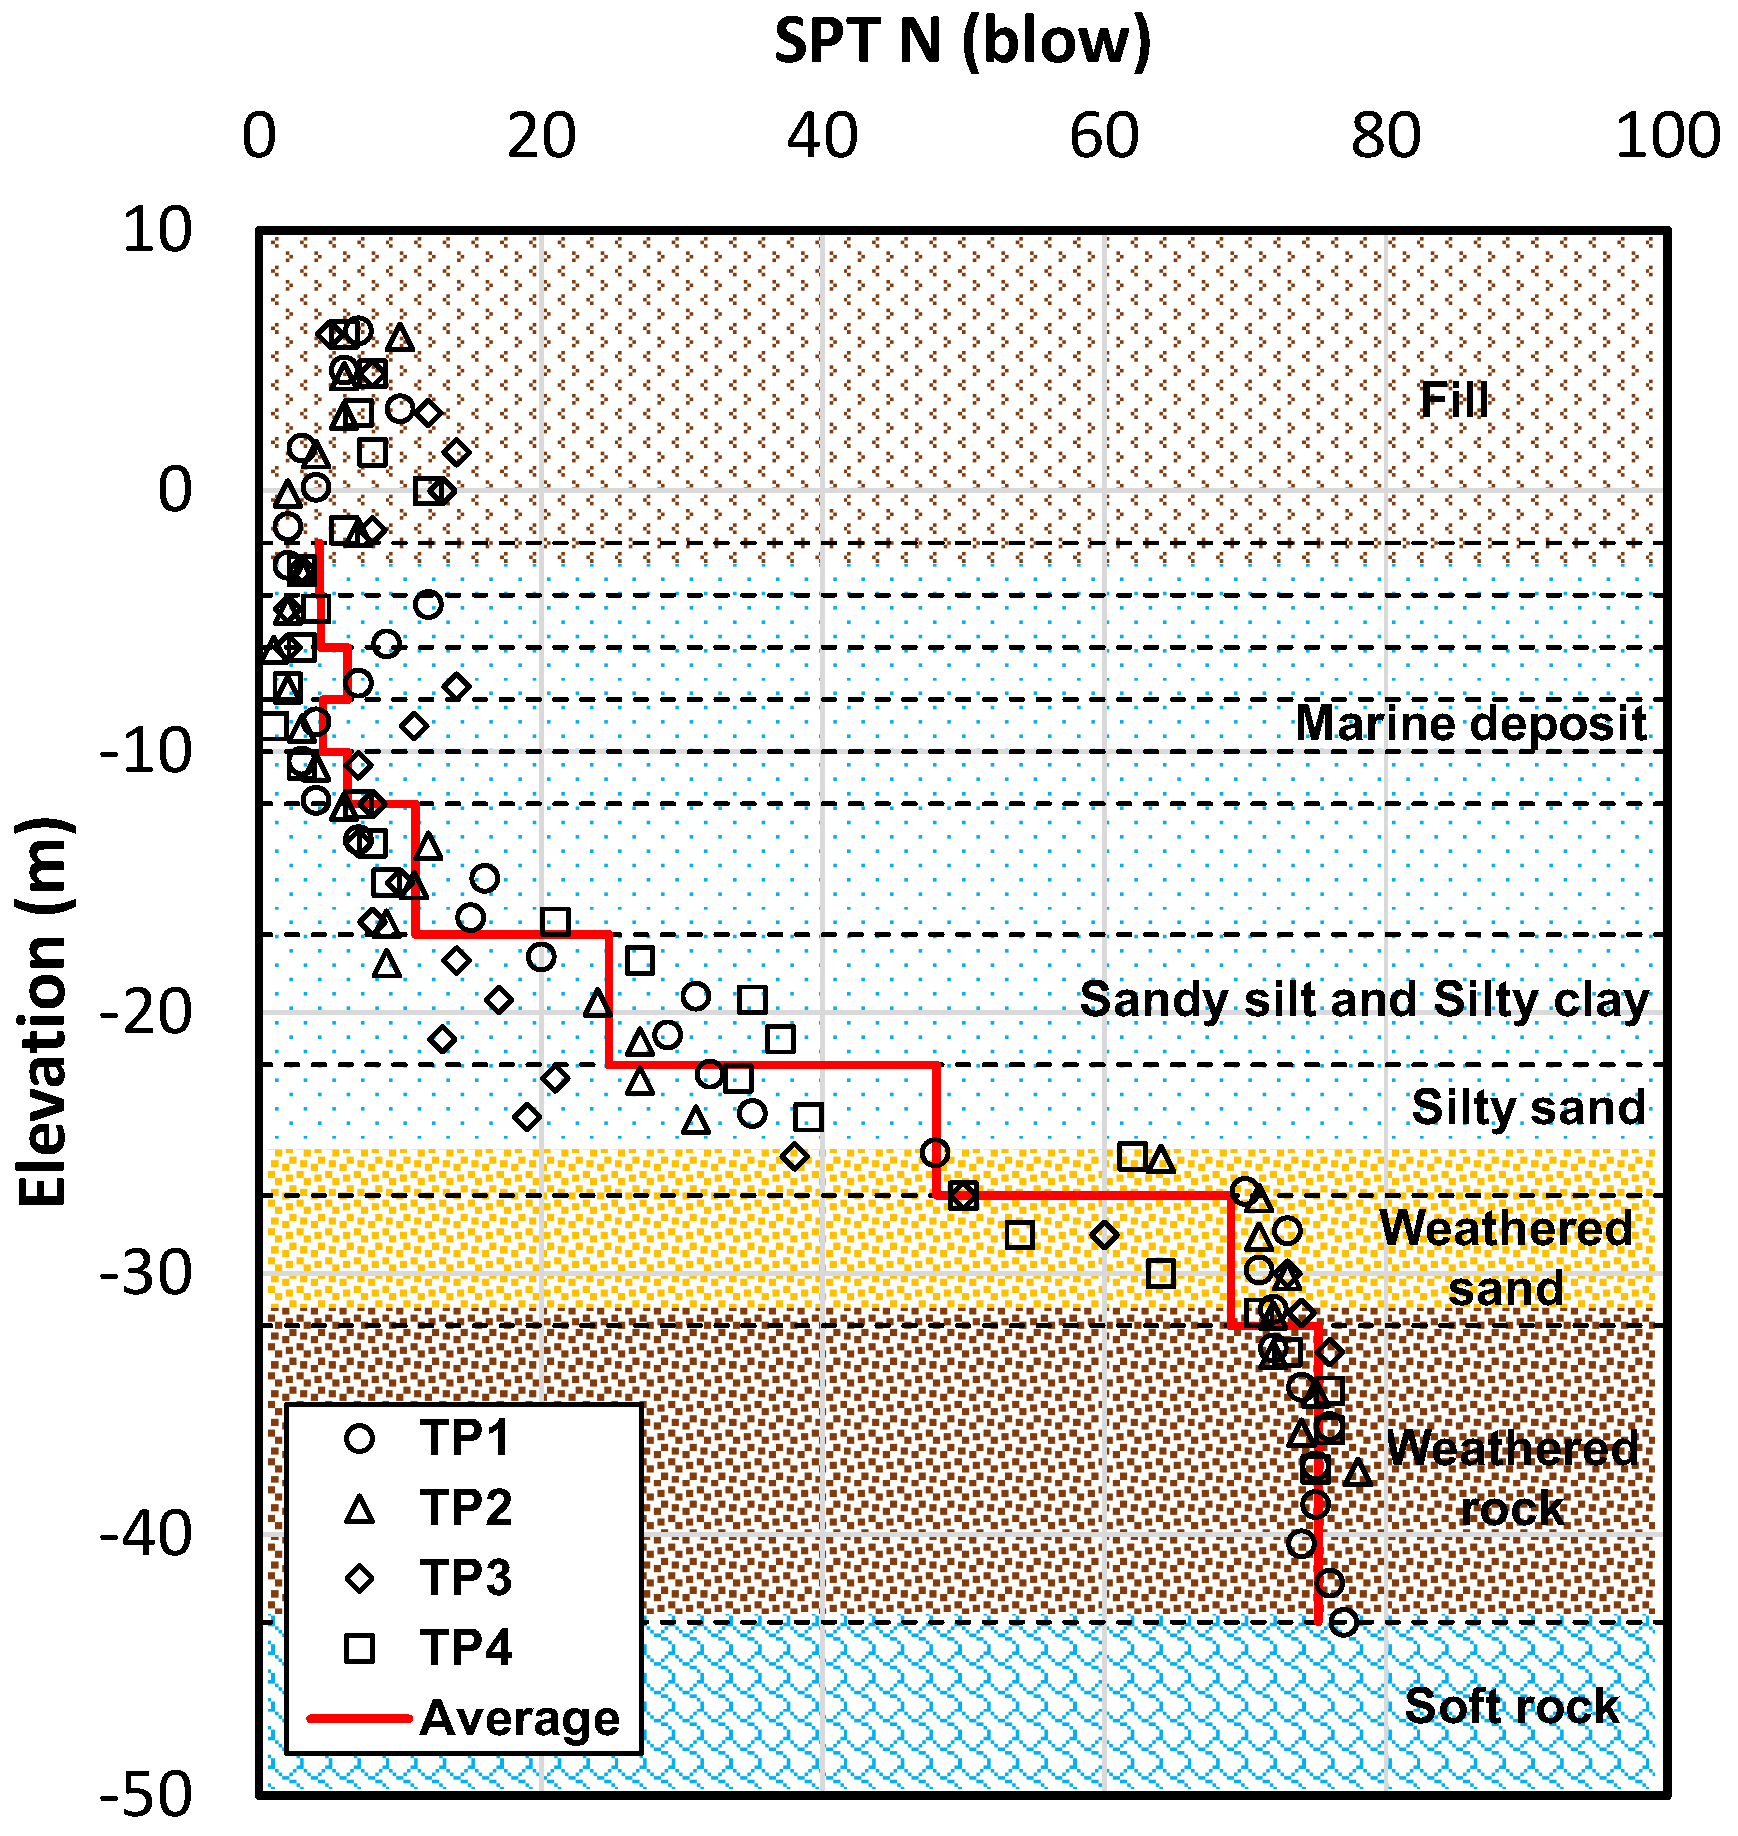
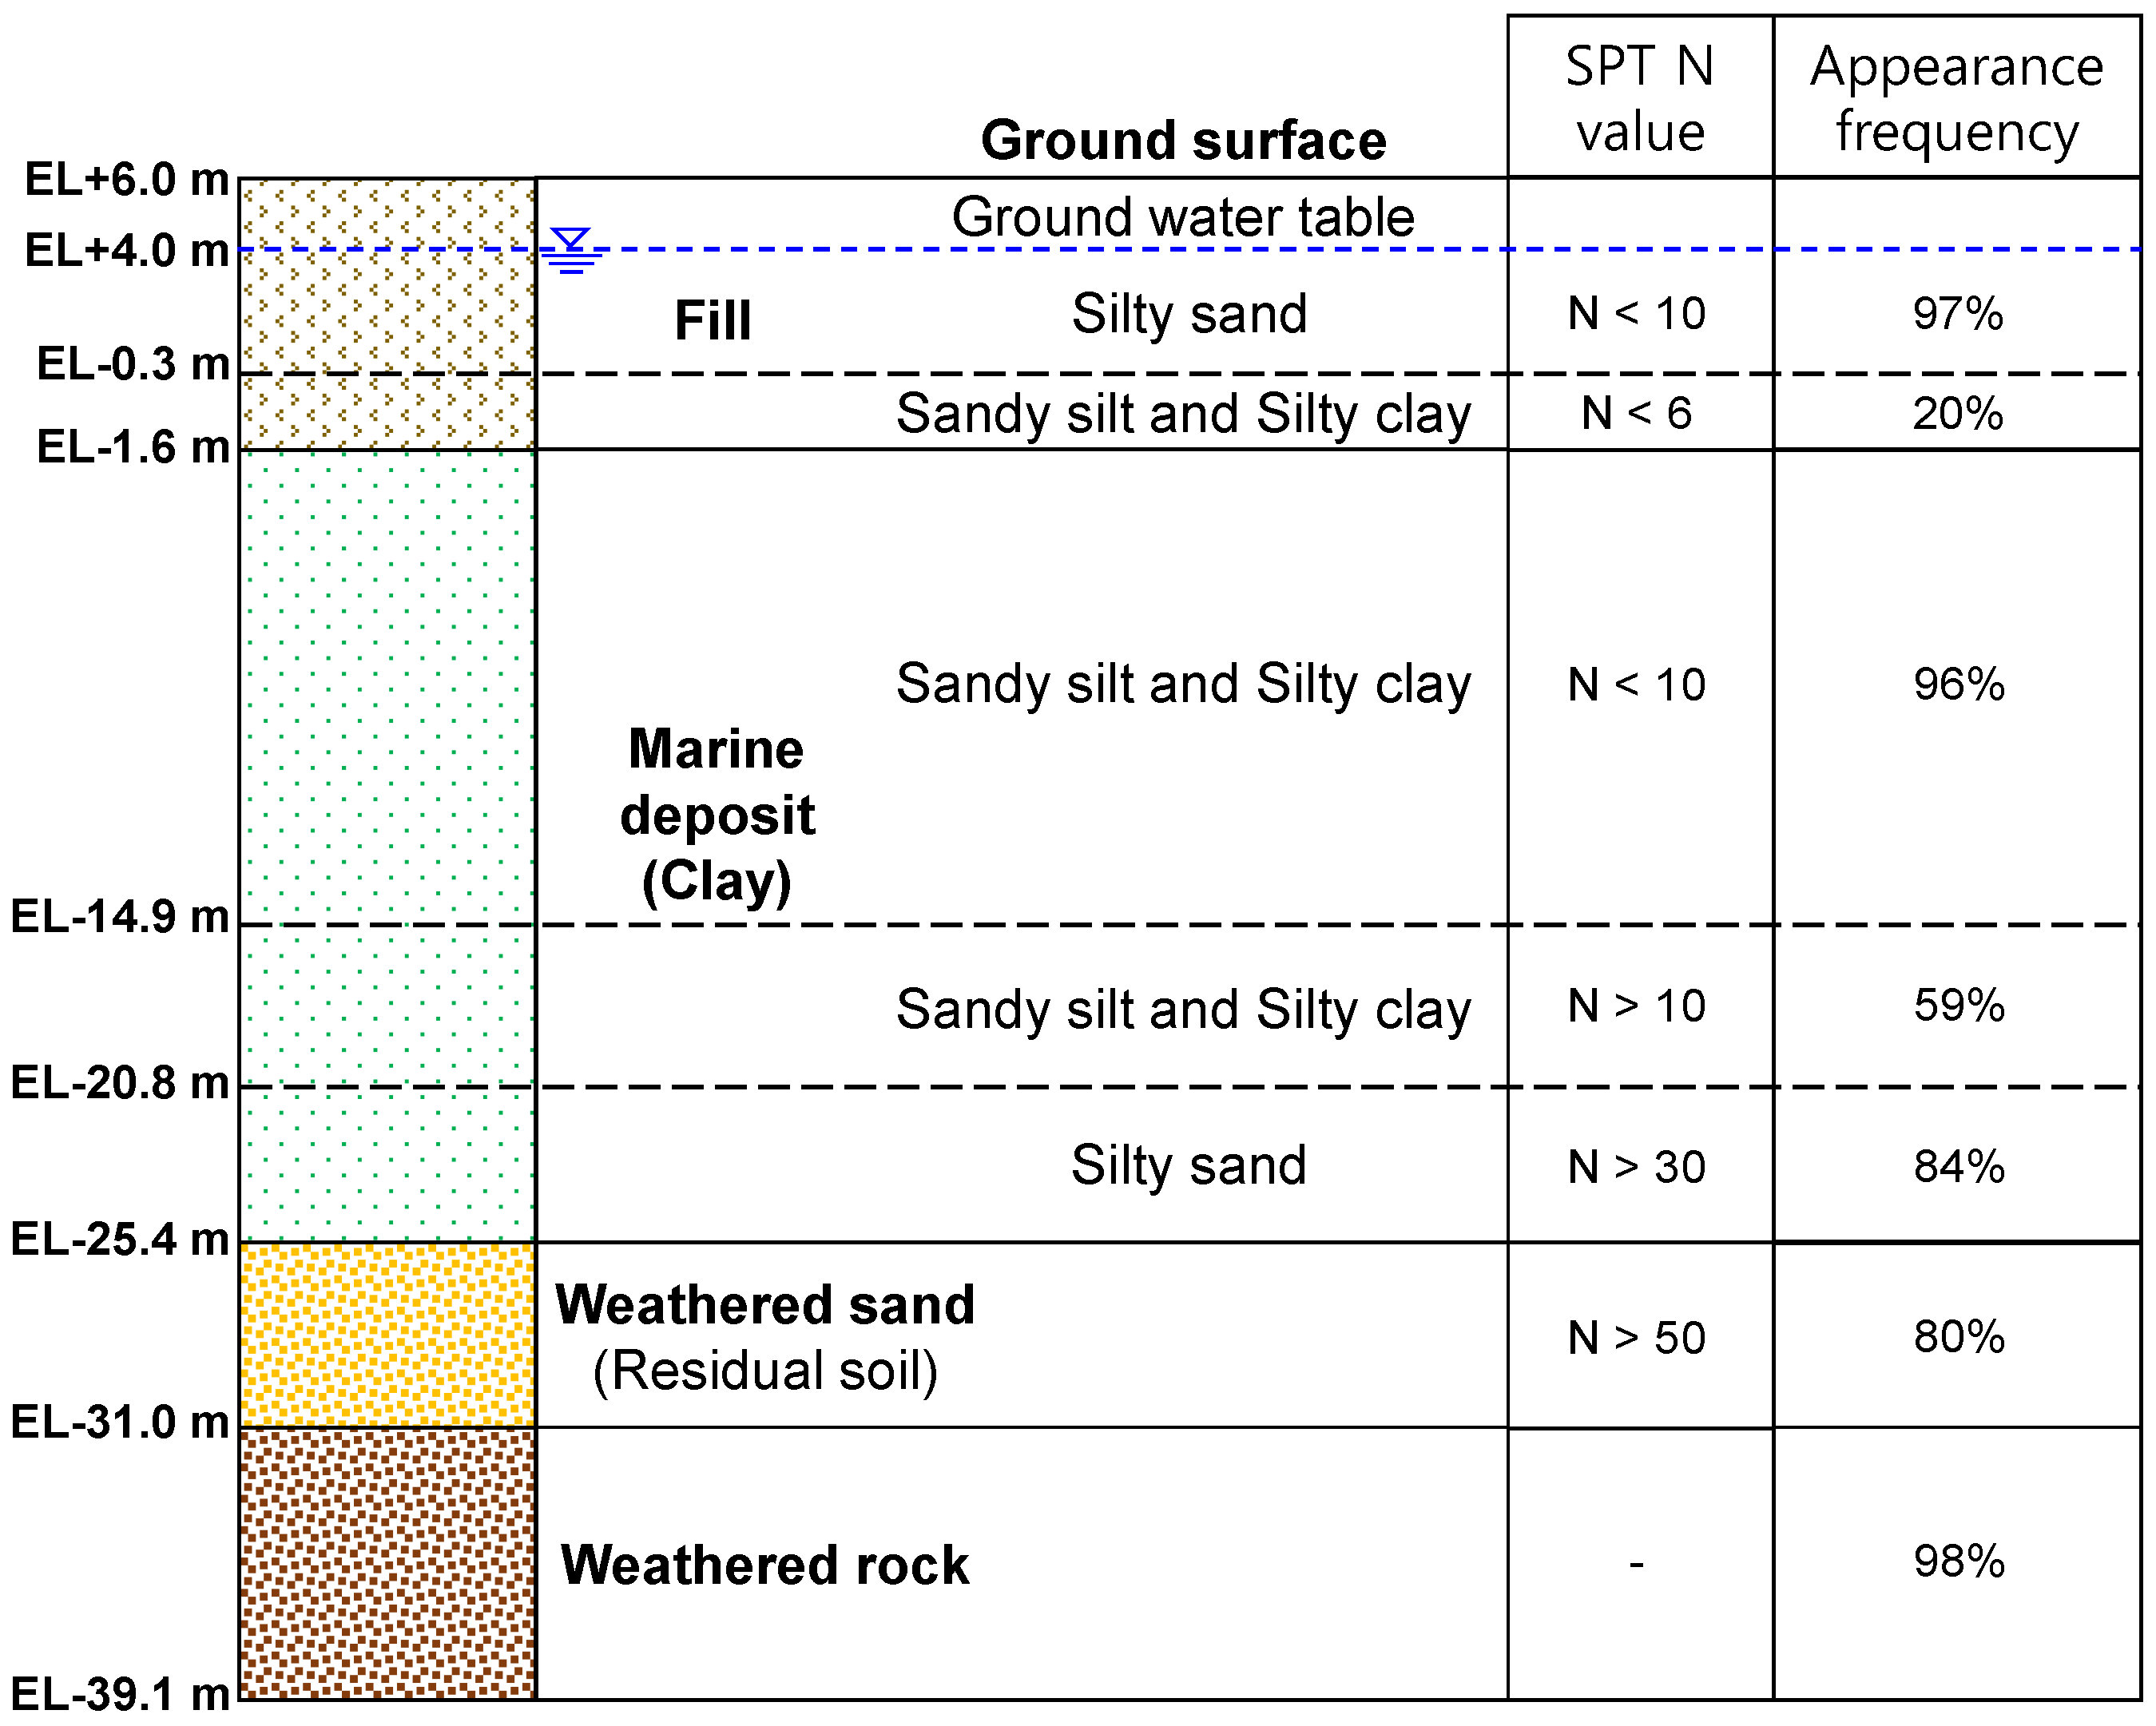
2.2. Subsurface Conditions

As mentioned above, a full-scale lateral pile load test was conducted in the Incheon Free Economic Zone (IFEZ) in the Songdo area of South Korea. In particular, the west coast of the Korean peninsula exhibits an unusual characteristic, with tide ranges reaching approximately 8 m during ebb and flow. Therefore, this area features a significantly deeper marine deposit layer compared to other locations. To investigate the subgrade conditions of the test site, borehole tests and Standard Penetration Tests (SPTs) were consistently performed, as shown in Figure 2.
Each symbol represents the SPT (Standard Penetration Test) result obtained from a specific borehole, while the solid line indicates the average SPT value for each layer. Based on the results derived from boring holes, the layers of the test area can be broadly categorized into dredged fill, marine deposit, weathered soil, weathered rock, soft rock, and hard rock layers. Figure 3 provides more detailed information on the ground conditions and frequency of occurrence in the area, while representative engineering properties of the Songdo area are summarized in Table 1, based on field and laboratory experiments.

3. Test Setup and Procedure

3.1. Instrumentation of FBG Sensor

To measure the axial strain of the laterally loaded pile in this test, unit-type FBG sensors designed for the drilled shaft were employed, as shown in Figure 4. In the fabrication of the unit-type FBG sensor, for the integration and behavior with the sensor after curing concrete, a threaded iron rod was used and a groove was made on it, and the raw FBG sensor was bonded with a strong adhesive before the groove was filled with epoxy in the groove. In addition, hex jam nuts were connected at both ends of the iron rod to increase contact with the concrete. The unit-type FBG sensors attached to the compression and tensile axes of the test pile were symmetrically installed on rebars at the specified level, as shown in Figure 5; these FBG sensors measured the bending strain with depth.

3.2. Test Pile Construction

As previously described, Figure 5 presents the installation location of the FBG sensors and the layout of the reaction pile and test pile. The 2350 mm nominal test pile was excavated to a tip elevation of −40.6 m under conditions of natural water seepage. It was embedded into the soft rock layer at a depth of 40.6 m. The pile installation process is as follows:
(1)
The pile construction began with the insertion of an outer diameter (O.D.) of the 2500 mm casing as the drilling progressed. Excavation of the pile was performed using a reverse circulation drill (RCD), and an airlift was utilized for cleaning purposes.
(2)
After cleaning the base, the reinforcing cage was inserted into the excavation.
(3)
Once the pile reached its tip, the reinforcing cage assembly was allowed to settle the excavation under its weight.
(4)
A 300 mm O.D. concrete delivery pipe (e.g., tremie pipe) was assembled and inserted into the reinforcing cage to extend near the tip of the pile.
(5)
Concrete was then pumped through the tremie pipe into the base of the pile until the top of the concrete reached an elevation of −1 m.
(6)
The 2500 mm O.D. casing was removed during the concrete placement, and the remaining casing was taken out the following day.
Figure 5. Installation location of the FBG sensors and the layout of the reaction and test piles.
Buildings 14 02596 g005

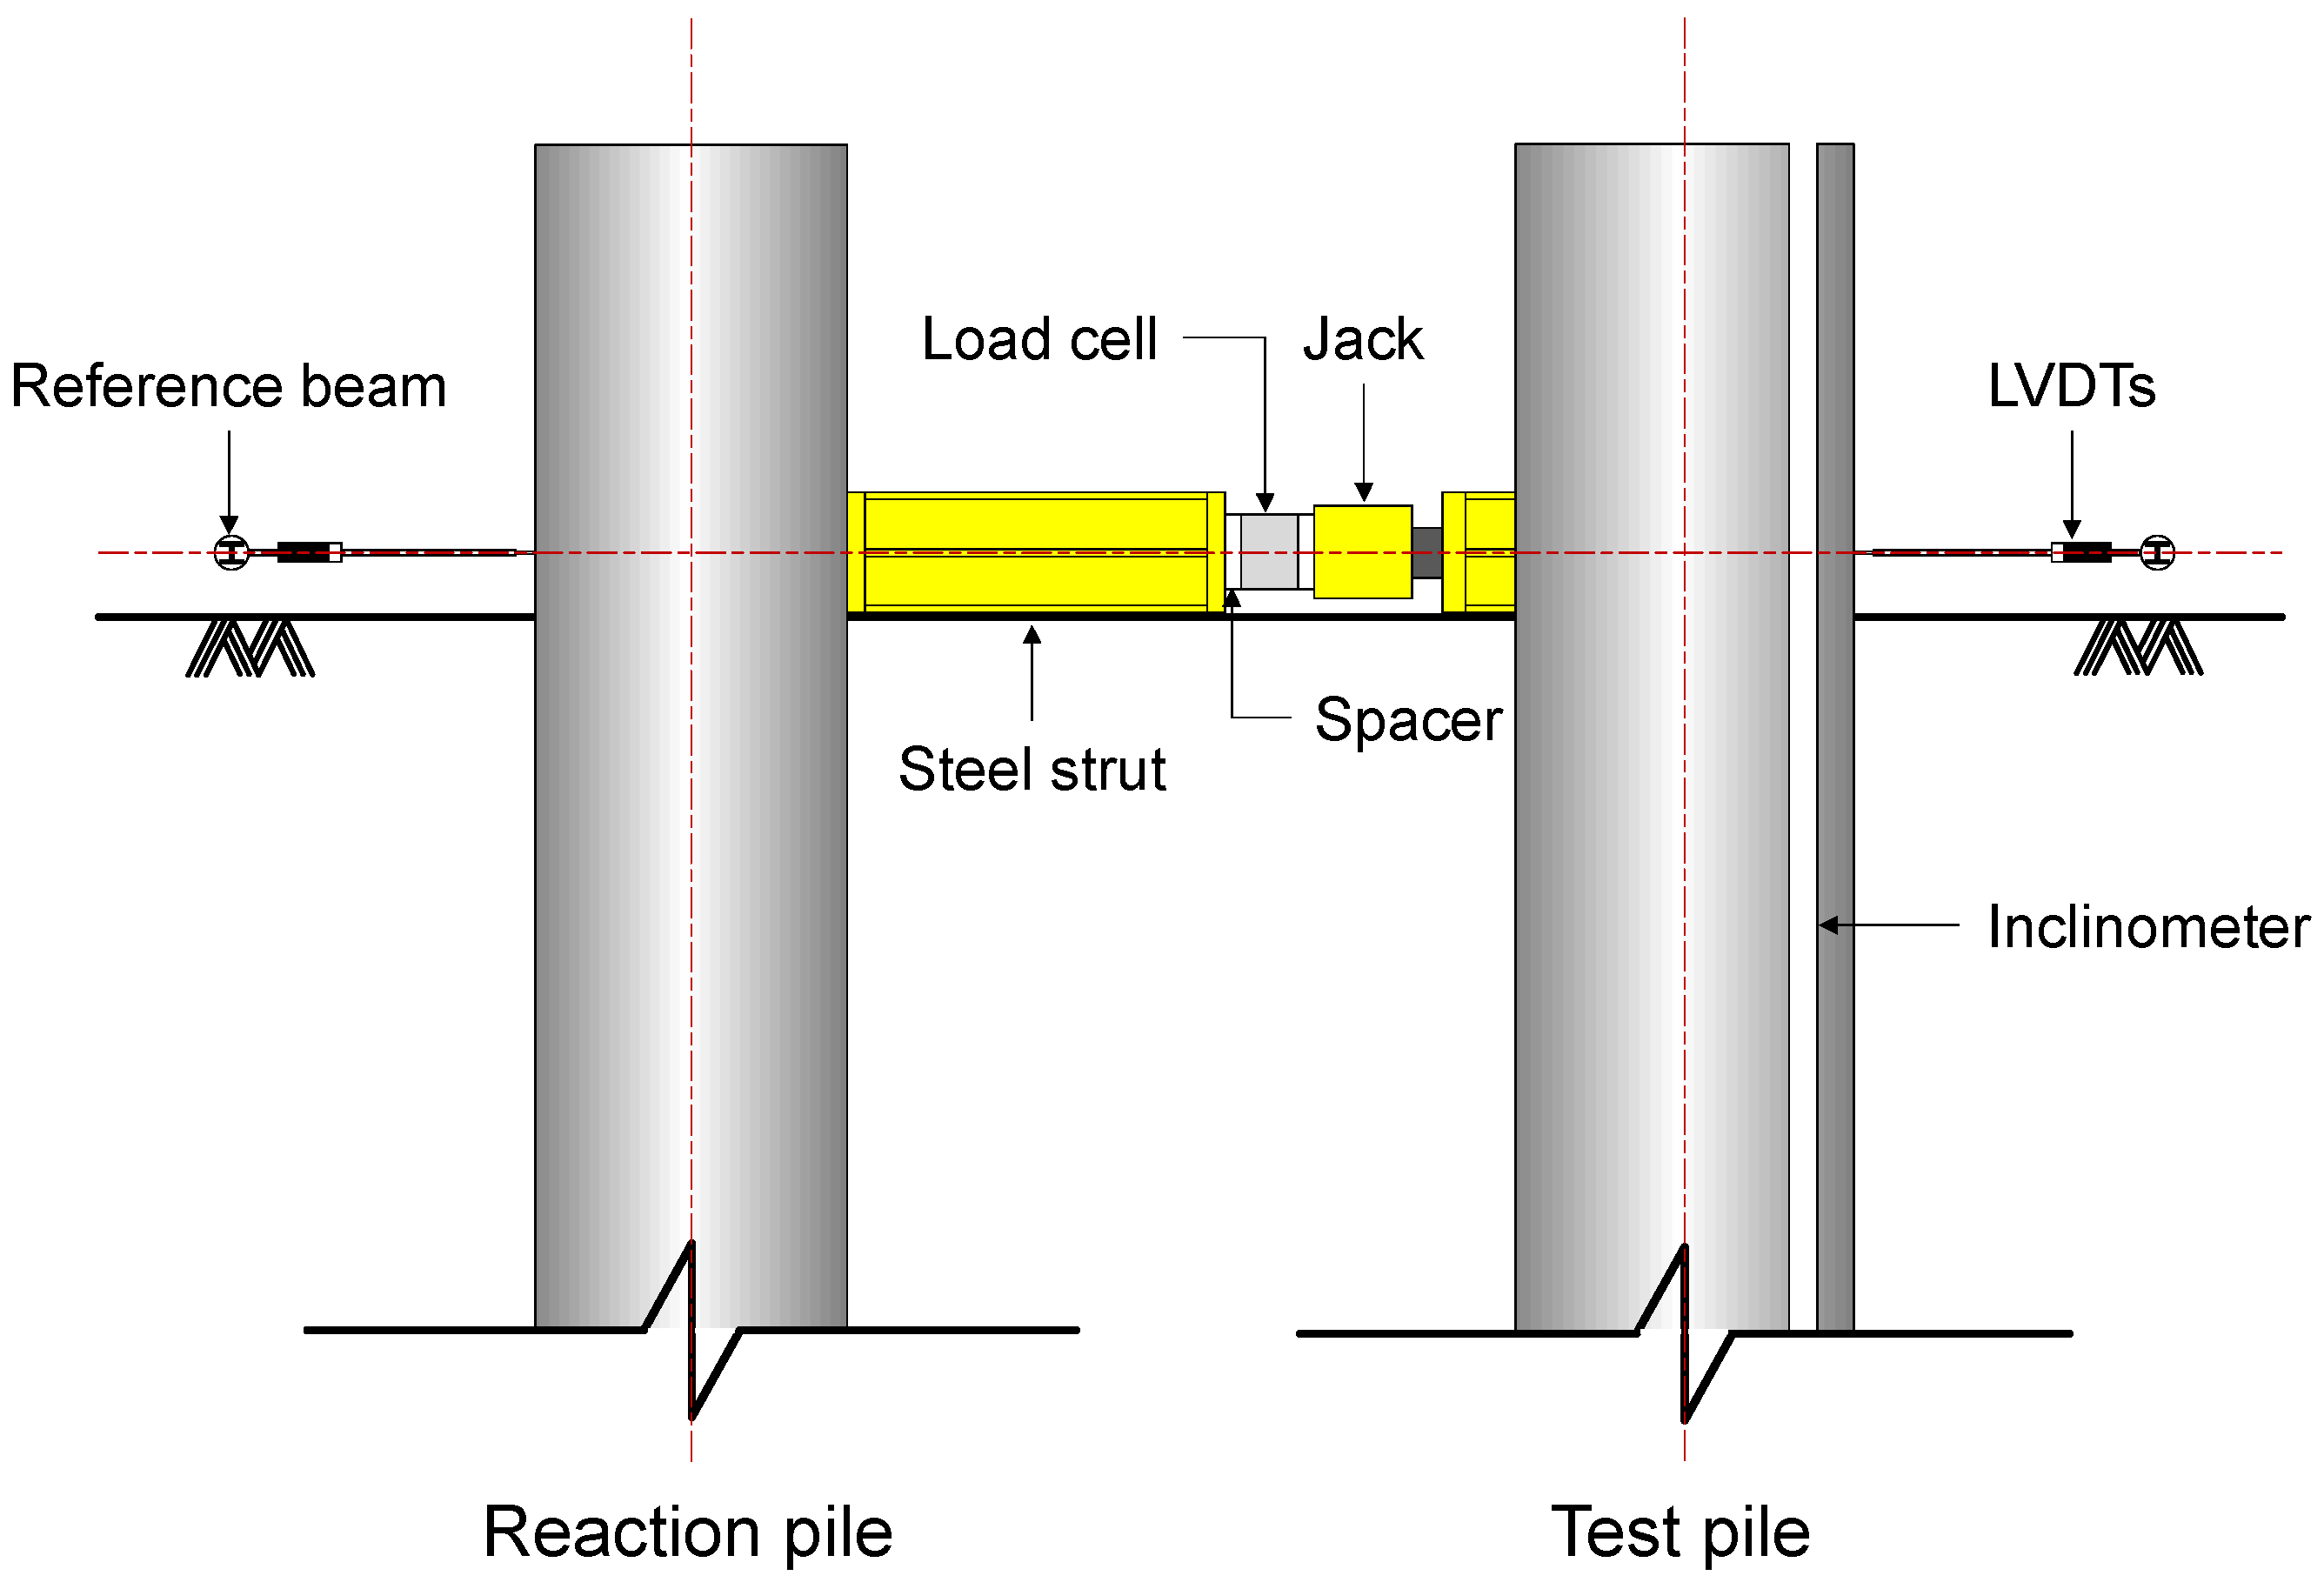
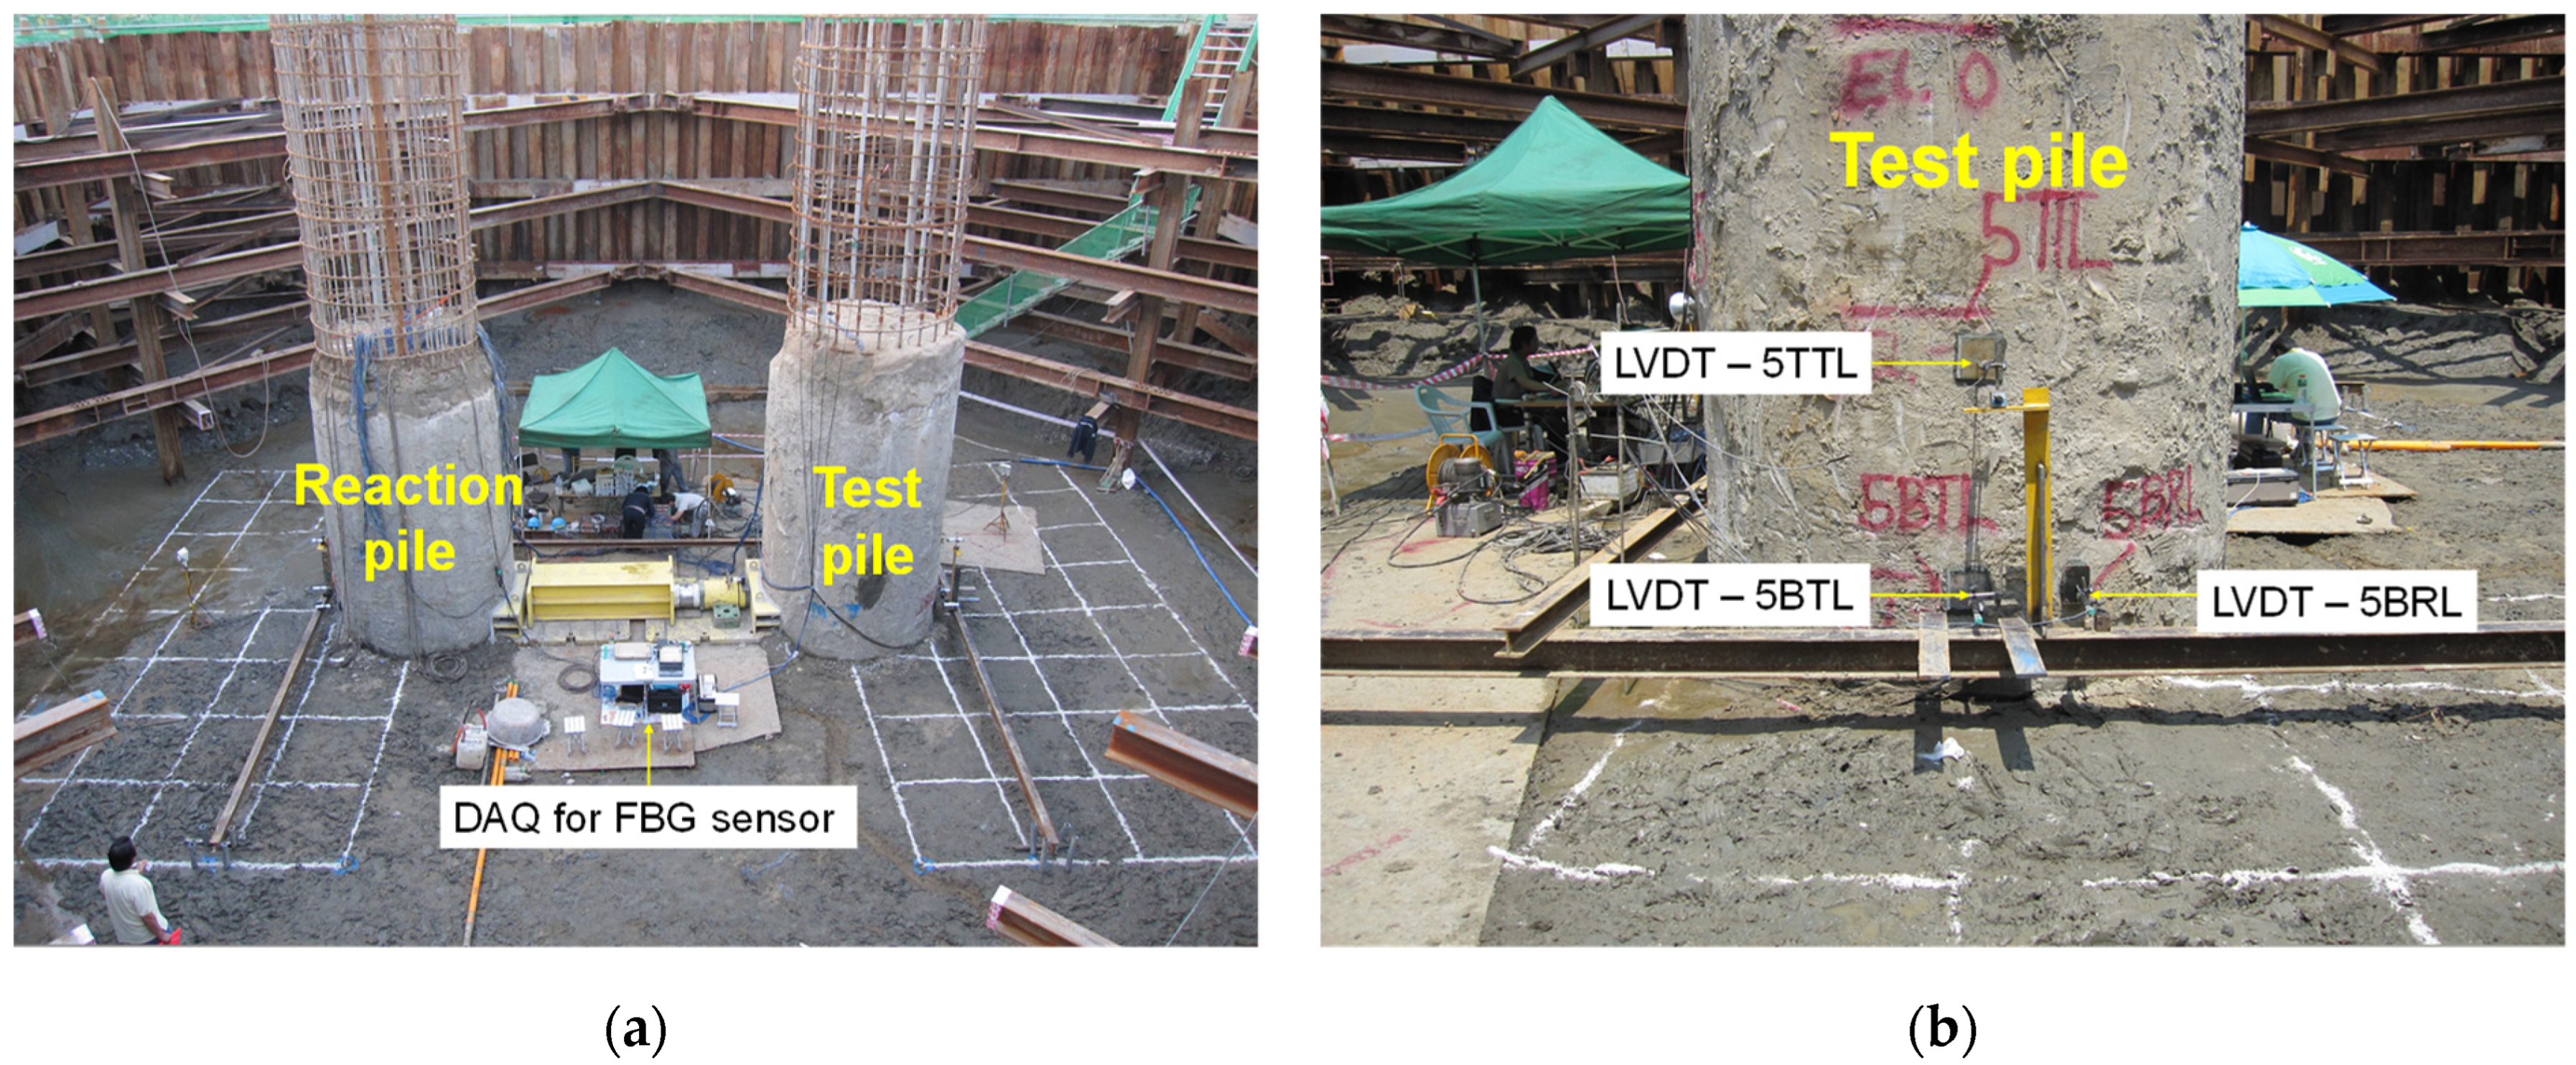
3.3. Setup for Full-Scale Lateral Pile Load Test

The lateral pile load test (LPLT) was set up based on the test standard for deep foundations under lateral loading [51]. Figure 6 illustrates the schematic drawing of the test setup for the lateral load test of the drilled shaft.
Between the reaction and test piles, a hydraulic jack, positioned at a loading elevation of −2 m (consistent with level 10 where the FBG sensor was installed), applied lateral loads to the test pile, with a load cell measuring the exact amount of applied force. The test pile was gradually loaded, beginning at 0 kN and increasing by 150 kN increments, until it reached 1350 kN. Afterward, the hydraulic jack was reset. Upon reapplying the 1350 kN load, the test pile was further loaded in increments of 90 kN from 1530 kN to 1800 kN. The pile head deflection was measured using linear variable differential transformers (LVDTs) mounted on a reference beam, which ensures accurate displacement measurements by remaining stationary (see Figure 7). A total of three LVDTs were installed. Pile head displacement at the loading height, divided into left and right to account for eccentricity. An additional LVDT was installed at −1 m elevation to more accurately evaluate the pile head displacement. The measured values from these three locations were averaged to assess the deflection of the pile head. For analysis purposes, it was assumed that the pile head has constant bending stiffness (EI) over the entire length.

4. Test Results and Analysis

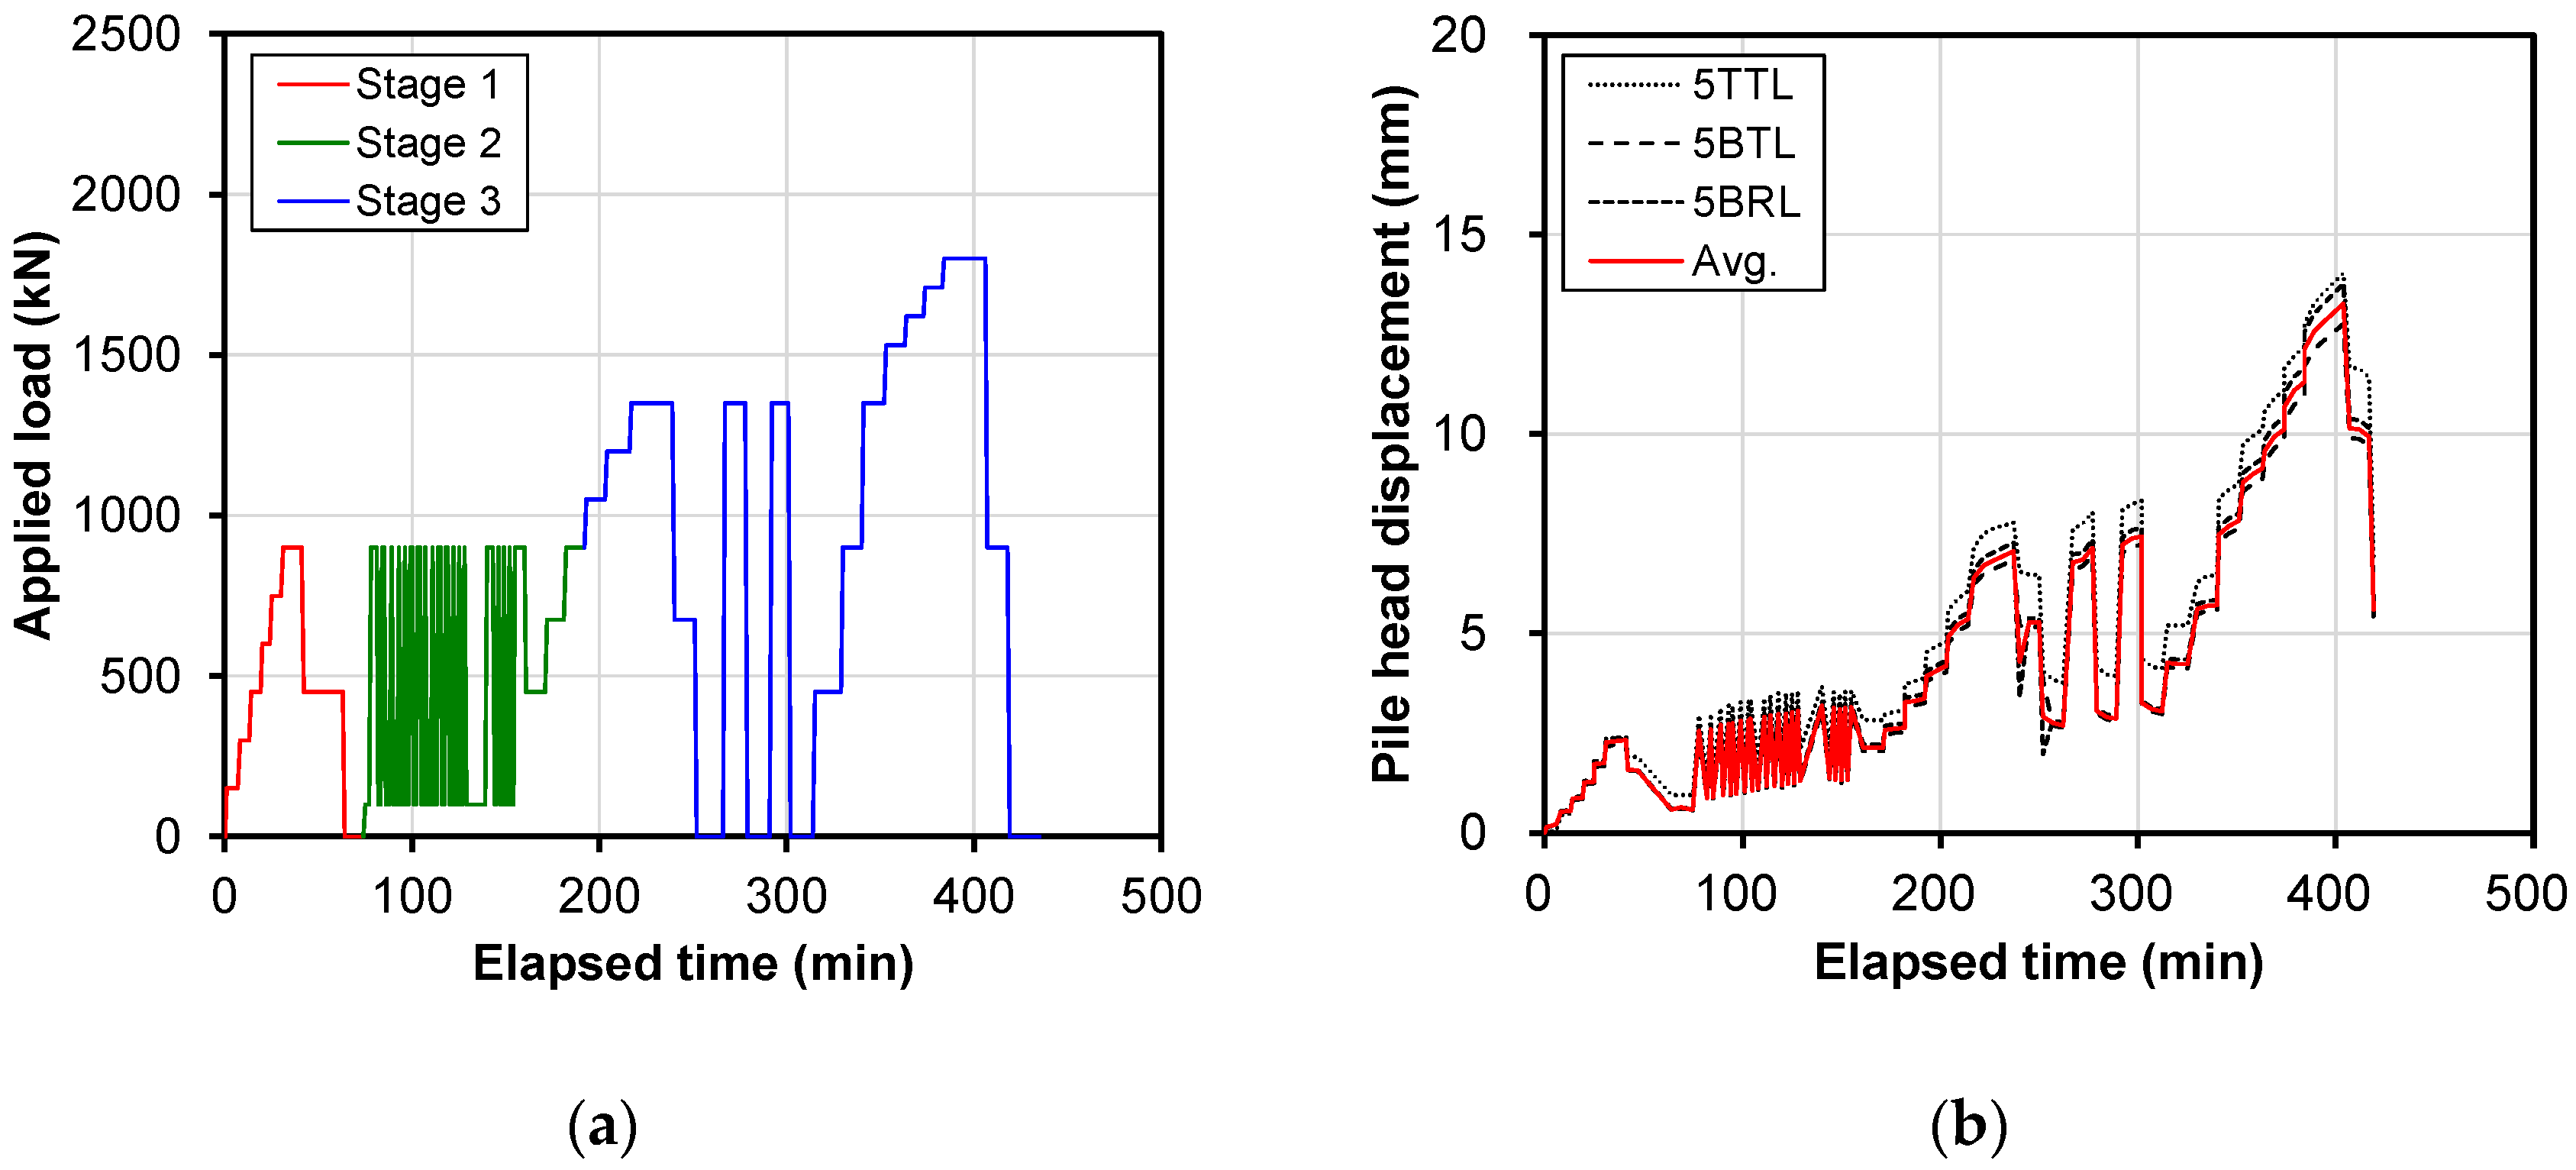
4.1. Measurements of Lateral Pile Load Test

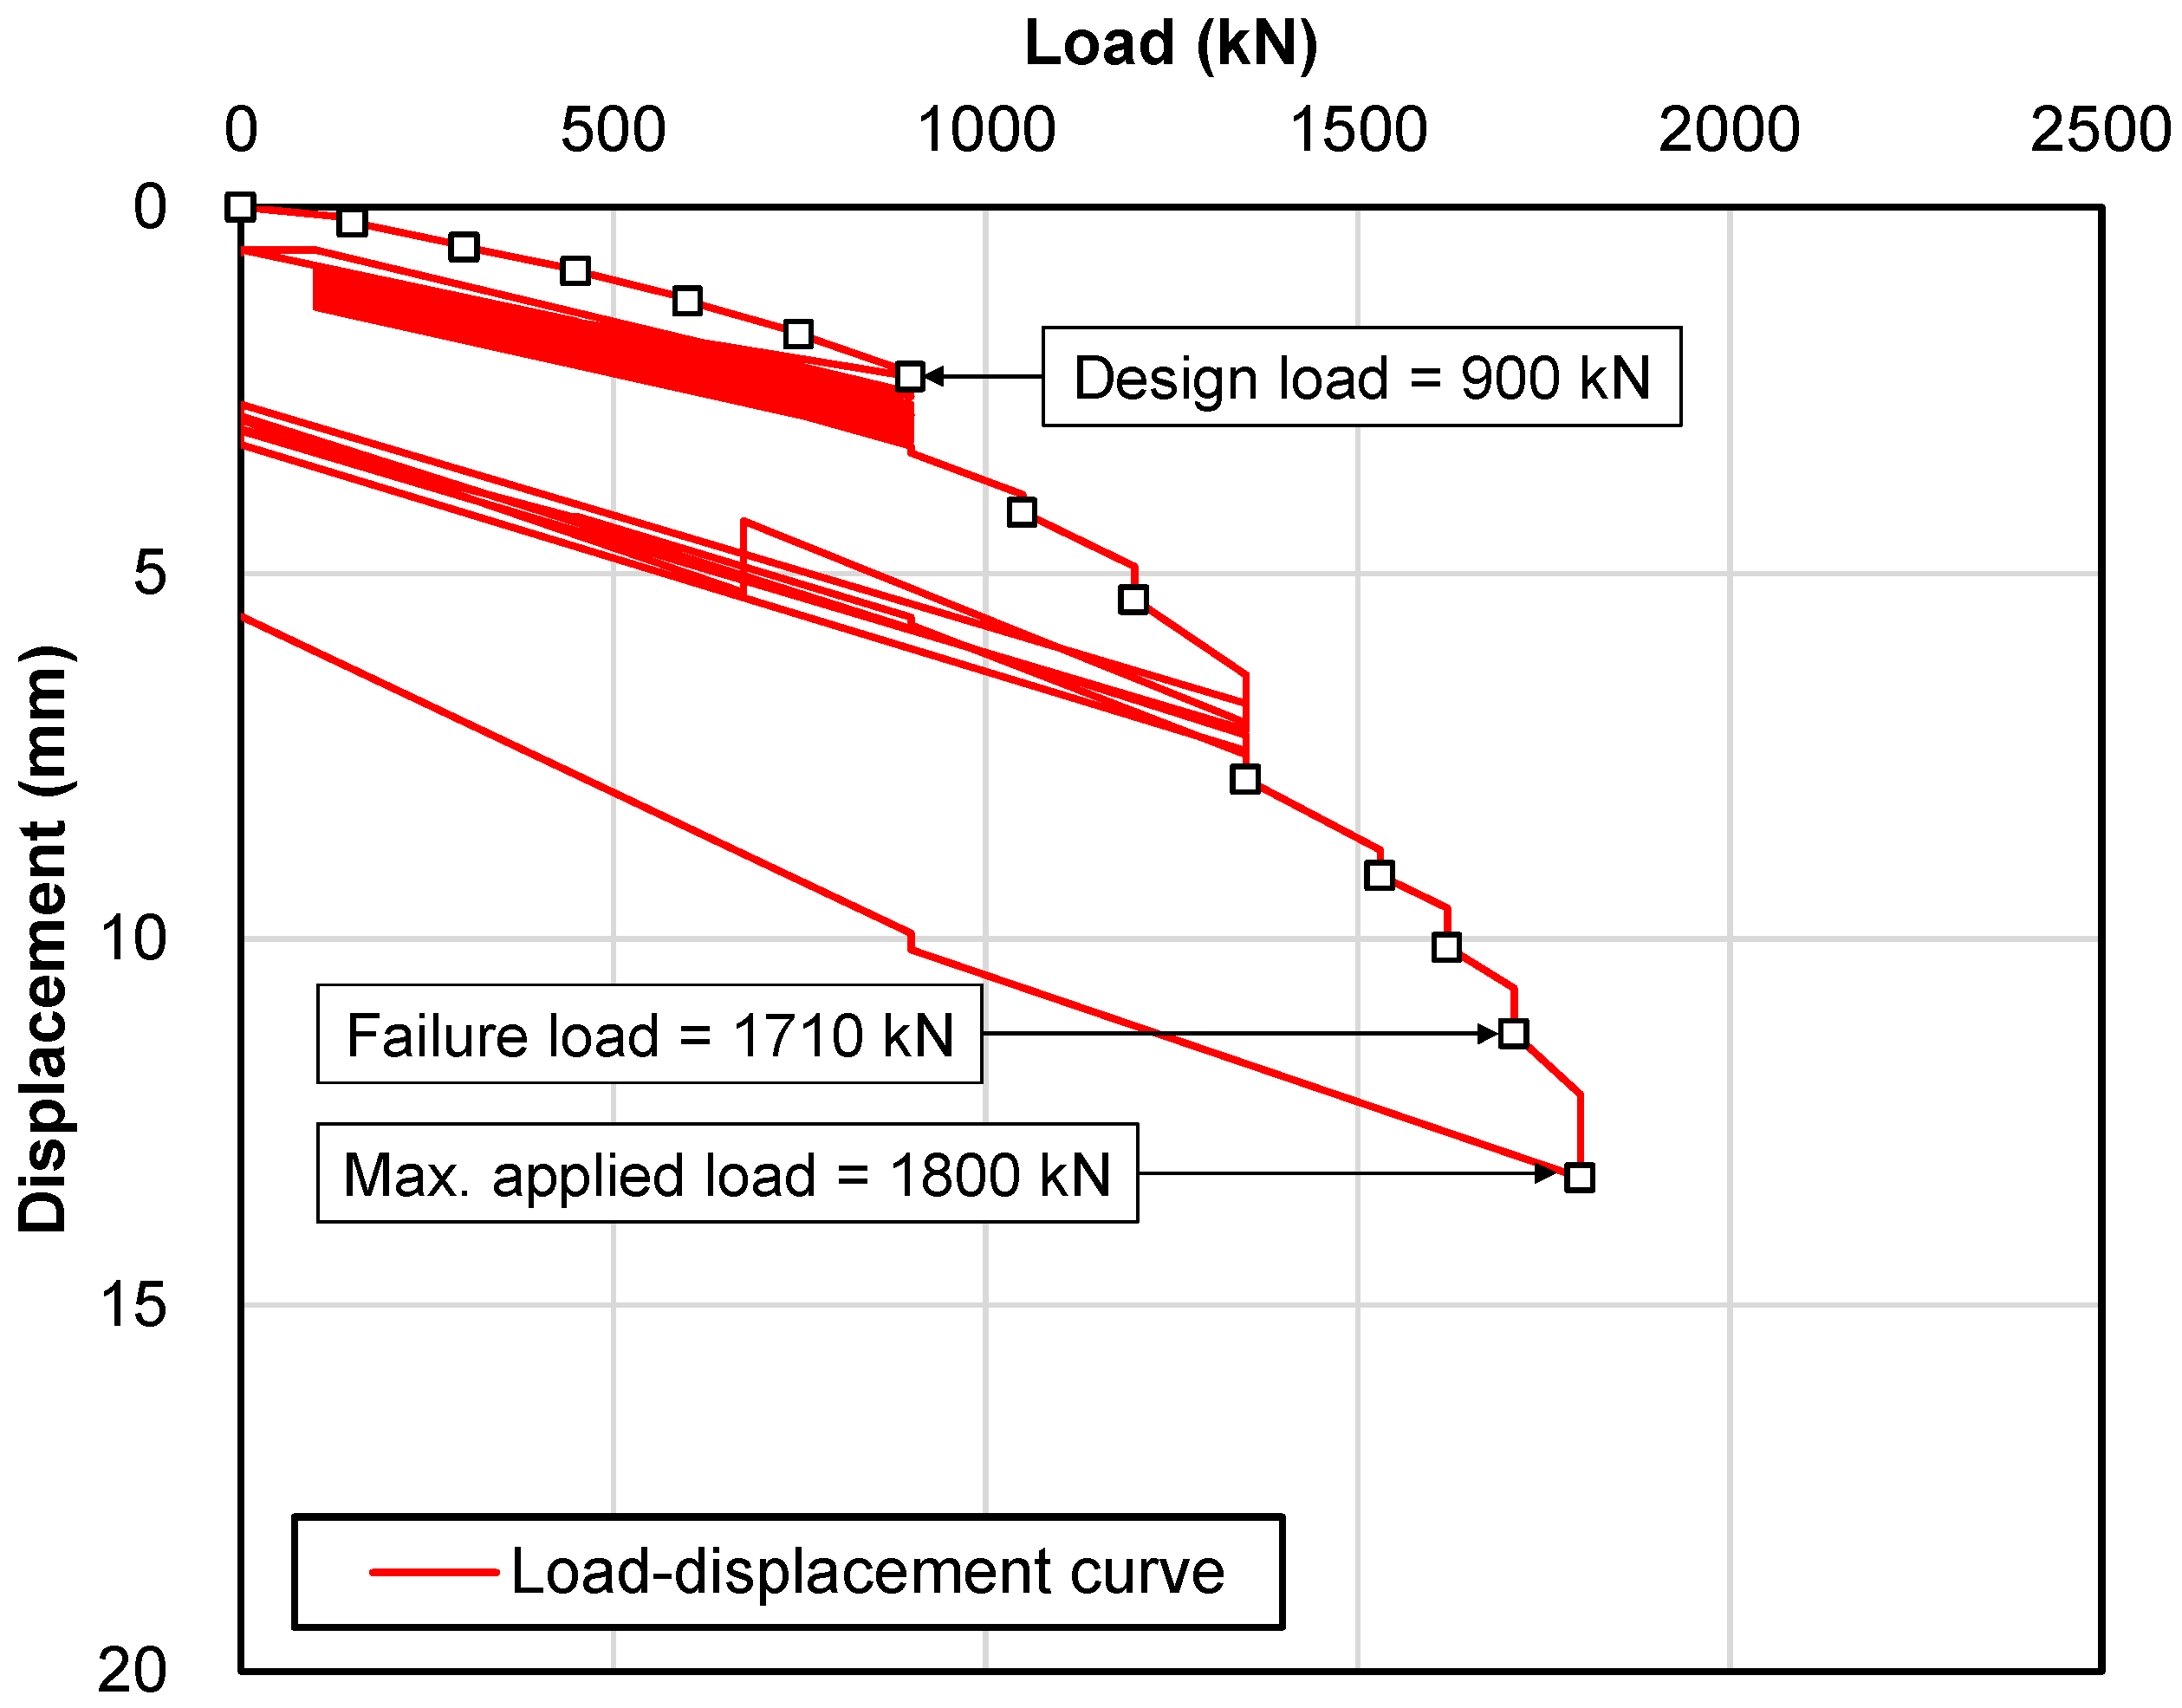
4.1.1. Load–Displacement Curve

The lateral pile load test was conducted to assess the performance of the test pile under lateral loading conditions, focusing on both its load-bearing capacity and displacement behavior. The process involved incrementally increasing the applied load and recording the resulting pile head displacements using LVDTs.
Figure 8a presents the applied load on the test pile over time during the lateral load test. The loading process began with gradual increments of 150 kN, eventually reaching the design load of 900 kN. Following this, cyclic loading was performed to evaluate the pile’s durability under repeated stress. After the cyclic tests, the load was further increased to explore the ultimate load capacity, culminating in a final applied load of 1800 kN. The figure below captures the progression of loading, including the critical reset of the hydraulic jack, which allowed for further load increments and provided insights into the pile’s response under varying conditions.
In addition, Figure 8b shows the corresponding displacements of the pile head measured at three locations, with the average displacement represented by the solid red line. The displacement data are crucial for understanding the pile’s stiffness and behavior under lateral loads. At the design load of 900 kN, the displacement was 2.32 mm, which increased to 3.13 mm after the cyclic loading. The displacement reached 11.30 mm at 1710 kN, indicating the onset of pile failure, and finally, it increased to 13.3 mm at the maximum load of 1800 kN. This progression highlights the pile’s deformation characteristics and the potential for yielding under high loads.
Figure 9 provides a detailed load–displacement curve, summarizing the relationship between the applied load and the pile head displacement. The curve illustrates the pile’s behavior throughout the loading process, clearly marking key points such as the design load (900 kN), failure load (1710 kN), and the maximum applied load (1800 kN). The curve’s shape indicates how the pile’s stiffness changes under increasing loads, with the initial linear portion representing elastic behavior, followed by nonlinear deformation as the load approaches the pile’s capacity. The point at 1710 kN corresponds to a significant increase in displacement, representing signaling failure, after which the displacement continues to increase even with smaller load increments. This figure is essential for understanding the pile’s performance limits and provides a comprehensive view of its load-bearing characteristics under lateral forces.

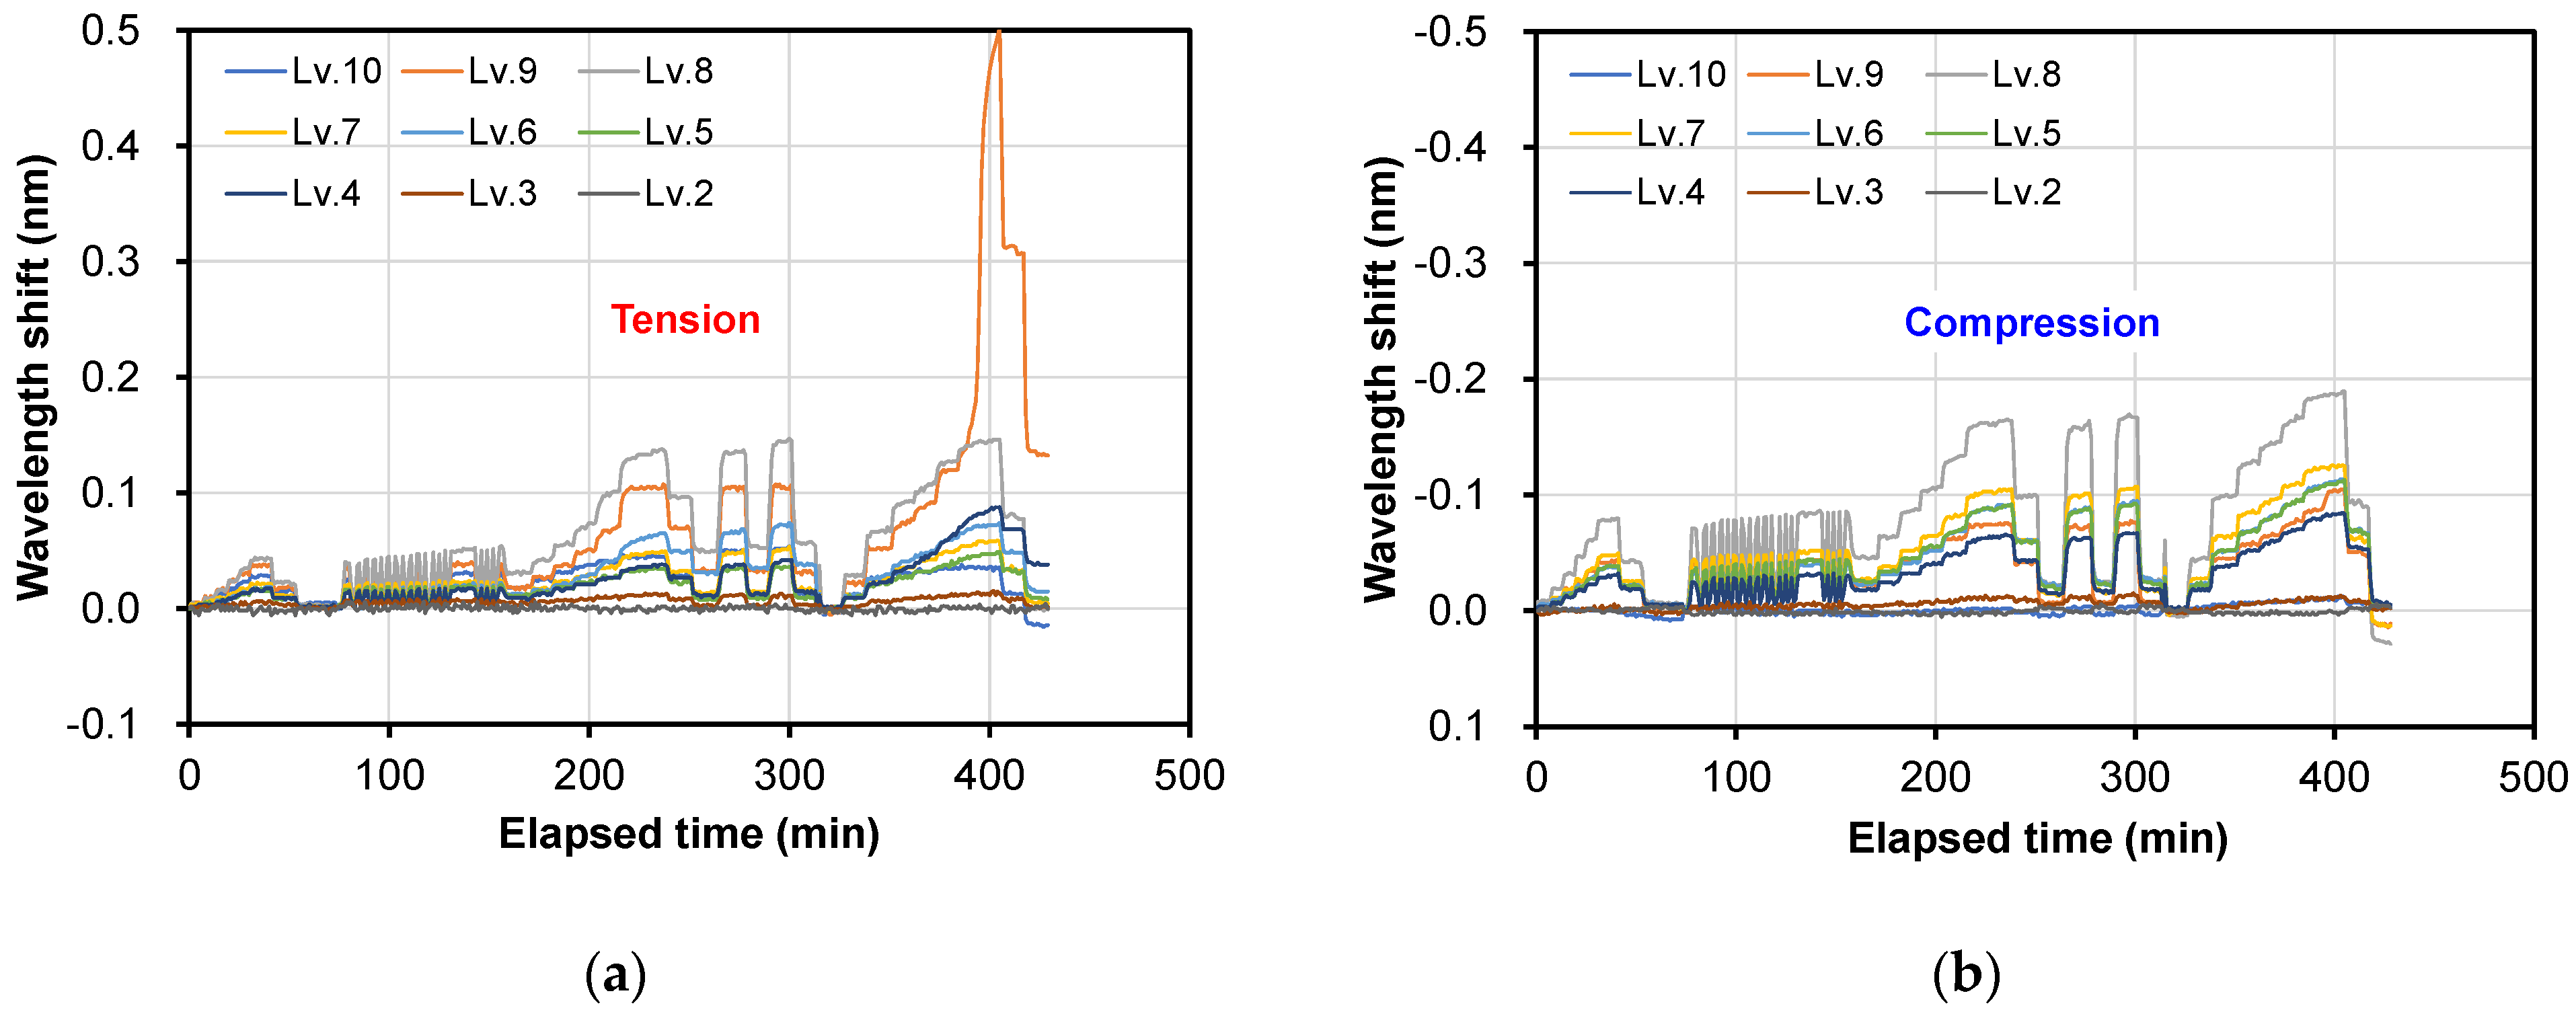
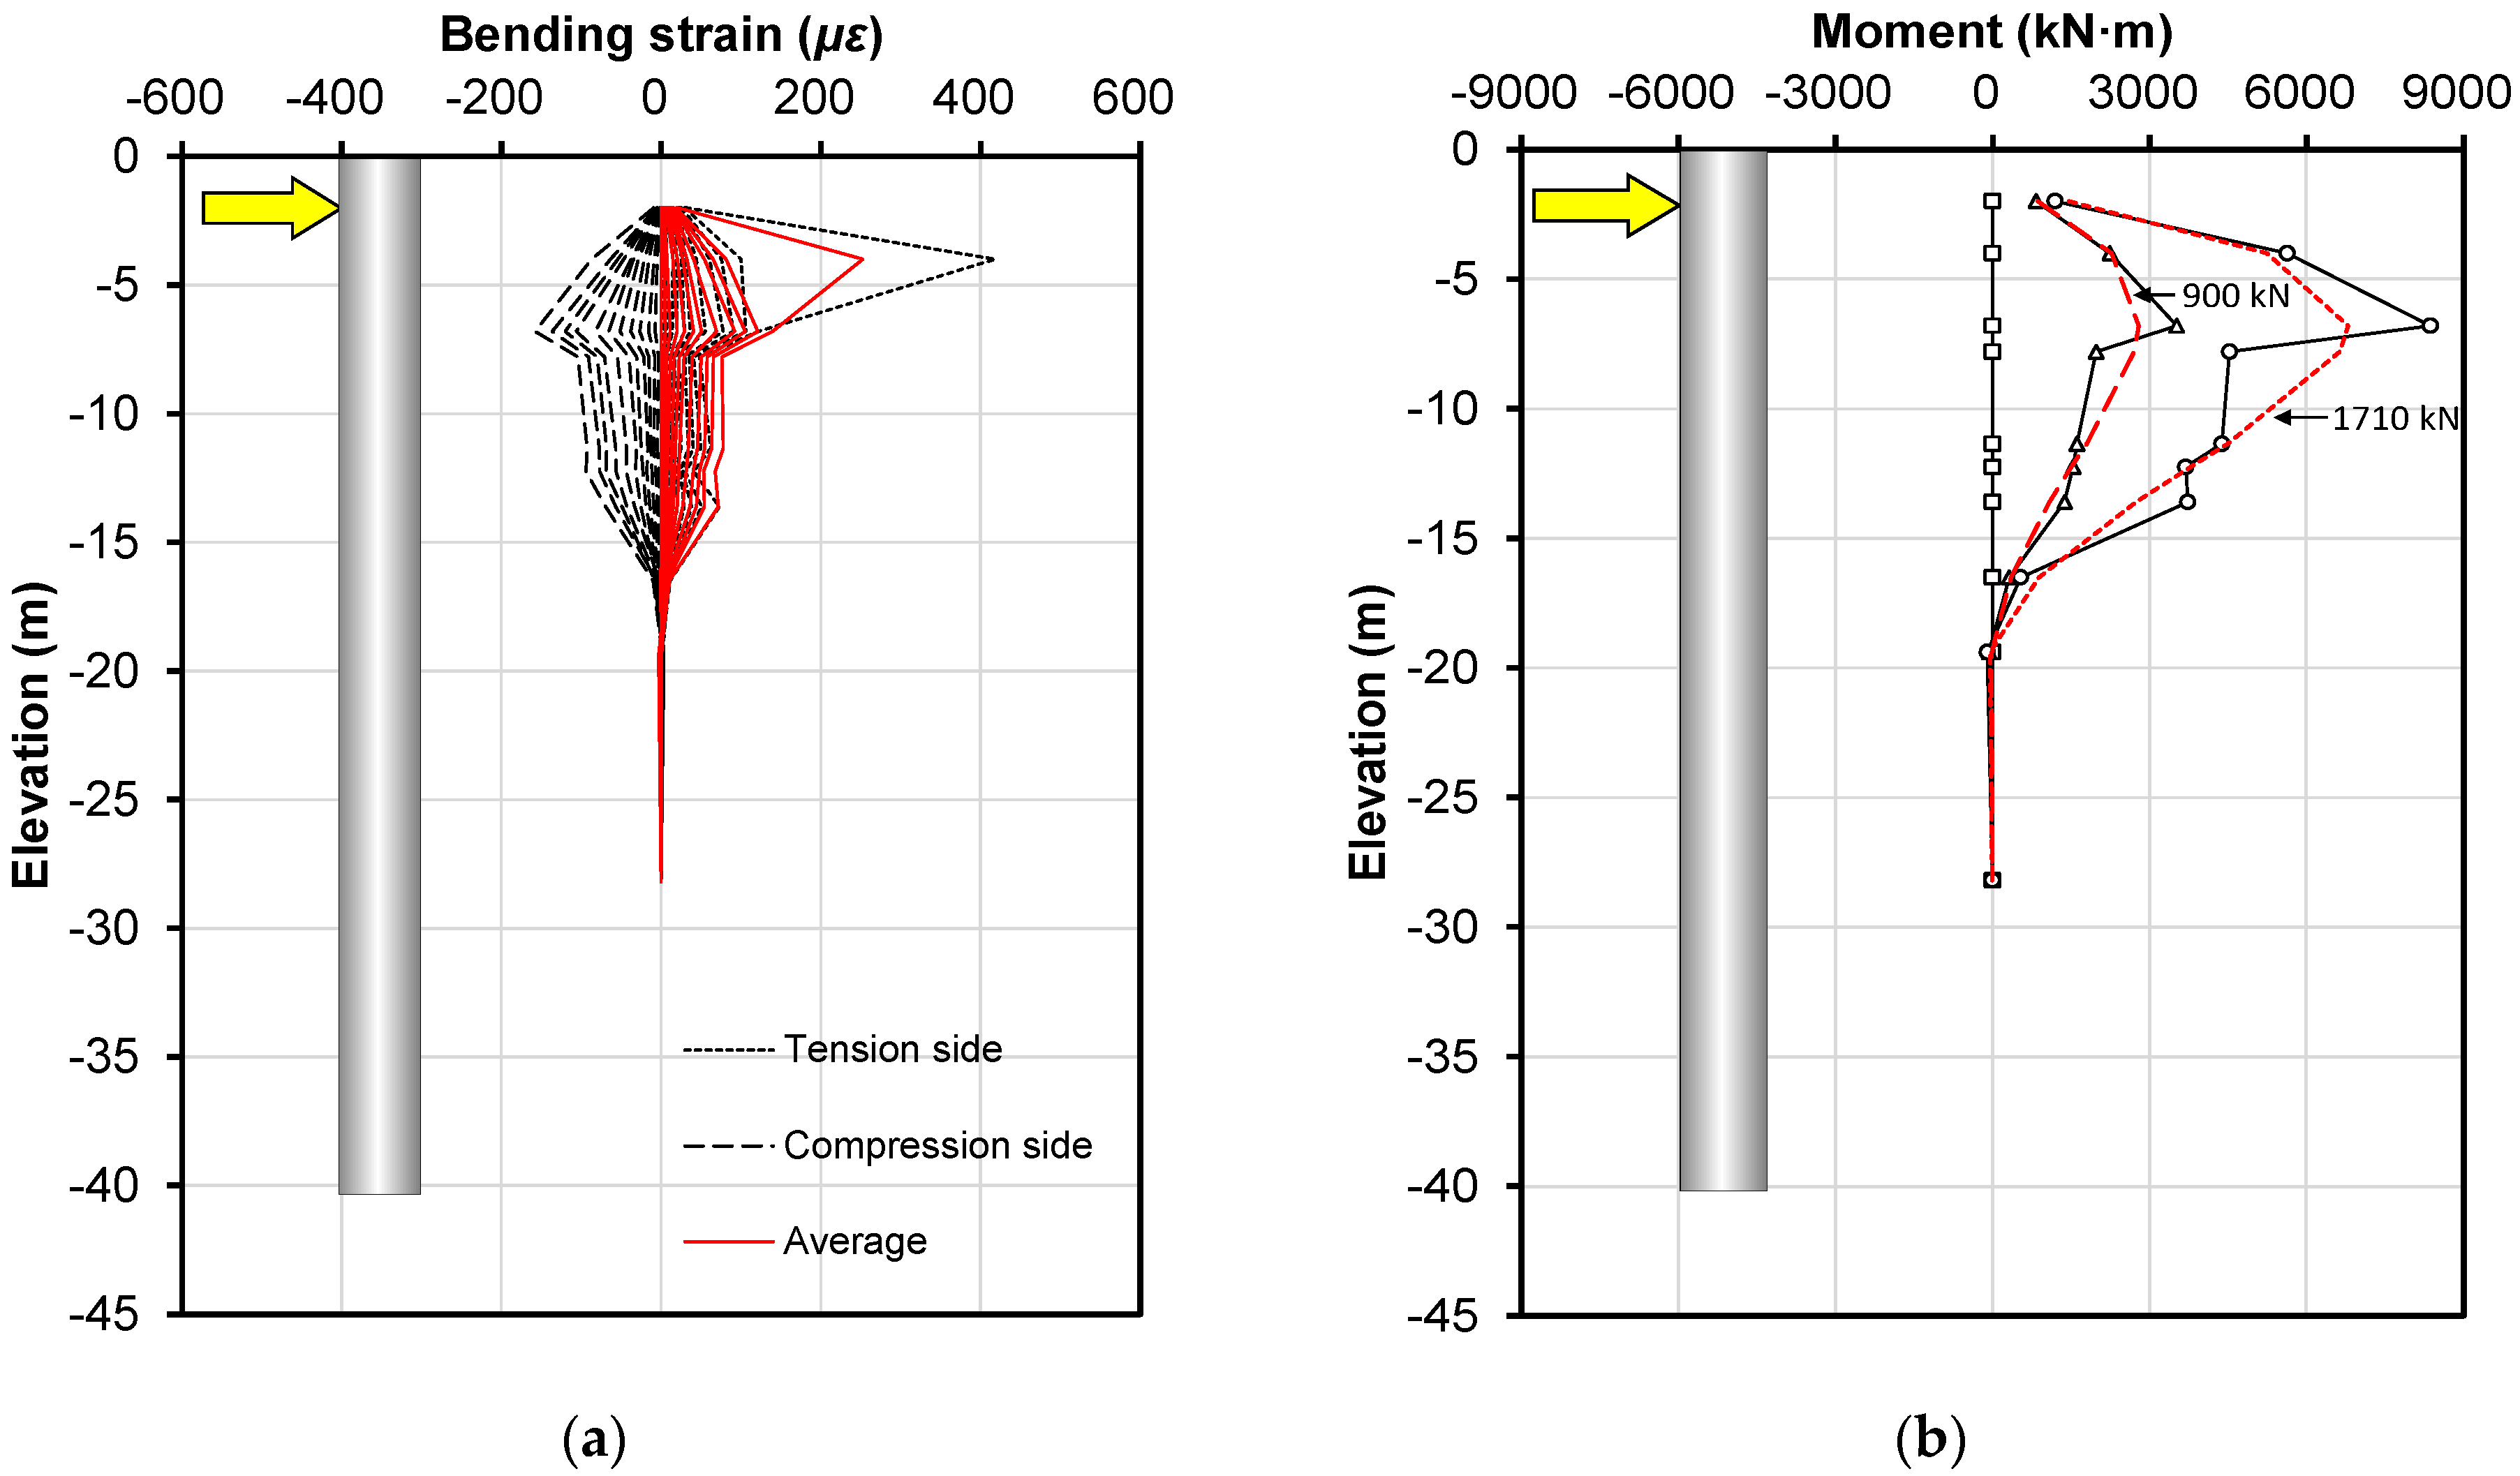
4.1.2. Bending Strain Measurement

The test also incorporated FBG strain sensors to measure axial strain on the test pile subjected to lateral loading. Since the FBG sensor installed at level 1 had a weak signal for evaluating axial strain on the test pile, measurements from levels 2 to 10 are presented in the following figure. Each level corresponds to a specific depth along the pile where the sensors were placed (see Figure 5), capturing the strain distribution as the pile was subjected to lateral forces.
Figure 10 displays the wavelength shift by depth measured by the FBG sensor as the pile head was incrementally loaded up to 1800 kN. This wavelength shift is referred to as ‘bending strain’, as it reflects the axial strain induced by the pile’s bending under lateral loading. The bending strain was evaluated using these wavelength measurements, and Figure 11a presents the bending strain caused by the horizontal movement of the test pile at varying depths. The figure clearly depicts the tensile and compression sides, with the solid red line representing the average values across these axes.
Theoretically, the strain on the compression side and tensile sides should be equal. However, due to the inherent differences in the compression and tensile elastic modulus of reinforced concrete, the neutral axis, where zero strain occurs, can shift. This shift leads to variations in the actual strain measurements. As depicted in Figure 11a, at loads up to 1710 kN, the strain on the compression side was slightly larger than that on the tensile side, although the absolute values followed nearly identical patterns. When the load increased to 1800 kN, the strain on the tensile side sharply escalated to more than twice that on the compression side. This increase indicates that the maximum strain point shifted 2 to 3 m upward, likely contributing to the pile’s failure as the load exceeded 1710 kN. The strain exceeded 300 με on the tensile side, which is approximately one-tenth of the fracture strain of concrete. This significant increase in strain suggests that the maximum moment in the pile occurred at 1710 kN, with the estimated moment at this point being 8364.9 kN·m.
For the design load of 900 kN and the maximum load of 1710 kN, the moment generated within the pile was calculated based on the wavelength variations depicted in Figure 10a,b. These moments are presented as functions of depth in Figure 11b. The maximum moment was observed at level 8, corresponding to an elevation of −6.8 m, where an FBG sensor was installed. The maximum moment values were determined to be 3520.2 kN·m at a loading of 900 kN and 8364.9 kN·m at a loading of 1710 kN. Additionally, through linear regression analysis of the evaluated moments based on the measured bending strains, the moments at the 900 kN and 1710 kN loads were estimated to be 2792.3 kN·m and 6790.4 kN·m, respectively. These moment values are critical for validating the inverse analysis discussed in the next section.

4.2. Inverse Analysis for Characterizing Various Types of Pile Behavior

Using the results of the moment estimation based on the measurement of bending strain, the results of an inverse analysis of the horizontal load were compared. For the inverse analysis, LPILE (Ensoft Inc., version 5.0, Austin, USA), which is a commercially available software, was used to assess the horizontal response of a single pile. The software is designed specifically for investigating single or group piles subjected to lateral loading using the p-y method. It resolves the differential equation for a beam–column by utilizing nonlinear lateral load–transfer p-y curves. Widely accepted and utilized by engineers globally, the popularity of this program stems from its user-friendly interface, minimal input requirements, effective handling of pile and soil nonlinearity, and its ability to predict pile strain actions along the pile length, enabling precise foundation design based on maximum bending moment, shear force, deflection, and slope. The inverse analysis was performed according to the physical properties and conditions. Actual values were applied to the pile properties, while the ground properties were based on ground survey results and the distribution of the pile’s bending moment. Table 2 summarizes the detailed input variables for the pile specification, soil properties, and loading conditions.
Figure 12 shows the comprehensive responses of a single pile under lateral loading through LPILE, focusing on shear force, bending moment, slope, and lateral deflection at two critical load levels: the design load of 900 kN and the ultimate load of 1710 kN. These figures provide a detailed insight into the pile’s behavior at different stages of loading, enabling a deeper understanding of the pile’s structural performance.
Figure 12a displays the shear force distribution along the depth of the pile for both the design and ultimate loads. The red curve represents the shear force at 900 kN, while the green curve corresponds to 1710 kN. At both load levels, the shear force gradually increases from the top of the pile down to a critical depth, where it peak before decreasing as the depth increases further. Particularly, the maximum shear force shifts slightly deeper with the higher load, indicating a change in the load distribution as the pile approaches its ultimate capacity. The bending moment distribution along the pile’s depth is shown in Figure 12b, highlighting the points where the maximum moments occur at both the design and ultimate loads. The bending moment curves (red for 900 kN and green for 1710 kN) exhibit a similar pattern, with the maximum moment occurring around a depth of −6.1 to −6.3 m for both load levels. The moment at the design load (3673.4 kN·m) is close to the experimental value (3520.2 kN·m), while at the ultimate load, the calculated moment (6839.6 kN·m) aligns closely with the linear regression of the experimental results, reinforcing the accuracy of the numerical analysis. In addition, the slope or rotation of the pile is depicted in Figure 12c, showing how the pile’s angle changes with depth under lateral loading. The rotation curves indicate that the pile experiences the most significant rotation near the ground surface, which diminishes with increasing depth. The difference in rotation between the design and ultimate loads is most pronounced near the surface, reflecting the pile’s increased deformation as the load approaches failure. Figure 12d provides a comparison between the lateral deflections obtained from the inverse analysis and those measured during the full-scale lateral pile load test (LPLT). At the design load of 900 kN, the deflections from the inverse analysis (2.64 mm) closely match the experimental results (2.32 mm), indicating strong agreement. However, at the ultimate load of 1710 kN, the deflection from the inverse analysis (5.32 mm) is significantly lower than the measured deflection (11.30 mm). This discrepancy could be attributed to additional factors such as the cyclic load test, which may have caused cumulative damage to the pile’s cross-section, particularly in the PVC pipe used for the integrity test (crosshole sonic test). The increased deflection at higher loads suggests that the pile’s stiffness decreases as it approaches failure, leading to deformations larger than those predicted by the numerical model.
Table 3 summarizes the maximum moments and deflections at the design and ultimate loads, comparing the results from the inverse analysis with the actual measurements. The close agreement between the numerical and experimental results at the design load underscores the reliability of the analysis method. However, the larger discrepancies at the ultimate load highlight the need to consider additional factors in the numerical model, such as material degradation and cyclic loading effects, shear force, bending moment, slope, and the deflection of a single pile under lateral loading, to improve accuracy. As described above, the results of various responses are provided for the design load of 900 kN and the ultimate load of 1710 kN. In addition, the results of the maximum moment and displacement obtained from the inverse analysis and measurements of the full-scale lateral pile load test are summarized in Table 3. Furthermore, for the inverse analysis using LPILE and verification against the measured values, the percentage error for the maximum moment and the difference for the lateral deformation were evaluated. The analysis at the design load of 900 kN showed high accuracy, with a percentage error of 4.35% and a small difference in lateral deformation of 0.32 mm. However, at 1710 kN, the analysis exhibited a larger percentage error of 18.2%, indicating that the analysis did not fully account for the unexpected conditions and actual behavior observed during the test.

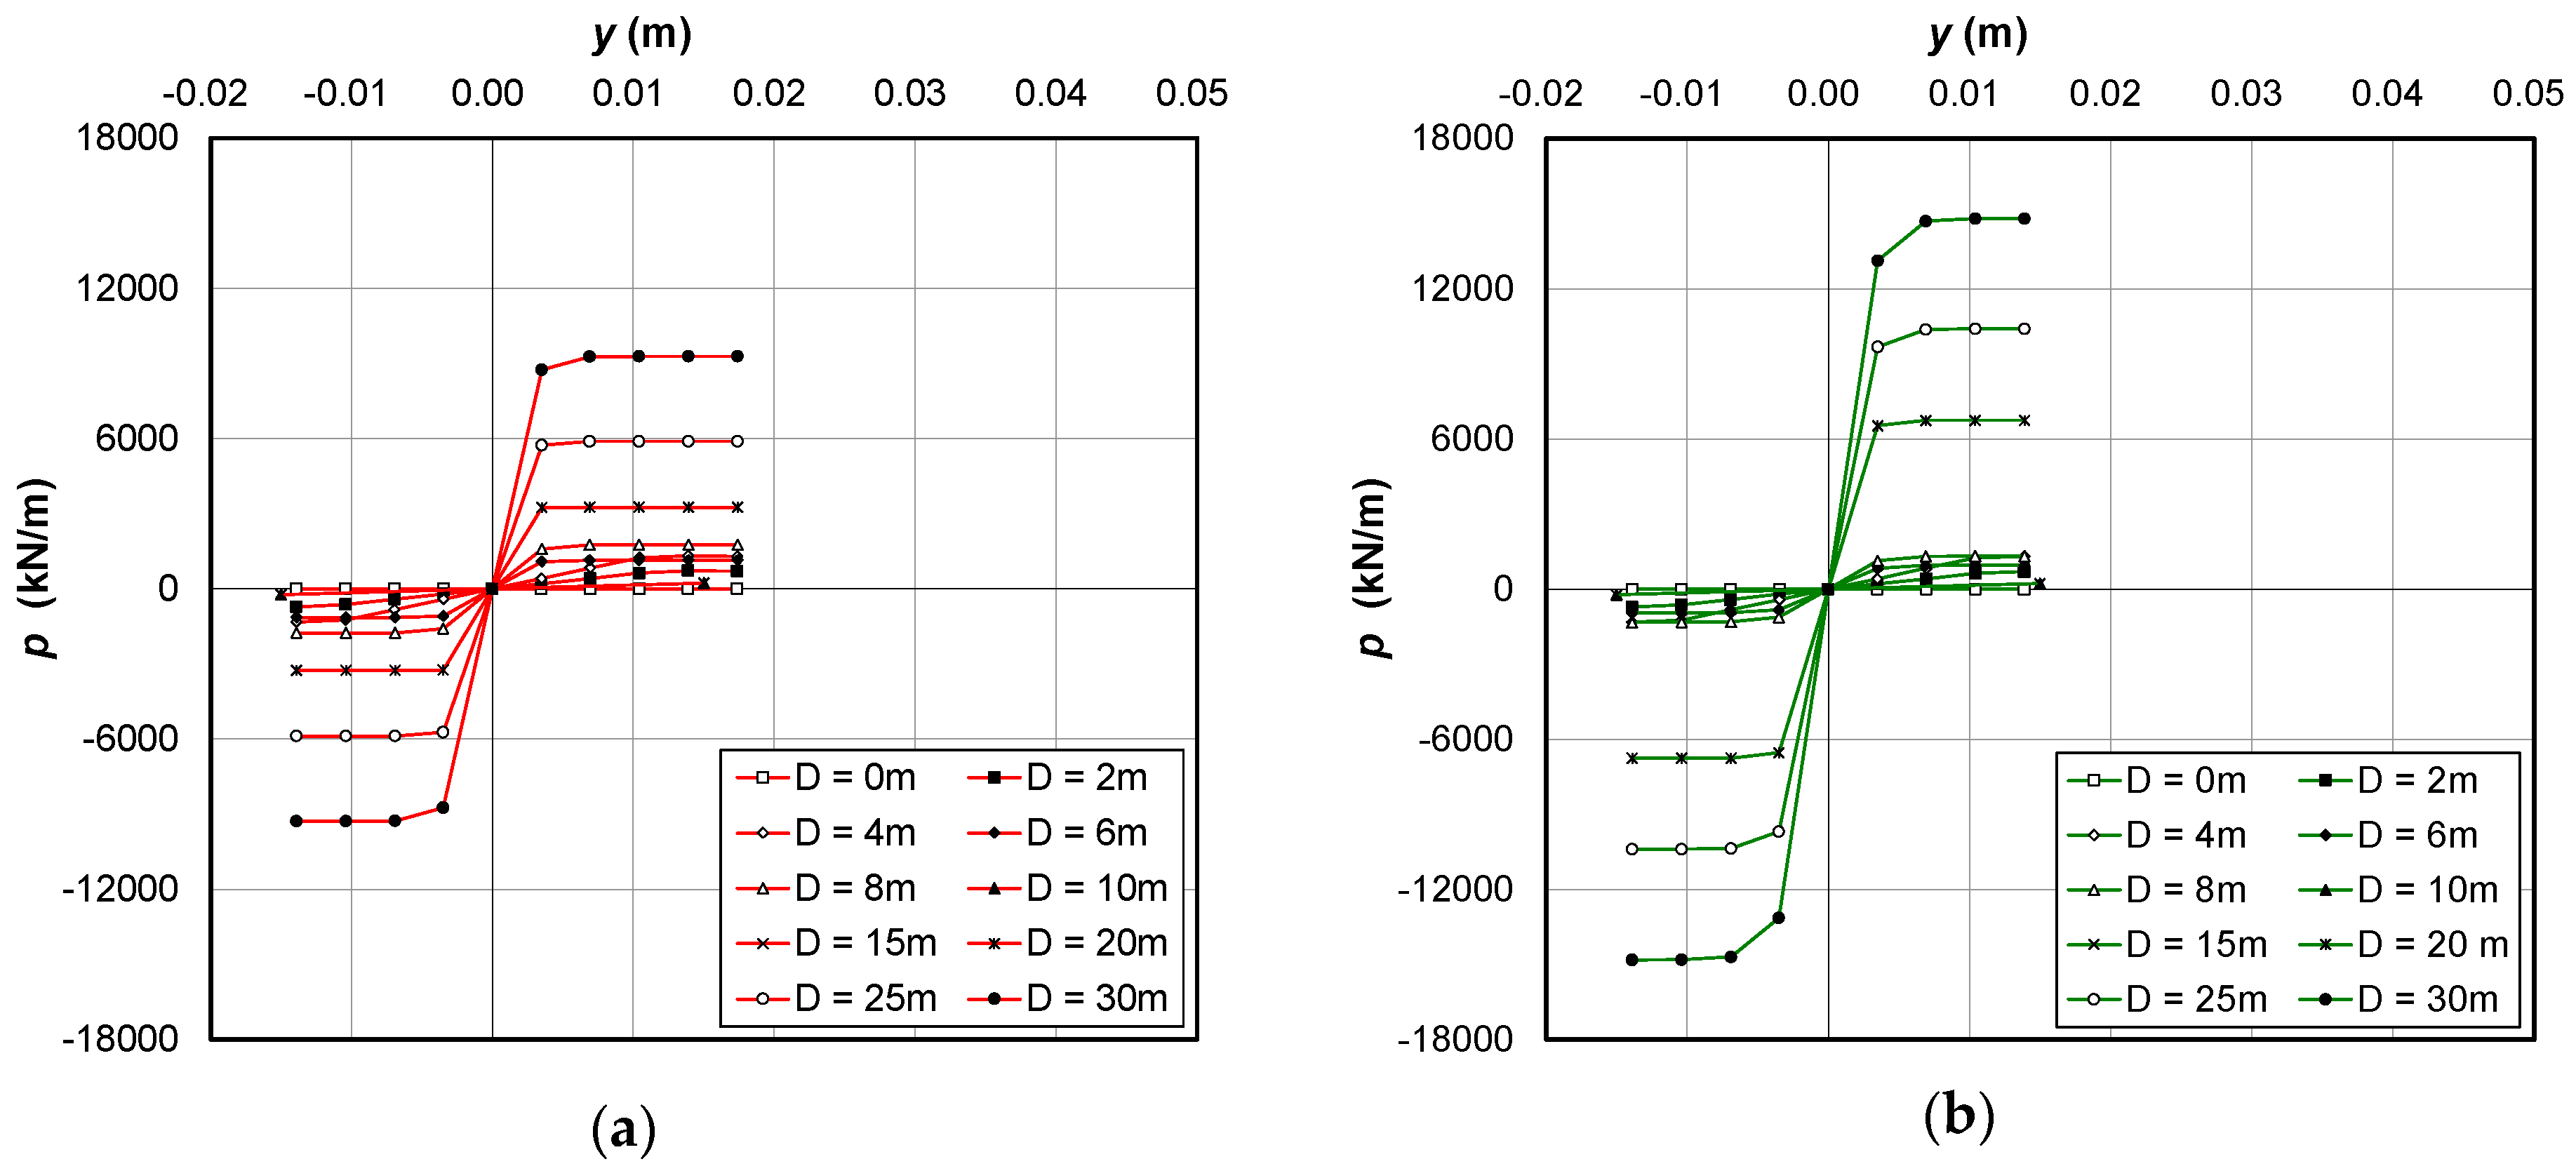
4.3. Estimation of p-y Curves

The p-y curve is a crucial method for designing and analyzing pile foundations under lateral loads across civil, structural, and geotechnical engineering fields. It assists engineers in predicting and ensuring the performance and stability of piles under various loading conditions. Full-scale load tests are essential for obtaining accurate, reliable p-y curves because they provide a realistic assessment of soil behavior, validate theoretical models, capture site-specific conditions, and ensure the safety and performance of pile foundations under lateral loads. In this study, the derivation of the p-y curve involved a systematic approach using LPILE analysis. The physical properties of the ground at the site and the characteristics of the drilled shaft were accurately input into the LPILE model. The resulting analysis was then verified against the bending moment data obtained from the lateral pile load test, as well as the lateral deformation measured at the pile head. Once the LPILE results were verified, depth-dependent p-y curves were successfully derived, and they are presented in Figure 13. These curves provide valuable insights into the soil–pile interaction, enabling a more precise incorporation of soil stiffness (i.e., the coefficient of horizontal subgrade reaction, kh) into pile design and analysis.

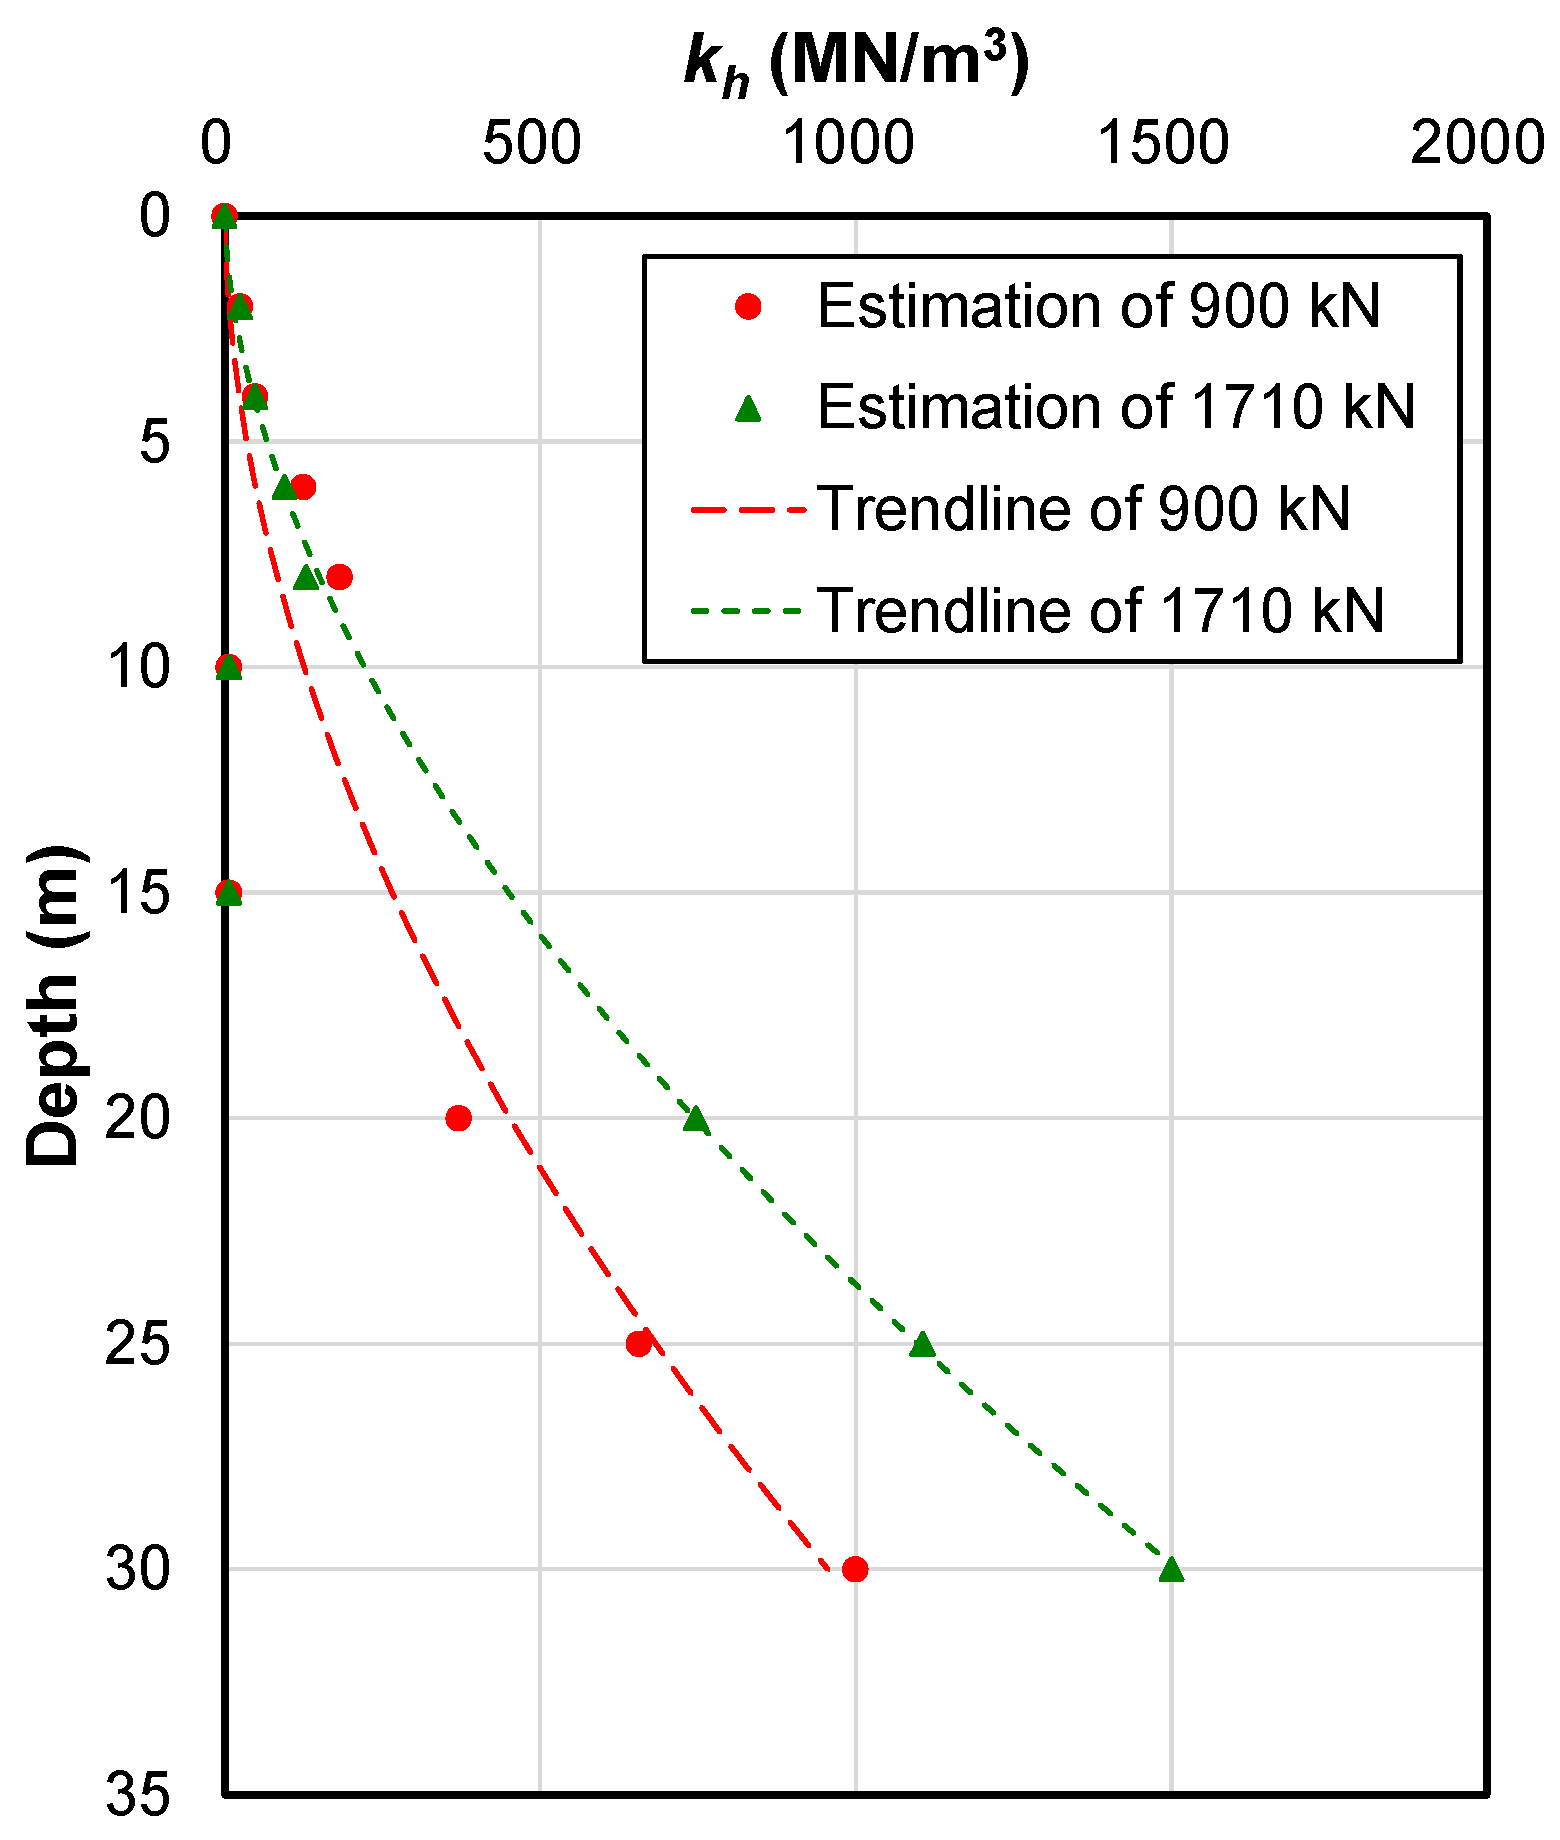
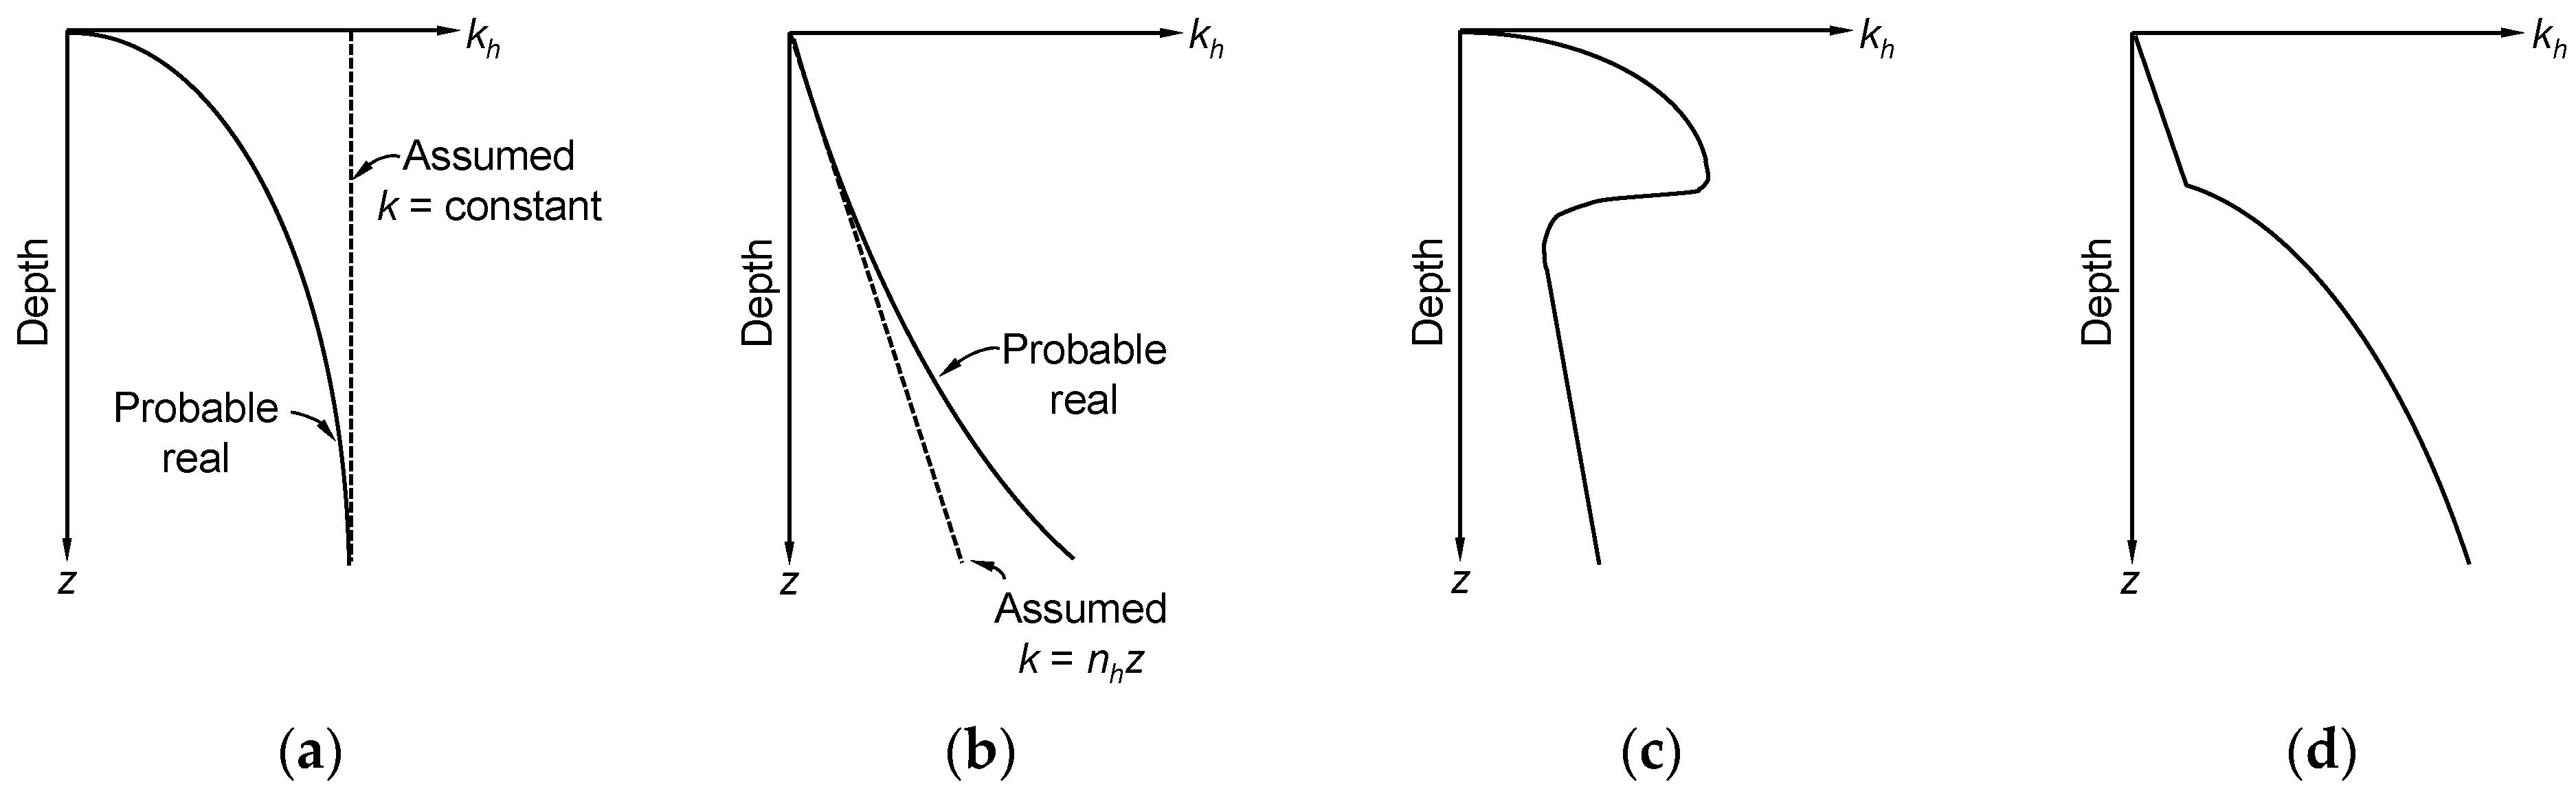
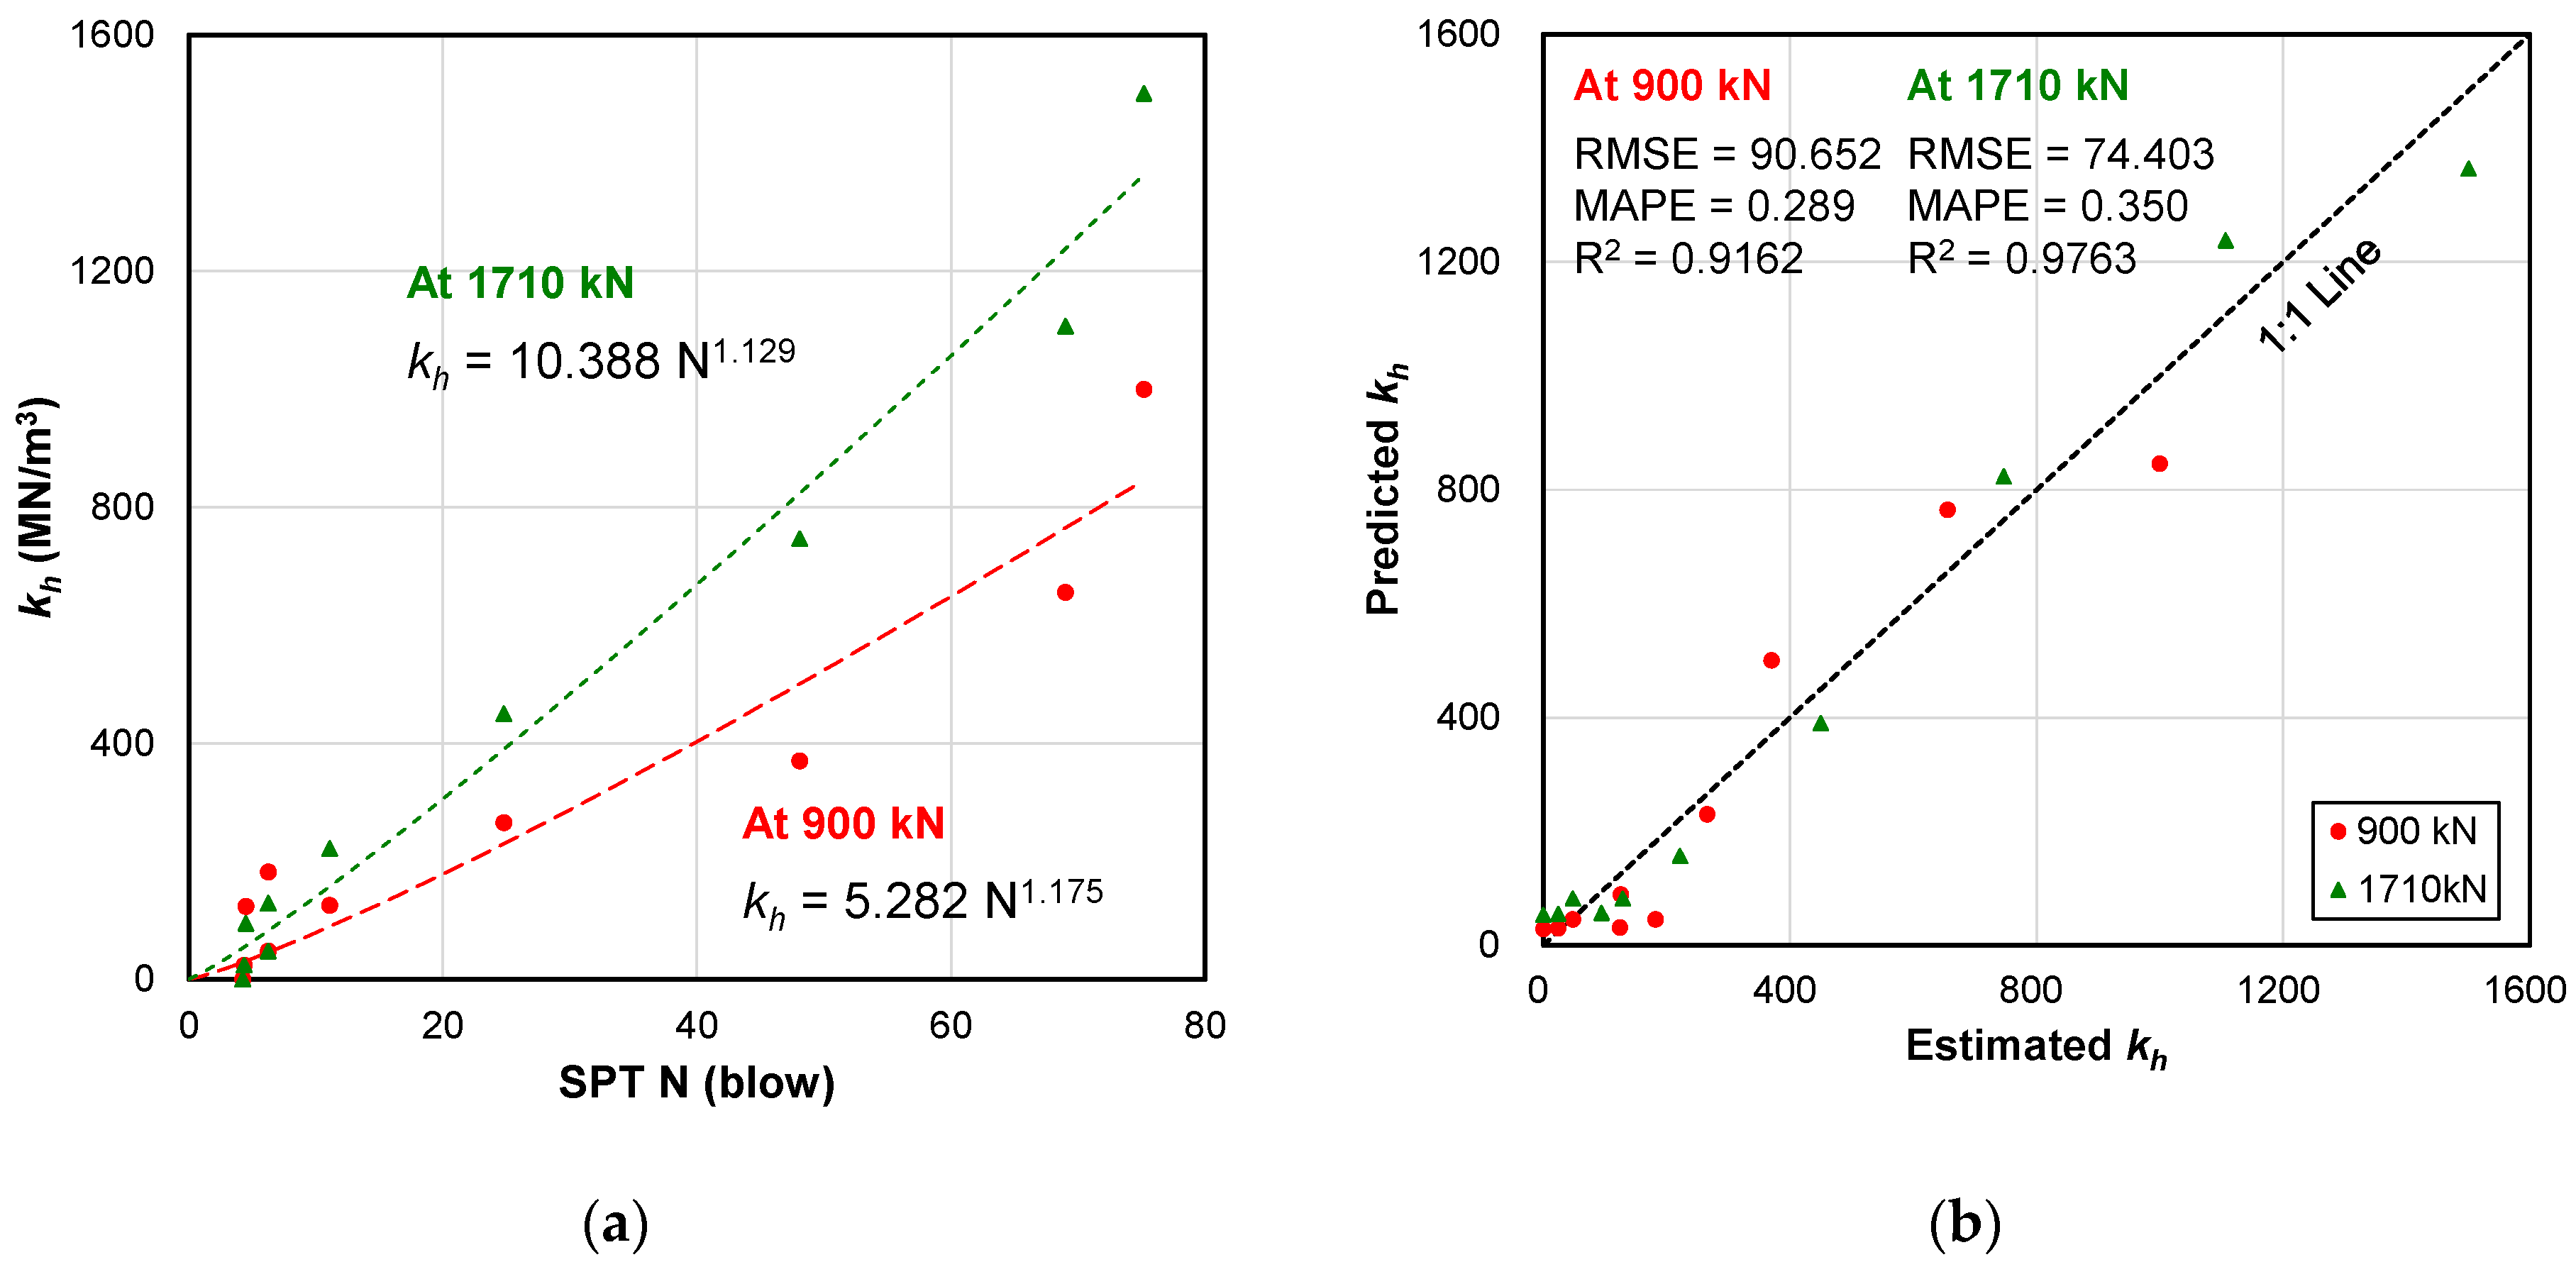
4.4. Coefficient of Horizontal Subgrade Reaction (kh)

Based on the depth-dependent p-y curves, the coefficient of horizontal subgrade reaction was evaluated as a function of depth. Figure 14 presents the estimated coefficients of horizontal subgrade reaction (kh) at different depths for two load conditions: 900 kN and 1710 kN.
The red circles represent kh estimations at the design load of 900 kN, and the green triangles represent kh estimations at the ultimate load of 1710 kN. Due to difficulties in achieving sufficient displacement at approximately 10 m depth, where the neutral axis of the pile for lateral behavior forms, trendlines were included for both sets of estimations: a red dashed line for the 900 kN load, and a green dashed line for the 1710 kN load. These trendlines indicate that kh values generally decrease with depth, and the values at the higher load of 1710 kN are consistently lower than those at the 900 kN load. This indicates increased soil deformation or reduced stiffness under higher loading conditions. As depicted in Figure 15, the trendline of the coefficient of horizontal subgrade reaction evaluated by depth is associated with the coefficient of horizontal subgrade reaction for normally loaded silt and clay [52], suggesting that the reclaimed ground was under normally loaded conditions.
For CL, kh values range from approximately 2000 to 25,000 kN/m3, depending on soil stiffness and depth. For ML, kh values range from approximately 1000 to 15,000 kN/m3. A coefficient of horizontal subgrade reaction of 500 MN/m3, while high, is consistent with very stiff or dense soils or bedrock conditions. This high value suggests minimal soil deformation under load and is typical of concrete-treated or heavily compacted soils. The coefficient of horizontal subgrade reaction was evaluated extensively according to depth based on the results of the lateral pile load test of the drilled shaft. Typical lower values were measured at shallow depths, while larger values were observed as the depth increased. As mentioned by Mano et al. [53], these values can vary depending on the width or stiffness of the pile, with very large values indicating very stiff or dense soil. The coefficient of subgrade reaction measures how the soil resists deflection under load, with higher values indicating stiffer soils.
To facilitate the convenient prediction of the coefficient of horizontal subgrade reaction, an empirical equation that utilizes the N value, derived from the Standard Penetration Test (SPT) conducted in the field, was proposed. Figure 16a presents the relationship between the kh value and the SPT-N value for both a load of 900 kN and a load of 1710 kN. The red circles and green triangles represent the empirical data points for the 900 kN and 1710 kN load conditions, respectively. Two trendlines, a red dashed line for 900 kN and a green dashed line for 1710 kN, are included to show the fitted empirical formulas for the kh prediction. These empirical equations indicate a power–law relationship between the SPT N values and the kh value for each load condition.
To estimate the performance of the empirical formulas, the performance of the equation was assessed by using the root-mean-square error (RMSE), mean absolute percentage error (MAPE), and correlation coefficient (R2). Figure 16b presents a performance evaluation plot comparing the predicted kh values to the estimated kh values. A 1:1 line (dashed) is included to indicate perfect agreement between predicted and estimated values. For the 900 kN loading condition, the results of RMSE, MAPE, and R2 were 90.652, 0.289, and 0.9162, respectively. For the 1710 kN load, the results of RMSE, MAPE, and R2 were 74.403, 0.350, and 0.9763, respectively, demonstrating even higher predictive accuracy with a lower RMSE and a higher R-squared value, despite a slightly higher MAPE. By correlating the N value with the kh coefficient, we can develop a practical and reliable method for estimating the coefficient based on easily obtainable field data. This empirical equation enables engineers to quickly assess the ground properties without the necessity for extensive in situ experiments, streamlining the design and analysis process for various geotechnical applications.

5. Conclusions

This study investigated the behavior of laterally loaded drilled shafts in marine deposits through a full-scale lateral load test, analyzing various pile characteristics. Key conclusions that can be drawn from this research include the following:
  • Based on a comprehensive investigation into the horizontal behavior of a large-diameter drilled shaft in marine deposits in Songdo, South Korea, this study analyzed various pile characteristics essential for the construction and design of buildings and infrastructures intended for marine deposits. As a result of the full-scale lateral load test on the large-diameter drilled shaft with a diameter of 2.5 m and a length of about 40 m, the maximum moment generated at the design load of 900 kN was 3520.2 kN, with a corresponding lateral displacement of 2.32 mm. Additionally, pile failure was anticipated at an applied load of 1710 kN, with the corresponding lateral deflection being 11.30 mm.
  • Advanced instruments such as Fiber Bragg Grating (FBG) sensors have proven critical for accurately measuring displacement and strain along the shaft, essential for constructing precise load–displacement curves and understanding responses to lateral loads. It is expected that further studies involving real-time motion observations (e.g., earthquakes and floods) will benefit from the advantages of fiber optic sensors, enabling long-term measurements.
  • Inverse analysis techniques using LPILE software validated the experimental results, confirming the accuracy of load–displacement data and providing deeper insights into force and moment distributions within the shaft. The maximum moment value, the location of its occurrence, and the lateral displacement were verified through inverse analysis and a comparison of measured values. As a result, it was confirmed that the maximum moment value and its corresponding lateral displacement matched well, with the point of maximum moment occurring approximately at 10 m depth. However, while the result at the design load of 900 kN showed good agreement, there was a significant discrepancy at the failure load, suggesting that there are challenges in using LPILE to assess pile behavior under ultimate conditions.
  • This research contributes to developing depth-dependent p-y curves tailored to marine deposits, vital for predicting lateral soil–pile interaction and optimizing drilled shaft design under similar geological conditions.
  • Practical implications include using derived p-y curves and insights into soil stiffness variations (the coefficient of horizontal subgrade reaction, kh) to enhance the stability and performance of drilled shaft foundations in reclaimed offshore areas like Songdo, South Korea. An empirical equation was proposed, utilizing the SPT-N value for the prediction of the kh value. This empirical equation was evaluated using metrics such as RMSE, MAPE, and R2, demonstrating fairly high prediction accuracy.
In summary, understanding the lateral behavior of large-diameter drilled shafts in marine deposits is crucial for optimizing their design and ensuring structural stability in challenging geological conditions. This study stresses the importance of advanced instrumentation and analytical techniques in achieving accurate predictions and enhancing the reliability of deep foundation systems.

Author Contributions

Conceptualization, M.K. and Y.K.; methodology, M.K., Y.K. and J.K.; software, M.K. and J.K.; validation, M.K. and Y.K.; formal analysis, Y.K. and J.K.; investigation, M.K. and J.K.; resources, M.K. and J.K.; data curation, M.K. and J.K.; writing—original draft preparation, M.K. and Y.K.; writing—review and editing, M.K., Y.K. and J.K.; visualization, M.K. and J.K.; supervision, M.K.; project administration, M.K.; funding acquisition, J.K. All authors have read and agreed to the published version of the manuscript.

Funding

This research was supported by the Korea Electric Power Corporation (Grant number: R23XO07-04) and a National Research Foundation of Korea (NRF) grant funded by the Korea government (MSIT) (No. NRF-2022R1C1C1011477).

Data Availability Statement

Dataset available on request from the authors.

Conflicts of Interest

The authors declare no conflicts of interest.

References

  1. Reese, L.C. Design and construction of drilled shafts. J. Geotech. Eng.-ASCE 1978, 104, 95–116. [Google Scholar] [CrossRef]
  2. Kulhawy, F.H. Drilled shaft foundations. In Foundation Engineering Handbook; Springer: Boston, MA, USA, 1991. [Google Scholar]
  3. O’Neill, M.W.; Reese, L.C.; Barnes, R.; Wang, S.T.; Morvant, M.; Ochoa, M. Effects of stratigraphic and construction details on the load transfer behavior of drilled shafts. Transp. Res. Record. 1992, 1336, 50–56. [Google Scholar]
  4. Sanping, Z.; Robert, L. Stability analysis of drilled shafts reinforced slope. Soils Found. 2002, 42, 93–102. [Google Scholar] [CrossRef]
  5. Wang, W.; Wu, J.; Li, Y. Super-long bored pile foundation for super high-rise buildings in China. In Proceedings of the 18th International Conference on Soil Mechanics and Geotechnical Engineering-Challenges and Innovations in Geotechnics, Paris, France, 2–7 September 2013; pp. 2897–2900. [Google Scholar]
  6. Taghavi, A.; McVay, M.; Niraula, L.; Davidson, M.; Patil, A. Axial and lateral resistance coupling in the analysis of large-diameter drilled shafts. Eng. Struct. 2020, 206, 110160. [Google Scholar] [CrossRef]
  7. Turner, J.P. Constructability for drilled shafts. J. Constr. Eng. Manag. 1992, 118, 77–93. [Google Scholar] [CrossRef]
  8. Gupta, R.C. Load-settlement behavior of drilled shafts in multilayered deposits of soils and intermediate geomaterials. Geotech. Test. J. 2013, 36, 725–741. [Google Scholar] [CrossRef]
  9. Jeong, S.; Park, J.; Ko, J.; Kim, B. Analysis of soil resistance on drilled shafts using proposed cyclic p-y curves in weathered soil. Geomech. Eng. 2017, 12, 505–522. [Google Scholar] [CrossRef]
  10. Zertsalov, M.G.; Znamenskiy, V.V.; Khokhlov, I.N. Interaction of drilled shafts in rock under the action of lateral load. In Proceedings of the 11th International Scientific Conference on Advanced in Civil Engineering: Construction-The Formation of Living Environment, FORM 2018, Moscow, Russia, 25–27 April 2018; Volume 365, p. 042050. [Google Scholar]
  11. Salman, H.; Puppala, A.J.; Chittoori, B.C. Utilizing site investigation and load tests to predict drilled shaft design parameters and capacities for various geological formations. In Proceedings of the Geo-Congress, Geo-Congress 2023, Los Angeles, CA, USA, 26–29 March 2023; pp. 34–44. [Google Scholar]
  12. Hwang, M. Land reclamation from tidal flats in Korea: A historical perspective. In Land Use Changes in Comparative Perspective; CRC Press: Boca Raton, FL, USA, 2002; p. 209. [Google Scholar]
  13. Lee, C.H.; Lee, B.Y.; Chang, W.K.; Hong, S.; Song, S.J.; Park, J.; Kwon, B.O.; Khim, J.S. Environmental and ecological effects of Lake Shihwa reclamation project in South Korea: A review. Ocean Coast. Manag. 2014, 102, 545–558. [Google Scholar] [CrossRef]
  14. Lee, S.D.; Miller-Rushing, A.J. Degradation, urbanization, and restoration: A review of the challenges and future of conservation on the Korean Peninsula. Biol. Conserv. 2014, 176, 262–276. [Google Scholar] [CrossRef]
  15. Yang, C. Remapping Songdo: A Genealogy of a Smart City in South Korea. Ph.D. Dissertation, University of Illinois at Urbana-Champaign, Champaign, IL, USA, 2020. [Google Scholar]
  16. Chee, S.Y.; Othman, A.G.; Sim, Y.K.; Adam, A.N.M.; Firth, L.B. Land reclamation and artificial islands: Walking the tightrope between development and conservation. Glob. Ecol. Conserv. 2017, 12, 80–95. [Google Scholar] [CrossRef]
  17. Yurchenko, I.; Vanzha, V.; Bandurin, M.; Volosukhin, V.; Bandurina, I. Risk assessment of land reclamation investment projects. In Proceedings of the International Conference Communicative Strategies of Information Society, CSIS 2018, Saint-Petersburg, Russia, 26–27 October 2018; pp. 216–221. [Google Scholar]
  18. Ukhurebor, K.E.; Aigbe, U.O.; Onyancha, R.B.; Ndunagu, J.N.; Osibote, O.A.; Emegha, J.O.; Balogun, V.A.; Kusuma, H.S.; Darmokoesoemo, H. An overview of the emergence and challenges of land reclamation: Issues and prospect. Appl. Environ. Soil Sci. 2022, 2022, 5889823. [Google Scholar] [CrossRef]
  19. Rollins, K.M.; Peterson, K.T.; Weaver, T.J. Lateral load behavior of full-scale pile group in clay. J. Geotech. Geoenviron. Eng. 1998, 124, 468–478. [Google Scholar] [CrossRef]
  20. Brandenberg, S.J.; Boulanger, R.W.; Kutter, B.L.; Chang, D. Behavior of pile foundations in laterally spreading ground during centrifuge tests. J. Geotech. Geoenviron. Eng. 2005, 131, 1378–1391. [Google Scholar] [CrossRef]
  21. Heidari, M.; Jahanandish, M.; El Naggar, H.; Ghahramani, A. Nonlinear cyclic behavior of laterally loaded pile in cohesive soil. Can. Geotech. J. 2014, 51, 129–143. [Google Scholar] [CrossRef]
  22. Teramoto, S.; Niimura, T.; Akutsu, T.; Kimura, M. Evaluation of ultimate behavior of actual large-scale pile group foundation by in-situ lateral loading tests and numerical analysis. Soils Found. 2018, 58, 819–837. [Google Scholar] [CrossRef]
  23. Zhu, B.; Wu, X.; Wang, Y.; Zhou, Y. Centrifuge modelling for seismic response of single pile for wind turbine subjected to lateral load. Mar. Geores. Geotechnol. 2021, 39, 1320–1338. [Google Scholar] [CrossRef]
  24. Zheng, G.; Cheng, X.S.; Zhou, H.Z.; Zhang, T.Q.; Yu, X.X.; Diao, Y.; Wang, R.Z.; Yi, F.; Zhang, W.B.; Guo, W. Resilient evaluation and control in geotechnical and underground engineering. China Civ. Eng. J. 2022, 55, 1–38. [Google Scholar]
  25. Cui, J. Structural analysis of high-rise buildings under lateral loads. Highl. Sci. Eng. Technol. 2023, 75, 209–214. [Google Scholar] [CrossRef]
  26. Tandjiria, V.; Teh, C.I.; Low, B.K. Reliability analysis of laterally loaded piles using response surface methods. Struct. Saf. 2000, 22, 335–355. [Google Scholar] [CrossRef]
  27. Chan, C.L.; Low, B.K. Reliability analysis of laterally loaded piles involving nonlinear soil and pile behavior. J. Geotech. Geoenviron. Eng. 2009, 135, 431–443. [Google Scholar] [CrossRef]
  28. Haldar, S.; Sivakumar Babu, G.L. Design of laterally loaded piles in clays based on cone penetration test data: A reliability-based approach. Géotechnique 2009, 59, 593–607. [Google Scholar] [CrossRef]
  29. Gurbuz, A.; Paikowsky, S.G. The lateral response of single free headed piles in sandy soils—Methods, measurements, and reliability. In Proceedings of the International Foundation Congress and Equipment Expo, IFCEE 2009, Orlando, FL, USA, 15–19 March 2009; pp. 584–591. [Google Scholar]
  30. McClelland, B.; Focht, J. Soil modulus for laterally loaded piles. J. Soil Mech. Found. Div. 1956, 82, 1049–1063. [Google Scholar] [CrossRef]
  31. American Petroleum Institute (API). Recommended Practice and Planning, Designing and Construction Fixed Offshore Platforms; API Offshore Structure Standards-RP 2A; API: Washington, DC, USA, 1993. [Google Scholar]
  32. Sinnreich, J.; Ayithi, A. Derivation of p-y curves from lateral pile load test instrument data. Geotech. Test. J. 2014, 37, 1025–1036. [Google Scholar] [CrossRef]
  33. Goh, A.T.C.; Teh, C.I.; Wong, K.S. Analysis of piles subjected to embankment induced lateral soil movements. J. Geotech. Geoenviron. Eng. 1997, 123, 792–801. [Google Scholar] [CrossRef]
  34. Jones, K.; Sun, M.; Lin, C. Numerical analysis of group effects of a large pile group under lateral loading. Comput. Geotech. 2022, 144, 104660. [Google Scholar] [CrossRef]
  35. Rollins, K.M.; Gerber, T.M.; Lane, J.D.; Ashford, S.A. Lateral resistance of a full-scale pile group in liquefied sand. J. Geotech. Geoenviron. Eng. 2005, 131, 115–125. [Google Scholar] [CrossRef]
  36. Khodair, Y.; Abdel-Mohti, A. Numerical analysis of pile–soil interaction under axial and lateral loads. Int. J. Concr. Struct. Mater. 2014, 8, 239–249. [Google Scholar] [CrossRef]
  37. Zhang, X.; Tang, L.; Li, X.; Ling, X.; Chan, A. Effect of the combined action of lateral load and axial load on the pile instability in liquefiable soils. Eng. Struct. 2020, 205, 110074. [Google Scholar] [CrossRef]
  38. Pinto, P.L.; Anderson, B.; Townsend, F.C. ASTM STP 1358; Comparison of Horizontal Load Transfer Curves for Laterally Loaded Piles from Strain Gages and Slope Inclinometer: A Case Study. American Society for Testing and Materials: Field Instrumentation for Soil and Rock. ASTM: West Conshohocken, PA, USA, 1999; pp. 3–15.
  39. Lin, S.S.; Liao, J.C. Lateral response evaluation of single piles using inclinometer data. J. Geotech. Geoenviron. 2006, 132, 1566–1573. [Google Scholar] [CrossRef]
  40. Chiou, J.S.; Chen, C.H.; Chen, Y.C. Deducing pile responses and soil reactions from inclinometer data of a lateral load test. Soils Found. 2008, 48, 609–620. [Google Scholar] [CrossRef]
  41. Byrne, B.W.; McAdam, R.A.; Burd, H.J.; Beuckelaers, W.J.; Gavin, K.G.; Houlsby, G.T.; Igoe, D.J.; Jardine, R.J.; Martin, C.M.; Muir Wood, A.; et al. Monotonic laterally loaded pile testing in a stiff glacial clay till at Cowden. Géotechnique 2020, 70, 970–985. [Google Scholar] [CrossRef]
  42. Fleming, K.; Weltman, A.; Randolph, M.; Elson, K. Piling Engineering; CRC Press: Boca Raton, FL, USA, 2008. [Google Scholar]
  43. Zhu, H.H.; Shi, B.; Yan, J.F.; Zhang, J.; Zhang, C.C.; Wang, B.J. Fiber Bragg grating-based performance monitoring of a slope model subjected to seepage. Smart Mater. Struct. 2014, 23, 095027. [Google Scholar] [CrossRef]
  44. Zhu, H.H.; Shi, B.; Zhang, C.C. FBG-based monitoring of geohazards: Current status and trends. Sensors 2017, 17, 452. [Google Scholar] [CrossRef]
  45. Hong, C.Y.; Zhang, Y.F.; Li, G.W.; Zhang, M.X.; Liu, Z.X. Recent progress of using Brillouin distributed fiber optic sensors for geotechnical health monitoring. Sens. Actuator A-Phys. 2017, 258, 131–145. [Google Scholar] [CrossRef]
  46. Sahota, J.K.; Gupta, N.; Dhawan, D. Fiber Bragg grating sensors for monitoring of physical parameters: A comprehensive review. Opt. Eng. 2020, 59, 060901. [Google Scholar] [CrossRef]
  47. Bhaskar, C.V.N.; Pal, S.; Pattnaik, P.K. Recent advancements in fiber Bragg gratings based temperature and strain measurement. Results Opt. 2021, 5, 100130. [Google Scholar] [CrossRef]
  48. Licha, A. “Green” and “Smart” cities diffusion: The case of Songdo, Korea. In International Perspectives on Translation, Education and Innovation in Japanese and Korean Societies; Springer: Cham, Switzerland, 2018; pp. 223–240. [Google Scholar]
  49. Chohan, U.W. The ubiquitous City—Sondgdo. McGill University. Available online: https://www.mcgill.ca/channels/channels/news/ubiquitous-city-songdo-songdo-236653 (accessed on 14 May 2014).
  50. Kim, D.; An, S.; Kim, J.; Lee, W. Characterization of soil variability of Songdo area in Incheon. J. Korean Geotech. Soc. 2009, 25, 73–88. (In Korean) [Google Scholar] [CrossRef]
  51. ASTM D 3966-07; Standard Test Method for Deep Foundations under Latera Load. ASTM: West Conshohocken, PA, USA, 2010. [CrossRef]
  52. Davisson, M.T.; Gill, H.L. Laterally loaded piles in a layered soil system. J. Soil Mech. Found. Div. 1963, 89, 63–94. [Google Scholar] [CrossRef]
  53. Mano, H.; Zhou, Y.; Yoshinari, K. Influence of pile width and pile stiffness on lateral subgrade reaction. J. Jpn. Assoc. Earthq. Eng. 2021, 21, 1–12. [Google Scholar] [CrossRef]
Figure 1. Satellite photos of the test site.
Buildings 14 02596 g001
Figure 2. SPT results for the test site.
Buildings 14 02596 g002
Figure 3. Subsurface conditions of Songdo area (compiled from Kim et al. [50]).
Buildings 14 02596 g003
Figure 4. Photograph and schematic drawing of the unit-type FBG sensor.
Buildings 14 02596 g004
Figure 6. Schematic drawing of the lateral pile load test.
Buildings 14 02596 g006
Figure 7. (a) Photograph of the test site and (b) the LVDT setup.
Buildings 14 02596 g007
Figure 8. Measurements of (a) applied load and (b) pile head displacement from LVDTs.
Buildings 14 02596 g008
Figure 9. Load–displacement curve.
Buildings 14 02596 g009
Figure 10. Wavelength measurements of (a) tension and (b) compression sides of the test pile.
Buildings 14 02596 g010
Figure 11. (a) Bending strain and (b) moment of the test pile.
Buildings 14 02596 g011
Figure 12. Results of the inverse analysis using LPILE: (a) shear force; (b) moment; (c) slope; and (d) deflection.
Buildings 14 02596 g012
Figure 13. Depth-dependent p-y curves for a load of (a) 900 kN and (b) 1710 kN.
Buildings 14 02596 g013
Figure 14. Estimation of the kh value as a function of depth.
Buildings 14 02596 g014
Figure 15. Variation in the kh coefficient with depth: (a) preloaded cohesive soil; (b) granular soil, silt, and normally loaded clay; (c) dried normally loaded clay; and (d) soft ground layer (after Davisson [52]).
Buildings 14 02596 g015
Figure 16. (a) Relationship between the kh value and the SPT-N value and (b) a comparison between predicted and estimated kh values.
Buildings 14 02596 g016
Table 1. Summary of engineering properties for representative strata of the test site.
StratumProperties
Undrained Shear Strength (cu, kPa)Friction Angle (ϕ, °)Total Unit Weight (γt, kN/m3) Poisson Ratio (ν)Vertical Modulus (Ev, MPa)Horizontal Modulus (Eh, MPa)USCS
Fill30-17.50.37–155–11SM
Marine deposit60-17.80.33021ML/CL
Weathered sand-3417.80.36042SM
Weathered rock-3220.20.25200140Granite gneiss
Soft rock-3320.50.25300210Granite gneiss
Table 2. Input variables for nonlinear analysis (LPILE).
CategoryInput VariableApplied Value
Pile specificationLength (m)40
Diameter (m)2.5
Elastic modulus (Conc, kN/m2)40,000,000
Moment of inertia (m4)1.917
Soil propertyCohesion (kN/m2)30
Friction angle (ϕ)30
Unit weight (kN/m3)18–20
Modulus of subgrade reaction (kN/m3)Marine deposit (CL)30,000
Deposit (SM)60,000
Weathered soil (SM)200,000
Weathered rock-
Loading conditionPile headFree
Applied load (kN)900/1710
Table 3. Comparison between the results of the inverse analysis and measurements.
Assumed Pile Length (m)Assumed Bearing StrataApplied Load (kN)Maximum Moment (kN·m)Lateral Deformation (mm)
Inverse AnalysisMeasurementInverse AnalysisMeasurement
40Soft rock9003673.43520.2/2792.3 *2.642.32
17106839.68364.9/6798.4 *5.3211.30
* regression results based on the results of the lateral pile load test.
Disclaimer/Publisher’s Note: The statements, opinions and data contained in all publications are solely those of the individual author(s) and contributor(s) and not of MDPI and/or the editor(s). MDPI and/or the editor(s) disclaim responsibility for any injury to people or property resulting from any ideas, methods, instructions or products referred to in the content.

