Article

Experimental Study on the Dynamic Response of Different Grades of Corroded Steel Reinforcement

by
Maria Basdeki
*,
Konstantinos Koulouris
and
Charis Apostolopoulos
Laboratory of Technology and Strength of Materials, Department of Mechanical Engineering & Aeronautics, University of Patras, 26504 Patras, Greece
*
Author to whom correspondence should be addressed.
Buildings 2024, 14(9), 2598; https://doi.org/10.3390/buildings14092598
Submission received: 9 July 2024 / Revised: 21 August 2024 / Accepted: 21 August 2024 / Published: 23 August 2024
(This article belongs to the Special Issue Capacity Assessment of Corroded Reinforced Concrete Structures)

Abstract

:
The mechanical behavior of corroded steel reinforcement under dynamic loadings is crucial for the entire structural response of reinforced concrete elements located in seismic regions. Taking into account the need to assess the structural integrity of existing building stock and the fact that the majority of the existing RC structures in Greece are constructed with the use of steel grades of S400 (equivalent to BSt 420s) and Tempcore B500c, the present study examines the dynamic behavior of rebars of different grades under low cycle fatigue (LCF) at a constant strain amplitude of ±2.5% and compares their performance through a quality material index. In the margin of the current research, the study also included two different grades of hybrid rebars, Tempcore B450 and dual-phase F (DPF). The outcomes demonstrated that single-phase S400 steel underwent mild degradation in its ductility, whereas its bearing capacity was significantly decreased due to corrosion. In contrast, B500c illustrated its superiority in terms of strength, yet recorded extremely limited service life, even in uncorroded conditions, raising questions about its reliability and the structural integrity of existing building stock. However, in corroded conditions, even if B500c corroded rebars showed higher mass loss values than the other examined grades, the degradation of their mechanical behavior due to corrosion was found to be minimal. Furthermore, dual-phase DPF rebars, with their homogeneous microstructure, appeared particularly promising with respect to Tempcore B450 if one considers the span of its service life compared to the extent of corrosion damage.

1. Introduction

Reinforced concrete (RC) is the most used construction material world-wide, combining the compressive strength capacity of concrete with the high tensile properties of steel rebars through the bond mechanism between them [1]. Due to the weakness of concrete in developing tensile stresses, the mechanical behavior of steel reinforcing bars under tension is crucial for the entire structural response of RC elements [2,3]. Thus, the predominant criterion in the production of rebars over the years has been an increase in yield strength fy (and, subsequently, in maximum ultimate stress, fu).
In addition to their high strength properties, the ductility of rebars is also significant, especially in the case of RC structures located in seismic areas, wherein the load-bearing structural members are subjected to cyclic loads and the materials (concrete and steel) develop high deformations and are required to absorb a significant amount of the input seismic energy [3]. In particular, in intense earthquakes, fatigue phenomena appear, and the loading history, which is related to the magnitude and frequency of imposed deformations as well as the number of loading cycles, has significant influence on reducing the bearing capacity and service lifetime of rebars [4,5].
Adopting the European technical codes and technology of the time, from the early 1960s until mid-1990s, in Greece, steel grade S400—which was equivalent to BSt 420s (according to DIN 488 [6])—was used exclusively as longitudinal reinforcement in RC structures. Steel S400 rebars are of single-phase microstructure with mixed ferrite and bainite grains and provide an upper yield limit of more than 420 MPa. The implementation of the new Greek Earthquake Regulation in 1992 (with amendments) and the approval of Greek Earthquake Regulation in 1999, wherein the concept of structures’ ductility was introduced, made clear the need to develop materials that incorporate this factor. Β500c-grade steel reinforcement therefore first appeared at the beginning of 2000 and since 2005, due to the alignment of national regulations with European codes on the minimum required ductility of structures, has been the predominant form of steel reinforcement in RC structures. The typical microstructure of Tempcore B500c displays a mixed microstructure with an external martensite ring layer that is responsible for strength and a ferrite–pearlite core that is responsible for ductility. However, as plenty researchers have highlighted [7,8,9], the distinctly present carbon in the martensitic layer is inherently susceptible to corrosive phenomena, which negatively affects the structural integrity of RC members.
Corrosion of steel reinforcement is recognized as a main factor in the degradation of RC structures’ performance, with the main consequences being loss of the rebars’ cross-section and the degradation of the local (steel–concrete) bond mechanism [4,5,7,8,9,10,11,12,13,14,15,16,17,18,19,20,21]. In cases of hostile environments in coastal regions, the action of chlorides forms pit corrosion and has detrimental effects as it leads to local reduction of the cross-section, causing the concentration of stress and significantly reducing the ductility of rebars. In previous studies, Apostolopoulos et al. investigated the mechanical behavior of corroded rebars of various grades (S400, S500s, B500c) under monotonic tensile loadings and dynamic cyclic loadings with different imposed strain amplitudes [5,15,16,17]. A similar experimental study on B500SD rebars was conducted by Fernandez et al. [18], in which the stress–strain relationships of corroded rebars under both monotonic tensile and fatigue loadings were examined and the influence of pit geometry was investigated. An extensive and comprehensive experimental study was performed by Caprili et al. [21], in which they examined the mechanical behavior of corroded rebars of different grades, investigating the influence of different diameters, production processes, ductility classes, and microstructures. All research studies have shown that the strength properties of corroded rebars show a linear decrease as the corrosion level increases, and they mainly emphasize the rapid drop in maximum strain capacity, which in the case of pitting corrosion shows an exponential downward trend. Imperatore [22] compiled results from various studies on corroded rebars in the case of uniform and localized corrosion and derived useful laws of degradation for the mechanical properties of corroded steel bars as a function of mass loss.
Aiming to improve the production of steel reinforcing bars in order to satisfy simultaneous requirements of high ductility and corrosion resistance, various research programs have been financed by the European Union in recent decades [23,24]. The development of a new typology of rebars was investigated by the project NEWREBAR ‘‘New dual-phase steel reinforcing bars for enhancing capacity and durability of anti-seismic moment resisting frames” (2015–2019), funded by the Research Fund for Coal and Steel (RFCS). Within the framework of the NEWREBAR project, after studying rebars of different chemical compositions and production processes, two types of steel grades were mainly promoted: the classic Tempcore B450 steel grade and a new dual-phase hybrid steel typology, called DPF, with a mixed microstructure within which hard martensite grains are embedded in a ductile ferrite matrix.
The present study examines the mechanical behavior of different grades of steel reinforcing bars, namely S400, Tempcore B500c, and two hybrid types of rebars (Tempcore B450 and dual-phase DPF) under dynamic loadings with constant imposed strain amplitudes in uncorroded and corroded conditions. Taking into account demands for high ductility, due to the fact that RC structures are often faced with aggressively corrosive environments and are constructed with S400 and B500c steel grades, there is a particular need to study the mechanical performance of these steel grades in corrosive conditions in order to make a reliable assessment of the structural adequacy of existing structures. The selected steel grades consist of representative materials already being used in existing reinforced concrete structures in the European region. In particular, S400-grade steel is the equivalent of BSt 420s, which was used from the 1960s until the late 1990s. Furthermore, both Tempcore B500c and B450 steel reinforcement are the predominant steel grades that have been used in RC structures for the last 25 years. For this reason, the study of the mechanical behavior of these steel grades in the long term is of major importance in assessing the structural capacity of existing RC building stock. Aiming to improve the production of steel reinforcing bars and in order to satisfy simultaneous requirements of high ductility and corrosion resistance, in the present manuscript, we describe the mechanical behavior of hybrid dual-phase (DPF) steel in order to highlight the influence of its microstructure on its anti-corrosive and mechanical performance. To conclude, the study of the abovementioned steel grades, especially those in use, is crucial for the structural assessment of the existing RC structures.
Moreover, current European and international regulations mainly provide design values resulting from monotonic loading (quasi-static loading), despite the fact that cumulative damage due to dynamic loading is explicitly stated to occur after seismic events. Thus, the present experimental study aims to fill this research gap and provide information about the dynamic response of steel reinforcement in corroded conditions, given that the dynamic behavior of steel reinforcement generally determines the structural response of RC components.

2. Experimental Procedure

The main goal of the present study is to explore the influence of various levels of corrosion damage on the mechanical behavior of different grades of reinforcing steel bars subjected to repeated cyclic loadings at constant imposed strain amplitudes so as to simulate their anti-seismic performance. The evaluation of their mechanical degradation was expressed in terms of the recorded maximum stress per loading cycle, the total number of cycles until failure, and the energy density. The experiments were conducted on four different steel grades, mainly on S400 (BSt420s) and Tempcore B500c, both of which have been used in existing RC structures in the last fifty years, and on hybrid Tempcore B450 and dual-phase steel F (DPF), as produced within the framework of the European research project “NEWREBAR” [24].
For the purpose of the present study, with the aim of investigating the dynamic response of steel reinforcing bars, a total of 101 specimens were used. There were 22 specimens of S400 grade, 28 specimens of B500c, 29 specimens of Tempcore B450, and 29 specimens of hybrid dual-phase steel F; these were cut to a total length of approximately 200 mm. From the total 101 specimens, 85 steel bars were subjected to corrosion tests to investigate their mechanical behavior in various corrosion conditions.

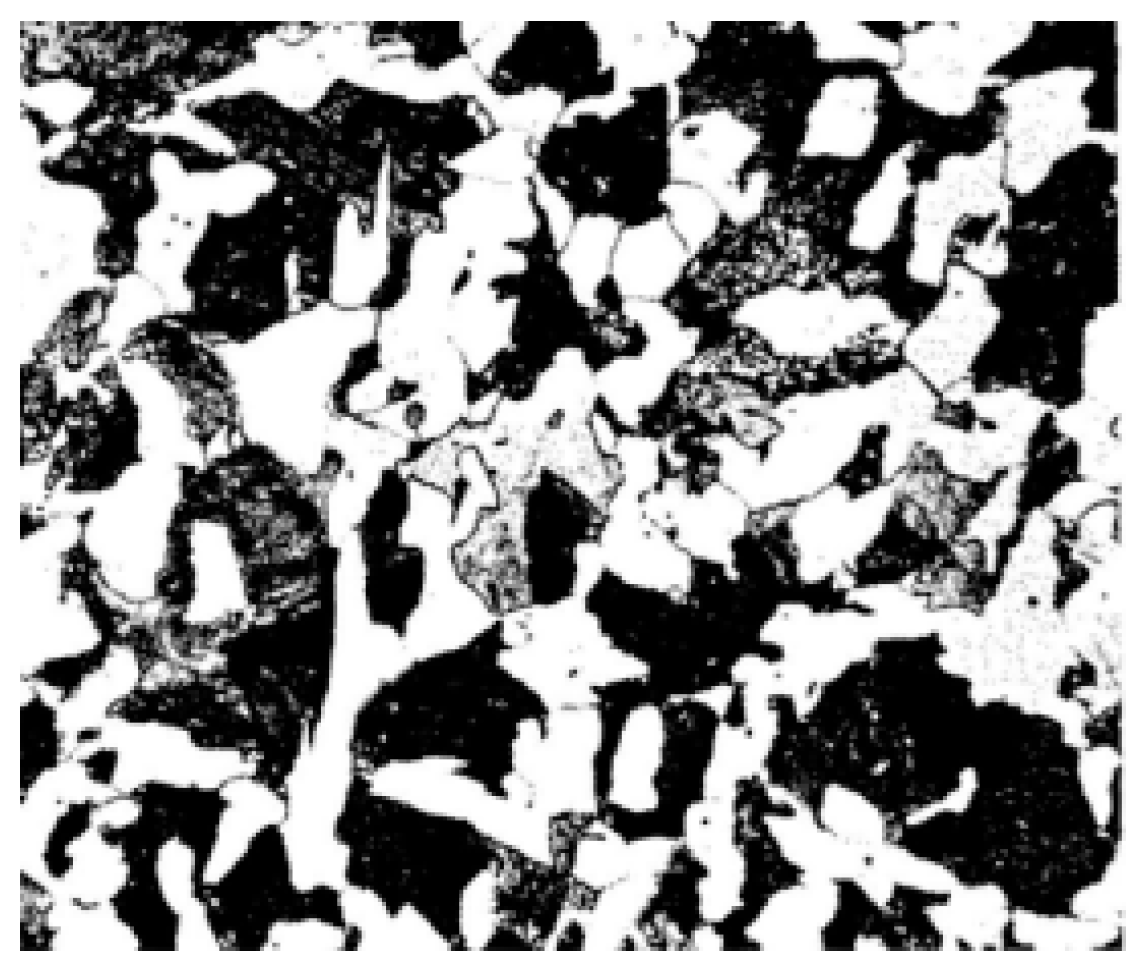
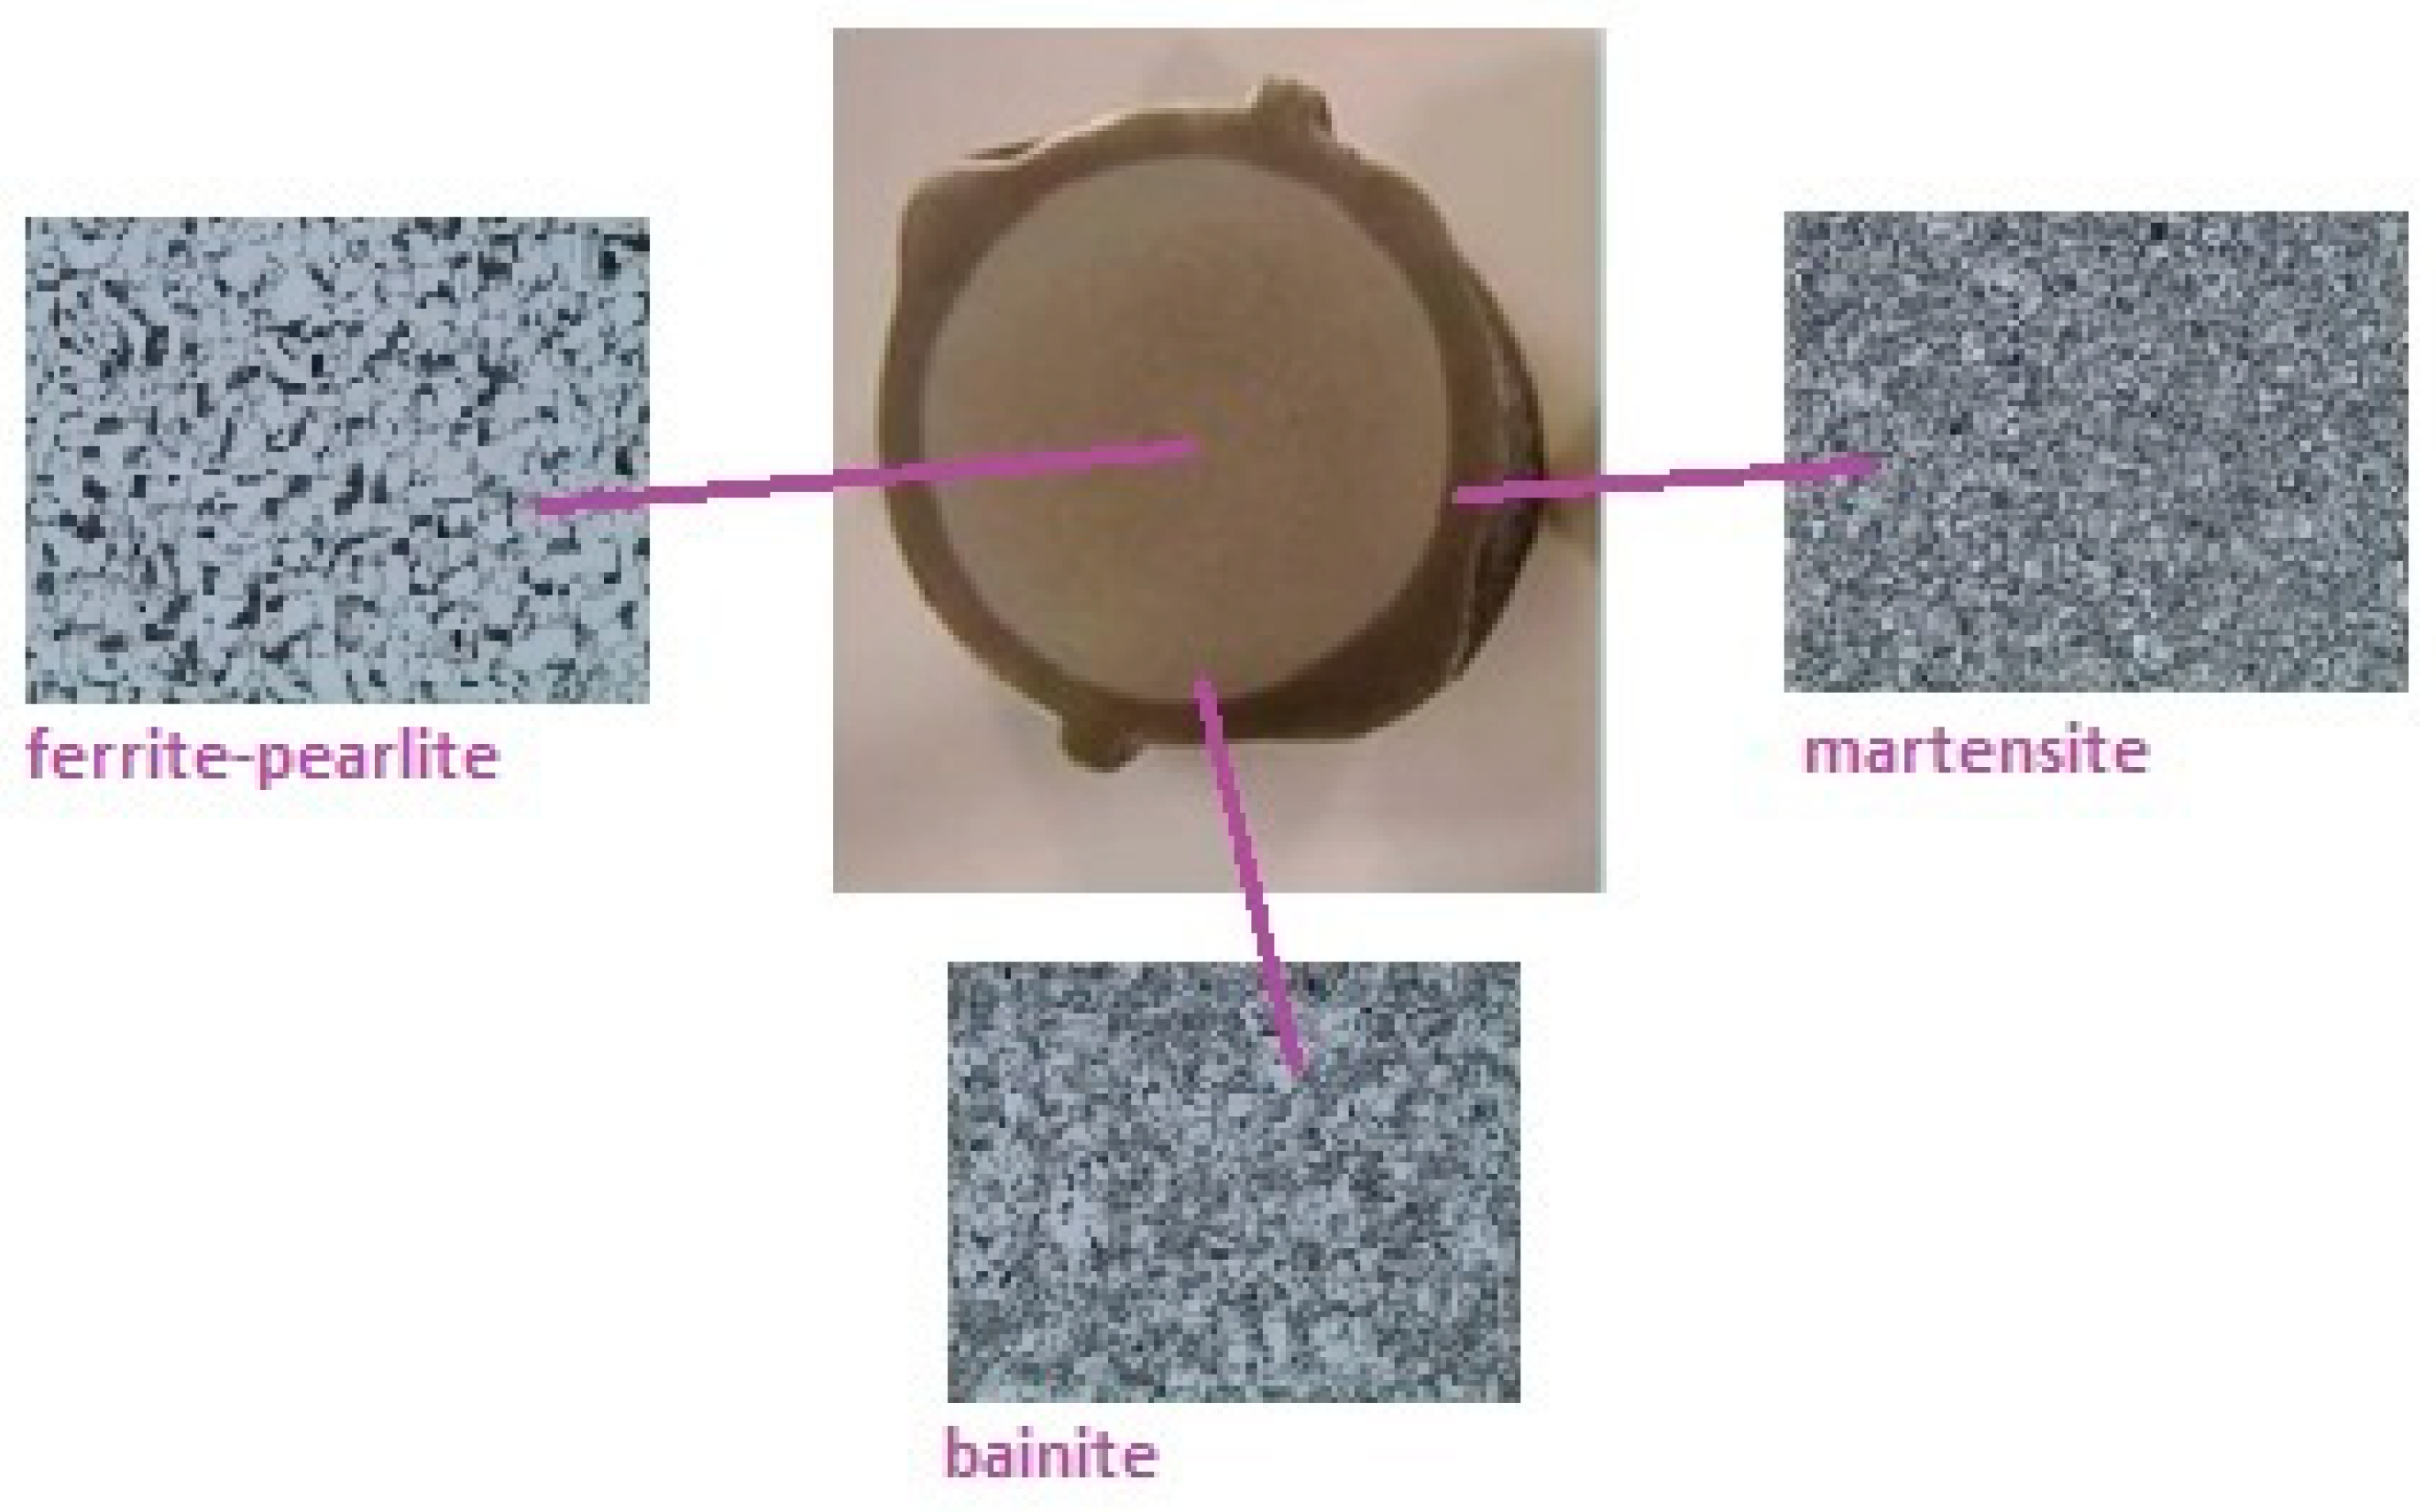
2.1. Microstructure of Different Steel Grades under Investigation

Single-phase S400 steel presents a single-phase microstructure with discrete grains of ferrite and perlite in its cross-section, as shown in Figure 1. Both grades of Tempcore rebars, B500c and B450, display a discrete tempered martensitic phase in the outer ring of the circumference, an interim phase of bainite, and a mixed phase with grains of ferrite–perlite in the core, as shown in Figure 2. Dual-phase steel F (DPF) exhibits a homogeneous mixed phase of martensitic and ferritic grains in its cross-section (Figure 3).
The steel reinforcing bars of S400- and B500c-grade steel were obtained from a Greek steel mill, whereas the rebars of hybrid Tempcore B450 and dual-phase steel F (DPF) were produced within the framework of project NEWREBAR in the form of ribbed bars. The chemical compositions of all grades of steel reinforcement are summarized in Table 1.

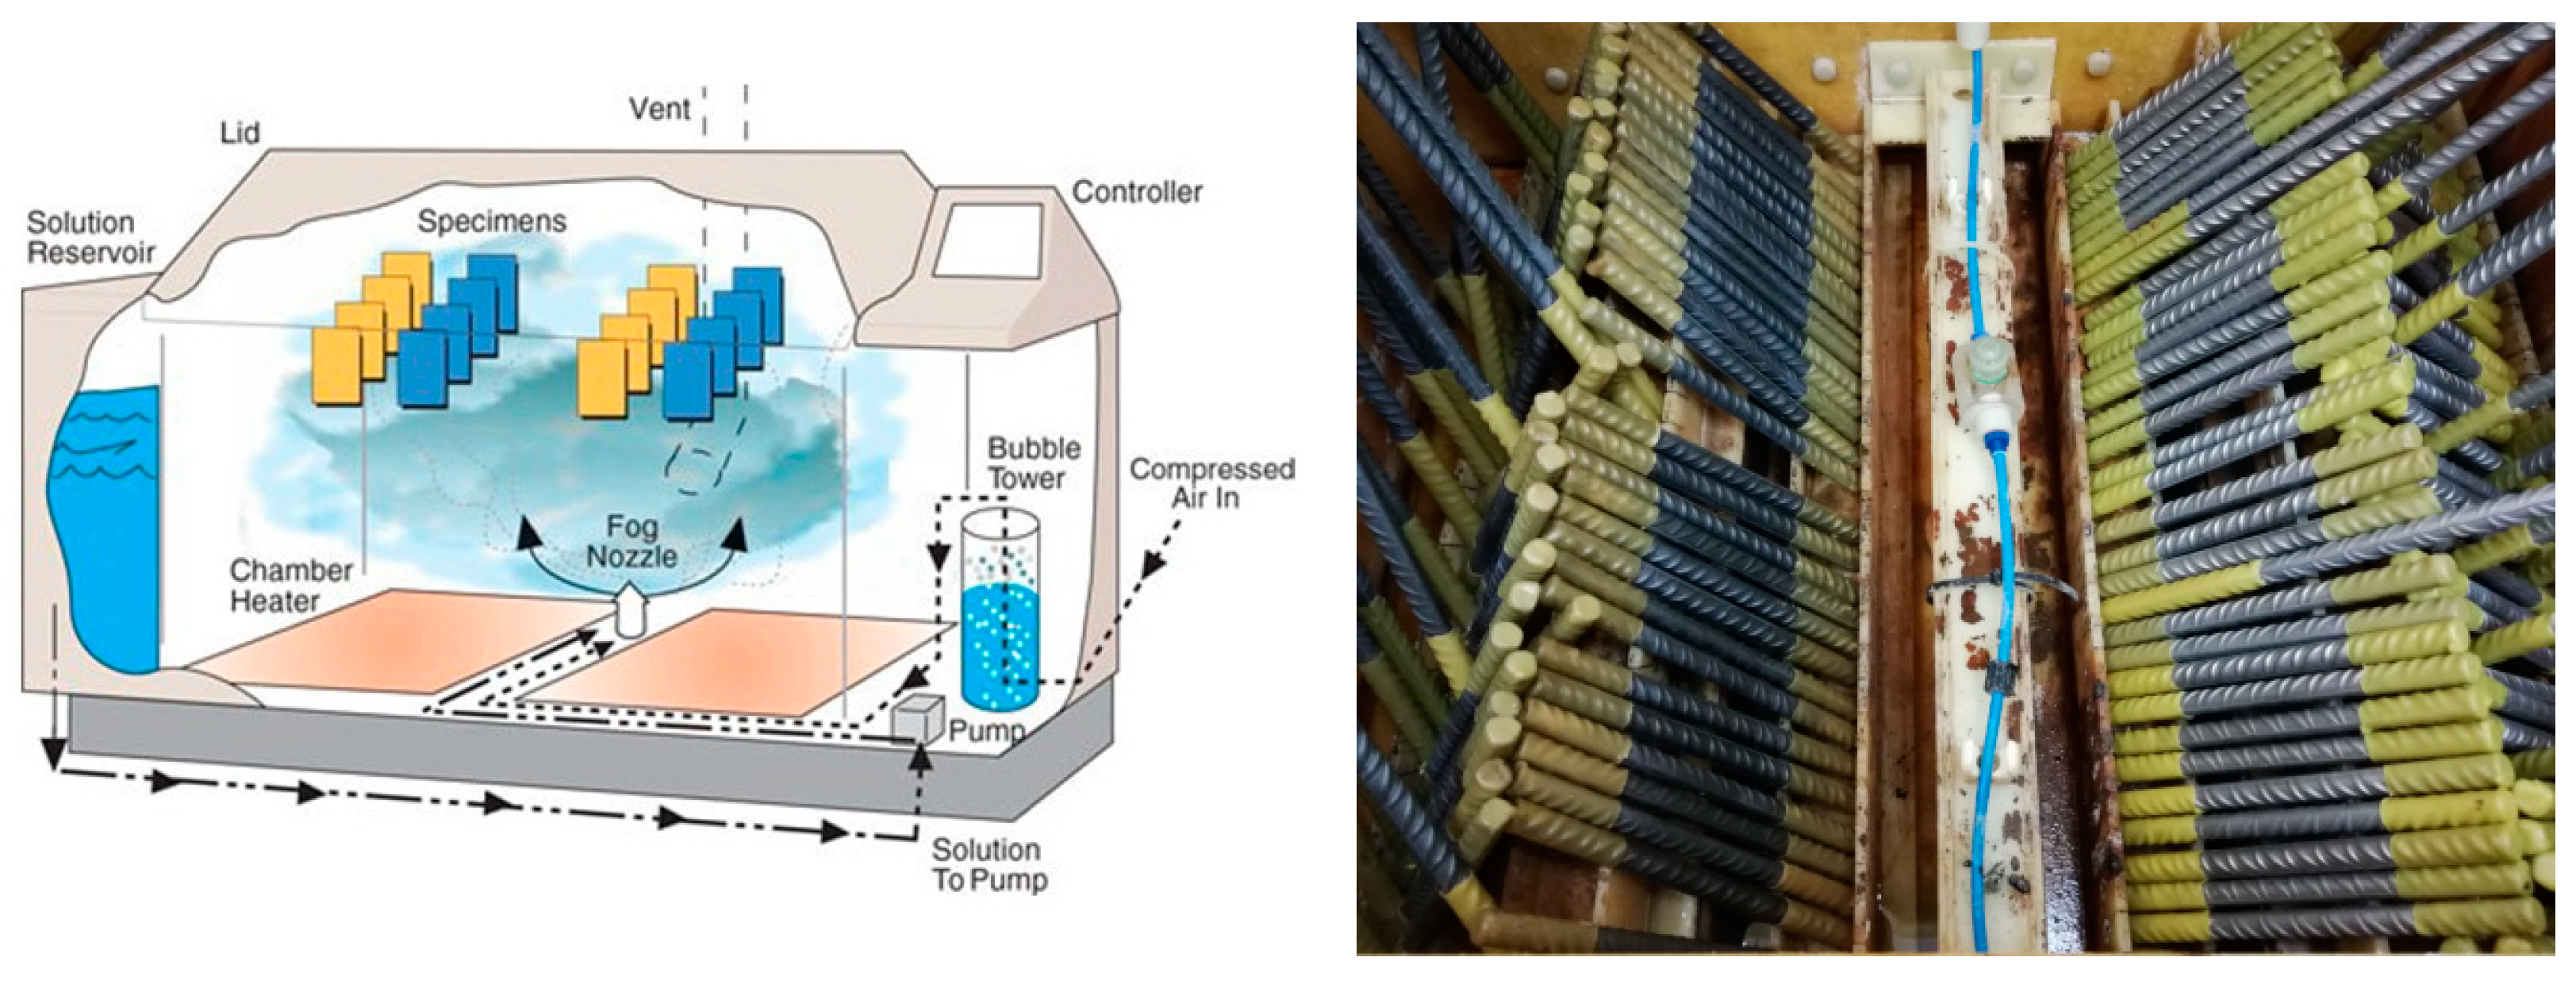
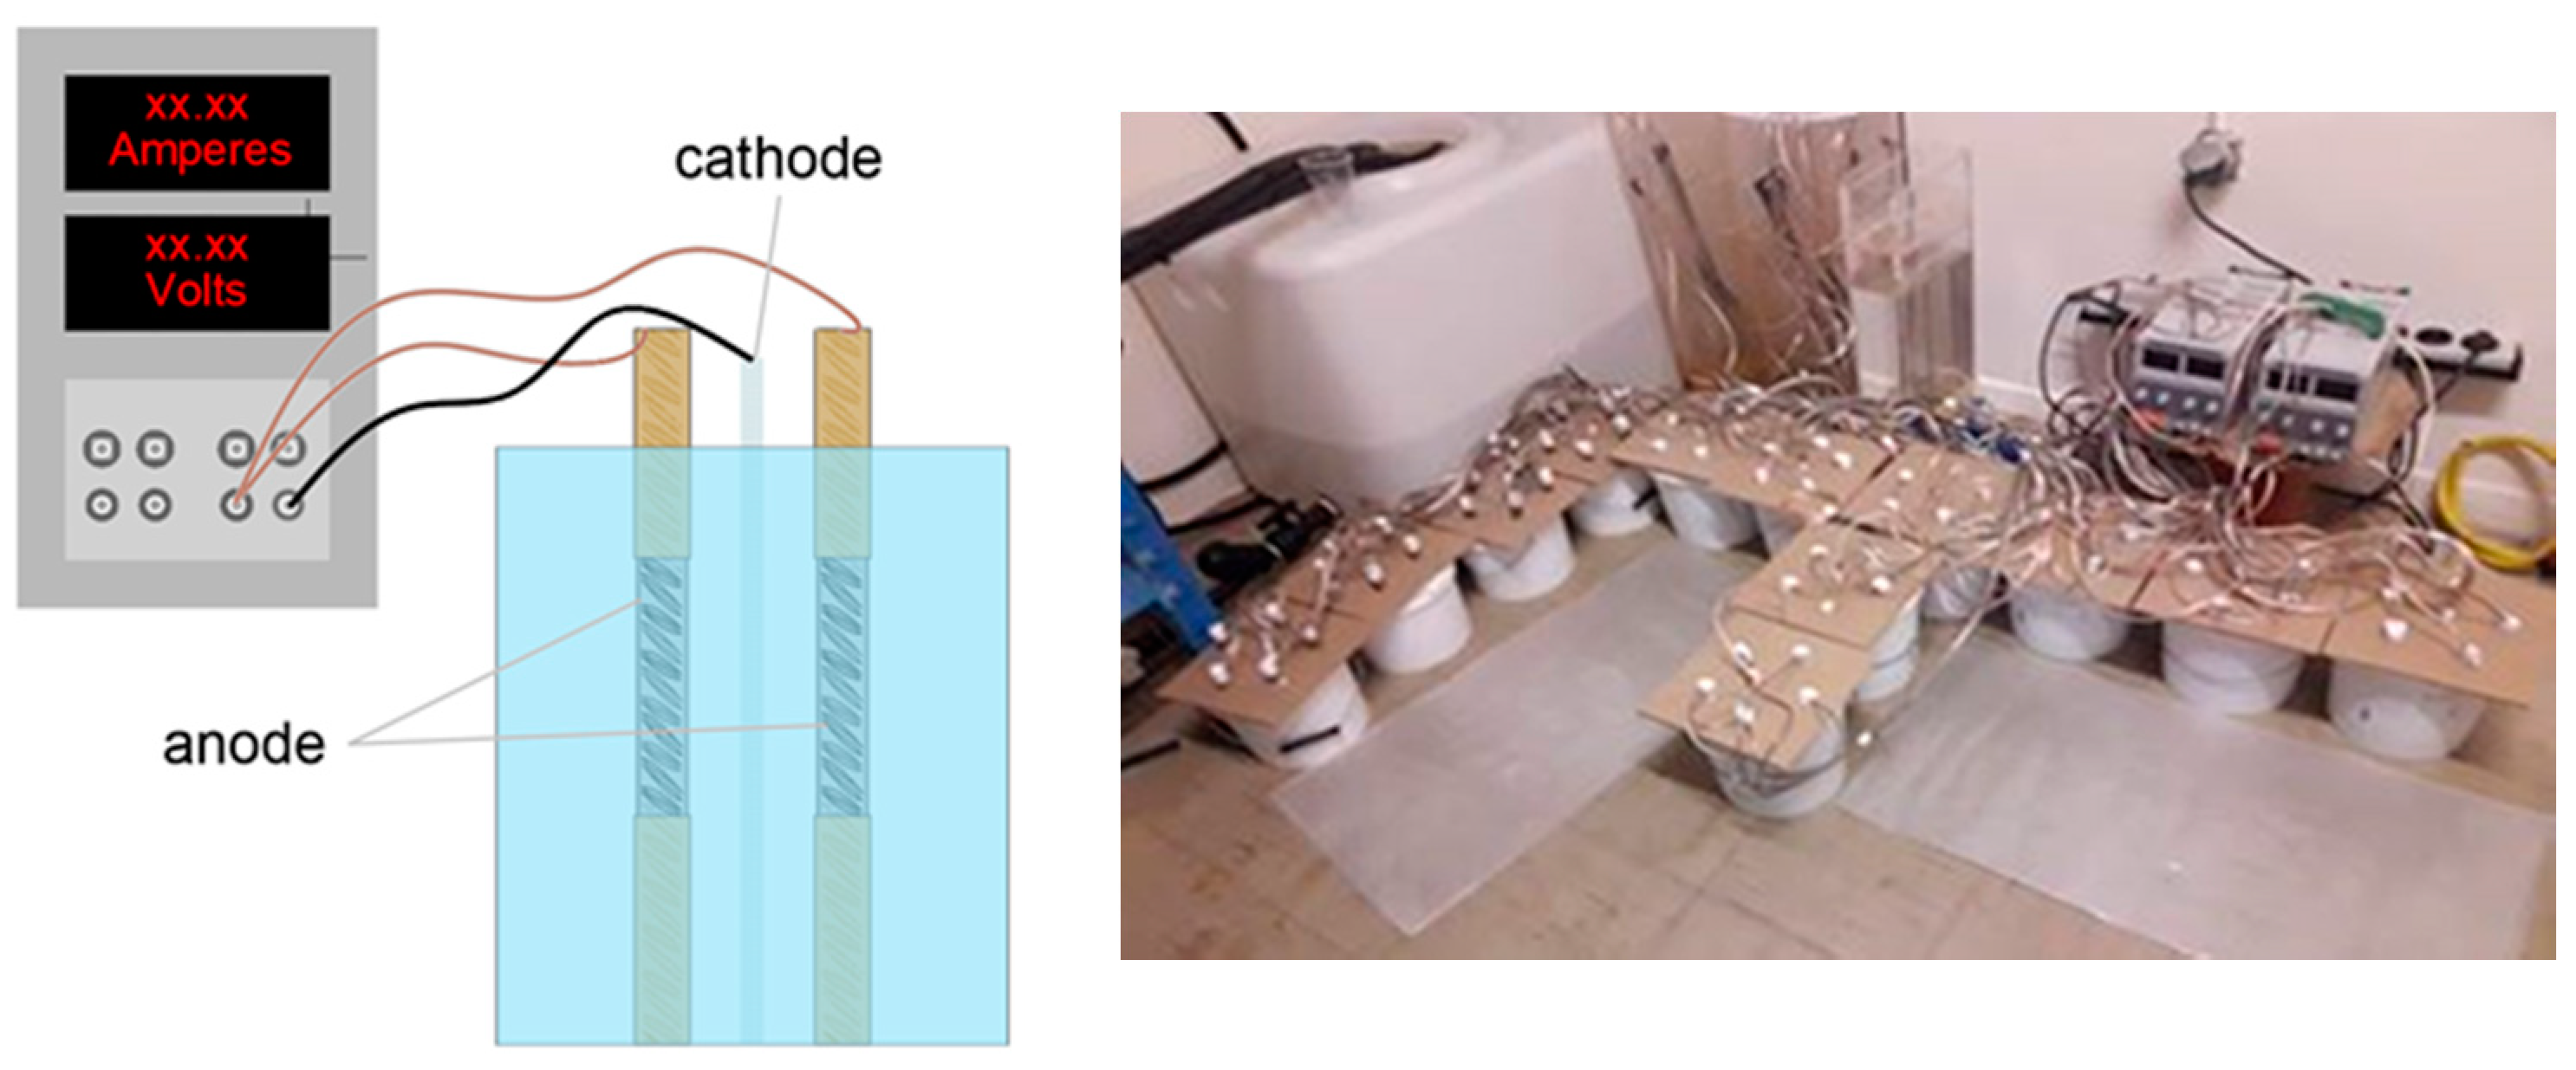
2.2. Corrosion Tests

As is already known, natural corrosion occurs at a very slow rate in reality as the onset of the phenomenon appears after a long period of time. Thus, accelerated methods are adopted in the laboratory, simulating the effect of corrosion damage on steel reinforcement but saving a significant amount of time. The two most widespread laboratory accelerated methods are corrosion exposure via a salt spray chamber and the impressed density corrosion method (ICDC).
The salt spray chamber (Figure 4) follows the specifications of the ASTM standard B117 (1997) [25], where reinforcing rebars are corroded using suitable equipment at a constant temperature of about 35 °C (with deviations of +1.1 to −1.7). Τhe formation of a cloud of sodium chloride solution containing 5% by mass of the solvent (distilled water) is required inside the chamber. Spray valves help to produce the cloud at high temperature and pressure, while the pH ranges from 6.5 to 7.2. In order to achieve a more accurate reproduction of the conditions prevailing in the natural coastal environment, and in particular in the exposure category XS1 according to the EN 206 [26], the specimens are subjected to wetting–drying cycles. More precisely, the daily operation of the accelerated method includes 8 wetting-drying cycles of 3 h each, i.e., 1.5 h of wetting and 1.5 h of drying [25].
Ιn the impressed current density corrosion (ICDC) method, the reinforcing bars to be corroded and the stainless steel bars are connected to a power supply applying direct electric current before being immersed a 5% sodium chloride solution by weight of water (Figure 5). The specific content of the NaCl solution represents the salinity of the Mediterranean basin, according to previous studies [28,29]. With the supply of electric current from the power supply, a closed electrical circuit is created, with the reinforcing steel bars to be corroded as the anode, the stainless bars as the cathode, and the sodium chloride solution as the electrolyte. In order to accelerate the corrosion process, the imposed current density is equal to 1.0 mA/cm2. As in the case of salt spray chamber, in the same manner, for a more accurate simulation of the real conditions in coastal areas, a cyclic exposure was adopted, with a 9 h wetting cycle and a 15 h drying cycle.
Prior to the accelerated corrosion tests, the initial mass of each specimen was recorded, namely Mref. Specimens of each grade of steel reinforcement were divided into groups, as in the tests of corrosion exposure time. Specimens of single-phase S400 steel, as part of a former experimental study, were subjected to the accelerated corrosion tests via a salt spray chamber, with six different exposure times, namely 10, 20, 30, 45, 60 and 90 days. Specimens of Tempcore B450 and dual-phase DPF steels were subjected to corrosion tests with seven different exposure times, namely 100, 200, 300, 400, 600, 800, and 1000 h, respectively, whereas specimens of Tempcore B500c were corroded for six different exposure times, namely 250, 400, 500, 600, 800, and 1000 h. It is worth mentioning that even though the corrosion behavior of the specimens presented in this study is studied by means of dissimilar corrosion methods, the equivalent recorded percentage mass loss allows us to correlate corrosion damage with the general mechanical performance of the reinforcing steel bars.
Upon completion, the specimens were washed with clean running water to remove the remaining salt deposits from their surfaces and were then dried. The oxide layer was removed using a bristle brush, according to the ASTM standard G1-03 (2011) specification, [30] and the resulting mass of each specimen was recorded again, denoted Mcor. Figure 6 depicts specimens before and after the corrosion tests.
Corrosion causes mass loss in materials, which may be uniform or localized (formed with pits). Taking into account that the examined rebars were bare and not embedded in concrete, the corrosion damage was assumed to be uniform and assessed by means of percentage mass loss of the rebars, as shown in Equation (1). The equation of mass loss assumes an average penetration depth along the bar, and a uniform average residual cross-section is taken into account.
Thus, following the cleaning process, the corrosion level of each steel bar was estimated in terms of mass loss by the following expression:
Percentage   Mass   Loss = M r e f M c o r M r e f 100   ( % )

2.3. Mechanical Tests—Low Cycle Fatigue

In order to study the dynamic response of steel rebars, low cycle fatigue (LCF) tests were carried out under displacement (strain) control mode. As a matter of fact, seismic events introduce the phenomenon of low cycle fatigue in steel reinforcement, and up to 6% strain amplitude can result in fracturing [5,31,32,33,34,35]. In the present experimental procedure, a strain amplitude of ±2.5% was selected in order to limit the buckling phenomenon and focus solely on the influence of the microstructure on the mechanical behavior of each steel reinforcement grade.
All rebars were subjected to cyclic loadings with a constant strain amplitude of ±2.5% so as to simulate their seismic behavior and simultaneously reduce the buckling phenomenon [31]. The loading frequency was set at 2 Hz, and the free length of specimens was equal to six times their diameter (6Ø) with the aim of simulating the spacing of transverse reinforcement (stirrups) in RC members designed with modern regulations (Figure 7).

3. Fatigue Index

Several studies have used damage indexes to evaluate the mechanical behavior of different engineering materials and rank them by their suitability for certain applications. Alexopoulos et al. first introduced a quality index to rank aluminum cast alloys regarding their suitability for aircraft structures, considering their yield strength, Rp, and strain energy density, W [36]. Extending this index, Alexopoulos et al. [9,37] proposed a performance index which compares different grades of steel reinforcement, accounting for both their tensile strength and ductility due to accumulating corrosion damage. As a supplement to this research study, an index of quality in the presence of corrosion is presented to rank different grades of steel reinforcement, assessing their response to dynamic loadings in the presence of aggressive environmental factors.
Taking into account that the dynamic response of steel reinforcement is dependent on several parameters such as the imposed strain amplitude, the accumulation of damage due to loading history, the slenderness ratio (nominal diameter to free length), corrosion level, etc., a fatigue damage index QF was previously introduced by the authors of [38,39] in order to evaluate the dynamic response of different grades of steel rebars and reflect the influence of loading history and corresponding absorbed energy on their mechanical performance. The determination of the quality index is described in detail in [38], but for purposes of clarity, a brief description of the index follows.
Q F = K F Q o
where the dimensionless factor KF accounts for the reduction in maximum stress due to corrosion and history loading, and Qo stands for the reduction in service life and corresponding maximum strain energy density due to the cumulative damage resulting from corrosion and fatigue loadings. The two factors are defined as follows:
K F = σ 80 , i σ max , ref σ max , i σ max , ref
Q o = N 80 , i N max , ref W d , i W d , max W d , max
The fatigue index cannot be generalized and determined on simpler coefficients due to the complexity of the damage mechanisms. The abovementioned index indicates the mechanical performance of different grades of steel reinforcement under dynamic loadings, taking into account both the loading history and corrosive factors. Moreover, the derived damage index results are valid for a specific imposed strain amplitude (which in the present case was a ±2.5% strain amplitude).

4. Discussion of Results

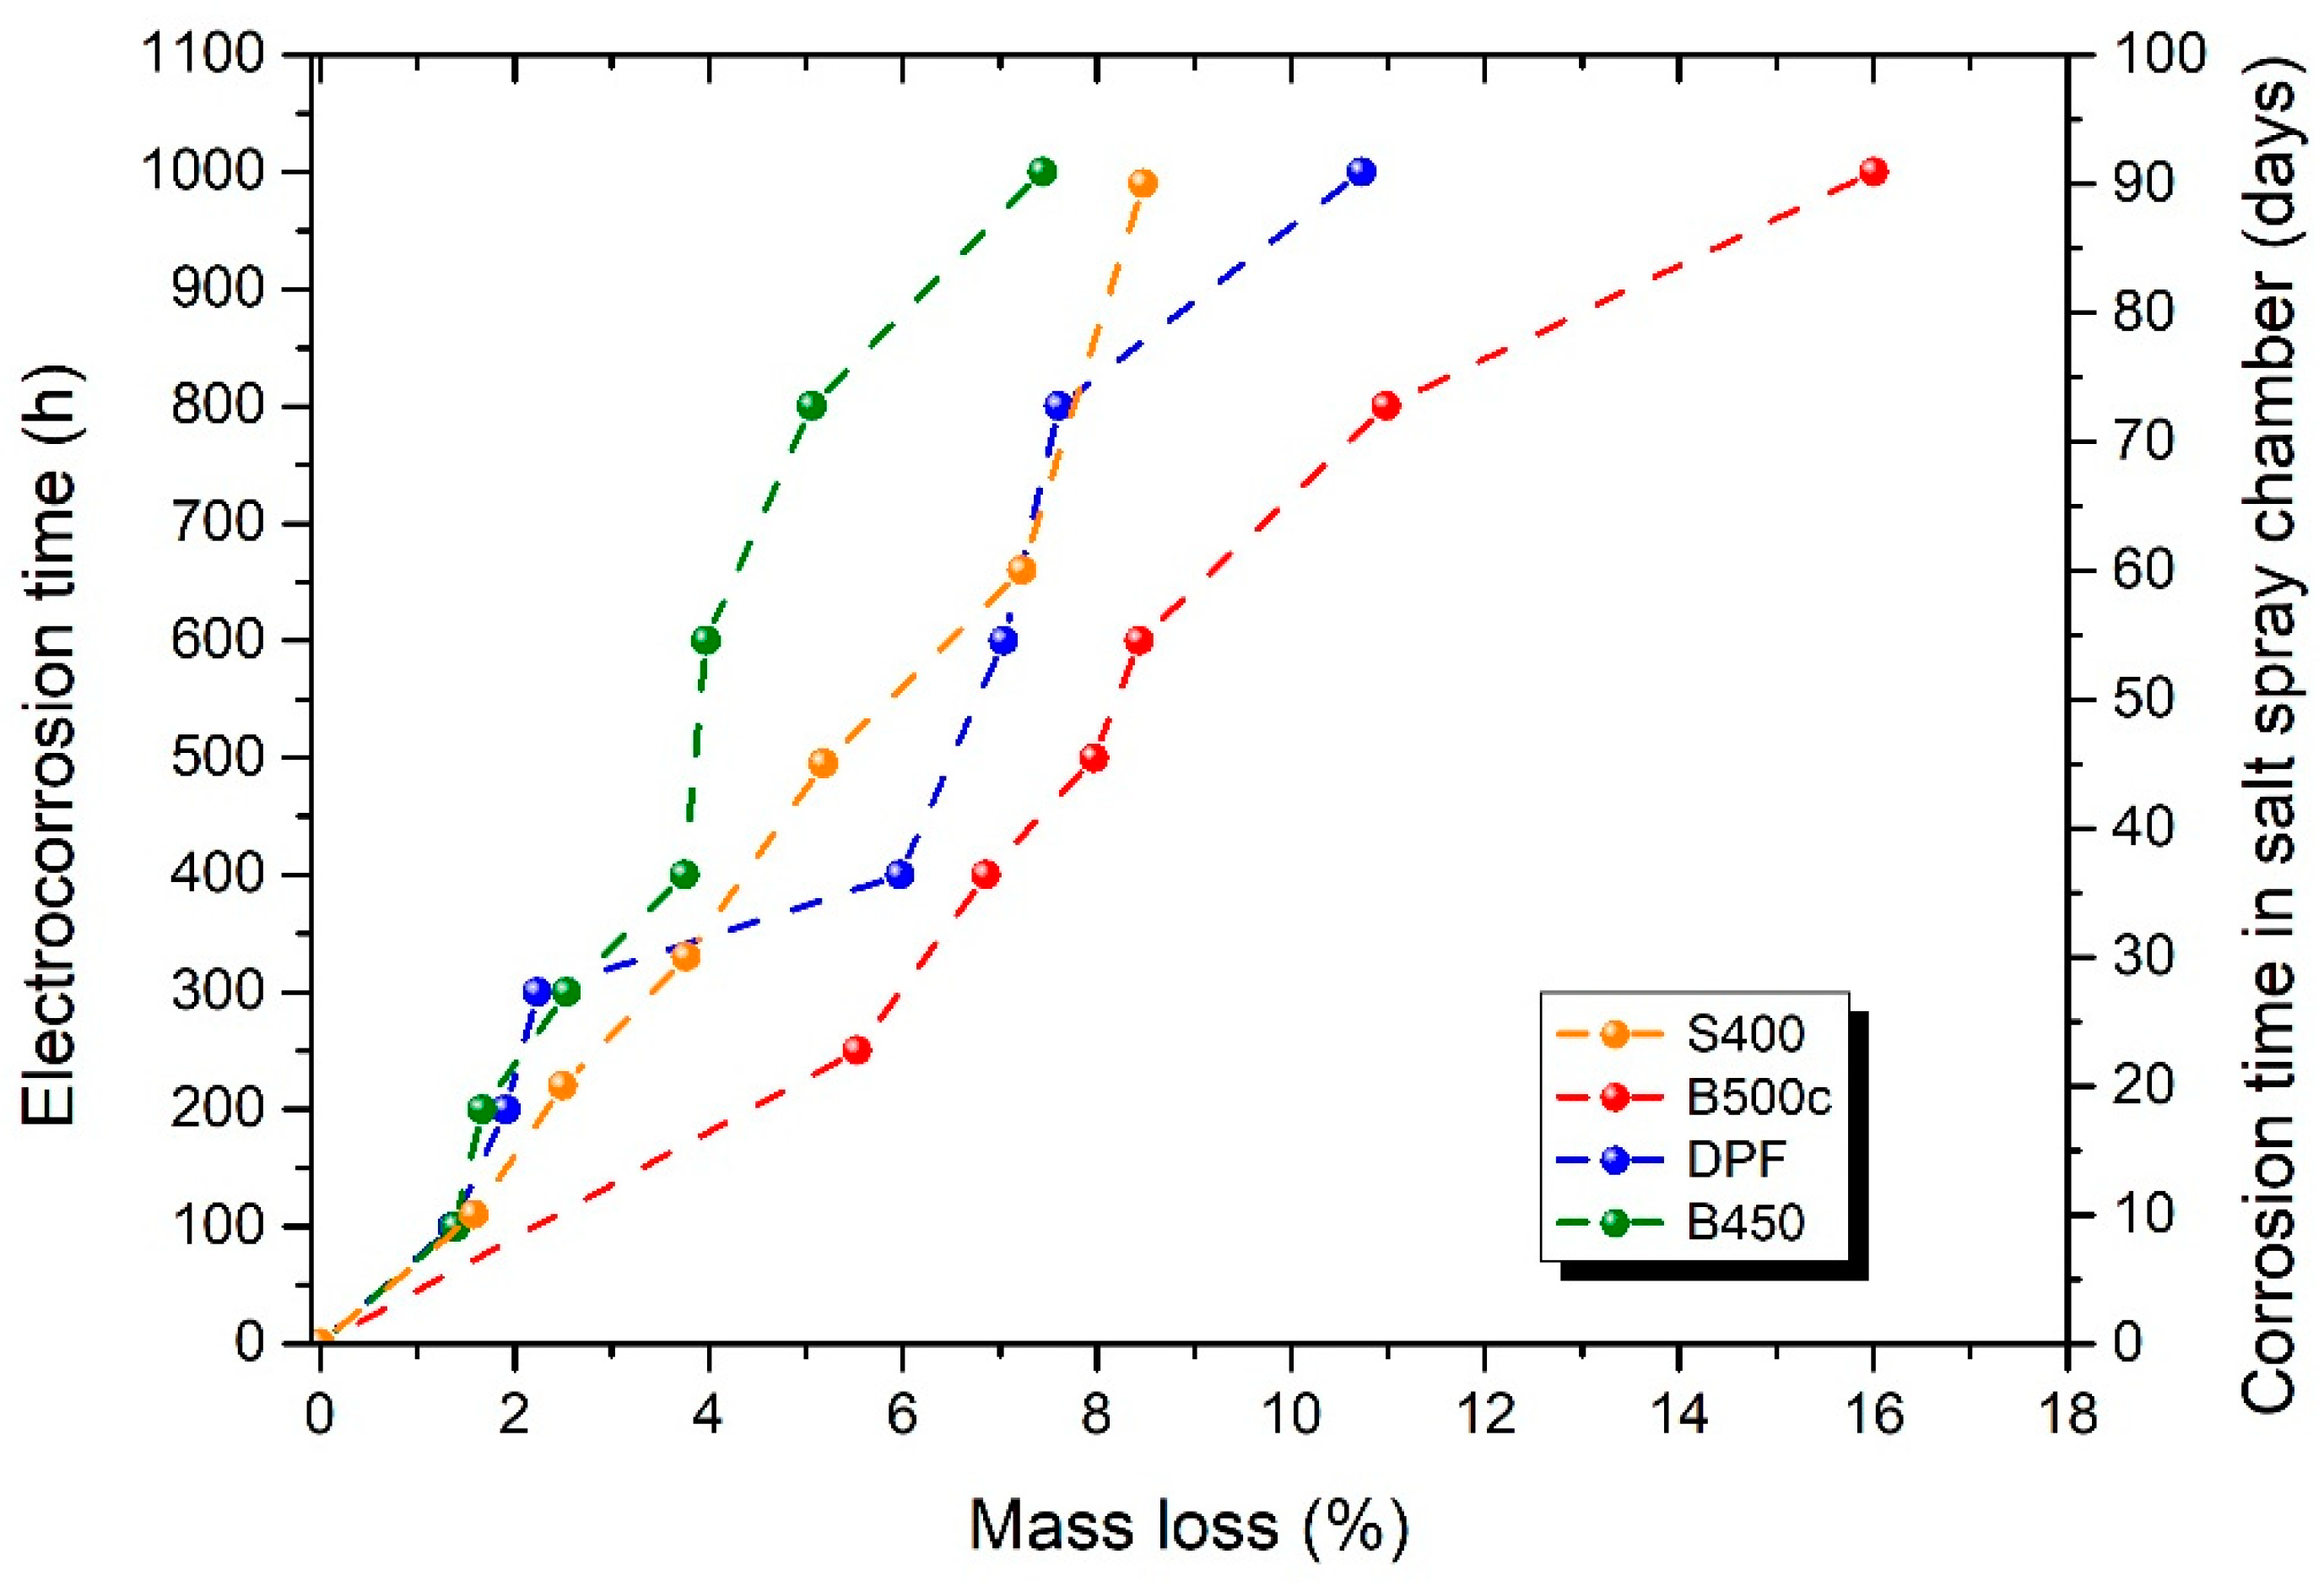
4.1. Corrosion Damage

The corrosion damage of all tested specimens was estimated upon the completion of the accelerated corrosion process in terms of percentage mass loss of steel rebars. The values of mass loss for steel grades of B500c, B450, and DPF subjected to electro-corrosion are presented in Table 2, and the percentage mass loss of S400 steel rebars, as determined via corrosion tests in the salt spray chamber, are presented in Table 3. The corrosion damage of all steel grades is illustrated in Figure 4.
Figure 8 illustrates the increase in corrosion damage in terms of percentage mass loss as a function of the accelerated corrosion time for all tested grades of steel reinforcement. At this point, it is worth mentioning that in the case of single-phase S400 steel, the accelerated corrosion method using a salt spray chamber was adopted, and the corrosion time is presented on the right vertical axis; meanwhile, in the case of B500c, B450, and DPF, the impressed current density corrosion method was adopted, and the electro-corrosion time is presented on the left vertical axis.
It is apparent from the recorded values of percentage mass loss, as shown in Figure 8, that the B450 and DPF grades demonstrated similar percentage mass loss for the first hours of electro-corrosion, but as corrosion time increased, mass loss differed depending on the steel grade. More specifically, Tempcore B450 and DPF demonstrated similar percentage mass loss equal to 2% for up to 300 h of electro-corrosion; nonetheless, after more corrosion time, Tempcore B450 recorded lower mass loss than DPF, i.e., 7.5% versus 11%, after 100 h under corrosion conditions. Regarding B500c steel rebars, the mass loss values were clearly higher compared to the rest of the examined steel grades from the very first hours of accelerated corrosion. Specifically, after 250 h of accelerated electro-corrosion, steel B500c recorded 5.5% mass loss, while steel grades B450 and DPF presented around 2% corrosion levels. Furthermore, B500c steel demonstrated generally higher values of percentage mass loss for the entire period of exposure to corrosion. In particular, after 300 h of corrosion time, the B500c mass loss rose by 6%, while after 1000 h, the mass loss soared to 16%. In conclusion, B500c steel was found to be more vulnerable to corrosion than to DPF and B450 steel grades for the entire corrosion process. Finally, although a comparison cannot be made with the rest of the examined steel grades due to the different accelerated corrosion methods, single-phase steel S400 showed a smooth reduction of up to 8.5% in mass loss over 90 days in the salt spray chamber.

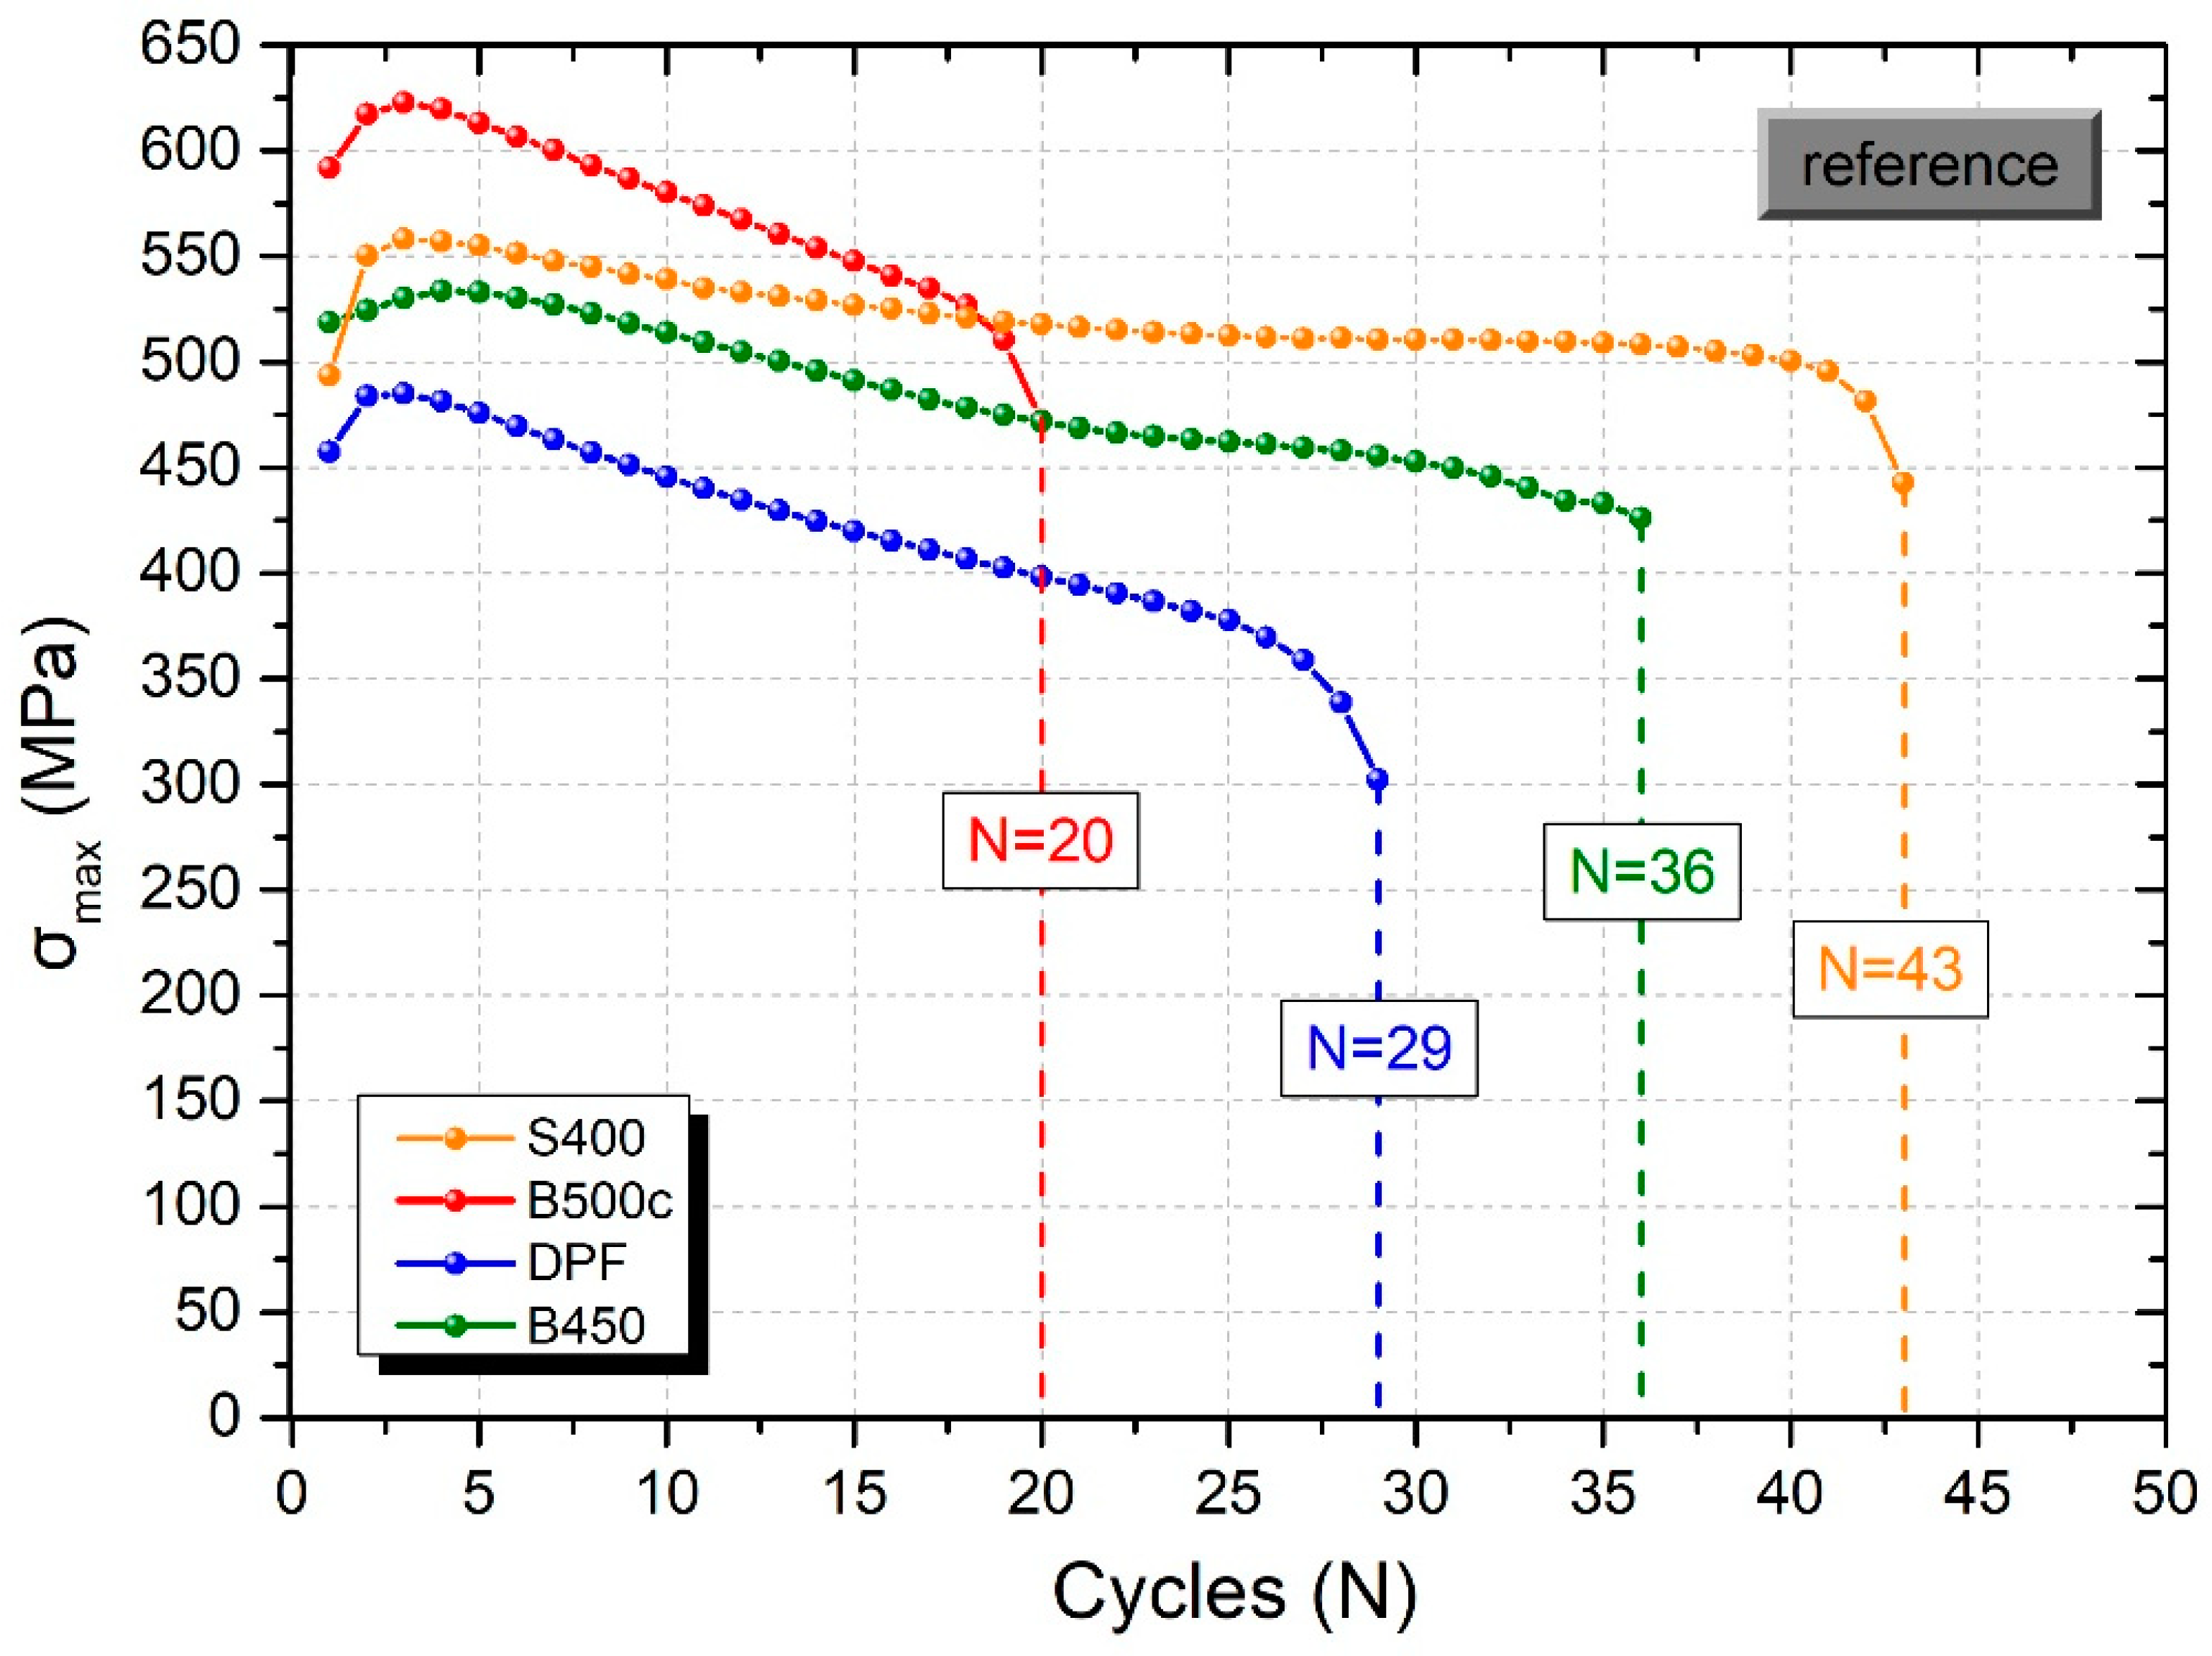
4.2. Results of LCF Tests

Providing high resistance in terms of strength is a predominant criterion in the production of steel reinforcement, as reflected by the significant increase in materials’ yield strength, fy (and consequently, the maximum stress limit, fu) over the years of its evolution from the single-phase steel grade StI (S220) to the current Tempcore B500c. Regarding the design of reinforced concrete structures, the value of yield stress is exclusively included in the equations calculating the equilibrium of reinforced concrete elements and accounting for the mechanical resistance of steel reinforcement. Nevertheless, in earthquake-prone areas, where structural members are subjected to strong cyclic loadings, high demands are placed on ductility rather than yield strength. The ductility of steel reinforcements is of major importance for their mechanical performance, which, in the case of cyclic loading, is expressed by (a) the ability of the material to perform for a large number of loading cycles (N) without a significant drop in its load-carrying capacity; (b) the maximum stress at each loading cycle (σmax); and (c) the dissipated energy (Wd). In this context, the results of LCF tests in terms of service life (number of cycles until failure), load bearing capacity (maximum stress σmax), and ability to absorb energy (energy density, Wd) are summarized in Table 4, Table 5, Table 6 and Table 7, in conjunction with the corresponding mass loss, for all tested grades of steel reinforcement.
Based on the results of the mechanical tests comparing the values of the loading cycles at failure and the energy absorption capacity, we observed that S400 steel bars, although they do not exhibit high stress values, clearly have higher ductility than the other categories in similar conditions (i.e., without corrosion). It is worth mentioning that among the two steel grades that have been used to date in RC structures, the total number of loading cycles before failure for S400 bars was 43, while for B500c bars, it was 20. Similarly, the energy absorption capacity for the entire service life of the S400 material increased by 85.2% on that of the B500c steel grade, recording an energy density of 1059 MPa instead of 571.85 MPa for the B500c grade.
Highly relevant in the study of the dynamic response of materials is the rate of degradation of their load-bearing capacity (maximum stress) per cycle due to buckling phenomena. Figure 9 presents the values of the maximum stress per cycle for each steel grade under the reference conditions, as recorded in LCF tests with a constant imposed deformation of ±2.5%.
As illustrated, the current Tempcore B500c steel shows higher strength values compared to the others, with a recorded maximum stress of 620 MPa compared to 570 MPa in the S400 grade, 530 MPa in the B450 grade, and 470 MPa in the DPF grade. Unlike its maximum stress, the lifetime of the B500c steel is significantly limited. More specifically, the recorded loading cycles before failure were 20 for the B500c grade, 43 for the S400, up by 115%, 36 for the B450, and 26 for the DPF grade. When observing the rate of decrease in the maximum stress per cycle for each steel category using curves, it is evident that the load-carrying capacity of B500c and DPF shows a similar tendency to rapidly decrease, which may be related to their limited service-life, while the S400 steel is characterized by a milder rate of decrease in maximum stress per cycle. In detail, from the fitting lines of the drop in load capacity, the degradation slope for B500c is 6.40%, for S400 is 1.41%, for B450 is 3.06%, and for DPF is 5.18%.
Given that the tests were carried out with a constant imposed deformation of ±2.5%, the maximum number of loading cycles performed with each steel—coupled with the rate of decrease in maximum stress—is closely related to the amount of absorbed energy per cycle and thus to the overall energy consumption capacity of the material. Considering the abovementioned remarks, it is evident that in the reference conditions (uncorroded specimens), the B500c steel grade shows limited ductility, as it has a sharp drop in maximum stress per cycle and a short service life. On the contrary, the S400 single-phase steel category is of a lower class in terms of strength, yet demonstrates a strong advantage in terms of deformation as it exhibits the mildest characteristics—the most gradual drop in load capacity per cycle and the greatest capacity to withstand load cycles. These features may constitute an important tool in cases where the structural integrity of existing RC structures in earthquake-prone areas is being studied and may be used to verify the mechanical performance of steel reinforcements, given that S400 steel was used for buildings constructed in the period between 1960 and 1990, and B500c has exclusively been used for newer buildings from 2000 to date.
In the light of the need to study existing buildings, it is crucial to provide data on the mechanical performance of each steel category, taking into account the existence of corrosion phenomena of the material. For this purpose, curves of the maximum stress as a function of loading cycles for corroded steel bars at different levels of mass loss, as extracted from fatigue tests at a constant imposed deformation of ±2.5%, are given in Figure 10, Figure 11, Figure 12 and Figure 13. As expected, in all cases, the degradation of the mechanical behavior of the steel due to corrosion damage is apparent and is more pronounced as the mass loss increases, as reflected by the fact that the σ-N curves of the corroded bars are significantly degraded relative to the reference bars (with no corrosion).
It is obvious from Figure 10 that the dynamic behavior of S400-grade steel is significantly affected by corrosion, since the curves of the recorded maximum stress per load cycle diverged significantly under corroded conditions compared to these under reference (uncorroded) conditions. The maximum stress of the S400 corroded rebars for about 8.0% mass loss dropped by 18% compared to the uncorroded rebars. Furthermore, the ductility of S400 corroded rebars dropped sharply even at a low corrosion level of 4.8%. In particular, single-phase steel S400 demonstrated a sharp drop of about 51% of its service life (from 43 to 21 cycles) for a corresponding mass loss of 5.2%. However, for higher corrosion levels of up to 8.1%, we observed no significant reduction in the number of load cycles before failure. The decrease in service life was equal to 56% (from 43 to 19 cycles) and 58% (from 43 to 18 cycles) for corresponding mass losses of 7.3% and 8.5%, respectively.
However, it is important to emphasize that although the recorded lifetime (ductility) of the S400 rebars appeared degraded compared to the reference conditions, it nevertheless remained consistently high and approximately equal to the corresponding lifetime of the B500c material in uncorroded conditions.
Observing the results of the dynamic behavior of B500c rebars under both corroded and uncorroded conditions, the B500c-grade steel showed higher mechanical performance than the S400 grade. In principle, the bearing capacity of B500c rebars in terms of maximum stress was found to be significantly higher than the corresponding value of the S400 rebars. Even if B500c-grade steel proved to be more vulnerable to corrosion, recording high values of mass loss (Table 2 and Figure 8), it demonstrated smooth mechanical degradation, since the reduction curves of the maximum stress per load cycle did not display deviations. In particular, the reduction in maximum stress for corroded B500c-grade steel (for about an 8.0% corrosion level) was 4.8% compared to the reference conditions, whereas in the case of the S400 grade, the reduction was recorded as 18%. Furthermore, the maximum stress of the B500c corroded rebar for a 16.0% mass loss decreased by 8% compared to the uncorroded material.
Regarding the influence of corrosion on the ductility of B500c-grade steel, the number of load cycles before failure was reduced significantly in corroded conditions. In particular, B500c steel exhibited a steep drop, recording a 45% decrease in service life (from 20 to 11 cycles) for a corresponding mass loss of 11%, while for percentage mass loss equal to 16%, the decrease in service life reached 50%. It should be noted that the steel B500 grade presented a limited service life from the beginning under the reference conditions. Thus, the further degradation of the service life of B500 due to corrosion raised important questions regarding the durability of RC structures built over the last 25 years, during which time this steel grade was used.
As mentioned before, several research projects have been carried out with the aim of improving and optimizing the production of steel reinforcing bars with high ductility and corrosion resistance. As Caprili et al. [20,21] and the authors of [5] have already highlighted, dual-phase steel grades satisfy these criteria. It is shown by Figure 12 that dual-phase steel, (DPF) presented low values of load capacity (in terms of maximum stress). However, DPF demonstrated both high ductility and durability capacity, since the number of load cycles to failure before was satisfactory—and higher than for the currently used Tempcore B500c grade—for the entire tested corrosion time. The DPF grade showed a steady mechanical performance in corroded conditions, as the curves of maximum stress versus load cycles did not diverge, and the degradation of bearing capacity was slight compared to the reference conditions.
Observing the results of hybrid Tempcore B450, it is obvious that this steel grade did not demonstrate satisfactory mechanical performance in the long term. Both the bearing and ductility capacity were degraded significantly due to corrosion. The recorded numbers of cycles before failure were highly scattered, as shown in Figure 13. Furthermore, the reduction rate of the maximum stress per load cycle was steeper than with the other steel grades, as can be seen in the comparison of the curves in Figure 14. It is noteworthy that the fracture surfaces of all tested samples in both reference and corroded conditions presented ductile characteristics, since the level of corrosion was limited and the tested specimens were bare, leading to a uniform type of corrosion without any observed localized reduction in cross-sections and pits.
Figure 14 illustrates the reduction in the number of cycles to failure (N) as a function of percentage mass loss for an imposed deformation of ±2.5% for all grades of steel reinforcement under investigation. In particular, B500c steel exhibited a mild decrease from 20 to 15 cycles, which is a decrease of 25% in service life for a corresponding percentage mass loss of 8.5%. At greater levels of percentage mass loss, the drop was steeper; B500c showed a 45% decrease in service life (from 20 to 11 cycles) for a corresponding mass loss of 11%, while for a percentage mass loss equal to 16%, the decrease in service life reached 50%. On the contrary, single-phase steel S400 demonstrated a sharp drop of about 51% in its service life (from 43 to 21 cycles) for a corresponding mass loss of 5.2%. In the same manner, the decrease in service life was equal to 56% (from 43 to 19 cycles) and 58% (from 43 to 18 cycles) for corresponding mass losses of 7.3% and 8.5%, respectively. Hence, the performance of the two grades of steel reinforcement used in existing structures built over the past 60 years, in terms of serviceability and in the presence of corrosion, raises questions about the mechanical performance of RC structures.
Moreover, the development of a new generation of steel reinforcements within the framework of NEWREBAR, i.e., Tempcore B450 and dual-phase steel F, recorded lesser reductions in service life. More precisely, steel B450 exhibited a drop of about 39% (from 36 to 23 and 22 cycles, respectively) while recording a relatively low percentage mass loss of up to 5%. At 7.5% mass loss, the decrease in service life was barely over 60%, recording a reduction of 22 cycles relative to the reference conditions. In addition, dual-phase steel F demonstrated a slight decrease of 10% (from 29 to 26 cycles) and 21% (from 29 to 23 cycles) for a corresponding mass loss of 7% and 7.6%, respectively. Once the mass loss reached a value of 11%, the service life was reduced by 31%, namely from 29 to 20 cycles. Based on the abovementioned values, it can be concluded that the new grades of steel reinforcement appear less vulnerable to corrosive conditions, since they recorded relatively low percentage mass loss along with improved performance in their service life, both in reference and corroded conditions.
In terms of strength, the degree of corrosion damage has also a significant impact on the maximum recorded stress of steel reinforcement, the reduction of which is plotted in the abovementioned figures. Regarding B500c steel, the results presented a reduction of between 5.4% and 9% over the whole period of exposure to corrosion, namely 5.4% (from 623 MPa to 589 MPa), 7.3% (from 623 MPa to 577 MPa), and 9% (from 623 MPa to 567 MPa) for a corresponding mass loss of 8.5%, 11%, and 16%, respectively. S400 steel showed the same trend, with slight reduction of 2% (from 558 MPa to 548 MPa) for a mass loss of 5.2% and 2.6% (from 558 MPa to 543 MPa) for mass loss of 7.3%, respectively. However, as corrosion increased, the drop in strength reached a value of 8% (from 558 MPa to 513 MPa) for a corresponding mass loss of 8.5%.
In comparison, regarding Tempcore B450, the drop in maximum appeared stable for the entire period of exposure to corrosion. More specifically, the decrease in maximum stress was equal to 5%, from 534 MPa to 503 MPa, for the maximum recorded mass loss of 7.5%, explaining the limited effect of corrosion on the strength of steel reinforcement. In the same manner, dual-phase steel F showed a 4% reduction in maximum stress (from 484 MPa to 464 MPa) for a mass loss of up to 7.5%, while for a mass loss of 11%, the recorded maximum stress decreased to 448 MPa. Based on these results, for a mass loss of up to 7.5%, S400 steel showed a smaller decrease in terms of strength than both Tempcore B450 and dual-phase steel F. However, even though dual-phase steel F was of a lower technical class than single-phase S400 and Tempcore B450 steel and reported greater levels of corrosion damage, it demonstrated better mechanical performance in corroded conditions. In a similar manner, as corrosion increased with a recorded mass loss of up to 11%, steel F demonstrated a smaller drop in its mechanical properties than B500c steel. The enhanced mechanical performance of dual-phase steel F was facilitated by the diffusion of martensite into its entire microstructure, as opposed to Tempcore’s steel reinforcement; both B500 steel and Tempcore B450 displayed a distinct martensitic outer surface in their cross-sections.

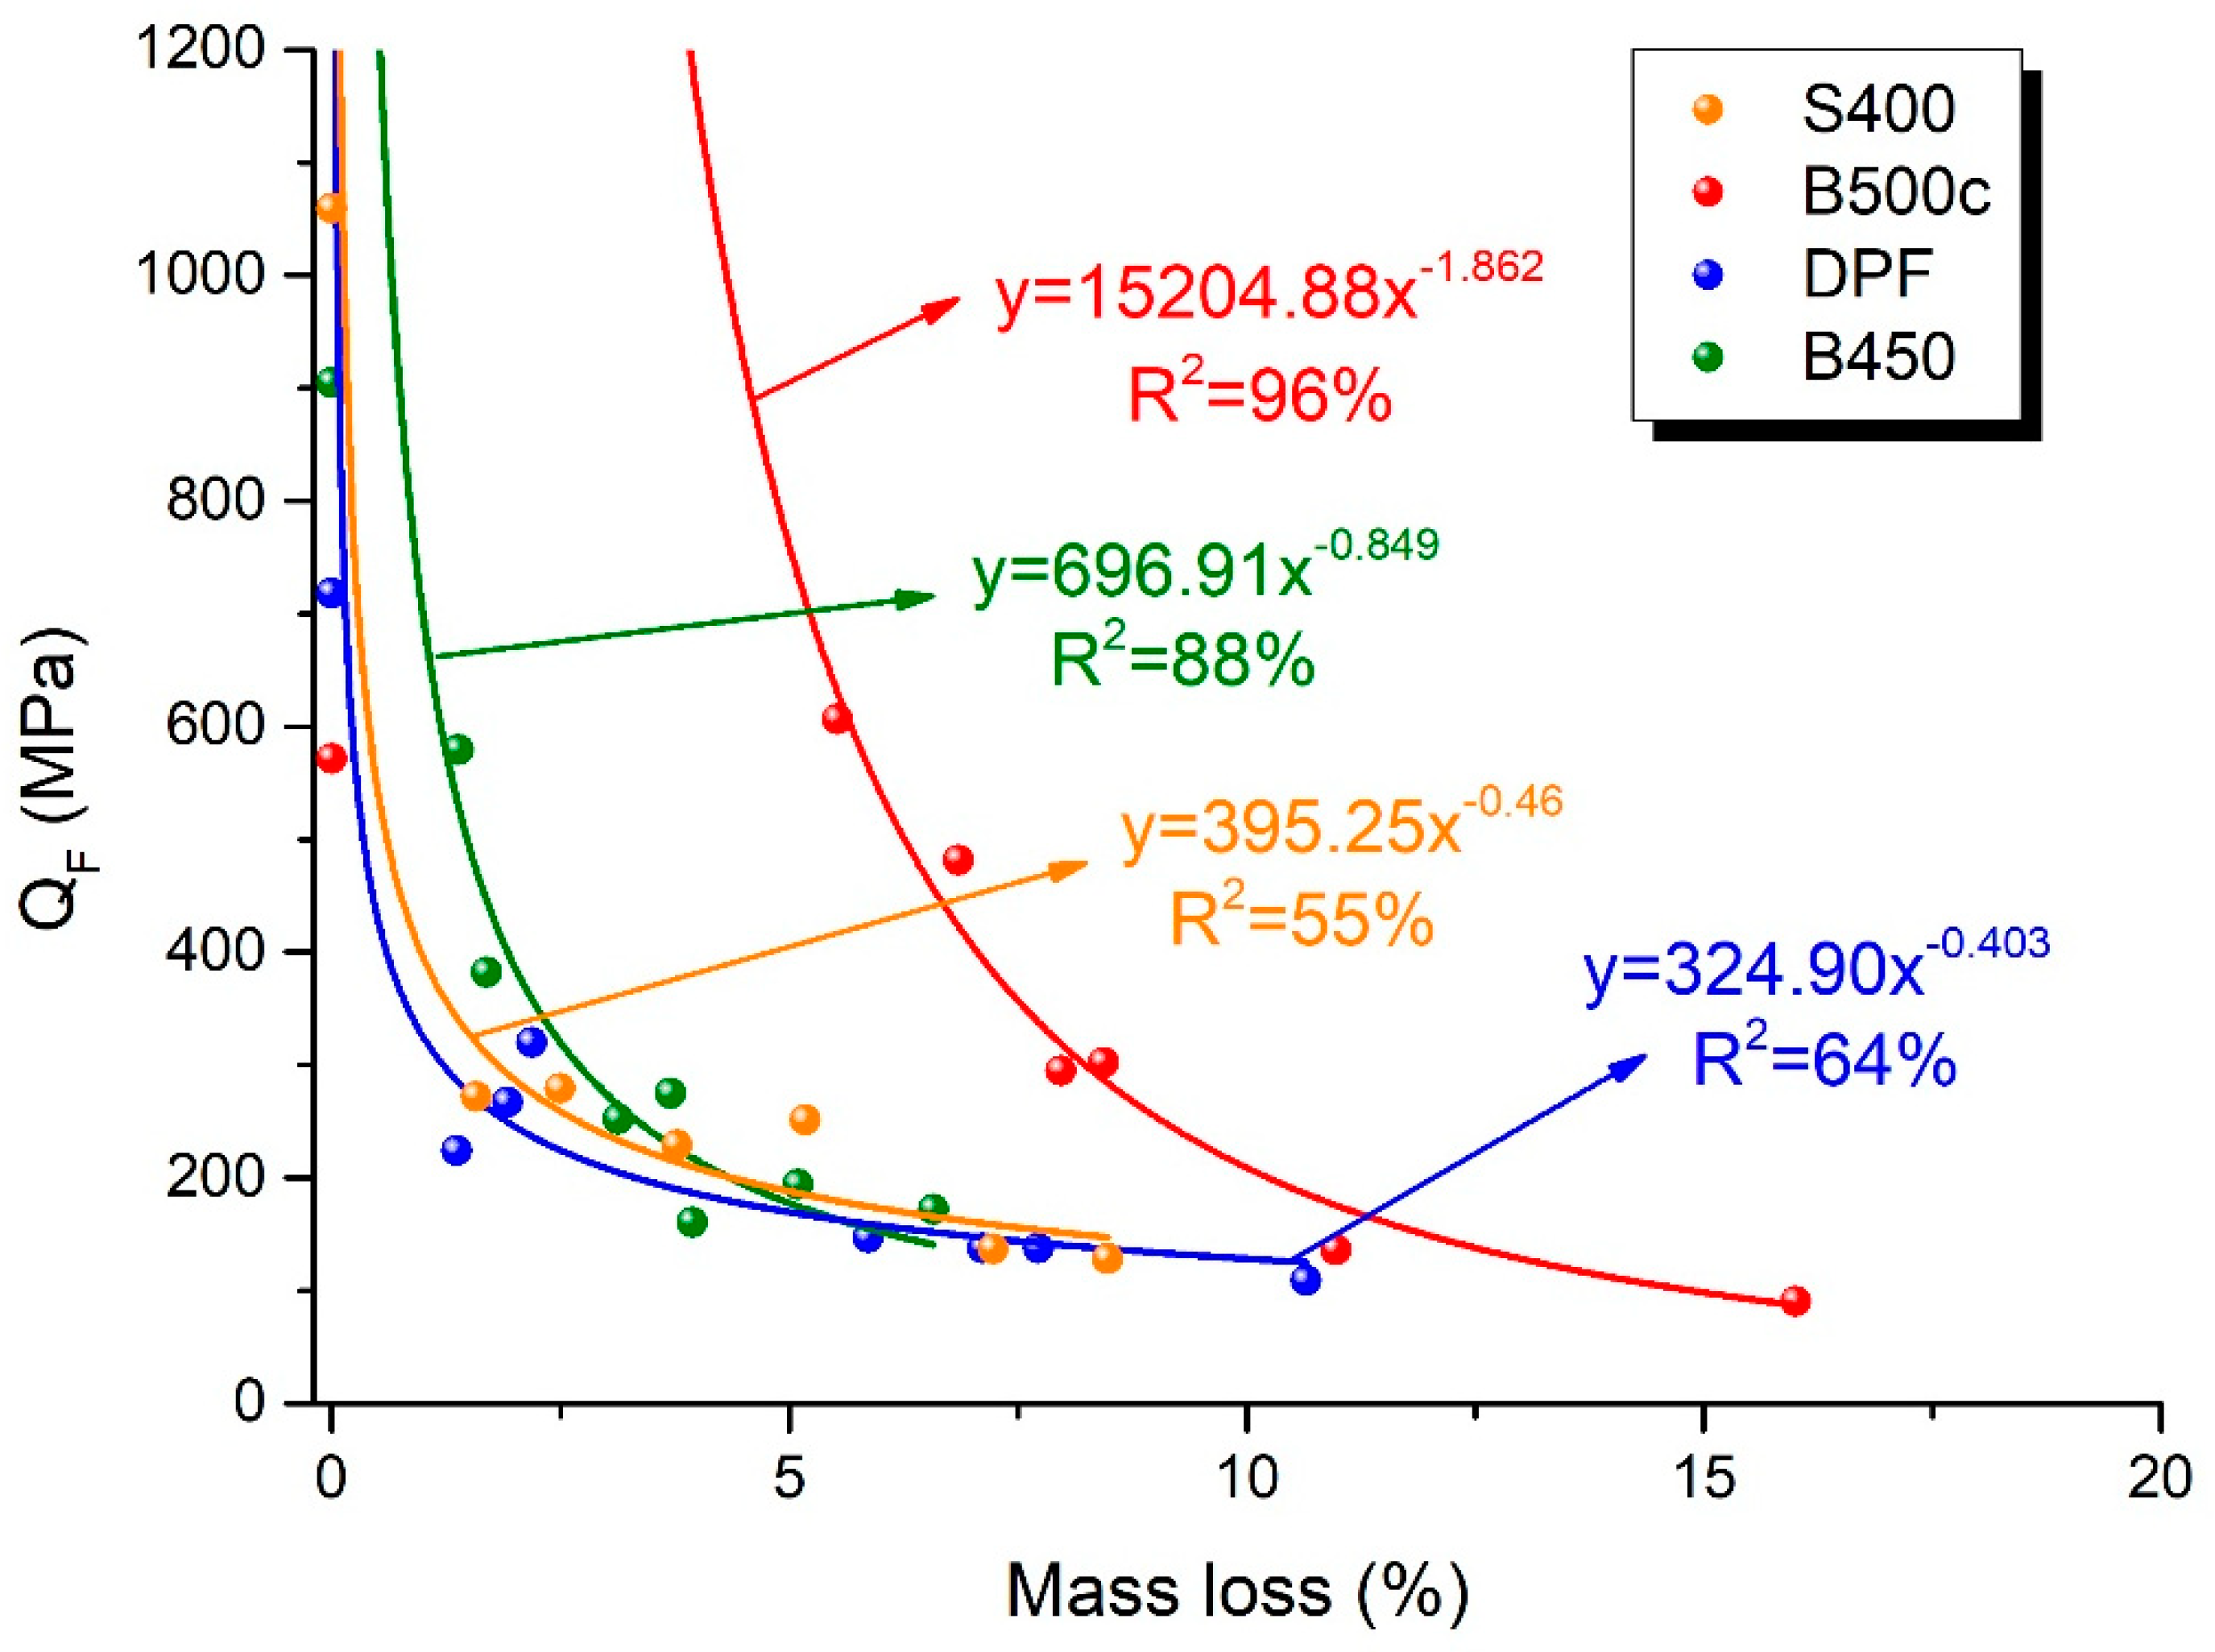
4.3. Fatigue Damage Index

Based on the abovementioned results in Section 2.3, the fatigue damage indexes of all tested steel reinforcement grades were calculated, and the derived values are presented in the following Table 8, Table 9, Table 10 and Table 11. Moreover, a non-linear regression analysis was conducted using the obtained values of the indexes in order to evaluate each grade of steel reinforcement.
Regarding the obtained results, as depicted in Figure 15, the modified fatigue indexes of single-phase S400 steel, Tempcore B450 steel, and dual-phase steel F depicted similar trends with the increase in the time of exposure to corrosion, as the service life of each grade of steel reinforcement dropped sharply until a mass loss of about 10%. However, steel B500c demonstrated a constant value for mass loss of up to 5% and thereafter steadily decreased until a mass loss of about 15%.
It is also notable that even though B500c steel exhibited the lowest level of bearing capacity in reference (non-corroded) conditions among all tested grades of steel reinforcement, Tempcore B450 steel, in the case of ±2.5% imposed deformation, sustained its mechanical properties and its ability to withstand repeated loads in corroded conditions. It can be also noted that S400 demonstrated the highest levels of bearing capacity in reference (non-corroded) conditions among all tested grades of steel reinforcement but after corrosion exposure showed an immediate decrease in its mechanical properties. Regarding the two hybrid grades of steel reinforcement, B450 outperformed dual-phase steel F in reference conditions, recording higher levels of bearing capacity. Nonetheless, with the increase in corrosion exposure, dual-phase steel F indicated better mechanical performance in the long term.

5. Conclusions

In the present study, an extensive experimental study was conducted on reinforcing steel bars, wherein corrosive damage to steel reinforcements was correlated with their loading history. From this investigation, the following outcomes were obtained.
  • Examining corrosion exposure via impressed current density, B500c showed a rapid increase in mass loss of 16% in corroded conditions after 1000 h. For the same exposure time, dual-phase F steel recorded a mass loss of about 11%, whereas Tempcore B450 demonstrated a mass loss of 7.5%.
  • The mechanical behavior of steel rebars under cyclic loadings at an imposed constant strain amplitude of ±2.5% was influenced by both the loading history of the material (i.e., the number of loading cycles) and the mass loss due to corrosion damage.
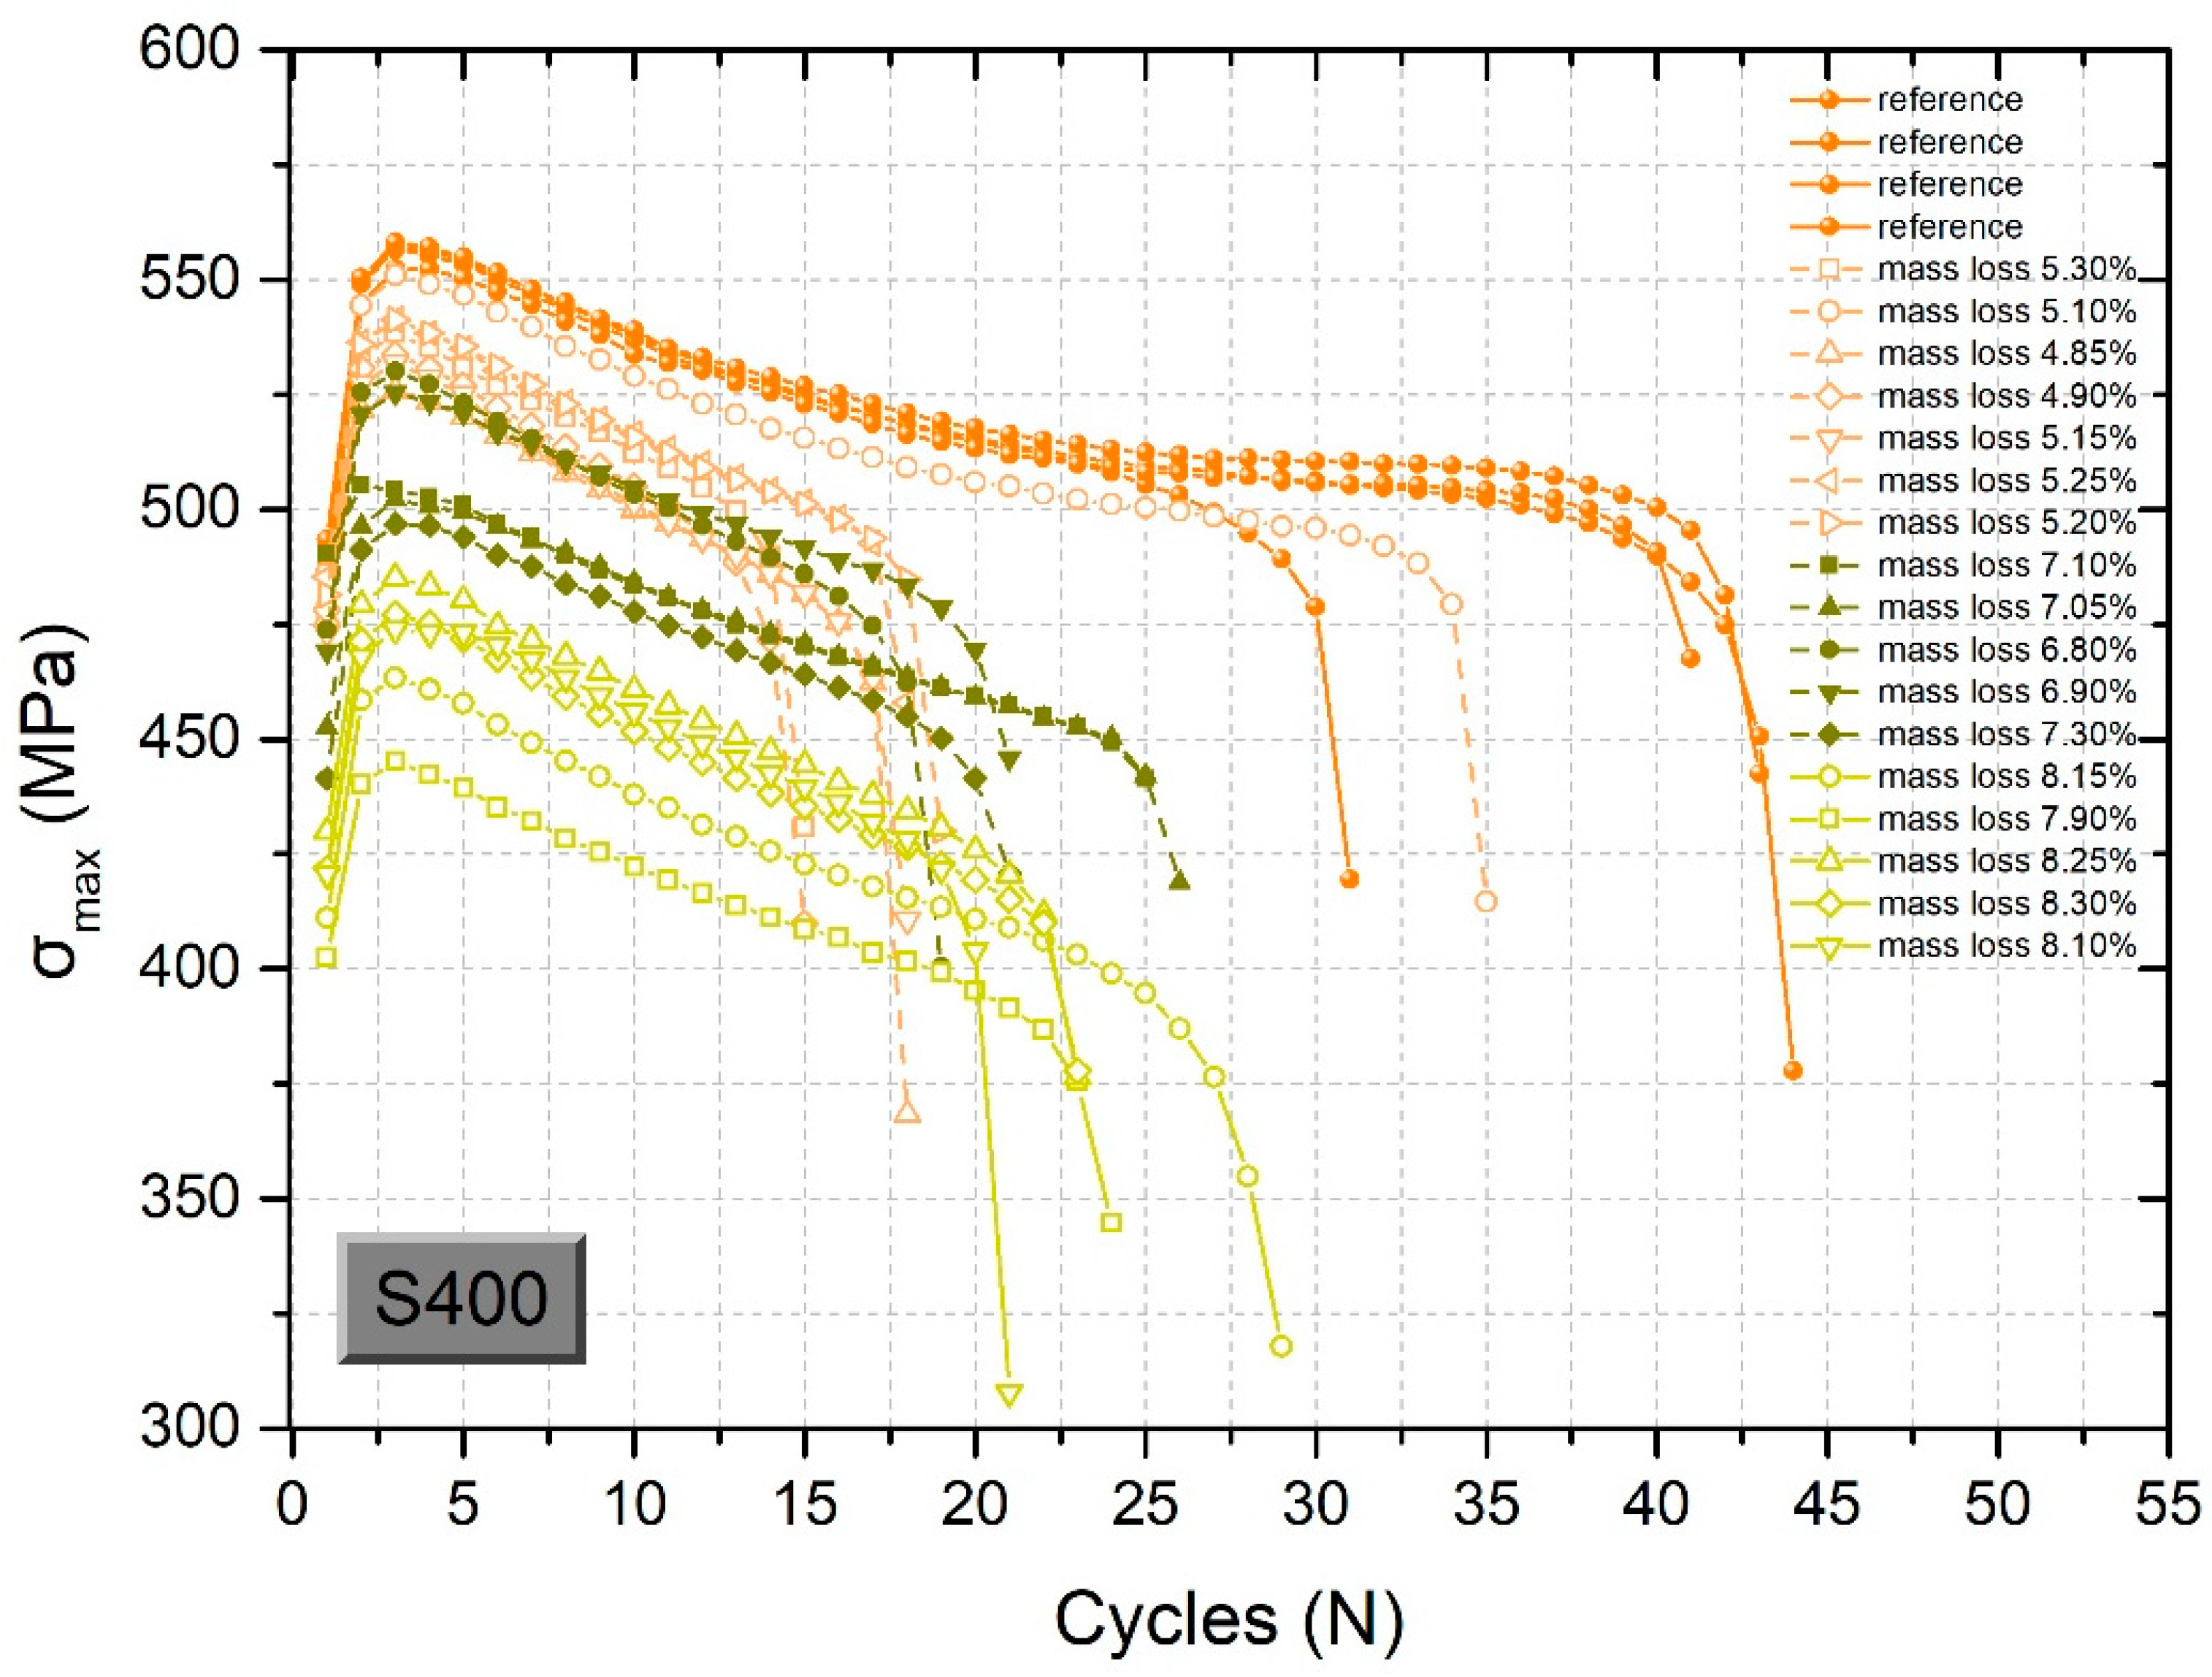
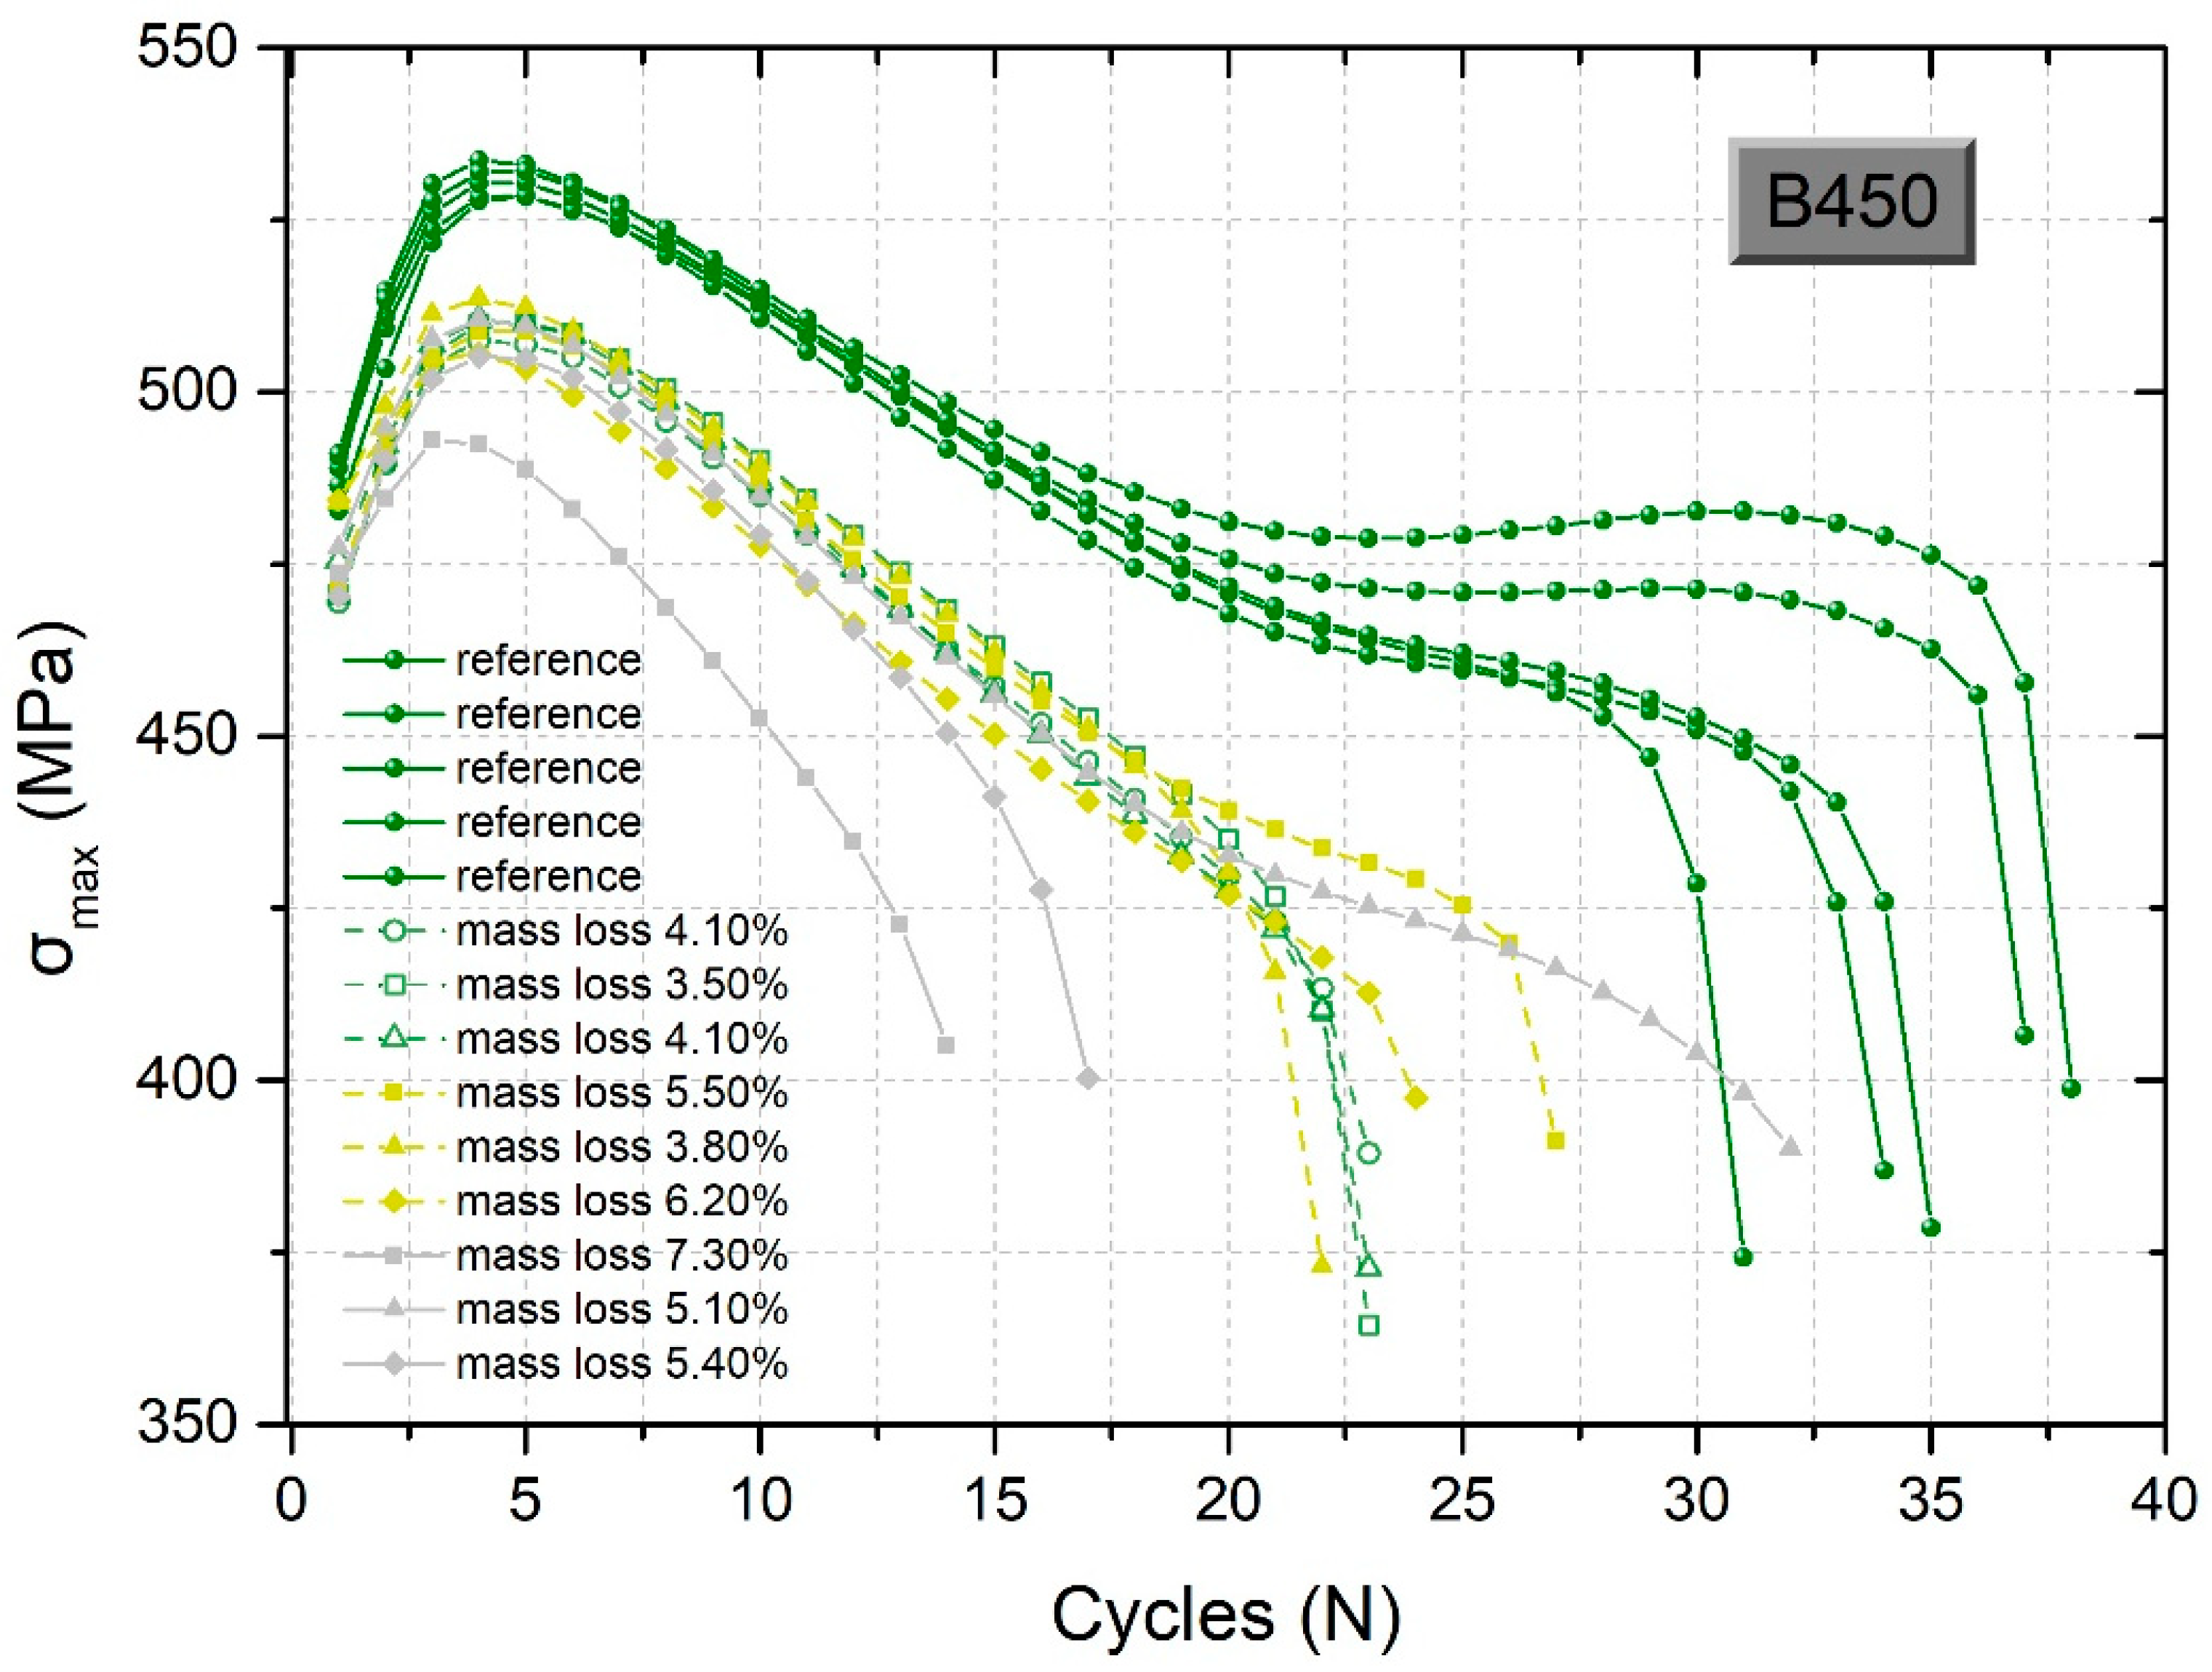
  • Steel grade S400 presented high long-term ductility capacity, since there were around 20 load cycles before failure (material life) under corroded conditions with about 8.0% mass loss, which is equal to the number of load cycles for B500c under reference (uncorroded) conditions. However, the bearing capacity of S400-grade steel was found to be affected by corrosion, as the curves of maximum stress per cycle versus loading cycles were found to be decreased and scattered as the corrosion level increased, as shown in Figure 9.
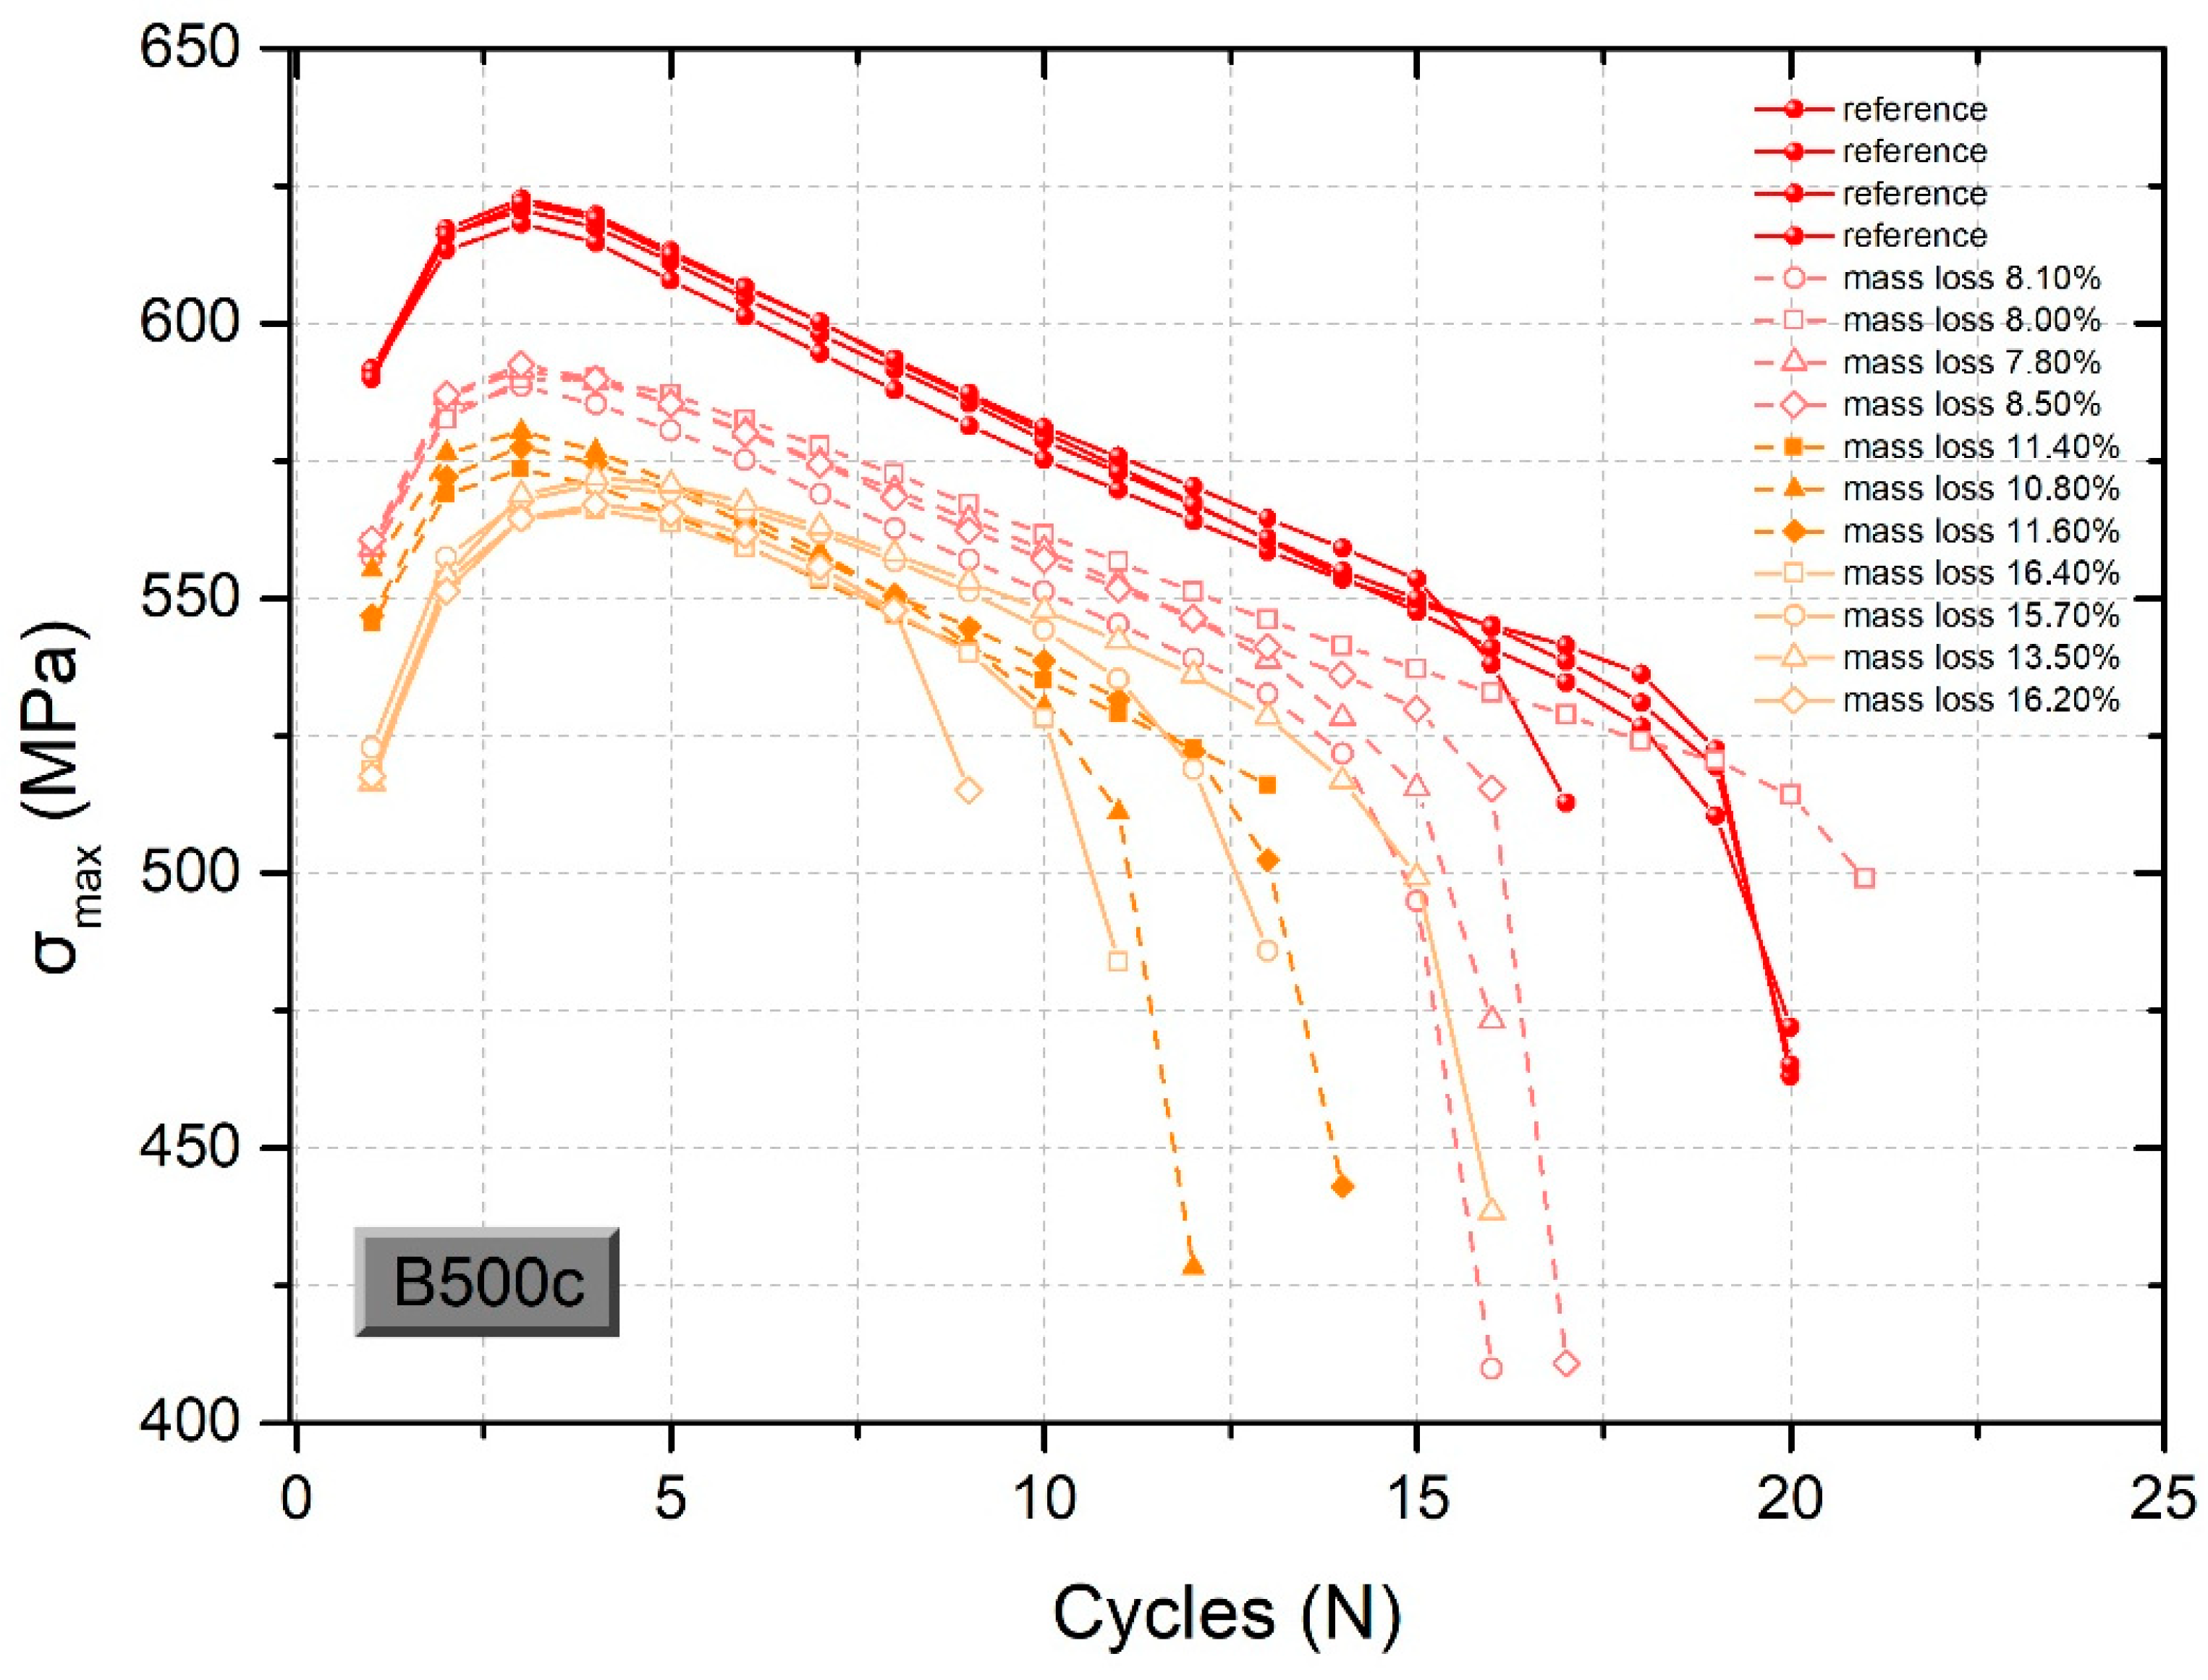
  • Observing the LCF test results, Tempcore B500c steel showed higher strength values compared to all tested grades of steel reinforcement in both reference (uncorroded) conditions and at the same corrosion level. However, the B500c-grade steel presented limited ductile capacity through the values of the total number of loading cycles before failure and the energy density, which were reduced compared to the other grades of steel reinforcement.
  • Between the two grades of steel reinforcement, B500c and S400, which have already been used in RC structures, it is obvious that the former type of reinforcement excelled in terms of ductility, but its bearing capacity was strongly affected by corrosion phenomena. On the other hand, B500c-grade steel exhibited reduced ductility in reference conditions compared to S400, but its dynamic response did not appear to be strongly degraded by corrosion damage.
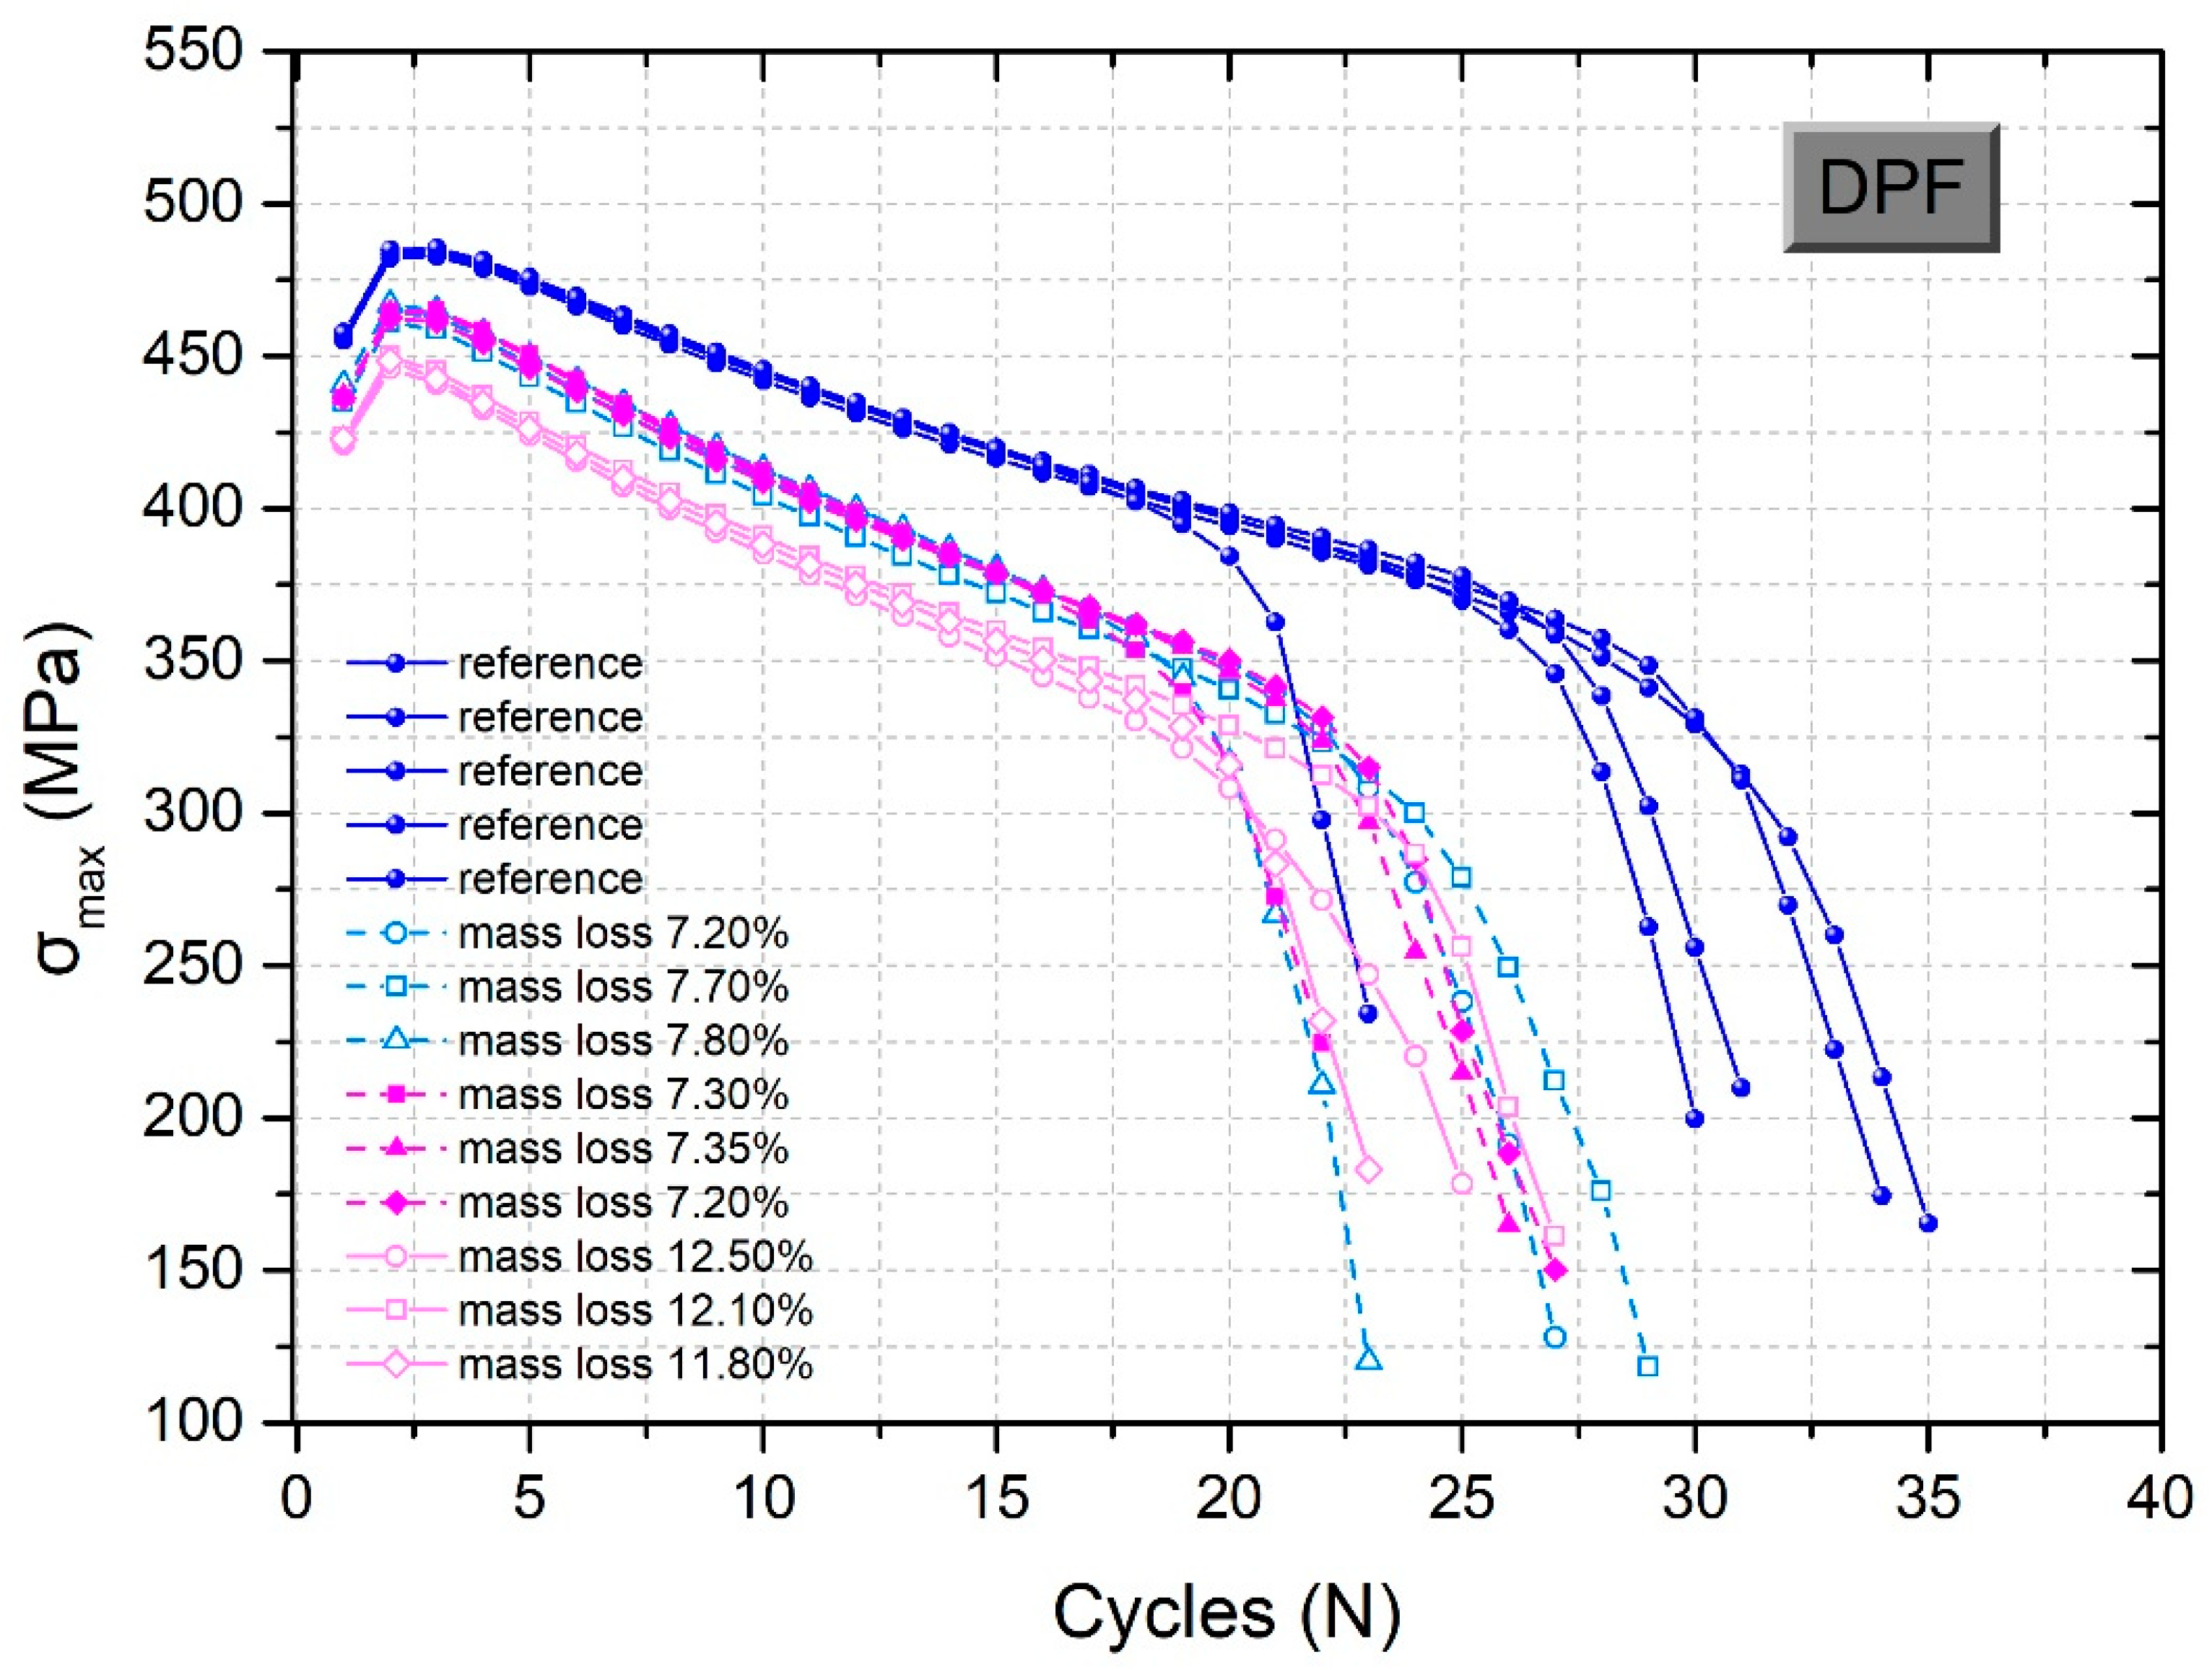
  • The hybrid dual-phase steel grade F (DPF) demonstrated obviously lower stress values than the other steel grades, which were below 400 MPa, but its ductility capacity was higher than that of the B500c grade. Furthermore, the mechanical degradation appeared smooth due to the corrosion phenomenon, since the curves of the reduction in maximum stress per load cycle (Figure 11) did not diverge.
  • The study of the long-term technical performance of the two categories—single-phase S400 and B500c—via the fatigue damage index is of great value because the majority of structures are designed and constructed with these two grades of steel reinforcement, and there is an urgent need to provide evidence of the condition of the existing reinforcing bars during the assessment of the structural adequacy of RC structures.
Future research: The present experimental study on the dynamic response of different grades of steel reinforcement, two of which have been widely used in RC structures in former decades, reveals the necessity of knowledge of the mechanical behavior of corroded steel reinforcement and subsequently the bearing capacity of existing RC structures in coastal areas. More experimental campaigns should be carried out to investigate the dynamic behavior of different grades of steel reinforcement with different strain amplitudes to simulate their response to different magnitudes of seismic loading. Nevertheless, the mixed microstructure of dual-phase steel (DPF) seems to retain a satisfactory amount of its ductility in the long term; therefore, further study on this type of microstructure is required if we are to simultaneously enhance its strength properties. Τo conclude, the present study could be regarded as an assessment tool for the technical community in the classification of different grades of steel reinforcement in quantitative terms.

Author Contributions

Methodology, M.B., K.K. and C.A.; investigation, M.B. and K.K.; writing—original draft preparation, K.K. and M.B.; writing—review and editing, C.A.; supervision, C.A. All authors have read and agreed to the published version of the manuscript.

Funding

This research received no external funding.

Data Availability Statement

The original contributions presented in the study are included in the article, further inquiries can be directed to the corresponding author.

Conflicts of Interest

The authors declare no conflicts of interest.

References

  1. Choi, Y.; Yuan, R.L. Experimental relationship between splitting tensile strength and compressive strength of GFRC and PFRC. Cem. Concr. Res. 2005, 35, 1587–1591. [Google Scholar] [CrossRef]
  2. Kent, D.C.; Park, R. Flexural members with confined concrete. J. Struct. Div. ASCE 1971, 97, 1969–1990. [Google Scholar] [CrossRef]
  3. Wang, J.; Yi, X.; Liu, Q.; Fang, X. Seismic performance of steel-reinforced concrete columns with Q690 high-strength steel. Materials 2022, 15, 2979. [Google Scholar] [CrossRef] [PubMed] [PubMed Central]
  4. Kashani, M.M.; Alagheband, P.; Khan, R.; Davis, S.A. Impact of corrosion on low-cycle fatigue degradation of reinforcing bars with the effect of inelastic buckling. Int. J. Fatigue 2015, 77, 174–185. [Google Scholar] [CrossRef]
  5. Apostolopoulos, C.; Konstantopoulos, G.; Koulouris, K. Seismic resistance prediction of corroded S400 (BSt420) reinforcing bars. Int. J. Struct. Integr. 2018, 9, 119–138. [Google Scholar] [CrossRef]
  6. DIN 488-3; Reinforcing Steels—Reinforcing Steel in Coils, Steel Wire. German Institute for Standardization: Berlin, Germany, 2009.
  7. Nettis, A.; Nettis, A.; Ruggieri, S.; Uva, G. Corrosion-induced fragility of existing prestressed concrete girder bridges under traffic loads. Eng. Struct. 2024, 314, 118302. [Google Scholar] [CrossRef]
  8. Fernandez, I.; Berrocal, C.G. Mechanical properties of 30 year-old naturally corroded steel reinforcing bars. Int. J. Concr. Struct. Mater. 2019, 13, 9. [Google Scholar] [CrossRef]
  9. Papadopoulos, M.P.; Apostolopoulos, C.A.; Alexopoulos, N.D.; Pantelakis, S.G. Effect of salt spray corrosion exposure on the mechanical performance of different technical class reinforcing steel bars. Mater. Des. 2007, 28, 2318–2328. [Google Scholar] [CrossRef]
  10. Kashani, M.M.; Crewe, A.J.; Alexander, N.A. Nonlinear stress–strain behaviour of corrosion-damaged reinforcing bars including inelastic buckling. Eng. Struct. 2013, 48, 417–429. [Google Scholar] [CrossRef]
  11. Meda, A.; Mostosi, S.; Rinaldi, Z.; Riva, P. Experimental evaluation of the corrosion influence on the cyclic behaviour of RC columns. Eng. Struct. 2014, 76, 112–123. [Google Scholar] [CrossRef]
  12. Koulouris, K.; Apostolopoulos, C. Study of the residual bond strength between corroded steel bars and concrete—A comparison with the recommendations of FIB Model Code 2010. Metals 2021, 11, 757. [Google Scholar] [CrossRef]
  13. Coccia, S.; Imperatore, S.; Rinaldi, Z. Influence of corrosion on the bond strength of steel rebars in concrete. Mater. Struct. 2016, 49, 537–551. [Google Scholar] [CrossRef]
  14. Fang, C.; Lundgren, K.; Chen, L.; Zhu, C. Corrosion influence on bond in reinforced concrete. Cem. Concr. Res. 2004, 34, 2159–2167. [Google Scholar] [CrossRef]
  15. Apostolopoulos, C.A.; Papadopoulos, M.P. Tensile and low cycle fatigue behavior of corroded reinforcing steel bars S400. Constr. Build. Mater. 2007, 21, 855–864. [Google Scholar] [CrossRef]
  16. Apostolopoulos, C.A.; Papadopoulos, M.P.; Pantelakis, S.G. Tensile behavior of corroded reinforcing steel bars BSt 500s. Constr. Build. Mater. 2006, 20, 782–789. [Google Scholar] [CrossRef]
  17. Apostolopoulos, C.A. The influence of corrosion and cross-section diameter on the mechanical properties of B500c steel. J. Mater. Eng. Perform. 2009, 18, 190–195. [Google Scholar] [CrossRef]
  18. Fernandez, I.; Bairán, J.M.; Marí, A.R. Corrosion effects on the mechanical properties of reinforcing steel bars: Fatigue and σ–ε behavior. Constr. Build. Mater. 2015, 101, 772–783. [Google Scholar] [CrossRef]
  19. Caprili, S.; Moersch, J.; Salvatore, W. Mechanical performance versus corrosion damage indicators for corroded steel reinforcing bars. Adv. Mater. Sci. Eng. 2015, 2015, 739625. [Google Scholar] [CrossRef]
  20. Caprili, S.; Salvatore, W. Mechanical performance of steel reinforcing bars in uncorroded and corroded conditions. Data Brief 2018, 18, 1677–1695. [Google Scholar] [CrossRef]
  21. Caprili, S.; Salvatore, W.; Valentini, R. Corroded TempCore® vs. dual-phase steel reinforcing bars. Constr. Build. Mater. 2021, 277, 122301. [Google Scholar] [CrossRef]
  22. Imperatore, S. Mechanical properties decay of corroded reinforcement in concrete—An overview. Corros. Mater. Degrad. 2022, 3, 210–220. [Google Scholar] [CrossRef]
  23. Rusteel. RFS-PR-8017 Effects of Corrosion on Low-Cycle Fatigue (Seismic) Behaviour of High Strength Steel Reinforcing Bars (2009–2012); European Commission: Brussels, Belgium, 2014. [Google Scholar]
  24. NEWREBAR. NEW Dual-Phase Steel Reinforcing Bars for Enhancing Capacity and Durability of Anti-Seismic Moment Resisting Frames (2015–2019); The Research Fund for Coal and Steel (RFSR-CT-2015-00023) of European Commission; European Commission: Brussels, Belgium, 2020. [Google Scholar]
  25. ASTM Standard B117; Standard Practice for Operating Slat Spray (Fog) Apparatus. ASTM International: West Conshohocken, PA, USA, 1997. [CrossRef]
  26. BS EN 206-1; Concrete. Part 1: Specification, Performance, Production and Conformity. British Standards Institution (BSI): London, UK, 2000.
  27. Katona, R.M.; Tokuda, S.; Perry, J.; Kelly, R.G. Design, construction, and validation for in-situ water layer thickness determination during accelerated corrosion testing. Corros. Sci. 2020, 175, 108849. [Google Scholar] [CrossRef]
  28. Jia, J.X.; Atrens, A.; Song, G.; Muster, T.H. Simulation of galvanic corrosion of magnesium coupled to a steel fastener in NaCl solution. Mater. Corros. 2005, 56, 468–474. [Google Scholar] [CrossRef]
  29. Valdez, B.; Ramirez, J.; Eliezer, A.; Schorr, M.; Ramos, R.; Salinas, R. Corrosion assessment of infrastructure assets in coastal seas. J. Mar. Eng. Technol. 2016, 15, 124–134. [Google Scholar] [CrossRef]
  30. ASTM Standard G1-03; Standard Practice for Preparing, Cleaning, and Evaluating Corrosion Test Specimens. ASTM International: West Conshohocken, PA, USA, 2011.
  31. Mander, J.; Panthaki, F.; Kasalanati, A. Low-cycle fatigue behavior of reinforcing steel. J. Mater. Civ. Eng. 1994, 6, 453–468. [Google Scholar] [CrossRef]
  32. Sheng, G.M.; Gong, S.H. Investigation of low cycle fatigue behavior of building structural steels under earthquake loading. Acta Metall. Sin. Engl. Lett. 1997, 10, 51–55. [Google Scholar]
  33. El-Bahy, A.; Kunnath, S.; Stone, W.; Taylor, A. Cumulative seismic damage of circular bridge columns: Variable amplitude tests. ACI Struct. J. 1999, 96, 711–719. [Google Scholar]
  34. Loporcaro, G.; Cuevas, A.; Pampanin, S.; Kral, M.V. Monotonic and low-cycle fatigue properties of earthquake-damaged New Zealand steel reinforcing bars. The experience after the Christchurch 2010/2011 earthquakes. Procedia Struct. Integr. 2018, 11, 194–201. [Google Scholar] [CrossRef]
  35. Tripathi, M.; Dhakal, R.P.; Dashti, F.; Massone, L.M. Low-cycle fatigue behaviour of reinforcing bars including the effect of inelastic buckling. Constr. Build. Mater. 2018, 190, 1226–1235. [Google Scholar] [CrossRef]
  36. Alexopoulos, N.D.; Pantelakis, S.G. A new quality index for characterizing aluminum cast alloys with regard to aircraft structure design requirements. Metall. Mater. Trans. A 2004, 35, 301–308. [Google Scholar] [CrossRef]
  37. Alexopoulos, N.D.; Apostolopoulos, C.A.; Papadopoulos, M.P.; Pantelakis, S.G. Mechanical performance of BStIV grade steel bars with regard to the long-term material degradation due to corrosion damage. Constr. Build. Mater. 2007, 21, 1362–1369. [Google Scholar] [CrossRef]
  38. Basdeki, M.; Apostolopoulos, C. Mechanical behavior evaluation of Tempcore and hybrid reinforcing steel bars via a proposed fatigue damage index in long terms. Metals 2021, 11, 834. [Google Scholar] [CrossRef]
  39. Basdeki, M.; Apostolopoulos, C. The effect of the shot blasting process on the dynamic response of steel reinforcement. Metals 2022, 12, 1048. [Google Scholar] [CrossRef]
Figure 1. Discrete phases of S400 (BSt420s) rebars wherein light color indicates ferrite and dark color indicates perlite.
Buildings 14 02598 g001
Figure 2. Typical view of cross-section of Tempcore rebars (B500c and B450c) with discrete phases of martensite, bainite, and ferrite–pearlite.
Buildings 14 02598 g002
Figure 3. Section of hybrid dual-phase F (DPF) steel (a) with a homogeneous mixed microstructure in which hard martensite grains are embedded in a ductile ferrite matrix (b).
Buildings 14 02598 g003
Figure 4. Schematic representation of the salt spray chamber (left) [27] and experimental setup in the laboratory (right).
Buildings 14 02598 g004
Figure 5. Schematic representation of the electro-corrosion setup (left) and the experimental setup in the laboratory (right).
Buildings 14 02598 g005
Figure 6. Specimens before corrosion exposure (left) and upon completion of corrosion tests (right).
Buildings 14 02598 g006
Figure 7. Set up of LCF tests (left) and strain waveforms received as input (right).
Buildings 14 02598 g007
Figure 8. Percentage mass loss of all tested grades of steel reinforcement.
Buildings 14 02598 g008
Figure 9. Depiction of maximum stress, σmax,ref, of the non-corroded steel bar for all types of steel reinforcement.
Buildings 14 02598 g009
Figure 10. Depiction of the maximum stress σmax,ref of the non-corroded steel bars (reference) and the maximum stress σmax,cor of the corroded steel bar for each level of corrosion expressed in mass loss for steel class S400.
Buildings 14 02598 g010
Figure 11. Depiction of the maximum stress σmax,ref of the non-corroded steel bars (reference) and the maximum stress σmax,cor of the corroded steel bars for each level of corrosion expressed in mass loss for steel class B500c.
Buildings 14 02598 g011
Figure 12. Depiction of the maximum stress σmax,ref of the non-corroded steel bars (reference) and the maximum stress σmax,cor of the corroded steel bars for each level of corrosion expressed in mass loss for steel class DPF.
Buildings 14 02598 g012
Figure 13. Depiction of the maximum stress σmax,ref of the non-corroded steel bars (reference) and the maximum stress σmax,cor of the corroded steel bars for each level of corrosion expressed in mass loss for steel class B450.
Buildings 14 02598 g013
Figure 14. Comparison of the mean values of the maximum stress σmax,ref of the non-corroded steel bars (reference) and the maximum stress σmax,cor of the corroded steel bars for each level of corrosion expressed in mass loss for all tested grades of steel reinforcement.
Buildings 14 02598 g014
Figure 15. Modified fatigue index QF values of all tested steel grades for a strain amplitude of ±2.5%.
Buildings 14 02598 g015
Table 1. Chemical compositions of steel rebars S400 (BSt420s), Tempcore B500c, Tempcore B450, and dual-phase F (DPF).
Steel TypeCMn SiPSCuNCrNiMoVCeq
(%)(%)(%)(%)(%)(%)(%)(%)(%)(%)(%)(%)
S4000.350.940.260.0130.0260.420.0100.160.100.0230.002-
B500c0.220.870.1930.0150.0470.261-0.0820.1060.0140.0010.409
B4500.2330.6460.1380.01840.04220.3710.01170.0800.1130.0187-0.393
DPF0.1600.9990.1660.03030.00990.3720.01180.1660.1370.0303-0.400
Table 2. Percentage mass loss vs. corrosion time of electro-corrosion for steel grades B500c, B450, and DPF.
Corrosion Time
(h)
Mass Loss (%)
B500cB450DPF
0---
100-1.391.36
200-1.671.91
2505.53--
300-2.542.24
4006.863.755.97
5007.97--
6008.443.977.04
80010.985.067.61
100016.017.4410.73
Table 3. Percentage mass loss vs. corrosion time in salt spray chamber for steel grade S400.
Corrosion Time
(Days)
Mass Loss (%)
S400
0-
101.58
202.50
303.77
455.18
607.23
908.48
Table 4. Results of LCF tests on single-phase S400 steel rebars (mean values).
Corrosion Time (Days)Mass Loss (%)Cycles (N)σmax (MPa)Energy Density
Wd (MPa)
0-43542.091059.00
101.5827540.97723.00
202.5021535.32725.00
303.7726544.55693.50
455.1824556.17628.75
607.2324543.25627.40
908.4824512.92587.00
Table 5. Results of LCF tests on Tempcore B500c steel rebars (mean values).
Corrosion Time (h)Mass Loss (%)Cycles (N)σmax (MPa)Energy Density
Wd (MPa)
0-20620.87571.85
2505.5322598.91623.80
4006.8621593.46579.03
5007.9718588.11495.35
6008.4418590.65497.84
80010.9814577.12388.11
100016.0113568.96321.95
Table 6. Results of LCF tests on dual-phase DPF (mean values).
Corrosion Time (h)Mass Loss (%)Cycles (N)σmax (MPa)Energy Density
Wd (MPa)
0-33484.20652.67
1001.3629472.62621.72
2001.9130492.59657.53
3002.2433477.39655.64
4005.9726462.06543.77
6007.0425464.05532.34
8007.6125463.80525.82
100010.7325448.08510.33
Table 7. Results of LCF tests on Tempcore B450 (mean values).
Corrosion Time (h)Mass Loss (%)Cycles (N)σmax (MPa)Dissipated Energy Wd (MPa)
0-36530.62789.92
1001.3935528.62825.37
2001.6733442.52774.86
3002.5428508.46654.16
4003.7528525.08557.88
6003.9723509.31568.13
8005.0625509.37596.23
10007.4422502.88529.19
Table 8. Calculations of the quality index of steel S400 (mean values).
Corrosion Time (Days)Mass Loss (%)Factor KDFactor QoFatigue Index
Qd
0-1.00001059.001059.00
101.580.7969338.07272.21
202.500.7802361.01278.92
303.770.8074283.08228.86
455.180.8423290.83251.08
607.230.8038171.31136.98
908.480.7164178.95128.35
Table 9. Calculations of the quality index of steel B500c (mean values).
Corrosion Time (h)Mass Loss (%)Factor KDFactor QoFatigue Index
Qd
0-1.0000571.85571.85
2505.530.7756783.42606.33
4006.860.7753620.47481.60
5007.970.7663385.57295.08
6008.440.7594397.35302.25
80010.980.7511182.67136.30
100016.010.7321123.5190.33
Table 10. Calculations of the quality index of dual-phase steel F (mean values).
Corrosion Time (h)Mass Loss (%)Factor KDFactor QoFatigue Index
Qd
0-1.0000718.46718.46
1001.360.7821285.43223.97
2001.910.8147392.37266.62
3002.240.7917428.86319.66
4005.970.7308200.53146.72
6007.040.7350187.57137.69
8007.610.7340187.18137.35
100010.730.686158.37108.58
Table 11. Calculations of the quality index of steel B450 (mean values).
Corrosion Time (h)Mass Loss (%)Factor KDFactor QoFatigue Index
Qd
0-1.0000905.02905.02
1001.390.8079713.97579.18
2001.670.6628573.82381.74
3002.540.7619329.37251.79
4003.750.7299375.82274.74
6003.970.735217.96160.69
8005.060.744259.51193.65
10007.440.731233.93172.07
Disclaimer/Publisher’s Note: The statements, opinions and data contained in all publications are solely those of the individual author(s) and contributor(s) and not of MDPI and/or the editor(s). MDPI and/or the editor(s) disclaim responsibility for any injury to people or property resulting from any ideas, methods, instructions or products referred to in the content.

