Abstract
Photovoltaic double-skin glass is a low-carbon energy-saving curtain wall system that uses ventilation heat exchange and airflow regulation to reduce heat gain and generate a portion of electricity. By developing a theoretical model of the ventilated photovoltaic curtain wall system and conducting numerical simulations, this study analyzes the variation patterns of the power generation efficiency of photovoltaic glass for different inclination angles, seasons, thermal ventilation spacing, and glass transmittance in the photovoltaic double-skin curtain wall system. The results indicate a positive correlation between the surface temperature of photovoltaic glass and both ground temperature and solar radiation intensity. Additionally, photovoltaic power generation efficiency is generally higher in spring and autumn than in summer and winter, with enhanced power generation performance observed. At an inclination angle of 40°, photovoltaic panels receive optimal solar radiation and, consequently, produce the maximum electricity. Furthermore, as the ventilation spacing increases, the efficiency of power generation initially rises, reaching a peak at approximately 0.4 m, where it is 0.4% greater than at a spacing of 0.012 m. For a photovoltaic glass transmittance of 40%, the highest photovoltaic power generation efficiency is 63%, while the average efficiency is 35.3%. This has significant implications for the application and promotion of photovoltaic double-skin glass curtain walls.
1. Introduction
To address the urgent need to combat global warming, China has set targets for achieving “carbon peak and carbon neutrality” [1]. Due to their high heat transfer coefficient, lower sealing performance, and greater transparency, traditional building envelopes featuring glass curtain walls are responsible for approximately 40–50% of the total energy consumption of building envelopes. This presents substantial challenges in achieving energy conservation and emission reduction objectives [2,3]. The use of renewable energy in reducing building energy consumption may allow for these goals to be achieved. Solar energy is a clean and inexhaustible resource in nature; it is considered an ideal energy source. Against this backdrop, the integration of solar photovoltaic systems with buildings, which is known as Building Integrated Photovoltaics (BIPV), has been proposed. BIPV seamlessly combines the building with the photovoltaic system, which allows for a reduction in indoor heat gain and the generation of electricity for the building’s own use, making it a type of green building [4,5].
The combination of photovoltaics (PV) with buildings mainly involves the roof and exterior walls, with a primary application on the facade in the form of photovoltaic curtain walls [6]. Studies have been conducted on the energy-saving potential of photovoltaic skin curtain walls [2,7]. Solar power leads in energy generation; innovations in BIPV are transforming building exteriors, yet their penetration into the construction sector remains low. A new model has explored the integration of PV systems in buildings, applied to Swiss data showing BIPV levels of innovation and traits, impacting scientific research and the construction industry [8]. A multifunctional and multi-zoned photovoltaic curtain wall design has also been proposed by integrating them with a photovoltaic thermal system that uses a thermos catalytic air process [9,10] and optimized design methods [11]. Compared with traditional photovoltaic ventilated curtain walls, this design achieved higher power generation, reduced heating and cooling loads, and decreased solar heat gain from the curtain walls. Huang et al. [12] studied a novel vacuum photovoltaic insulating glass unit (VPV IGU) in Hong Kong. Their results showed that, during the summer, compared with the traditional double-layer transparent glass system, the VPV IGU reduced heat gain by 81.63% and increased power generation by 31.94%. Wang et al. [13] conducted a comparative study between photovoltaic double-skin curtain walls and photovoltaic insulating glass units. Their results demonstrated the significant energy-saving potential of integrated photovoltaic solutions. This shows that photovoltaic curtain walls can outperform traditional insulating glass in terms of energy efficiency, which provides a strong rationale for adopting them over traditional energy-saving measures.
In recent years, many studies have been conducted on double-skin facade (DSF) structures. This type of facade meets aesthetic requirements and reduces heat gain and heat loss in buildings, which allows for a reduction in their energy consumption [14,15]. The ventilated DSFs can reduce solar heat absorption in the summer and provide thermal insulation in the winter. In addition, the narrower cavity in DSFs can produce a better chimney effect [7,16]; the airflow behavior during natural ventilation should to be studied further. Guo et al. [17] conducted experimental tests on naturally ventilated double-layer photovoltaic windows in different climatic regions. The coupling of the ventilated double-glazed facade with a photovoltaic system allowed for the reduction of energy consumption and the generation of electricity [18,19]. Tina et al. [20] developed a ventilated active glass-glass facade installed with double-sided photovoltaic modules, which improved the power output by approximately 5% compared with a non-ventilated single crystal BIPV facade. He et al. [21] compared the energy performance between double-layer and single-layer photovoltaic windows. The results showed that the double-layered photovoltaic windows outperform the single-layered ones. Peng et al. [22,23] developed a novel ventilated PV-DSF and conducted experiments to evaluate its energy performance for different ventilation modes. Compared with the closed DSF, the naturally ventilated DSF can use the air circulation within the cavity to remove the heat accumulated in it, cool down the window, and reduce the heat entering the indoor space. Compared with the mechanically ventilated DSF, the natural ventilation does not consume energy and it can significantly enhance the heat exchange, achieving the purpose of ventilation and cooling.
The transmittance of photovoltaic glass is related to the photovoltaic coverage ratio and the material thickness of the photovoltaic modules. It affects the proportion of solar radiation that is absorbed, transmitted, and re-radiated, which affects the temperature of the photovoltaic modules and thus the power generation efficiency [24]. Chow et al. [25] deduced that a solar cell transmittance in the range of 45–55% can achieve the best energy-saving effect in Hong Kong. Japan developed the semi-transparent photovoltaic technology, where the transmittance of the semi-transparent solar photovoltaic glass can be adjusted by changing the area of the holes [26]. Miyazaki et al. [27] used EnergyPlus to study the impacts of photovoltaic window transmittance and the window-to-wall ratio of the heating and cooling load, daylighting, and power generation of office buildings. Their results showed that under Tokyo’s climate conditions, 40% solar cell transmittance and a window-to-wall ratio of 50% achieved the lowest electricity consumption.
The power generation efficiency of photovoltaic glass depends on many factors, such as the ambient temperature [28], solar irradiance [29], and photovoltaic capacity [30]. Hong et al. [31] offer valuable insights into the operational performance of a nearly Zero Energy Building (nZEB) over the course of a decade, underscoring the importance of continuous analysis, maintenance, and strategic design improvements to achieve and sustain net-zero energy status. The integration of PV with double-skin facade structures results in more complex airflow distribution characteristics, which may affect PV thermal transfer [32,33].
Numerous studies have focused on optimizing photovoltaic double-skin facade structures, yet research examining the various factors affecting the power generation efficiency of photovoltaic panels remains limited. This paper provides a detailed analysis of how the temperatures of photovoltaic modules and substrate glass fluctuate with changes in solar radiation intensity, wind speed, and ground temperature within such systems. It also examines how the inclination angle of the photovoltaic glass influences efficiency and explores the seasonal variations in photovoltaic glass power generation across different climates. Furthermore, it delves into the effects of ventilation spacing on the façade’s photovoltaic glass and assesses how changes in glass transmittance levels can alter power generation efficiency. By incorporating factors like tilt angle, ventilation spacing, and glass transmittance, researchers have developed optimized design strategies for photovoltaic double-skin glass curtain walls, which enhance their performance and energy efficiency. This study not only identifies crucial elements for maximizing power generation efficiency but also enables the fine-tuning of parameters to bolster building energy efficiency. This investigation marks a significant step forward in promoting the application of these innovative curtain walls in architecture, championing sustainability, and supporting the advancement of sustainable development goals.
2. Research Method
2.1. Ventilated Photovoltaic Glass Curtain Wall System Model
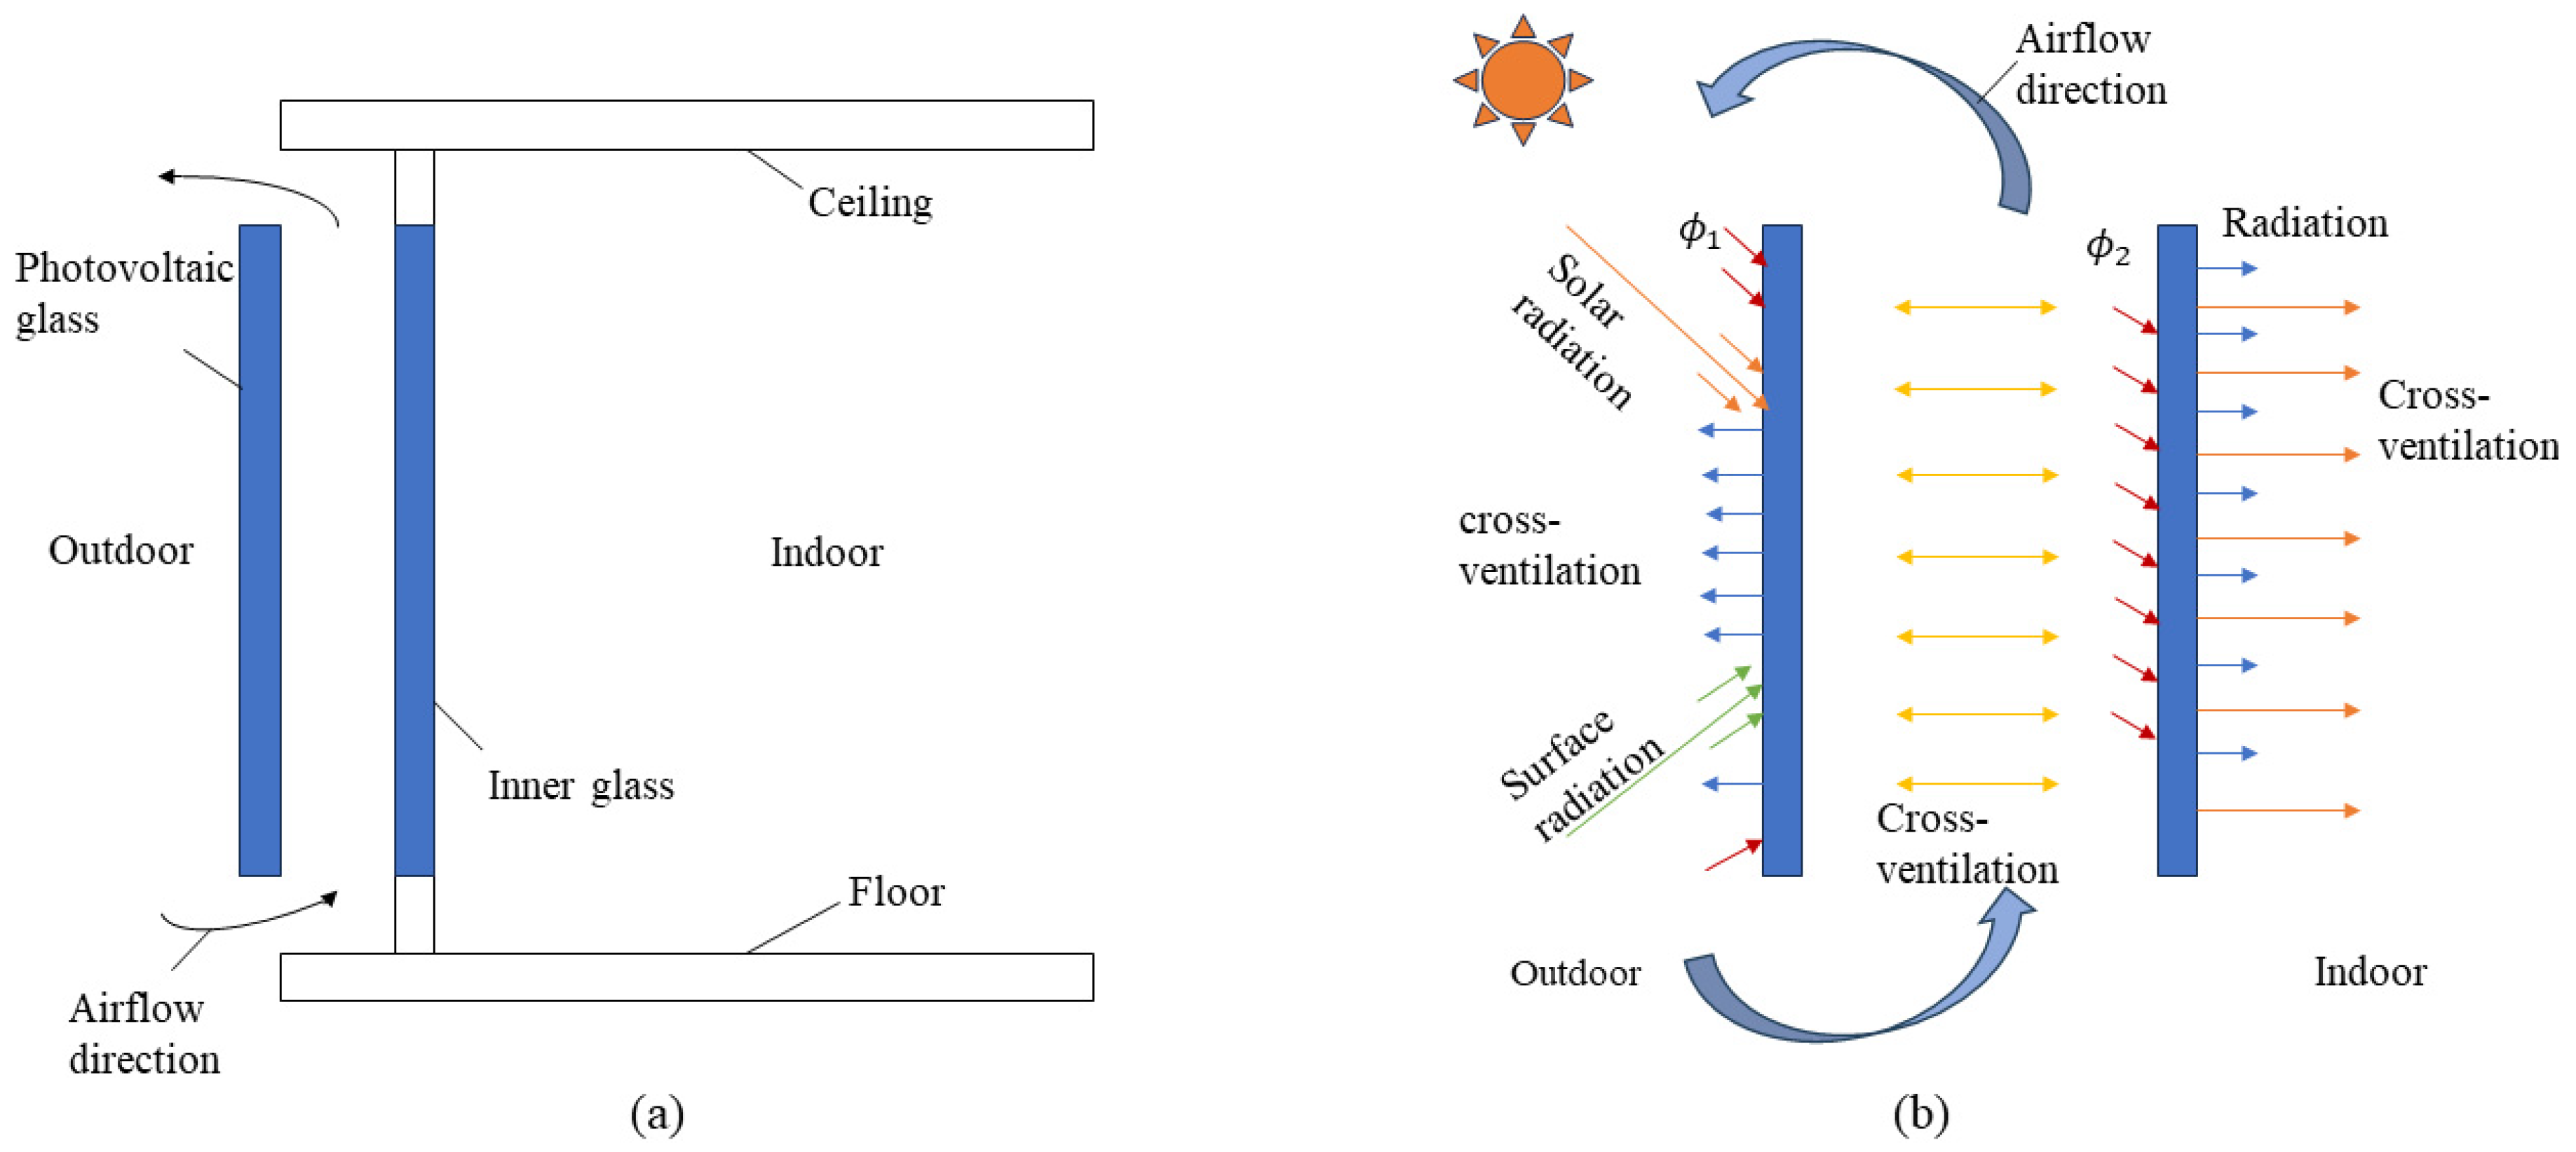
Figure 1 introduces the basic structure of the photovoltaic curtain wall. It can be observed from Figure 1a that the photovoltaic double-layer glass curtain wall structure consists of an outer photovoltaic module and an inner conventional single-layer glass.
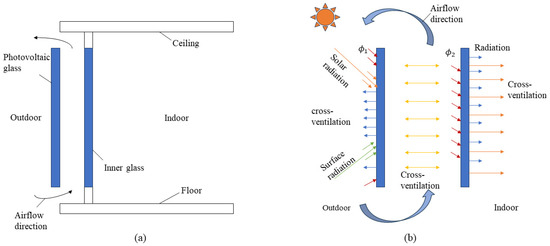
Figure 1.
Physical model of ventilated photovoltaic curtain wall, (a) curtain wall structure and (b) thermal analysis of curtain wall.
Figure 1b shows the thermal performance characteristics of the photovoltaic double glazing. The photovoltaic double-layer glass curtain wall (PV-DSF) is an architectural exterior wall system that combines photovoltaic technology with a double-layer glass curtain wall, in order to increase energy efficiency and to improve the utilization of renewable energy. The internal energy increment of the photovoltaic module mainly includes the solar radiation, ground radiation, and indoors and outdoors convection of absorbed solar radiation. The internal energy increment of the substrate glass mainly includes absorbed solar radiation, convection, and radiation from the photovoltaic module and indoor environment. The cavity between the photovoltaic module and the substrate glass mainly affects the heat transfer through convection.
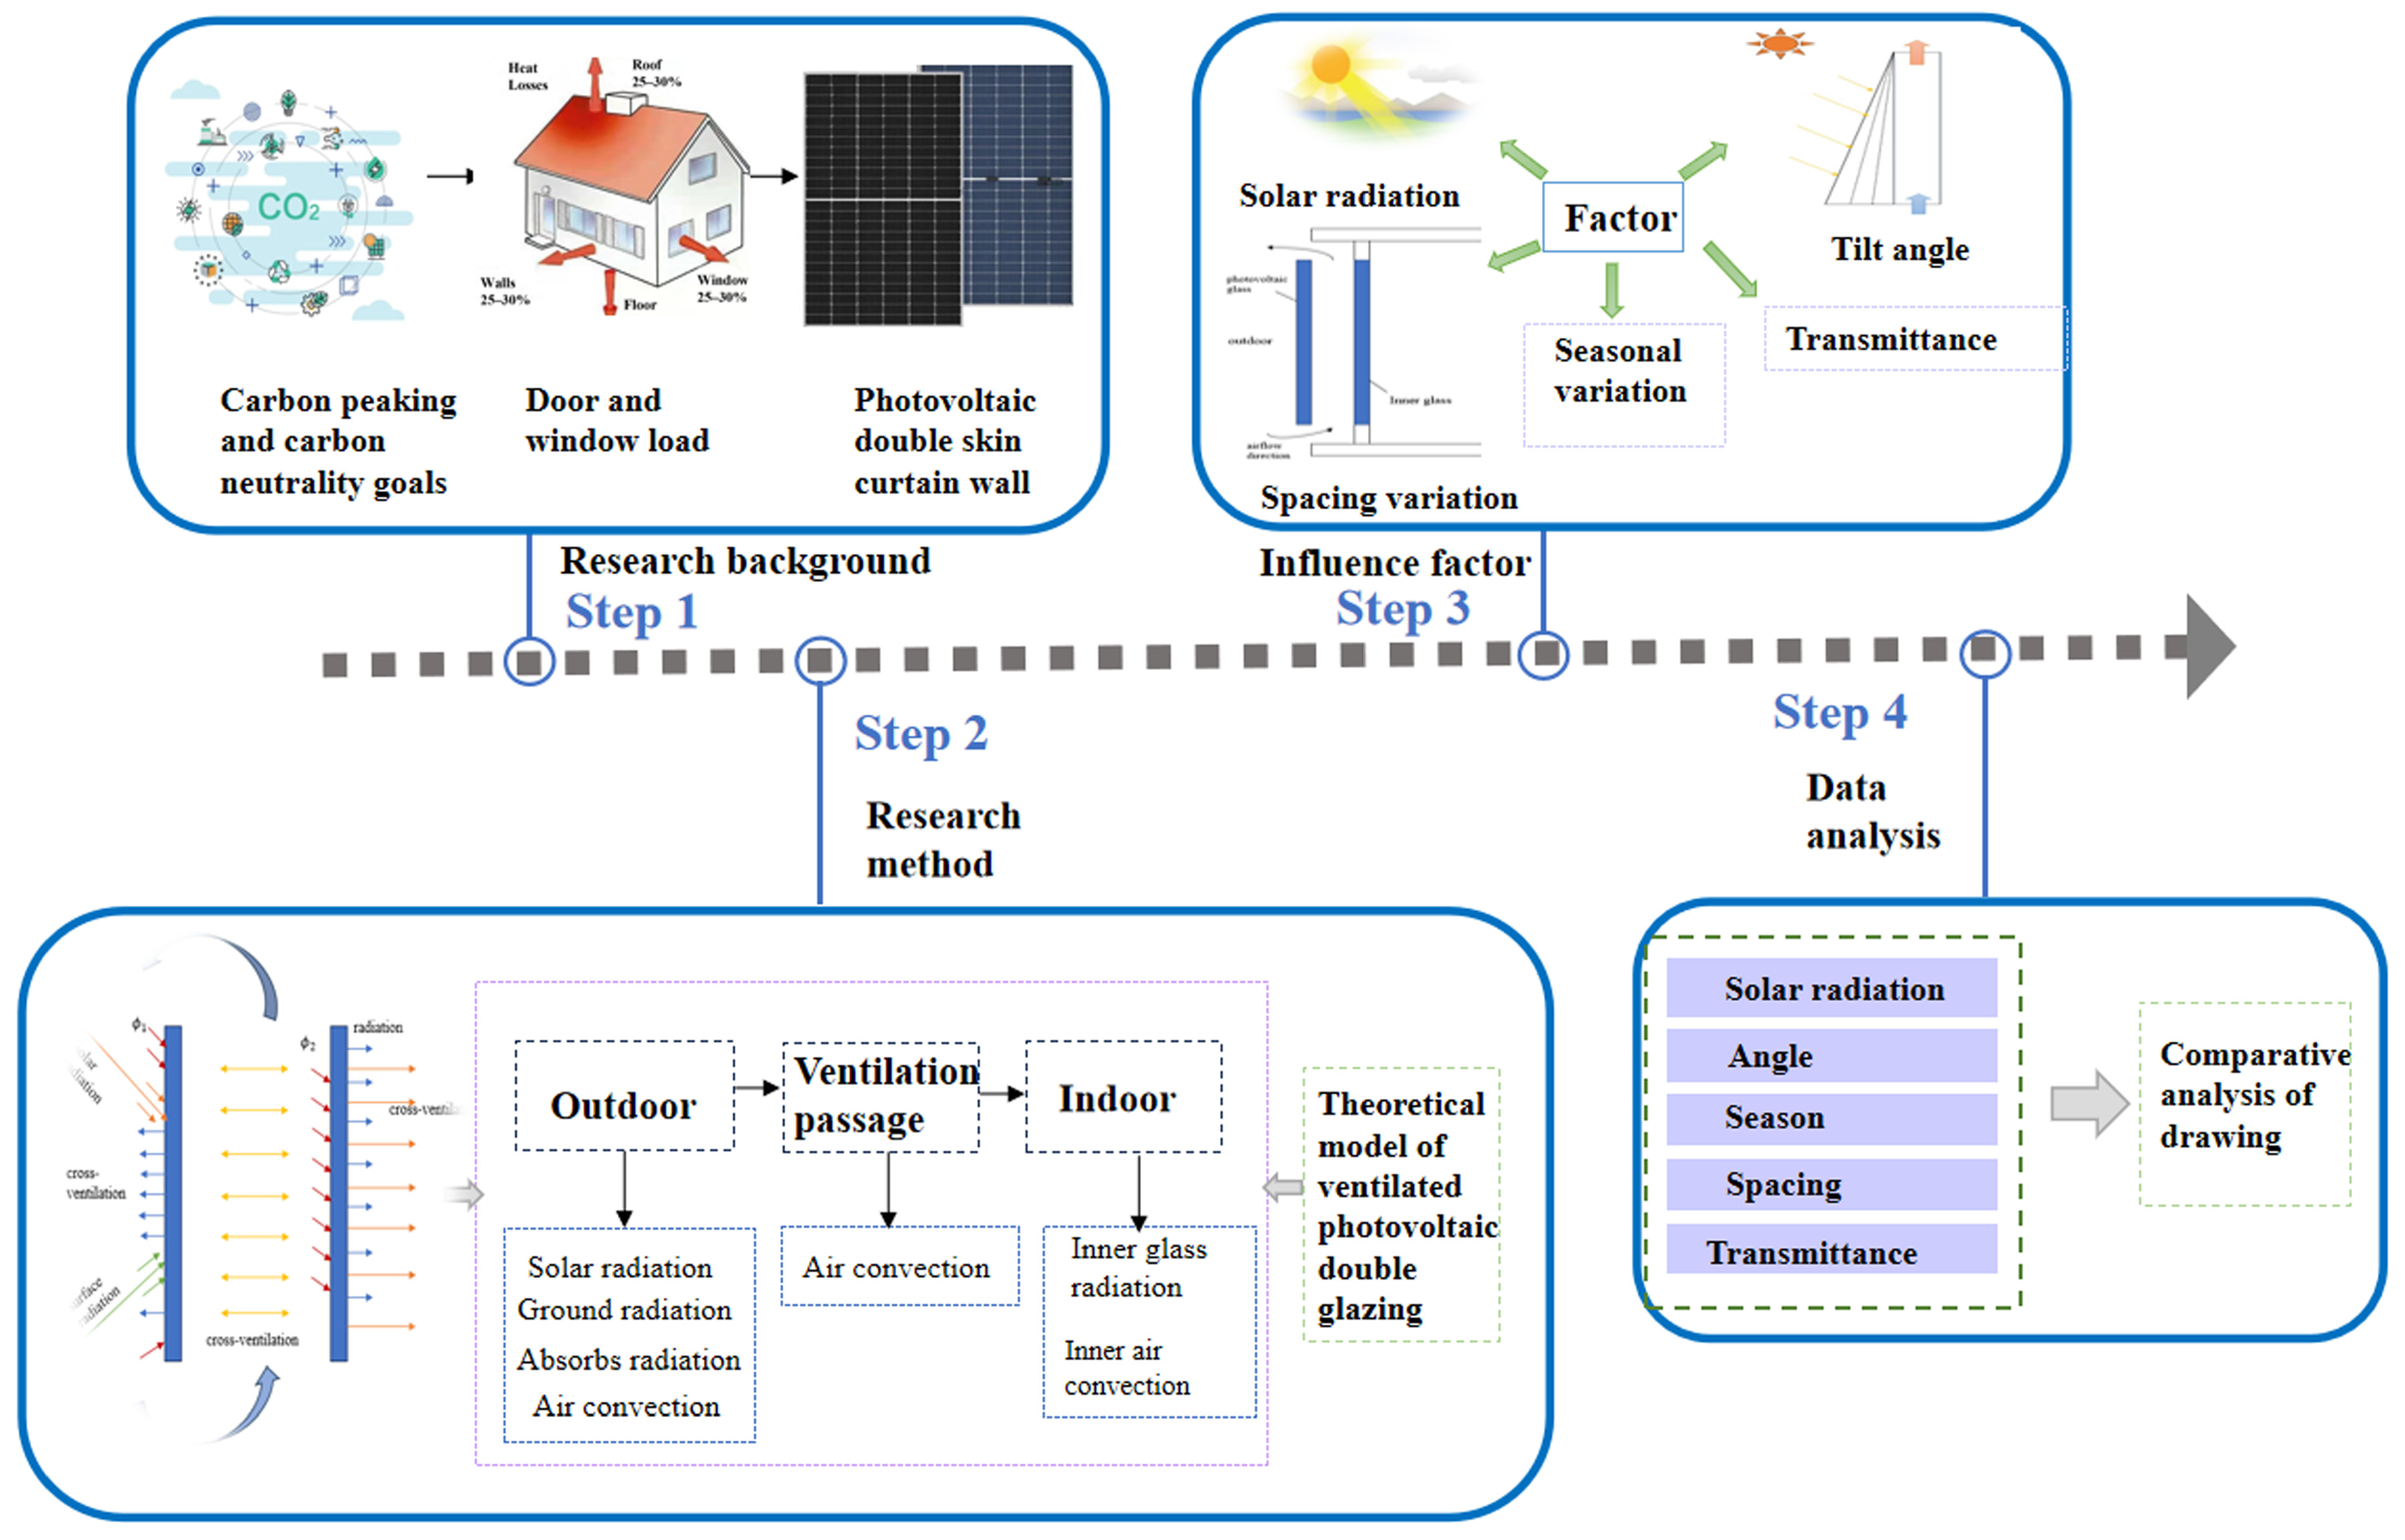
The technical framework, summarizing the methodological steps adopted in this study, is shown in Figure 2. Meteorological data for a typical meteorological year in Jinan City were first obtained through the EnergyPlus 22.1.0 software platform, including many parameters such as the solar irradiance, ambient temperature, and wind speed, which served as the premise and foundation for this study’s data analysis. The raw data was then preprocessed using cubic spline interpolation. Afterwards, using the MATLAB R2020a software platform, the established nonlinear differential equations were solved to obtain the photovoltaic panel surface temperature (Tm) and inner glass temperature (Tg). Finally, the calculated Tm and Tg were used to compute the power generation efficiency and analyze the obtained results. A detailed introduction to all the followed steps is provided in the sequel.
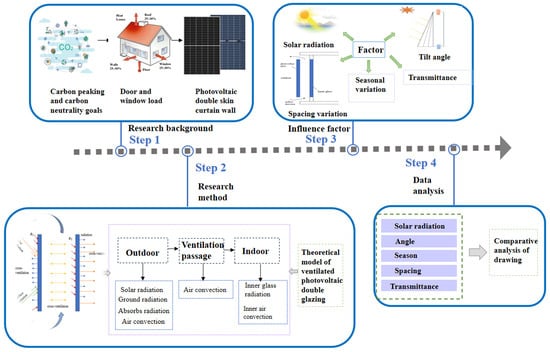
Figure 2.
Technology roadmap of this study.
2.2. Theoretical Model of Ventilated Photovoltaic Curtain Wall System
The photovoltaic panel surface air convection heat transfer was calculated according to Equation (1):
where hconv,a,m is the convective heat transfer coefficient between the outdoor air and the surface of the photovoltaic panel (W/(m2·K)), Ta is the environment temperature (K), Tm is the photovoltaic panel surface temperature (K), and A is the photovoltaic glass area (m2).
The radiation exchange heat between the sky and the surface of the photovoltaic panel was calculated according to Equation (2):
where hr,m,sky is the radiant heat transfer coefficient of the sky and the photovoltaic panel surface (W/(m2·K)) and Tsky is the sky’s effective temperature (K).
The radiation exchange heat from the sky and the ground was calculated according to Equation (3):
where hr,m,gro is the radiative heat transfer coefficient between the sky and the ground (W/(m2·K)) and Tgro is the surface temperature (K).
The radiant heat exchange between the photovoltaic panel and the inner glass was calculated according to Equation (4):
where hr,m,g is the radiant heat transfer coefficient between the photovoltaic panel and the inner glass (W/(m2·K)) and Tg is the inner glass temperature (K).
The Convective heat transfer between photovoltaic panel and inner glass was calculated according to Equation (5):
where hconv,m,g is the convective heat transfer coefficient between the photovoltaic panel and the inner glass, W/(m2·K).
Convection heat transfer between the inner glass and the interior was calculated according to Equation (6):
where hconv,g,room is convective heat transfer coefficient between inner glass and interior, W/(m2·K); Troom, the room temperature, is set at 299.15 K.
Radiant heat transfer between component and sky was calculated according to Equation (7):
where hr,g,room is the radiant heat transfer coefficient between the component and the sky (W/(m2·K)).
The radiant heat transfer between the inner glass and the photovoltaic panel was calculated according to Equation (8):
where hr,g,m is the radiant heat transfer coefficient between the inner glass and the interior (W/(m2·K)).
The convection heat transfer between the inner glass and the photovoltaic panel was calculated according to Equation (9):
where hconv,m,g is the convective heat transfer coefficient between the inner glass and the photovoltaic panel (W/(m2·K)).
In a double-layer photovoltaic glass curtain wall system, the unsteady energy balance equation of the photovoltaic module was calculated according to Equation (10):
where A is the area of the photovoltaic array (m2), ρm is the component density (kg/m2), dm is component thickness (m), cm is the specific heat of the component (J/(kg·K)), φ1 is the solar radiation energy absorbed by the PV module (W/m2), Pout is the output power of the photovoltaic module (W).
In a double-layer photovoltaic glass curtain wall system, the unsteady energy balance equation of the inner layer glass was calculated according to Equation (11):
where φ2 is the solar radiant energy absorbed by the inner glass (W/m2), ρg is the inner glass density, kg/m3; cg specific heat of inner glass (J/(kg·K)).
The unsteady heat transfer equation of the ventilated photovoltaic double-layer glass curtain wall system is a nonlinear differential equation. The mathematical model was developed using MATLAB R2020a, and the numerical solution was obtained by the fourth-order Runge-Kutta method, which is an efficient numerical method for solving differential equations. The latter uses the slope values of four points to approximate the solution values of differential equations. Before calculating the differential equation, the cubic spline interpolation method was used to calculate solar irradiance, ambient temperature and ground temperature and wind speed.
2.3. Calculation of the Heat Transfer Coefficient
2.3.1. Convective Heat Transfer Coefficient
The convective heat transfer between the photovoltaic glass and the outdoor air is related to wind speed [34,35]. If the wind speed is greater than 2 m/s, the convective heat transfer can be expressed as follows:
If the wind speed is greater than 2 m/s, the convective heat transfer expression is obtained as follows [34,35]:
In the leeward situation, the convective heat transfer coefficient between the photovoltaic glass and the outdoor air (W/(m2·K)) is expressed as follows [34,35]:
where v is the wind speed (m/s).
The convective heat transfer coefficient between the photovoltaic module and the inner glass with the indoor air was obtained as follows [36]:
where Troom is the indoor temperature, K.
In the photovoltaic glass curtain wall system, the convective heat transfer coefficient between the photovoltaic module and the inner glass was obtained as follows [37]:
where Nu is a parameter related to the Rayleigh number (Ra).
For ventilated photovoltaic double-glazing, when Ra is greater than 109, Nu = 0.12Ra1/3 [35]. Otherwise, Nu = 0.12Ra1/3 [38]. The Rayleigh number Ra = (Gr·Pr) = gαδ3ΔT/νa. g is the acceleration due to gravity (m2/s), α is the volumetric expansion coefficient, α = 2/(Tm + Tg), ΔT is the acceleration due to gravity (K), a is the gas diffusivity (m2/s), v is the kinematic viscosity of air (m2/s), λ is the thermal conductivity of the ventilation channel (W/(m·K)).
2.3.2. Radiative Heat Transfer Coefficient
For vertically installed photovoltaic modules, the view factor between the module and the inner glass is equal to 1. The radiative heat transfer coefficient expression was obtained as follows [39]:
where is the Stefan-Boltzmann constant, with equal to 5.67×10⁻⁸ W/(m2·K4), εg is the emissivity of the inner glass which is always less than 1, in this study, the value is 0.8 [39], and εm is the emissivity of the photovoltaic module, which is also always less than 1, the value is 0.853.
The expression of the radiative heat transfer coefficient for vertically installed photovoltaic modules with the sky and ground was obtained as follows [40,41,42]:
where Xm–sky is the radiation view factor of the photovoltaic module to the sky, Xm–gro is the radiation view factor of the photovoltaic module to the ground, εsky is the sky emissivity, Tdb is the dew point temperature (K), tgro is the annual average soil surface temperature (°C), Ag is the temperature fluctuation amplitude, y is the depth from the soil surface, (where y = 0), Z is the fluctuation period, and τ denotes any time.
Assuming that the indoor space is a closed cavity, according to the completeness of the view factor, that of the inner glass to the inner surface of the building envelope is equal to 1. The radiative heat transfer coefficient between the inner glass and the inner surface of the building envelope is given by the reference [31]:
2.3.3. Energy Absorption by Glass Curtain Wall
The solar energy absorbed by the photovoltaic module in a double-layer photovoltaic glass curtain wall was obtained as follows [43]:
where αm is the absorption coefficient of the photovoltaic module for solar radiation and E represents the absorbed solar radiation, estimated by calculating the effective radiation on an inclined panel [43]. This calculation incorporates factors including solar declination, geographic latitude, and the panel’s tilt and orientation, expressed in W/m2.
The solar energy absorbed by the inner glass was obtained as follows [43]:
where αg is the absorption coefficient of the inner glass for solar radiation and τm is the transmittance of the photovoltaic module.
2.4. Evaluation Indicators
The photovoltaic conversion efficiency of the photovoltaic module is a crucial parameter in the photovoltaic power generation systems that convert light energy into electrical energy. It is the main factor determining the efficiency of photovoltaic power generation [44]. During the actual use of photovoltaic modules, they are subject to the influence of the complex outdoor environment, which can lead to changes in their electrical performance parameters. Among these factors, solar irradiance has the most significant impact [45]. Studies have shown that solar irradiance, ambient temperature, wind speed, and humidity affect the surface temperature of photovoltaic modules, which affects the power generation.
The temperature coefficient indicates the sensitivity of the photovoltaic panel efficiency to temperature changes. It is usually expressed in %/°C. For photovoltaic panels with a temperature coefficient of 0.35% (amorphous silicon), the power generation efficiency reaches its highest value at the standard temperature (25 °C). For every 1 °C increase in temperature, the output power of the photovoltaic panel decreases by 0.35% [46].
The relationship between the temperature coefficient and the efficiency is given by [46]:
where Δη is the photovoltaic conversion efficiency (%), β is the temperature coefficient, (%/°C), Tb is the standard temperature (25 °C), and Ts is the actual operating temperature (°C).
The output power is computed as [47]:
The power generation efficiency of the photovoltaic panel (%) is computed as [48]:
where Pout is the output power of the photovoltaic panel (W) and Pmax is its maximum value (150 W).
2.5. Case Data
2.5.1. Meteorological Data
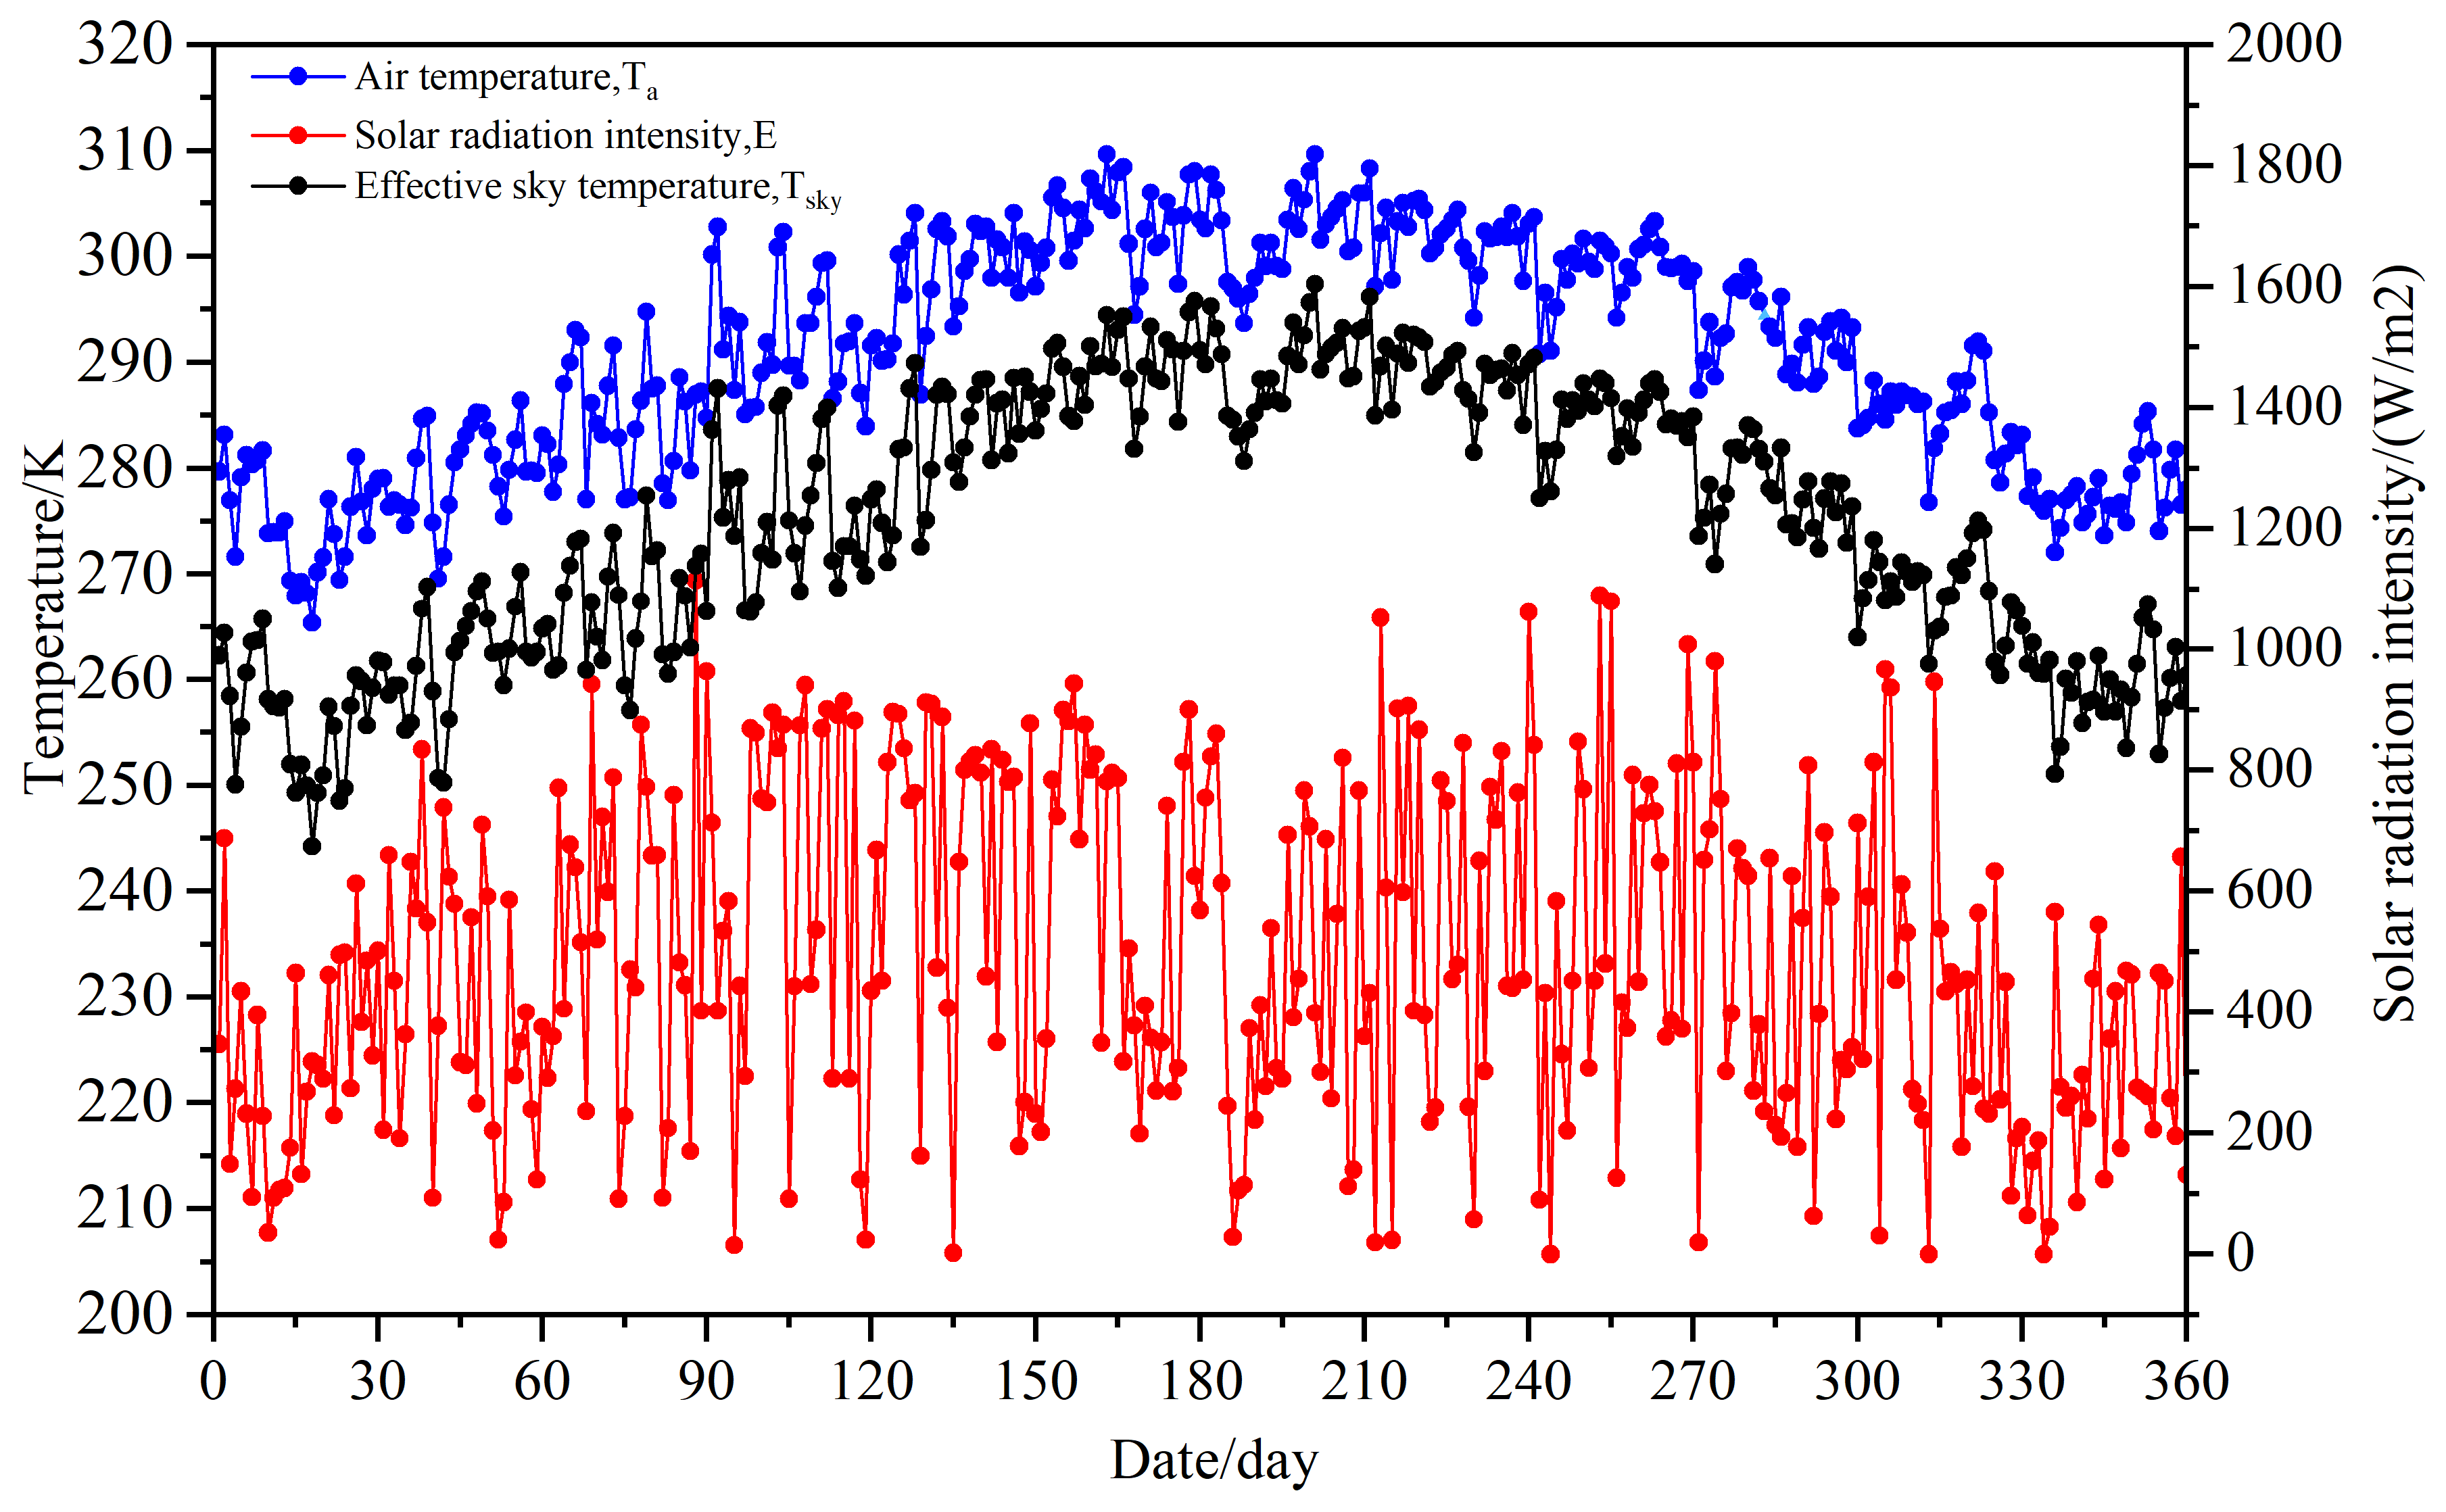
The performance prediction was conducted using weather data from Jinan, a city with hot summers and cold winters in eastern China. Figure 3 shows the meteorological data for a typical year in Jinan (latitude 36°40′ N, longitude 117°00′ E), including the outdoor dry bulb temperature, solar radiation intensity, and effective sky temperature.
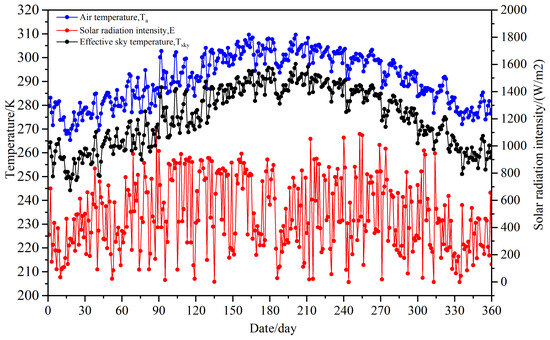
Figure 3.
Meteorological data of a typical year in Jinan (China).
2.5.2. Performance Parameters
The parameters of the photovoltaic glass curtain wall and those of the thermal performance of photovoltaic modules are shown in Table 1 and Table 2, respectively.

Table 1.
Characteristic parameters of the photovoltaic glass curtain wall.
Table 2.
Parameters of the thermal performance of photovoltaic modules.
2.5.3. Relationship between the Installation Tilt Angle and Power Generation
Figure 4 shows the solar radiation absorption of a vertical photovoltaic panel and a panel with varying tilt angles. The photovoltaic module absorbs different amounts of solar radiation at different tilt angles, which leads to changes in power generation. A correct tilt angle allows for maximization of the amount of solar radiation received by the module, which increases its power generation efficiency. Studies have shown that the optimal tilt angle depends on the latitude of the area. This study was conducted in Jinan, Shandong (36°40′ N latitude, 117°00′ E longitude). Table 3 presents the relationship between different installation tilt angles of the photovoltaic panel and the proportion of power generation loss.
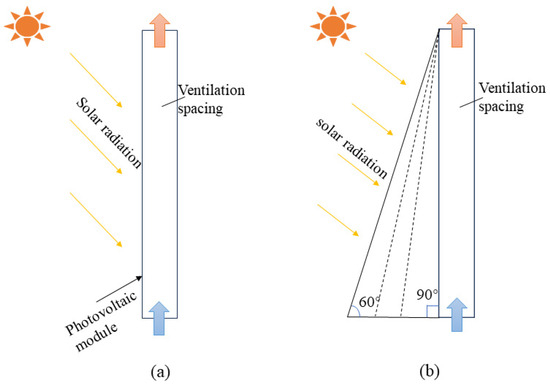
Figure 4.
PV panel installation angle: (a) vertical PV module; and (b) variation of the installation angle.
Table 3.
Relationship between the PV panel installation angle and power generation loss.
2.6. Validation of the Model
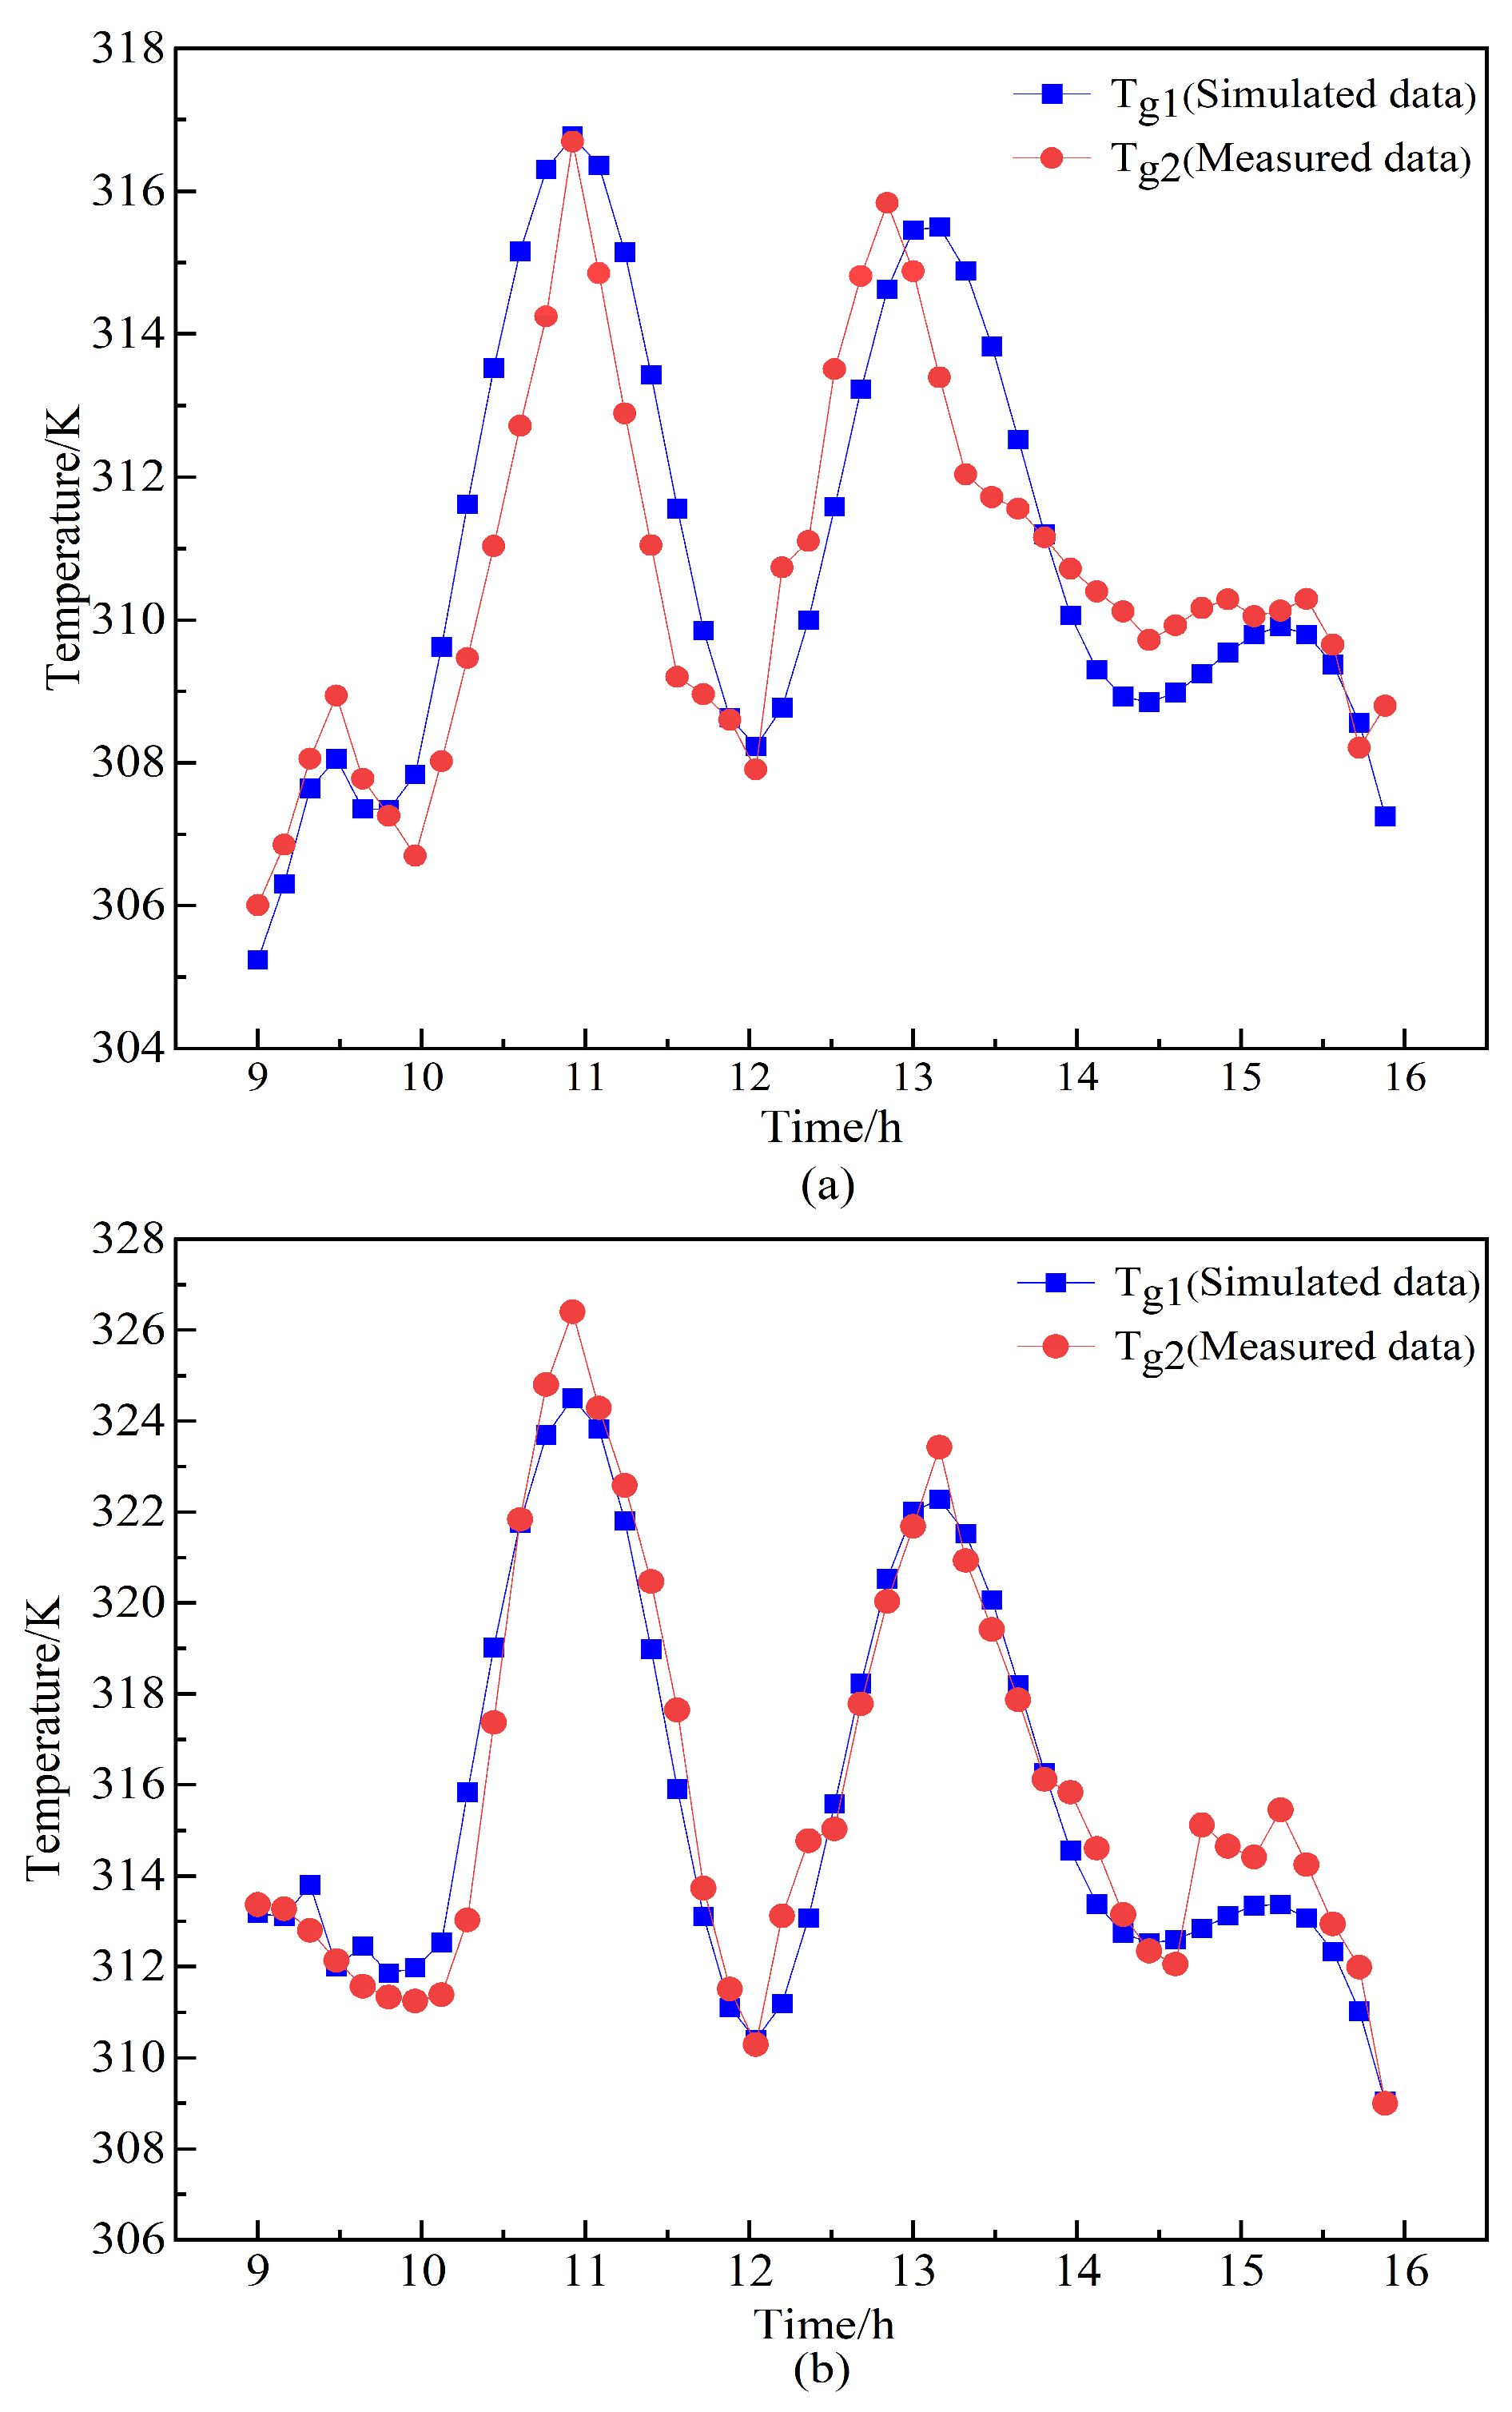
Since the experimental platform for this study has not yet been established, in this section, the reliability of the developed model is verified by comparing its simulation results with the experimental data presented in [43]. The latter were obtained from an experiment conducted on 27 August 2017, at the Shanghai Solar Energy Research Center. Variations in the inner glass temperature over time are shown in Figure 5. The meteorological data are shown in Figure 5a, while variation in the photovoltaic panel surface temperature over time is shown in Figure 5b. It can be seen that the numerical calculation results are consistent with the experimental results presented in the reference [43].
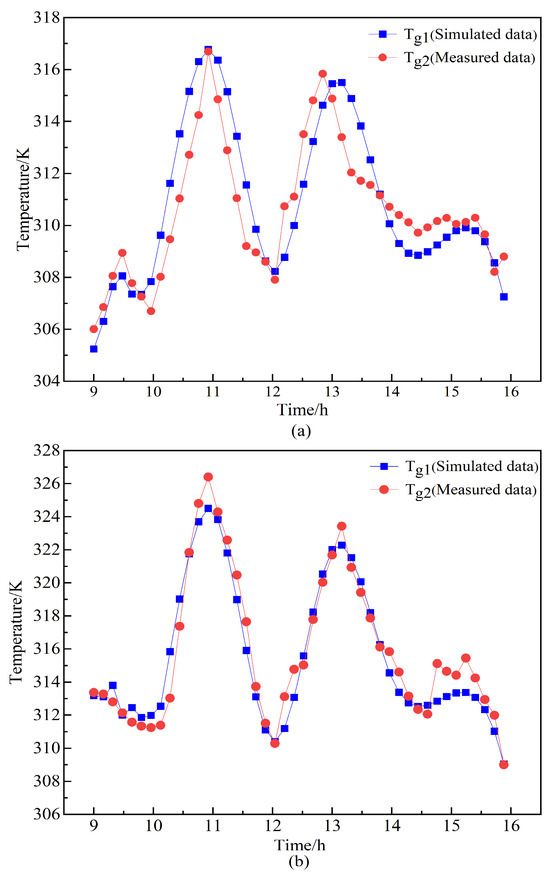
Figure 5.
Validation analysis: (a) Fitting of the inner glass temperature; (b) Fitting of the photovoltaic panel surface temperature.
The root mean square Error (RMSE), mean absolute error (MAE), mean absolute percentage error (MAPE), and absolute value of the relative error at each time step (ERROR) are used to evaluate the simulated data [49]:
where n is the number of data points, is the actual observed value at the i-th data point, and is the predicted value at the i-th data point (Table 4).
Table 4.
Analysis of the errors of the data obtained by simulation.
3. Results and Analysis
3.1. Temperature of the Photovoltaic Glass Affected by the Solar Radiation
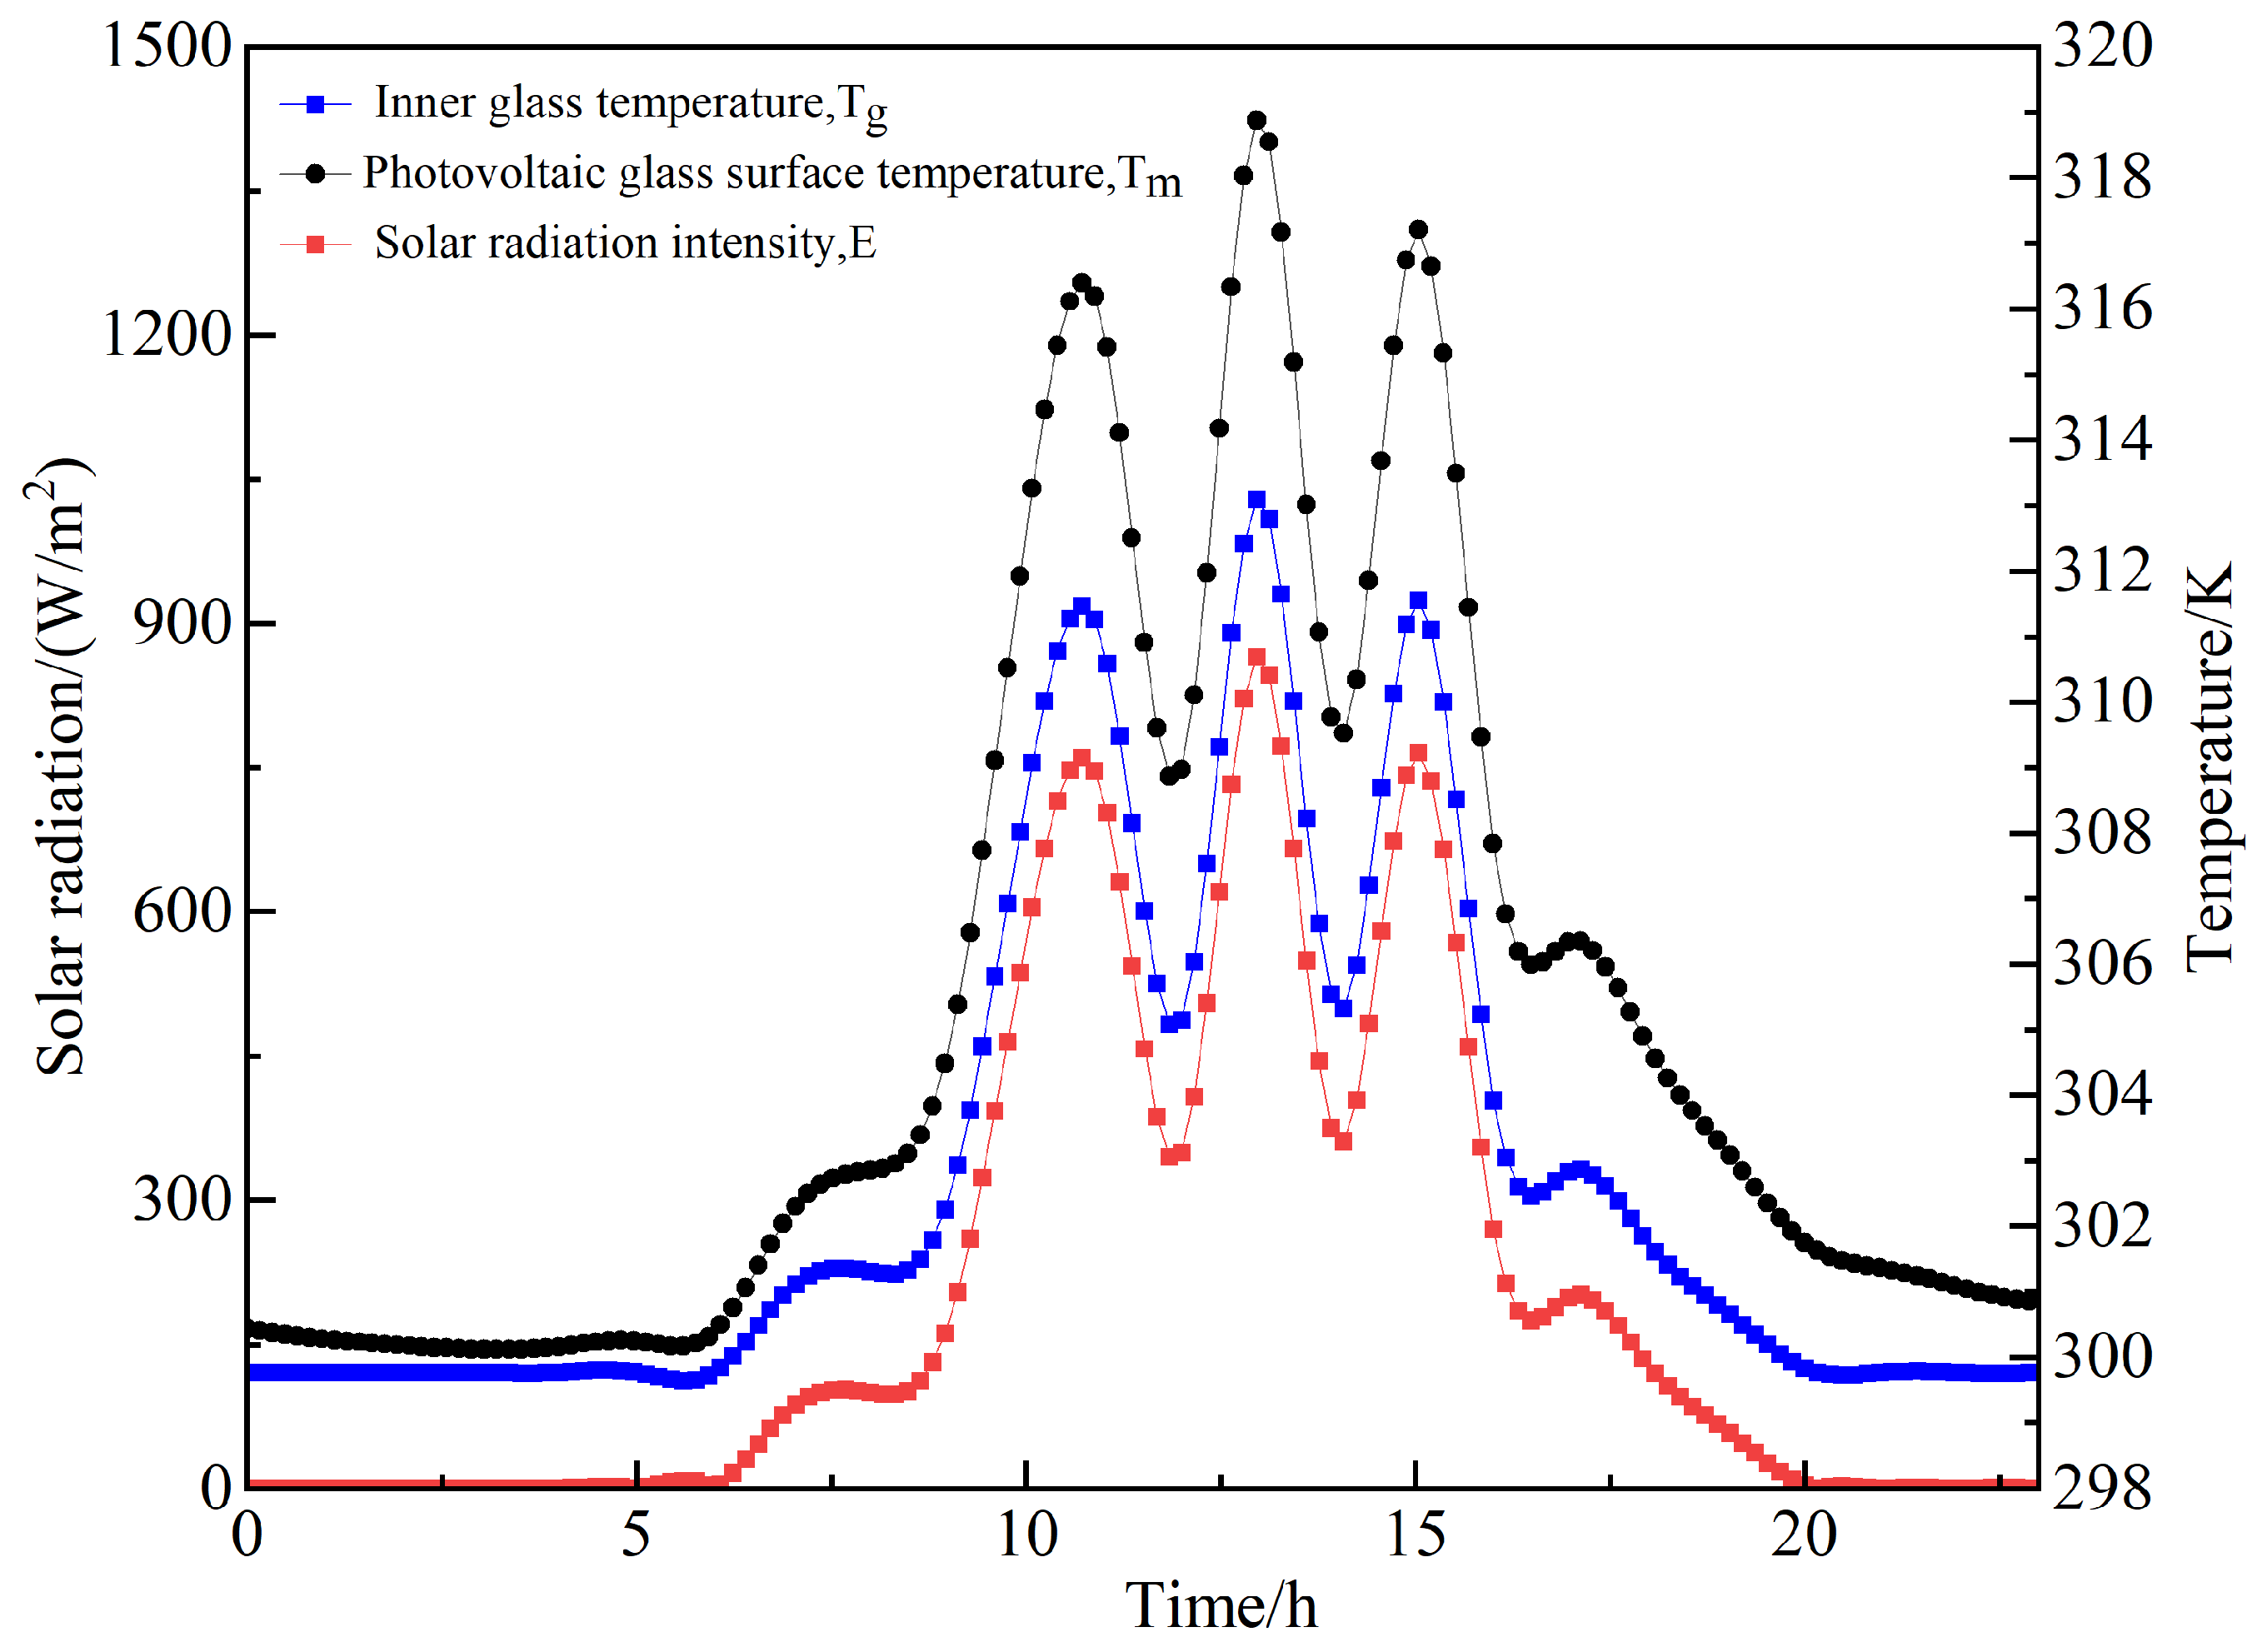
Considering the summer conditions as an example, and using the weather data from Jinan on 1 August, the surface temperature of the photovoltaic panel and the temperature of the backing glass were calculated to analyze the temperature variation patterns of the photovoltaic module and the backing glass with solar radiation intensity and the ground temperature. Figure 6 shows variation in the glass temperature function of time, for different solar radiations. It can be seen that the temperatures of the photovoltaic module and the backing glass significantly affect their performance. In addition, under high temperature conditions, the performance of the photovoltaic module is significantly decreased. The temperature of the photovoltaic module is affected by different factors, with solar radiation intensity being the primary factor, as shown in Figure 6.
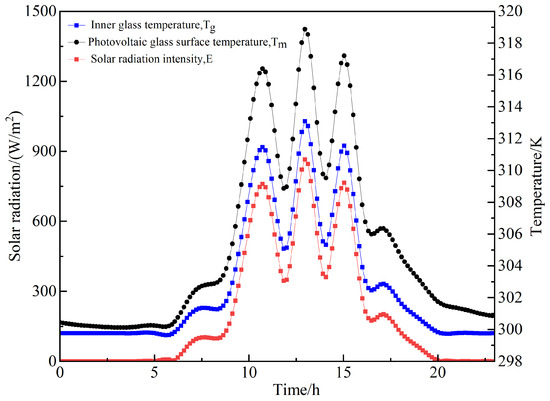
Figure 6.
Variation of the glass temperature function of time, for different solar radiations.
The variations in the temperatures of the photovoltaic module surface and the backing glass are consistent with the variations of the solar radiation intensity, reaching a peak when the latter is at its maximum value. On clear days exhibiting high solar radiation intensity, the photovoltaic module absorbs more heat, which results in an increased temperature. When the solar radiation intensity increases, the temperature of the photovoltaic module also increases.
Temperature is a significant factor affecting the efficiency of photovoltaic power generation, and photovoltaic double-skin glass curtain walls exhibit a pronounced temperature dependence. As temperatures rise, the efficiency of power generation typically decreases. To overcome this limitation, we can optimize the curtain wall structure to reduce the operating temperature of the photovoltaic glass, thereby enhancing its power generation efficiency.
3.2. Impact of the Tilt Angle on Photovoltaic Power Generation
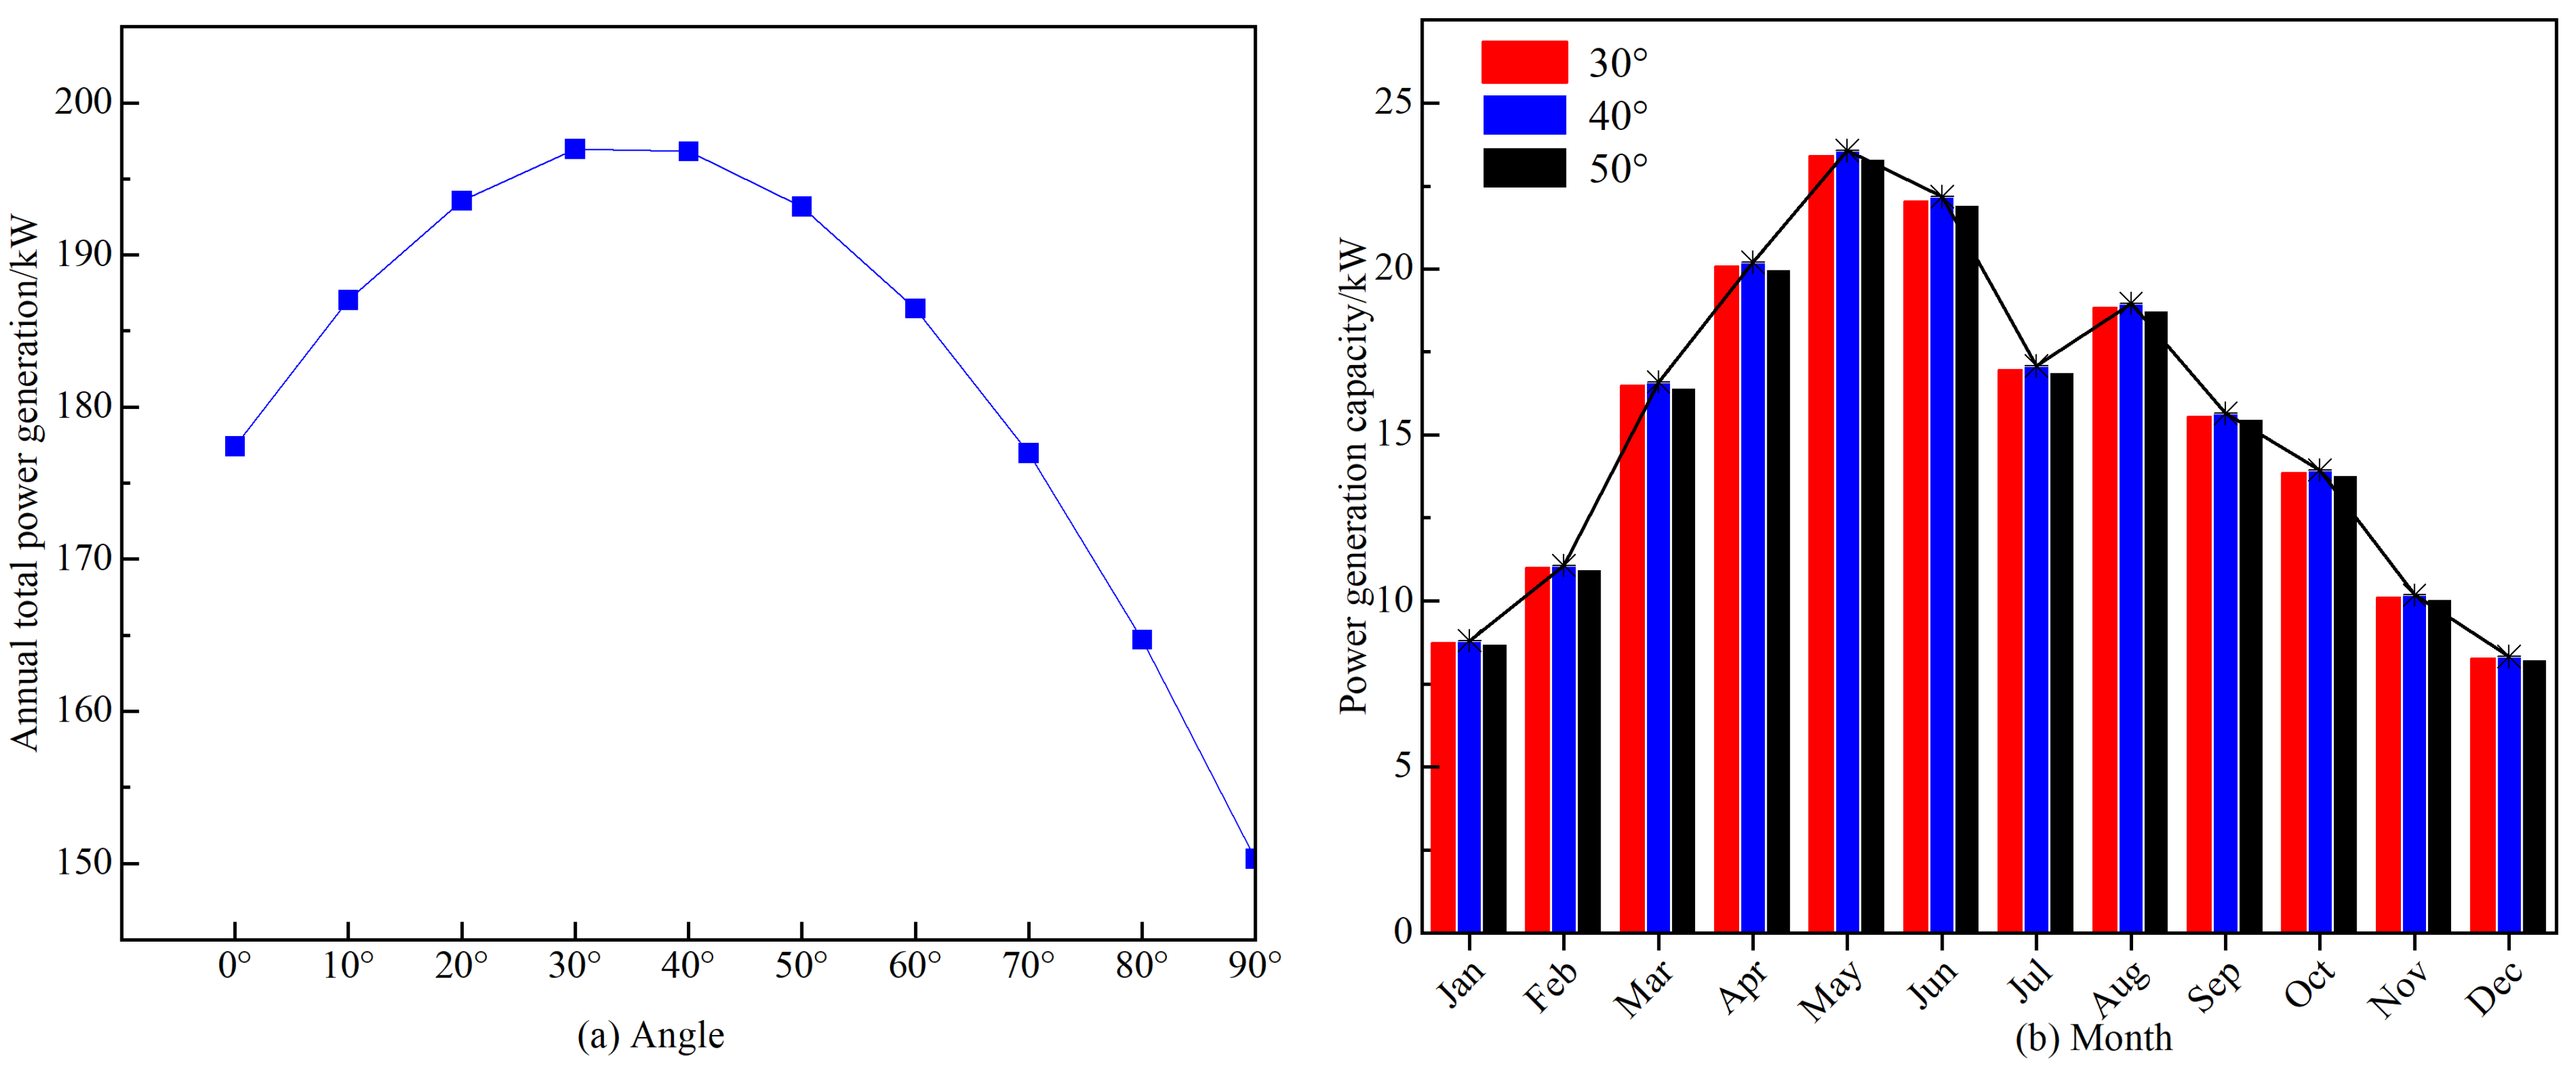
When the tilt angle increases, the annual power generation first increases and then decreases. Figure 7 shows impact of the tilt angle on power generation. It can be seen from Figure 7a that the optimal tilt angle for the Jinan area is almost 40°, with the annual power generation reaching 185 kW. In addition, a tilt angle of 90° exhibits the greatest loss of power generation. More precisely, it results in an annual power generation of only 150 kW, which presents a 24% loss compared with the optimal tilt angle.

Figure 7.
Impact of the tilt angle on power generation: (a) variation in the total annual power generation function of the tilt angle; and (b) variation in the monthly power generation function of the tilt angle.
Figure 7b shows the variation in the monthly power generation at different tilt angles. At the same tilt angle, the monthly power generation first increases and then decreases, with the highest power generation occurring in May. At different tilt angles in the same month, when the tilt angle increases, the power generation first increases and then decreases, and the maximum power generation occurs at a tilt angle of 40°. When the tilt angle is equal to 90°, the minimum power generation in May is 18.989 kW. When the tilt angle is equal to 40°, the maximum power generation in May is 23.570 kW. Moreover, the power generation reaches its lowest value (of 6.705 kW) in December. In the same month, when the tilt angle increases, the power generation first increases and then decreases, and the maximum power generation is reached at a tilt angle of 40°.
Jinan experiences hot weather in July and August, and the main factor affecting power generation capacity is temperature. As shown in Figure 7, the variation in inclination also has an effect on power generation capacity, but the effect is less than that of temperature. By meticulously adjusting the installation angle of the photovoltaic panels in alignment with local geographical factors such as azimuth and solar altitude angles, we can pinpoint the optimal tilt angle to maximize photovoltaic power generation performance.
3.3. Impact of the Ventilation Spacing on the Photovoltaic Power Generation Efficiency
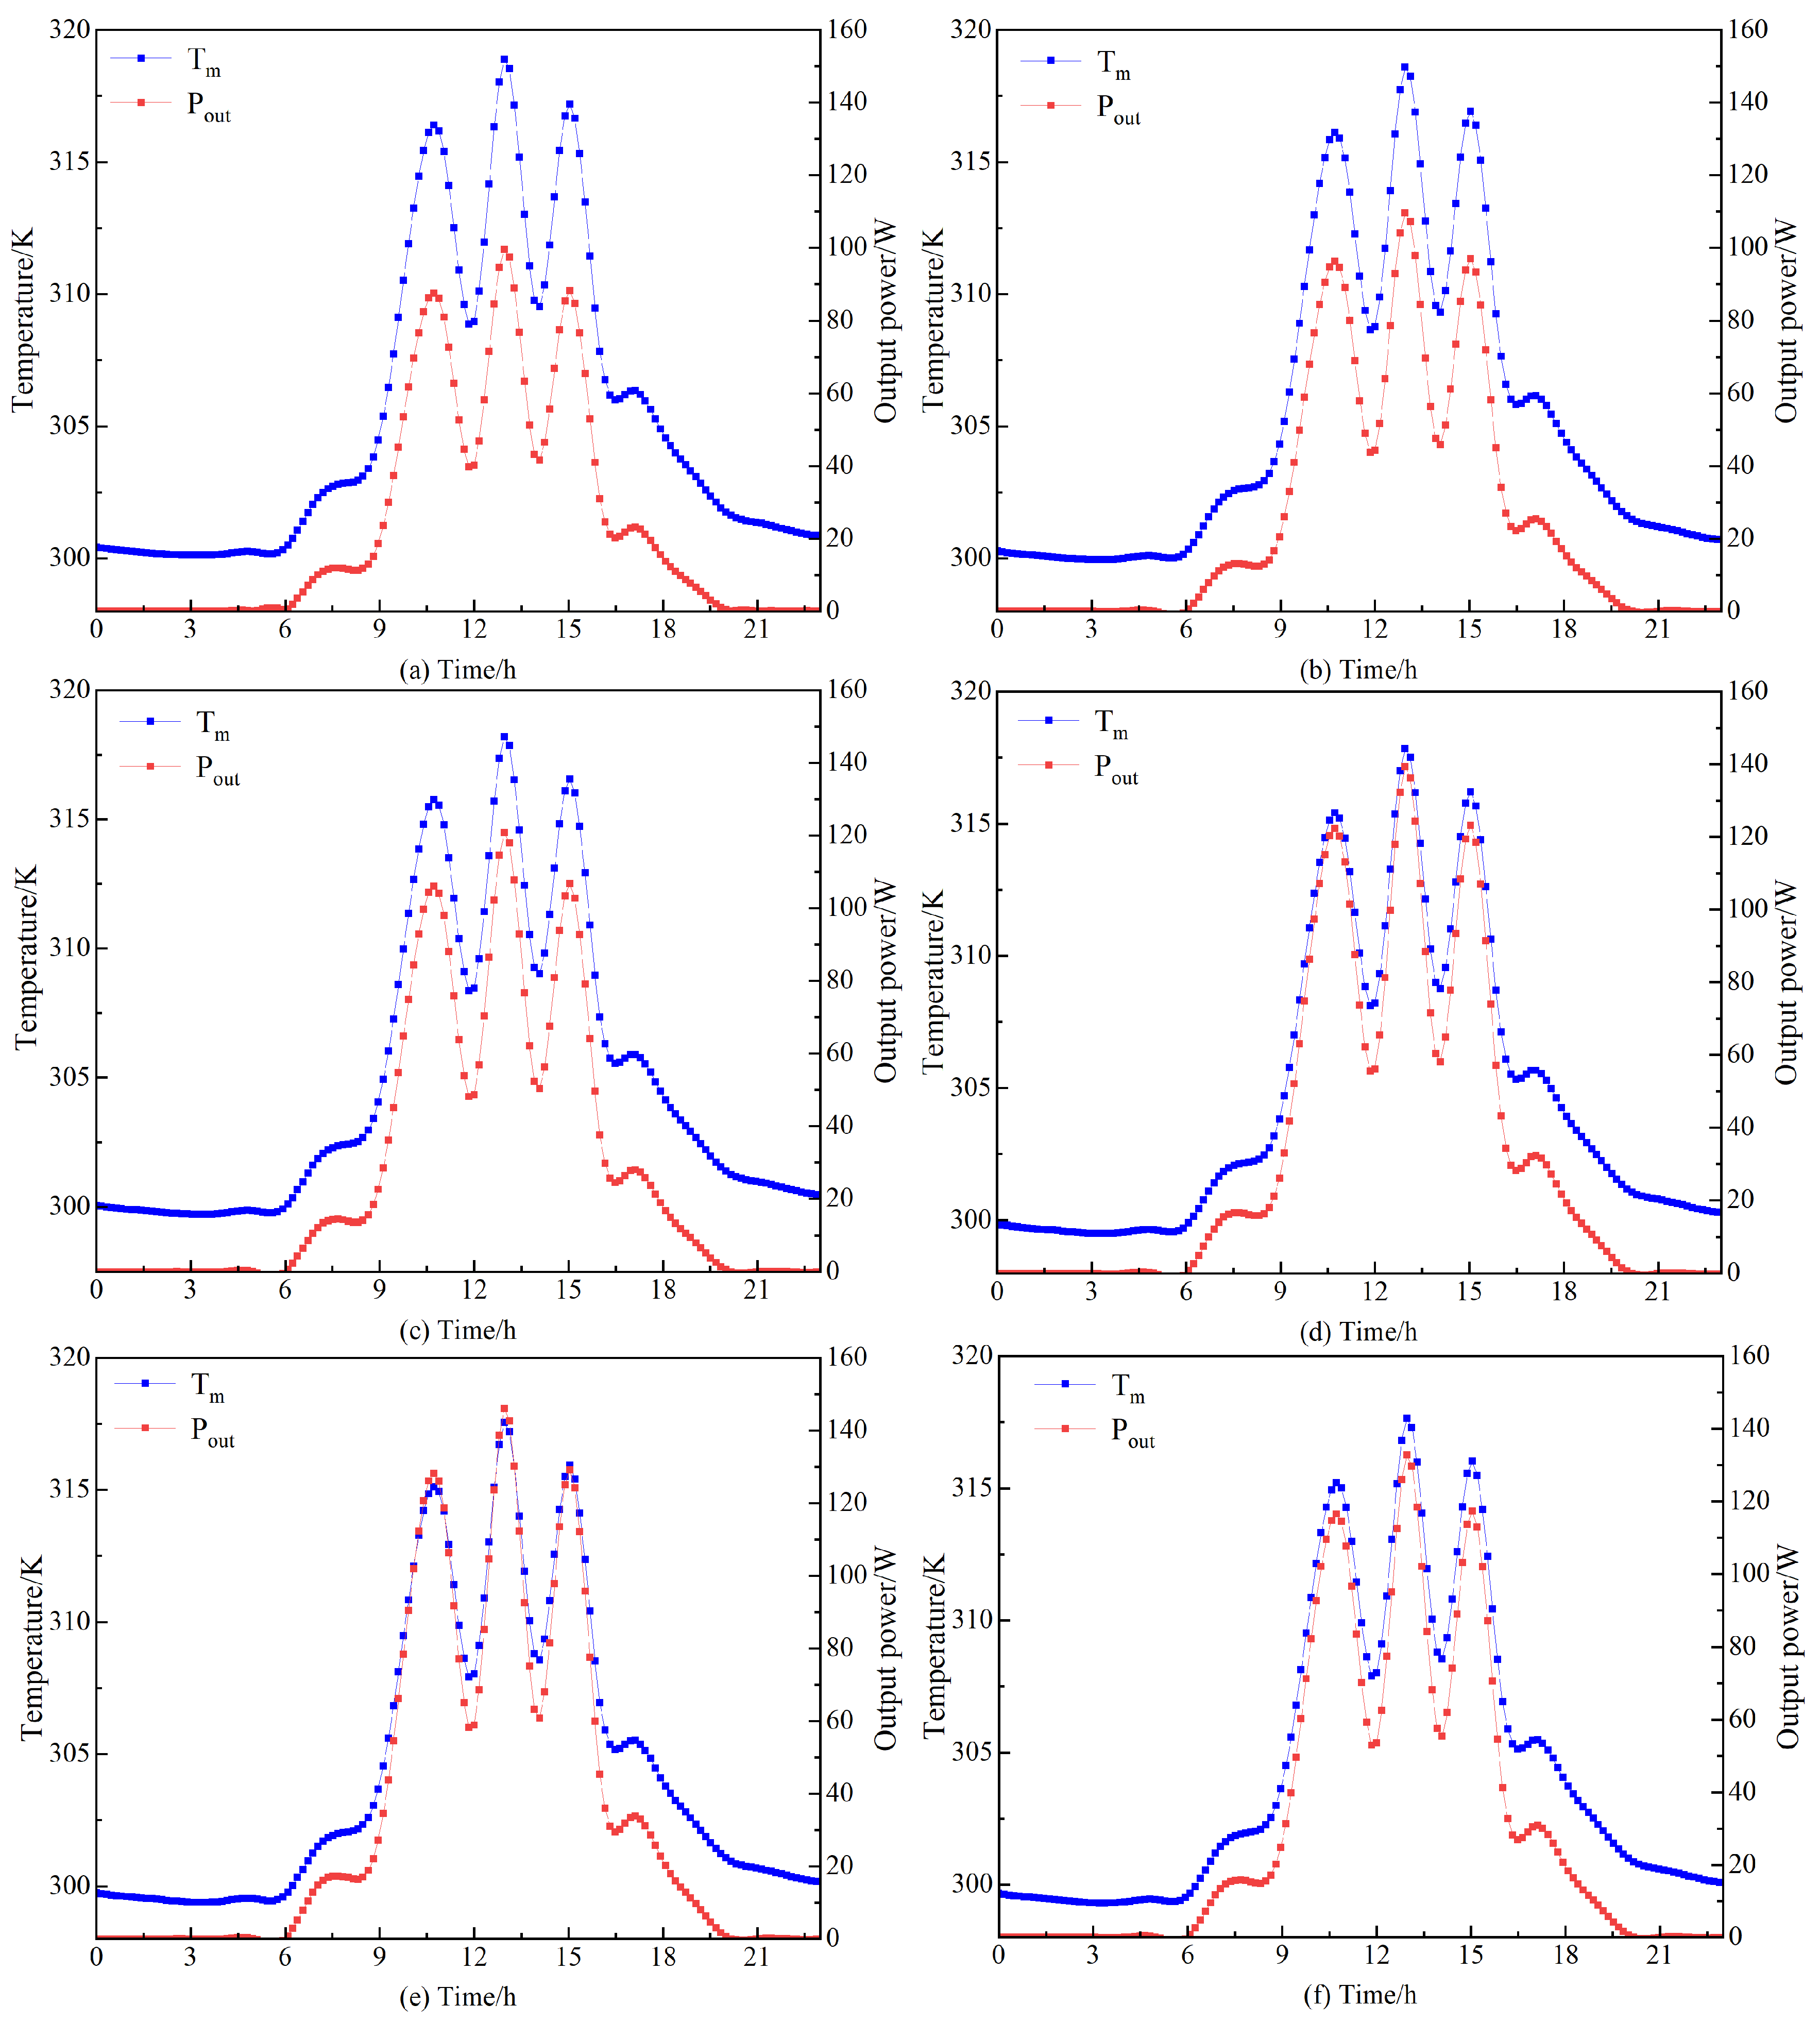
Considering the summer conditions as an example, the changes in the power generation efficiency under different ventilation spacings were studied. Figure 8 illustrates changes in the power generation and surface temperature of the photovoltaic panels over time at different spacings. It can be observed that, when the ventilation spacing increases, the surface temperature of the photovoltaic panels tends to decrease. The power generation of the photovoltaic panels increases.
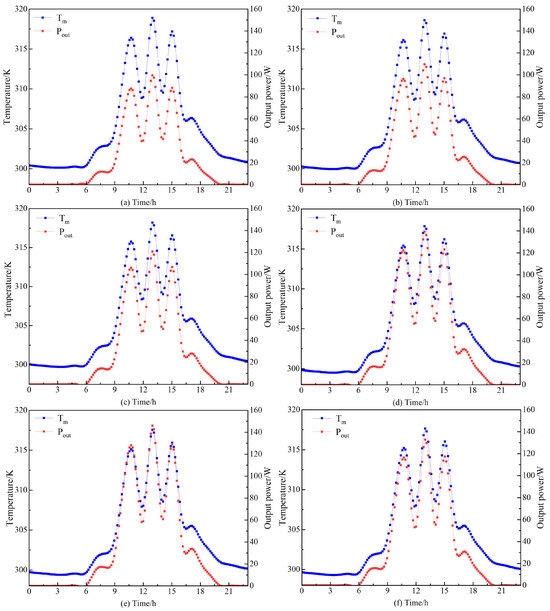
Figure 8.
Variation of the generation efficiency and temperature function of time, for spacing values of: (a) The change of Pout and Tm with spacing of 0.012 m over time; (b) The change of Pout and Tm with spacing of 0.1 m over time; (c) The change of Pout and Tm with spacing of 0.2 m over time; (d) The change of Pout and Tm with spacing of 0.3 m over time; (e) The change of Pout and Tm with spacing of 0.4 m over time; (f) The change of Pout and Tm with spacing of 0.5 m over time.
It can be seen from Figure 8 that, when the ventilation spacing is in the range of 0–0.4 m, the surface temperature of the photovoltaic panels decreases. When the spacing is equal to 0.012 m, the surface temperature of the photovoltaic panels is approximately 300.43 K at night and can reach 317.2 K during the day. For a spacing of 0.4 m, with the best convective heat transfer effect, the surface temperature of the photovoltaic panels is almost 299.4 K at night, and it can reach up to 316.7 K during the day.
It can also be observed from Figure 8 that the thermal ventilation spacing mainly affects heat transfer through convection. For Re < 109, the airflow in the ventilation channel is laminar, while for Re > 109, it is turbulent. When the ventilation spacing increases, the convective heat transfer is gradually improved, which results in a decrease of the surface temperature of the photovoltaic module. The surface temperature of the photovoltaic module directly affects photovoltaic power generation efficiency. Within the thermal ventilation spacing range of 0.1–0.4 m, the power generation efficiency gradually increases with the increase of the spacing. When the ventilation spacing becomes greater than 0.4 m, the power generation efficiency starts to decrease. When the ventilation spacing is equal to 0.012 m, the power generation efficiency reaches its lowest value (61.6%). In addition, when the ventilation spacing is equal to 0.4 m, the power generation efficiency reaches its highest value (62%), denoting an increase of 0.4%.
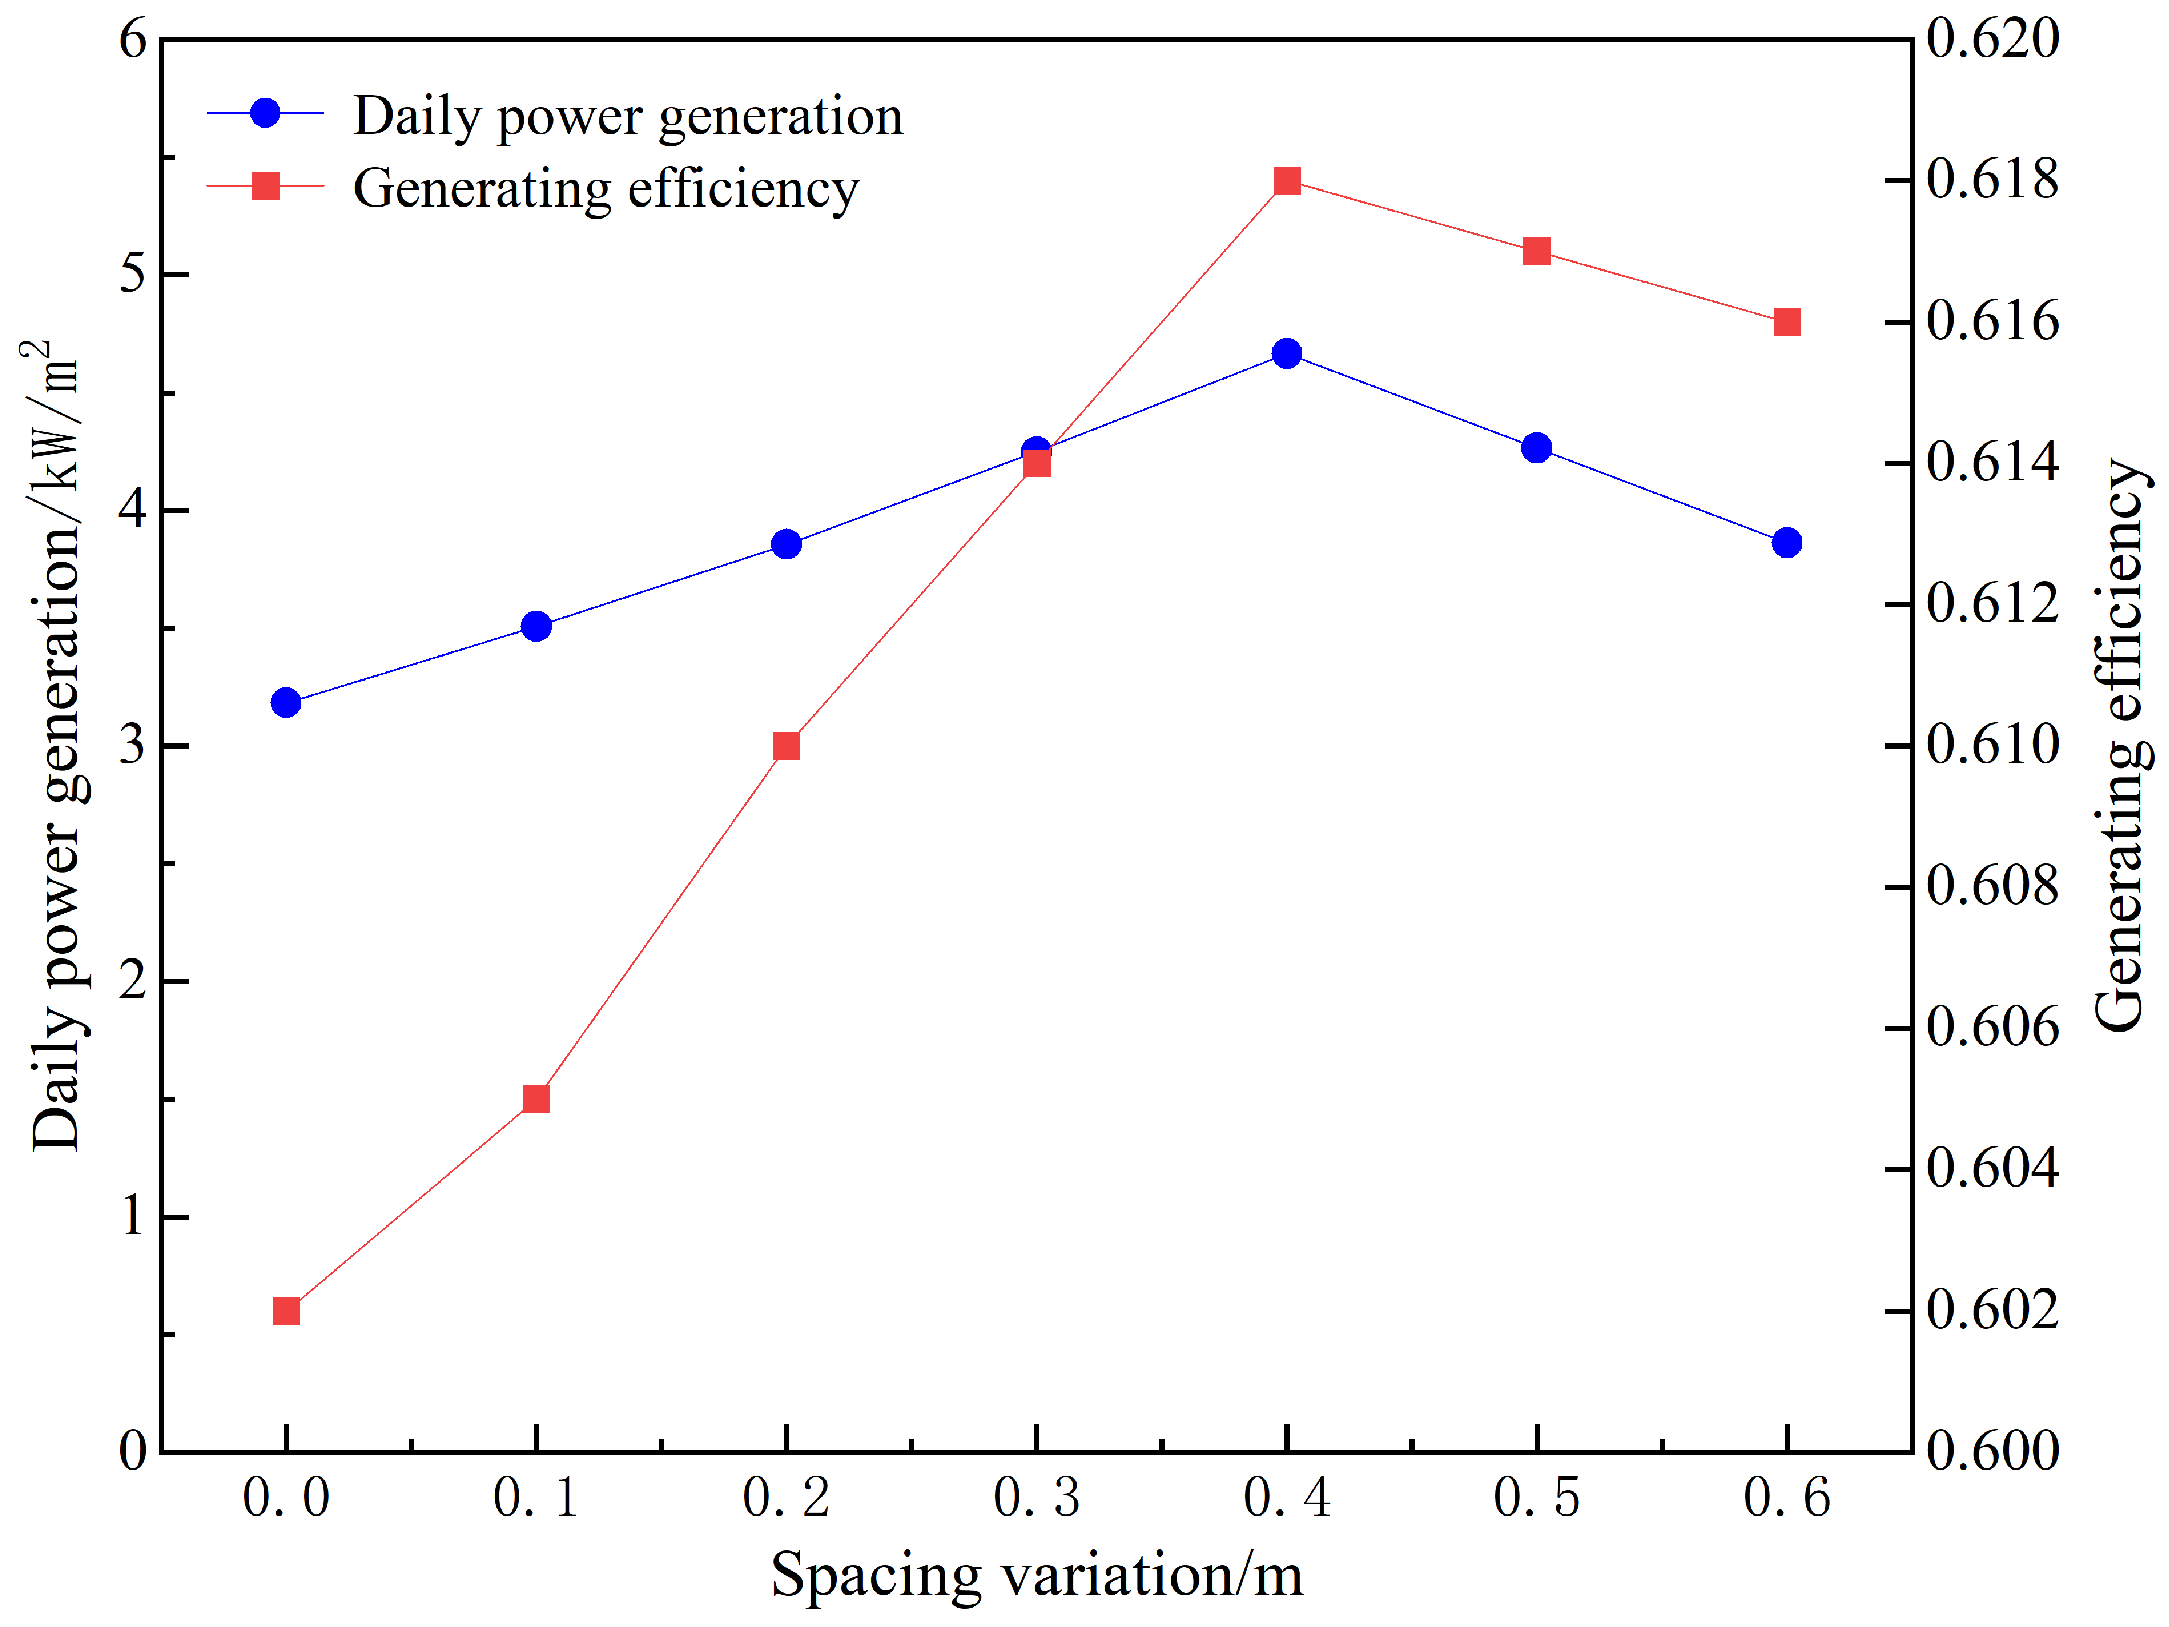
Figure 9 shows the changes to the power generation and its efficiency on 1 August and the function of the spacing. For a spacing of 0.4 m, the maximum power generation was 4.5 kW/m2, and its efficiency was 61.8%.
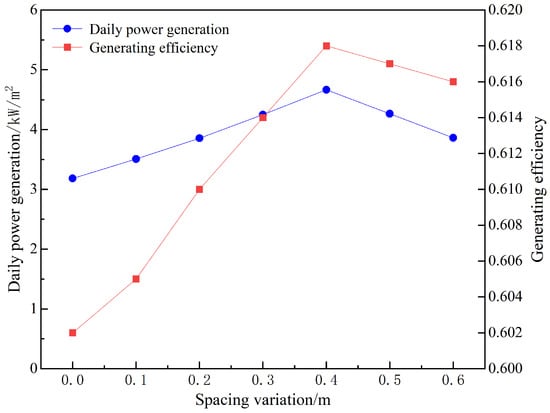
Figure 9.
Variation in power generation and its efficiency function in the ventilation spacing.
3.4. Impact of the Seasonal Change on the Power Generation Efficiency
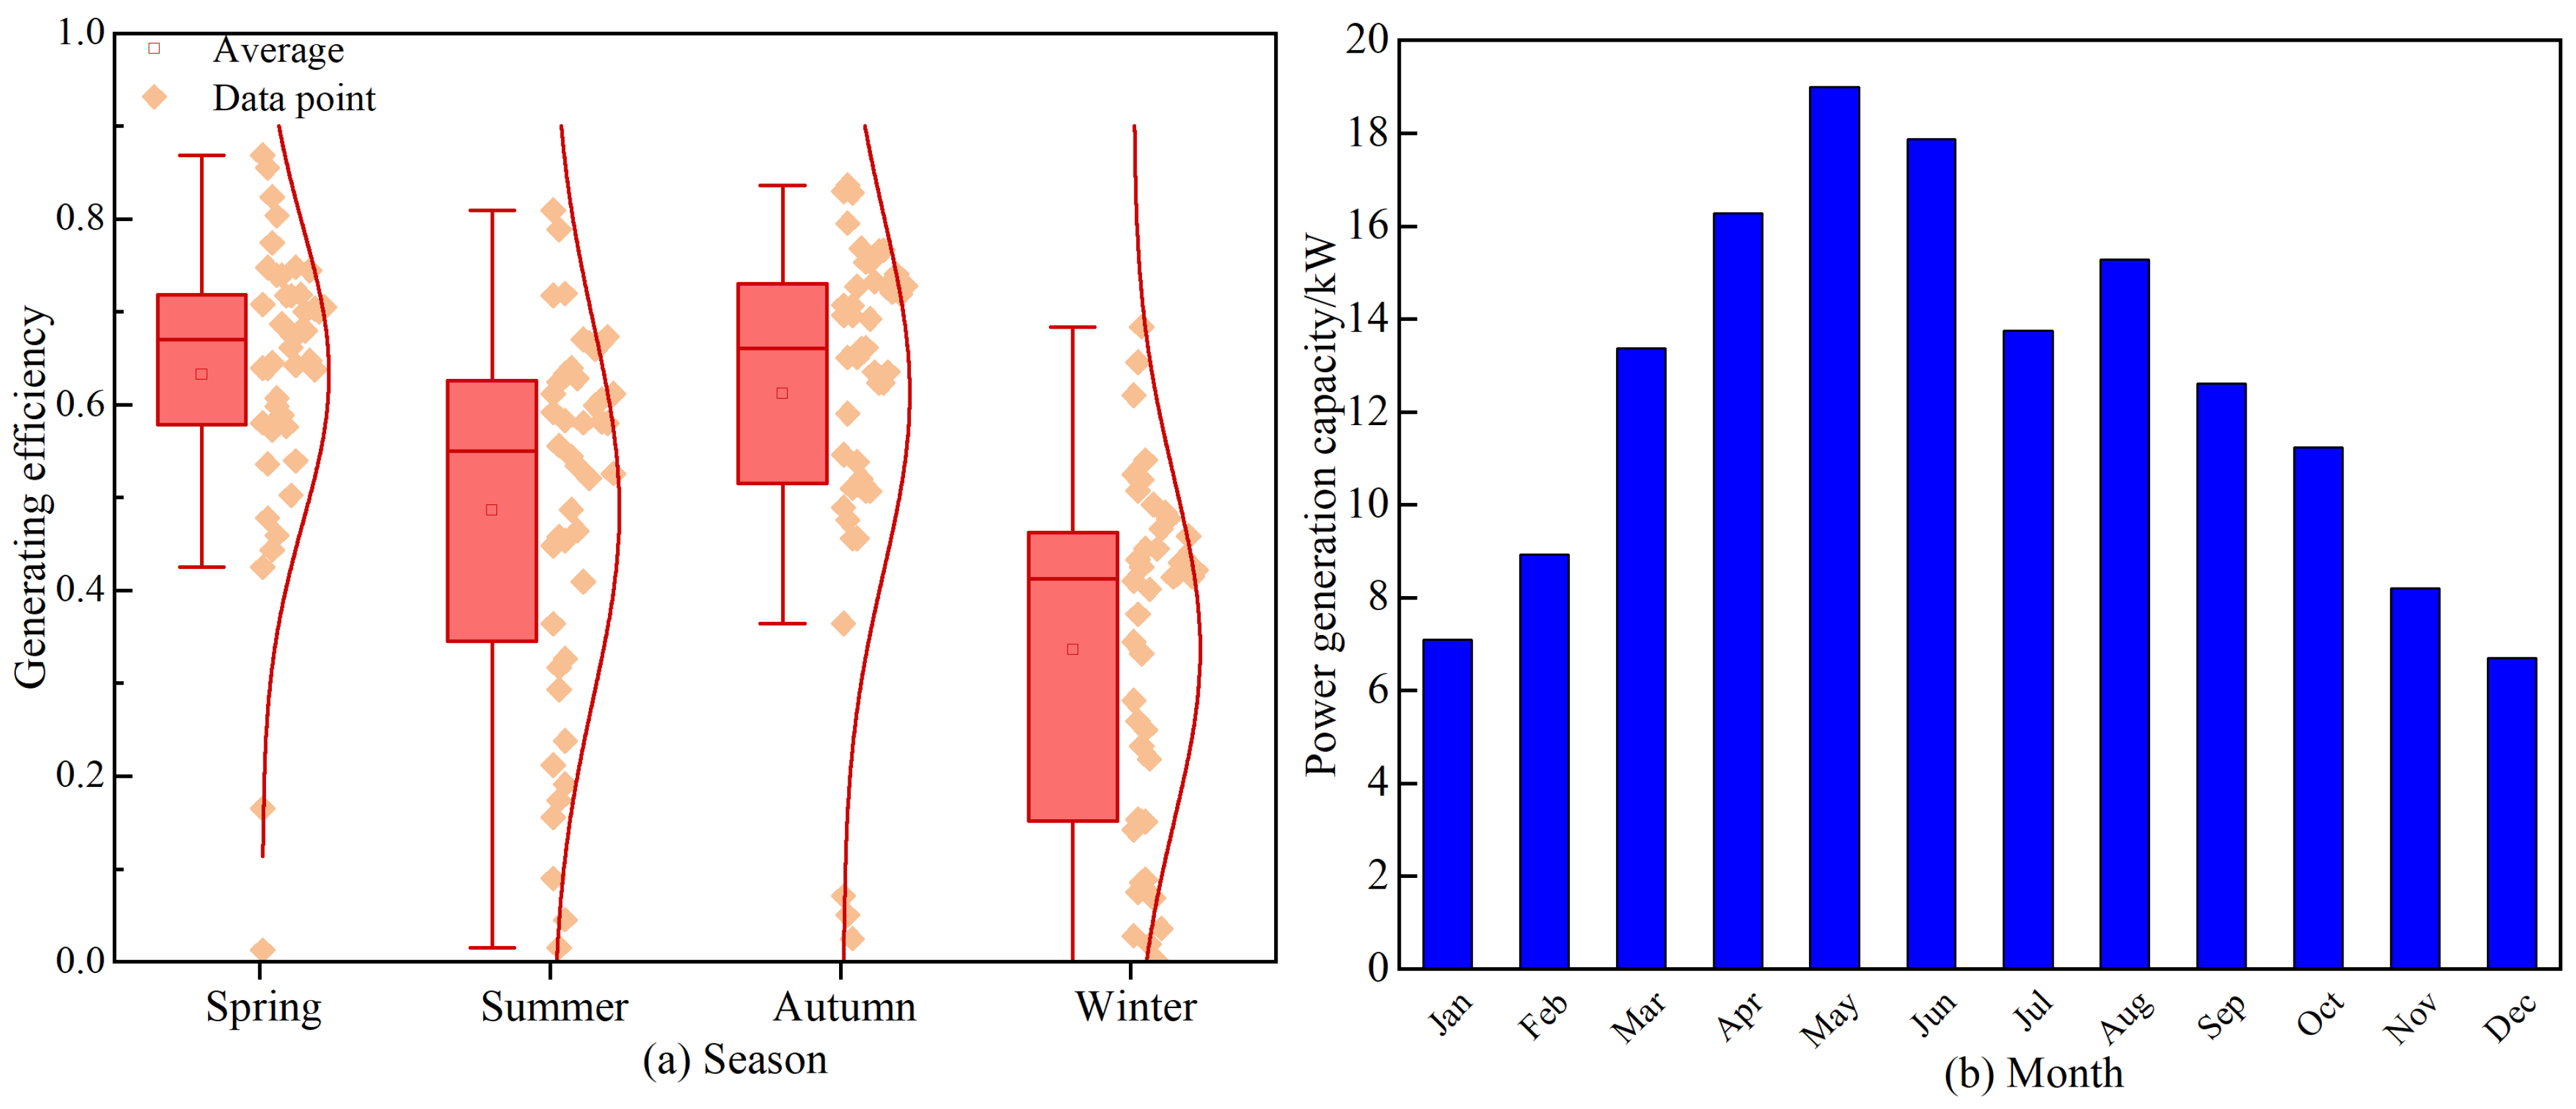
Jinan is located in a cold region with distinct seasons. More precisely, spring is from March to May, summer is from June to August, autumn is from September to November, and winter is from December to February of the following year. The season affects the surface temperature of the photovoltaic panels, which affects the power generation efficiency of the photovoltaic modules. Studies have shown that at standard temperature (25 °C), the power generation efficiency of the photovoltaic panels reaches its highest value, and for every 1 °C temperature increase, the output power of the photovoltaic panels decreases by 0.35%. Figure 10 depicts the seasonal variation in power generation efficiency.
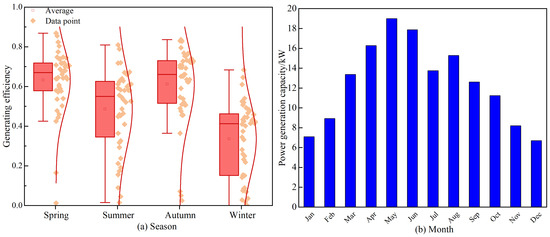
Figure 10.
Seasonal variation: (a) Power generation efficiency function of the seasons; and (b) Variation in the power generation function of the months.
Figure 10a presents a box plot showing the maximum photovoltaic power generation efficiency for each season. Jinan has three months in each season. Fifteen days are randomly selected from each month to obtain the maximum photovoltaic power generation efficiency for that day. This results in 15 efficiency values for each month and 45 values for each season.
Figure 10b shows the variation in the power generation function of the month. It can be seen that May exhibits the highest power generation, reaching 19 kW. In addition, the maximum photovoltaic power generation efficiency in spring can reach 0.75, and the lowest is 0.5. Thus, the median value is approximately 0.69, for a power generation range of 0.62–0.72. In summer, the maximum efficiency can reach 0.8, while the lowest is 0.1, and thus the median value is almost 0.5 for a power generation range of 0.29–0.59. In autumn, the maximum efficiency can reach 0.82, while the lowest is 0.49, and thus the median value is almost 0.68, for the power generation range of 0.5–0.71. In winter, the maximum efficiency can reach 0.68, while the lowest is 0.1, and this the median value is almost 0.45.
In summary, the overall power generation efficiency and the power generation performance of the photovoltaic panels in spring and autumn are higher than those in summer and winter.
3.5. Impact of the Photovoltaic Glass Transmittance on the Power Generation Efficiency
Transmittance denotes refers to the percentage of light allowed to pass through a material. The transmittance of glass is affected by its thickness and color. The thickness of the glass affects its strength and thermal stability. However, an excessive thickness can reduce its transmittance. The color of the glass is also an important factor that should be taken into consideration. Tinted glass can provide aesthetically pleasing visual effects and improve the glare resistance. However, it usually reduces the transmittance. Figure 11 illustrates variations in light transmittance. Figure 11a depicts changes in surface temperature of the photovoltaic panel over time, whereas Figure 11b describes the relationship between power generation efficiency and temperature over the same period.
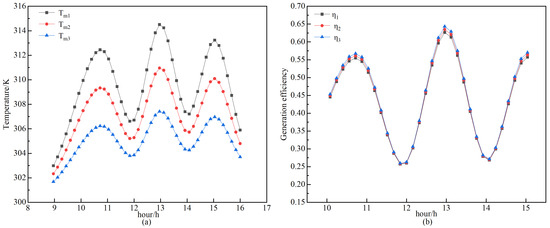
Figure 11.
Variations in light transmittance: (a) The change in surface temperature of the photovoltaic panel over time; and (b) The relationship between power generation efficiency and temperature over the same period.
It can be seen from Figure 11 that glass transmittance affects the surface temperature and power generation efficiency of the photovoltaic modules. Considering summer as an example, the power generation efficiency was studied from 9:00 AM to 4:00 PM. Note that Tm1, Tm2, and Tm3 represent the surface temperatures of the photovoltaic module with transmittance values of 80, 60, and 20%, respectively. The higher the transmittance, the higher the surface temperature of the photovoltaic module. In addition, η1, η2, and η3 represent the power generation efficiencies with transmittance values of 80, 60, and 40%, respectively. When the transmittance is equal to 40%, the power generation efficiency reaches its maximum value (of 63%) at 1:00 PM, and the average power generation efficiency is 35.3%. When the transmittance is equal to 80%, the maximum power generation efficiency is 60%, and the average power generation efficiency is 34.6%. For photovoltaic curtain walls, the lower the transmittance, the more solar radiation is used for the conversion of electricity in the photovoltaic module, and the higher the power generation efficiency.
4. Discussion
BIPV involves the combination of photovoltaic modules with building envelopes. However, it has not been widely adopted due to many challenges such as the large-scale planning, high costs, and optimization performance affected by environmental variables. To promote the use of photovoltaic double-glazed curtain walls, this paper studied the factors affecting photovoltaic power generation efficiency, leading to satisfactory results. However, this study has some limitations, summarized as follows:
During the analysis of the impact of radiation on photovoltaic power generation efficiency, the refinement of solar radiation data was not sufficient. Mathematical models were developed to estimate the radiation data on tilted surfaces, with the most common being the isotropic model, which is suitable for cloudy skies and skies with diffuse solar radiation intensity [50]. The solar radiation intensity significantly affects photovoltaic power generation efficiency. The analysis of the impact of the tilt angle on the photovoltaic power generation demonstrated that this angle is one of the most important parameters in solar systems, ensuring the capture of maximum solar radiation. Therefore, determining the optimal tilt angle can maximize the absorption of solar radiation, which increases power generation efficiency [51]. In this study, the selection of the optimal tilt angle was not precise enough, which is due to the significant angle changes. This paper also showed that the ventilation spacing of photovoltaic double-glazed windows significantly affects the energy consumption of the building [9].
The angles selected for our simulation were static, aligning with standard installation practices and chosen to determine the optimal angle for peak efficiency given the architectural constraints of the building. The building model used in this study did not feature the capability to adjust the angle in real-time. Looking ahead, we recognize the importance of exploring structures equipped with adjustable photovoltaic panel angles. Such an approach could provide valuable insights into optimizing solar energy harvesting throughout different seasons. We are committed to incorporating these scenarios into our future research efforts, thereby enhancing the practical relevance of our findings.
The relationship between building height and spacing changes should also be considered in future work. Because the height of the building affects the wind speed of the ventilation interval, and in turn the heat dissipation effect within the interval is affected. Due to insufficient consideration of this aspect, more work needs to be done in the future to obtain a clearer and more accurate conclusion. The impact of spacing on power generation efficiency under natural ventilation conditions was also studied, with a summer’s day used as an example. However, the sample size was small, and thus these results cannot be generalized.
Transmittance significantly affects the thermal, electrical, and daylighting effects of the semi-transparent photovoltaic curtain walls. Transmittance is affected by many factors, such as the glass material and thickness, and this study used amorphous silicon photovoltaic glass, which presents a particular case. Moreover, applying semi-transparent photovoltaic curtain walls with different transmittance values under different window-to-wall ratios has different impacts on the overall energy efficiency [52]. Furthermore, the analysis of the power generation efficiency, while considering the combination of transmittance with various factors, is not comprehensive enough.
Adjusting the installation angle of PV panels influences cross-ventilation, primarily due to changes in airflow dynamics, pressure variations, and integration with building design. The angling of PV panels modifies the conventional airflow trajectory, thereby affecting the building’s ventilation efficiency. Tilted panels may obstruct air movement, potentially reducing airflow through openings, such as windows or ventilation slots. Therefore, the angle and placement of PV panels must be thoughtfully integrated into architectural designs to prevent adverse effects on the ventilation system. Further research should focus on designing experiments to explore how adjusting the tilt angle of PV panels can either minimize these negative impacts or enhance ventilation positively.
In our forthcoming research, we aim to explore the integration of PV systems with grid infrastructure, recognizing its critical role in enhancing the energy autonomy of buildings. Additionally, it is necessary to consider system uncertainty under climate change [53,54]. We believe that examining the grid-connected capabilities of such systems will yield valuable insights for the design and implementation of sustainable building practices. We acknowledge that this paper primarily relies on simulation studies and lacks experimental validation, which undoubtedly constrains the depth and scope of our findings. To address this, we will establish an experimental platform to gather more precise and practical data, thereby enhancing the reliability and applicational value of our research. Future studies will address these limitations, and further optimization will be conducted to increase the accuracy of our results.
5. Conclusions
In this study, we conducted simulations and thermal performance evaluations of a ventilated double-layer photovoltaic glass curtain wall system, yielding the following insights. The surface temperature of the photovoltaic panels is significantly influenced by ground temperature and solar radiation levels. An increase in ground temperature corresponds to a rise in the panel’s surface temperature. Additionally, the intensity of solar radiation has a direct impact on the module’s temperature, reaching its peak under maximum solar exposure.
The tilt angle of the photovoltaic panels plays a role in determining their surface temperature and, consequently, their power generation efficiency. With vertical placement, the average efficiency is 39.41%. As the tilt angle decreases, the efficiency progressively improves. Thermal ventilation spacing primarily influences convective heat transfer. An increase in spacing enhances convective cooling, leading to a reduction in the photovoltaic module’s surface temperature. Power generation efficiency increases with ventilation spacing within the range of 0.1~0.4 m, but efficiency begins to decline when spacing exceeds 0.4 m.
Seasonal variations impact the efficiency of photovoltaic panels. During spring and autumn, moderate temperatures can bring the panel closer to its optimal operating temperature. In summer, efficiency drops as temperatures rise beyond the optimal range. In winter, cooler temperatures can slightly boost efficiency, but the lower sun angles and shorter daylight hours can adversely affect overall power generation. The transmittance of the photovoltaic glass governs the amount of light that passes through. Lower transmittance means more solar radiation is converted into electrical energy within the module, potentially leading to higher power generation efficiency.
By analyzing key factors like tilt angle, ventilation spacing, and glass transmittance, researchers have optimized design strategies for photovoltaic double-skin glass curtain walls, thereby enhancing their performance. This study identifies critical elements for maximizing power generation efficiency, enabling the fine-tuning of parameters to improve building energy efficiency. The investigation holds profound significance for promoting and applying these curtain walls in architecture, driving innovation and supporting sustainable development goals.
Author Contributions
Conceptualization, X.Z. (Xiaoxuan Zhou), X.Z. (Xue Zhou) and J.L.; methodology, J.L., X.Z. (Xiaoxuan Zhou) and S.Z.; software, X.Z. (Xiaoxuan Zhou); formal analysis, X.Z. (Xiaoxuan Zhou); investigation, X.Z. (Xiaoxuan Zhou), X.Z. (Xue Zhou), X.Z. (Xiangyuan Zhu), J.L. and S.Z.; resources, J.L. and X.Z. (Xiaoxuan Zhou); data curation, X.Z. (Xiaoxuan Zhou) and J.L.; writing—original draft preparation, X.Z. (Xiaoxuan Zhou); writing—review and editing, X.Z. (Xiaoxuan Zhou), S.Z., X.Z. (Xue Zhou), X.Z. (Xiangyuan Zhu) and J.L.; visualization, X.Z. (Xiaoxuan Zhou); supervision, J.L., X.Z. (Xiangyuan Zhu) and S.Z.; project administration, J.L. and S.Z.; funding acquisition, J.L. and S.Z. All authors have read and agreed to the published version of the manuscript.
Funding
This work was funded by the Natural Science Foundation of the Shandong Province, China (ZR2021ME199, ZR2020ME211 and ZR2021ME237).
Data Availability Statement
The original contributions presented in the study are included in the article, further inquiries can be directed to the corresponding authors.
Acknowledgments
This work was also supported by the Plan of Introduction and Cultivation for Young Innovative Talents in Colleges and Universities of the Shandong Province (Lu Jiao Ke Han [2021] No. 51).
Conflicts of Interest
The authors declare no conflicts of interest.
Nomenclature
| A | area, m2 |
| Ag | temperature fluctuation range |
| am | solar radiation absorption coefficient of photovoltaic module |
| ag | absorption coefficient of inner glass to solar radiation |
| a | coefficient of gas expansion, m2/s |
| cg | inner glass specific heat, J/(kg·K) |
| cm | component specific heat capacity, J/(kg·K) |
| dm | component thickness, mm |
| E | solar radiation energy, W/m2 |
| hconv,a,m | convection heat transfer coefficient between outdoor air and surface air of photovoltaic panel, W/(m2·K) |
| hr,m,sky | radiant heat transfer coefficient of sky and photovoltaic panel surface, W/(m2·K) |
| hr,m,gro | radiative heat transfer coefficient between sky and ground, W/(m2·K) |
| hr,m,g | radiant heat transfer coefficient between photovoltaic panel and inner glass, W/(m2·K) |
| hconv,m,g | convective heat transfer coefficient between photovoltaic panel and inner glass, W/(m2·K) |
| hconv,g,room | convective heat transfer coefficient between inner glass and interior, W/(m2·K) |
| hr,g,room | radiant heat transfer coefficient between component and sky, W/(m2·K) |
| hr,room,g | radiant heat transfer coefficient between inner glass and interior, W/(m2·K) |
| hconv,m,g | convective heat transfer coefficient between inner glass and photovoltaic panel, W/(m2·K) |
| Pout | output power, W |
| Ra | Rayleigh number |
| Ta | environment temperature, K |
| Tsky | sky effective temperature, K |
| Tm | photovoltaic module surface temperature, K |
| Tg | inner glass temperature, K |
| Tgro | surface temperature, K |
| Troom | indoor temperature, K |
| tgro | average annual temperature of soil surface, °C |
| Tdb | dew point temperature, K |
| Xm-sky | the radiation Angle coefficient of photovoltaic module to the sky |
| Xm-gro | the radiation Angle coefficient of photovoltaic module to the ground |
| y | depth from the surface of the soil, m |
| Greek Symbols | |
| εsky | sky emissivity |
| αm | absorption coefficient of photovoltaic module |
| αg | inner glass absorption coefficient |
| τm | transmittance |
| λ | fan coil supply air |
| Φ | absorbed radiation, W |
| ν | kinematic viscosity |
| ρm | density |
| Subscripts | |
| a | outdoor air |
| g | inner glass |
| m | photovoltaic module |
| sky | sky |
| gro | ground |
| Abbreviation | |
| BIPV | building integrated photovoltaics |
| VPV IGU | vacuum photovoltaic insulating glass unit |
References
- Zhou, S.; Tong, Q.; Pan, X.; Cao, M.; Wang, H.; Gao, J.; Ou, X. Research on low-carbon energy transformation of China necessary to achieve the Paris agreement goals: A global perspective. Energy Econ. 2021, 95, 105137. [Google Scholar] [CrossRef]
- Mangkuto, R.A.; Rohmah, M.; Asri, A.D. Design optimisation for window size, orientation, and wall reflectance with regard to various daylight metrics and lighting energy demand: A case study of buildings in the tropics. Appl. Energy 2016, 164, 211–219. [Google Scholar] [CrossRef]
- Wang, M.; Li, T.; Li, C.; Zhou, H.; Ju, X.; Tang, W.; Han, Y.; Xu, S. Optimizing Solar Power Generation in Urban Industrial Blocks: The Impact of Block Typology and PV Material Performance. Buildings 2024, 14, 1914. [Google Scholar] [CrossRef]
- Peng, C.; Huang, Y.; Wu, Z. Building-integrated photovoltaics (BIPV) in architectural design in China. Energy Build. 2011, 43, 3592–3598. [Google Scholar] [CrossRef]
- Zhang, X.; Zhao, X.; Smith, S.; Xu, J.; Yu, X. Review of R&D progress and practical application of the solar photovoltaic/thermal (PV/T) technologies. Renew. Sustain. Energy Rev. 2012, 16, 599–617. [Google Scholar]
- Zhao, R.; Zhang, W.; Huang, F.; Yao, L. Coupled optical-thermal-electrical modelling of translucent photovoltaic curtain wall considering indoor lighting. Sol. Energy 2024, 272, 112481. [Google Scholar] [CrossRef]
- Chen, S.; Zhang, Z.; Wang, C.; Tan, L.; Liu, H.; Yuan, H.; Zhang, R.; Hu, R. Evaluation Model of Distributed Photovoltaic Utilization in Urban Built-Up Area. Buildings 2024, 14, 943. [Google Scholar] [CrossRef]
- Bonomo, P.; Frontini, F. Building Integrated Photovoltaics (BIPV): Analysis of the Technological Transfer Process and Innovation Dynamics in the Swiss Building Sector. Buildings 2024, 14, 1510. [Google Scholar] [CrossRef]
- Zhang, C.; Ji, J.; Wang, C.; Ke, W. Annual analysis and comparison of the comprehensive performance of a CdTe PV ventilated window integrated with vacuum glazing in different climate regions. Renew. Energy 2024, 223, 120029. [Google Scholar] [CrossRef]
- Choi, Y. Increasing the Utilization of Solar Energy through the Performance Evaluation of Air-Based Photovoltaic Thermal Systems. Buildings 2024, 14, 1219. [Google Scholar] [CrossRef]
- Tan, C.N.-L. Toward an integrated framework for examining the addictive use of smartphones among young adults. Asian J. Soc. Health Behav. 2023, 6, 119–125. [Google Scholar] [CrossRef]
- Huang, J.; Chen, X.; Yang, H.; Zhang, W. Numerical investigation of a novel vacuum photovoltaic curtain wall and integrated optimization of photovoltaic envelope systems. Appl. Energy 2018, 229, 1048–1060. [Google Scholar] [CrossRef]
- Wang, M.; Peng, J.; Li, N.; Yang, H.; Wang, C.; Li, X.; Lu, T. Comparison of energy performance between PV double skin facades and PV insulating glass units. Appl. Energy 2017, 194, 148–160. [Google Scholar] [CrossRef]
- Jiru, T.E.; Tao, Y.-X.; Haghighat, F. Airflow and heat transfer in double skin facades. Energy Build. 2011, 43, 2760–2766. [Google Scholar] [CrossRef]
- Zhou, J.; Chen, Y. A review on applying ventilated double-skin facade to buildings in hot-summer and cold-winter zone in China. Renew. Sustain. Energy Rev. 2010, 14, 1321–1328. [Google Scholar] [CrossRef]
- Barbosa, S.; Ip, K. Perspectives of double skin façades for naturally ventilated buildings: A review. Renew. Sustain. Energy Rev. 2014, 40, 1019–1029. [Google Scholar] [CrossRef]
- Guo, W.; Kong, L.; Chow, T.; Li, C.; Zhu, Q.; Qiu, Z.; Li, L.; Wang, Y.; Riffat, S.B. Energy performance of photovoltaic (PV) windows under typical climates of China in terms of transmittance and orientation. Energy 2020, 213, 118794. [Google Scholar] [CrossRef]
- Eke, R.; Senturk, A. Monitoring the performance of single and triple junction amorphous silicon modules in two building integrated photovoltaic (BIPV) installations. Appl. Energy 2013, 109, 154–162. [Google Scholar] [CrossRef]
- Han, J.; Lu, L.; Yang, H. Numerical evaluation of the mixed convective heat transfer in a double-pane window integrated with see-through a-Si PV cells with low-e coatings. Appl. Energy 2010, 87, 3431–3437. [Google Scholar] [CrossRef]
- Bahiraei, M.; Monavari, A.; Moayedi, H. Second law assessment of nanofluid flow in a channel fitted with conical ribs for utilization in solar thermal applications: Effect of nanoparticle shape. Int. J. Heat Mass Transf. 2020, 151, 119387. [Google Scholar] [CrossRef]
- He, W.; Zhang, Y.X.; Sun, W.; Hou, J.X.; Jiang, Q.Y.; Ji, J. Experimental and numerical investigation on the performance of amorphous silicon photovoltaics window in East China. Build. Environ. 2011, 46, 363–369. [Google Scholar] [CrossRef]
- Peng, J.; Lu, L.; Yang, H. An experimental study of the thermal performance of a novel photovoltaic double-skin facade in Hong Kong. Sol. Energy 2013, 97, 293–304. [Google Scholar] [CrossRef]
- Peng, J.; Lu, L.; Yang, H.; Ma, T. Comparative study of the thermal and power performances of a semi-transparent photovoltaic façade under different ventilation modes. Appl. Energy 2015, 138, 572–583. [Google Scholar] [CrossRef]
- Sun, Y.; Shanks, K.; Baig, H.; Zhang, W.; Hao, X.; Li, Y.; He, B.; Wilson, R.; Liu, H.; Sundaram, S.; et al. Integrated semi-transparent cadmium telluride photovoltaic glazing into windows: Energy and daylight performance for different architecture designs. Appl. Energy 2018, 231, 972–984. [Google Scholar] [CrossRef]
- Chow, T.T.; Fong, K.F.; He, W.; Lin, Z.; Chan, A.L.S. Performance evaluation of a PV ventilated window applying to office building of Hong Kong. Energy Build. 2007, 39, 643–650. [Google Scholar] [CrossRef]
- Chehab, O. The intelligent façade photovoltaic and architecture. Renew. Energy 1994, 5, 188–204. [Google Scholar] [CrossRef]
- Miyazaki, T.; Akisawa, A.; Kashiwagi, T. Energy savings of office buildings by the use of semi-transparent solar cells for windows. Renew. Energy 2005, 30, 281–304. [Google Scholar] [CrossRef]
- Wang, Z.; Li, Y.; Wang, K.; Huang, Z. Environment-adjusted operational performance evaluation of solar photovoltaic power plants: A three stage efficiency analysis. Renew. Sustain. Energy Rev. 2017, 76, 1153–1162. [Google Scholar] [CrossRef]
- Wang, D.D.; Sueyoshi, T. Assessment of large commercial rooftop photovoltaic system installations: Evidence from California. Appl. Energy 2017, 188, 45–55. [Google Scholar] [CrossRef]
- Nakamoto, Y.; Eguchi, S. How do seasonal and technical factors affect generation efficiency of photovoltaic power plants? Renew. Sustain. Energy Rev. 2024, 199, 114441. [Google Scholar] [CrossRef]
- Hong, J.; Park, J.; Kim, S.; Lim, C.; Kong, M. Energy Analysis of a Net-Zero Energy Building Based on Long-Term Measured Data: A Case Study in South Korea. Buildings 2023, 13, 3134. [Google Scholar] [CrossRef]
- Rounis, E.D.; Athienitis, A.K.; Stathopoulos, T. BIPV/T curtain wall systems: Design, development and testing. J. Build. Eng. 2021, 42, 103019. [Google Scholar] [CrossRef]
- Peng, J.; Curcija, D.C.; Thanachareonkit, A.; Lee, E.S.; Goudey, H.; Jonsson, J.; Selkowitz, S.E. Comparative study on the overall energy performance between photovoltaic and Low-E insulated glass units. Sol. Energy 2021, 214, 443–456. [Google Scholar] [CrossRef]
- Sparrow, E.M.; Cur, N. Turbulent Heat Transfer in a Symmetrically or Asymmetrically Heated Flat Rectangular Duct With Flow Separation at Inlet. J. Heat Transf. 1982, 104, 82–89. [Google Scholar] [CrossRef]
- Khalifa, A.-J.N. Natural convective heat transfer coefficient—A review: I. Isolated vertical and horizontal surfaces. Energy Convers. Manag. 2001, 42, 491–504. [Google Scholar] [CrossRef]
- Khalvati, F.; Omidvar, A. Summer study on thermal performance of an exhausting airflow window in evaporatively-cooled buildings. Appl. Therm. Eng. 2019, 153, 147–158. [Google Scholar] [CrossRef]
- Vosough Yazdani, S.; Madanipour, K.; Ahmadi, M. Measurement of convective heat transfer coefficient and the Nusselt number by moiré deflectometry technique. Opt. Lasers Eng. 2024, 176, 108095. [Google Scholar] [CrossRef]
- Brinkworth, B.J. Estimation of flow and heat transfer for the design of PV cooling ducts. Sol. Energy 2000, 69, 413–420. [Google Scholar] [CrossRef]
- Wang, M.; Li, P.; Liu, W. Generic mathematical formulation of the total heat transfer coefficients between heated radiant floor surfaces and rooms. Build. Environ. 2022, 211, 108701. [Google Scholar] [CrossRef]
- Cholewa, T.; Anasiewicz, R.; Siuta-Olcha, A.; Skwarczynski, M.A. On the heat transfer coefficients between heated/cooled radiant ceiling and room. Appl. Therm. Eng. 2017, 117, 76–84. [Google Scholar] [CrossRef]
- Bu, F.; Yan, D.; Tan, G.; An, J. A novel approach based on equivalent sky radiative temperature for quick computation of radiative cooling in building energy simulation. Renew. Energy 2024, 221, 119820. [Google Scholar] [CrossRef]
- Kalogirou, S.; Florides, G. Measurements of Ground Temperature at Various Depths. In Proceedings of the 3rd International Conference on Sustainable Energy Technologies, Nottingham, UK, 28–30 June 2004. [Google Scholar]
- Hao, G.Q.; Zhang, R.; Li, H.B.; Liu, C.; Yuan, X.; Ye, X.J.; Li, S.Z.; Yang, N.; Zhang, J.P. Study on thermal performance of photovoltaic glass curtain wall. Build. Sci. 2017, 33, 65–71+88. (In Chinese) [Google Scholar]
- Largot, S.; Bessous, N.; Ghodbane, M.; Boumeddane, B.; Hussain, F.; Shafi, M.; Zhang, B.; Al-Fatlawi, A.W.; Borni, A. Experimental study on the effect of operational and environmental conditions on photovoltaic modules productivity in El-Oued region, algeria. Energy Convers. Manag. X 2024, 23, 100655. [Google Scholar] [CrossRef]
- Raya-Armenta, J.M.; Bazmohammadi, N.; Vasquez, J.C.; Guerrero, J.M. A short review of radiation-induced degradation of III–V photovoltaic cells for space applications. Sol. Energy Mater. Sol. Cells 2021, 233, 111379. [Google Scholar] [CrossRef]
- Hamzat, A.K.; Sahin, A.Z.; Omisanya, M.I.; Alhems, L.M. Advances in PV and PVT cooling technologies: A review. Sustain. Energy Technol. Assess. 2021, 47, 101360. [Google Scholar] [CrossRef]
- Kulkarni, R.S.; Talange, D.B.; Mate, N.V. Output Estimation of Solar Photovoltaic (PV) System. In Proceedings of the 2018 International Symposium on Advanced Electrical and Communication Technologies (ISAECT), Rabat, Morocco, 21–23 November 2018. [Google Scholar]
- Qiu, T.; Wang, L.; Lu, Y.; Zhang, M.; Qin, W.; Wang, S.; Wang, L. Potential assessment of photovoltaic power generation in China. Renew. Sustain. Energy Rev. 2022, 154, 111900. [Google Scholar] [CrossRef]
- Amasyali, K.; El-Gohary, N.M. A review of data-driven building energy consumption prediction studies. Renew. Sustain. Energy Rev. 2018, 81, 1192–1205. [Google Scholar] [CrossRef]
- Liu, B.Y.H.; Jordan, R.C. The long-term average performance of flat-plate solar-energy collectors: With design data for the U.S., its outlying possessions and Canada. Sol. Energy 1963, 7, 53–74. [Google Scholar] [CrossRef]
- Yadav, A.K.; Chandel, S.S. Tilt angle optimization to maximize incident solar radiation: A review. Renew. Sustain. Energy Rev. 2013, 23, 503–513. [Google Scholar] [CrossRef]
- Olivieri, L.; Caamaño-Martin, E.; Olivieri, F.; Neila, J. Integral energy performance characterization of semi-transparent photovoltaic elements for building integration under real operation conditions. Energy Build. 2014, 68, 280–291. [Google Scholar] [CrossRef]
- Ran, J.; Song, Y.; Zhou, S.; Yang, K.; Liu, J.; Tian, Z. A bi-level optimization method for regional integrated energy system considering uncertainty and load prediction under climate change. J. Build. Eng. 2024, 84, 108527. [Google Scholar] [CrossRef]
- Ran, J.; Qiu, Y.; Liu, J.; Zhu, X.; Liu, J.; Tian, Z. Coordinated optimization design of buildings and regional integrated energy systems based on load prediction in future climate conditions. Appl. Therm. Eng. 2024, 241, 122338. [Google Scholar] [CrossRef]


Disclaimer/Publisher’s Note: The statements, opinions and data contained in all publications are solely those of the individual author(s) and contributor(s) and not of MDPI and/or the editor(s). MDPI and/or the editor(s) disclaim responsibility for any injury to people or property resulting from any ideas, methods, instructions or products referred to in the content. |
© 2024 by the authors. Licensee MDPI, Basel, Switzerland. This article is an open access article distributed under the terms and conditions of the Creative Commons Attribution (CC BY) license (https://creativecommons.org/licenses/by/4.0/).