Abstract
The roof is the part of a building that is exposed to solar radiation for the longest period, making green roofs particularly effective in reducing air conditioning energy consumption during the summer. This study aims to assess the advantages of modular green roofs in terms of energy savings and cost reduction during the summer in Xuzhou. By conducting field measurements and surveys under both air-conditioned and non-air-conditioned conditions and utilizing building energy simulation tools, the performance of green roofs with different parameters was compared. Using EnergyPlus, factors such as soil thickness, thermal conductivity, and leaf area index were simulated. The results indicated that green roofs have superior thermal performance in summer, with the daily cooling load per unit area for top-floor rooms being 1.05 kWh/m2, 0.21 kWh/m2 lower than that for bare roofs, achieving an energy saving rate of 16.7%. It is recommended that soil thickness not exceed 0.3 m and insulation thickness not exceed 0.05 m or be set to 0 m. Take building no. 2 of the Xuzhou material market as an example: with the optimized green roof, the energy saving rate increased to 27.0%, which is 12.4% higher than that of the original green roof. The suggested cost for modular green roofs is 204 RMB/m2.
1. Introduction
In recent years, China’s total energy consumption has ranked first in the world, but its energy utilization efficiency remains low. Moreover, the energy consumption of the building industry is expected to account for 45.5% of the total societal energy consumption [1]. As people’s demand for green spaces increases, it becomes increasingly challenging to allocate large areas for vegetation and beautification due to the scarcity of urban land. Therefore, expanding green spaces within the limited urban environment has become a significant challenge. The roof, often referred to as the “fifth facade” of a building, has become the focus of research. Studies on green roofs have accumulated substantial findings, showing that green roofs, as an effective environmental solution, can increase green areas and reduce building energy consumption [2,3,4,5,6].
The definition of a green roof can be understood narrowly and broadly. Narrowly, it refers to the greening of rooftops of various buildings, structures, platforms, or terraces, typically consisting of vegetation, soil, a filter layer, and a drainage layer. Broadly, it includes planting trees and flowers on the rooftops, terraces, balconies, or artificial hills of various buildings, structures, urban walls, bridges, etc., to create gardens. The “green roof” studied in this paper falls under a narrow definition, referring to the planting of vegetation on building roofs by laying planting soil or setting planting containers.
The thermal impact of green roofs has become a major research topic. In recent years, studies using on-site measurements, experiments, and computational methods to analyze the thermal effects of green roofs have yielded quantitative data. Onmura et al. performed on-site measurements of vegetated roofs in Japan and found that surface temperatures decreased by about 30–60 °C [7]. Wind tunnel experiments and numerical calculations also confirmed the evaporative cooling effect of green roofs. Yumofopoulou conducted a computational study on the thermal performance of vegetated roofs, concluding that green roofs can enhance a building’s thermal performance but cannot replace insulation [8]. These studies indicate that collecting data through on-site measurements is feasible. Regarding heat transfer in green roofs, Kostadinović et al. studied the performance of green roofs in a humid subtropical climate and found that heat flux was reduced by 57% [9]. Huang et al. analyzed the cooling effects of four types of plants and found that green roofs covered with shrubs could reduce up to 83% of the heat [10]. Research indicates that the most important characteristics of vegetation in the heat transfer process include leaf area index (LAI), leaf height, coverage, albedo, and stomatal resistance [11]. Jaffal et al. developed a model to analyze the thermal characteristics of green roofs, setting four different LAI values (0.5, 2, 3.5, and 5). The results showed that increasing the LAI could reduce indoor air temperature and decrease cooling demand in summer [12]. Another simulation study found that installing green roofs reduced indoor temperatures by 1.1 K during typical summer days and increased them by 0.7 K during typical winter days in non-air-conditioned buildings [13]. The study also showed that the surface temperature of green roofs was 15 K lower than that of conventional roofs [14]. Further research indicates that green roofs can reduce the peak temperature of roof membranes and delay the occurrence of this peak temperature from 2 PM to 7 PM, with a maximum delay of 5 h. Studies show that compared to conventional roofs, green roofs can significantly reduce surface temperatures.
Moreover, some scholars have conducted seasonal comparative studies of roof greening in different climate zones. An experimental study in the Midwest United States found that the heat flux of green roofs decreased by an average of 13% in winter and 167% in summer [15]. Additionally, another study evaluated green roof systems in a hot and rainy subtropical region, finding that internal temperatures significantly decreased during warm weather, while there was no difference compared to conventional roofs during cold weather [16]. This suggests that the energy-saving effects in summer may be greater than those in winter. Most international studies have been conducted in tropical, subtropical, and Mediterranean climates, while domestic research on green roofs has mainly focused on Chongqing, Hunan, Beijing, Guangzhou, Harbin, Shanghai, and Hong Kong.
In addition to reducing heat flux, green roofs also have a significant impact on energy savings. Some scholars simulated single-family homes with conventional and green roofs in a temperate climate in France. The results showed that during heating and cooling periods, green roofs achieved significant energy savings, particularly for non-insulated buildings (48% energy savings) and buildings with medium insulation (5 cm, 10% energy savings) [17]. Similarly, a simulation study conducted in a hotel in a temperate climate yielded similar results, showing that up to 48% of energy could be saved in non-insulated environments, 7% in moderately insulated environments, and less than 2% in highly insulated environments [18]. Previous research found that increasing soil thickness could reduce building energy consumption, and the continuous operation of green roofs could reduce annual cooling energy consumption by 34.9% [19]. A study in Saudi Arabia found that large-scale green roofs with soil depths of less than 15 cm could reduce energy consumption by about 8% [20]. A study conducted in Amman, Jordan, in the Mediterranean region, compared green roofs with traditional residential roofs and found that dense green roof systems with a soil depth of 25 cm reduced energy consumption by 17% compared that of to conventional roofs [21]. Research indicates that applying thicker soil layers can improve thermal performance in arid areas with high summer temperatures [17]. Some scholars suggest using photovoltaic (PV) panels as plant covers to provide shade and protect plants from high temperatures [22,23]. In a study conducted in Athens, the installation of a green roof system on a nursery building reduced the overall cooling load by 6% to 49% and the top floor’s cooling load by 12% to 87% [24]. A study in Shanghai found that green roofs reduced cooling and heating loads on the top floor of public buildings by 3.6% and 6.2%, respectively [4]. In three on-site measurements conducted in China, rooms with green roofs had indoor air temperatures about 0.95 °C, 0.8 °C, and 0.5 °C lower than those with bare roofs, ceramic roofs, and clay roofs, respectively, while the air conditioning power reduction rate for green roofs reached 15.2% [25]. In spring, summer, and autumn, the average internal surface temperature of green roofs was 10% lower than that of bare roofs, while in winter it was 20% higher. Overall, green roofs can reduce room electricity consumption by 18% [26]. Measurements also showed that green roofs outperformed cool roofs in terms of energy savings and carbon reduction benefits, with more stable internal surface temperature fluctuations and smaller temperature changes [27,28].
In summary, studies on green roofs have been conducted in many countries. However, these studies are limited to specific locations, climates, and plant types, and their data cannot be directly applied to the Xuzhou region. Previous studies on green roofs mainly focused on single-factor analysis, lacking multi-factor research, and research on building energy consumption and energy saving rates in Xuzhou is relatively scarce. Therefore, this paper will study multiple factors, focusing on energy saving rates and costs in the design and renovation of green roofs and applying the research results to practical projects.
The main objective of this study is to explore the impact of optimized green roof designs on energy savings and cost reduction compared to existing green roofs in the Xuzhou region. The study will use buildings without green roofs at the same location as a reference. Data will be collected through on-site measurements and surveys, investigating changes in the indoor thermal environment and air conditioning energy consumption in office buildings after the application of green roofs. Building energy simulation tools will be used to compare and analyze the optimized green roof design with the existing green roof design, focusing on the energy-saving potential of modular green roof systems.
2. Methods
2.1. Site and Climate Conditions
Xuzhou is a prefecture-level city in Jiangsu Province, China, located at 34.26° N latitude and 117.2° E longitude. It has a temperate monsoon climate with ample sunlight. The annual average temperature in Xuzhou is 14 °C, with an average maximum temperature of 32 °C and an average minimum temperature of −3 °C. The sunshine duration ranges from 52% to 57%, and the annual precipitation is between 800 and 930 mm. This study focuses on the urban area of Xuzhou, which includes the Gulou District, Quanshan District, Yunlong District, Tongshan District, and New District.
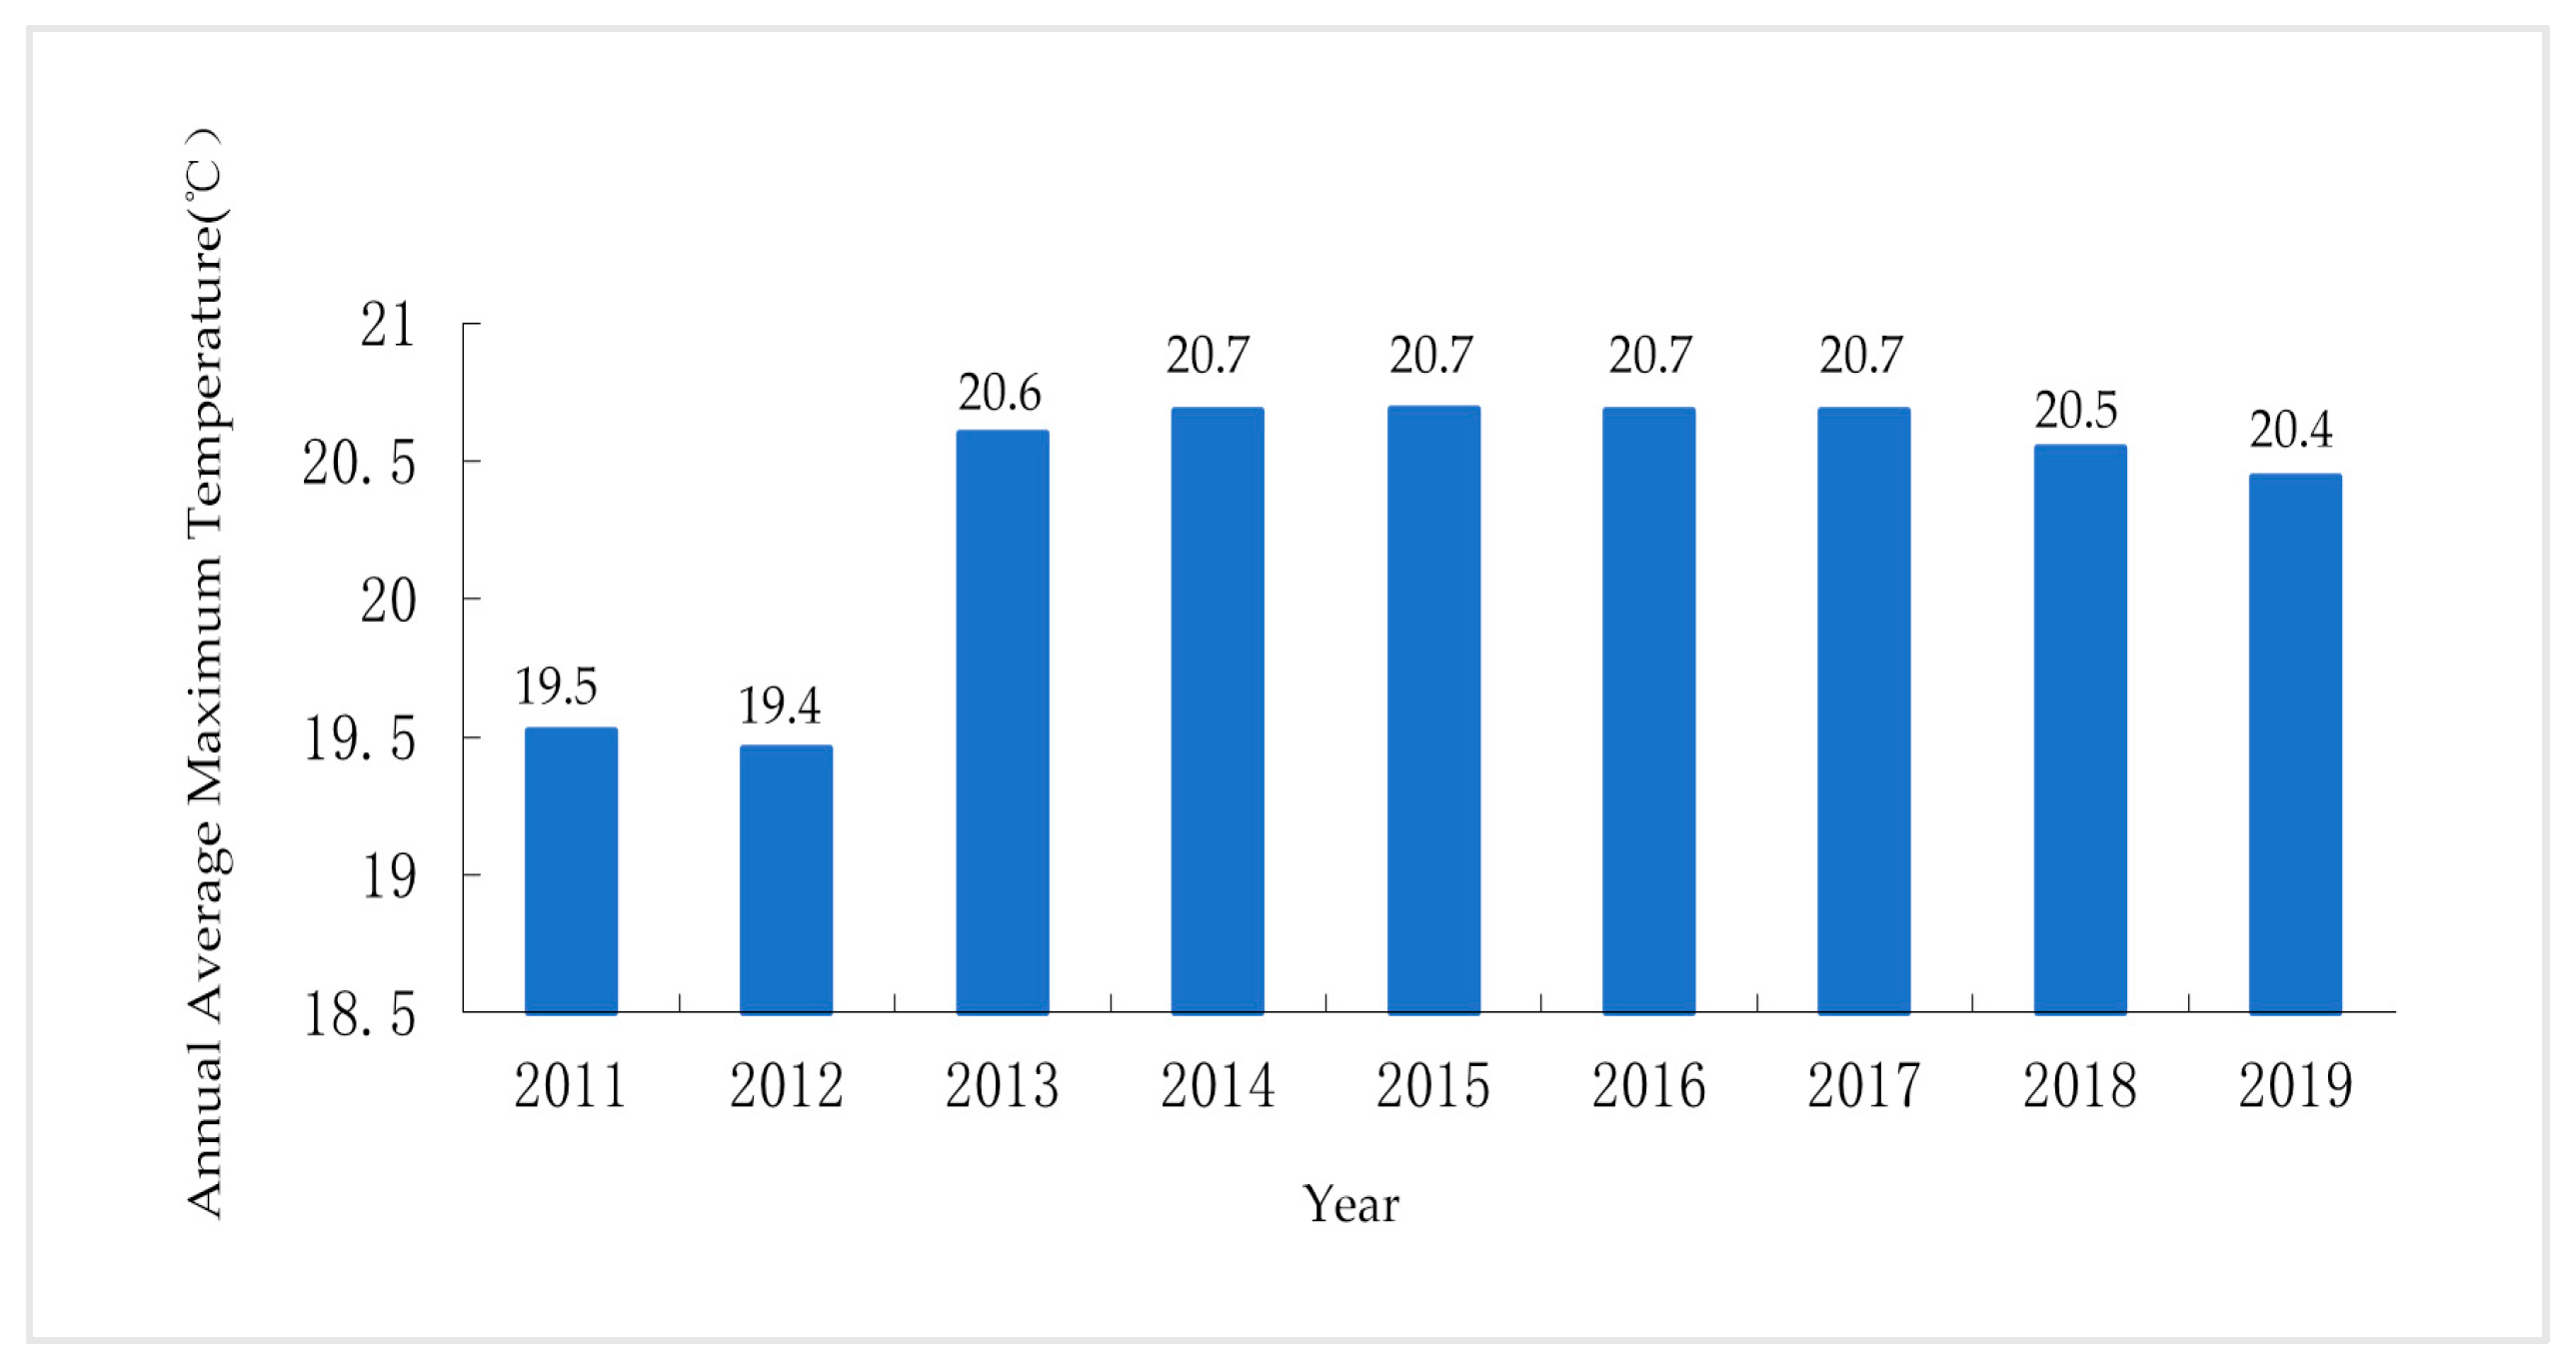
Analyzing the trend of average annual maximum temperatures from 2011 to 2019, it is evident that temperatures generally show an upward trend, as illustrated in the figure. The average maximum temperature in 2012 was 19.4 °C, rising to 20.6 °C in 2013, which is related to Xuzhou’s significant urban and construction development, leading to an increase in building areas. In recent years, Xuzhou has focused on ecological construction, actively promoting green buildings and green roofs and improving the urban environment. Since 2017, the average annual maximum temperature has gradually decreased, indicating that large-scale green roofs have a certain impact on reducing urban temperatures. Therefore, green roofs should receive more attention in building and landscape construction.
2.2. Research Location and Basic Building Characteristics
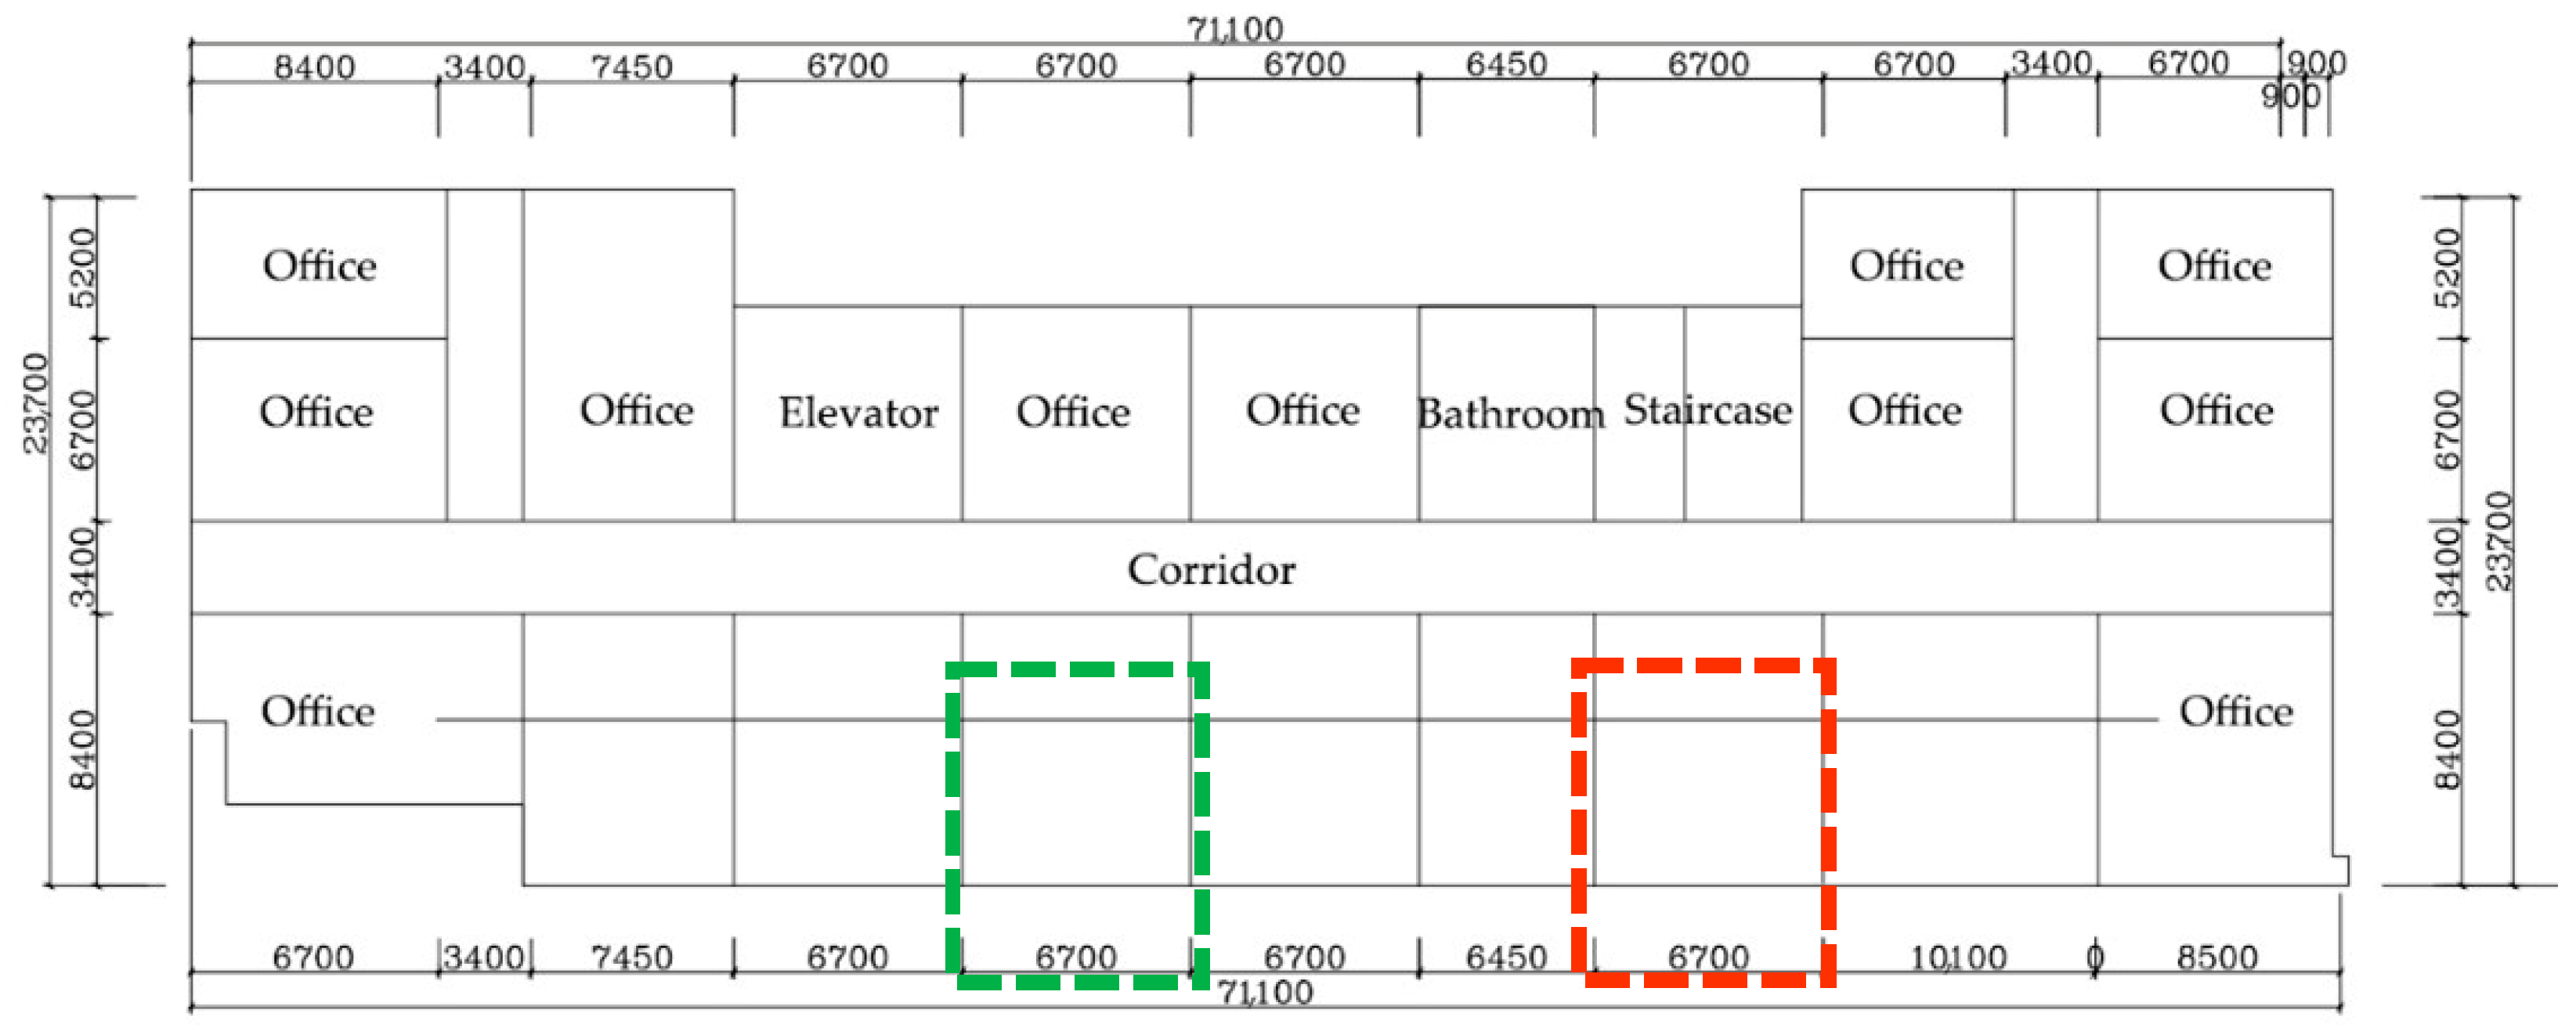
The on-site measurements were conducted at two locations: building 2 of the material market (formerly the Xiadian Timber Market) at no. 170 Xiadian Road, Gulou District (Figure 1) and the rooftop of the Jiangsu Jiatianxia elderly care service company at no. 137 Jiefang Road, Yunlong District. The rooftop of building 2 at the material market has no obstructions around it, so the measurements are not affected by shadows or reflected solar radiation, and air conditioning units are installed in the interior rooms. To avoid the influence of other external factors on the measurement results, simultaneous testing of two rooms, one with and one without greening, was necessary. The selected rooms are top-floor offices with the same orientation, structural dimensions, and air conditioning positions. The roof is flat, and the dimensions of the test room are 6.7 m (width) × 8.4 m (length) (Figure 2). The two tested rooms are separated by two other rooms to minimize the impact of heat transfer between rooms and lateral heat transfer through the roof.

Figure 1.
The average annual maximum temperature from 2011 to 2019.
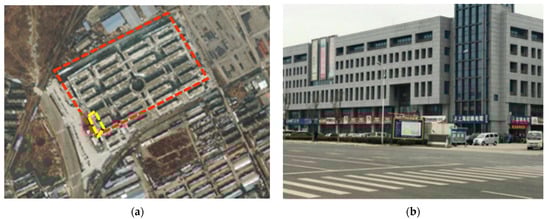
Figure 2.
(a) Experimental office building location; (b) facade of the experimental office building.
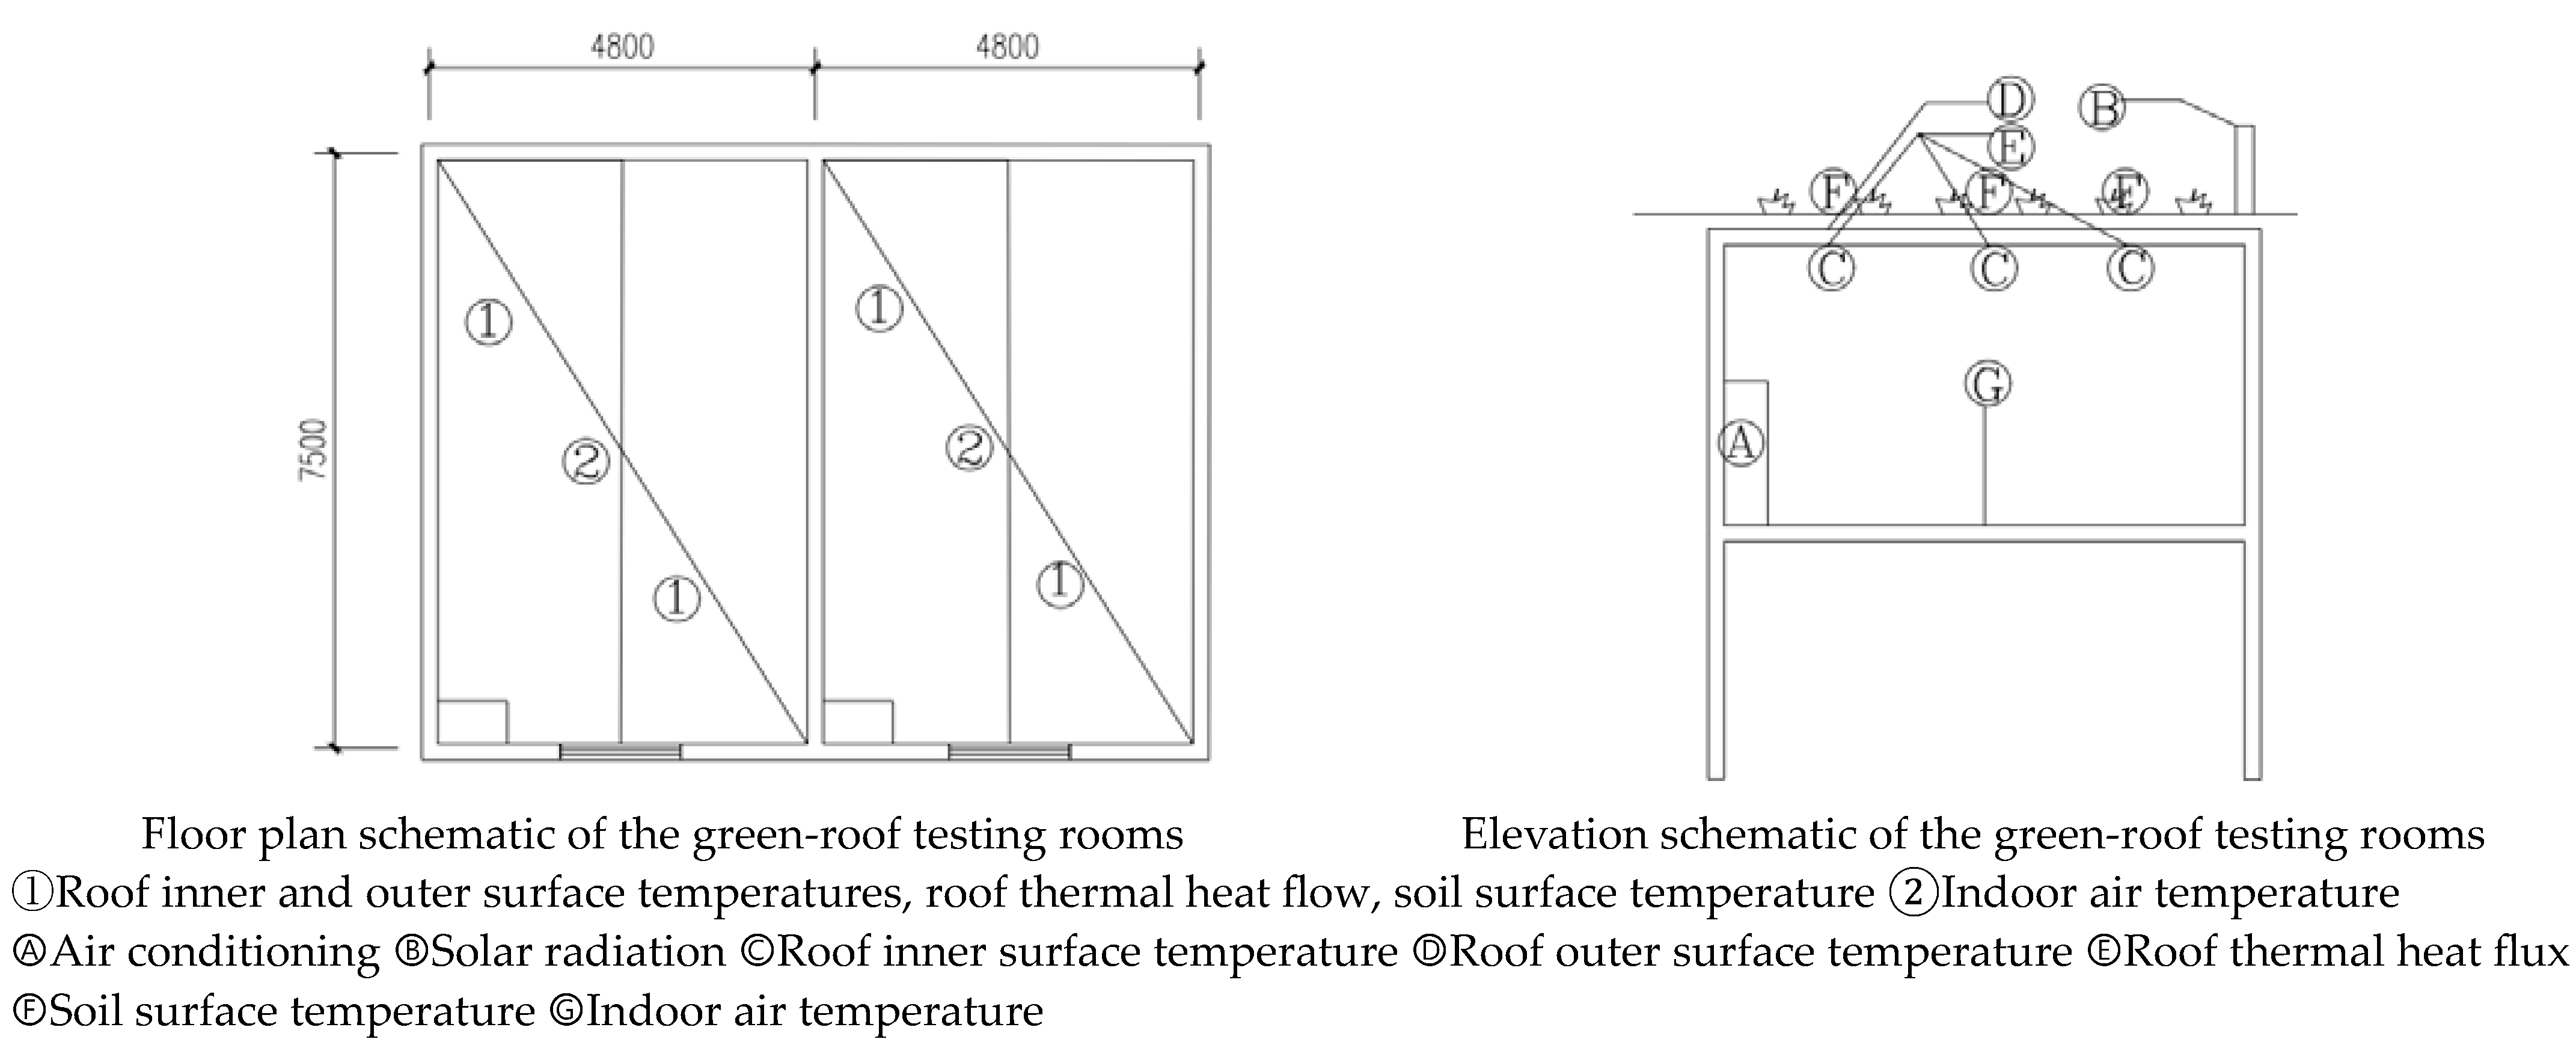
Building 2 of the material market has a reinforced concrete frame structure with a total construction area of 9931.9 square meters, including 9638.6 square meters aboveground and 499.3 square meters underground. The building has seven floors in total, six above ground and one underground, with a building height of 23.95 m. The selection of test rooms at the elderly care service company followed the same principles as that at the material market, with specific dimensions of 4.8 m (width) × 7.5 m (length).
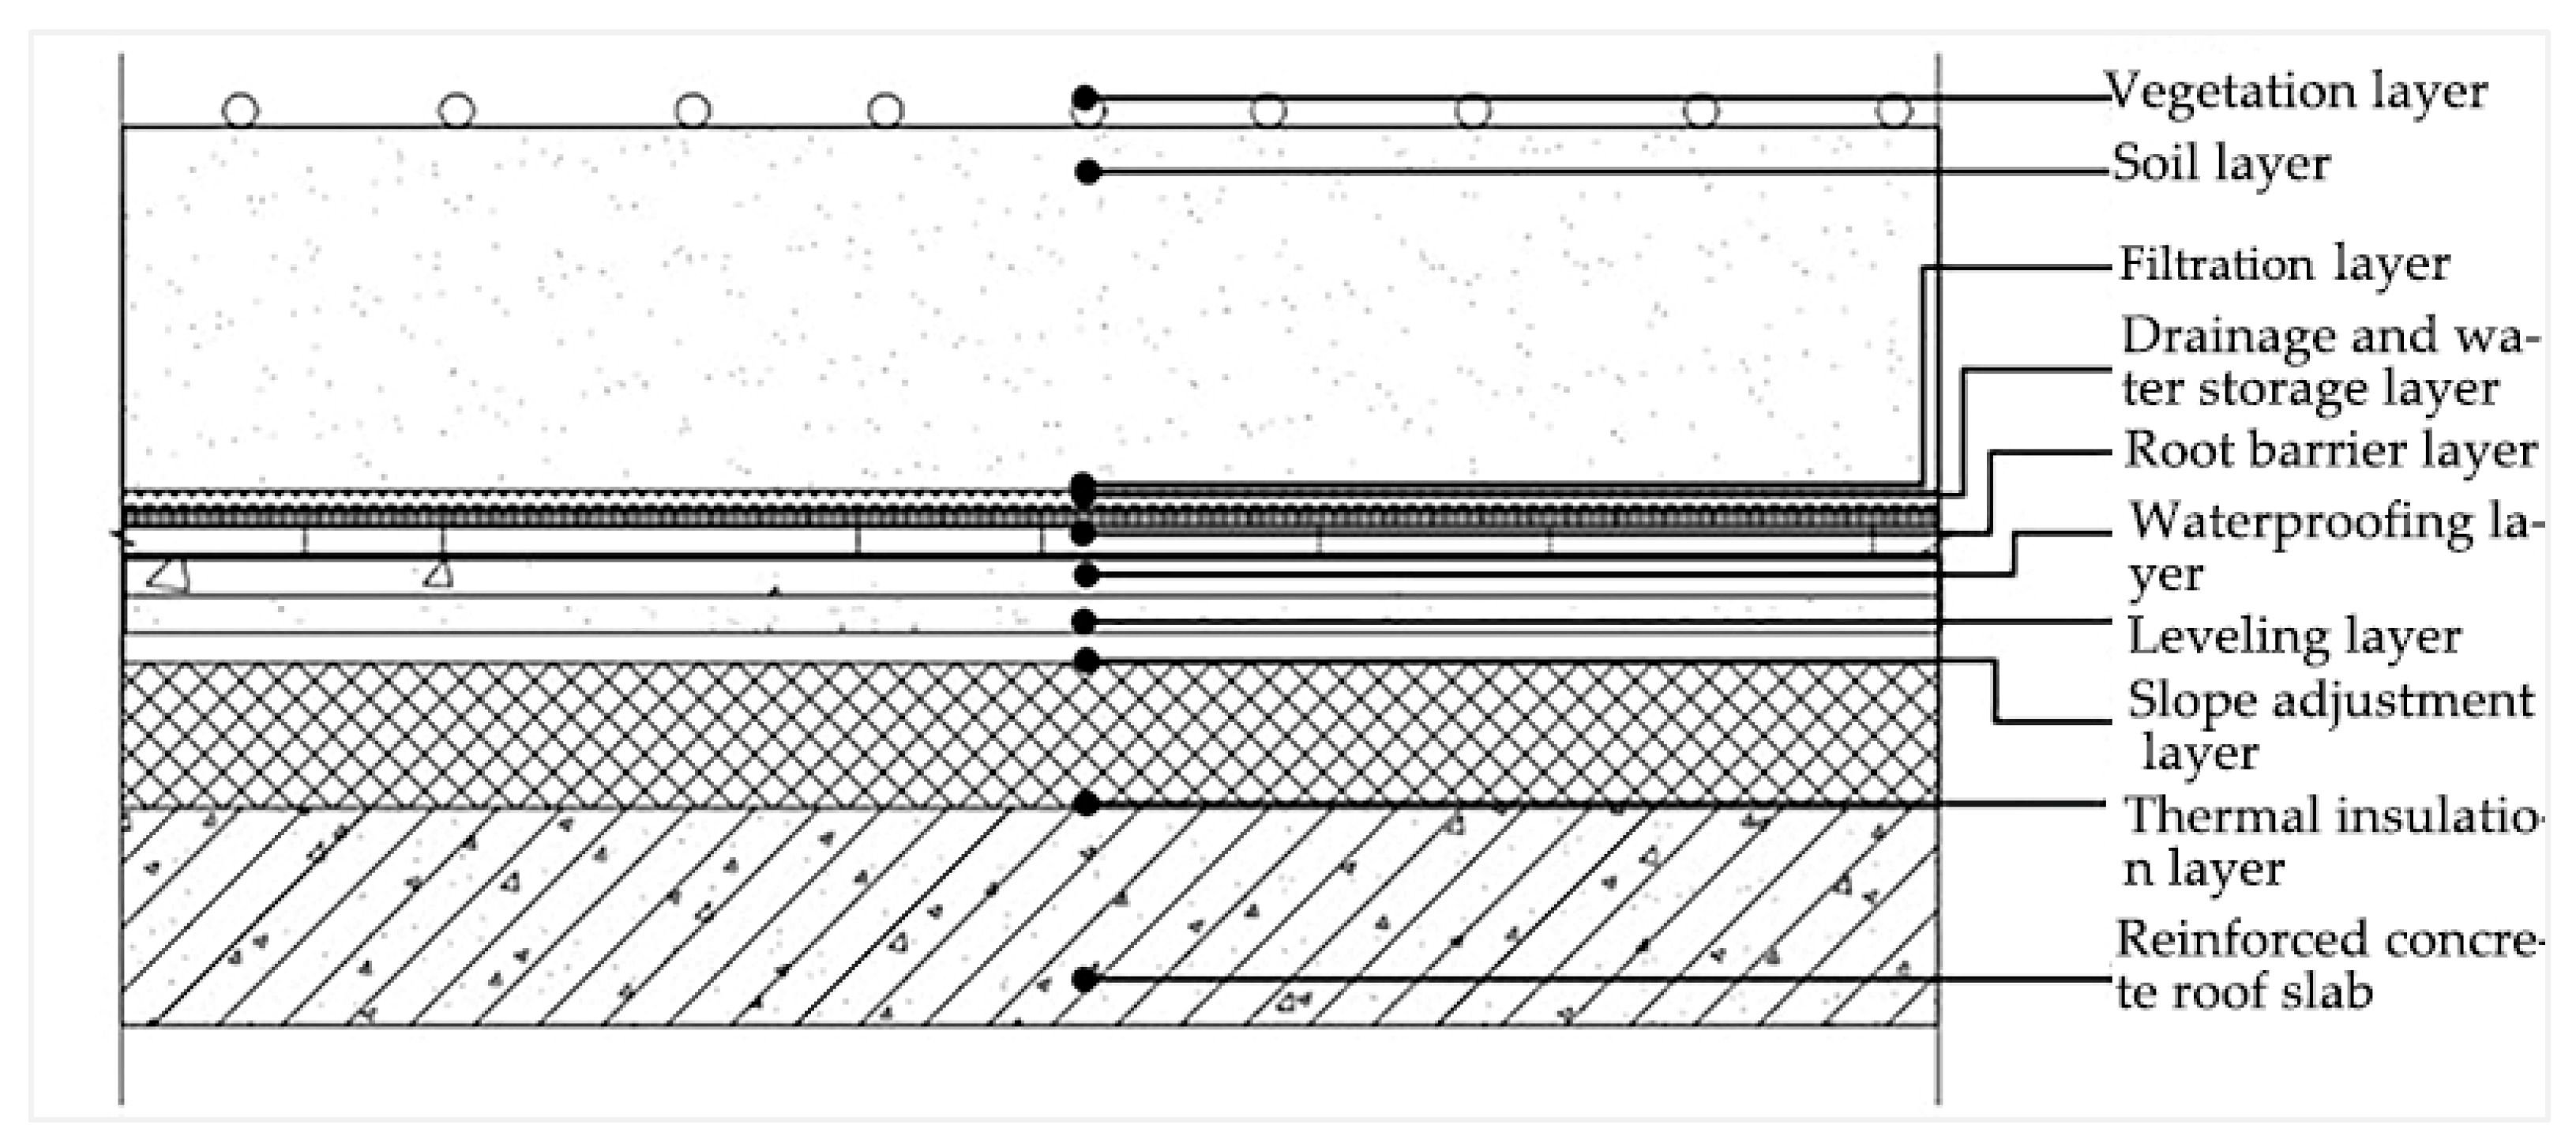
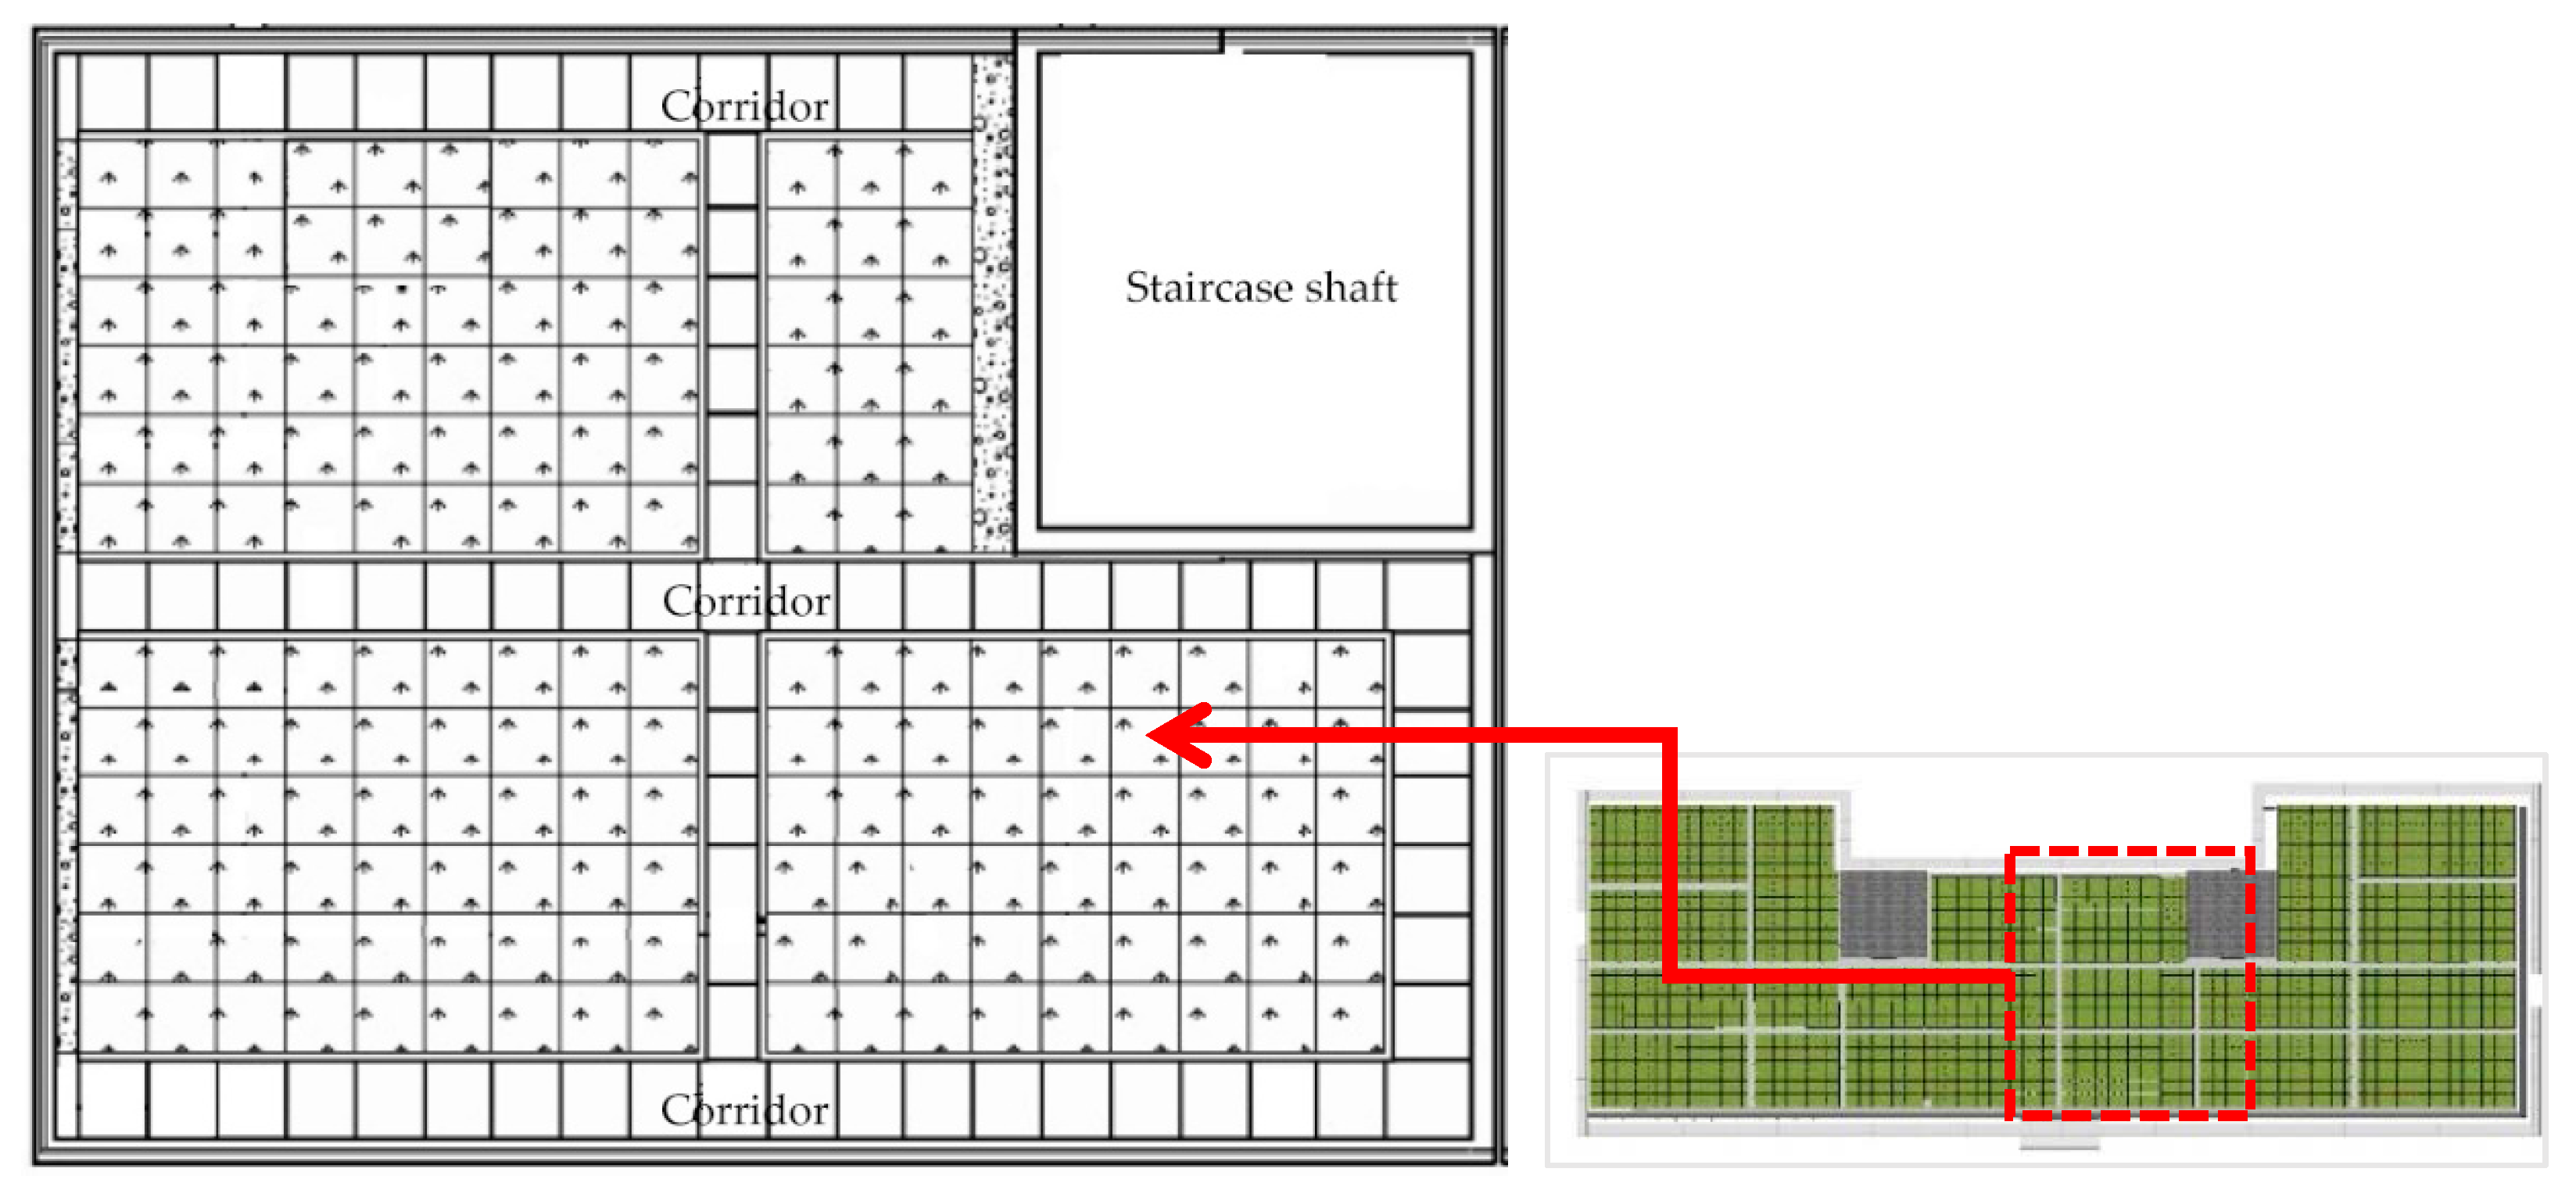
The roof construction primarily consists of the following layers from bottom to top: reinforced concrete roof slab with waterproofing, 20 mm thick cement slag slope, 20 mm thick 1:2.5 cement mortar leveling, 1.5 mm thick polymer waterproofing membrane, 60 mm thermal insulation layer, root barrier layer, drainage and water storage layer, filtration layer, 200 mm soil layer, and vegetation layer mainly comprising carpet grass, as shown in Figure 3 and Figure 4.
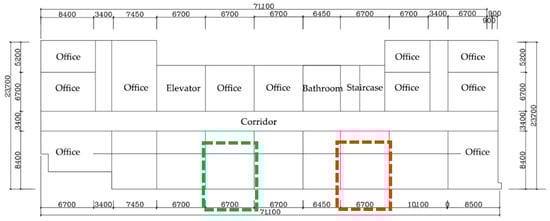
Figure 3.
Schematic diagram of the top floor of building 2 at the material market. Note: Test room 1 is a room with a green roof, while test room 2 is a room without a green roof.
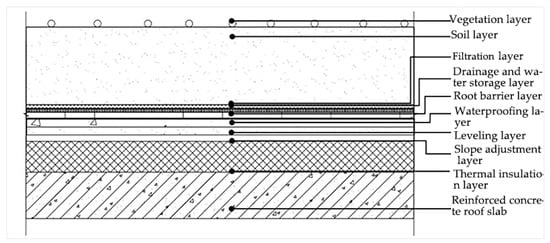
Figure 4.
Structure of the tested green roof.
2.3. Field Measurements
The current status of office buildings in Xuzhou was analyzed through on-site measurements and surveys. The measurements were conducted from 10 to 16 August 2023. The measurement conditions and parameters are detailed in Table 1, with 10–14 August representing air-conditioned conditions and 15–16 August representing non-air-conditioned conditions, during which there were continuous sunny days. The performance parameters of the air conditioning system are shown in Table 2.

Table 1.
Measured operating conditions and parameters.
Table 2.
Air conditioning performance parameters.
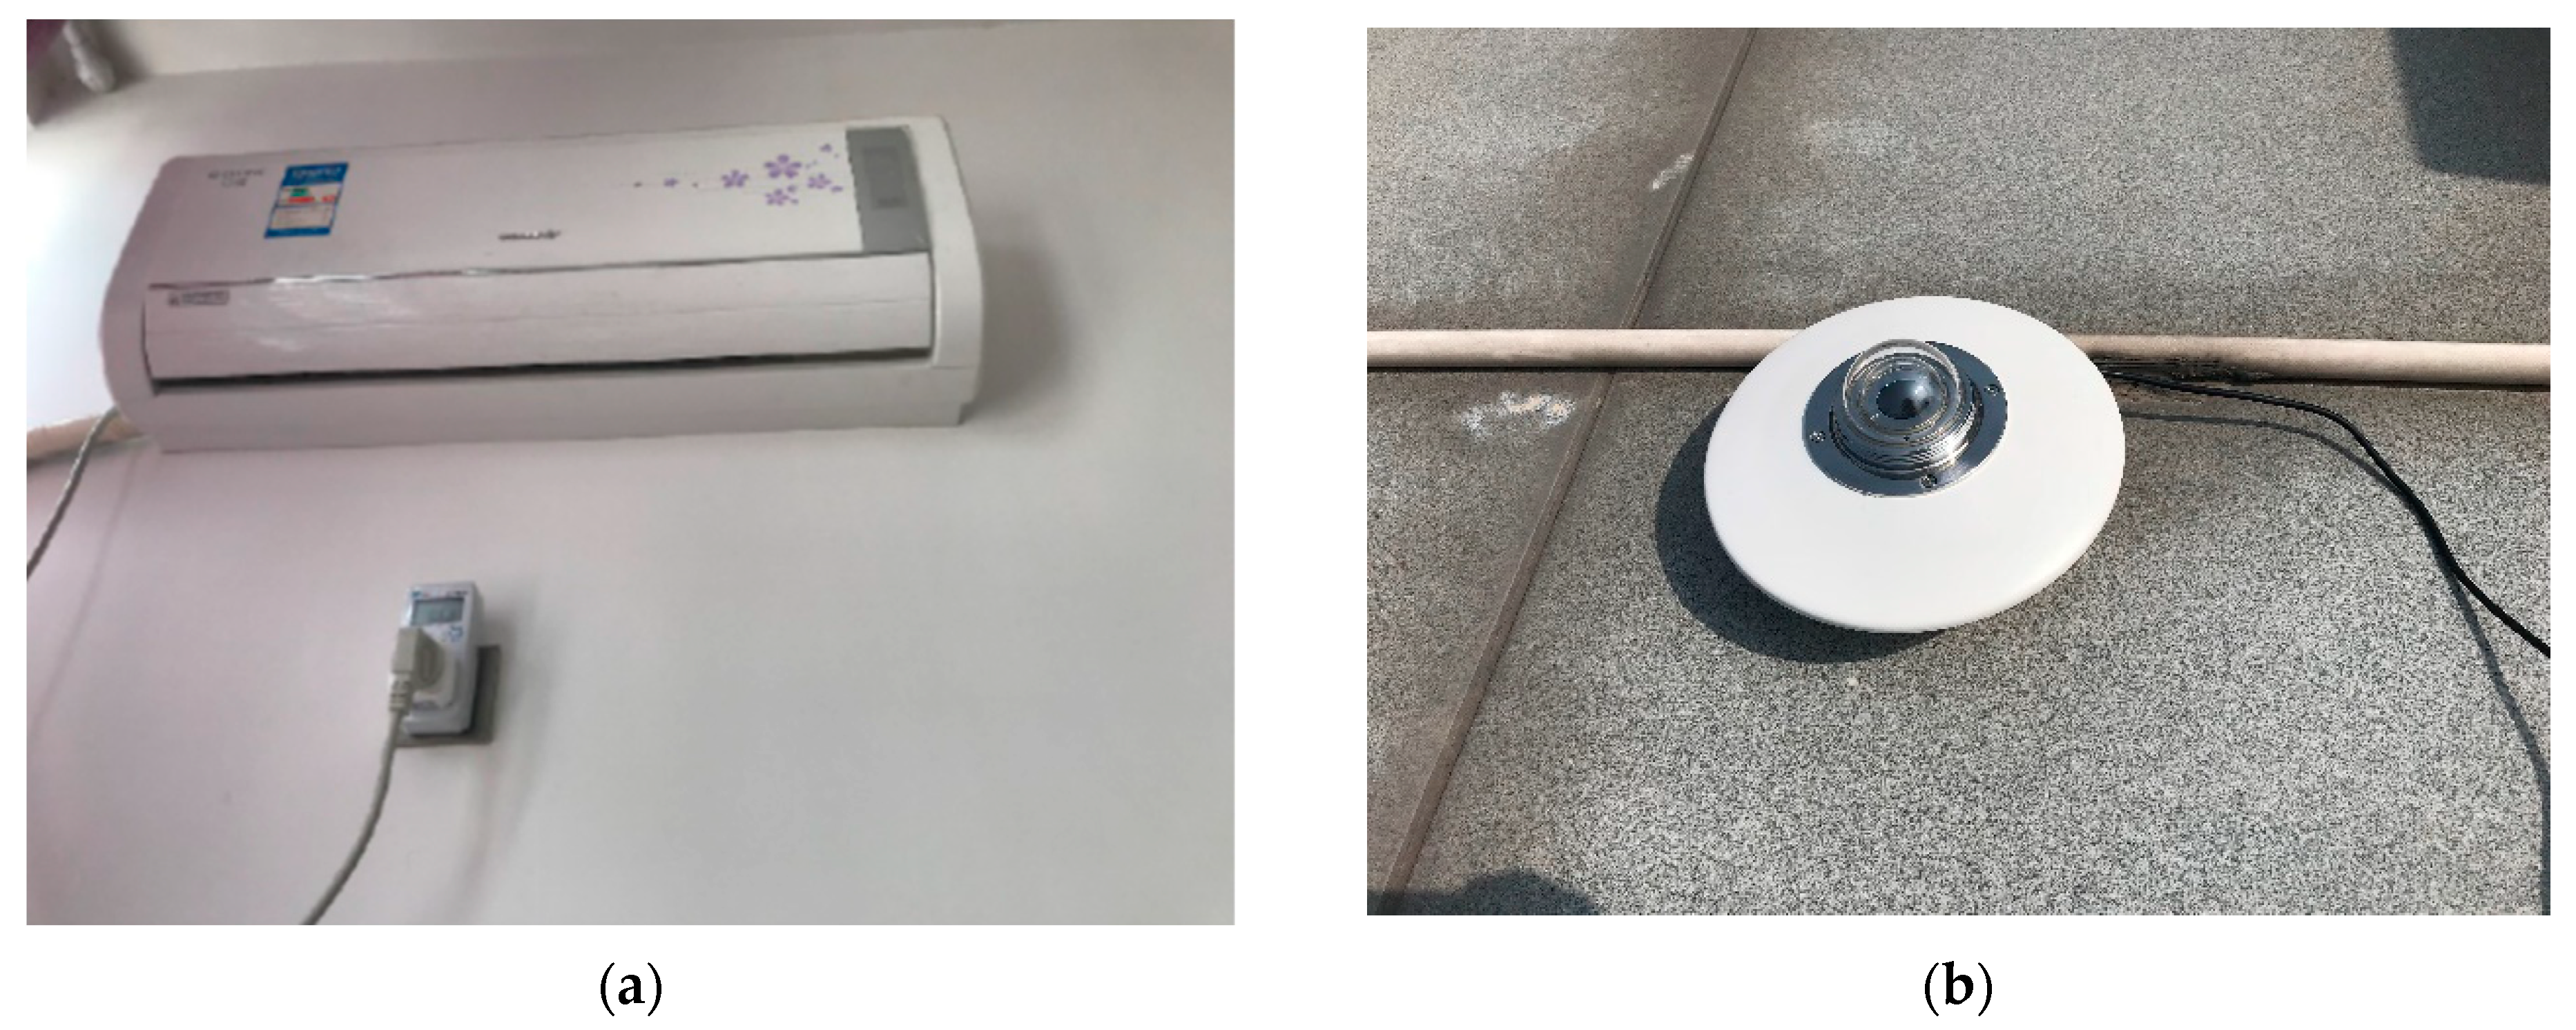
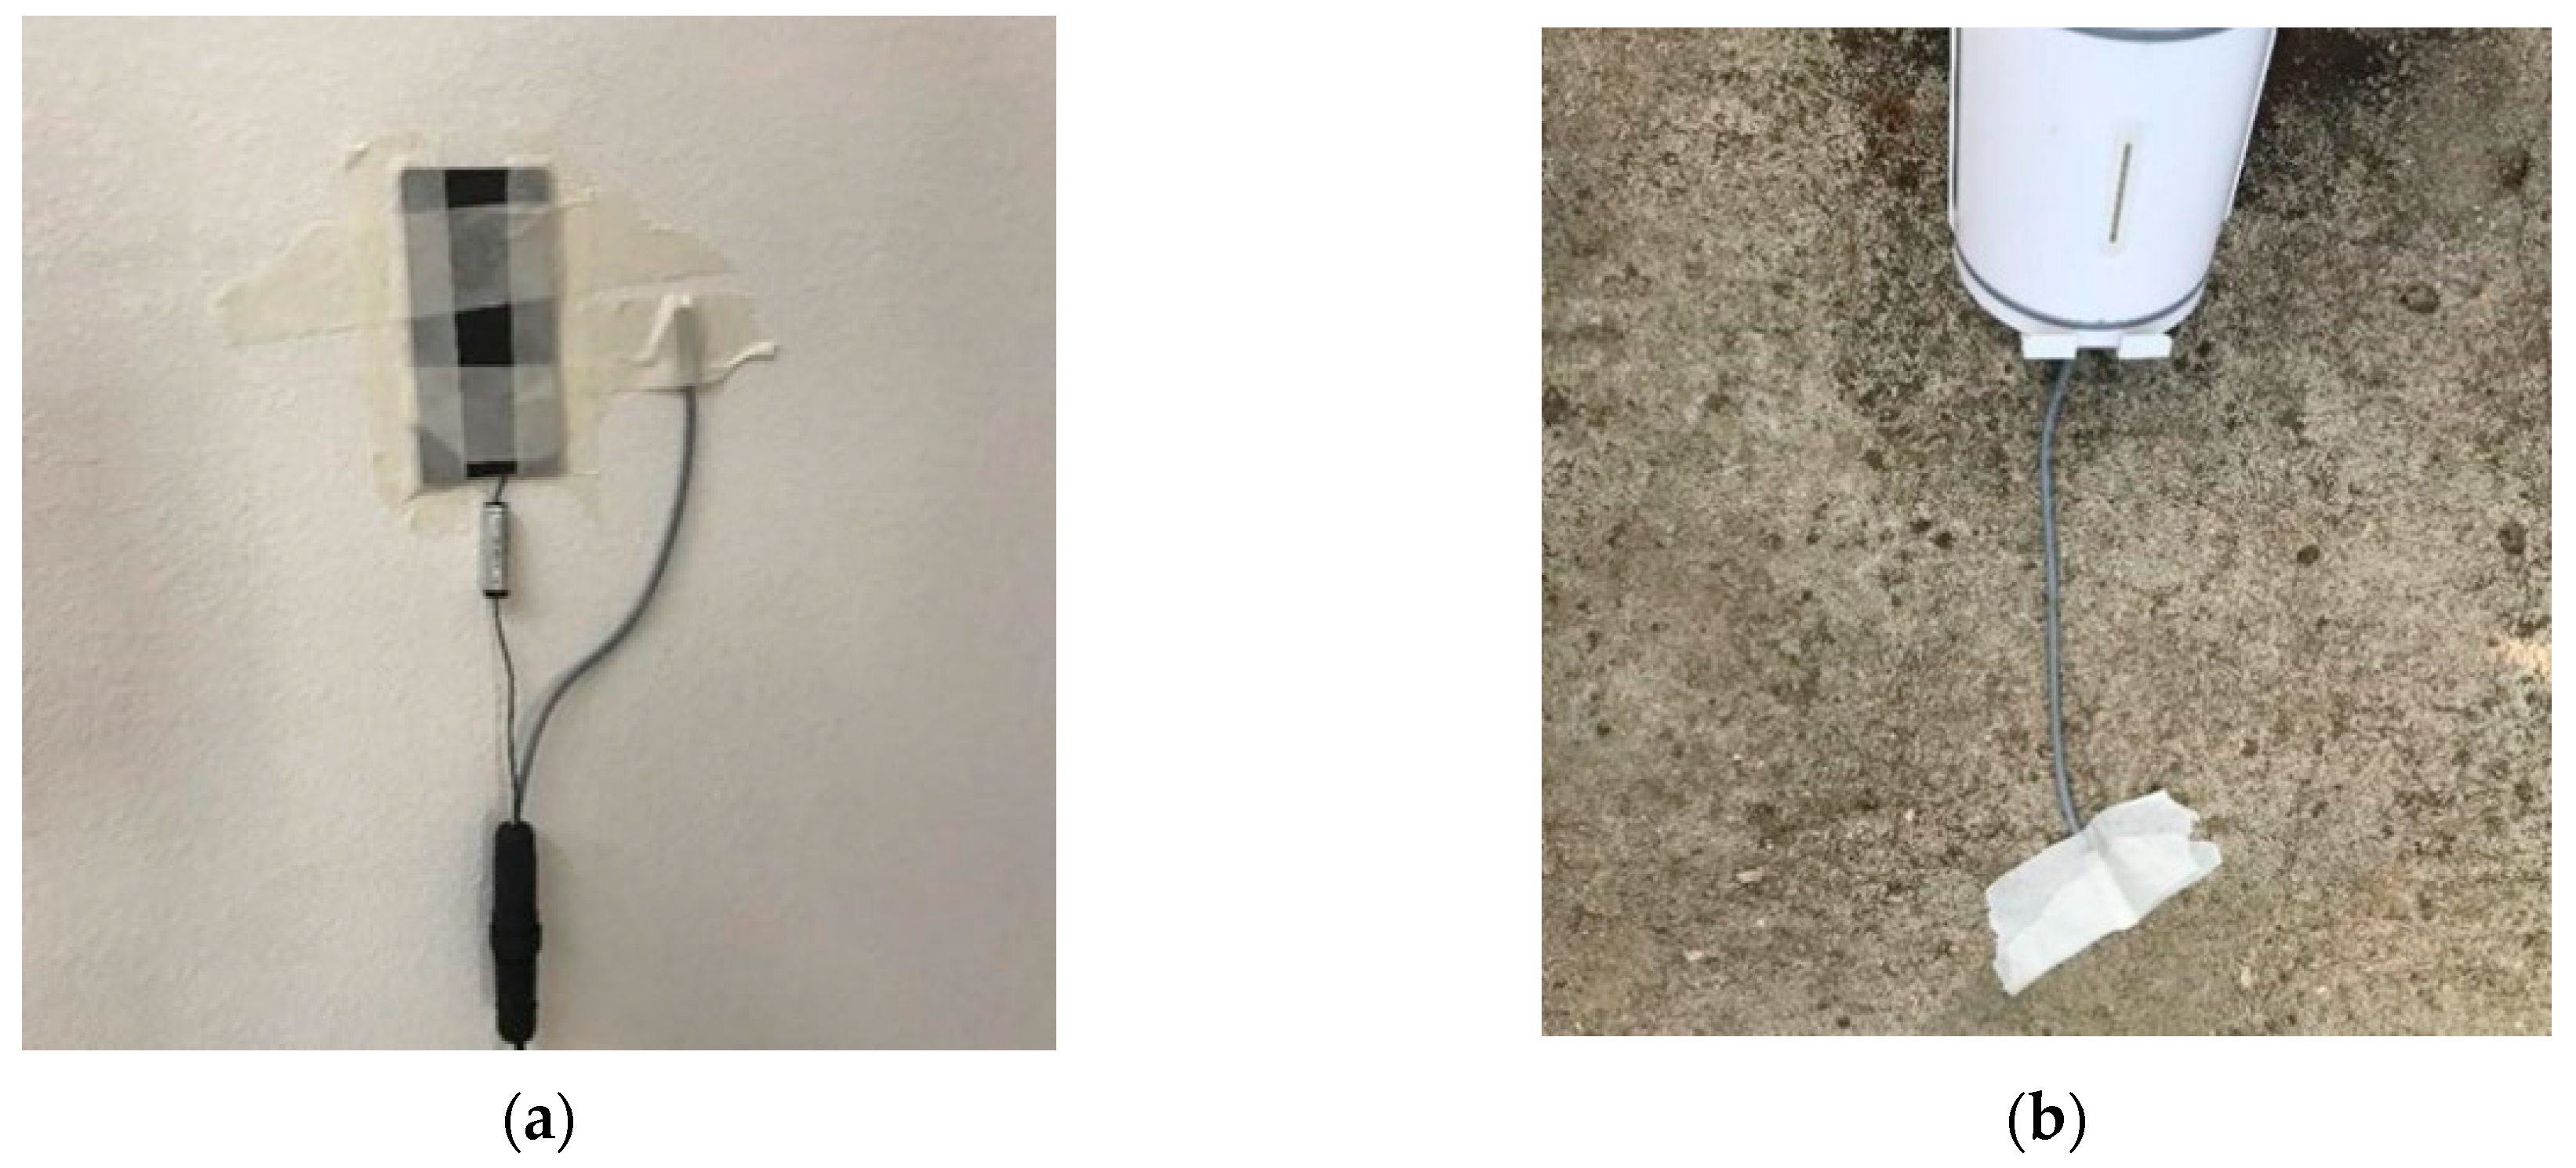
The air conditioner is plugged into the power monitoring device (Figure 5). The measurement interval is 9 h, and the air conditioning power consumption is manually recorded at 5:00 p.m. The solar radiation meter is placed on an unobstructed parapet on the roof to measure solar radiation, facing due south, with the measurement point at a height of 1.1 m above the roof surface (Figure 5). The Tinytag temperature and humidity recorder is positioned outdoors in a shaded area, 0.75 m above the roof surface (Figure 6). When the area of the study rooms differs, the number of temperature measurement points should also vary accordingly. The office area of building 2 in the material market is 56.28 m2, and the area of the elderly care service company is 52.26 m2. According to Table 3, three measurement points for indoor air temperature are placed in each room. The indoor air temperature measurement points should be located at a height of 1.1 to 1.7 m above the floor, with all points set at 1.5 m from the floor and at least 0.5 m away from walls and heat sources (Figure 6).

Figure 5.
(a) Air conditioning power consumption measurement point; (b) solar radiation measurement point.
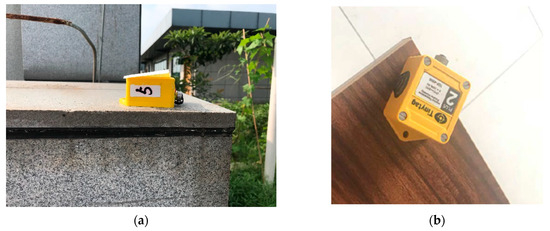
Figure 6.
(a) Outdoor air temperature measurement point; (b) indoor air temperature measurement point.
Table 3.
Standards for selecting the number of indoor temperature measurement points.
A total of 12 measurement points were required for the two rooms, with and without green roofs, in building 2 of the material market (six points each on the inner and outer surfaces). Wireless temperature and heat flux recorders were used to measure the interior surface temperature of the roof. To ensure a uniform roof surface temperature, measurement points were selected away from walls, windows, and other areas that might cause thermal bridging effects. When securing the measurement points, the probes of the temperature recorders were placed in close contact with the roof surface, with minimal gaps, and the temperature-sensitive ends were fixed with aluminum foil to eliminate the impact of thermal radiation (Figure 7).
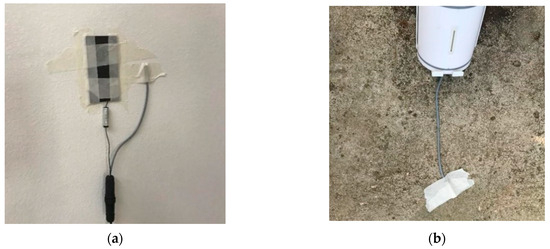
Figure 7.
(a) Roof inner surface measurement point; (b) roof outer surface measurement point.
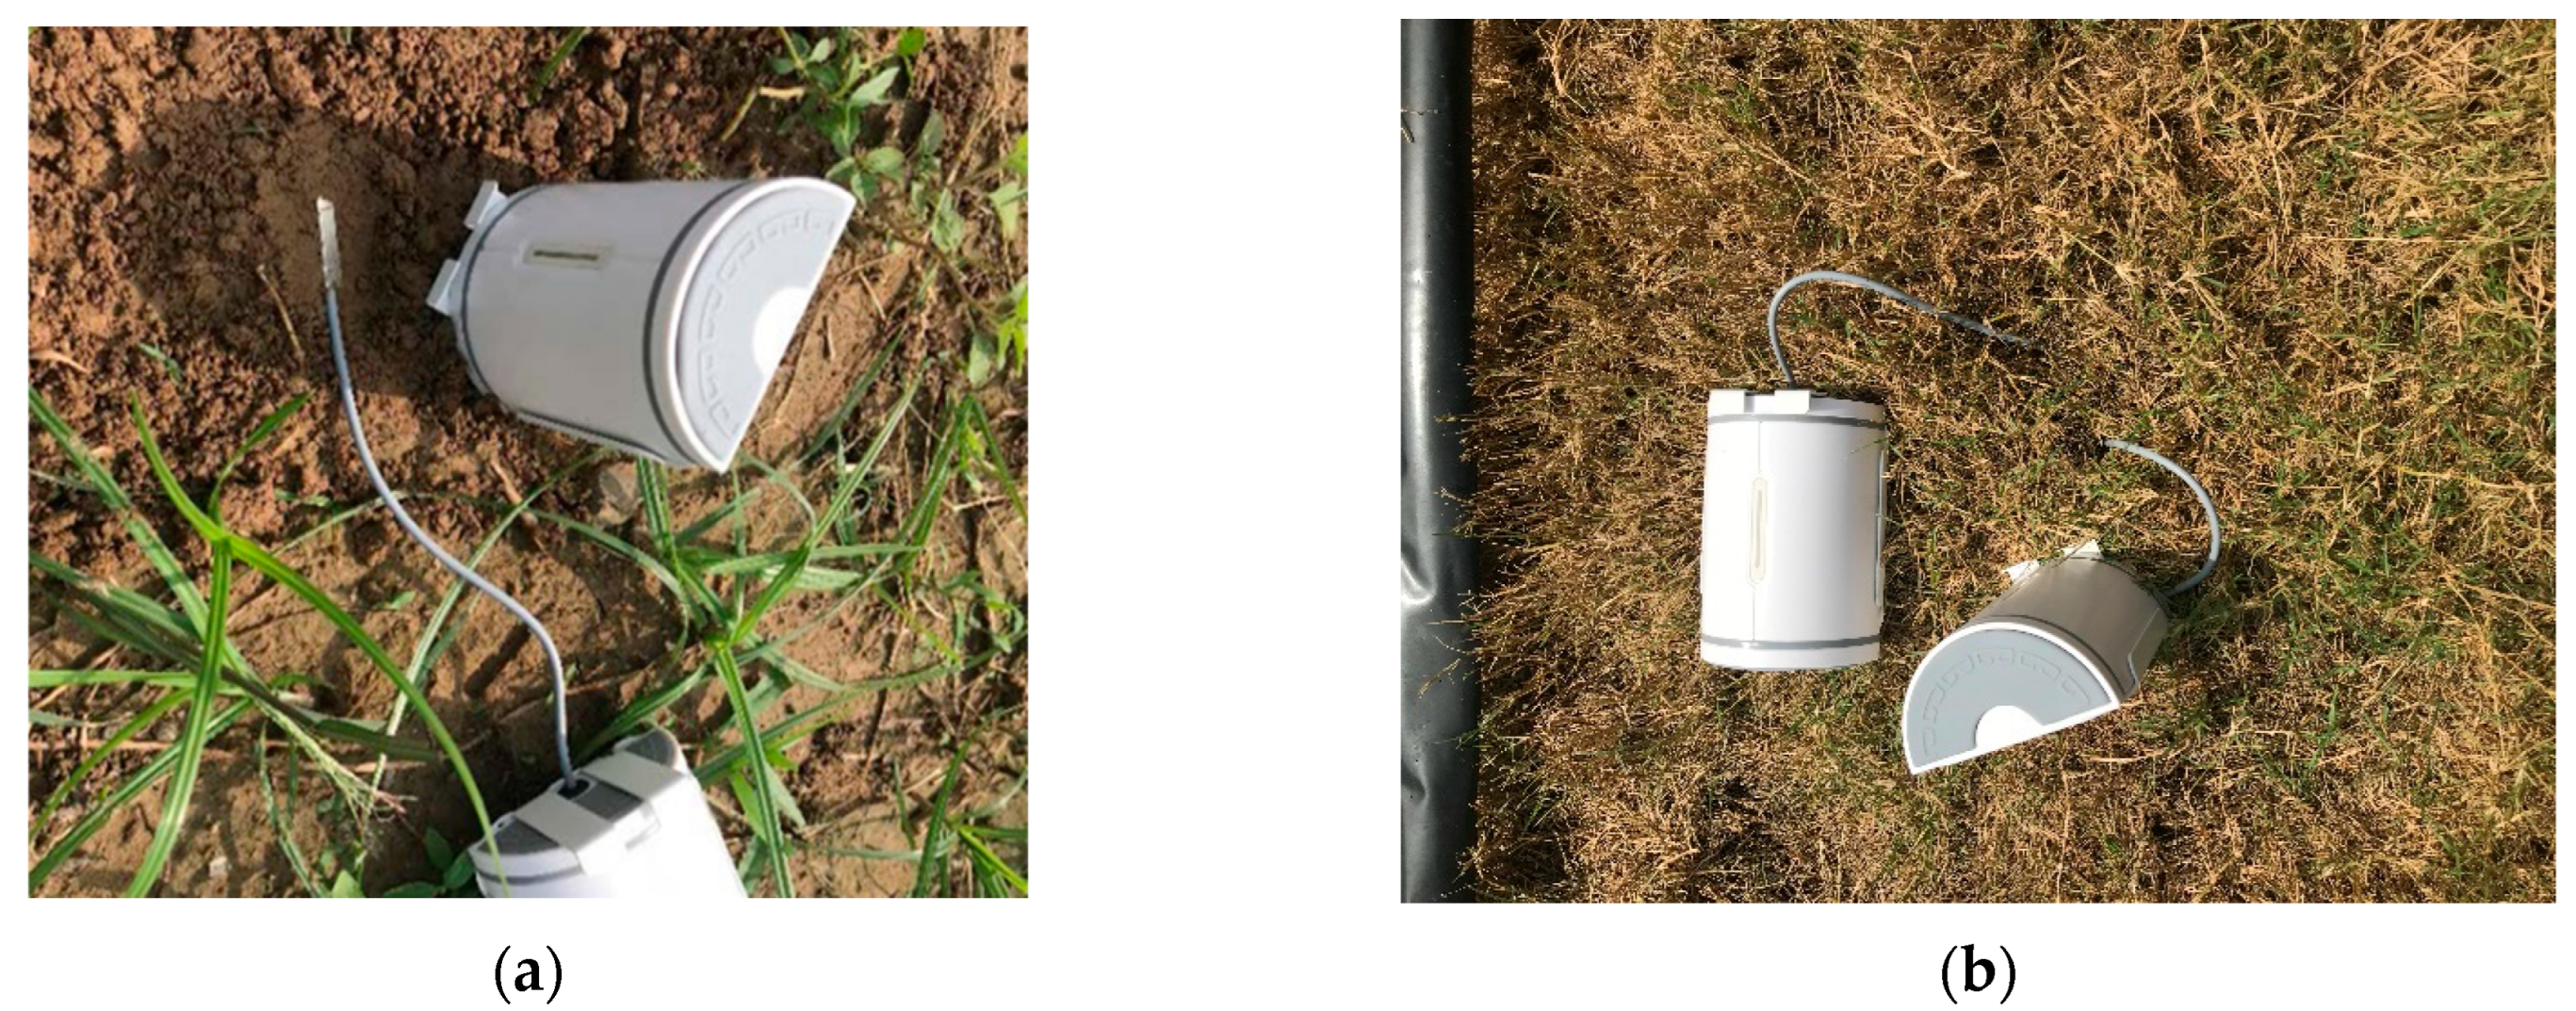
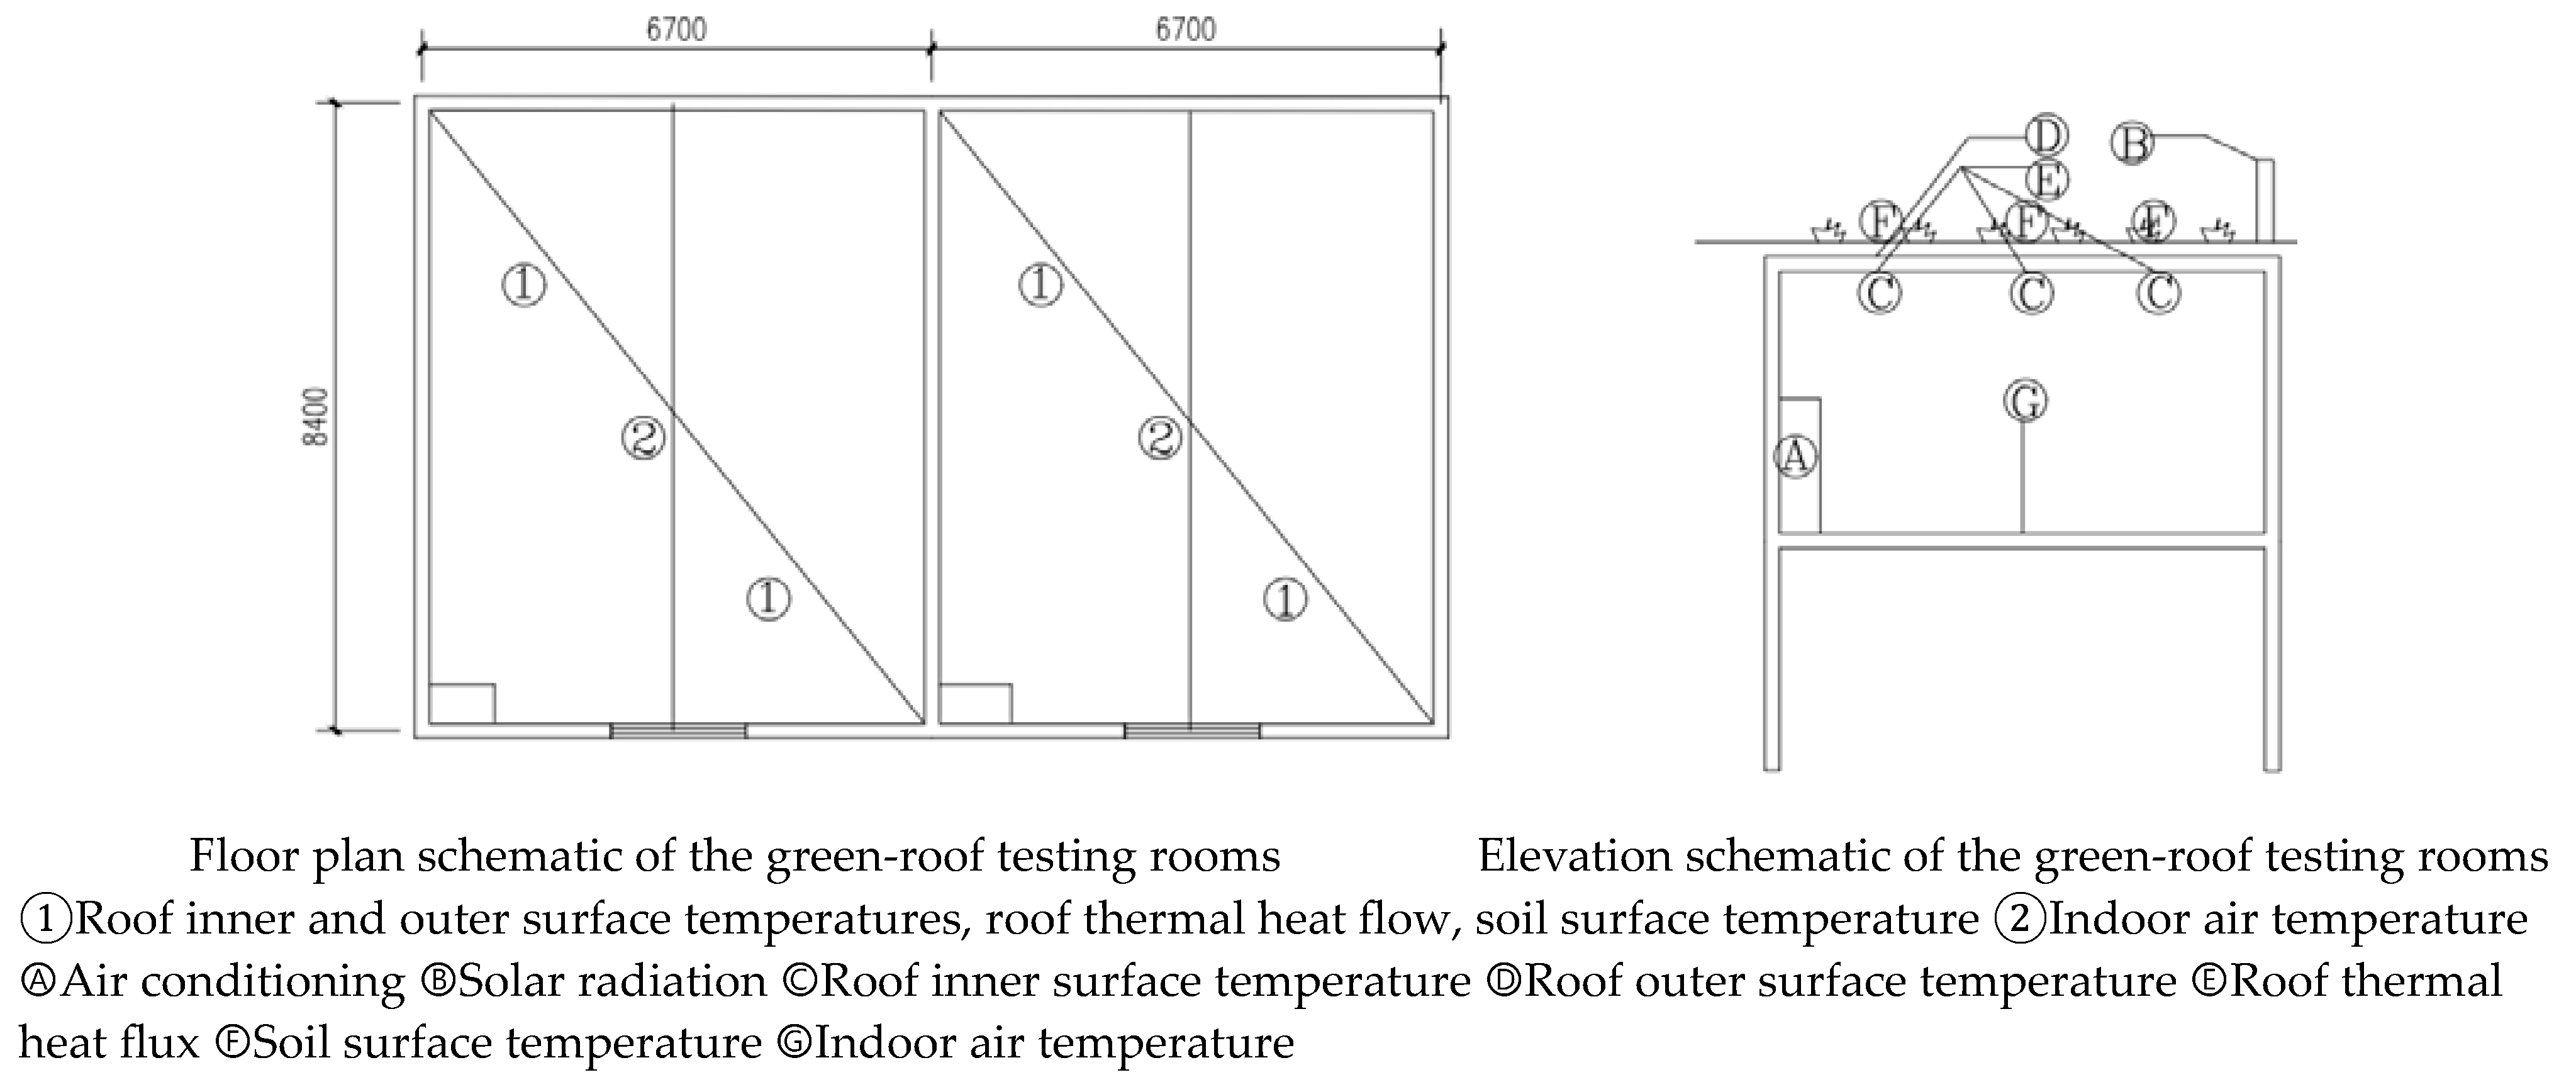
The specific arrangement method was as follows: wireless temperature recorders were used to measure the inner and outer surface temperatures of the roof. The placement of the heat flux sensors on the roof followed the arrangement of the interior surface temperature measurement points. Since the instruments used were wireless temperature and heat flux recorders, they were closely attached to the roof, avoiding gaps to improve measurement accuracy. Six measurement points were arranged on-site,. The arrangement of measurement points for soil surface temperature also followed the placement of the interior surface temperature points. The wireless temperature recorders were also closely attached to the soil surface (Figure 8), with three measurement points arranged on-site, as shown in Figure 9Ⓕ. The actual measurement points for the elderly care service company were arranged similarly to those shown in Figure 10. The on-site measurements aimed to analyze the following: (1) the trend of indoor air temperature changes; (2) the reduction in surface temperature caused by the green roof under both air-conditioned and non-air-conditioned conditions; and (3) the changes in the soil surface temperature caused by the plants on the roof. The main performance parameters of the instruments are shown in Table 4.
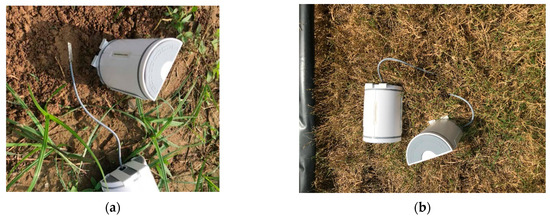
Figure 8.
(a) Soil surface temperature measurement point on the roof of building 2 at the material market; (b) Soil surface temperature measurement point at the elderly care service company.
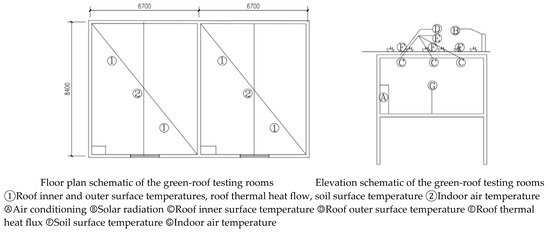
Figure 9.
Schematic diagram of the location of the measurement points in building 2 at the material market.

Figure 10.
Schematic diagram of the location of the measured points at the elderly care service company.
Table 4.
Main performance parameters of testing instruments.
2.4. Questionnaire Survey
The questionnaire respondents were randomly selected, and the Xuzhou green-roof survey questionnaire was distributed to 200 individuals across two green-roof buildings. To ensure accuracy and cover various age groups, occupations, and other demographics, the questionnaires were primarily distributed on weekdays from 12 to 14 August 2023. A five-point Likert scale was used, as shown in Table 5, to quantify both objective questions and subjective questions related to people’s perceptions.
Table 5.
Likert five-point scale.
The main content of the questionnaire included: (1) basic information of the respondents, such as gender, age, type of green roof, usage status, floor level of the user, frequency of air conditioner usage, and air conditioning operation time, and (2) respondents’ perceptions and opinions, including the degree of greenery, green space, concern for the green roof, views, satisfaction, and energy consumption.
2.5. Simulation and Data Analysis
Based on the characteristics of the basic building, a building model of material market building no. 2 was established using the advanced simulation software EnergyPlus8.7.0 developed by the U.S. Department of Energy, as shown in Figure 11. After validating the effectiveness of the numerical model, weather data files for the Xuzhou region were imported into EnergyPlus. The simulation period was set from 1 June to 31 August 2023, excluding weekends, with the air conditioning temperature set at 26 °C. The air conditioning system was a fan coil unit system that operates continuously throughout the day, with no other heat sources in the room. The original design parameters included the construction methods and thermal physical parameters of the materials (as shown in Table 6) and the thermal parameters required for the green roof module (as shown in Table 7).
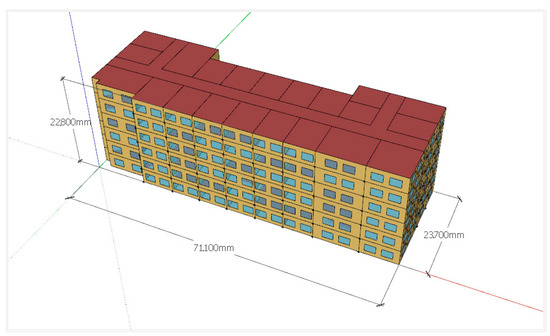
Figure 11.
Building model.
Table 6.
Thermal properties of materials and construction methods of the building.
Table 7.
Thermal parameter settings for green roof modules.
Similar to that of traditional roofs, the energy balance of a green roof is primarily influenced by solar radiation forcing. Solar radiation, combined with convection and evaporation from the soil and plant surfaces, works to maintain energy balance through heat conduction to the soil substrate and longwave radiation to the soil and leaf surfaces. The thermodynamic model of the green roof mainly consists of shortwave radiation from the sun hitting the roof and the exchange of longwave radiation between the roof and the environment. Below are the relevant radiation heat transfer equations:
- Shortwave radiative heat transfer:
In the equation, QSW is the heat transfer due to shortwave radiation; αveg is the shortwave absorption coefficient of the vegetation; αsoil is the shortwave absorption coefficient of the soil; Isolar is the intensity of incident solar radiation; and Fveg is the vegetation coverage factor, representing the proportion of the roof surface covered by vegetation.
- 2.
- Longwave radiative heat transfer:
In the equation, QLW is the heat transfer due to longwave radiation; ϵveg and ϵsoil are the longwave emissivity of the vegetation and soil, respectively; σ is the Stefan–Boltzmann constant (5.67 × 10⁻⁸ W/m2·K⁴); Tveg and Tsoil are the temperatures of the vegetation and soil, respectively (unit: K); and Tsky is the effective radiation temperature of the sky (unit: K).
The model still has limitations. In more complex building energy simulations, some additional radiative heat transfer mechanisms (such as radiation exchange within the vegetation layer, sky radiation, and reflection) also need to be considered.
The thickness of the soil layer is typically determined by the size and type of the selected vegetation. Depending on the type of vegetation, the soil thickness can range from a thin layer of 5–10 cm to a thick layer of up to 1 m. Some researchers have conducted studies by setting the soil layer thickness to 0.1 m [6]. To evaluate the effect of soil coverage on roof slabs with different thermal conductivities, studies have been conducted by gradually reducing the soil thermal conductivity from 1.75 W/(m·K) to 0.05 W/(m·K) in increments of 0.2 W/(m·K) in order to explore when the increased soil coverage becomes insignificant or redundant for the thermal performance of the roof system [33]. The leaf area index (LAI) is one of the key factors influencing roof energy consumption. It essentially represents the ratio of the projected area of all leaves to the soil surface area and is directly related to sensible and latent heat fluxes. A higher LAI indicates greater surface shading and lower stomatal resistance, which significantly increase the latent heat flux of the leaf layer. The typical LAI value for green roofs is 1, although actual values vary depending on the type of vegetation, usually ranging from 0.001 to 5.0 [12]. To study the impact of adjusting green roof design parameters, LAI values in the simulation were set between 1.0 and 5.0 [6]. The experiment primarily simulated parameters for both the building structure and the green roof. For the building structure, the simulation focused on insulation thickness, the building orientation of the green roof, and the slope angle of the green roof. For the green roof, the simulation focused on soil thickness, soil thermal conductivity, and leaf area index, while all other parameters were set to the software’s default values. All design parameter settings are shown in Table 8.
Table 8.
Design parameters and their distributions.
2.6. Energy Performance Standards
In the summer, the air conditioning load is the cooling load required to maintain indoor comfort. The calculation methods mainly include the harmonic response method, z-transfer function, and cooling load temperature difference method [34]. This paper selects the unit air conditioning cooling load and energy saving rate to evaluate the energy consumption of office buildings. The unit air conditioning cooling load can be calculated using the following formulas:
- Cooling load generated through heat transfer from exterior walls, roofs, exterior windows, and other envelope structures:
In the equations, CLWq represents the hourly cooling load generated by heat transfer through exterior walls (W); CLWm represents the hourly cooling load generated by heat transfer through roofs (W); CLWc represents the hourly cooling load generated by heat transfer through exterior windows (W); K represents the heat transfer coefficient of exterior walls, roofs, or exterior windows [W/(m2·K)]; F represents the heat transfer area of exterior walls, roofs, or exterior windows (m2); and tw1p represents the hourly cooling load calculation temperature of exterior walls (°C).
- 2.
- Cooling load generated by solar heat gain through exterior windows:
In the equations, CLc represents the hourly cooling load generated by solar radiation through glass windows (W); Cclc represents the solar radiation cooling load coefficient for standard glass without shading; Cz represents the comprehensive shading coefficient for exterior windows; Cw represents the shading correction coefficient; Cn represents the internal shading correction coefficient; Cs represents the glass correction coefficient; and DJmax represents the maximum value of the solar heat gain factor in summer.
- 3.
- Cooling load formed by human bodies, lighting, equipment, etc.:
In the equations, CLn represents the hourly cooling load formed by human body heat (W). Ccln represents the coefficient of the human body cooling load. Ø represents the clustering factor. Qn represents the heat dissipation of the human body (W). CLzm represents the hourly cooling load formed by lighting heat (W). Cclzm represents the coefficient of the lighting cooling load. Czm represents the lighting correction factor. Qzm represents the heat dissipation of lighting (W). CLsb represents the hourly cooling load formed by equipment heat (W). Cclsb represents the coefficient of the equipment cooling load. Csb represents the equipment correction factor. Qsb represents the heat dissipation of equipment (W).
- 4.
- Cooling load formed through heat transfer when the temperature difference between the two sides of the internal enclosure structure exceeds 3 °C:
In the equations, tls represents the average calculated temperature of adjacent non-air-conditioned rooms. Δtls represents the difference between the average calculated temperature of adjacent non-air-conditioned rooms and the daily average outdoor temperature in summer. For spaces such as offices, corridors, etc., where heat dissipation is minimal, it can range from 0 to 2 °C.
3. Results Analysis
3.1. Analysis of the Measured Data
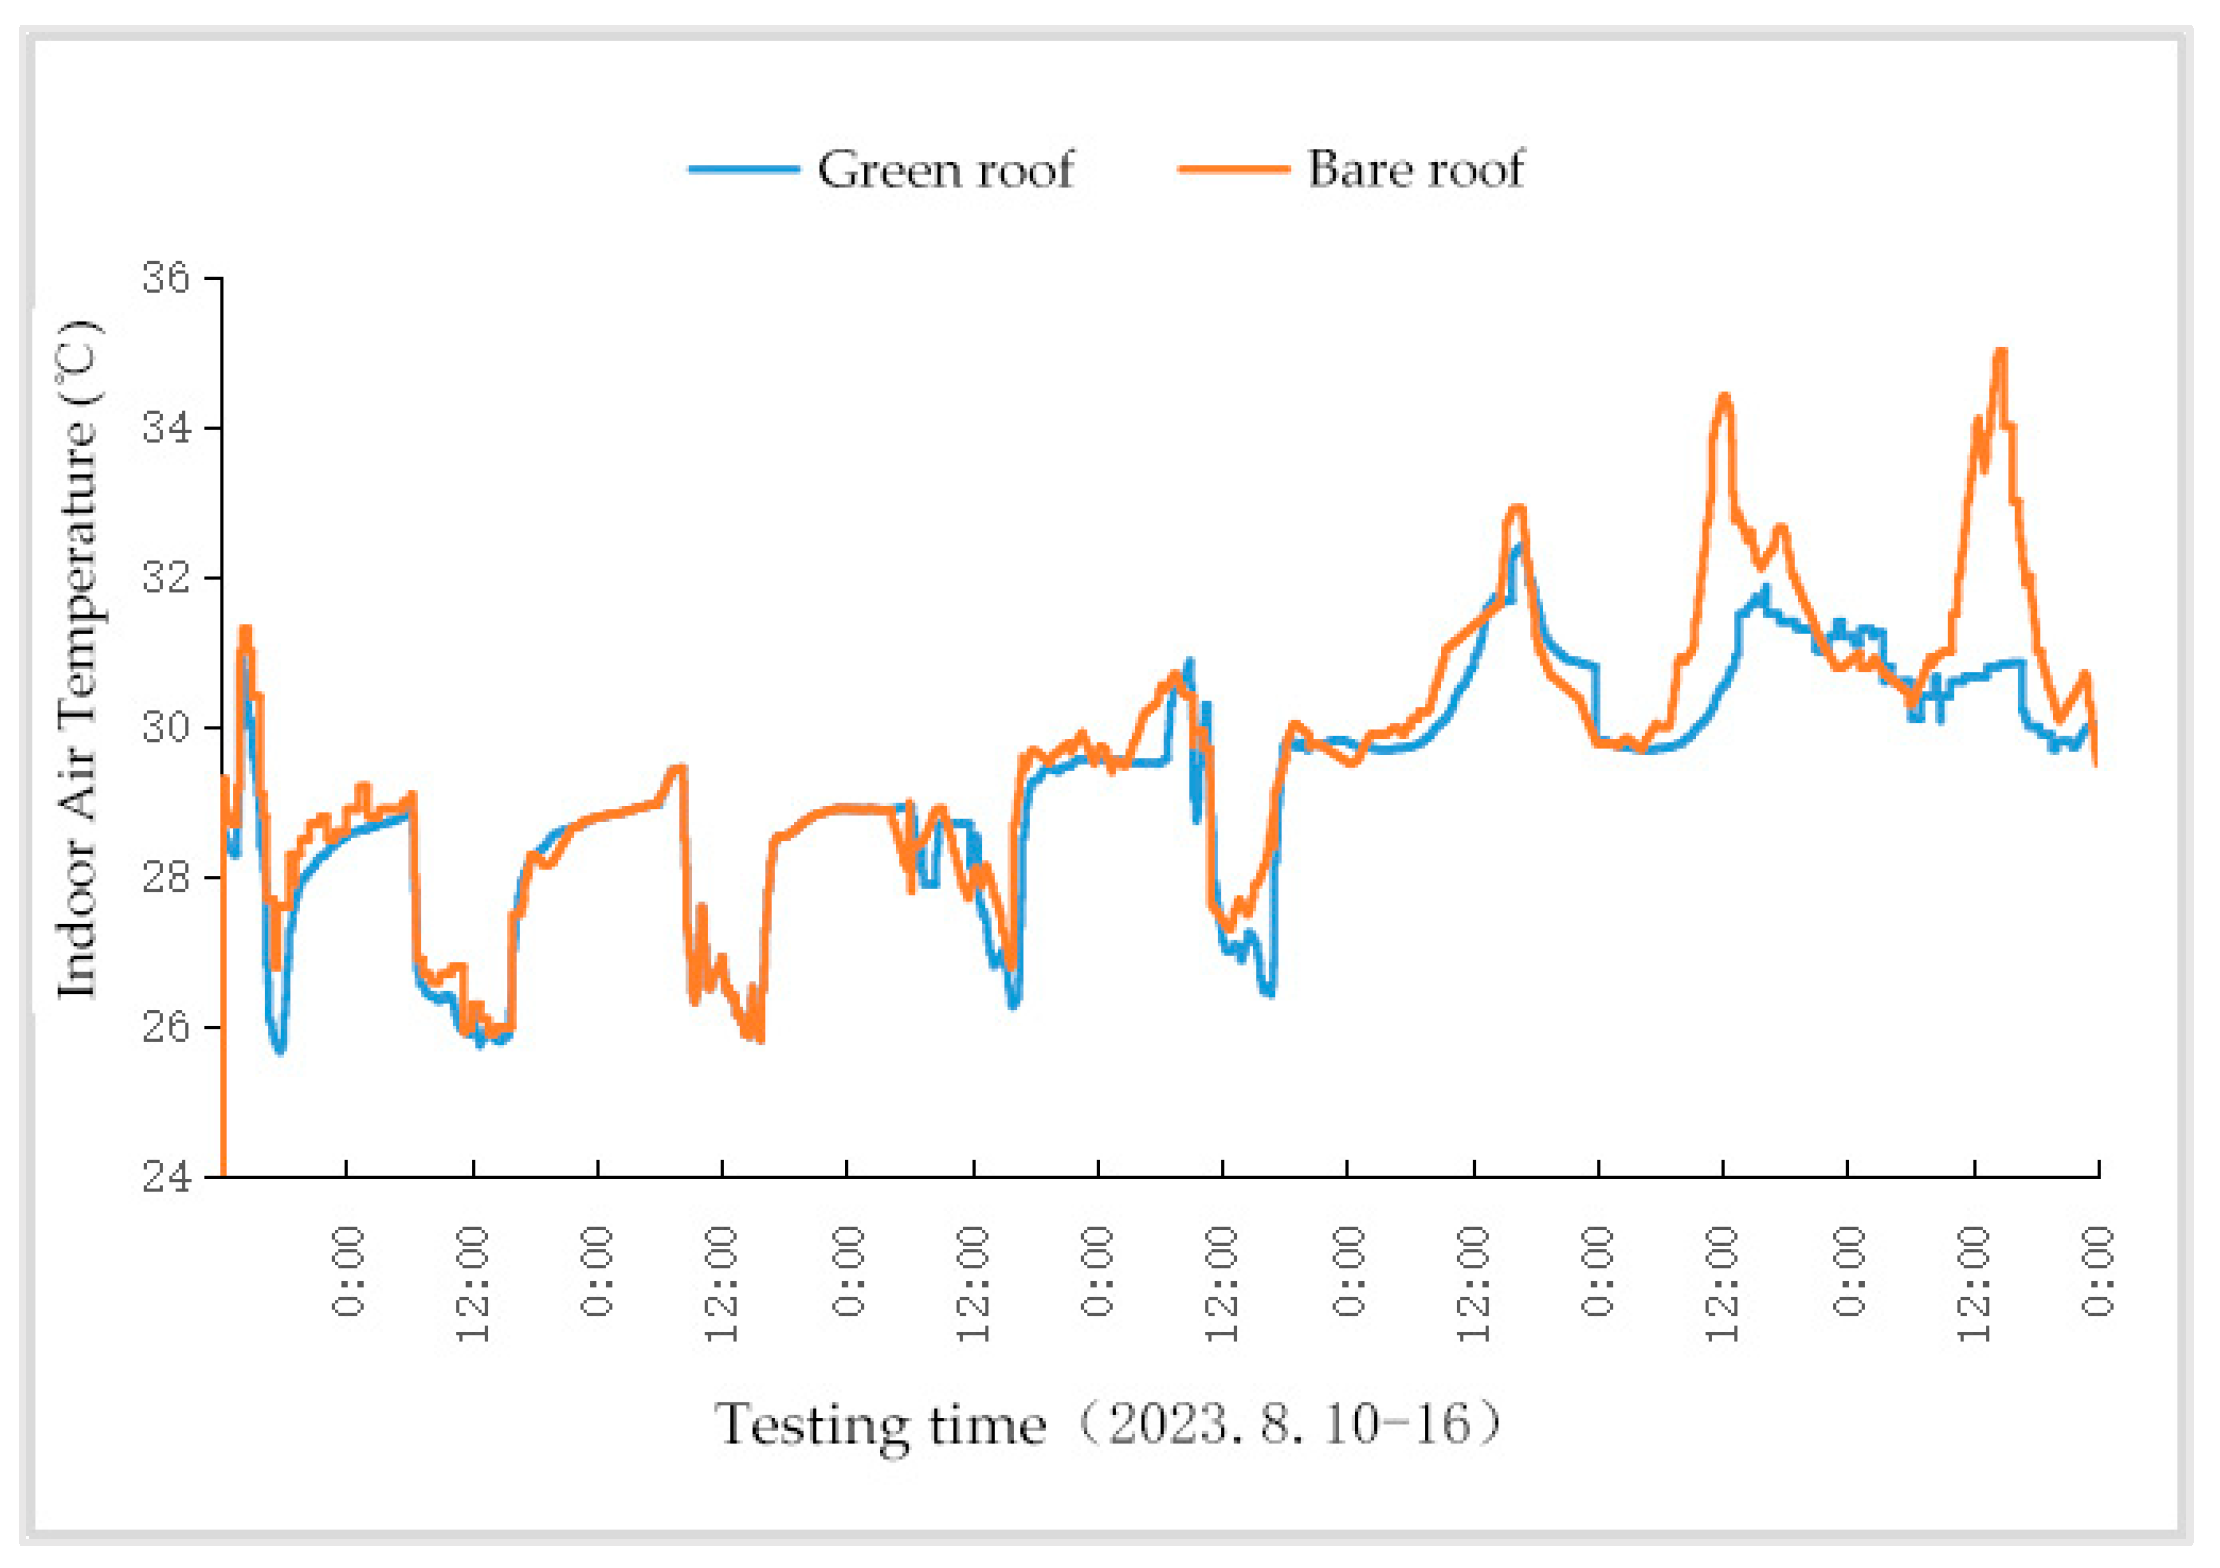
As shown in Figure 12, during the air conditioning period (8:00–17:00 from 10–14 August), solar radiation intensity was relatively high, exceeding 800 W/m2 around 12:30. The outdoor air temperature peaked between 37.9 °C and 43.8 °C, with lows ranging from 27.1 °C to 29.8 °C. In the absence of air conditioning (15–16 August), the trend in outdoor air temperature mirrored that of solar radiation but with a certain phase delay. As shown in Figure 13, the indoor temperature variation curves during the air conditioning period nearly coincide. During office hours from 10 to 14 August, the overall average indoor temperature under the bare roof was 27.3 °C, which is 0.2 °C higher than the average for the green roof. During non-office hours, the overall average indoor temperature under the bare roof was 29.7 °C, which is 0.4 °C higher than that under the green roof. This indicates that during the air conditioning off phase, the green roof reduces indoor air temperature in the summer; however, at night, the heat dissipation capacity of the green roof is inferior to that of the bare roof, leading to a smaller reduction in temperature. Under non-air-conditioned conditions (15–16 August), the indoor temperature under the bare roof reached 35.0 °C, while the green roof’s indoor temperature was 31.8 °C, a reduction of 3.2 °C, corresponding to a cooling rate of 9.1%. Notably, on the night of 16 August, the indoor temperature under the green roof was higher than that under the bare roof. This is because the thermal resistance of the green roof is greater than that of the bare roof, resulting in less heat dissipation at night and thus higher temperatures. It is also possible that the heat accumulated in the building during the day is released at night, with the green roof being more affected by this phenomenon. In contrast, under non-air-conditioned conditions, during periods of high outdoor temperature and solar radiation, the green roof demonstrates a significant cooling effect in the Xuzhou region.
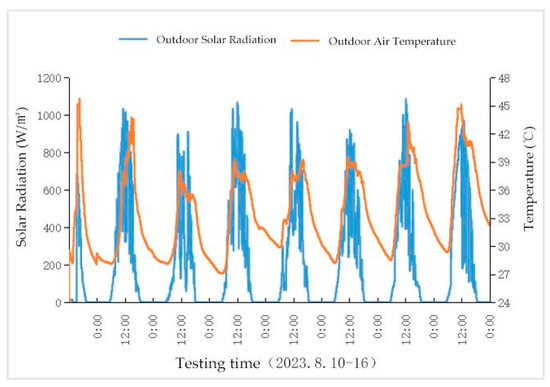
Figure 12.
Trends in outdoor solar radiation and air temperature.
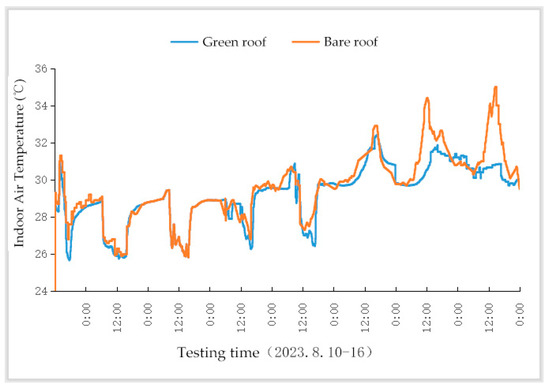
Figure 13.
Trends in indoor air temperature.
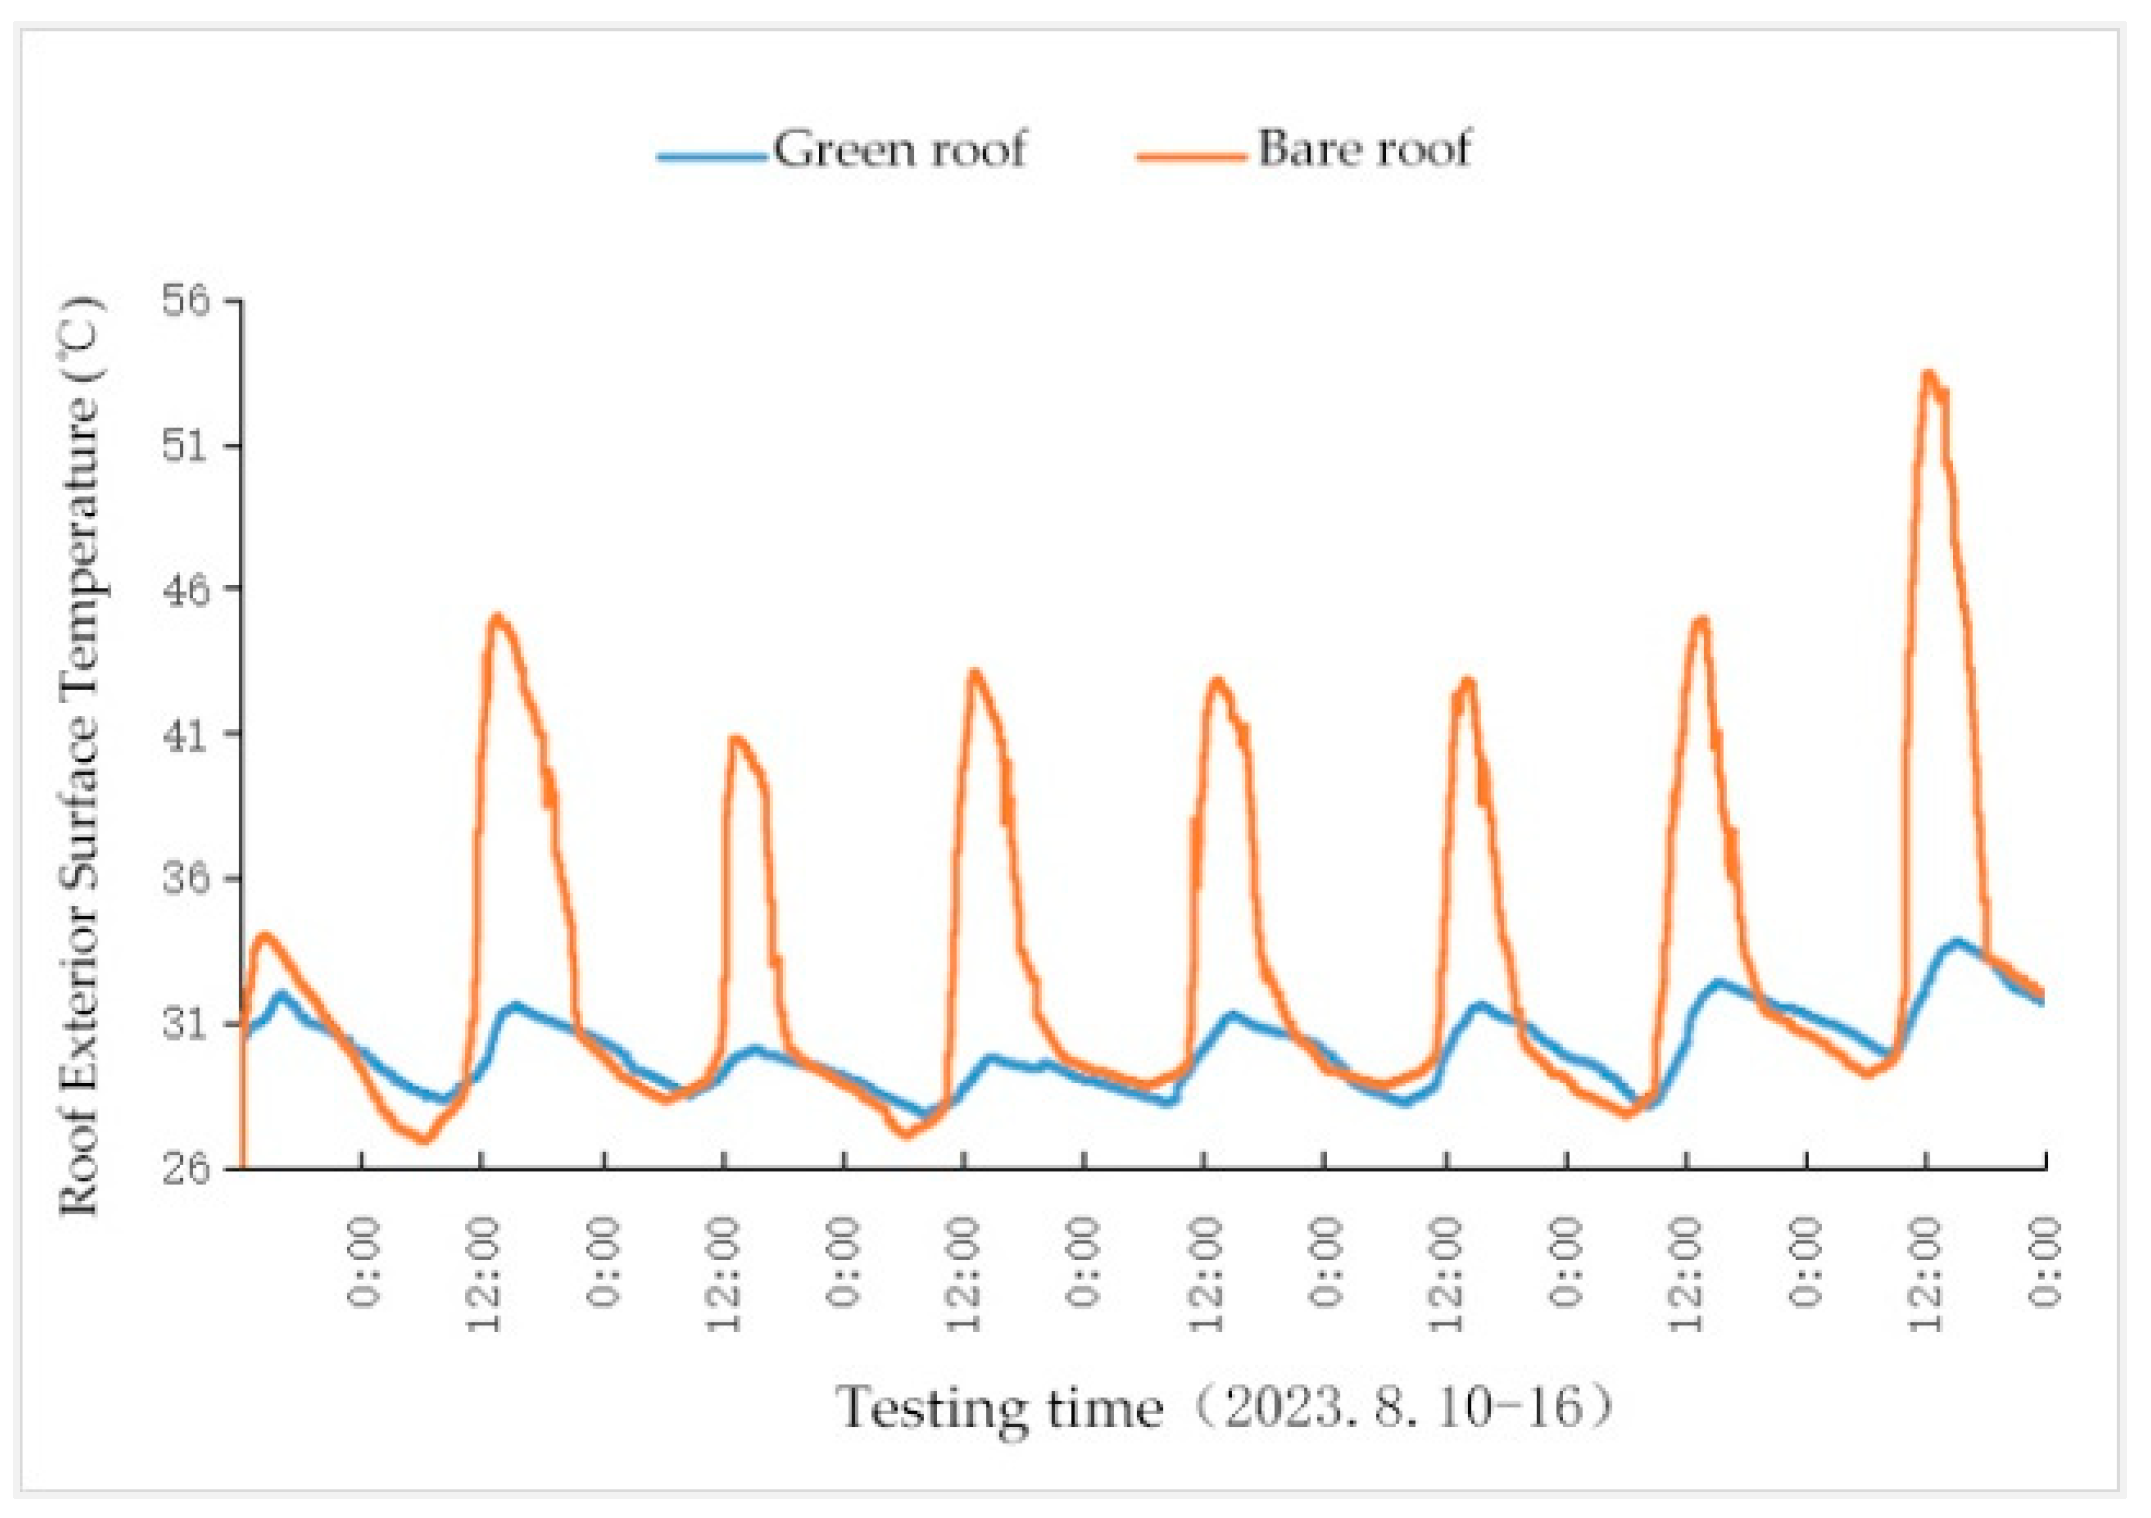
Figure 14 shows the temperature variation trends of the outer surfaces of the two types of roofs over the seven test days. Since the outer surface of the bare roof is the outermost layer of the building envelope, while the outer surface of the green roof is insulated by a layer of vegetation and soil, the temperature fluctuation range of the bare roof is larger. Under air-conditioned conditions, the results indicate that the outer surface temperature of the bare roof reaches its peak between 13:30 and 14:30, while the green roof reaches its peak 1–2 h later, between 14:30 and 15:30. This is because the vegetation and soil layers of the green roof have a higher heat capacity, allowing them to absorb and store more heat, leading to slower temperature changes. In contrast, the bare roof lacks a buffering layer, causing its outer surface temperature to change more rapidly with the intensity of solar radiation, therefore reaching its maximum temperature earlier in the afternoon (between 13:30 and 14:30).
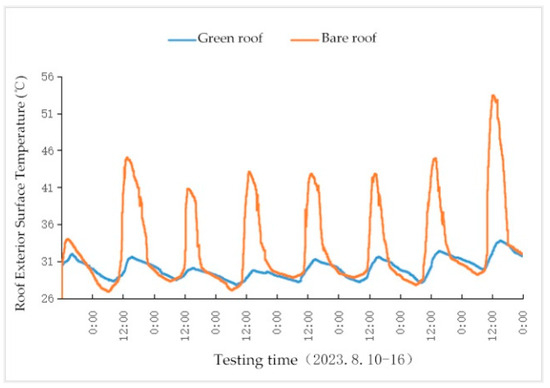
Figure 14.
Trend of roof surface temperature changes.
Table 9 lists the typical values of the outer surface temperature parameters of the roof under air-conditioned conditions, including the maximum value, minimum value, daily average value, and daily maximum temperature difference of the measured parameter. As seen in Table 9, the average maximum temperature, average daily temperature, and average daily maximum temperature difference of the green roof’s outer surface are 30.9 °C, 29.3 °C, and 2.7 °C, respectively, while those for the bare roof are 42.8 °C, 32.8 °C, and 14.8 °C, respectively, with corresponding cooling rates of 27.8%, 10.7%, and 81.6%. A similar trend was observed under non-air-conditioned conditions. The daily maximum temperature difference of the green roof is significantly lower than that of the bare roof, which is due to the multilayer structure of the green roof (such as vegetation and substrate) forming a buffer zone that reduces the temperature gradient between the outer surface of the roof and the internal environment. This structure allows heat to dissipate through convection and radiation during the day, further lowering the roof temperature. However, on the clear nights of 10, 11, and 12 August, the outer surface temperature of the green roof was higher than that of the bare roof because the soil layer on the green roof surface has less heat dissipation capacity at night compared to the bare roof. Table 10 lists the typical values of the outer surface temperature parameters for two test days under non-air-conditioned conditions. The average maximum temperature, average daily temperature, and average daily maximum temperature difference of the green roof’s outer surface are 33.1 °C, 31.0 °C, and 4.1 °C, respectively, while those for the bare roof are 35.8 °C, 35.4 °C, and 20.4 °C, respectively, with corresponding cooling rates of 32.3%, 12.4%, and 80.0%. This indicates that the green roof can enhance the roof’s thermal insulation performance, reduce the daily temperature fluctuations of the roof, protect structural layers and waterproof layers from damage due to temperature fluctuations, and extend the roof’s service life.
Table 9.
Typical values of temperature parameters of the outer surface of the roof on 10–14 August.
Table 10.
Typical values of the temperature parameters of the outer surface of the roof on 15–16 August.
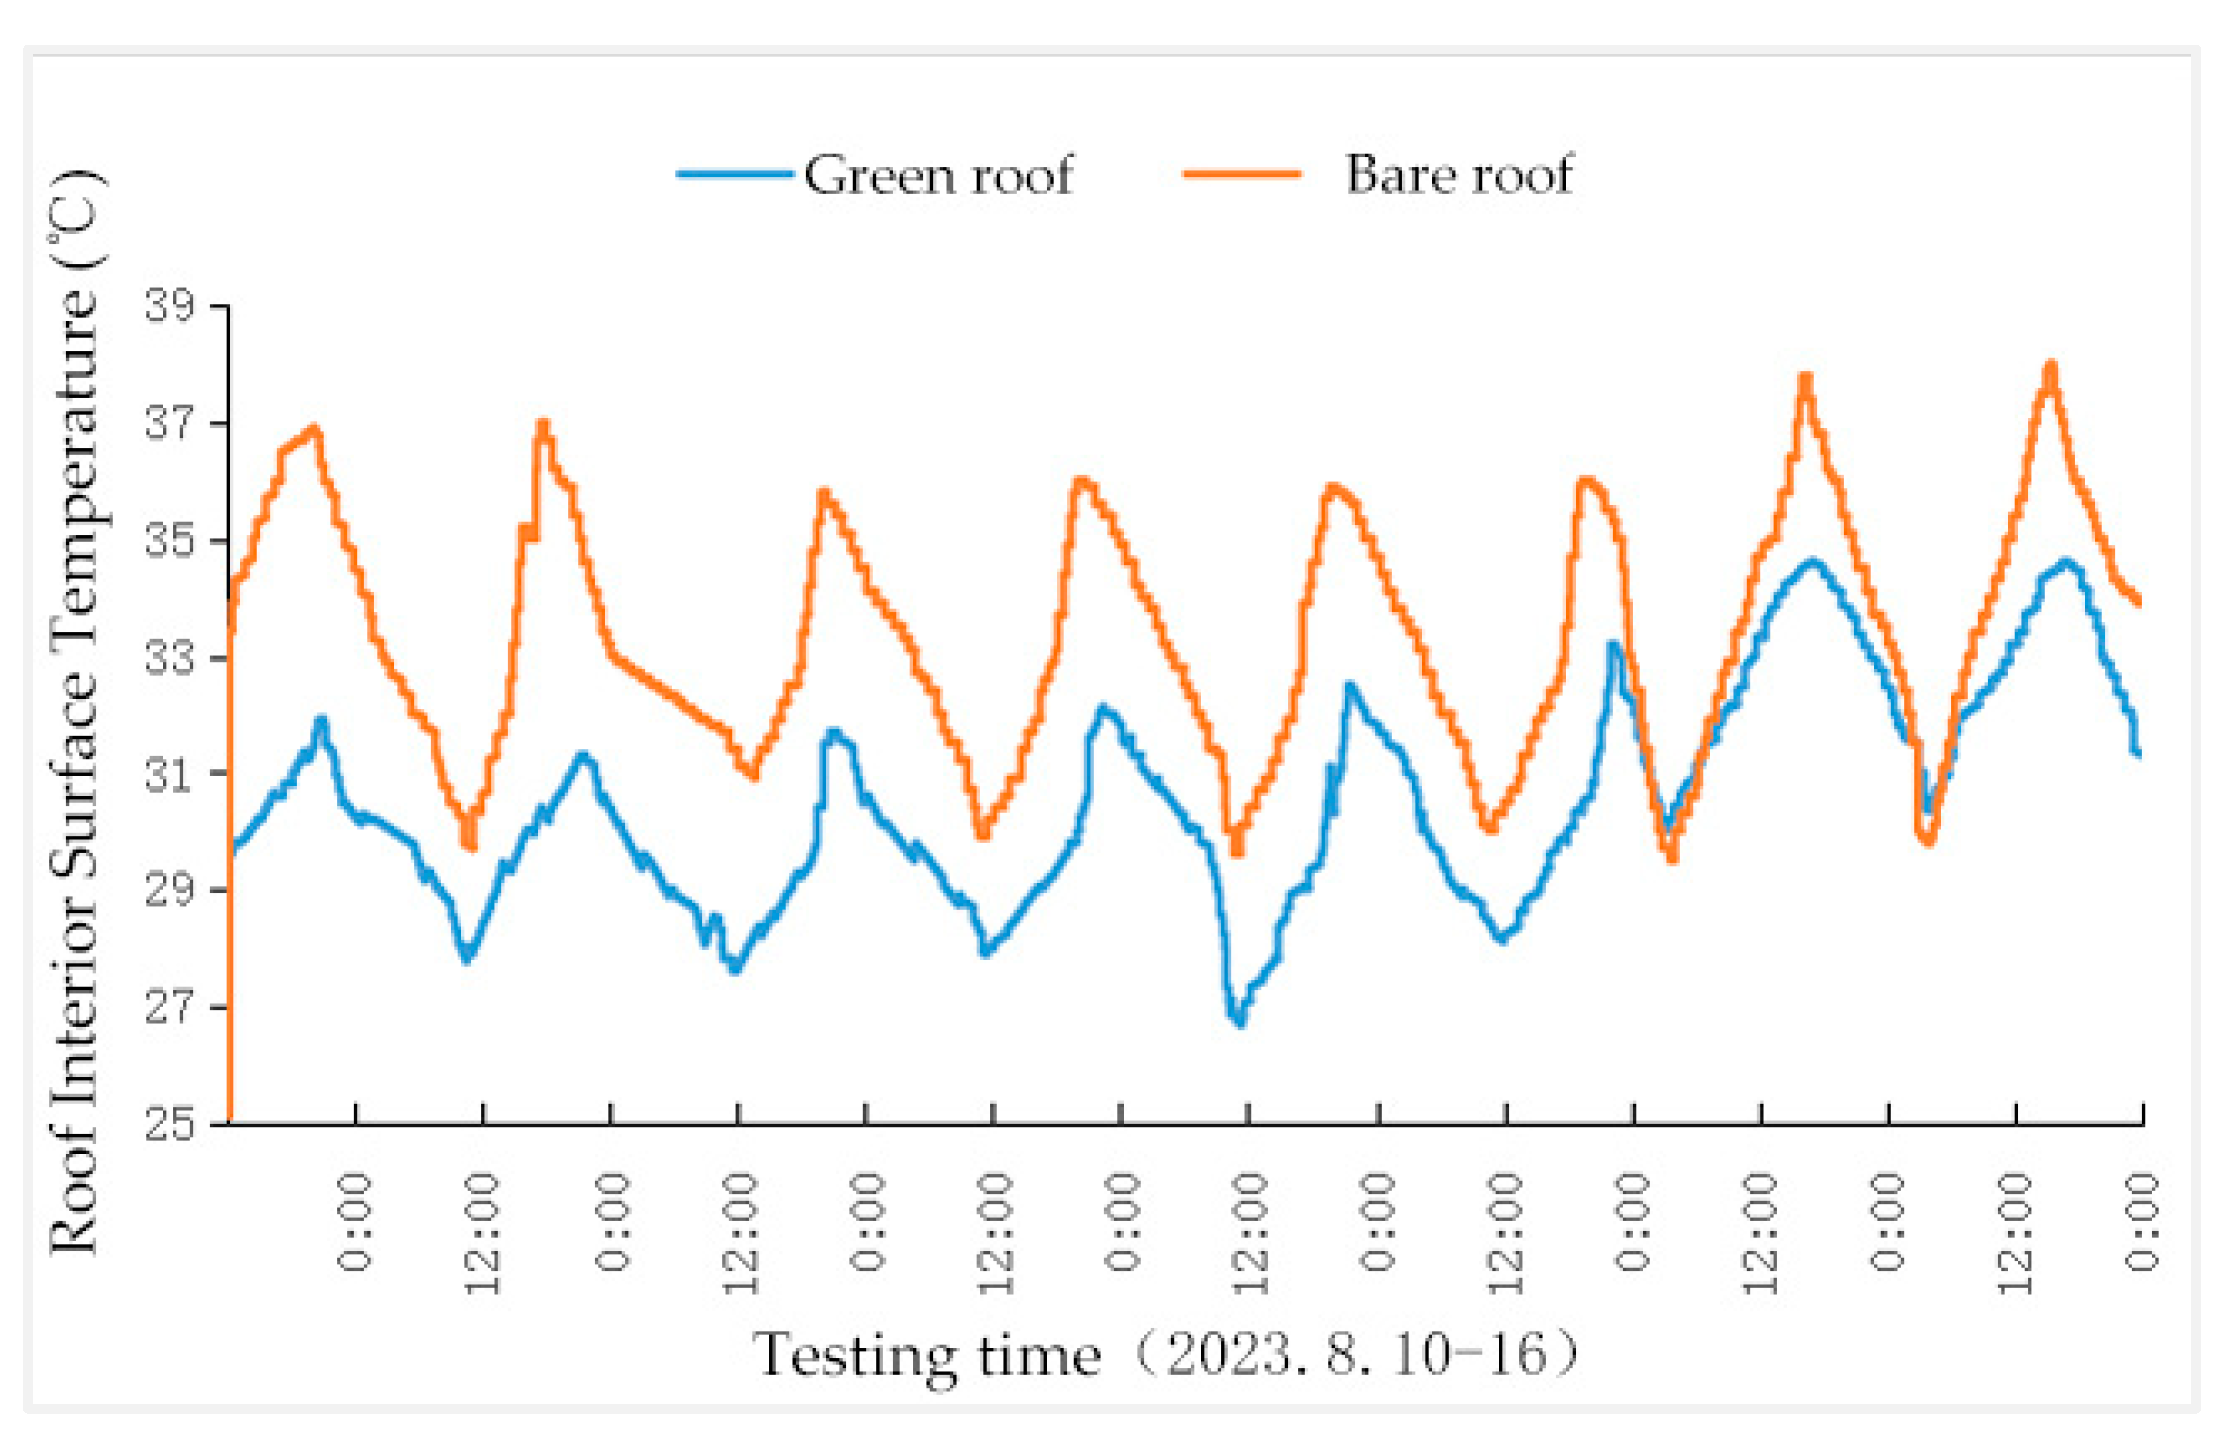
Figure 15 shows the temperature variation trends of the inner surfaces of the two types of roofs over the seven test days. Under air-conditioned conditions, the highest temperature of the bare roof’s inner surface appears around 19:00 each day, while the green roof’s peak temperature occurs 1–2 h later. This delay is primarily due to the multilayer structure of the green roof, which gives it a higher thermal resistance compared to that of the bare roof. In addition to increasing the heat capacity, these layers also enhance the overall thermal resistance of the roof, making it more difficult for heat to penetrate. As a result, although both types of roofs absorb heat during the day, the higher thermal resistance of the green roof delays the transfer of heat to the inner surface, causing its peak temperature to occur later.
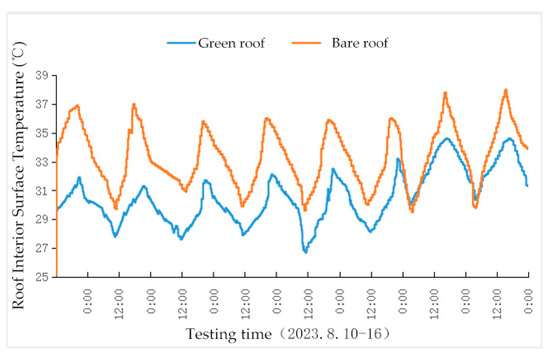
Figure 15.
Trend of roof interior surface temperature changes.
Table 11 lists the typical values of the inner surface temperature parameters for the roofs during five days of testing under air-conditioned conditions. The average maximum temperature, average daily temperature, and average daily maximum temperature difference of the green roof’s inner surface are 32.2 °C, 29.7 °C, and 4.5 °C, respectively, while those for the bare roof are 36.1 °C, 32.9 °C, and 6.1 °C, respectively. Compared to the bare roof, the cooling rates of the green roof in terms of average maximum inner surface temperature, daily average temperature, and daily maximum temperature difference are 10.8%, 9.7%, and 26.2%, respectively. The green roof provides a passive cooling effect on the indoor environment, keeping the temperature around 29 °C. A similar trend was observed under non-air-conditioned conditions, as shown in Table 12. This is because the green roof, through the absorption, storage, and slow release of heat by its vegetation and soil layers, can significantly reduce the temperature fluctuations of the inner surface, providing better insulation and improving living comfort. Therefore, comparative analysis shows that the green roof reduces temperature fluctuations on the inner surface and delays the occurrence of peak temperatures during the day due to its high thermal resistance and heat capacity. In contrast, the bare roof experiences faster temperature increases during the day and quicker heat dissipation at night, resulting in greater temperature fluctuations.
Table 11.
Typical values of temperature parameters for the inner surface of the roof on 10–14 August.
Table 12.
Typical values of temperature parameters of the inner surface of the roof on 15–16 August.
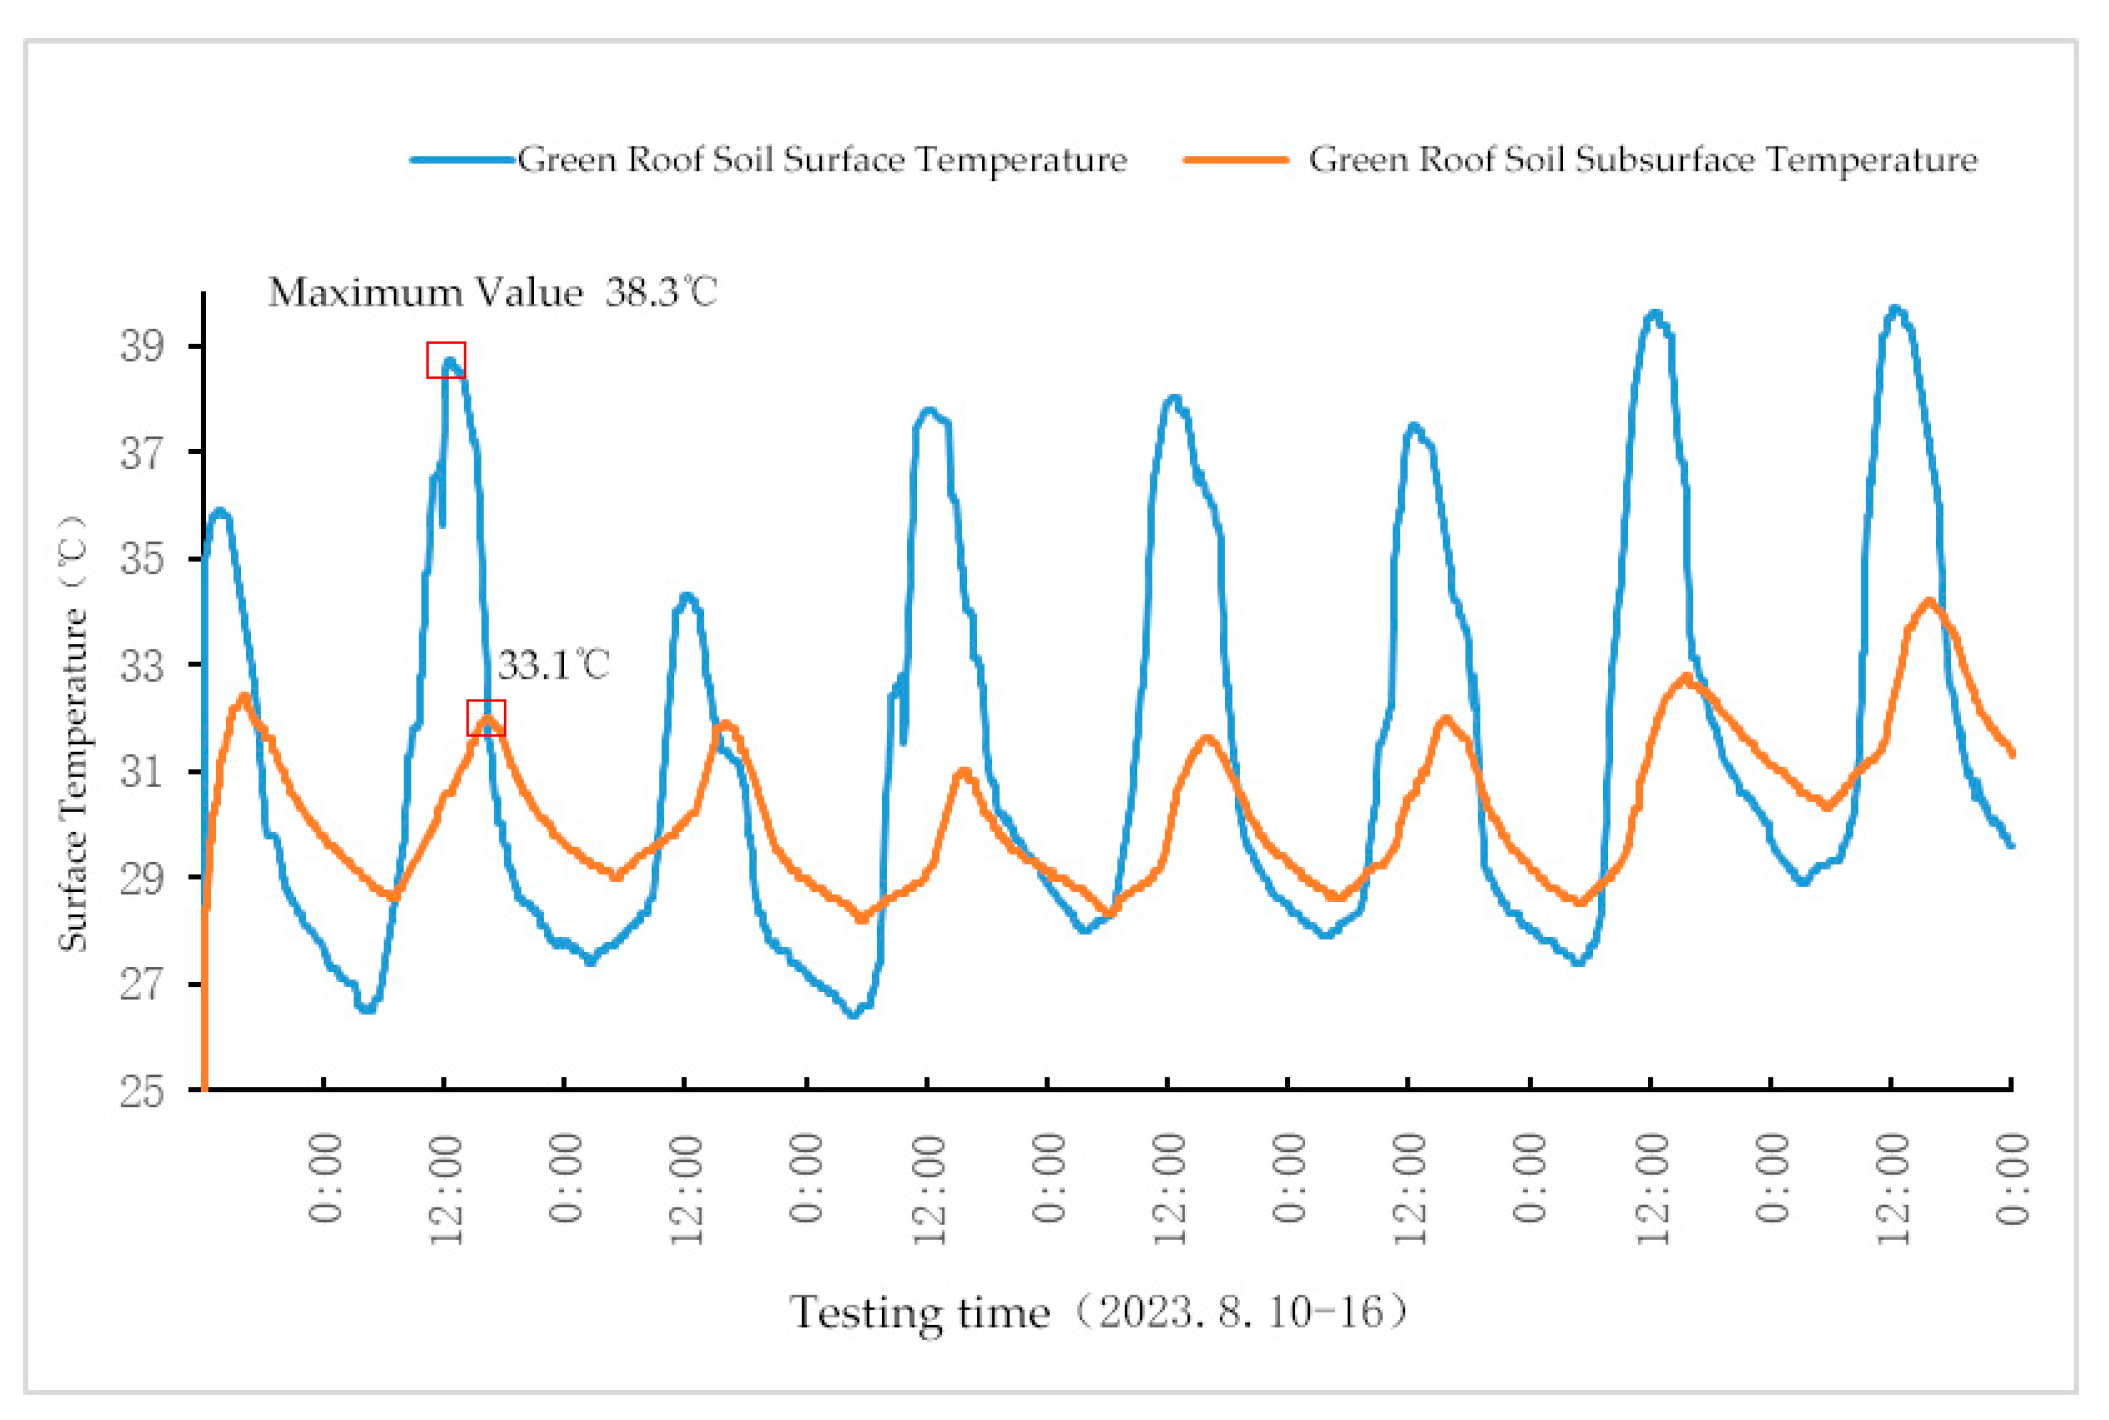
Figure 16 shows the temperature variation trends of the soil surface over the seven test days. The study results indicate that under air-conditioned conditions, the temperature fluctuation of the upper soil surface is greater than that of the lower soil surface (the outer surface of the green roof). The analysis shows that the peak temperature of the lower soil surface occurs between 14:30 and 15:30, approximately 2 h later than the peak temperature of the upper soil surface. The upper soil surface is directly exposed to solar radiation, causing a rapid temperature increase and greater fluctuations during the day. In contrast, the lower soil surface is located within the soil, close to the roof structure, and is less affected by direct solar radiation, resulting in slower and more stable temperature changes. Since heat conduction from the upper surface to the lower surface takes time, the peak temperature of the lower surface generally occurs about 2 h later than that of the upper surface. Under air-conditioned conditions, the maximum temperature of the upper soil surface is 38.3 °C, which is 6.7 °C higher than the lower soil surface temperature, corresponding to a cooling rate of 17.5% for the lower soil surface. Under non-air-conditioned conditions, the maximum temperature of the upper soil surface is 39.3 °C, which is 6.9 °C higher than the lower soil surface temperature, corresponding to a cooling rate of 17.6% for the lower soil surface. The lower soil surface, protected by the soil layer and roof structure, has a lower maximum temperature compared to the upper soil surface, demonstrating the insulating effect of the soil layer. Especially during the day, the temperature of the lower soil surface is generally 5–6 °C lower than that of the upper surface, indicating that the soil layer has good insulation capabilities during the day. Further analysis shows that the temperature fluctuation of the upper soil surface is significant, with a notable daily temperature difference. Under non-air-conditioned conditions, the daily maximum temperature difference reaches 12.1 °C. This is because the upper surface is directly exposed to the external environment, leading to rapid temperature increases during the day and rapid decreases at night. In contrast, the temperature fluctuation of the lower soil surface is smaller, and the daily maximum temperature difference is also lower, demonstrating the effective buffering effect of the soil layer. Whether under air-conditioned or non-air-conditioned conditions, the temperature of the lower soil surface is lower than that of the upper surface, with smaller temperature fluctuations, further highlighting the role of the soil layer in regulating and stabilizing roof temperature.

Figure 16.
Temperature variation trend of soil surface.
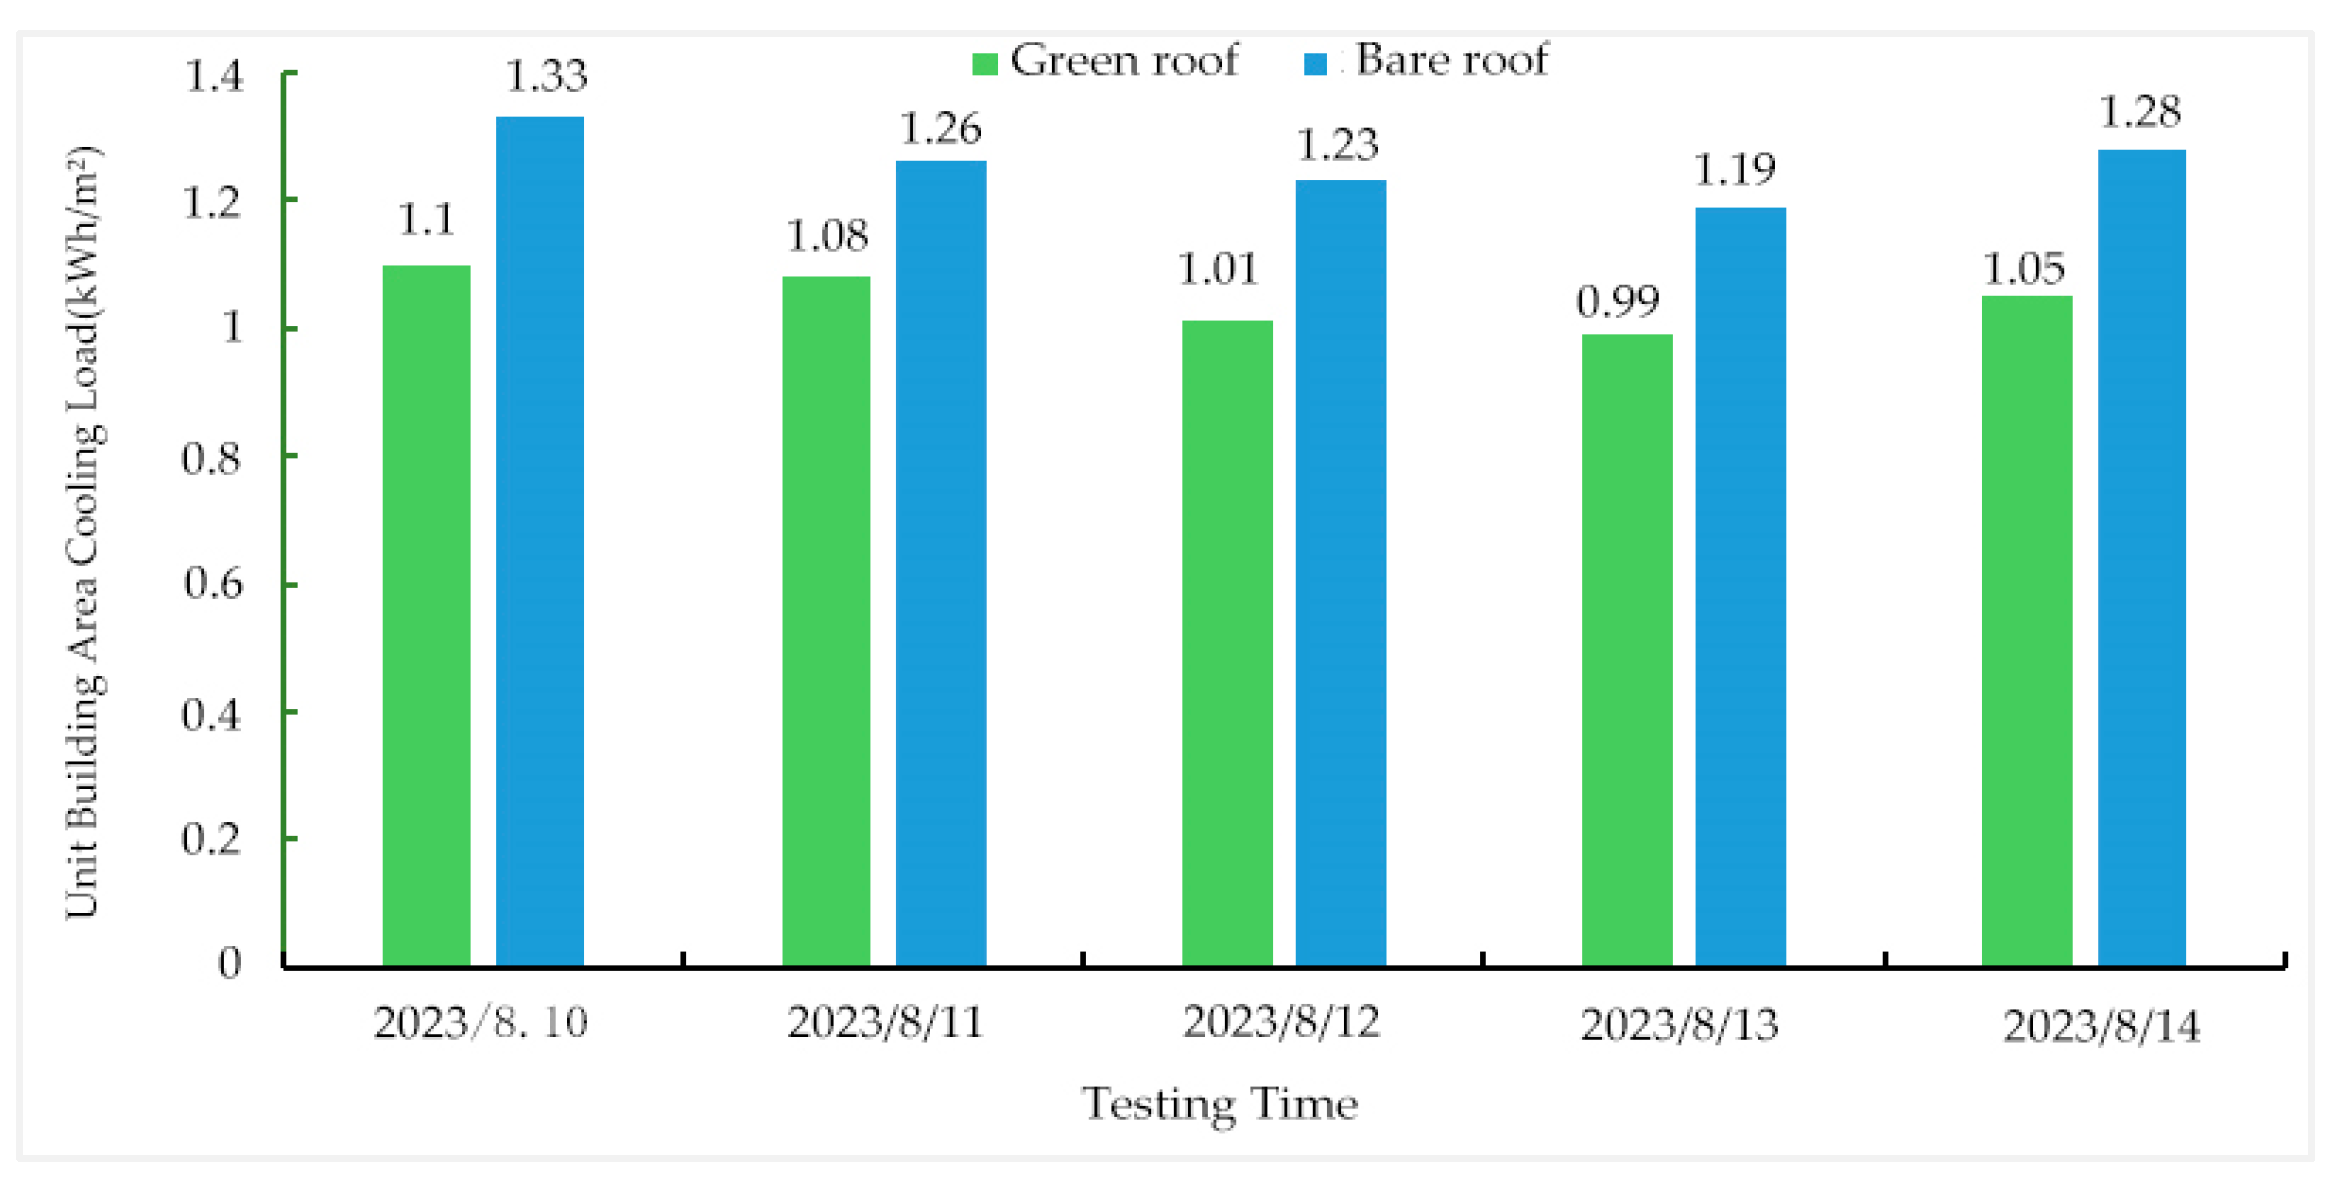
The energy-saving effect of green roofs is mainly reflected in the reduction in cooling loads. Figure 17 shows the cooling load per unit building area over five test days (10–14 August 2023) under air-conditioned conditions. The study selected air conditioning equipment of the same model and performance parameters for measurement, and the room layout was discussed earlier. The results show that the daily average cooling load per unit building area for the green-roof room was 1.05 kWh/m2, while for the bare-roof room, it was 1.26 kWh/m2, with the green roof achieving an energy saving rate of 16.7%. This is due to the slower temperature rise on the inner surface of the green roof, requiring less energy from the air conditioning system during the high-temperature periods of the day, thus resulting in a lower cooling load. This result is similar to the findings of Hashem et al., who reported an average energy saving rate of 16–18% for a school building in California during the summer with a green roof. This further confirms the widespread energy-saving effect of green roofs in different regions and building types.

Figure 17.
Variation in air conditioning cooling load per unit building area from 10 to 14 August.
The measured results from the Jiangsu Jiatianxia elderly service company are similar to those mentioned above and will not be analyzed separately. Furthermore, the Jiangsu Jiatianxia elderly service company has similar measured results, indicating that green roofs can effectively reduce temperature and save energy in Xuzhou, Jiangsu Province, China.
3.2. Analysis of the Questionnaire Results
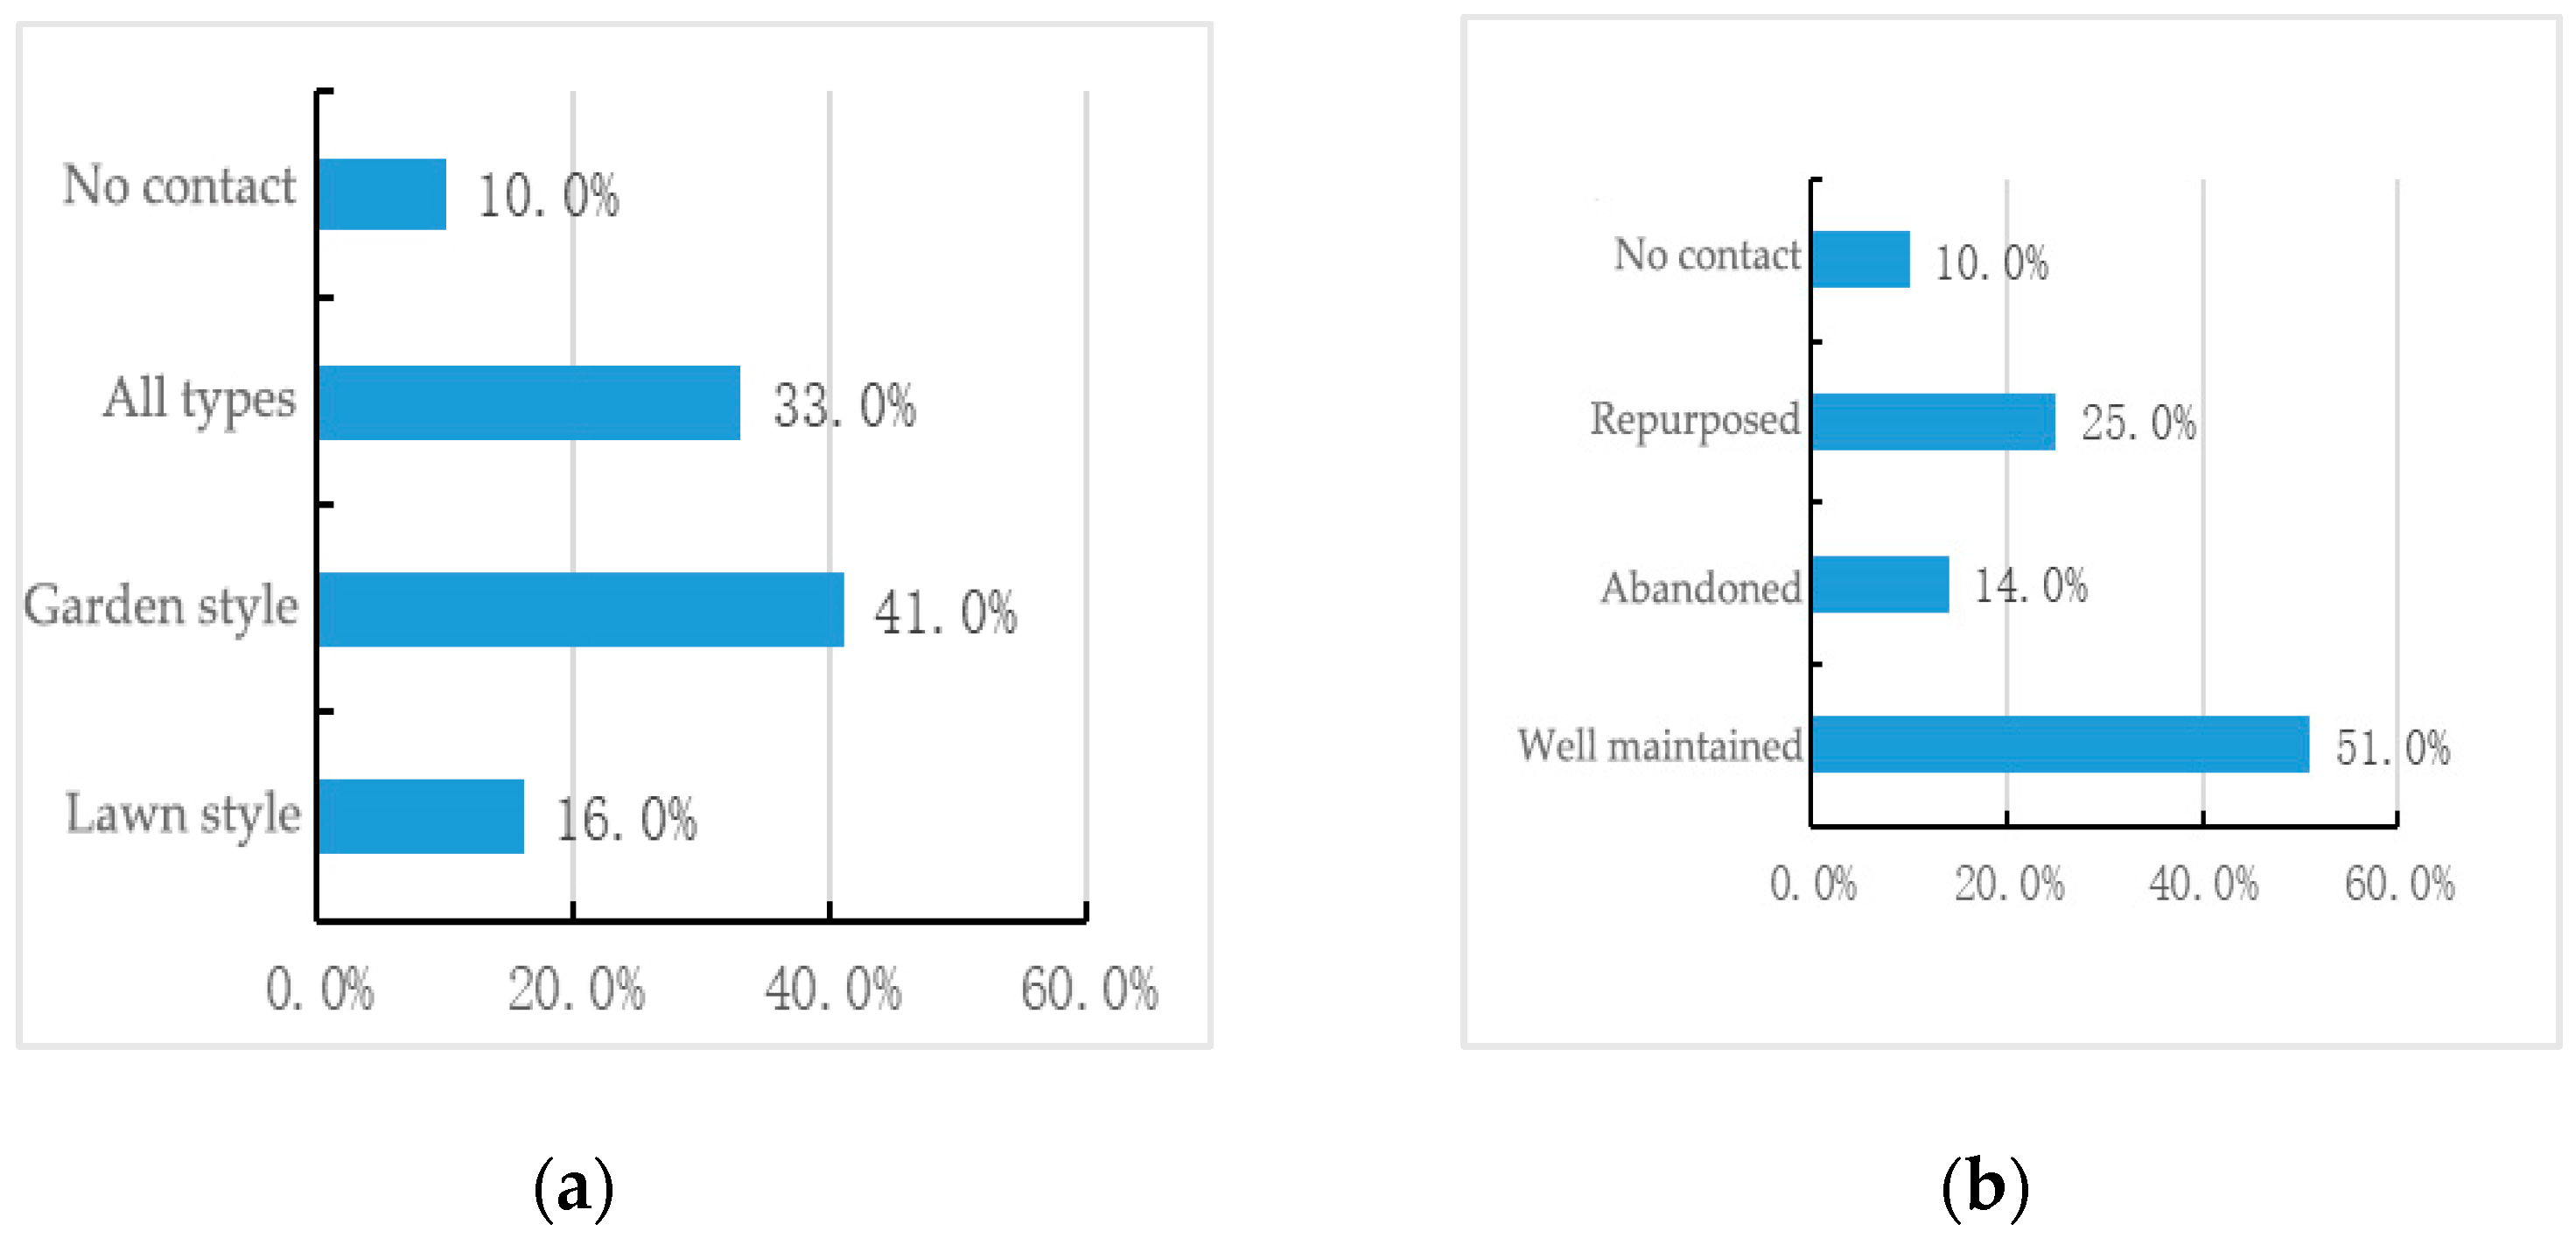
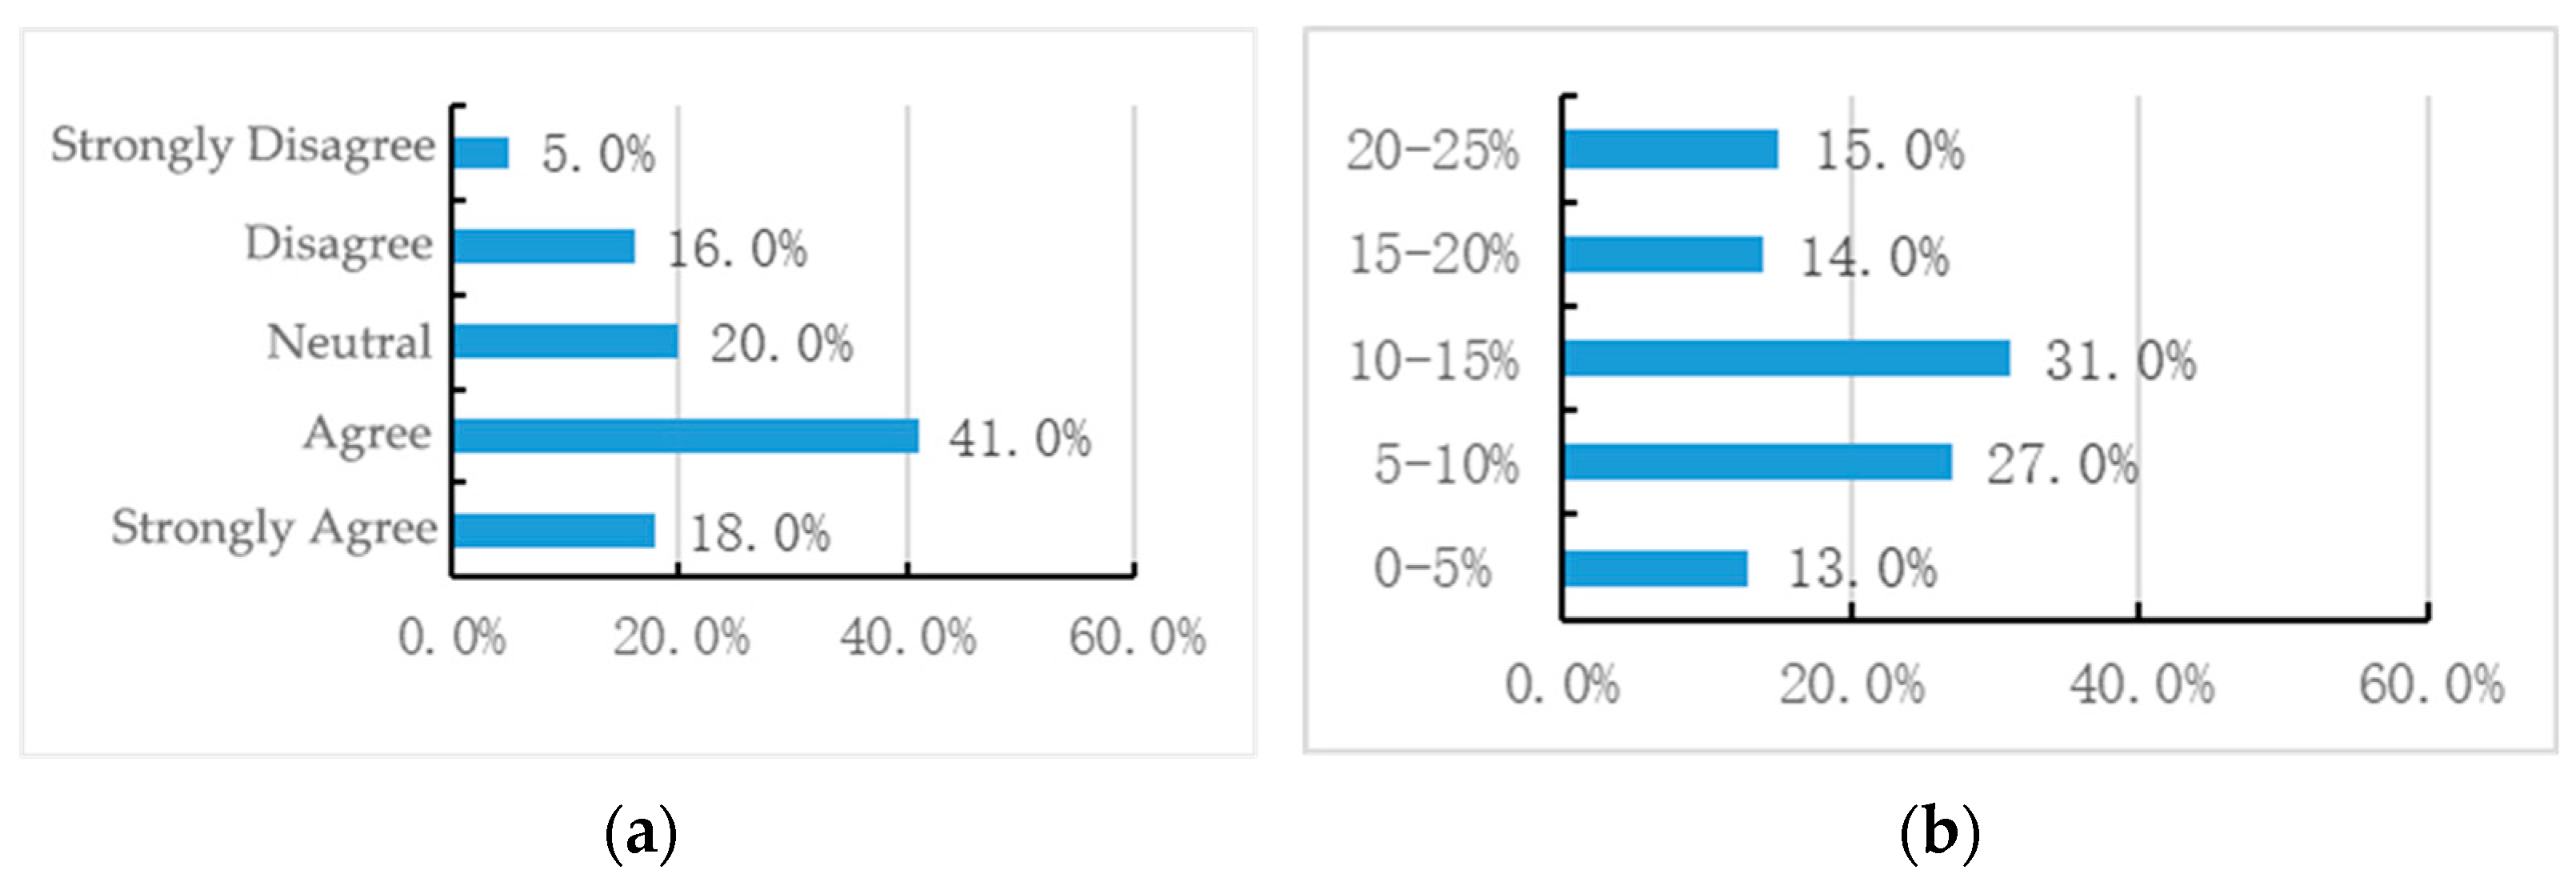
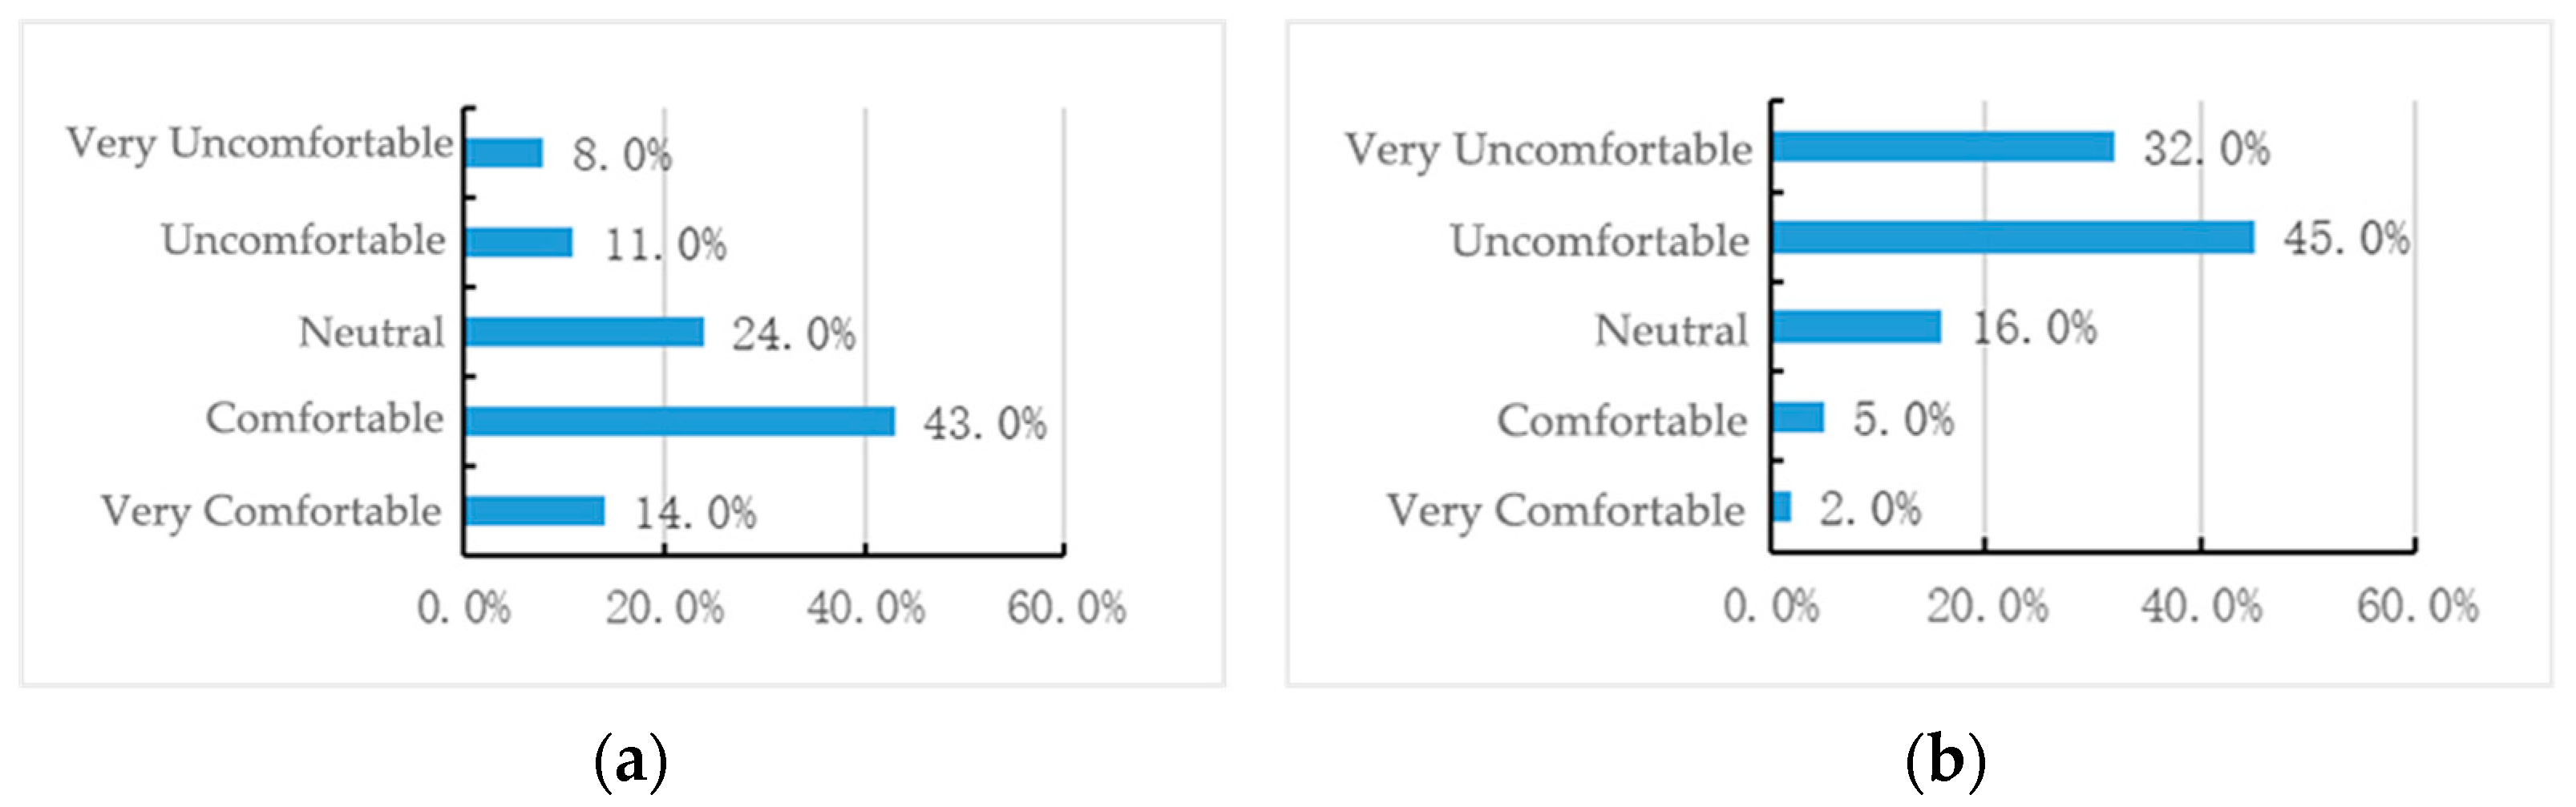
In the Xuzhou green-roof survey, a total of 200 questionnaires were distributed across two green-roof buildings, with 183 valid responses received, resulting in a response rate of 91.5%, indicating that the selected sample data are fairly representative. The Cronbach’s α coefficients for the material market and Jiangsu Jiatiantang Elderly Services Co., Ltd. (Xuzhou, China) are 0.724 and 0.783, respectively, with KMO values of 0.813 and 0.798, indicating good reliability and validity. As shown in Figure 18, the questionnaire results indicate that most green roofs in Xuzhou are garden style and are in good condition. Figure 19 show that 59.0% of respondents agree that green roofs can reduce indoor energy consumption, with most estimating a 10–15% reduction in building energy use. Figure 20 reveals that in summer, satisfaction with air-conditioned rooms is significantly higher than that with non-air-conditioned rooms. The survey also indicates that the biggest issue in constructing green roofs is water leakage and blockage, followed by maintenance and funding challenges and, finally, safety concerns.
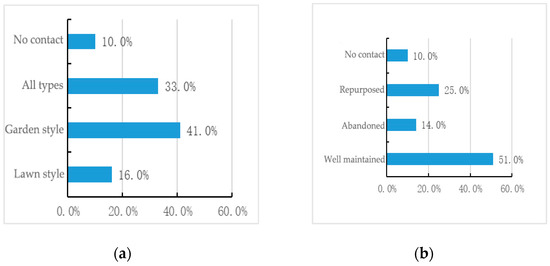
Figure 18.
(a) Green roof form; (b) the use of green roofs.
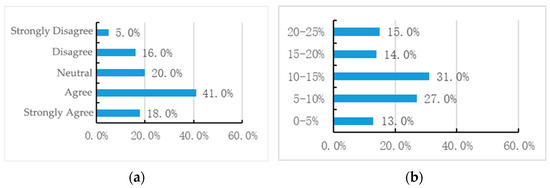
Figure 19.
(a) Degree of agreement on whether roof greening can reduce indoor air conditioning and other energy consumption; (b) green roofs can reduce the energy consumption of the building.
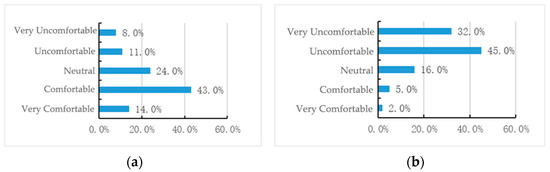
Figure 20.
(a) Indoor comfort feeling when the air conditioner is turned on in summer; (b) feeling of indoor comfort when the air conditioner is not turned on in summer.
3.3. Validation of the Simulation Model
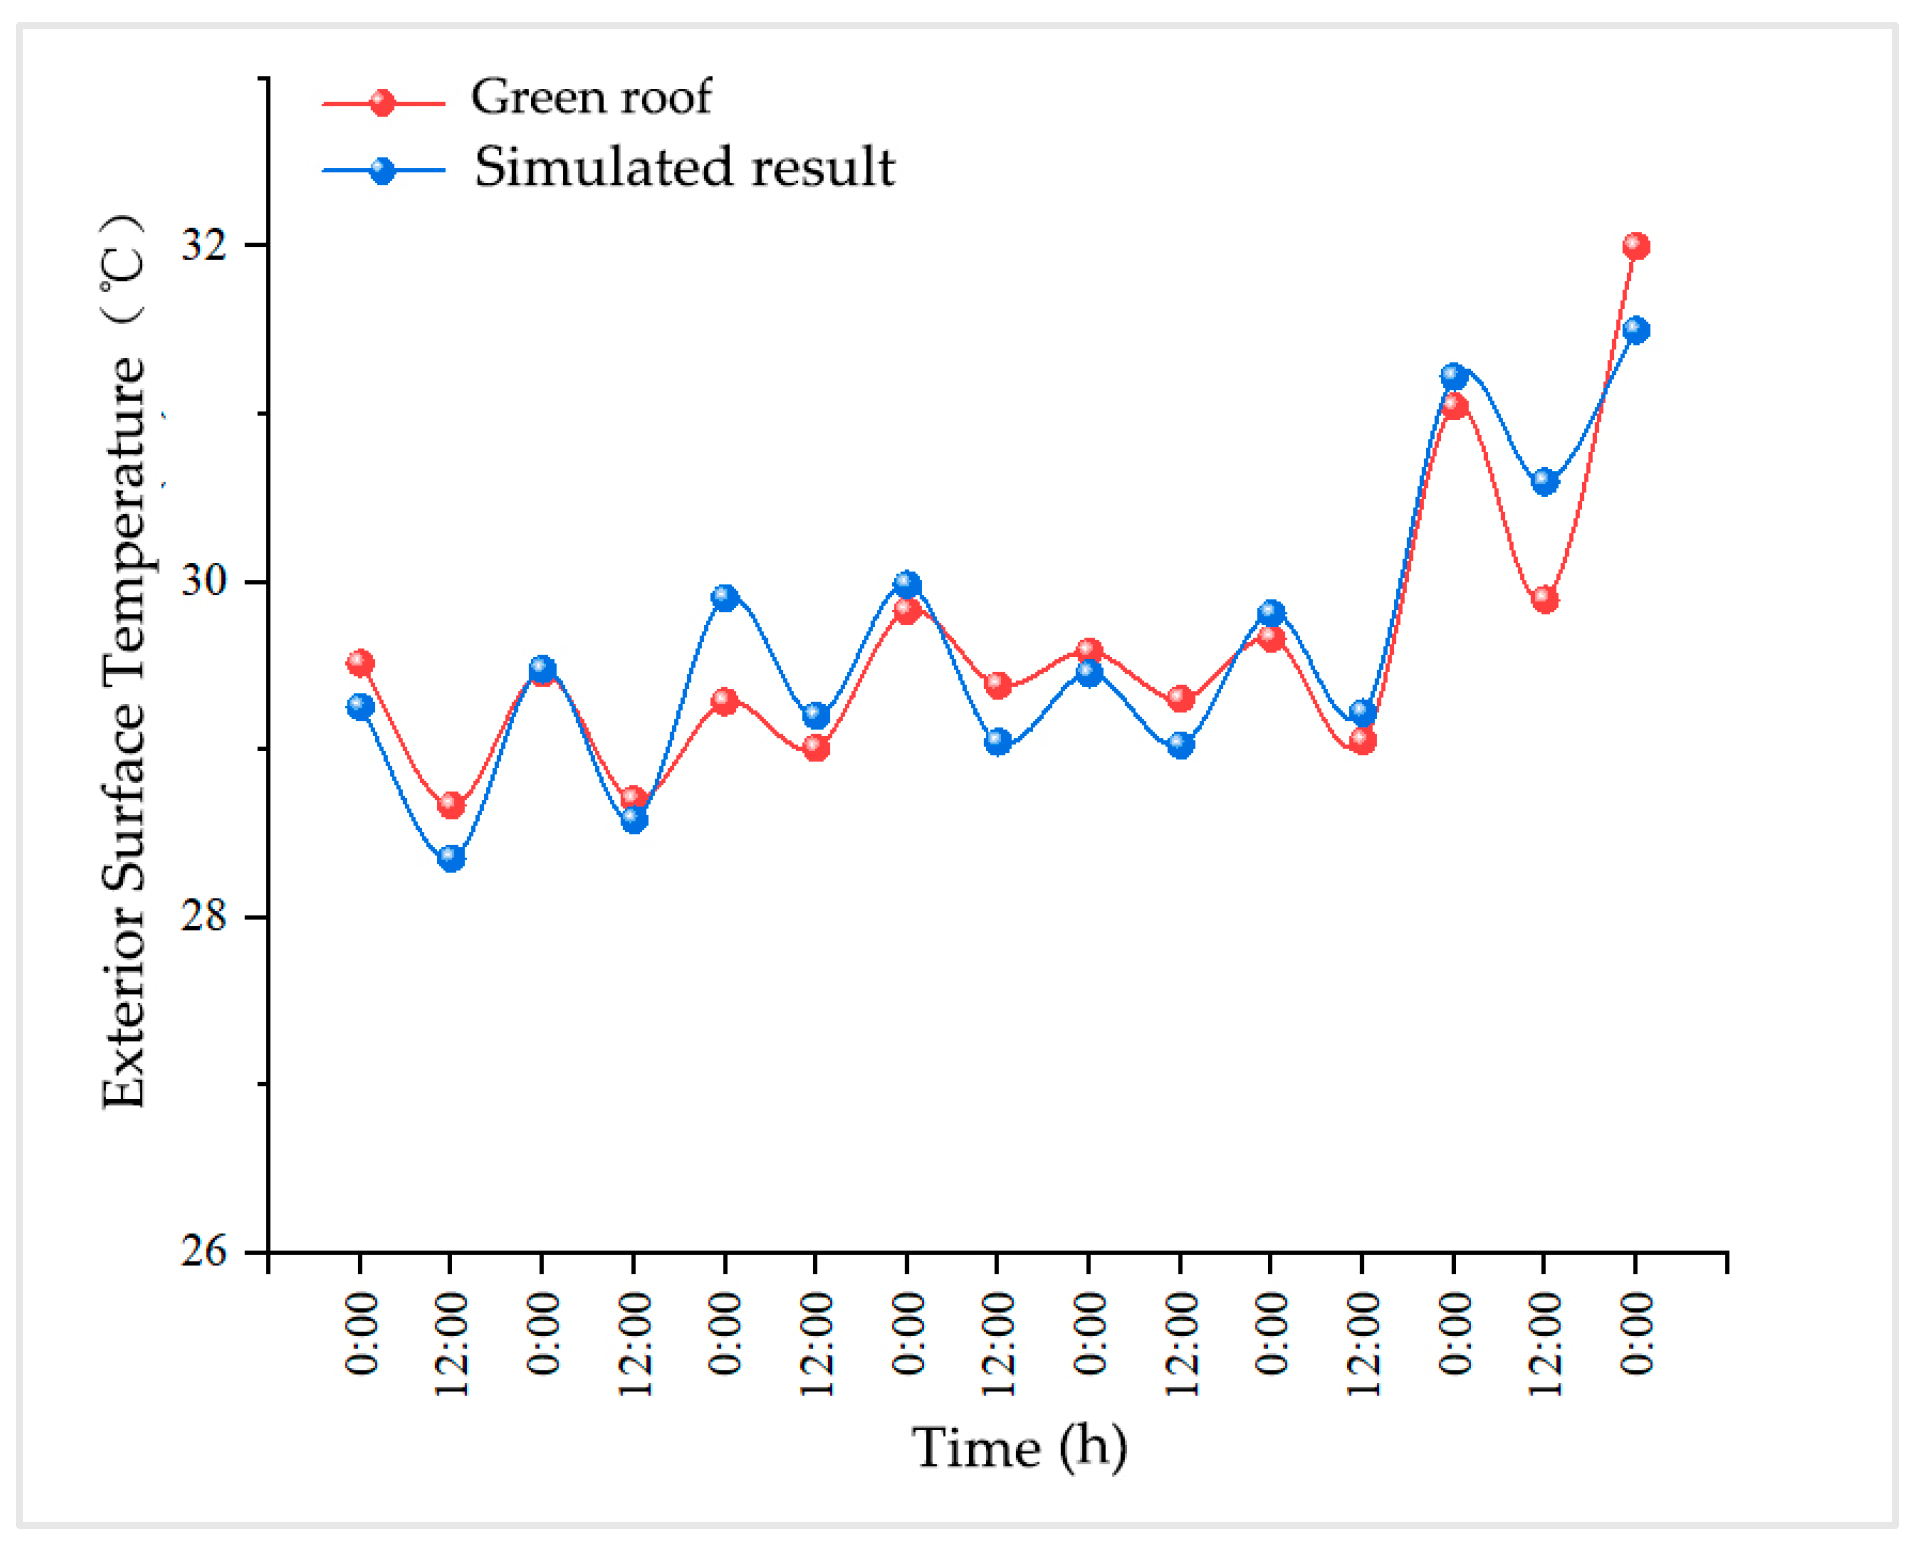
Figure 21 shows the comparison between the measured and simulated exterior surface temperatures of the green roof over seven days. It can be observed that there is a good consistency between the two curves, indicating that the model adequately captures the daily temperature variations. The root mean square error (RMSE) between the measured values and the simulated temperatures is 0.76 °C, which is within the permissible error range. Therefore, the simulation model of the building is acceptable and representative, making it suitable for further analysis.
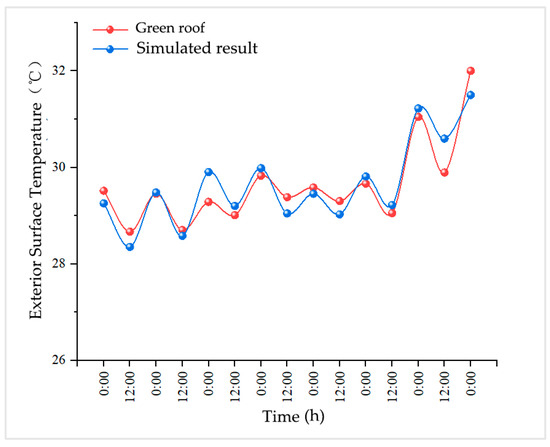
Figure 21.
Comparison of measured and simulated exterior surface temperatures of the green roof.
3.4. The Impact of Soil Thickness on Energy Consumption
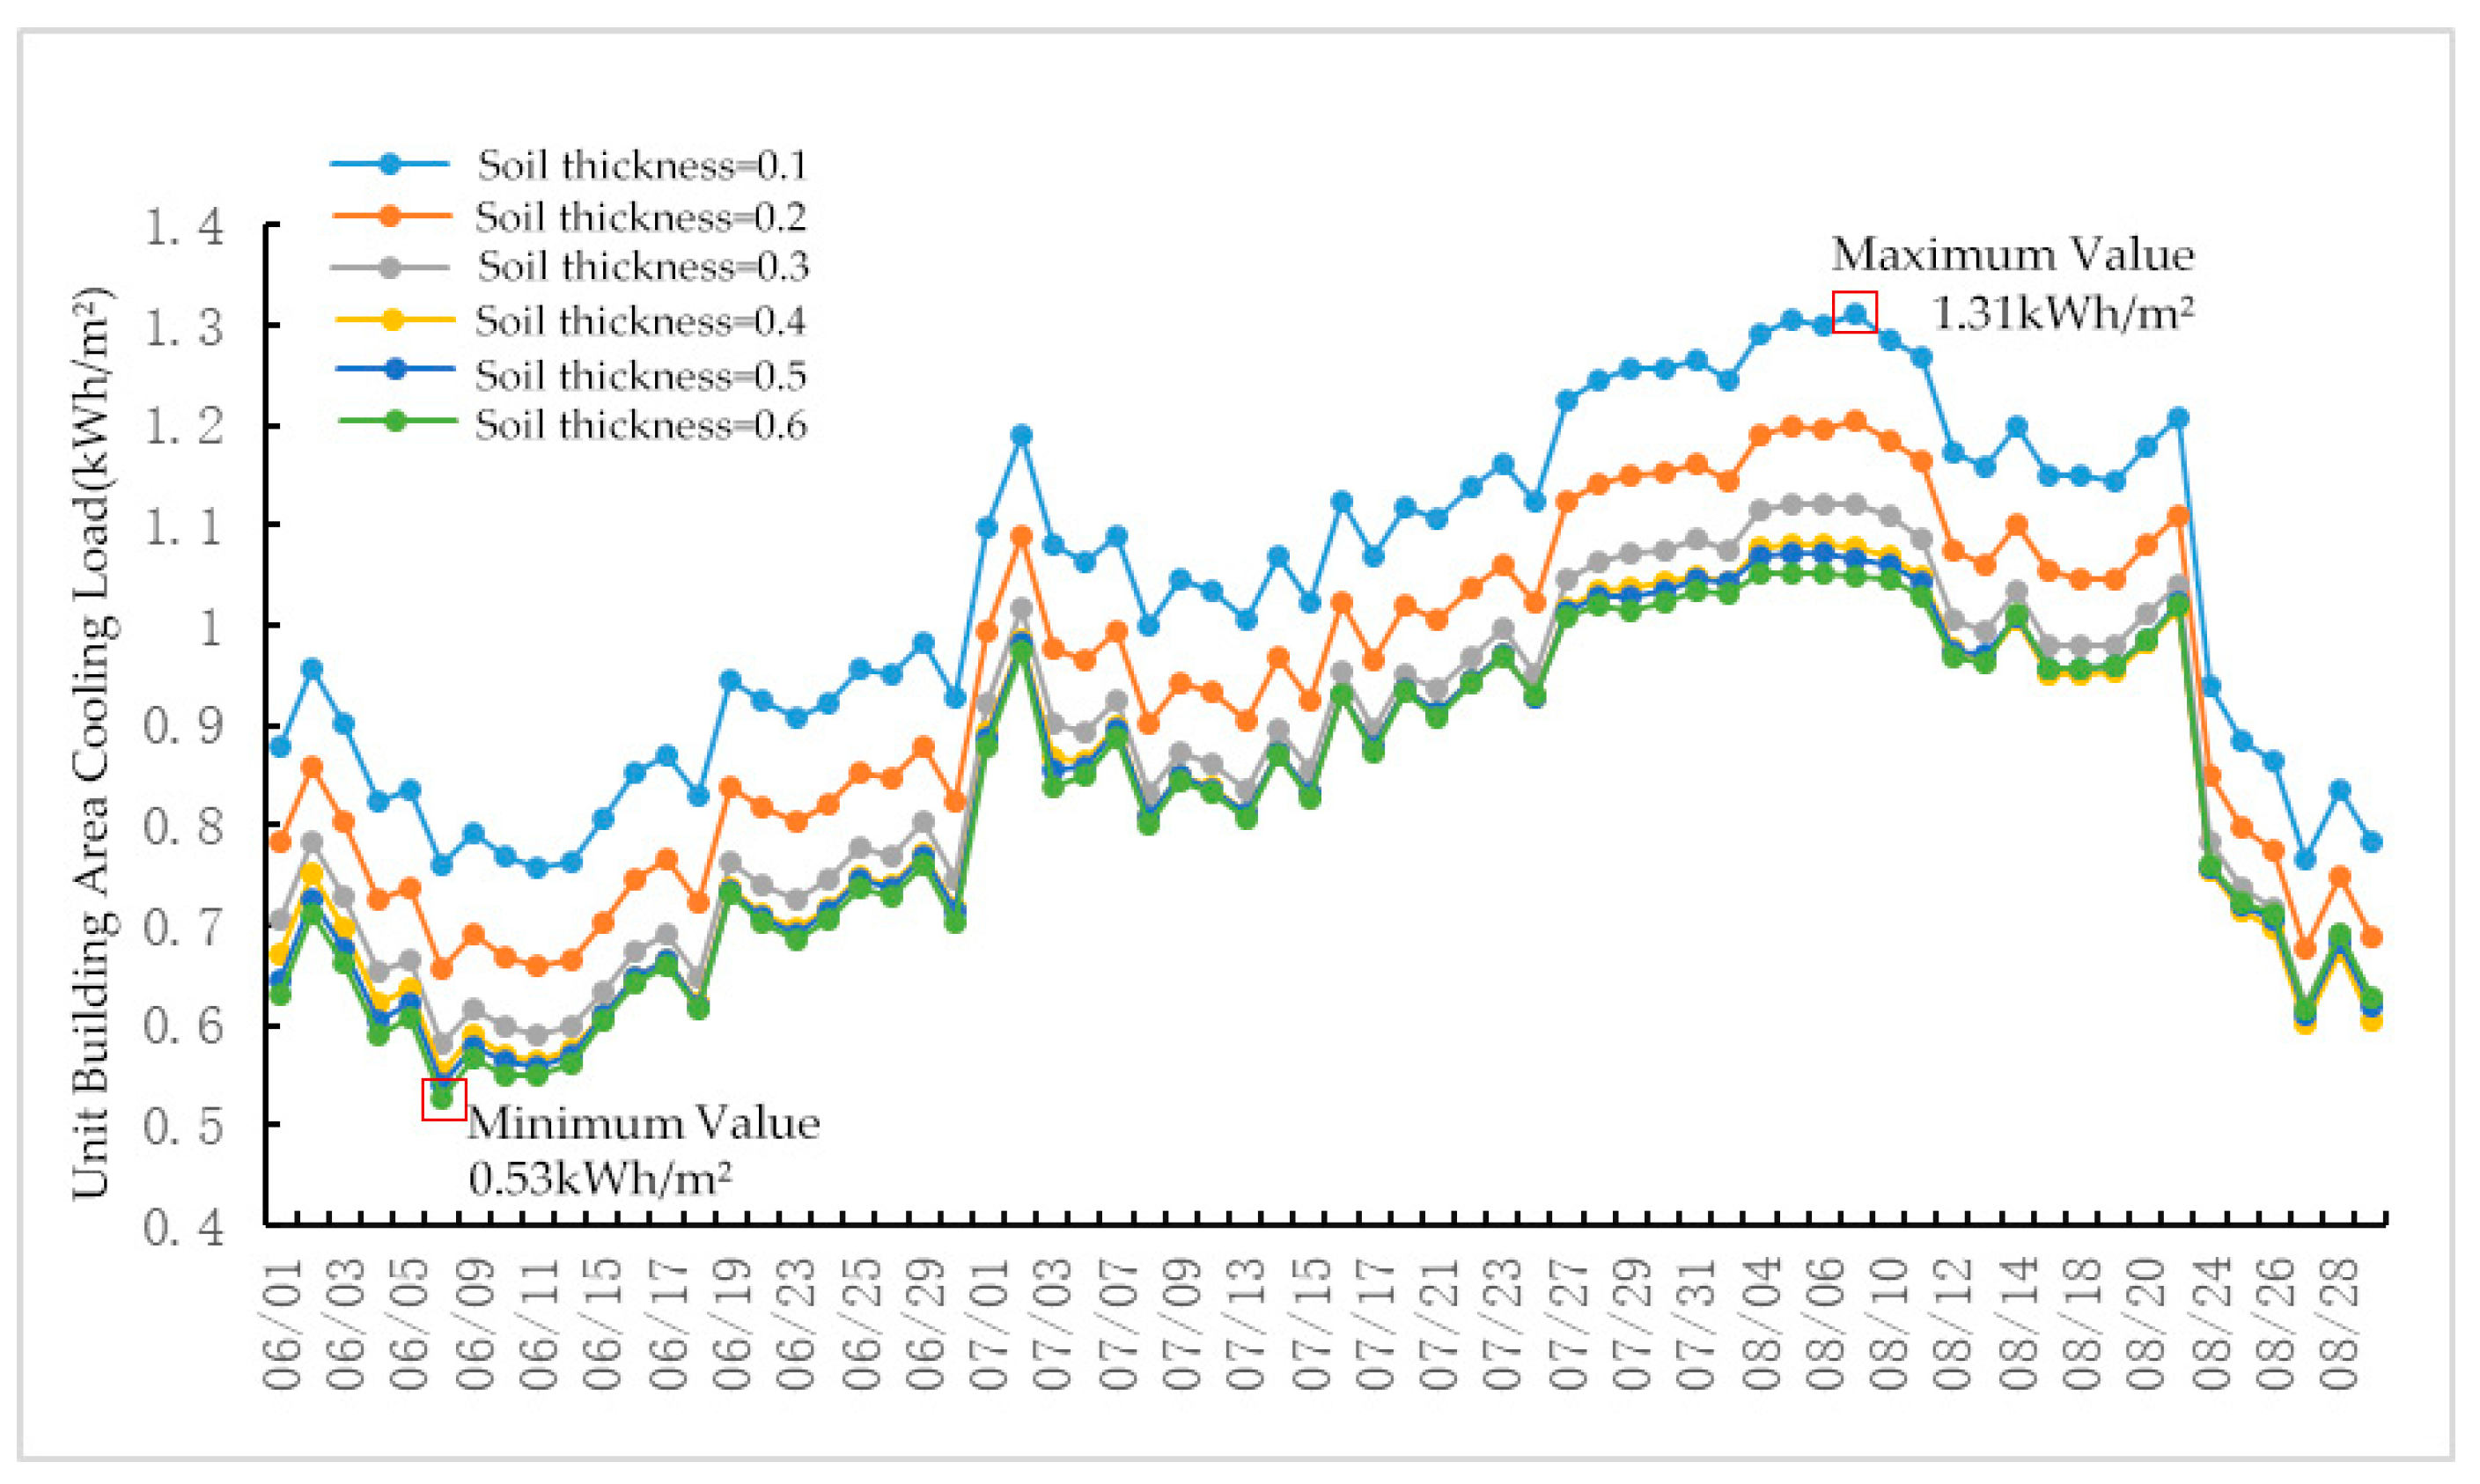
A numerical simulation was conducted to evaluate the cooling load per unit building area during the summer (1 June–31 August) under different soil thicknesses. As shown in Figure 22, the simulation results indicate that as soil thickness increases, the cooling load per unit building area gradually decreases. Thicker soil layers can provide more effective insulation, thereby slowing down the rate at which heat is transferred into the building. The highest daily value was observed on 7 August, with a cooling load per unit area of 1.31 kWh/m2 when the soil thickness was 0.1 m. The lowest daily value was recorded on 8 June, with a cooling load per unit area of 0.53 kWh/m2 when the soil thickness was 0.6 m. When the soil thickness is less than 0.3 m, the reduction in cooling load is more significant, but beyond 0.3 m, the rate of heat transfer slows down relatively. This phenomenon occurs because the insulating effect of the soil reaches a certain threshold, beyond which further increasing the thickness does not significantly enhance insulation performance. During the simulation period, the total cooling load per unit area for soil thicknesses of 0.1 m, 0.2 m, 0.3 m, 0.4 m, 0.5 m, and 0.6 m was 68.4 kWh/m2, 61.7 kWh/m2, 57.0 kWh/m2, 55.2 kWh/m2, 54.9 kWh/m2, and 54.5 kWh/m2, respectively. Using the daily average total cooling load per unit area at 0.1 m thickness as the baseline, the energy saving rates for soil thicknesses of 0.2 m to 0.6 m were 10.6%, 17.0%, 19.6%, 20.0%, and 20.6%, respectively. When using the daily average total cooling load per unit area at 0.1 m as the baseline, the energy saving rates between thicknesses of 0.2 m and 0.6 m were 6.4%, 2.6%, 0.4%, and 0.6%, respectively. This shows that as soil thickness increases, the differences in energy saving rates gradually diminish. The above analysis indicates that when designing green roofs, the soil thickness should not exceed 0.3 m. Additionally, a soil thickness of 0.3 m provides sufficient insulation performance while also avoiding excessive roof load.
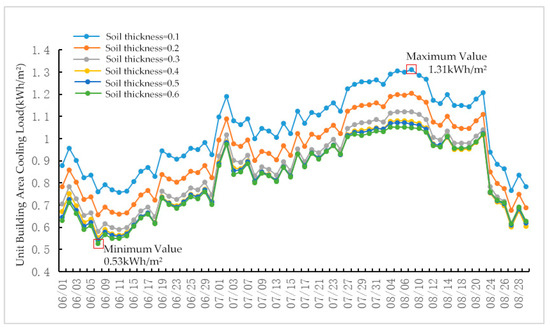
Figure 22.
Simulation of the variation in air conditioning cooling load per unit building area with soil thickness.
3.5. The Impact of Soil Thermal Conductivity on Energy Consumption
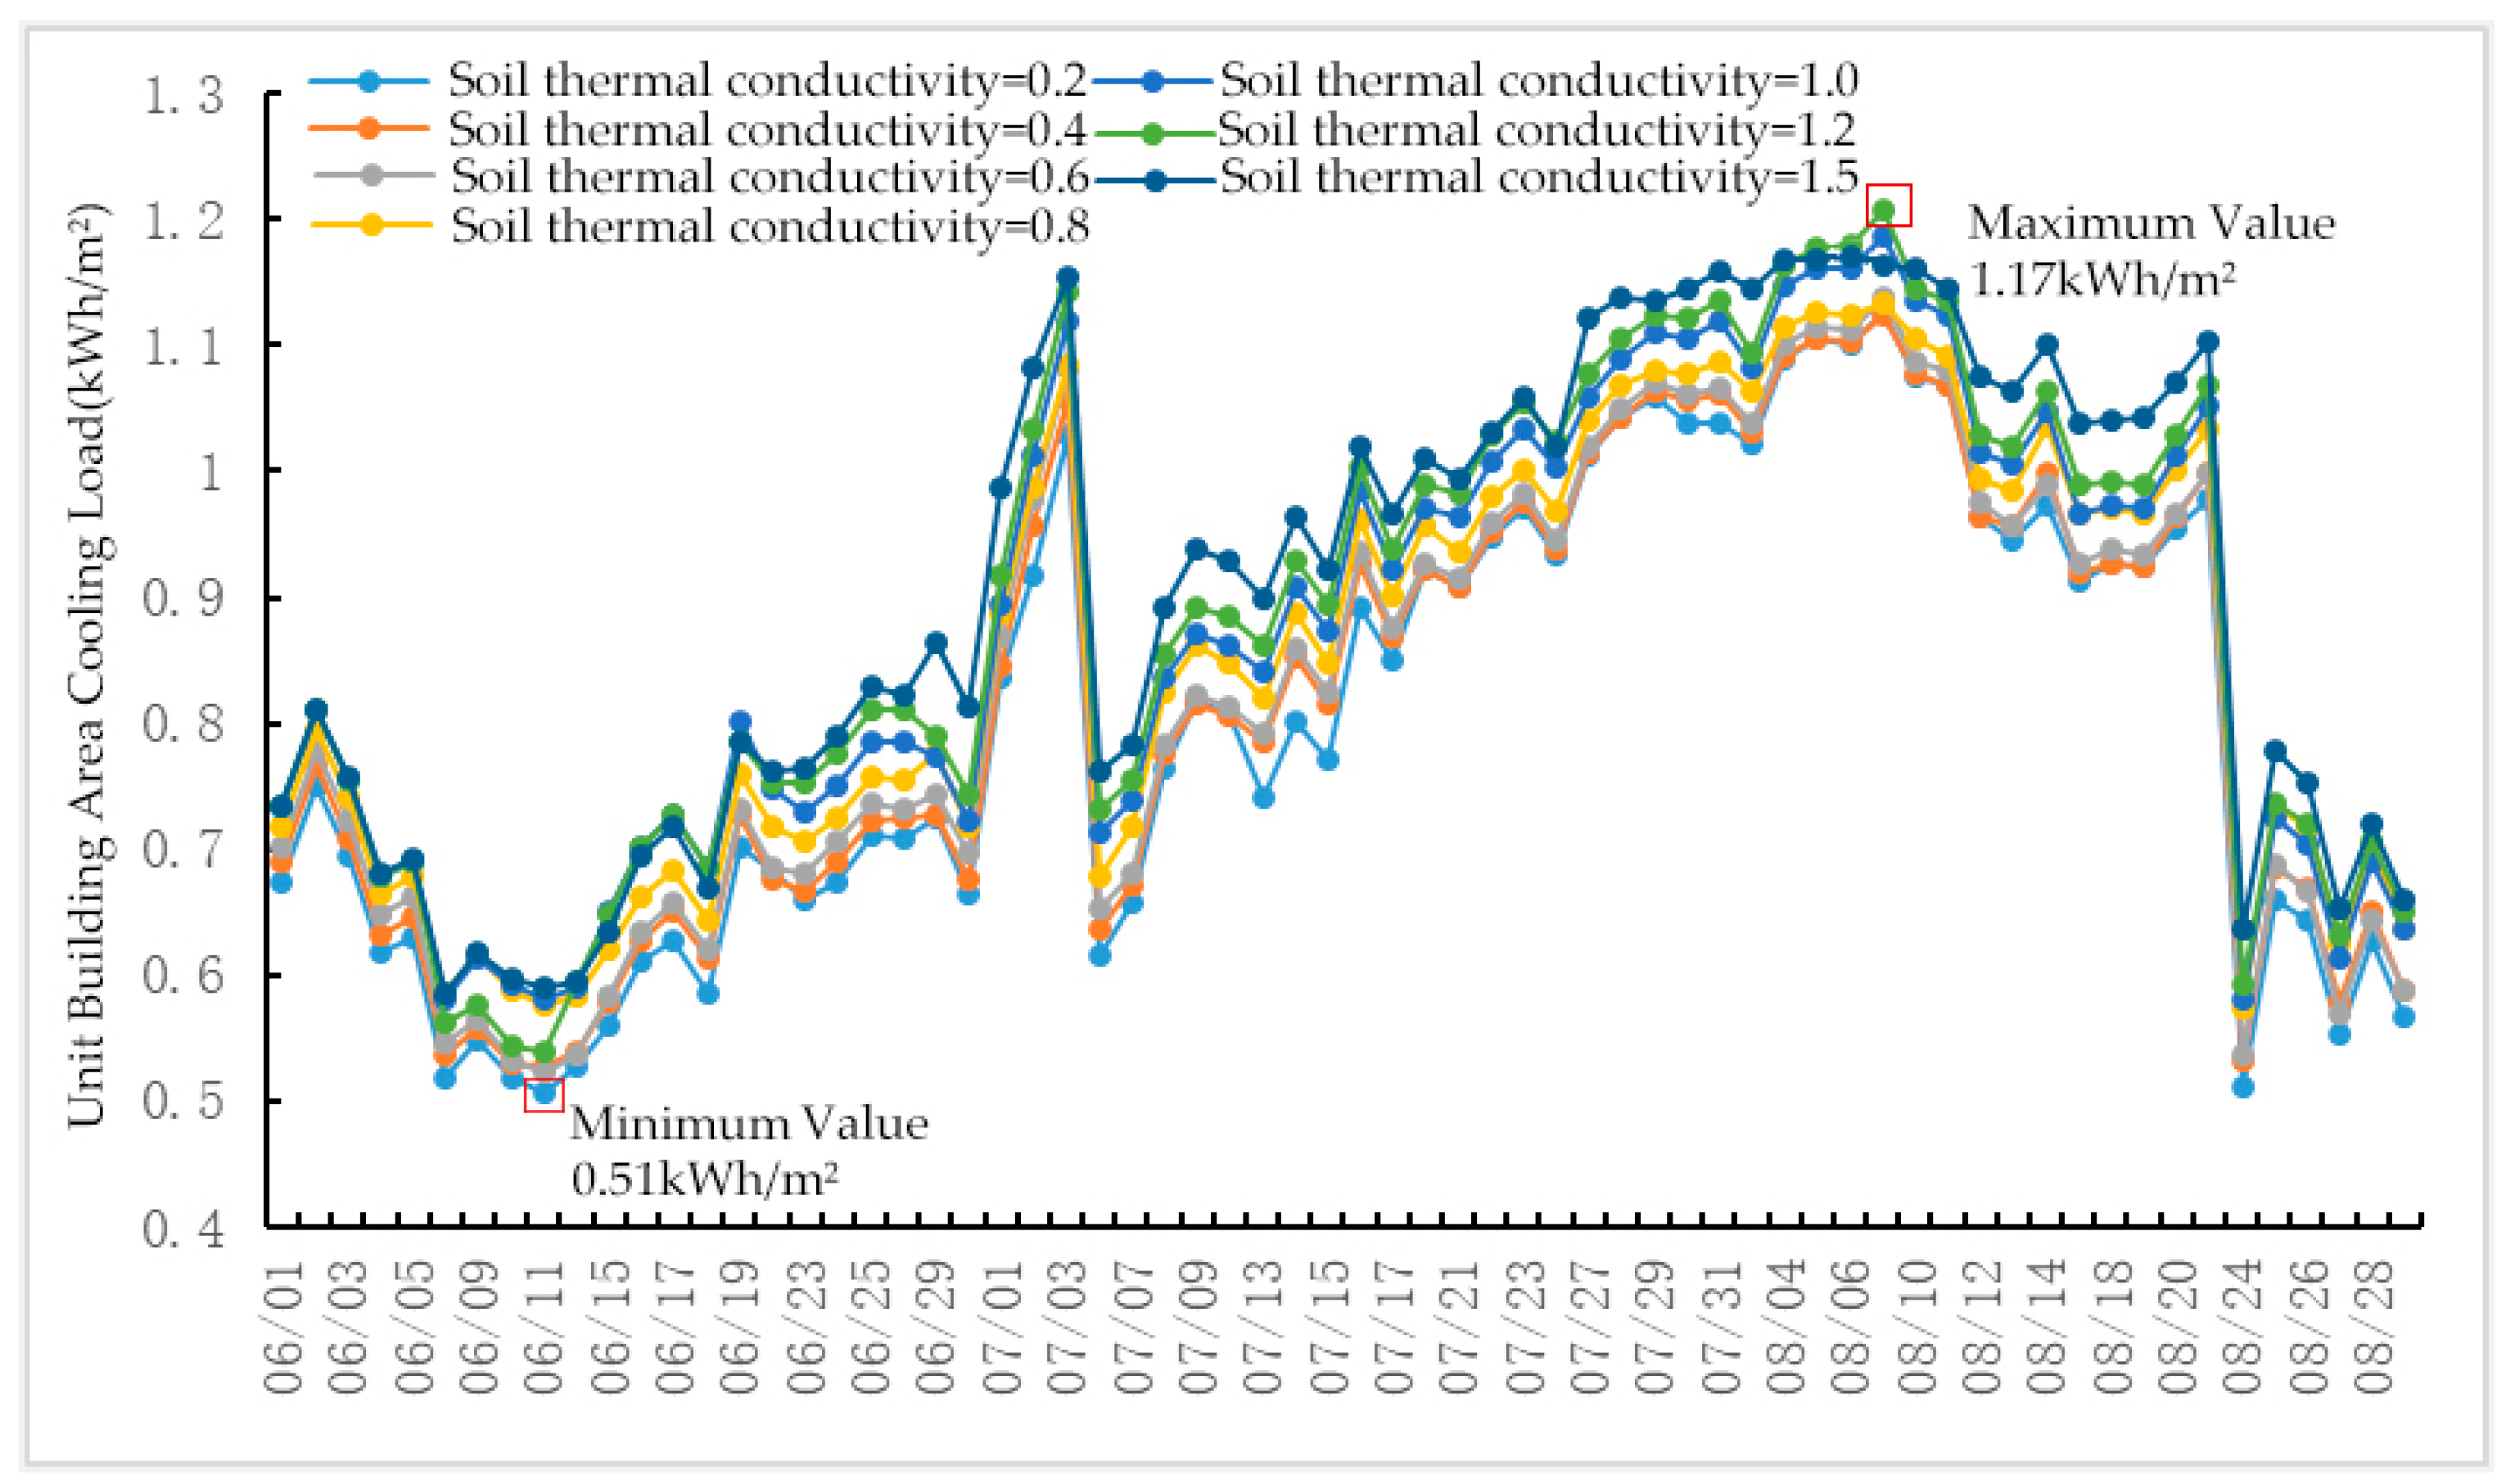
To simplify the model and maintain consistency in research conditions, this study assumes that the soil layer is in a dry state, with the thermal conductivity of the dry soil layer set to 0.35 W/m·K. A numerical simulation was conducted to evaluate the cooling load per unit building area during the summer (1 June–31 August) under different soil thermal conductivity values. The highest daily cooling load per unit area was observed on 6 August, with a value of 1.17 kWh/m2 when the soil thermal conductivity was 1.5 W/mK. The lowest daily value was recorded on 11 June, with a cooling load per unit area of 0.51 kWh/m2 when the soil thermal conductivity was 0.2 W/mK. As shown in Figure 23, for soil thermal conductivity values of 0.2 W/mK, 0.4 W/mK, 0.6 W/mK, 0.8 W/mK, 1.0 W/mK, 1.2 W/mK, and 1.5 W/mK, the total cooling load per unit area was 53.0 kWh/m2, 54.0 kWh/m2, 54.4 kWh/m2, 56.3 kWh/m2, 57.5 kWh/m2, 57.6 kWh/m2, and 59.8 kWh/m2, respectively. Using the daily average total cooling load per unit area at 0.2 W/mK thermal conductivity as the baseline, the energy saving rates for thermal conductivities of 0.4 W/mK to 1.5 W/mK were −2.3%, −3.0%, −6.6%, −8.9%, −9.0%, and −13.3%, respectively. The analysis indicates that soil material with a thermal conductivity of 0.2 W/mK shows the lowest total cooling load, suggesting that the lower the soil thermal conductivity, the lower the cooling load per unit building area. Lower soil density and moisture content result in lower thermal conductivity. Therefore, when designing green roofs, it is advisable to select lightweight planting soils with low thermal conductivity. Lightweight substrates are typically composed of a mixture of agricultural and forestry waste, peat, perlite, vermiculite, and other lightweight minerals, which can reduce roof load. It is important to note that the heat transfer coefficient is not only determined by the thermal conductivity of the materials but is also influenced by air velocity, especially under conditions of natural ventilation or high wind speeds. In this study, when simulating green roofs in EnergyPlus, the default air velocity is set to 0.5 m/s. Although the actual variations in air velocity were not considered during the simulation, which may lead to an underestimation or overestimation of the cooling load, the simulation results still provide valuable reference information under the existing conditions.
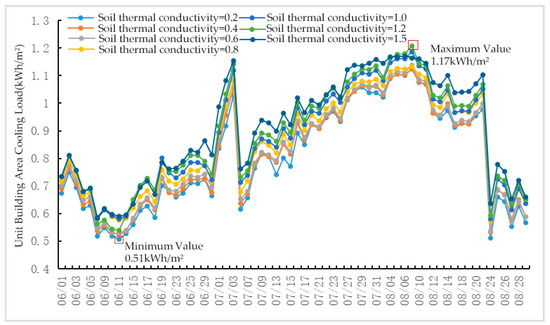
Figure 23.
Simulation of variation in air conditioning cooling load per unit building area with soil thermal conductivity.
3.6. The Impact of Leaf Area Index (LAI) on Energy Consumption
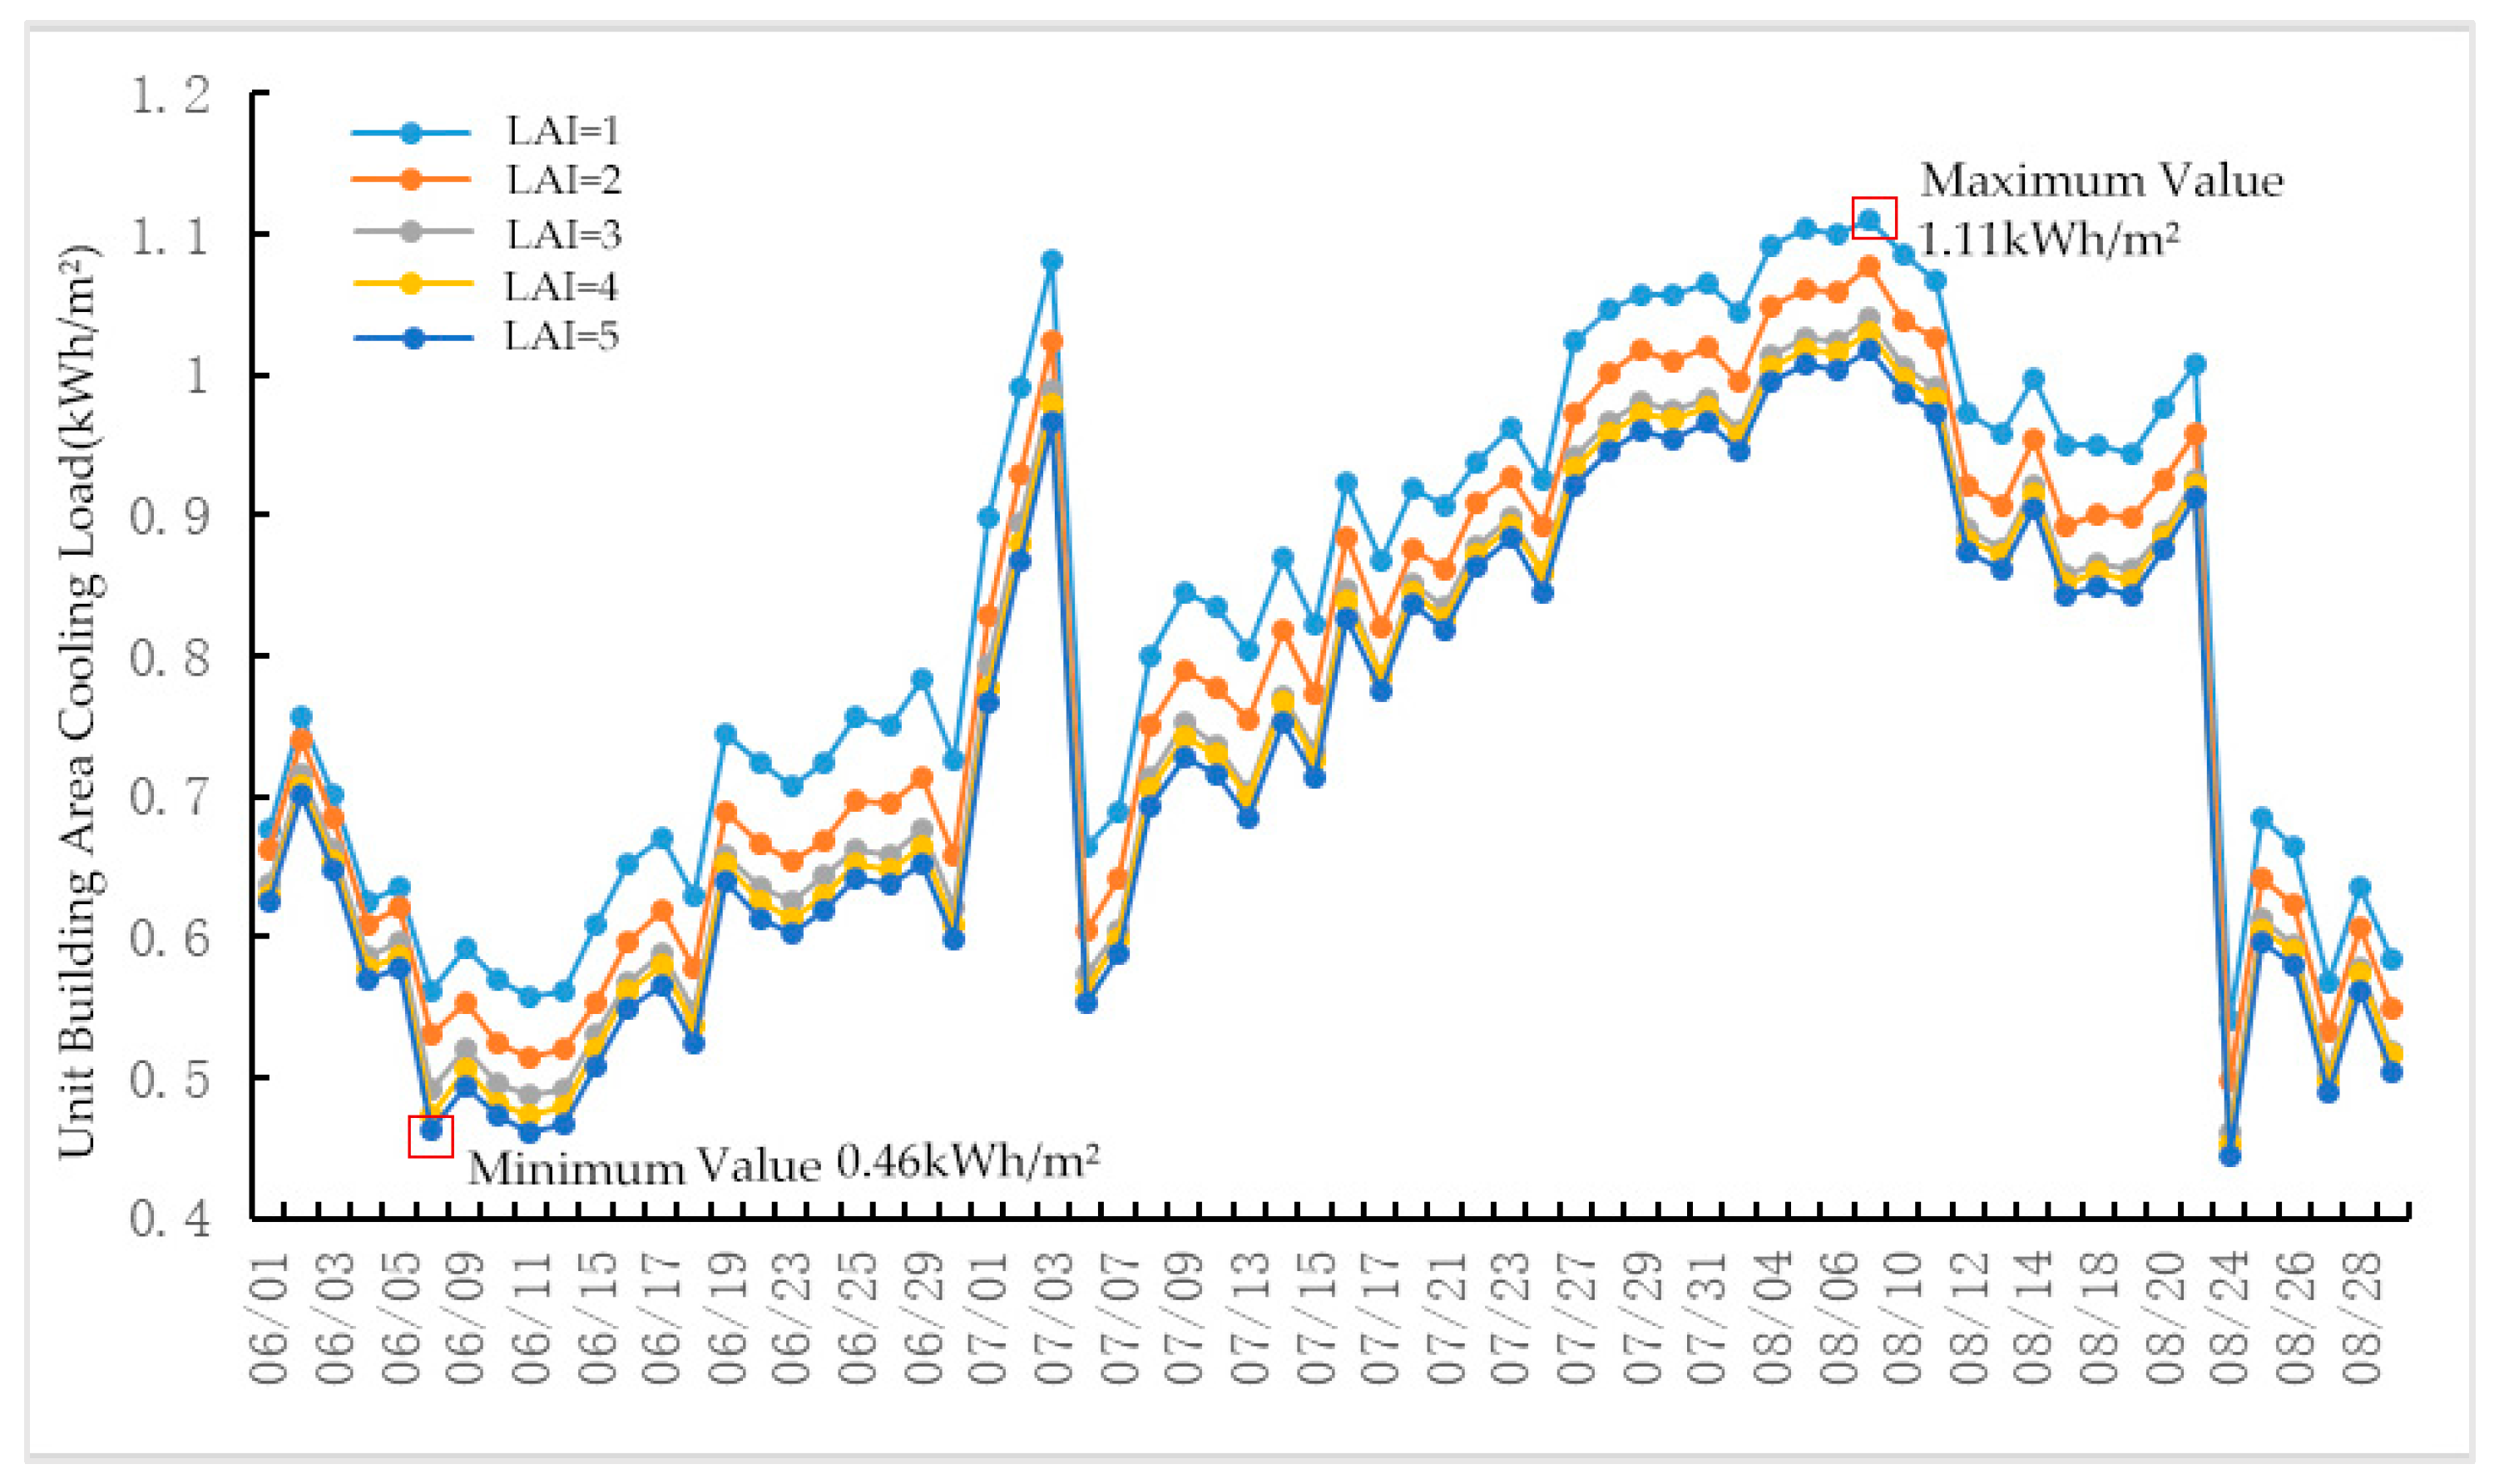
A numerical simulation was conducted to evaluate the cooling load per unit building area during the summer (1 June–31 August) under different leaf area index (LAI) values. The results show that the highest cooling load per unit area occurred on 7 August, reaching 1.11 kWh/m2 with an LAI of 1, while the lowest load was observed on June 8, with an LAI of 5 at 0.46 kWh/m2. As shown in Figure 24, particularly during the high-temperature periods in July and August, the cooling load at an LAI of 1 is significantly higher than that at other values. This indicates that lower LAI values are less effective in reducing the heat entering the building, leading to an increased cooling load. The total cooling load per unit area for LAI values of 1, 2, 3, 4, and 5 were 54.8 kWh/m2, 51.8 kWh/m2, 49.6 kWh/m2, 49.1 kWh/m2, and 48.5 kWh/m2, respectively. Compared to the LAI of 1, the energy saving rates for LAI values of 2, 3, 4, and 5 were 5.4%, 9.5%, 10.4%, and 11.5%, respectively. The analysis indicates that as the LAI increases from 1 to 5, the cooling load per unit building area decreases sequentially. This is because a higher LAI represents denser vegetation, with the leaves providing greater shading against solar radiation, thereby reducing the heat gain of the building and lowering the cooling load per unit area. However, in practice, achieving an LAI of 5 is often difficult. Additionally, the energy saving rate difference between LAI values of 3 and 2 is 4.1%, leading to the conclusion that beyond an LAI of 3, the differences between the curves become smaller, indicating that the rate of cooling load reduction begins to slow down. Therefore, when designing green roofs, it is recommended to use an optimal LAI value of 3 to balance energy-saving effects and practical feasibility.
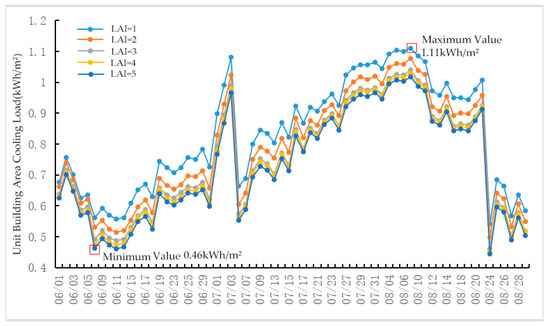
Figure 24.
Simulation of the variation in air conditioning cooling load per unit building area with leaf area index (LAI).
3.7. The Impact of Insulation Layer Thickness on Energy Consumption
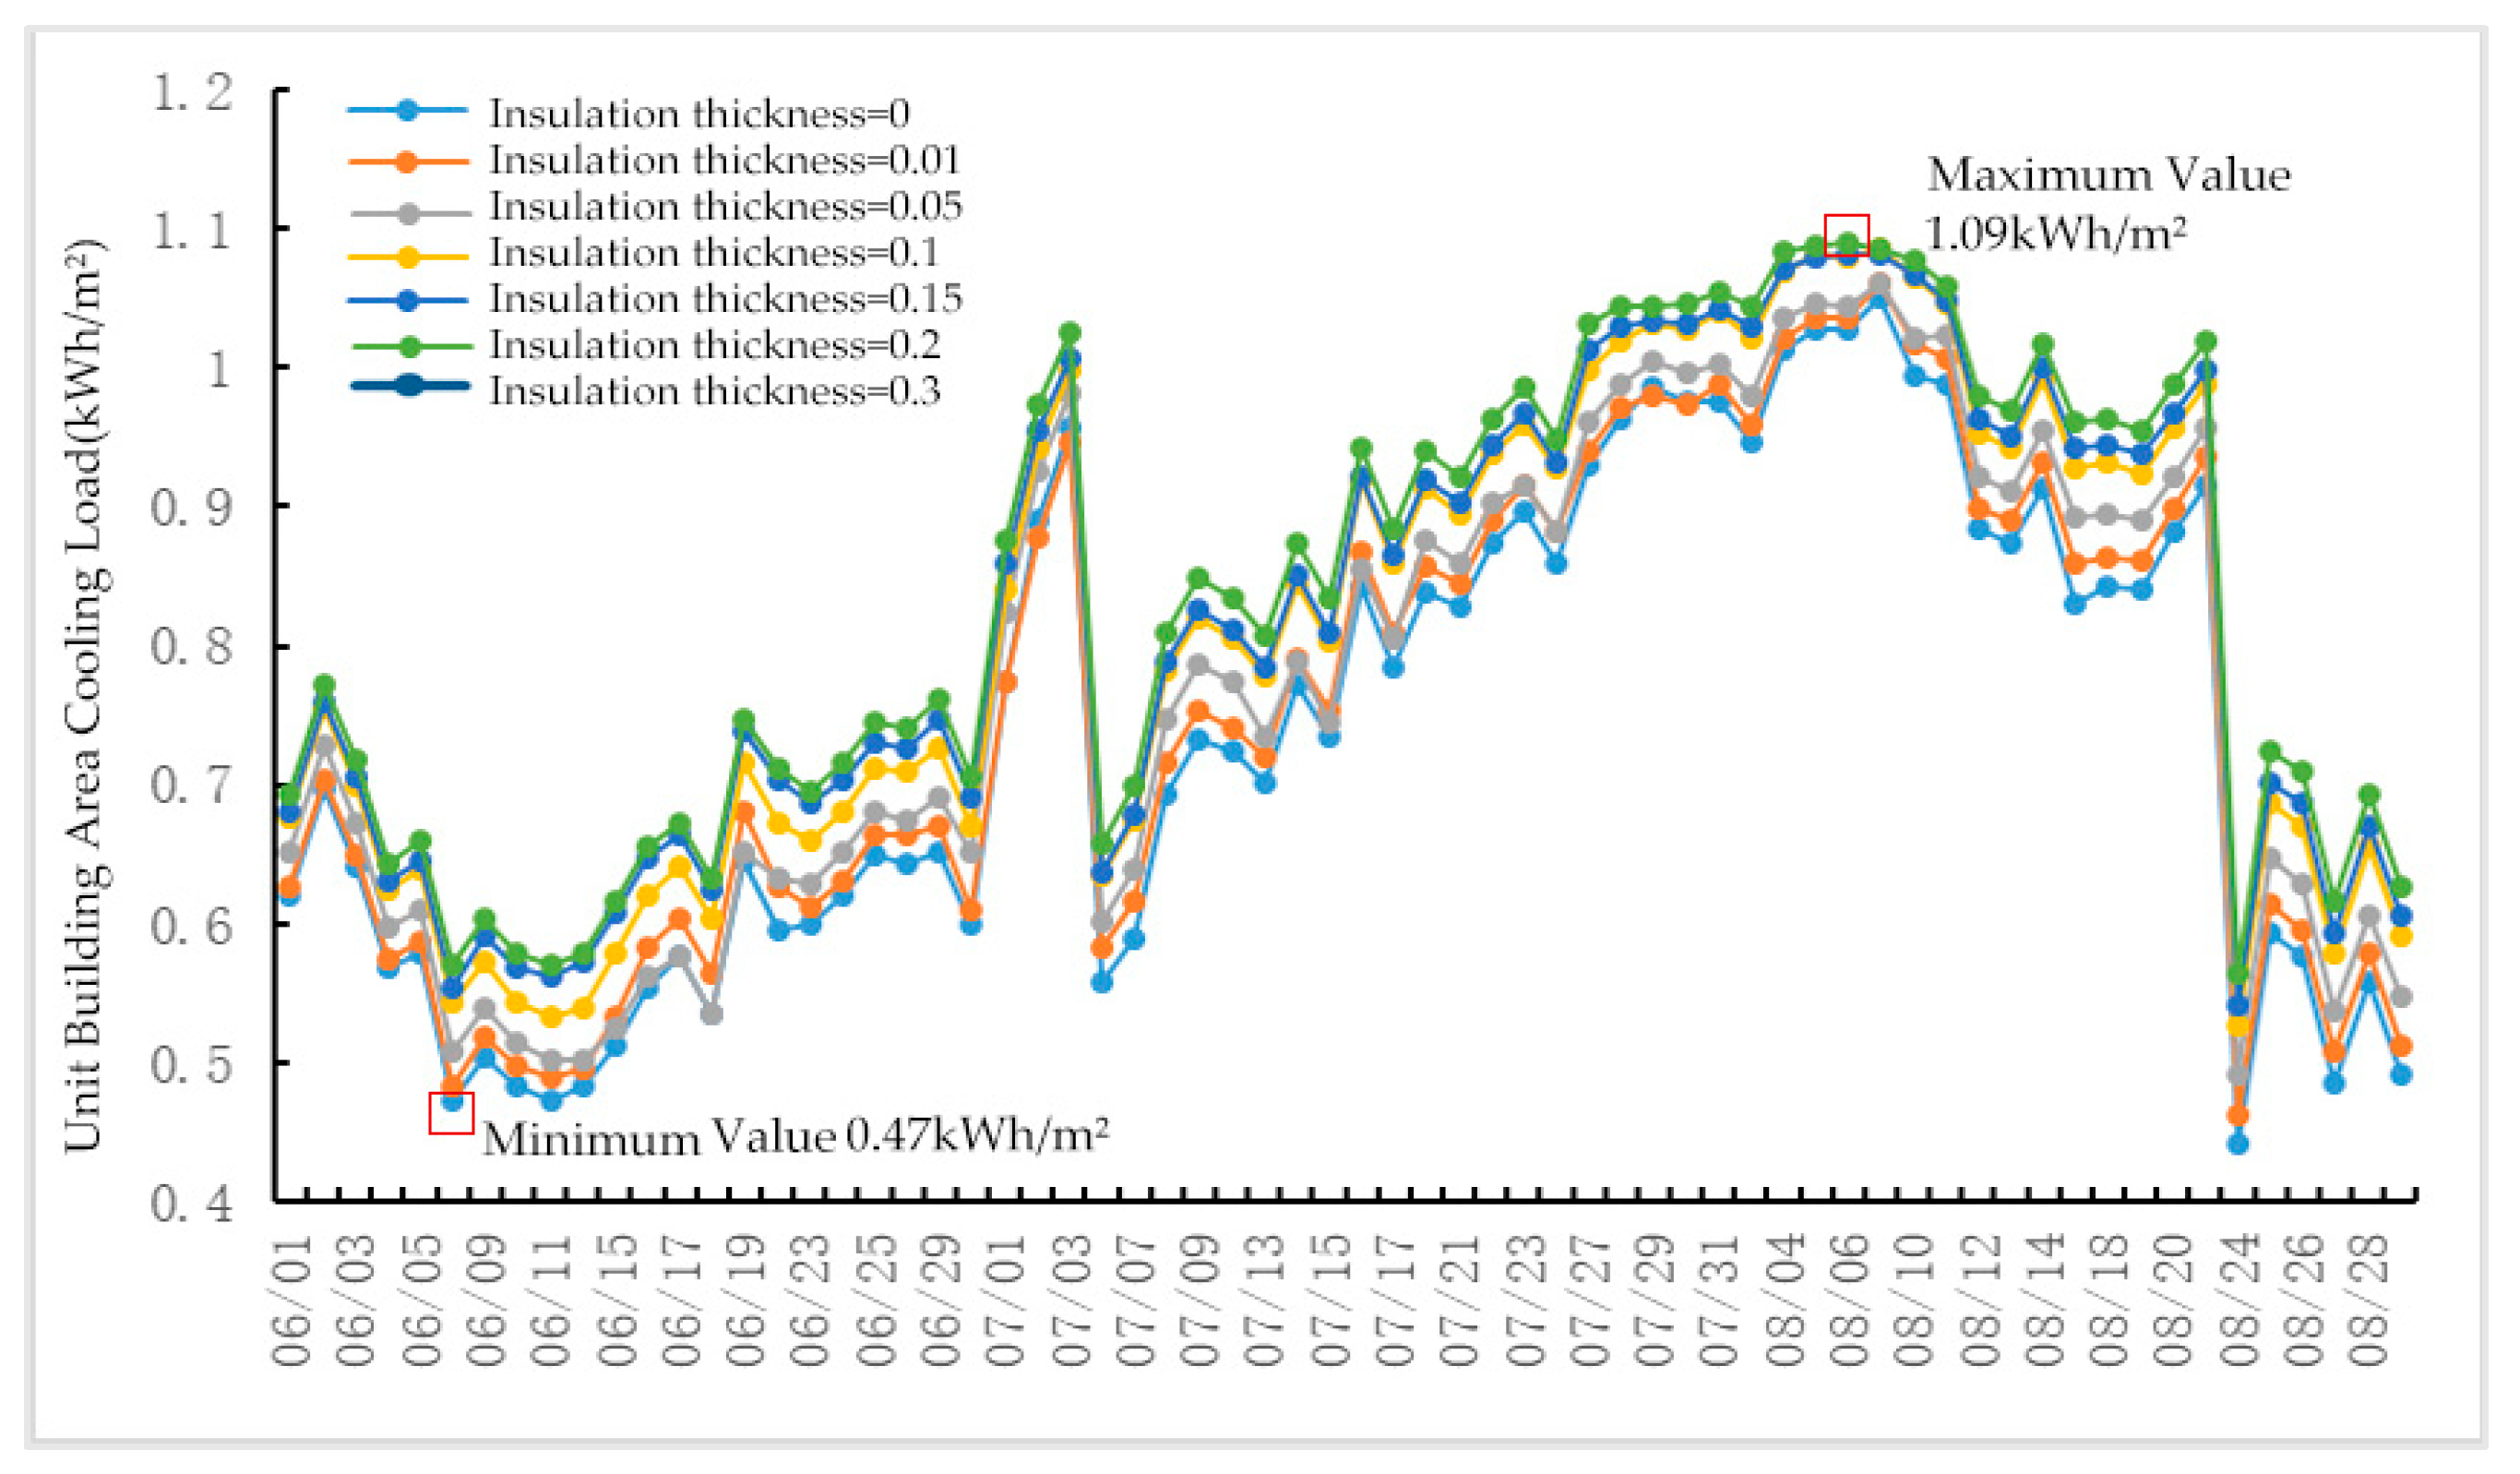
In the design of the green roof, to study the impact of energy consumption and the roof insulation layer, this research selected extruded polystyrene board (XPS), the most commonly used insulation material in roofing projects (thermal conductivity = 0.033 W/mK), with the thickness range set from 0 to 0.3 m. A numerical simulation was conducted to evaluate the impact of insulation thickness on the cooling load per unit building area during the summer (1 June–31 August). As shown in Figure 25, as the insulation thickness increases, the cooling load per unit area gradually increases. The highest cooling load per unit area occurred on 6 August, reaching 1.09 kWh/m2 with an insulation thickness of 0.2 m. The lowest load was observed on June 8, with no insulation (0 m), at 0.47 kWh/m2. Figure 25 illustrates that as the insulation thickness increases from 0 to 0.2 m, the total cooling load per unit area gradually increases. This indicates that beyond a certain thickness, the effectiveness of insulation in reducing the cooling load becomes limited, and it may even lead to an increase in load. When the thickness exceeds 0.05 m, the rate of load increase becomes more pronounced, while below this threshold, the changes are less noticeable. The total cooling load per unit area for insulation thicknesses of 0 m, 0.01 m, 0.05 m, 0.1 m, 0.15 m, and 0.2 m were 48.8 kWh/m2, 49.8 kWh/m2, 50.9 kWh/m2, 53.3 kWh/m2, 54.1 kWh/m2, and 55.2 kWh/m2, respectively. Compared to that for no insulation (0 m), the corresponding energy saving rates for thicknesses between 0.01 m and 0.2 m were −2.0%, −4.2%, −9.1%, −10.8%, and −13.0%, respectively. The increase in insulation thickness may lead to an enhanced thermal lag effect, meaning that the heat entering the building is delayed but eventually accumulates and transfers indoors. When the insulation is thicker, the heat absorbed during the day may gradually be released at night, thereby increasing the cooling load at night. This phenomenon suggests that thicker insulation is not necessarily better. The analysis indicates that for green roof design in the summer, the insulation thickness should not exceed 0.05 m. If there is no mandatory requirement, a thickness of 0 m (no insulation) can be considered. Beyond 0.05 m, increasing the insulation thickness results in a significant increase in cooling load per unit area, which is detrimental to energy efficiency.
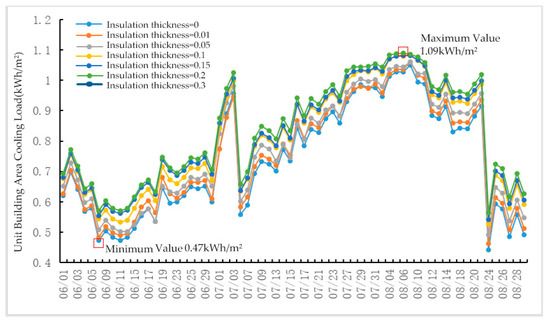
Figure 25.
Simulation of the variation in air conditioning cooling load per unit building area with insulation layer thickness.
3.8. The Impact of Green-Roof Building Orientation on Energy Consumption
A numerical simulation was conducted to evaluate the cooling load per unit building area of green-roof buildings during the summer (1 June–31 August) under different orientations. As shown in Figure 26, the orientation range extends from due south to southeast by 90°. The lowest daily cooling load per unit area occurred on 24 August, between 15° and 30° southeast by south, at 0.53 kWh/m2. The highest daily cooling load per unit area was observed on 6 August, at 90° east by south (due east), reaching 1.20 kWh/m2. Buildings oriented 15° and 30° east by south had lower cooling loads throughout the summer. As the orientation gradually shifts from 0° (due south) toward the southeast (30° to 90°), the cooling load increases. Buildings oriented at 90° (due east) experienced the highest cooling load during high-temperature periods. The figure further shows that for orientations of 0° (due south), 15°, 30°, 45°, 60°, 75°, and 90° east by south, the total cooling load per unit area was 56.1 kWh/m2, 53.8 kWh/m2, 55.0 kWh/m2, 57.6 kWh/m2, 58.5 kWh/m2, 59.5 kWh/m2, and 60.8 kWh/m2, respectively. Using the daily average total cooling load per unit area at 0° (due south) as the baseline, the energy saving rates for orientations 15° to 90° east by south were 4.1%, 2.0%, −2.7%, −4.3%, −6.1%, and −8.4%, respectively. The energy saving rates further indicate that the orientations between 15° and 30° east by south perform best in terms of energy efficiency.
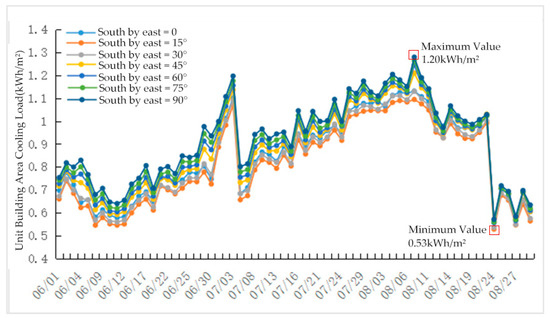
Figure 26.
The simulated change in the influence of the orientation of the green roof on the cooling load of air conditioning per unit building area (east).
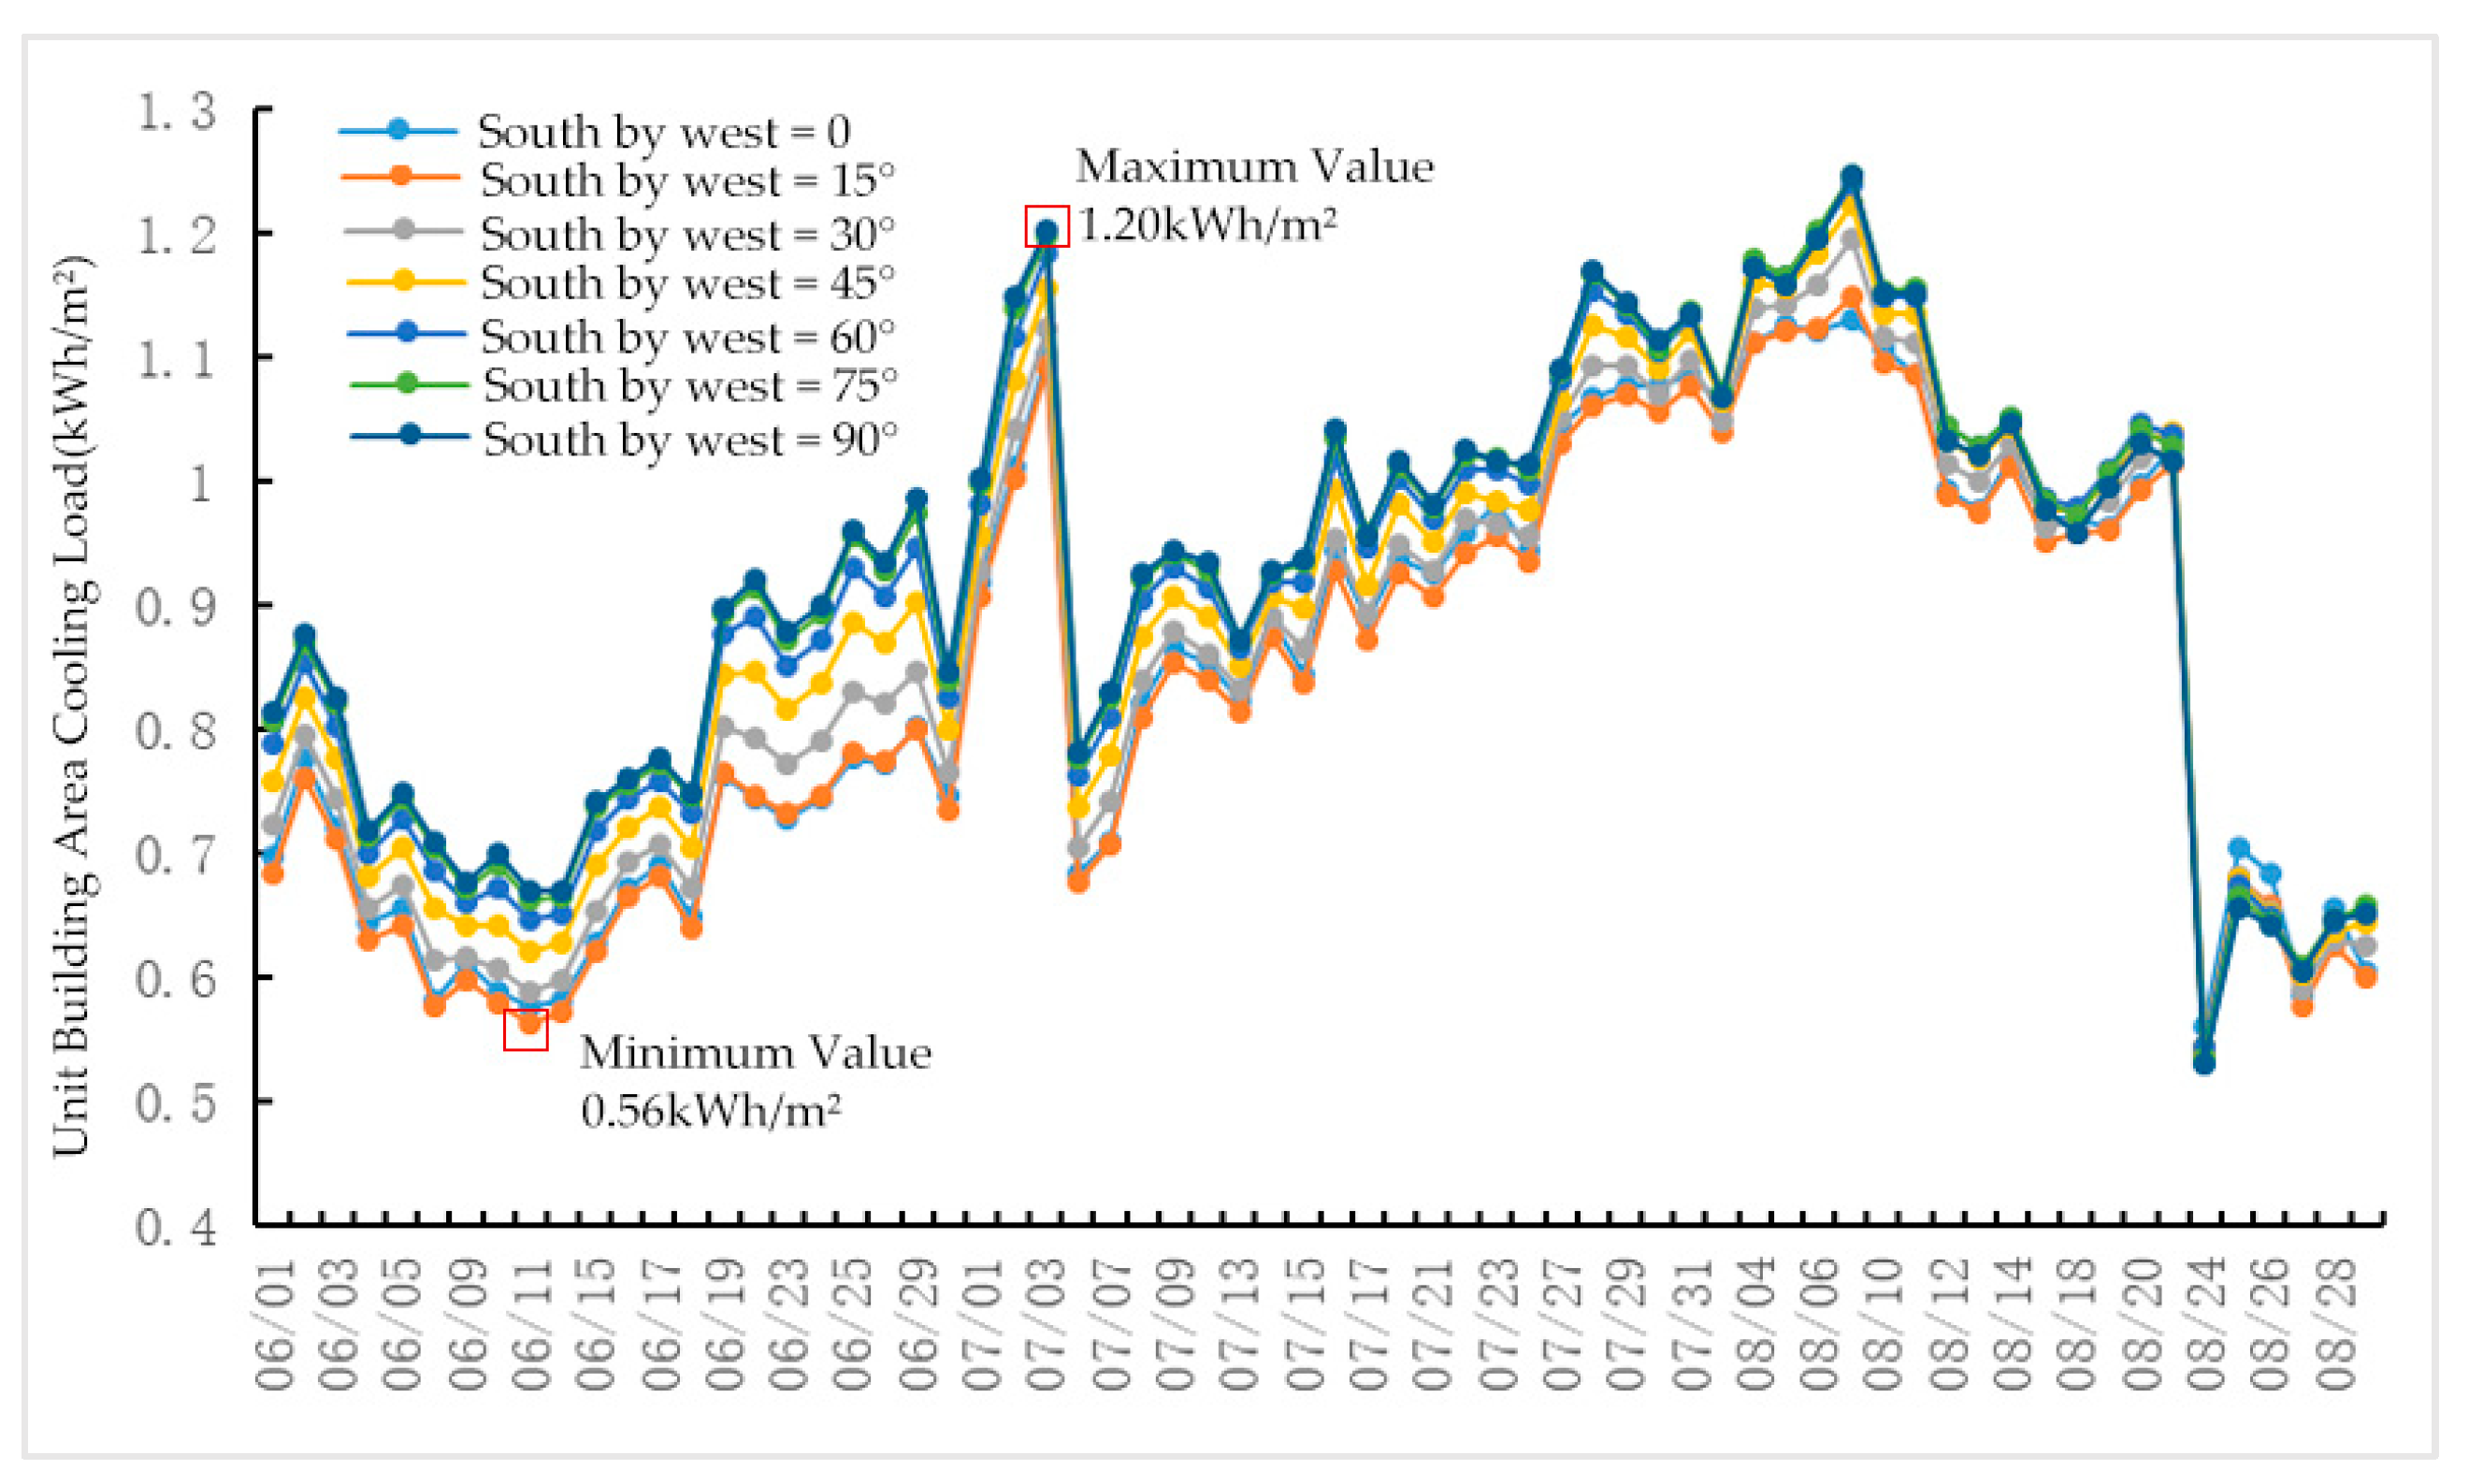
As shown in Figure 27, within the orientation range from due south to 90° southwest by south, the lowest cooling load occurred on June 11 at 15° southwest by south, at 0.56 kWh/m2, while the highest load was observed on July 3 at 90° southwest by south, reaching 1.20 kWh/m2. Buildings oriented at 0° (due south) and 15° exhibited lower cooling loads throughout the summer. As the orientation shifts toward the southwest (60° to 90°), especially at 90° (due west), the cooling load remains high throughout the summer. The highest energy consumption occurred with a due west orientation because the building is exposed to the afternoon sun, significantly increasing the cooling load per unit area due to solar radiation. The figure further shows that for orientations of 15°, 30°, 45°, 60°, 75°, and 90° southwest by south, the total cooling load per unit area was 55.5 kWh/m2, 56.5 kWh/m2, 58.9 kWh/m2, 60.2 kWh/m2, 60.9 kWh/m2, and 61.0 kWh/m2, respectively. Using the daily average total cooling load per unit area at 0° (due south) as the baseline, the energy saving rates for orientations from 15° to 90° southwest by south were 1.2%, −0.7%, −5.0%, −7.3%, −8.6%, and −8.7%, respectively. The energy saving rates further indicate that 15° southwest by south is more energy efficient than other orientations. Therefore, the suitable orientation range for buildings in Xuzhou is 30° east by south to 15° west by south, with the optimal orientation being 15° to 30° east by south. The three orientations with the highest energy consumption are 90° east by south (due east), 75° west by south, and 90° west by south (due west).
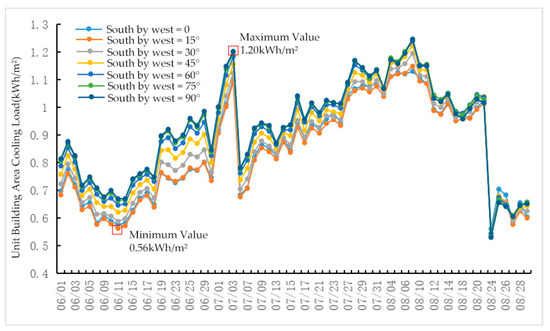
Figure 27.
Simulated change in the influence of the orientation of the green roof on the cooling load of air conditioning per unit building area (western).
3.9. The Impact of Green-Roof Slope Angle on Energy Consumption
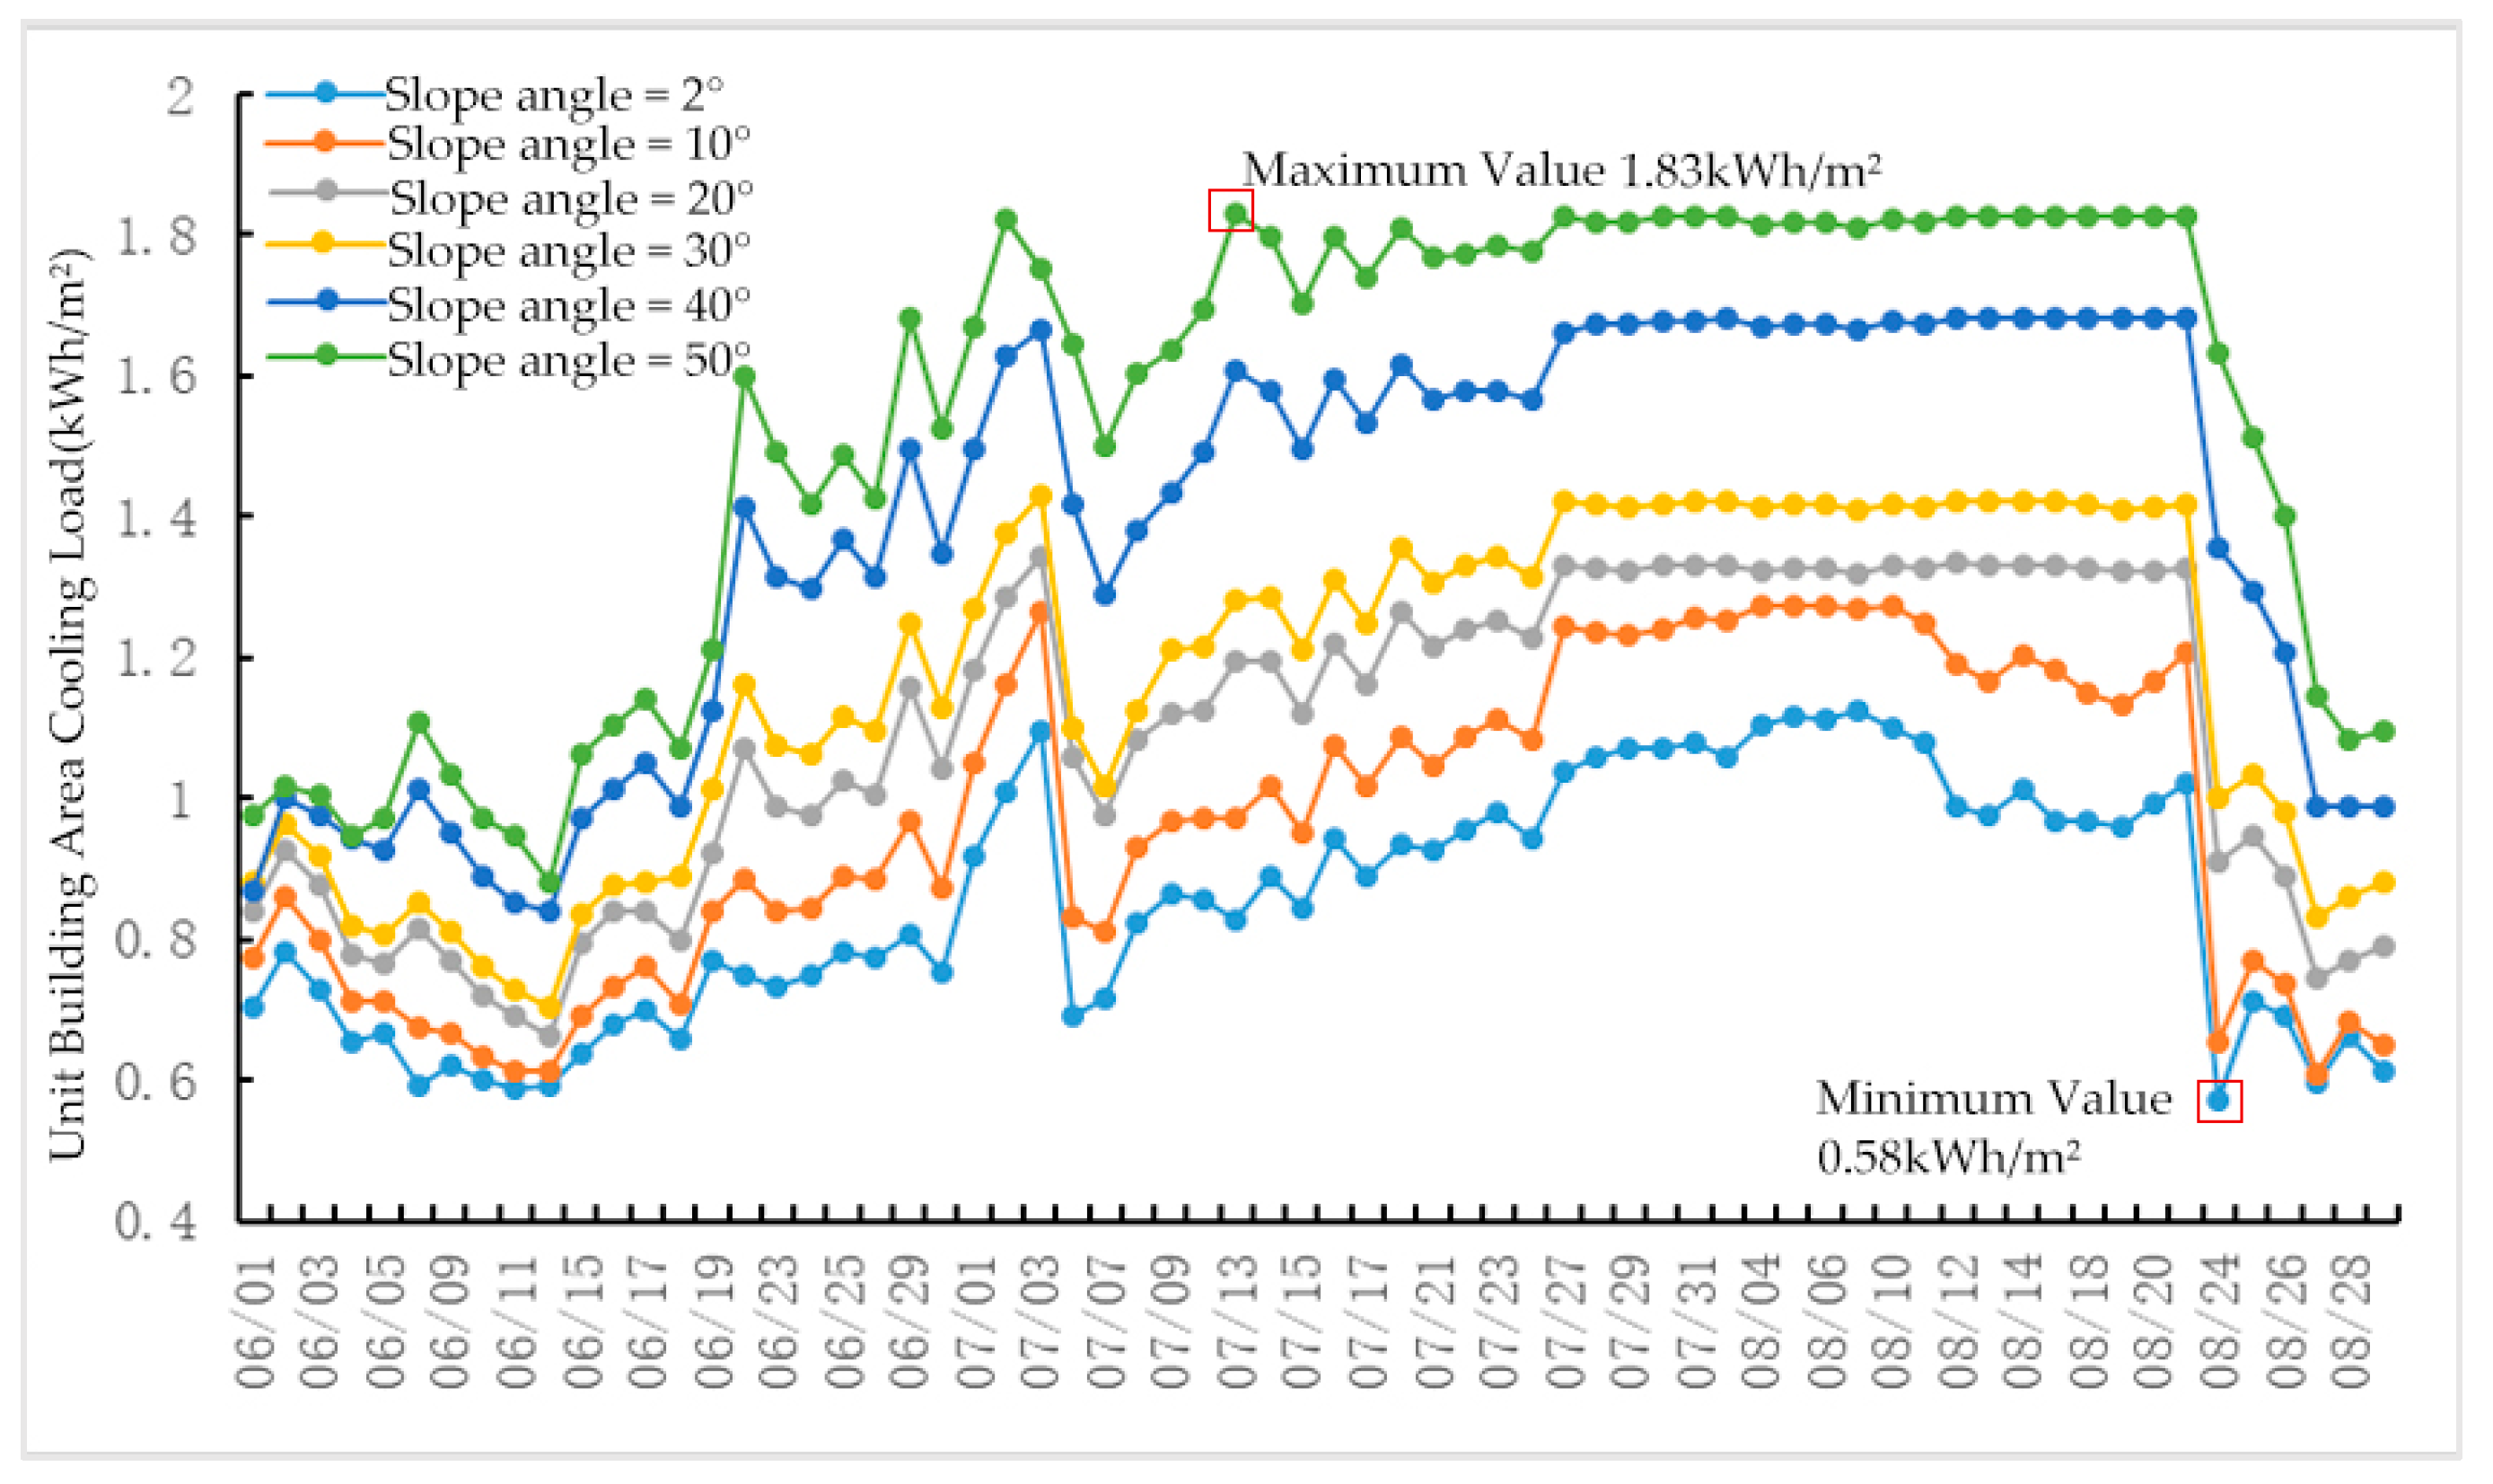
A numerical simulation was conducted to evaluate the cooling load per unit building area during the summer (1 June–31 August) under different green-roof slope angles. As shown in Figure 28, the maximum daily load occurred on 13 July when the roof slope angle was 50°, reaching 1.83 kWh/m2, while the minimum load occurred on 24 August at a slope angle of 2°, with a value of 0.58 kWh/m2. As the roof slope angle increases, the roof surface becomes more directly exposed to solar radiation. A larger slope increases the effective area exposed to sunlight, leading to greater heat absorption by the roof surface and gradually increasing the cooling load per unit area. Between slope angles of 10° and 30°, the increase in cooling load is relatively moderate. However, once the slope angle exceeds 30°, the increase in cooling load becomes more significant. The figure further shows that for roof slope angles of 2°, 10°, 20°, 30°, 40°, and 50°, the total cooling load per unit area was 56.2 kWh/m2, 64.0 kWh/m2, 72.2 kWh/m2, 77.3 kWh/m2, 91.8 kWh/m2, and 101.5 kWh/m2, respectively. Using the daily average total cooling load per unit area at a 2° slope as the baseline, the energy saving rates for slope angles between 10° and 50° were −14.1%, −28.7%, −37.8%, −63.6%, and −80.9%, respectively. The energy saving rates further indicate that when the slope is less than 30°, the increase in cooling load is smaller, and the energy-saving effect is relatively better. The analysis suggests that in the design of green roofs, a flat roof design should be prioritized. If a sloped roof design is necessary, the roof slope angle should be kept below 30° to minimize energy consumption.

Figure 28.
Simulation of the variation in air conditioning cooling load per unit building area with the green-roof slope angle.
4. Design and Optimization
4.1. Modular Green Roof Design
With continuous innovation in green roof technology, modular green roofs have gradually emerged. Compared to traditional container green roofs, modular green roofs have many features, such as root barriers, safety, and ease of construction. They solve the problem of roof waterproof layer damage and leakage caused by traditional green roofs [35]. Modular planting boxes can meet the needs of different building types. Table 13 shows their common forms [36].
Table 13.
Common forms of planting boxes.
The construction layers of modular green roofs are similar to those of their traditional forms. Modular green roofs mainly consist of planting containers and waterproof layers. The containers include plant layers, substrate layers, water retention and drainage layers, and root barrier layers. The plant and substrate layers are not significantly different from those in traditional green roofs; the water retention and root barrier layers are placed within the containers, which are then placed on the roof rather than being directly laid on the building roof. Modular green roofs can be applied to roofs with different angles of inclination, requiring only the connection of modules and the implementation of fire prevention measures.
Based on the previous simulation results, this study designs the soil thickness of the green roof modules for building no. 2 of the material market to be 0.3 m, with a soil thermal conductivity of 0.2 W/mK and a leaf area index of 3. The building is oriented 20° east of south, and the roof is flat. The local plan of the green roof is shown in Figure 29. The green modules are separated by walkways, and their planting profile is shown in Figure 30. The planting containers are connected with connectors.

Figure 29.
Local plan.
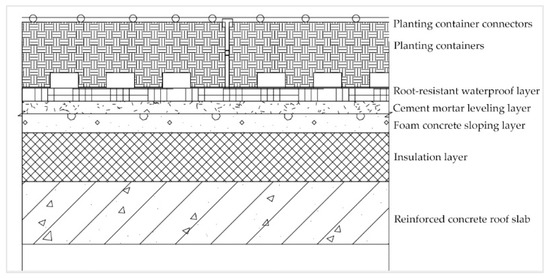
Figure 30.
Planting profile.
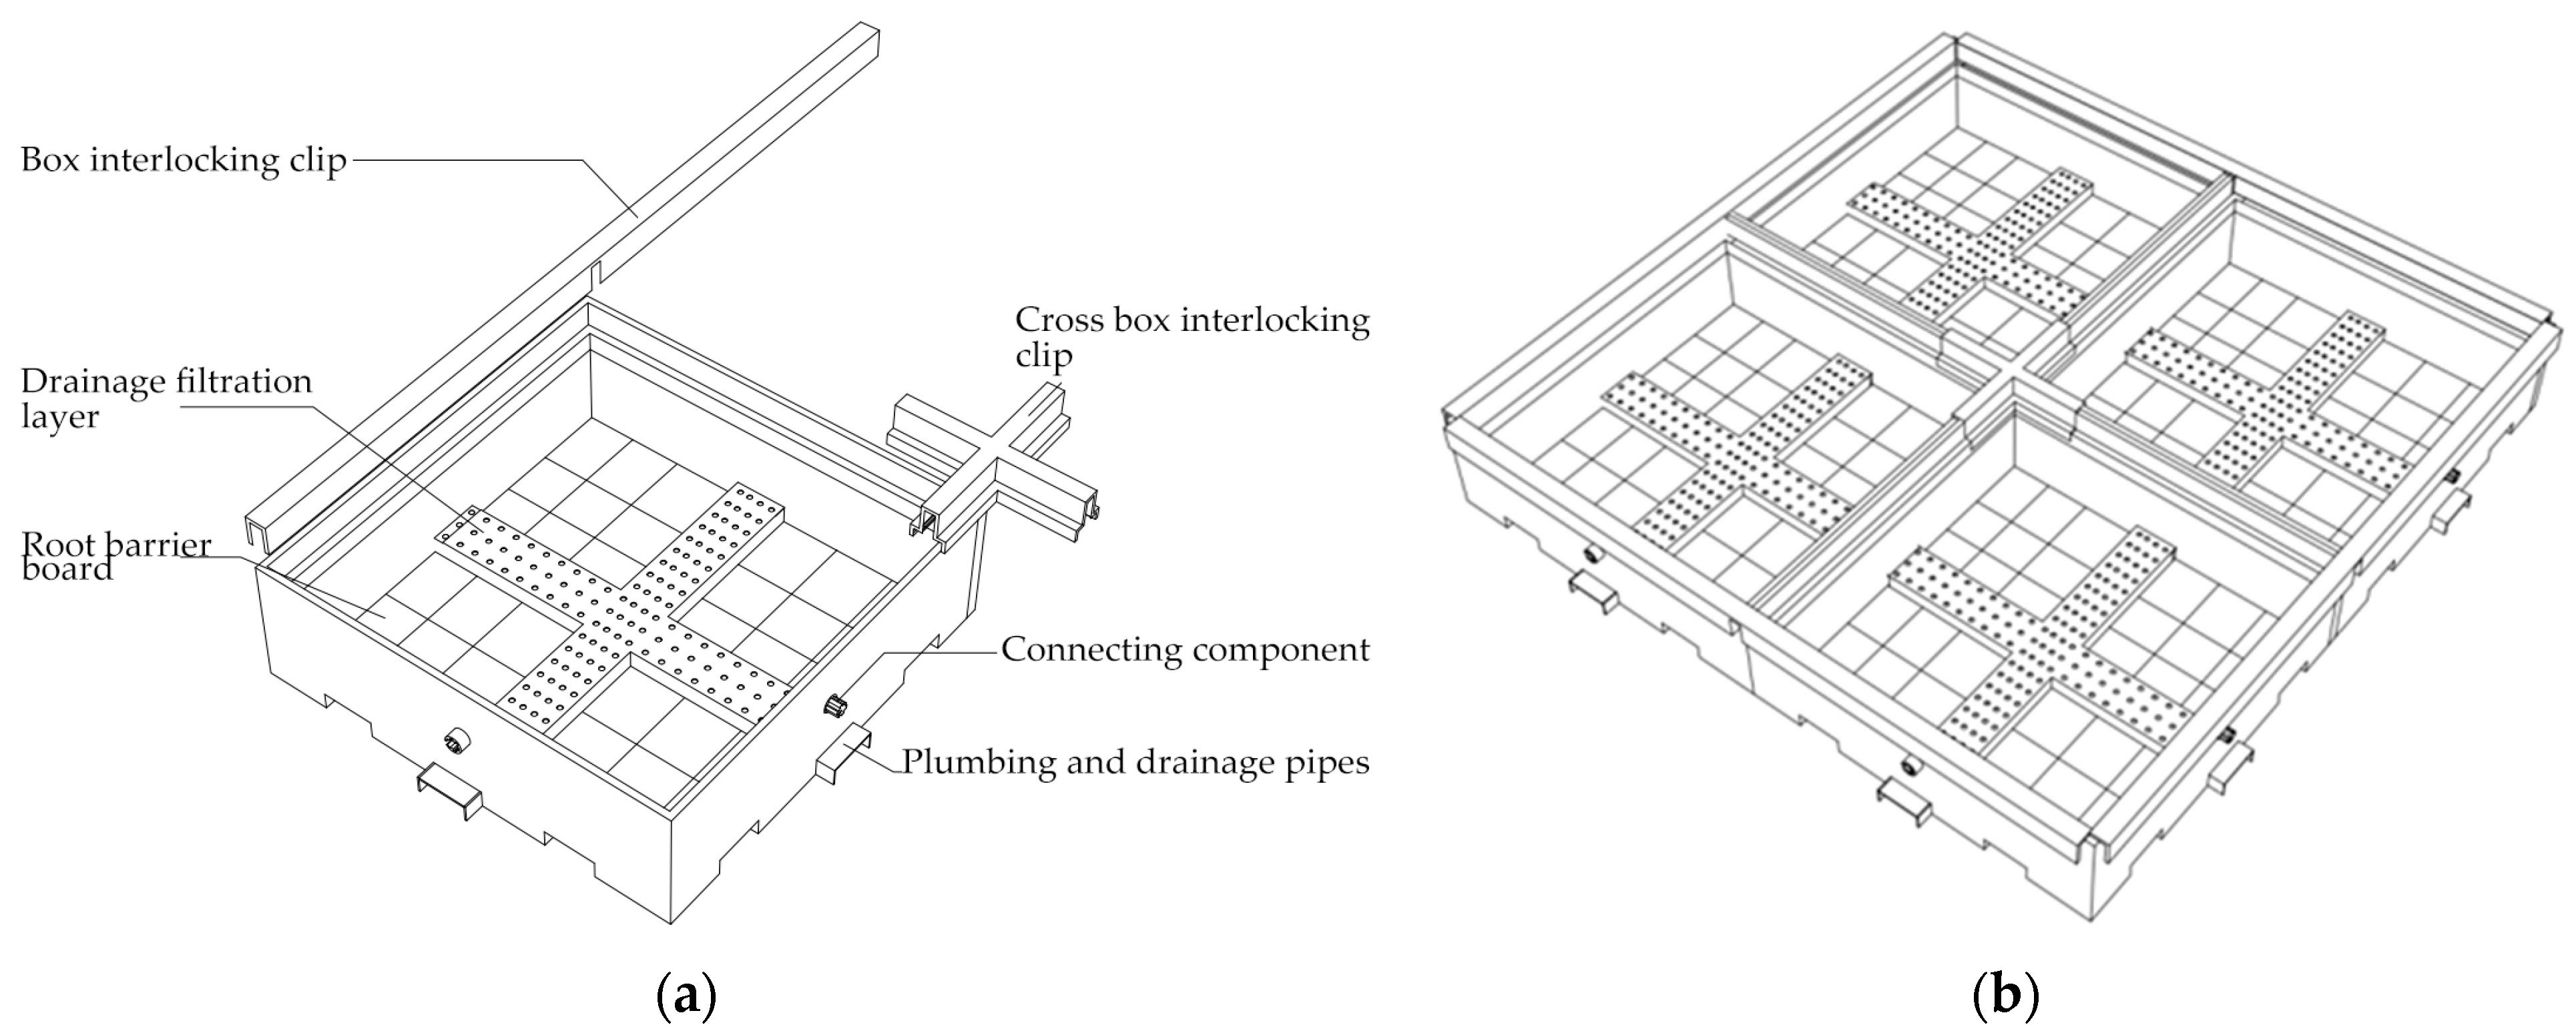
After completing the above steps, the design of a modular green roof can proceed. This type of roof can effectively reduce costs, facilitate maintenance and management, and be beneficial for the promotion of green buildings. After consulting with the customer service of Shenzhen Wind & Cloud Ecological Environment Co., Ltd. (Shenzhen, China), we decided to use their company’s green roof modules. The composition is shown in Figure 31a,b, demonstrating the connection method between four modules.
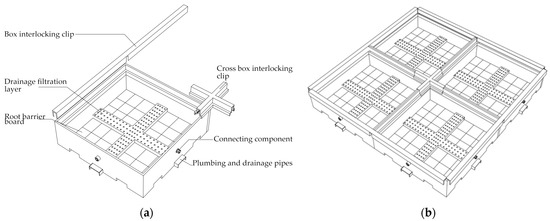
Figure 31.
(a) Composition of green roof modules; (b) Connection methods between modules.
To reduce weight, this design uses artificially synthesized planting soil. Based on the simulation results, the soil thickness is set at 0.3 m, and the soil thermal conductivity is 0.2 W/mK. The chosen module plants sedum, which is easy to grow, has a long lifespan, and is drought tolerant, cold resistant, and suitable for the climate in Xuzhou, with a leaf area index of 3. The selected planting boxes can be connected with clips, ensuring a convenient and secure connection between modules. The modular planting boxes are directly laid on the roof, preventing the soil and plants from directly contacting the roof, thus extending its lifespan. Finally, a cost calculation was performed, concluding that the expected expenditure is 204 yuan per square meter, which aligns with current practical conditions.
4.2. Energy Consumption Verification
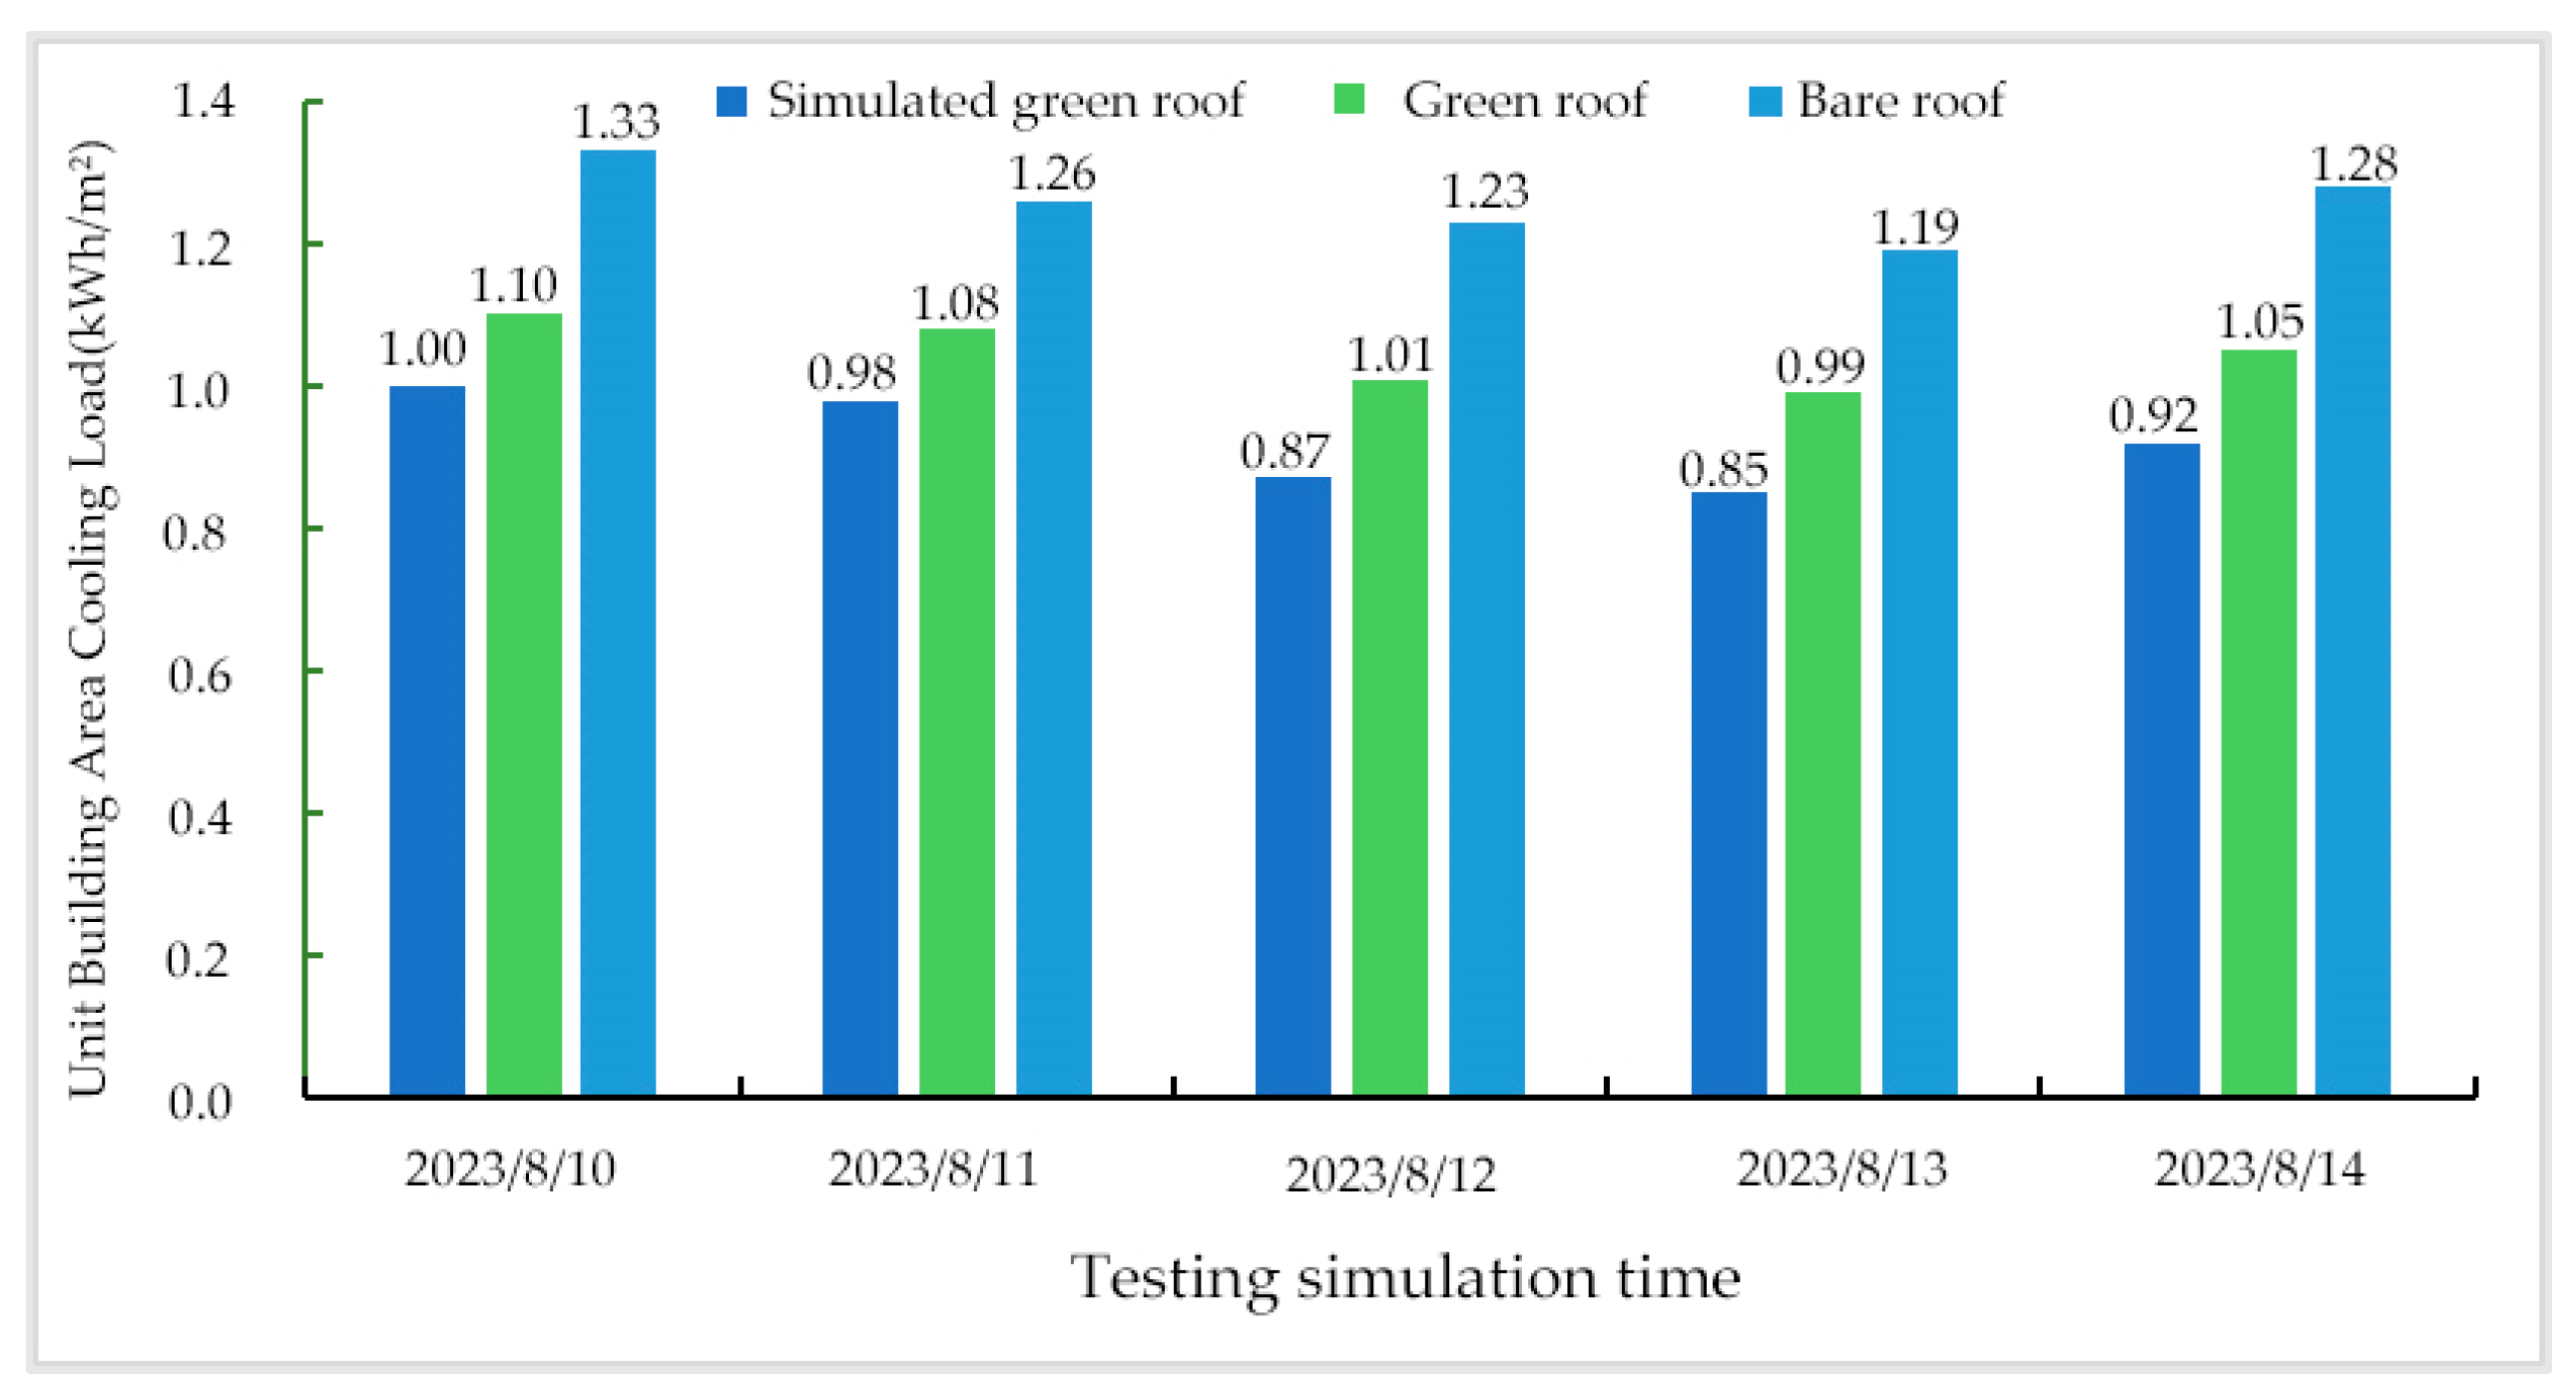
Based on the aforementioned design parameters, building no. 2 of the materials market was remodeled, and simulations were conducted to calculate the daily average unit building area cooling load and determine the energy savings rate, which were then compared with actual measured results for validation. Figure 32 and Table 14 illustrate the comparison between measured and simulated unit building area cooling loads and daily average unit building area cooling loads from 8:00 to 17:00 on five test days. The results indicate that after renovation, the daily average unit building area cooling load for the rooms corresponding to the green roof of building no. 2 is 0.92 kWh/m2, whereas the original green roof of the material market had a daily average unit building area cooling load of 1.05 kWh/m2. These values are respectively lower than those for a bare roof, which are 0.34 kWh/m2 and 0.21 kWh/m2. The energy savings rates for the renovated green roof and the original green roof of the materials market are 27.0% and 16.7%, respectively. The analysis demonstrates that green roofs can effectively reduce the unit building area cooling load compared to conventional bare roofs. Moreover, by integrating the optimal simulation results, the renovated green roof of building no. 2 achieves a 12.4% higher energy savings rate than the original green roof of the materials market.
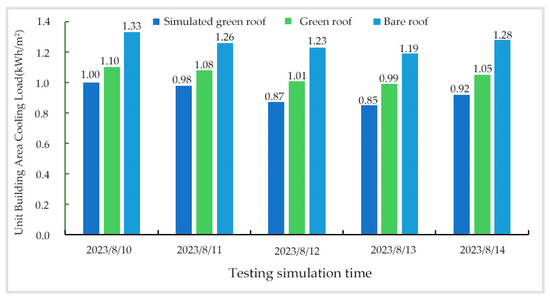
Figure 32.
Air conditioning cooling load per unit building area from August 10th to 14th.
Table 14.
Typical values of air conditioning cooling load parameters per unit building area during 10–14 August.
5. Conclusions
Through on-site analysis of existing green roofs in Xuzhou, building parameters and energy consumption were measured. Using EnergyPlus software, the cooling load per unit area for office buildings with green roofs was simulated under various parameters, and energy saving rates were calculated. The optimal design values from the simulation were applied to actual building designs and re-simulated with EnergyPlus, yielding reduced cooling loads, energy saving rates, and costs.
The following conclusions were drawn: Under air-conditioned conditions, green roofs reduced indoor temperatures, outer surface temperatures, and inner surface temperatures by 0.4 °C, 11.5 °C, and 3.9 °C, respectively. Compared to bare roofs, the daily average cooling load per unit area was 1.05 kWh/m2, a reduction of 0.21 kWh/m2, with an energy saving rate of 16.7%. Without air conditioning, green roofs reduced the maximum indoor temperature by 2.2 °C, the outer surface temperature by 19.0 °C, and the inner surface temperature by 3.9 °C. Similar cooling and energy saving effects were observed in the measurements from Jiangsu Jiatiantian Elderly Care Service Co., Ltd. (Xuzhou, China); soil thickness should not exceed 0.3 m, with a thermal conductivity of 0.2 W/mK. The leaf area index (LAI) should be as large as possible, ideally around 3. Insulation thickness should not exceed 0.05 m and can be omitted if not necessary. The optimal orientation for buildings in Xuzhou is 15°–30° east by south. A flat roof is preferred, and if a sloped roof is required, the slope should be kept below 30°. After converting building no. 2 of the Xuzhou material market into a modular green roof, the energy saving rate of the optimized green roof was 27.0%, saving 12.4% more energy compared to the original green roof with a 16.7% energy saving rate. The results show that optimized green roofs can effectively reduce cooling energy consumption and costs in the Xuzhou area. We recommend applying these parameters to urban buildings with similar climatic conditions (cold regions). However, further analysis is required to assess their applicability in other regions of China.
This study primarily focuses on cooling energy savings in summer and does not consider the energy saving effects for heating in winter. Future research should cover data for the entire year. The study focuses on office buildings in Xuzhou; future research could expand to other climate zones and building types to provide broader recommendations for the development of green roofs in China. Additionally, this study mainly examines air conditioning energy consumption; future research could further explore water consumption and rainwater harvesting related to green roofs.
Author Contributions
M.C., H.L., and X.B. conducted the data measurement and organization; M.C. performed the model simulation and validated the model; Z.D. and G.Y. provided the methodology; Z.D. and G.Y. conducted the review and revisions. All authors have read and agreed to the published version of the manuscript.
Funding
This research was supported by the China University of Mining and Technology Graduate Innovation Program Project (2023WLJCRCZL336).
Data Availability Statement
Data is openly available in a public repository that issues datasets with DOIs: https://doi.org/10.57760/sciencedb.11050.
Acknowledgments
The funding is supported by the Graduate Innovation Program of China University of Mining and Technology; project number is 2023WLJCRCZL336. The study was also supported by the Open Laboratory Project of China University of Mining and Technology, based on the Building Physics Laboratory.
Conflicts of Interest
The author declares no conflicts of interest.
Nomenclature
| LAI | Leaf area index (m2/m2) |
| EER | Coefficient of performance for cooling |
| QSW | Heat transfer due to shortwave radiation |
| QLW | Heat transfer due to longwave radiation |
| CLWq | Hourly cooling load generated by heat transfer through exterior walls (W) |
| CLWm | Hourly cooling load generated by heat transfer through roofs (W) |
| CLWc | Hourly cooling load generated by heat transfer through exterior windows (W) |
| Cz | Comprehensive shading coefficient for exterior windows |
| CLn | Hourly cooling load generated by human body heat (W) |
| CLzm | Hourly cooling load generated by lighting heat (W) |
| CLsb | Hourly cooling load generated by equipment heat (W) |
| tls | Average calculated temperature of adjacent non-air-conditioned rooms |
References
- Ma, L. Experimental and Simulation Study of Sedum Roof Greening in Guangzhou (Master’s thesis, South China University of Technology). 2018. Available online: https://xueshu.baidu.com/usercenter/paper/show?paperid=1h6e0850qj5t0cg0wk7s0px0ry797658 (accessed on 10 June 2024).
- Pomerantz, M.; Pon, B.; Akbari, H.; Chang, S.C. The Effect of Pavements Temperatures On Air Temperatures in Large Cities; Lawrence Berkeley National Laboratory: Berkeley, CA, USA, 2000. [Google Scholar]
- Abuseif, M.; Gou, Z. A Review of Roofing Methods: Construction Features, Heat Reduction, Payback Period and Climatic Responsiveness. Energies 2018, 11, 3196. [Google Scholar] [CrossRef]
- Yang, H.; Hang, Y.; Ozaki, A.; Dong, N. Thermal energy performance of green roof cool roof: A comparison study in Shanghai area. J. Clean. Prod. 2020, 267, 122205. [Google Scholar]
- Imran, H.M.; Kala, J.; Ng, A.W.M.; Muthukumaran, S. Effectiveness of green and cool roofs in mitigating urban heat island effects during a heatwave event in the city of Melbourne in southeast Australia. J. Clean. Prod. 2018, 197, 393–405. [Google Scholar] [CrossRef]
- Sailor, D.J. A green roof model for building energy simulation programs. Energy Build. 2008, 40, 1466–1478. [Google Scholar] [CrossRef]
- Onmura, S.; Matsumoto, M.; Hokoi, S. Study on evaporative cooling effect of roof lawn gardens. Energy Build. 2001, 33, 653–666. [Google Scholar] [CrossRef]
- Eumorfopoulou, E.; Aravantinos, D. The contribution of a planted roof to the thermal protection of buildings in Greece. Energy Build. 1998, 27, 29–36. [Google Scholar] [CrossRef]
- Kostadinović, D.; Zdravković, M.; Đorđević, N.; Milanović, M. Experimental investigation of summer thermal performance of the green roof system with mineral wool substrate. Build. Environ. 2022, 217, 109061. [Google Scholar] [CrossRef]
- Huang, Y.; Zhao, Q.; Chen, Y.; Jiang, S.; Zhang, S. Thermal performance of extensive green roofs in a subtropical metropolitan area. Energy Build. 2018, 159, 39–53. [Google Scholar] [CrossRef]
- Jamei, E.; Chau, H.W.; Seyedmahmoudian, M.; Stojcevski, A. Review on the cooling potential of green roofs in different climates. Sci. Total Environ. 2021, 791, 148407. [Google Scholar] [CrossRef]
- Zeng, C.; Bai, X.; Sun, L.; Zhang, Y.; Yuan, Y. Optimal Parameters of Green Roofs in Representative Cities of Four Climate Zones in China: A Simulation Study. Energy Build. 2017, 150, 118–131. [Google Scholar] [CrossRef]
- Foustalieraki, M.; Assimakopoulos, M.N.; Santamouris, M.; Pangalou, H. Energy performance of a medium scale green roof system installed on a commercial building using numerical and experimental data recorded during the cold period of the year. Energy Build. 2017, 135, 33–38. [Google Scholar] [CrossRef]
- Karachaliou, P.; Santamouris, M.; Pangalou, H. Experimental and numerical analysis of the energy performance of a large scale intensive green roof system installed on an office building in Athens. Energy Build. 2016, 114, 256–264. [Google Scholar] [CrossRef]
- Getter, K.L.; Rowe, D.B.; Andresen, J.A.; Wichman, I.S. Seasonal heat flux properties of an extensive green roof in a Midwestern U.S. climate. Energy Build. 2011, 43, 3548–3557. [Google Scholar] [CrossRef]
- Simmons, M.; Gardiner, B.; Windhager, S.; Tinsley, J. Green roofs are not created equal: The hydrologic and thermal performance of six different extensive green roofs and reflective and non-reflective roofs in a sub-tropical climate. Urban Ecosyst. 2008, 11, 339–348. [Google Scholar] [CrossRef]
- Jaffal, I.; Ouldboukhitine, S.-E.; Belarbi, R. A comprehensive study of the impact of green roofs on building energy performance. Renew. Energy 2012, 43, 157–164. [Google Scholar] [CrossRef]
- Niachou, A.; Papakonstantinou, K.; Santamouris, M.; Tsangrassoulis, A.; Mihalakakou, G. Analysis of the Green Roof Thermal Properties and Investigation of its Energy Performance. Energy Build. 2001, 33, 719–729. [Google Scholar] [CrossRef]
- Bevilacqua, P.; Bruno, R.; Arcuri, N. Green roofs in a Mediterranean climate: Energy performances based on in-situ experimental data. Renew. Energy 2020, 152, 1414–1430. [Google Scholar] [CrossRef]
- Al-Tamimi, N. Passive Design Strategies for Energy Efficient Buildings in the Arabian Desert. Front. Built Environ. 2022, 7, 805603. [Google Scholar] [CrossRef]
- Goussous, J.; Siam, H.; Alzoubi, H. Prospects of green roof technology for energy and thermal benefits in buildings: Case of Jordan. Sustain. Cities Soc. 2015, 14, 425–440. [Google Scholar] [CrossRef]
- Bousselot, J.M.; Slabe, T.J.; Klett, J.E.; Koski, R.D. Photovoltaic Array Influences the Growth of Green Roof Plants. J. Living Arch. 2017, 4, 9–18. [Google Scholar] [CrossRef]
- Jahanfar, A.; Drake, J.; Sleep, B.E.; Margolis, L. Evaluating the shading effect of photovoltaic panels on green roof discharge reduction and plant growth. J. Hydrol. 2019, 568, 919–928. [Google Scholar] [CrossRef]
- Santamouris, M.; Pavlou, C.; Doukas, P.; Mihalakakou, G.; Synnefa, A.; Hatzibiros, A.; Patargias, P. Investigating and analysing the energy and environmental performance of an experimental green roof system installed in a nursery school building in Athens, Greece. Energy 2007, 32, 1781–1788. [Google Scholar] [CrossRef]
- Yang, W.; Wang, Z.; Cui, J.; Zhu, Z.; Zhao, X. Comparative Study of the Thermal Performance of the Novel Green (Planting) Roofs against Other Existing Roofs. Sustain. Cities Soc. 2015, 16, 1–12. [Google Scholar] [CrossRef]
- Zhao, D.G.; Tang, M.F.; Zhang, Z.M. Study on the Cooling Effect in Summer and Thermal Insulation Effect in Winter of Lightweight Green Roofs. Green. Build. 2010, 2, 28–30. [Google Scholar]
- Fan, L.; Wang, Y.Y.; Cui, J.F.; Song, N.; Lu, X.R. Design and Practice of Three-dimensional Greening of Public Buildings in Southwest China: A Case Study of Roof Greening in Chengdu. Sichuan Archit. 2019, 2, 4. [Google Scholar]
- Yan, C.H.; Ren, J.; Liu, J.Y. Assessment of Building Energy Consumption under Different Roof Types in Future Climate Change. Build. Energy Efficien. 2020, 48, 30–35, 40. [Google Scholar]
- International Electrotechnical Commission (IEC). IEC 60364-1: Low-Voltage Electrical Installations—Part 1: Fundamental Principles, Assessment of General Characteristics, Definitions. IEC: Geneva, Switzerland, 2020; Available online: https://www.doc88.com/p-8035677436344.html (accessed on 10 June 2024).
- European Committee for Standardization (CEN). EN 1991-1-4: Eurocode 1: Actions on Structures—Part 1-4: General Actions—Wind Actions. CEN: Brussels, Belgium, 2005; Available online: https://www.phd.eng.br/wp-content/uploads/2015/12/en.1991.1.4.2005.pdf (accessed on 10 June 2024).
- National Institute of Standards and Technology (NIST). NIST Special Publication 330: The International System of Units (SI). NIST: Gaithersburg, MD, USA, 2019. Available online: https://www.nist.gov/pml/special-publication-330 (accessed on 10 June 2024).
- International Organization for Standardization (ISO). ISO 9060: Solar Energy—Specification and Classification of Instruments for Measuring Hemispherical Solar and Direct Solar Radiation. ISO: Geneva, Switzerland, 2018. [Google Scholar]
- Wei, T.; Jim, C.Y.; Chen, Y.; Chen, A.; Li, X. Complementary influence of green-roof and roof-slab thermal conductivity on winter indoor warming assessed by finite element analysis. Energy Rep. 2022, 8, 14852–14864. [Google Scholar] [CrossRef]
- Zhang, Q.W. Comparison and Analysis of Air Conditioning Cooling Load Calculation Methods Between China and Japan. Refrig. Air Cond. Electr. Power Mach. 2011, 32, 68–71. [Google Scholar]
- Xin, J. Multifunctional Roof Greening Device—A New Technology of Modular Combination Roof Greening. Mod. Prop. 2016, 07, 64–66. [Google Scholar] [CrossRef]
- Ke, S.Z. Discussion on the Application of Container Roof Greening in Sponge City Construction. China Build. Waterproofing 2016, 19, 19–23. [Google Scholar] [CrossRef]


Disclaimer/Publisher’s Note: The statements, opinions and data contained in all publications are solely those of the individual author(s) and contributor(s) and not of MDPI and/or the editor(s). MDPI and/or the editor(s) disclaim responsibility for any injury to people or property resulting from any ideas, methods, instructions or products referred to in the content. |
© 2024 by the authors. Licensee MDPI, Basel, Switzerland. This article is an open access article distributed under the terms and conditions of the Creative Commons Attribution (CC BY) license (https://creativecommons.org/licenses/by/4.0/).