Abstract
Construction project management is critical to the success of construction projects, with the performance of project managers (PMRs) playing a central role. Despite its importance, previous studies have highlighted the poor performance of construction organizations in Nigeria, such as project delays and cost overruns and the need for proper project management practices. However, the specific performance of PMRs in the Nigerian construction industry (NCI) has not been extensively studied. To address this issue, this study aims to identify the causes of underperformance among PMRs in the NCI by examining the tasks where PMRs underperform and the extent of this underperformance and its effect on motivational support from organizations. Data were collected through 206 questionnaires and 36 semi-structured interviews with organizations and project managers. Descriptive analysis was conducted to evaluate project management (PM) practices as well as the level of motivational support provided to PMRs. The analysis revealed that PMRs underperform in more than 60% of tasks but outperform in 20%. Underperformance refers to the tasks in which PMRs performed less than the expected contributions set by the organization, while outperformance describes tasks where PMRs exceeded the organization’s expectations. The analysis also revealed low motivational support of PMR. Correlation analysis was conducted to investigate whether motivational support influences PMR performance, and the results indicated a two-way causal relationship between underperformance and low motivational support. This study integrated a game theory model with regression analysis to show that (stay, support) is the dominant solution for project managers and organizations, provided the net contribution of support is positive. In this context, “stay” refers to PMRs continuing working with their current organization, while “support” refers to the motivational support provided by the organization to enhance the commitment and performance of the PMRs. However, current support levels may not be enough to cause PMRs to begin to outperform. In addition, regression analysis was conducted between the degree of underperformance and motivational factors, and we conducted a preliminary simulation by increasing these values of regression coefficients. The results indicated that while motivational support from organizations can improve PMRs performance, its effectiveness is limited. Factors such as corruption, political pressures, and organizational culture have a greater impact on performance. Addressing these factors may be more crucial for enhancing performance and project outcomes than focusing only on motivational support. Therefore, the Nigerian construction industry needs to implement institutional changes alongside motivational strategies to improve PMRs performance and project success.
1. Introduction
1.1. Background
The present environment in the Nigerian construction industry (NCI) has become unstable due to low performance, which has required construction organizations to pay attention to their performance level as the main success factor for project completion. The industry has been identified to have poor performance, which has been linked to project delays and cost overruns [1,2]. Project delays and cost overruns have been the major criticisms in the Nigerian construction industry. Alade et al. [3] claimed that most construction projects in Nigeria experience delays due to a lack of project management, which leads to disputes, litigation, arbitration, and often project abandonment. According to Obebe et al. [4], insufficient project management practices and project managers’ commitment contribute to project failure in Nigeria’s construction environment. Dalibi [5] highlighted that the insufficient utilization of project management professionals and the involvement of non-project managers in Nigerian construction projects significantly contribute to project delays and cost overruns. The non-project managers’ roles in projects include overseeing daily operations on the construction site, ensuring that tasks are completed according to plan and schedule, and managing the work of laborers’ safety and subcontractors under PMRs supervision. Inadequate project management professional knowledge and lack of commitment of project managers affect construction organizations’ performance [6].
Iroha et al. [7] argued that the underutilization of project managers in the Nigerian construction industry forms a system with subsystems of underperformance and lowered commitment. Within the subsystem of underperformance, the study identified such embedded informal factors as corruption, political influence, religious and tribal sentiments, and organizational culture as contributory causes of insufficient project management practices and project managers’ effectiveness. These factors negatively influence institutional laws and regulations, including employment and work law, contract law, and government policies and regulations, thereby undermining the ethics of the NCI [8]. The adverse effects of corruption and political pressure for personal gain force project managers to prioritize the demands of elites over project requirements and procedures. The impact of corrupt practices weakens contract law by influencing the contract bidding process, often leading to projects being awarded to incompetent contractors [7].
The instability of government policies and regulations causes delays and difficulties in obtaining project permits and approvals, hindering construction organizations’ long-term project plans, resulting in administrative burdens, and affecting project managers’ decision-making [9]. The weakness of employment and work law, caused by religious and tribal discrimination, leads to a lack of team cohesion [10]. The pervasive ineffectiveness of laws and regulations in the industry contributes to underperformance and forces project managers to underperform. In the subsystem of lowering commitment, Iroha et al. [7] postulated that the impact of underperformance results in the low contributions of project managers in the Nigerian construction industry. The study argued that this perception of low contributions leads to low trust in the ability and commitment of project managers. The lack of trust in project managers’ commitment is one of the reasons for the organizational culture that fosters low support and motivational incentives, limited project manager involvement, insufficient recognition, and unfair working conditions.
1.2. Research Objectives
Previous studies have highlighted the poor performance of construction organizations in Nigeria, attributing it to a lack of project management practices, such as insufficient project planning, ineffective scheduling, and control. These studies emphasized the importance of proper project management practices [4,11]. However, the specific performance of project managers (PMRs) has rarely been discussed. No comprehensive research has been conducted on the actual contributions of project managers compared to the organization’s expectations. The aim of this study was to investigate and identify the causes of underperformance among PMRs that lead to their low commitment and contributions in projects, resulting in project delays and cost overruns. To address this issue, the study had four main objectives: (1) identify which tasks PMRs underperform in the Nigerian Construction Industry (NCI) and measure the extent of this underperformance, (2) examine whether this underperformance results in reduced motivational support from organizations, (3) analyze causes of underperformance of project management practices in the NCI, and (4) propose a method to explore strategies to enhance PMR performance.
To achieve this, a comprehensive literature review was conducted to highlight existing challenges and gaps in project management practices within the NCI. Data were collected through 206 questionnaires and 36 semi-structured interviews with organizations and project managers, providing insights into their perspectives on project managers’ roles and organizational expectations. A key focus was analyzing the level of involvement of project managers, the specific expectations of organizations, and the motivational support provided by the organizations. This study conducted statistical analyses to reveal the tasks in which project managers underperform and outperform and organizations’ expectations for PMRs in the three project stages. In this, a correlation analysis was conducted between the degree of underperformance of PMRs and the motivational support they received from organizations to interpret the relationship between PMRs’ underperformed tasks and low motivational support. This study then used game theory to explain the interaction and decision-making behaviors between PMRs and organizations, explicitly revealing why project managers underperform and why organizations make certain decisions regarding motivational support. In addition, regression analysis was conducted between the underperformed tasks and motivation factors to identify the motivation factors that are capable of reducing the underperformance of PMRs and improving their performance.
The underperformance of PMRs is closely related to their organizations’ decisions on motivational support, PMRs’ decisions on whether to stay or leave their organizations, and “embedded” factors influencing PMRs’ performance, such as political factors. To develop effective measures for improving PMRs’ performance, it is essential to identify and analyze these interrelationships. The academic novelty of this study lies in proposing methods to identify and analyze these relationships through the development of a game theory model combined with regression analysis. This approach made it possible to determine that (stay, support) emerges as the dominant strategy for PMRs and their organizations and to interpret that the level of motivational support at this dominant solution is the “minimum”. Additionally, the analysis suggested that embedded factors significantly influence PMRs’ performance. The proposed methods offer a foundation for comprehensive analysis aimed at finding a “global optimum” solution to the issue of PMR underperformance in the NCI.
The rest of the structure of the paper is as follows: Section 2 covers the literature review on project management practices, project manager performance evaluation, and motivation. Section 3 describes the participants and procedures, including the methods for survey and interview data collection and the hypothesis. Section 4 presents an analysis of project management practices in Nigerian construction organizations, examines the underperformance and outperformance of project managers, and explores the impact of underperformance on motivational support and project manager contributions. Section 5 discusses the study, providing an explanation of the current situation using a game theory model, graphical representations of motivational factors, results of the regression analysis, implications from the game theory model, and a simulation of performance improvement based on the regression results. Section 6 concludes the study with suggestions and limitations.
2. Literature Review
2.1. The Review of Project Management Practices and Project Managers
The success of construction projects can be identified with the proper implementation of project management practices. The poor performance of Nigerian construction organizations on projects has been associated with insufficient utilization and commitment of project managers.
Table 1 summarizes the causes, phenomena, and implementation of the tasks of project management (PM) and the consequences associated with the underutilization of project managers (PMRs) in NCI. The section on phenomena focuses on the utilization of project managers, and the causes describe their reasons. Implementation of tasks of project management (PM) identifies how insufficient tasks or functions of project management are implemented, and consequences summarize their impact on project organization or project outcome. There are two features in this table. First, studies that substantially discuss the underutilization of project managers are included even if the terms “underutilization” or “commitment” are not explicitly mentioned. For such studies, causes, insufficient implementation of PM tasks, and their consequences are summarized. Second, in some studies, experience and commitment are treated as attributes of project managers. However, this study categorizes them into causes and phenomena, respectively, because the former characterizes the past, and the latter characterizes the present.

Table 1.
Causes, Phenomena, and Tasks of Project Management (PM) and Consequences Associated with Underutilization of Project Managers (PMRs) in NCI.
According to Sharafadeen et al. [12], insufficient project manager experience contributes to the ineffectiveness of project planning efforts, resulting in increased project risks and delays. Obebe et al. [4] investigated the causes of project failure in Nigerian construction organizations and identified poor planning, lack of effective communication, and misplacement of project priorities as significant factors. These issues were attributed to inadequate project management experience. The employment of project management knowledge and the commitment of project managers were underscored as critical issues [4]. Daniel and Ibrahim [13] identified project manager incompetence and construction stage mistakes as factors contributing to low performance, leading to project failures in Nigerian construction organizations. Werigbelegha and Tamunosiki-Amadi [14] argued that insufficient project management training contributes to project managers’ incompetence in selecting appropriate project management tools and techniques for projects.
Yahya et al. [15] argued that insufficient leadership skills among project managers contribute to poor project planning and monitoring, resulting from non-conformance to project specifications. According to Andabai and Jasmine [14], the adoption and implementation of modern project management methods and techniques have not been firmly established in Nigeria, which contributes to contractors not being able to deliver projects within project budgets, specifications, and timelines. Dalibi [5] attributed the absence of project management practices to underutilization of project management professionals. Olawale et al. [16] identified organizational culture, working conditions, and recognition as factors that influence the commitment and contribution of project managers within their respective organizations. According to Olateju et al. [6], the lack of project managers’ commitment largely contributes to the poor performance of construction organizations. Unegbu et al. [11] attributed project delays in the country to improper planning and poor site management, which stem from a lack of project management experience and commitment among project managers. Ezeokoli et al. [17] revealed that the underutilization of project managers causes significant challenges including poor project planning and inadequate quality control, which result in continuous project failure.
The table shows us two limitations in the past studies. First, the implementation of project management tasks is limited to a general description. Tasks to be conducted by project managers are versatile, ranging from the pre-project (planning) and execution (construction) to the post-project stages (closure). To effectively address the issue of underutilizing project managers, it is crucial to identify which project management tasks are insufficiently implemented, understand the reasons behind this, and assess the consequences. Second, most of the relationships among the four components have been identified through qualitative research. Confirming these findings with quantitative analysis would provide even stronger evidence.
This current study addresses these limitations by expanding on a study by [7], which argued that PMR underperformance is influenced not only by organizational factors like support but also by uncontrollable factors such as political pressure and weak governance. The uniqueness of the study by [7] lies in its focus on the consequences of PMR underutilization, where low organizational support is highlighted rather than low project performance. Measuring organizational support is more straightforward for PMRs than assessing project performance because the scope is limited to PMRs themselves. This characteristic allows the current study to conduct a statistical analysis of the relationship between PMR underperformance and the level of organizational support they receive.
2.2. Valuation of Project Managers Performance
The valuation of project managers’ performance is a multifaceted process including various stages, methodologies, and metrics. According to Giri [18], project managers’ performance can be determined by establishing clear performance metrics that align with project objectives and organizational goals. These key performance indicators (KPIs) and metrics often include project completion time, adherence to budgetary constraints, stakeholder satisfaction, quality of deliverables, and team performance. Key performance indicators provide a structured framework for evaluating project managers’ performance and enable organizations to comprehensively assess project managers’ contributions throughout the project lifecycle [19,20]. This assessment explicitly provides project managers’ skills, expertise, and experience that ensure they possess the necessary competencies to lead the project effectively. It includes reviewing past project performance, evaluating technical proficiency, and assessing leadership capabilities. Throughout the project planning and execution stages, project managers are to be regularly monitored to assess their adherence to project plans, problem-solving abilities, decision-making skills, and leadership effectiveness. Feedback sessions are conducted to provide project managers (PMRs) with constructive insights into their performance, strengths, and areas for improvement. In addition, periodic performance reviews are undertaken to formally evaluate PMRs performance against predefined KPIs and performance criteria, incorporating self-assessment, peer feedback, and stakeholder input [21]. This systematic approach to performance evaluation ensures that PMRs receive ongoing support, guidance, and recognition for their contributions, ultimately driving project success and organizational performance.
Furthermore, the results of PMRs performance valuation have significant implications for project outcomes and organizational success. By accurately assessing PMR performance, organizations can identify areas of strength and areas for improvement, enabling targeted interventions and support mechanisms to enhance PM effectiveness. Positive results from performance valuation, such as high stakeholder satisfaction, timely project delivery, and adherence to budgetary constraints, validate the project managers’ contributions and reinforce their role as effective project leaders. Conversely, negative results or performance gaps highlight areas requiring attention and intervention, prompting organizations to provide additional training, resources, or support to address deficiencies and improve PMRs performance [22,23]. Ultimately, the results of PMRs performance valuation serve as a valuable tool for organizational decision making, talent management, and strategic planning, enabling organizations to optimize project outcomes, mitigate risks, and achieve sustainable project success.
Crawford [24] researched the top management perceptions of project management competence, which provided insights and highlighted the competencies that top management values. However, the findings were based on perceptions and focused on top management views, potentially neglecting project managers’ perceptions. Turner and Miller [25] investigated the project manager’s leadership style as a success factor in projects. The study provided an extensive review of the literature on project management leadership styles, clearly establishing the relationship between leadership styles and project success. The study is primarily literature-based, lacks empirical validation, and focused mainly on leadership, potentially overlooking other critical performance factors, such as top management support and motivation.
Aga et al. [26] researched transformational leadership and project success. The study demonstrated the impact of transformational leadership on project success, which focused on the importance of team building, a crucial aspect of project management. However, the transformational leadership style may not be suitable for all organizations, project types, and cultures. The findings may be considered context-specific and not universally applicable. Cartwright and Yinger [27] examined project management competency, which covers a wide range of competencies required for effective project management. The study provided a standardized approach to assess project managers’ skills, offered clear professional development, and proposed a competency framework for industries. This framework seems too broad and does not account for industry-specific competencies.
2.3. Motivation of Project Managers
The relationship between motivation and performance can be summarized as a mutual one. Performance is directly linked to motivation, meaning that motivated individuals tend to be more productive. Conversely, increased performance can further enhance motivation. Motivated employees tend to be more engaged, focused, and committed to their tasks, which can lead to project success. Motivation has been defined by different scholars; Kazaz et al. [28] defined motivation as a composition of powers and mechanisms that help workers to achieve their tasks willingly and to come closer to project objectives. It is an arrangement that convinces and encourages human behaviors to achieve a purpose. Goyal [29] defined motivation as a process that initiates, guides, and maintains goal-oriented behavior. Chruden and Sherman [30], who are among the early researchers on motivation, stated that motivation involves needs that exist in an individual and the goals or incentives that are to be found outside of the individual. Needs are those thoughts within individuals that emotionally induce them to engage in behavior, which directs toward achieving a goal or incentive that they believe to be capable of satisfying them.
In addition, Manzoor [31] argued that motivation is a power that strengthens behaviors, gives a route to behavior, and triggers the tendency to continue. One can argue that motivation is a force that acts on or within individuals to behave in a certain goal-directed manner. Motivation is a key driver of employee performance and determines the quality and quantity of work performance. Prominent authors such as Maslow and Herzberg and later scholars like Alderfer, McGregor, and Vroom, introduced the concept that motivation is intricately connected to the “desire to achieve”, which is present within individuals in the form of various needs [31].
Maslow [32] argued that man naturally desires to grow from one level to another along the needs pyramid, which follows in the order of physiological, security, love, esteem, and self-actualization. The first three needs are deficiency needs, which give the ideal personality, while the last two are growth needs that are not activated because of deficiency. Herzberg [33] presented a two-factor theory from Maslow’s hierarchy of needs with the assumption that there should be a separation between what motivates workers and what causes dissatisfaction in the workplace. The theory describes the two factors that represent the lower and higher levels of human needs with “hygiene factors” and “motivators”, respectively [34]. Motivators satisfy the worker’s need for self-actualization, promote positive job attitudes, and represent the employee’s ultimate goal.
Clayton Alderfer developed the ERG (Existence, Relatedness, and Growth) theory in [35], in which he accepted and expanded Maslow’s hierarchy system. The ERG theory introduces three fundamental needs: existence needs, which are necessary for human survival and similar to Maslow’s physiological needs; relatedness needs that focusing on interpersonal connections and are similar to Maslow’s love needs; and lastly, growth needs, which align with Maslow’s self-actualization, representing the aspiration for personal development and fulfillment. The difference between these two theories is that the ERG theory does not assume that a lower-level need must be satisfied before an individual can desire the higher-level need [36]. McGregor presented theory X and theory Y in 1960. The concept of McGregor’s theory was that a manager’s supervisory style is based on their perception of their employees and thus presumably knowing what motivates their employees. Both theory X and theory Y reflect the manager’s perception and not that of the employees [37].
The Victor Vroom Expectancy Theory [38] of motivation is grounded in the principle that employee effort is expected to result in performance, and successful performance is anticipated to yield rewards. This theory argues that individuals are motivated by the expected outcomes of their actions and has proven valuable in predicting various work-related variables across diverse organizations. It has been utilized to explain the level of effort expected to complete a job, individuals’ decisions to join or leave their jobs and organizations, as well as job satisfaction [39].
For the construction industry to remain a significant sector, it is imperative that its employees remain consistently motivated, as this directly enhances their performance. Sabo [40] asserted that motivation serves as a tool to enhance employees’ performance and increase organizational productivity. The undermining of the efforts and contributions of project management professionals discourages them and negatively affects their commitments [41]. Project managers are responsible for the successful planning and execution of projects. Motivation plays a pivotal role in the performance of project managers and directly influences their commitment and contributions to project success [42,43].
Understanding the factors that motivate project managers and addressing any issues of low motivation is crucial for enhancing overall project outcomes. Motivated project managers are more proactive, dedicated, and driven to achieve project goals and deliver results effectively [44]. Al-Abbadi and Agyekum-Mensah [45] examined the motivational factors influencing the productivity of construction professionals in Jordan. Their research identified personal growth/career improvement, timely payment, and decision-making autonomy as crucial factors motivating employees’ performance. Marisa and Yusof [45] explored the significance of motivation among construction managers and its impact on organizational success. Their research indicated that motivation influences the performance of construction managers and the overall success of the company.
Additionally, motivated project managers were found to exert greater effort toward achieving organizational goals and played a pivotal role in motivating other team members. Opara et al. [46] investigated the factors driving worker motivation to enhance productivity and assessed the resulting impact on productivity within Nigeria’s construction industry. Their findings indicated that construction professionals were primarily intrinsically motivated by factors such as decision-making autonomy, self-expression opportunities, and potential for personal growth. Additionally, extrinsic motivators like salary increments, job promotions, and recognition were identified as influential factors. Based on these concepts, it is evident that motivation serves as the driving force behind actions, encouraging individuals to work actively and efficiently and unleash their creativity to the fullest extent possible.
3. Materials and Methods
3.1. Participants and Procedures
The overall goal of an organizational performance study is to ensure the efficient utilization of human and natural resources within the constraints of a country’s legal framework, with the key objective of promoting economic growth and development [47]. This research was conducted to identify project managers’ roles, responsibilities, and factors that influence the work motivation of project managers in construction organizations. To collect data, a survey and interview approach was employed to gain a comprehensive understanding of the subject matter from multiple perspectives and data sources. Combining both methods enabled a more robust analysis by leveraging the strengths of each approach, ensuring a more complete understanding of the research topic. A questionnaire was designed, and before the questionnaire was distributed, we carried out a pilot survey with construction professionals and practitioners. In addition to the questionnaire survey, a semi-structured interview was also carried out.
The respondents selected for this survey were project managers employed in government construction agencies and private contracting firms, which have the highest concentration of project managers within the industry. The private contracting firms consist of both indigenous and foreign contractor organizations. Additionally, project managers from private consulting firms, including land and quantity survey consulting firms, geo-tech consulting firms, architectural firms, and mechanical and electrical consulting firms, were included in the survey. The reason for selecting these three sectors was to capture a diverse range of practices and challenges, allowing for a more thorough understanding of PM across different types of organizations and their respective challenges in NCI. Table 2 shows the demographic characteristics of the questionnaire respondents. The survey included project managers holding various positions, such as project directors, senior project managers, and project managers, with working experience in project management ranging from one year to over twenty years. The criteria for including PMRs at different levels was to capture a broad range of perspectives and to gather comprehensive insights on PM practices, challenges, and performance across different roles to increase the generalizability of the findings.
Table 2.
Demographic characteristics of the questionnaire respondents.
From a cross-sectional analysis between working experience in project management (PM) and duration of employment in a current organization in PM, the number and percentage of project managers (PMRs) that have worked in one organization only are 198 and 96.1%, respectively. In this survey, most of the respondents reported stay8ing in one organization. We return to this point in Section 5.
3.1.1. Questionnaire and Interview
Table 3 outlines the three primary sectors of the Nigerian Construction Industry (NCI) selected for the questionnaire survey. A total of 400 questionnaires were distributed through various channels, including email, online platforms, personal contacts, and physical distribution of hard copies. Out of the 400 questionnaires distributed across various sectors, 206 were correctly filled out and returned for analysis. Moser and Kalton [48] stated that survey results could be considered biased and of little value if the percentage response is less than 30–40%. In this study, the response rate is 51.5%, which shows that the survey result is unbiased and thus has a higher value.
Table 3.
Data collection Organization.
Additionally, 36 participants were interviewed based on the questionnaire survey questions to elicit more contextual insights from these professionals. Table 4 provides an overview of the respondents and the data collection based on their positions within the three groups. Seven interviewees represented government agencies such as the Federal Road Maintenance Agency (FERMA), Federal Housing Authority (FHA), Nigeria Railway Corporation (NRC), and Federal Airports Authority of Nigeria (FAAN). Eighteen interviewees were from registered private contracting firms specializing in major construction projects in Nigeria, while the remaining eleven were from registered private consulting firms. The data from the interviewees offered a qualitative description of respondents’ opinions, providing insights into the levels of commitment and motivations exist between organizations and project managers and the impact on project performance.
Table 4.
Interviewees Project Manager (PMR) Position and Organization.
The data collection was conducted in regions categorized with high rates of government and private investment projects, driven by significant social and economic activity. These regions include the southwest, known for the largest seaport and airport in Nigeria, positioning it as the country’s economic center. The southeast is recognized as the business, crude oil, and technological hub of Nigeria, attracting considerable investment and development projects. In addition, the southern region, being the largest producer of crude oil and natural gas, serves as a focal point for energy-related projects and infrastructure development. On the other hand, Abuja, the federal capital territory of Nigeria, is located in the north-central region of the country, experiencing significant government-led development projects and infrastructure initiatives. Focusing on these regions, the aim was to gather insight data from areas with high construction activity and investment concentrations. This provided a comprehensive understanding of the actual contribution of project managers in project management practices and the motivational support offered by the organizations in Nigeria.
3.1.2. Survey Design and Collection
The questionnaire was divided into three parts: The first part asked demographic questions; the second part focused on the project management practices and their perceived importance, which encompassed an evaluation of the level of project management tasks practiced by the organizations, the extent of involvement of project managers in these tasks, and the degree of assignment of project management responsibilities to project managers; the third part focused on motivational factors and their perceived importance, which involved assessing the level of motivation factors practiced by the organizations and the extent to which these factors were applied to project managers, as shown in Table 5.
Table 5.
A List of Questions.
For part 2, we selected 26 tasks that are generally considered project managers’ responsibilities. These tasks are categorized across the three stages of project, including eleven from the pre-project stage, ten from the execution stage, and five from the post-project stage. The detailed breakdown of the results can be found in Section 4. For part 3, we also selected 26 motivation factors. The motivation factors chosen for this study were derived from a comprehensive review of the existing literature on project management practices, performance, and motivation within the construction industry. The selected factors were then refined based on their relevance to the specific context of the (NCI). To ensure a robust and relevant set of factors, the following several key steps were undertaken. Literature review: An extensive review of academic journals, industry reports, and previous research studies was conducted to identify common motivation factors that influence project manager performance and commitment. Expert consultation: Input was sought from industry experts, including experienced project managers and organizational leaders within the NCI. Their insights helped to validate and contextualize the motivation factors identified from the literature review. Pilot survey: This preliminary survey was conducted with a small sample of project managers to assess the relevance and importance of the identified factors. Their feedback was used to refine the list of motivation factors.
These factors are detailed in Section 4, along with the corresponding results. Each respondent was asked Q6 through Q11 for each task and Q12 and Q13 for each motivation factor. Q10 and Q11 are questions about an organization’s expectations towards project managers, that is, ideal situations. Q8 and Q9 are questions about project managers’ contributions, that is, actual situations. Thus, the difference between Q10 and Q11 and Q8 and Q9 is considered an index to represent to what extent project managers perceive to underperform or outperform the expectations of their organizations for each task. Some tasks are assigned and conducted by non-project managers. Q6 and Q7 are questions about actual practices by non-project managers. Q6 and Q7 are designed to provide information on organization policy and culture such as how tasks for project management functions are assigned and how highly project managers are valued in each organization.
The justification for using the difference between Q10 and Q11 and Q8 and Q9 as an alternative index to represent the degree of project managers’ performance is addressed here. There are two reasons for this. First, these questions are related to their jobs in their organizations. Thus, it is reasonable to assume that they have sufficient information to answer these questions. Second, because of the first reason, it was possible to collect a larger number of responses and increase the efficiency of the statistical survey. It should be noted, however, that these responses are subjective answers, which may include a certain degree of bias. It is assumed that an increase in efficiency in those outperformed may lead to increased bias. Addressing this potential issue is important for future research.
A pilot survey was conducted with project management professionals and practitioners with a purposive sampling approach including 3 academic experts and 13 project managers with over 10 years of project management experience and thus having an extensive knowledge of professionals. The participants of the pilot study were asked to evaluate and provide constructive comments on the appropriateness of the language, the validity of the questions, its structure, and completeness. The participants of the pilot study provided imperative data such as key performance indicators (KPIs) of project managers and standard operational procedures (SOPs) of the selected organizations. After receiving their comments, the questionnaire was revised for readability and restructured and their provisions included. Based on recommendations from the pilot study, we established a benchmark requiring survey participants to have a minimum of one year of project management experience, while interview participants were selected based on having at least ten years of project management experience.
This threshold was set to ensure the collection of comprehensive data, considering the extensive knowledge and practical insights these participants possess in project management techniques. These participants hold key positions within their respective organizations, making their perspectives invaluable for capturing the unique characteristics of each organization. This approach facilitated a thorough exploration of the current trajectory of project management within their organizations and identified potential areas for improvement. Descriptive statistics are used for two purposes: to examine the data and to summarize the observations [49]. Descriptive statistics of quantitative technique were conducted on the collected data to determine the project management practices (Q6 and Q7), the actual contributions of project managers (PMRs) (Q8 and Q9), and the expected contribution of PMRs by organizations (Q10 and Q11) in construction organizations in Nigeria. The method was also used to determine the motivation factors attributed to PMRs (Q12 and Q13) within Nigerian construction organizations.
The questionnaire was structured using a 5-level Likert scale, providing respondents with a standardized method to express their opinions and perceptions and allowing for a detailed assessment of their perceived responses. The respondents’ responses were designed as 1 = not practice; 2 = low practice; 3 = medium practice; 4 = high practice; and 5 = very high practice on the level of project management practices and motivational factors practices. The same pattern was used on the level of importance of the project management practices and motivational factors, where 1 = not important; 2 = less important; 3 = medium important; 4 = high important; and 5 = very high important. This investigation aimed to ascertain the actual contribution of project managers, evaluate their commitment to project management practices, and understand the level of motivational support provided by their respective construction organizations.
3.2. Hypotheses
Iroha et al. [7] claimed that there is an existence of underperformance of project managers in the Nigerian construction industry, and it leads to lower motivation practices by their organizations. The findings of this current study validate the claims by Iroha et al. [7]. First, the following hypotheses were developed:
- Hypothesis 1
- H10 (Null Hypothesis): Project managers do not perceive underperformance or outperformance for any project management tasks.
- H11 (Alternative Hypothesis): Project managers perceive underperformance or outperformance for some project management tasks.
- Hypothesis 2
- H20 (Null Hypothesis): Regardless of the level of underperformance or outperformance project managers perceive, they perceive the same level of motivational support from their organization.
- H21 (Alternative Hypothesis): The higher the level of underperformance project managers perceive, the less motivational support from their organization they perceive. The higher the level of outperformance project managers perceive, the more motivational support from their organization they perceive.
As described in Section 3.1.2, the difference between Q10 and Q11 and Q8 and Q9 explains the underperformance or outperformance. Q10 and Q8 represent the level of practice, and Q11 and Q9 represent their levels of importance. Here, we introduce the new variables of EPMR and APMR as follows:
EPMR and APMR represent the expected and actual contribution of project managers, respectively. The actual level of motivation support towards project managers denoted as AMS and given as follows:
AMS represents the actual motivational support provided to project managers.
Using these variables, the above hypotheses are rewritten as follows:
H10: or
H11: or
Here, and mean the mean values of and , for each task respectively. Furthermore,
and means the mean value of for each task.
To test the second hypothesis, we introduce variables of , , , and . , , and mean the mean values of , , and for each respondent, respectively. means the difference between and , which is the mean value of for each respondent.
Then, the second hypothesis is rewritten as follows:
H20: and are independent.
H21: and are negatively correlated.
It should be noted that the expected contribution of project managers and their actual contribution might be different depending on the type of business scope, such as the government, consultant, and contractors. It is reasonable to assume that, however, their differences are independent of the type of business scope. This assumption suggests that the variations in expected and actual contributions of project managers are likely driven by broader organizational practices and cultural factors rather than the specific nature of the business. Therefore, the hypotheses developed in this study can be considered applicable across a wide range of organizational contexts. Thus, Hypothesis 1 was developed and validated for all organizations in this study. Hypothesis 2 was developed to focus on the validation of the relationship between the project managers’ underperformance and motivational support by their organizations. Similarly to EPMR and APMR, the ANPMR variable represents the actual contribution of non-project managers:
Particularly for tasks with , where is the mean value of for each task, careful analysis is needed. If is significantly higher than , non-project managers are considered to regularly play an alternative role of project managers in performing that task where project managers have underperformed in relation to the expected contributions. Thus, the following supplementary hypothesis was developed:
- Hypothesis 3
- H30 (Null Hypothesis): There is no perceived difference in the contribution by non-project managers and project managers in that task.
- H31 (Alternative Hypothesis): There is a perceived difference in the contribution by non-project managers and project managers in that task.
Using these variables, the above hypotheses are rewritten as follows:
H30: or
H31: or
where
4. Results and Analysis
SPSS software (version 19.0) was used to analyze the collected data. A reliability test was conducted on the data to measure the internal consistency reliability by using Cronbach’s alpha coefficient. Table 6 presents a comprehensive reliability analysis of data on the 26 project management (PM) practices, their importance, and the 26 motivation factors. The table includes the mean values, standard deviations, and variances for both the PM practices and motivation factors, highlighting the level of consensus and the spread of responses among the respondents. The perceived level of practices conducted by non-project managers (Q6) shows good internal consistency, with a Cronbach’s alpha value of 0.874. Similarly, the perceived importance of these practices (Q7) also demonstrates high reliability, with a Cronbach’s alpha value of 0.863. The actual level of contributions of project managers (Q8) maintains good reliability, with a Cronbach’s alpha of 0.851, and the importance of these contributions (Q9) also exhibits good internal consistency, with a Cronbach’s alpha of 0.838. The expected contributions from project managers by organizations (Q10) achieve the highest reliability in the table, with a Cronbach’s alpha of 0.895, while the perceived importance of these expected contributions (Q11) shows very good consistency with a Cronbach’s alpha value of 0.891. Regarding the motivation factors, the practice of these factors (Q12) displays good reliability, with a Cronbach’s alpha value of 0.891, and the motivational support provided to project managers (Q13) also shows good internal consistency, with a Cronbach’s alpha value of 0.878. Overall, the data demonstrate reliable insights into PM practices and motivation factors, with all Cronbach’s alpha values exceeding 0.8, indicating good to very good internal consistency.
Table 6.
Reliability of Data of PM and Motivation.
4.1. Analysis of PM Practices in the Organizations
Table 7 recounts a detailed descriptive statistical analysis that compares the mean values of project management practices by organizations, the expected contributions of PMRs by organizations, and the actual contributions of PMRs and their perceived importance respectively. This analysis highlights the gap between organizational expectations, the actual performance of PMRs, and actual contributions of NPMRs, offering insights into areas where practices align or fall short.
Table 7.
Summary of Mean Value of Each Task.
The expected contribution of PMRs by their organizations, Q10 and Q11; the actual contributions of PMRs, Q8 and Q9; and the actual contributions of non-project managers, Q6 and Q7, are different from task to task. Each stage of the project has different characteristics. The execution project stage has notable characteristics that distinguish it from the pre-project and post-project stages; the differences between Q10 and Q8 and between Q11 and Q9 were thus the largest among the three stages. The difference between Q10 and Q8 and between Q11 and Q9 was the largest among the three stages. Furthermore, the differences between Q6 and Q8 and between Q7 and Q9 were the largest. In this survey, it was found that the actual contribution of PMRs as compared with the expected contribution is the lowest at the execution project stage. Non-project managers cover insufficient practice by project managers in the execution stage. At the post-project stage, the mean values of Q10, Q11, Q8, and Q9 were the highest among the three stages. In this survey, the expected and actual contributions of PMRs were the highest at the post-project stage. The pre-project stage had mixed results in terms of the level of practice and its importance. The mean value of Q8 was lower than Q10, but that of Q9 was higher than Q11. Though the actual level of practice of PMRs was lower than that of the expected level, its importance level was higher than the expectation.
4.2. Analysis of Underperformance and Outperformance of PMRs
In this section, the analysis provided a detailed explanation of the tasks that were either underperformed or outperformed by project managers. The underperformed tasks were those where project managers did not meet the expected contributions. These tasks often fell short due to various factors, such as lack of motivation, insufficient training, and external pressures like corruption and political interference. On the other hand, the results also identified tasks where project managers exceeded expectations. These outperformed tasks highlighted areas where project managers demonstrated high levels of efficiency and effectiveness, surpassing their organizations’ expectations. The reasons behind this outperformance were linked to factors such as increased autonomy in decision making, a sense of professional pride, and a strong sense of responsibility.
4.2.1. Identification of Underperformed and Outperformed Tasks
Table 8 shows a summary of the paired t-test between and across PM tasks. This evaluation assesses the performance level of PMRs for each task, highlighting any significant differences between expectations and actual outcomes. Among the 26 tasks compared for PMR performance, the hypothesis was rejected for 21 tasks and accepted for 5 tasks. For the 21 tasks where the hypothesis was rejected, was significantly greater than for 16 tasks, indicating underperformance by PMRs. Conversely, was significantly greater than for five tasks, showing PMRs’ outperformance. These findings led to the rejection of the first null hypothesis H1. Additionally, was significantly less than for 12 tasks, while was found to be significantly less than for 8 tasks.
Table 8.
Categorization of Project Managers’ Performance and t-test associated with Mean Values.
Furthermore, according to the relative value of , underperformed tasks and outperformed tasks were categorized into three groups, respectively. The first underperformed group U1 satisfies Q6Q7>Q10Q11>Q8Q9 and consists of A2, B9, and B10. The second group U2 satisfies Q10Q11>Q6Q7>Q8Q9 and consists of A1, A9, B2, B3, B4, B5, B7, B8, and C3. The third group U3 satisfies Q10Q11>Q8Q9>Q6Q7 and consists of A8, C1, C2, and C5. It was found that for task A8, which involves preparing health and safety management strategies and hiring external labor, most organizations prefer to use health and safety managers and human resource managers who specialize in these areas. Despite expecting high contributions from project managers, these specialized managers are allocated more of the responsibilities. Similarly, task C1, which is “involvement in check-list and project assessment”, is often assigned to the operational manager by organizations to ensure that the assessment considers cross-functional impacts and provides an unbiased perspective. For task C5, which involves developing lessons learned for organizational improvement, most organizations prefer using non-project managers on this task to allow project managers to focus on their primary responsibilities while still ensuring that valuable lessons are captured and documented. The first outperformed group O1 satisfies Q6Q7>Q8Q9>Q10Q11 and includes A3. The second group O2 satisfies Q8Q9>Q6Q7>Q10Q11 and consists of A7, A10, and C4. The third group O3 satisfies Q8Q9>Q10Q11>Q6Q7 and includes A5.
For tasks in U2, the paired t-test was conducted to validate Hypothesis 3. The results show that there exist significant mean differences between Q6Q7 and Q8Q9 for all tasks except C3. Particularly, tasks B2, B3, B5, and B8 show highly significant differences (high t-values), with p-values < 0.01.
Figure 1 graphically illustrates both the expected and actual contributions of PMRs across various categories. The graph highlights significant differences between expected and actual contributions as well as tasks where organizational expectations are relatively low. The detailed analysis of the characteristics associated with each task is provided in the next sections.

Figure 1.
Contribution of PMR and Expected Contribution PMR by the Organization.
4.2.2. Analyses of Underperformed Tasks
The analyses identified tasks where PMRs underperform. In U1 tasks, A2, B9, and B10, organizations allocate more responsibilities to non-project managers (NPMRs), and PMRs perform below the organization’s expectations, leaving the roles to NPMRs to perform. The actual contribution of project managers, , of these tasks are 3.79, 3.92, and 3.92, and they are not so low compared to the expected contribution. These tasks are also essential to project success; thus, the reason behind PMRs’ underperformance needs to be identified, especially regarding how organizations allocate project management responsibilities among PMRs and NPMRs.
Among underperformed tasks, those in U2 need to be paid attention. In these tasks, the PMRs cannot fulfill the organization’s expectations. Furthermore, H30 was rejected except for C3. Thus, the roles of PMRs are covered by NPMRs except for C8. Among these tasks, it is worthwhile to focus on tasks that are insufficiently handled by PMRs and analyze their characteristics.
Table 9 summarizes their characteristics. Three criteria, namely (Q10Q11), (Q6Q7), and (Q8Q9), are used, and each value is evaluated in four ranks. They are H (high): Value ≥ 4.0, M (medium): 3.5 ≤ Value < 4.0, L (low): 2.5 ≤ Value < 3.0, and VL (very low): Value < 2.5. There are seven tasks whose (Q8Q9) is ranked in “L” or “VL” in U2 and one such task in U3. Thus, in total, eight tasks were identified, and they were characterized into three types.
Table 9.
Characteristics of Tasks Insufficiently Contributed by Project Managers.
Table 9 presents the characteristics of tasks insufficiently handles by project managers, categorized into three types based on expectations and contributions. Their summary is described as follows.
Type I includes tasks with low expectations, where task A9 shows very low contributions from both PMRs and NPMRs, and task B7 shows low contributions from both parties. Type II involves tasks with medium to high expectations. Task B2 has high expectations but sees insufficient involvement from NPMRs, and task B8 has medium expectations with NPMRs playing a moderate role, yet PMR contributions are low. Type III comprises tasks with medium to high expectations but low contributions from both parties. Task A8 has high expectations with very low contributions from both PMRs and NPMRs, while tasks B5 and B4, with medium expectations, exhibit low to very low contributions from both PMRs and NPMRs. This highlights the discrepancies between expected and actual contributions by both PMRs and NPMRs across various tasks.
Type I is characterized as “Low expectation and (Very) Low contribution by both parties”. A9 (Involvement in the purchase and supervision of equipment, materials, and supplier selections) and B7 (Preparing internal and external reports relating to the project status) were categorized as this type. Regarding A9, (Q10Q11), (Q8Q9), and (Q6Q7) are 3.39, 2.22, and 2.56, which are the third lowest, the lowest, and the lowest, respectively. It means that this task is less seriously recognized as a project manager’s job. To make matters worse, its fulfillment by both PMRs and NPMRs is extremely insufficient. B7 has similar characteristics, though contribution by both parties is not as low as those of A9. As a future area of study, it is important to identify not only why contributions by both parties are low but also why organizations’ expectations are low to begin with.
Type II is characterized as “Medium or high expectation, but NPMR (insufficiently) plays a role”. B2 (Evaluating resource utilization on the planned estimate and prepare variance analysis) and B8 (Preparing daily progress reports on the project) were categorized as this type. Regarding B2, organizations recognize this task as an important job of project managers. Since project managers cannot fulfill organizations’ expectations at all, however, NPMRs play their roles. However, their contributions are still much lower than organizations’ expectations. Regarding B8, organizations’ expectations are medium, and NPMRs play a role for PMRs. For both tasks, it is important to increase the level of contribution by PMRs. It is critical to do so in B2 because its expectations are high.
Type III is characterized as “High or medium expectation but low contribution by both parties”. A8 (Preparing health and safety management strategy and involvement in hiring external labors), B5 (Confirming safety and hazard prevention on the site), and B4 (Contractor project evaluation reports) were categorized as this type. Organizations’ expectations of project managers to fulfill these tasks are high or medium. However, contributions by PMRs and NPMRs are far below their organizations’ expectations, though non-project managers play some roles in B5 and B4.
Type III seems to provide important implications in dealing with the gap between ideal and reality. A8 and B5 are related to H&S, i.e., health and safety. Securing H&S should be one of the most important responsibilities of management in principle. B4, contractor project evaluation, is also supposed to play a critical role in managing a project. In practice, however, these responsibilities are not fully fulfilled. That is, there exists a clear gap between the ideal and reality. Project managers are often required to give higher priority to meeting political demands than project demands [7]. There is a possibility that political demands may weaken the function of B4.
Furthermore, compromising safety to satisfy cost and schedule targets is considered a universally widespread practice. It was found from this study that safety managers and human resource managers often directly deal with health and safety due to their expertise in these areas. However, project managers make a final decision on how to manage health and safety. If they face political demands, it might lead to further compromise of health and safety. Studying the reasons for the insufficient implementation of tasks in type III is an important future issue to elucidate how to reduce the gap between the ideal and reality.
The characteristic of U3 tasks is that organizations’ expectations toward PMRs are high. Project managers’ contribution is medium or high, except for A8. However, project managers fail to meet the organization’s expectations for the functions of the tasks. This is reflected by relatively high t-values for A8, C1, and C5, which are 16.52, 13.45, and 7.54, respectively. This failure places organizations at high risk. Further study is required to understand the reasons for the significant underperformance.
In summary, the characteristics of underperformed tasks are versatile. In tasks in U1, the contribution by non-project managers is even higher than organizations’ expectations towards PMRs. In most tasks in U2 except one task, the contribution by NPMRs is significantly higher than that of project managers. However, a more detailed analysis showed their different characterizations, with three types: low expectation and (very) low contribution by both parties (Type I); medium or high expectation, but NPMR (insufficiently) plays a role (Type II); and high or medium expectation but low contribution by both parties (Type III). Among tasks in U3, organizations’ expectations of PMRs are high. A8 (Preparing health and safety management strategy and involvement in hiring external labors) is classified in Type III in U2. For the other three tasks in U3, PMRs fail to meet the organization’s expectations, though their contribution is medium or high.
4.2.3. Risk of Underperformed Tasks
In many cases, PMRs face the gap between the ideal and reality. Table 10 outlines the risk effects of project managers’ underperformance across three project stages. This table was derived from analyzing various project management tasks and the potential risks associated with underperforming in these tasks. It categorizes tasks into three different underperformance groups (U1, U2, and U3) and lists specific tasks along with their associated risks.
Table 10.
Examples of Risk of Underperformed PM Tasks by PMRs.
It was found that most organizations tend to use NPMRs that specialize in certain task responsibilities. This situation demoralizes and limits PMRs in performing their roles effectively. During the interviews, some respondents mentioned that external factors such as corruption and political pressure negatively affect the implementation of project management, forcing project managers to prioritize personal gain over project needs. This affects long-term project plans and influences decision making. For example, corrupt practices influence procurement decisions, leading to biased vendor selection. This, in turn, causes delays in the supply chain and the provision of substandard materials, which largely contributes to the underperformance in U1 and U2. The selection of incompetent suppliers results in risks associated with tasks A9, B10, and A2. Additionally, due to political pressure for personal gain, project funds are often diverted, largely contributing to the underperformance in U1, U2, and U3. This bribery and diversion of project funds were attributed to risks associated with tasks A2, A9, B3, and A8.
The costs of the huge gap between the ideal and reality seem enormous. Particularly, insufficient implementation of tasks categorized in Types I, II, and III possibly brings significant risk. In the future, it may be worthwhile to study which task insufficiencies cause project failures such as project delays, cost overruns, or project abandonment.
4.2.4. Analyses of Outperformance Tasks
The analyses indicated the tasks where PMRs outperform the organization’s expectations. Among these tasks, task A3 (Preparing timeline, identifying resources, negotiation with vendors) is notable as the only project management task in O1 where PMRs exceed the organization’s expectations despite being delegated fewer responsibilities. In O2 tasks, project managers significantly surpass expectations, especially in tasks A10 (Liaising and consulting with the host community for a successful project) and C4 (Involvement in completing the final project report and handing it over to the client), with t-values of −23.61 and −10.25, respectively. Similarly, in O3, task A5 (Working with architects and engineers to obtain the specifications of the project) stands out, with PMRs outperforming expectations with a t-value of −2.06. During the interviews, it was found that the outperformance of project managers was attributed to the opportunities for autonomy in decision making on the project without having to wait for top management approval, which project managers claimed often caused delays. Professional pride and a sense of responsibility were also mentioned as key motivations for their high contributions.
Organizations stated that the high contributions of PMRs provide a wide range of benefits, including improving project success rates, completing projects on time and within budget, better resource management, effective risk mitigation, strategic alignment, and continuous improvement. Tam et al. [50] argued that autonomy in decision making empowers project managers to take timely actions and make informed decisions, enhancing their efficiency and effectiveness. This empowerment boosts their confidence and encourages a proactive approach to problem solving. Additionally, the sense of professional pride and responsibility drives PMRs to uphold high standards and deliver exceptional results. The respondents argued that such contributions lead to more successful project outcomes through effective risk mitigation and ensure that potential issues are identified and addressed promptly, reducing the prospect of project delays and cost overruns.
4.3. Influence of Underperformance on Motivation Support
The underperformance of PMRs on project management tasks was found to significantly erode organizations’ trust in their competency. This reduced trust is a major factor that contributes to an organizational culture that provides low motivational support. Project managers often face unfair working conditions, a lack of recognition, limited career growth opportunities, insufficient job training, and minimal involvement in decision-making processes. These factors lead PMRs to feel undervalued and unappreciated. When PMRs perceive that their efforts are not acknowledged or rewarded, their motivation to excel weakens. This feeling of being undervalued leads to decreased contributions to their project management responsibilities, further exacerbating their underperformance. These views are based on a qualitative study of the respondents’ responses during the interview.
Consequently, quantitative study is considered beneficial. In this section, first, the levels of motivation support activities given to project managers by the organizations are studied. Second, to see how they are influenced by the degree of underperformance of PMRs, the correlation analyses between both factors are conducted. The first study reveals which support activities are invested more intensively than others, and the second study quantitatively identifies the potential impact of the underperformance of PMRs on the levels of motivation support activities given to them by their organizations. These studies strengthen the previous qualitative studies.
Levels of Motivation Support Activities
Table 11 illustrates a descriptive statistical analysis that examines the level of motivation factors practiced by the organizations (Q12) and the actual level of motivation support given to project managers (Q13). This analysis assesses the alignment between organizational practices and the support experienced by PMRs. Factor 5 (Sudden changes in projects by the client) and factor 6 (Delay in responding to requests for information and project materials) of the motivation factors were originally rated using a scale where 1 = not practiced, 2 = low practice, 3 = medium practice, 4 = high practice, and 5 = very high practice. To align these responses with the responses of other motivation factors, the scale for these questions was reversed: 1 = very high practice, 2 = high practice, 3 = medium practice, 4 = low practice, and 5 = not practiced.
Table 11.
Categorization of motivation factors based on PMR interest.
It is important to understand and address the motivation factors that are vital to enhancing project managers’ performance and commitment. Thus, all factors were classified into three groups. Group 1 focuses on providing opportunities for professional growth, skill enhancement, and autonomy in decision making, which directly impact project managers’ motivation to excel in their roles. Addressing these factors can lead to higher employee satisfaction and retention and a more skilled and committed workforce. Group 2 includes factors that influence the working environment and the quality of relationships within the workplace. These elements affect job satisfaction, collaboration, and an overall friendly workplace. Group 3 focuses on the financial and non-financial incentives that support project managers’ well-being and job security. These factors are essential for ensuring financial stability and providing additional motivational benefits.
The results have several characteristics. First, overall support activities by studied organizations are not intensive. The mean values of all factors in Q12 and Q13 are 2.49 and 2.64, respectively, which are between 2 = low practice and 3 = medium practice. Second, the way that support is provided by the organization is different between project managers in all the organizations. Comparing the mean values in Q12 and Q13, for Group 1, Q12>Q13; for Group 2, Q12≑Q13; for Group 3, Q12<Q13. That is, compared to organizational support to all members, project managers perceive less motivational support for professional development, career advancement, and decision-making authority and perceive more support for financial benefits and nonfinancial support. Third, more concretely, the results show that: Q12 = 1.87 and Q13 = 1.27; Job promotion: Q12 = 2.51 and Q13 = 1.89; Job training: Q12 = 2.75 and Q13 = 1.98; Good relationships with colleagues and supervisors: Q12 = 3.07 and Q13 = 1.54; Involvement in decision making: Q12 = 2.85 and Q13 = 2.20. These findings indicate that although the practice levels are already low, the actual motivation levels experienced by project managers are even lower.
4.4. Project Managers Contributions and Motivational Support
Iroha et al. [7] claimed that the underperformance of PMRs causes a series of changes in their organizations’ perceptions and activities. It generates organizations’ perception of the low contribution of PMRs, reduces their trust towards PMRs, and eventually leads to their low motivational support for PMRs. In this section, correlation analysis is conducted to quantitatively confirm the relationship between the underperformance of PMRs and motivation support by their organizations.
Here, the difference between each PMR’s contribution expected by his/her their organizations and each PMR their actual contribution is defined as the degree of underperformance. This is represented with (difference in means of each PMR respondent of Q10Q11 and each PMR respondent of Q8Q9). Responses in Q13 are assumed to represent the level of motivational support by organizations. Correlation analysis was conducted to examine the relationship between PM tasks and the motivational support provided to PMRs. To investigate this relationship in more detail, each variable was divided into groups. For the underperformance of project managers, we also focused on underperformed tasks as well as all tasks. Underperformed tasks are those in U1, U2, and U3 in Table 8 and have negative . Thus, for underperformed tasks is introduced. For motivational factors, three groups, namely Groups 1, 2, and 3, which were defined in Table 11, are introduced. Eight (=2 × 4) correlation analyses were conducted for different sets of the degree of underperformance and motivation factors of each respondent: (1) all tasks and (2) underperformed tasks; (a) all motivation factors, (b) Group 1, (c) Group 2, and (d) Group 3. The results are shown in Table 12.
Table 12.
Correlation Coefficients Between the Degree of Underperformance of Project Managers and Levels of Motivation Support.
The results have three characteristics. First, all correlation coefficients are negative. Second, comparing the results of all tasks and underperformed tasks, the absolute value of the correlation coefficient between the former and all motivational factors and each group is higher than those of underperformed tasks. Third, among the three groups, Group 1 is most negatively correlated. Only Group 1 is significantly correlated with the degree of underperformance of both all tasks and underperformed tasks. Group 2 is the second, and Group 3 is the least.
Regarding the first characteristic, Iroha et al. [7] also claimed that low motivational support towards PMRs lowers their motivation and commitment, which becomes a cause of underperformance in the next projects. Thus, the above relationship may represent the causal relationship between motivational support and underperformance rather than the causal relationship between underperformance and motivational support. However, the overall claim by Iroha et al. [7] is that there exists a vicious cycle between the underperformance of PMRs, low motivational support by their organizations, and their low motivation and commitment. Project delays, cost overruns, and even abandonment of many projects are considered a reflection of this vicious cycle. Therefore, it is reasonable to interpret that the results of these correlation analyses represent both causal relationships. In the next section, the other causal relationship between low motivational support and underperformance is discussed.
The purpose of focusing on underperformed tasks was to identify their common characteristics. However, the second characteristic, weaker negative correlation coefficients with underperformed tasks, means that this analysis fell into selection bias. When study samples are selected based on a narrow variation in dependent variables, the causal effect is underestimated, which is called selection bias [51]. In this analysis, either the degree of underperformance or the motivational factor can be a dependent variable. Thus, the selection of underperformed tasks creates selection bias and underestimates the effect of the motivational factor. To use all tasks, including not only underperformed tasks but also outperformed tasks, is a correct approach.
The third characteristic appears to provide an important implication regarding organizational support. Group 1 is considered critical to enhance the management skills of project managers. Conceptually, the effectiveness of investment in skill enhancement of each project manager, EI, may thus be represented by the following:
The numerator represents the benefit associated with Group 1 of motivation factors, and the denominator represents the cost associated with the implementation of all motivation factors. It seems reasonable to assume that EI decreases as the support level of Group 1 decreases. Group 1 has the lowest mean value and is most negatively correlated with the motivation factors. Thus, there is a possibility that the EI of many organizations in surveyed organizations keeps decreasing. Under the current situation, therefore, it seems difficult for organizations to generate driving forces and internally enhance the performance of project managers.
5. Discussion
In the previous chapters, we identified underperformance among PMRs across 16 key tasks. Additionally, the mean value for motivational factors provided to PMRs was found to be 2.64, indicating a level between low and medium practice. Despite this, 96.1% of surveyed project managers have remained with their current organizations. These phenomena look incomprehensible. In this section, this study aimed to contextualize and interpret these phenomena by using a game theory model alongside a regression analysis to examine the relationship between underperformance and the level of motivational support. Through this approach, we sought to uncover the underlying reasons for the observed behavior and the persistence of PMRs within organizations that offer limited motivational support.
5.1. Explanation of the Current Situation by Game Theory Model
Staying at the same organizations despite low motivational support becomes a prevailing phenomenon. It is possible to interpret that this occurs as a result of actions by project managers and their organizations. Game theory serves as a valuable tool to analyze and explain the rationale behind the decisions made by both parties. In this section, the study presents a framework using a game theory model to reveal the current situation and motivations that drive these choices.
Table 13 illustrates a hypothetical payoff matrix detailing strategic interactions and rational decision-making behaviors among PMRs and organizations. Project managers will stay with their organizations when they perceive opportunities for career growth (), while organizations will support PMR career growth when net contributions of PMR, given the cost of support ( = investment), are perceived. Organizations are motivated to provide such opportunities when they perceive the value and benefits of investing in project managers’ career development. Conversely, project managers are more likely to leave their current organizations if they do not perceive career growth opportunities but perceive support from another organization willing to invest in their career development (). In the “non-support” scenario, organizations do not offer career support (), and project managers stay and contribute without this support (). The respondents in the interview indicated that project managers often choose to stay due to the high rate of unemployment, particularly for project management positions. Project managers will leave their current organizations when they perceive growth opportunities elsewhere () and when their current organizations have taken non-support as a measure (0). This situation has been the prevailing condition between PMRs and organizations within the Nigerian construction industry.
Table 13.
Hypothetical Payoff Matrix for PMR and Organization.
- where
- : Individual growth with organization support perceived by PMR.
- : Individual growth without organization support perceived by PMR.
- : Individual growth in other organizations perceived by PMR with support in the current organization.
- : Individual growth in other organizations perceived by PMR without support in the current organization.
- : Net contribution of PMR with organization support perceived by the organization.
- : Contribution of PMR with no organization support perceived by the organization.
- : Cost of support (investment).
The organization’s decision to support or not to support PMRs depends on the probability that they leave the organization once support is made. Here, represents the probability perceived by the organization that PMR stays at the organization. Suppose that the organization’s perception of the growth of PMR and the PMR’s perception of themselves are the same. Then, the hypothetical expected payoff matrix for PMR and the organization, which is perceived by the organization, is given in Table 14.
Table 14.
Hypothetical Expected Payoff Matrix for PMR and the Organization are Perceived by the Organization.
: The probability perceived by the organization that PMR stays at the organization.
This study found that 96.1% of the respondents have worked in one organization only. In this analysis, it is thus assumed that . It should be noted that may also be influenced by the level of organizational support, . Since this is the first attempt to explain the current situation, is assumed to be independent of for the sake of simplicity. Discussion of the dependency of on is a future issue. Under this situation, the expected payoff matrix is reduced to Table 15.
Table 15.
Hypothetical Expected Payoff Matrix for PMR and the Organization Perceived by the Organization when .
When the following conditions are satisfied, (stay, support) becomes the dominant solution.
where
- : The gross contribution of support.
- : The net contribution of support.
5.2. Graphical Representation of Motivation Factors
In the previous section, it was determined that (stay, support) emerges as the dominant strategy under certain conditions. To fully understand these conditions, it is necessary to explain how , , and are represented. Section 4.4 discussed the causal relationship between the degree of underperformance and the level of motivational support, which provides further context for these conditions. In this section, using a causal effect relationship between the level of motivational support and the degree of underperformance, we graphically try to represent, , and . Figure 2a represents an image of the regression analysis between the degree of underperformance and the level of motivational support. The vertical axis, , is , the difference between the contribution of PMR expected by the organization and the net contribution of PMR with organization support perceived by the organization. The horizontal axis is the level of organizational support.

Figure 2.
(a) Image of the Regression Analysis. (b) Effects of Support of Training. (c) Distribution of Responses.
Here, three noteworthy assumptions are made. The first is the interpretation of, the mean value of Q10Q11. literally represents . It is assumed that. The second is the interpretation of , the mean value of Q8Q9. It is reasonable to assume that represents, the net contribution of PMR with organization support perceived by the organization. Thus, the vertical axis, , becomes . The third is the treatment of. In the game theory model, it is treated as a discrete variable: invest or not invest. Figure 2a shows, however, that appears as a continuous variable. Thus, is treated as a continuous variable. Accordingly, is also treated as a continuous variable.
Figure 2b depicts the effect of investment of support. Suppose that the following holds:
For the sake of simplicity, the net effect of is assumed to be linear, as the purpose of this discussion is to explain the impact of investment support.
The above, then, represents a hypothetical situation of how each respondent would perform before she/he receives support from the organization. After PMRs receive motivational support, their performance line is improved from to .
5.3. Results of Regression Analysis
The next step is to concretely explain and . This was achieved through regression analysis, where is set as the dependent variable and Group 1, Group 2, and Group 3 as independent variables. A stepwise regression analysis was conducted to analyze these relationships. Table 16 shows the results. Among the three groups of motivation factors, only Group 1 becomes a significant variable. The unstandardized coefficients for the constant and Group 1 are 0.694 and −0.225, respectively. The statistical significance p-value = 0.000 supports the reliability of this finding. In the statistical analysis hereafter, the value of Group 1, a group of factors that support professional development, career advancement, and decision-making authority, is used to represent for two reasons: First, this is the only significant variable among motivation factor variables. Second, factors in Group 1 are considered critical to enhance the management skills of project managers. Thus, in Figure 2a,b, is 0.694, and is 0.225.
Table 16.
Results of Multiple Regression Analysis between the Degree of Underperformance and Motivation Factors.
The values of R, R Square, and Adjusted R Square are 0.262, 0.069, and 0.064, respectively. The regression model does not successfully explain much of the variance of the degree of underperformance. Multiple reasons may exist for the low explanatory power of the regression model. Among them, multiple levels of institutional factors, including political factors, weak governance, and organizational culture, seem to be noteworthy. This is revisited in Section 5.5.
5.4. Implication from the Game Theory Model
Here, an important implication is obtained. As long as , Equation (13) is satisfied. But it does not necessarily mean that , that is, overcoming underperformance. The ellipse in Figure 2c shows the distribution of respondents’ answers. The shaded part represents who outperforms their organization’s expectations. No shaded part represents the underperformance. In this survey, the ratio of outperformers () was 26.8%, and the ratio of underperformers () was 73.2%. The results of Table 11 show that the mean value of Group 1 of motivation factors, is 2.07, which is almost equivalent to “low practice”. In surveyed organizations, the “minimum” support is provided, and thus, (stay, support) becomes the dominant strategy. As a result, however, many PMRs fall in the category of underperformance.
The game theory model gives another implication. From Table 15, the expected payoff of the organization when it takes the “support” strategy (EPOS) is given as follows:
Its expected payoff associated with the “non-support” strategy (EPON) is given as follows:
In order for “support” to become a better strategy than “non-support”, the next equation should hold:
When , Equation (13) is reduced to Equation (8). As decreases, the value of increases. It is possible to interpret that the minimum organizational support thus becomes feasible at a high probability of , which is partially caused by the high unemployment ratio.
5.5. Simulation of Improvement of Performance Using the Results of Regression Analysis
Here, multiple measures exist to improve the performance of PMRs. One is to provide more effective support by the organization. This is represented by a situation of increasing the value from to (Figure 3a). In this case, is transformed into . As depicted in Figure 3b, it is possible to interpret that an increase in the effectiveness of motivational support is equivalent to setting at the center and rotating each point clockwise by . We transformed all points of and computed the ratio of outperformers. Figure 3c shows the image of its impact. It should be noted that may not become the regression line of transformed data. Its explanation is described in Appendix A.
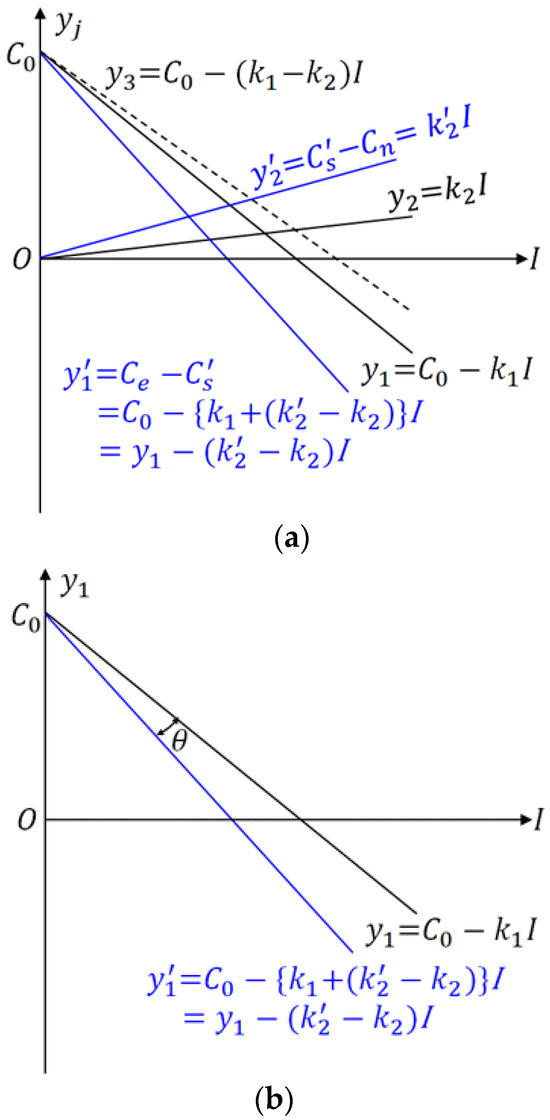
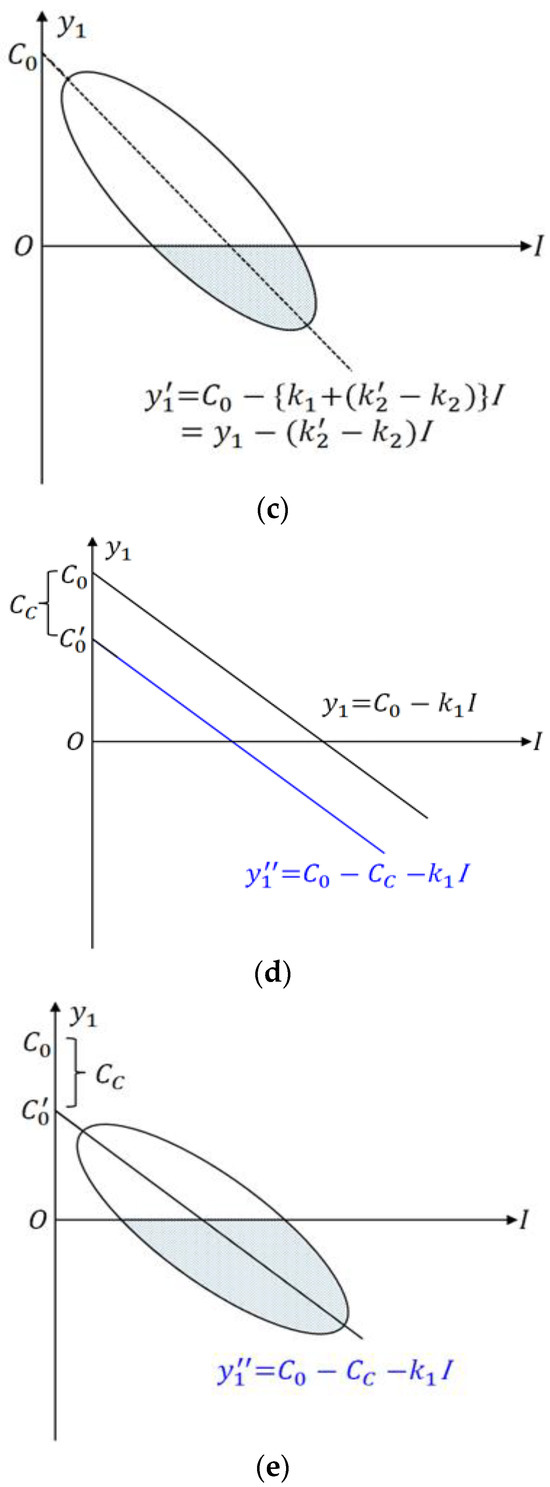
Figure 3.
(a) Provision of More Effective Support. (b) Interpretation of Increase in Effectiveness of Motivational Support. (c) Impact of Increase in Effectiveness of Motivational Support. (d) Change of Constant. (e) Impact of Change of Constant.
Another measure is to change the constant. The line of is expected to be pushed down by and be shifted to (Figure 3d). Its impact is presented with Figure 3e.
Figure 4 shows the results of the preliminary simulation. The horizontal axis represents the rate of change, while the vertical axis shows the ratio of outperformance. The values in the horizontal axis are given as follows:
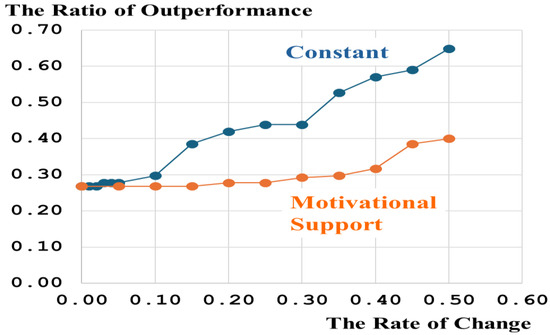
Figure 4.
Simulation Results of Improvement of Performance of PMRs.
These equations represent the changes in Group 1 (motivation factors) and the constant (which has not yet been explained as representing embedded factors), respectively. describes the rate of change in motivation support by comparing the difference between values of and relative to k1. Δconstant describes the rate of change in the constant.
As the rates of change with respect to motivational support and the constant increase, both ratios of outperformers increase. Throughout the range of the rate of change, the constant condition consistently shows a higher ratio of outperformers than the motivational support condition. The results of Figure 4 are considered a reflection of the low Adjusted R Square = 0.064 value of the regression analysis (Table 16). Iroha et al. [7] made two important claims regarding the underperformance of PMRs. First, multiple levels of institutional factors including political factors, weak governance, and organizational culture lower the performance of project managers. It is possible to understand that these factors are included in the constant. Second, there exists a vicious cycle that the underperformance of PMRs implies low motivational support by their organization, which leads to their underperformance. These claims imply the “hypothesis” that the effectiveness of motivational support by organizations is too low to enhance the performance of PMRs. The low Adjusted R Square of the regression analysis and the results of Figure 4 seem to “validate” that motivational support by organizations is one of the measures to improve the performance of PMRs, but its effectiveness is limited, and the impact of multiple levels of institutional factors is large. Identification of the effectiveness of each institutional factor is an important future issue.
6. Conclusions, Suggestions, and Limitations
This study treated the conclusions made by [7] as “hypotheses” and tried to validate them by quantitatively measuring and analyzing project management practices and the performance and commitment of project managers in the Nigerian Construction Industry (NCI). Using data from 206 project managers and organizations, descriptive statistics were obtained to determine project management practices, expected contributions, and actual contributions of project managers (PMRs). Our questions and conclusion are summarized as follows.
The first aim was to identify whether there exist underperformed tasks as compared with organizations’ expectations and which tasks were underperformed. Among 26 tasks that are generally considered project managers’ responsibilities, 16 tasks were underperformed, and 5 tasks were outperformed. Five tasks were neither underperformed nor outperformed. Among the three stages of project management, namely the pre-project, execution, and post-project stages, tasks at the execution stage were most underperformed. Characteristics of underperformed tasks were versatile depending on the level of organizations’ expectations, NPMRs contribution, and actual contribution by PMRs. Although we could not concretely identify the causes of the underperformance of each task, the political pressure and organizational culture to assign certain tasks to NPMRs are considered causes. Particularly, the following eight tasks with low contribution by PMRs need attention concerning their consequences: H&S (A8); equipment, materials, and suppliers (A9); evaluating resource utilization and preparing variance analysis (B2); contractor project evaluation reports (B4); confirming safety and hazard prevention on the site (B5); internal and external reports of the project status (B7); and daily progress reports (B8). For outperformed tasks, autonomy for decision making, professional pride, and a sense of responsibility were raised as key boosters.
The second aim was to study whether the underperformance of PMRs led to low motivational support by their organizations. A total of 26 motivational factors were identified and categorized into three groups: professional development (Group 1), job environment (Group 2), and (Non-) financial support (Group 3). The results of the correlation analyses showed that the degree of underperformance was negatively and significantly correlated with all motivation factors of Group 1 and Group 2. One of the claims by [7] was the existence of a vicious cycle between the underperformance of PMRs and low motivational support by their organizations. Project delays, cost overruns, and even abandonment of many projects are considered a reflection of this vicious cycle. Therefore, it is reasonable to interpret that the results of these correlation analyses represent two-way causal relationships between the underperformance of PMRs and low motivational support.
From this survey, it was found that underperformance of PMRs was observed in 16 tasks out of 26 tasks, and the mean values of motivational support of all factors and Group 1 are 2.64 and 2.07, respectively. In all, 96.1% of surveyed PMRs have stayed at the same organization. Thus, the third aim was to explain why these phenomena occur. We combined a game theory model and regression analysis to explain it. From formulation with a game theory model, (stay, support) emerged as the dominant solution for PMRs and organizations as long as the net contribution of support becomes positive. However, this level of support is not necessarily sufficient for project managers to become outperformers. To address this, the probability that PMRs stay at the same organization was introduced into the model. It was found that as decreased, conditions where “support” by organizations becomes a better strategy became more severe. Currently, . It is thus possible to interpret that the “minimum” organizational support becomes feasible at a high probability, which is partially caused by the high unemployment ratio in Nigeria.
The fourth aim was to discuss how the performance of PMRs can be improved. To do so, we conducted a preliminary simulation by increasing the value of regression coefficients: Group 1 of motivation factors and the constant. The results showed that for the same rate of change with respect to these coefficients, the latter increased the ratio of outperformers to the former. This implies that motivational support by organizations is one of the measures, and its effectiveness in improving the performance of PMRs is limited. Political pressures, weaker enforcement of regulations, and organizational culture, all impacting assigning certain tasks to NPMRs, are considered to hamper the increase in the performance of PMRs.
The second conclusion that the underperformance of project managers caused less organizational support may be considered common sense: Higher performers should be rewarded with more organizational support. It should be noted, however, that concerns were raised that the underperformance of project managers may be influenced not only by their own efforts and organizational support but also by other external factors. Unfortunately, the fourth conclusion shows that our concern was correct. The results of this study reemphasize the importance of a comprehensive approach.
Similar to other studies, this research has some limitations that should be noted for future research. The first limitation is technical in nature. This study concentrated on motivational support as a key variable influencing PMR underperformance. However, as discussed in Section 5, factors such as political influences and organizational culture also contribute largely to underperformance. Future research would benefit from exploring these additional factors to better understand the mechanisms behind PMR underperformance. The second type of limitation relates to sample collection. The study’s findings are based on a relatively small sample of 206 project managers and construction organization respondents in Nigeria, with only 36 interviewees. This limited sample size raises concerns about the representativeness and reliability of the responses, particularly from the few organizational representatives interviewed. Further research with a larger sample of more organizational participants is recommended to collect more data to strengthen conclusions. Moreover, the data collected from four geopolitical regions instead of the six geopolitical regions of Nigeria also represent a limitation. Hence, a broader and more diverse range of data collection will enhance the simplification and reinforce the findings.
Author Contributions
Conceptualization, E.V.I. and T.W.; methodology and software, E.V.I. and T.W.; formal analysis, E.V.I. and T.W.; investigation, E.V.I.; writing—original draft preparation, E.V.I.; writing—review and editing, T.W.; supervision, T.W. and S.T.; project administration, E.V.I., T.W. and S.T.; funding acquisition, T.W. and S.T. All authors have read and agreed to the published version of the manuscript.
Funding
This research received no external funding.
Data Availability Statement
Data supporting the findings of this study can be obtained from the corresponding author upon reasonable request. Due to ethical concerns regarding data privacy and security, the data cannot be made publicly available.
Acknowledgments
The authors gratefully acknowledge the valuable support of the research assistants who collected data in Nigeria. We also extend our sincere appreciation to the directors and heads of departments, especially in the public sector, for their valuable contributions as well as to all the participants of the questionnaire survey. This study was supported by the Kochi University of Technology, Japan.
Conflicts of Interest
The authors declare no conflicts of interest.
Abbreviation
| PMRs | Project managers |
| NCI | Nigerian construction industry |
| PM | Project management |
| NPMRs | Non-project managers |
| KPIs | Key performance indicators |
| SOPs | Standard operating procedures |
| SPSS | Statistical packages for the social sciences |
| ERG | Existence, relatedness, and growth |
| FHA | Federal housing authority |
| NRC | Nigerian Railway Corporation |
| FAAN | Federal airport authority of Nigeria |
| FERMA | Federal roads maintenance agency |
| EPMRs | Expected contributions of project managers |
| APMRs | Actual contributions of project managers |
| AMS | Actual level of motivational support |
| ANPMRs | Actual contributions of non-project managers |
Appendix A
Suppose that we want to represent with the following regression model.
where
is the error vector and is represented with the following:
Setting
where
When we use the ordinary least-square method to obtain the regression coefficients and , they must satisfy the following equations.
Solving Equations (A1) and (A2) yields the following:
where
Suppose the components of and are given by and , respectively. The pair of and is represented with point in the x-y coordinate.
Now, we rotate this point by clockwise. This point is move to the following:
Thus, after rotation, new vectors and are given by the following:
The following equations are satisfied:
Thus, we obtain new regression coefficients and as follows:
When , and hold.
References
- Mamman, E.J.; Umesi, E.R. Causes and effects of delay on public construction projects delivery in Nigeria. Afr. Sch. J. Built Environ. Geol. Res. 2022, 24, 4. [Google Scholar]
- Awojobi, O.N.; Ayakpat, J.; Adisa, O.D. Rebased Nigerian gross domestic product: The role of the informal sector in the development of the Nigerian economy. Int. J. Educ. Res. 2014, 2, 301–316. [Google Scholar]
- Alade, K.T.; Lawal, A.F.; Omonori1, A.A.; Olowokere, E.A. Causes and Effects of Delays in Construction Projects in Akure, Ondo State, Nigeria. FUTA J. Manag. Technol. 2016, 29–38. [Google Scholar]
- Obebe, S.B.; Kolo, A.; Enagi, I.S.; Adamu, A.A. Failure In Contracts In Nigerian Construction Projects: Causes And Proffered Possible Solutions. Int. J. Eng. Appl. Sci. Technol. 2020, 5, 679–692. [Google Scholar] [CrossRef]
- Dalibi, S.G. Resultant Effects of Poor Supervision in Construction Projects in Nigeria. In Proceedings of the 6th Building and Construction Economic Round Table, Abuja, Nigeria, 14–15 June 2016. [Google Scholar]
- Olateju, O.I.; Abdul-Azeez, I.A.; Alamutu, S.A. Project management practice in nigerian public sector—An empirical study. Aust. J. Bus. Manag. Res. 2011, 1, 1. [Google Scholar]
- Iroha, E.V.; Watanabe, T.; Satoshi, T. Flawed Institutional Structures: Project Managers Underutilized in Nigeria’s Construction Industry. Buildings 2024, 14, 807. [Google Scholar] [CrossRef]
- Usman, N.D.; Inuwa, I.I.; Iro, A.I.; Dantong, S. The influence of unethical professional practices on the management of construction projects in North Eastern states of Nigeria. Int. J. Econ. Dev. Res. Investig. 2012, 3, 124–129. [Google Scholar]
- Kasimu, A.M.; Isah, A.D. Causes of delay in Nigeria construction industry. Interdiscip. J. Contemp. Res. Bus. 2012, 4, 2. [Google Scholar]
- Bello-Schünemann, J.; Porter, A. Porter, Building the Future Infrastructure in Nigeria Until 2040. 2017. Available online: https://issafrica.s3.amazonaws.com/site/uploads/war-21.pdf (accessed on 14 May 2024).
- Unegbu, H.C.; Yawas, D.; Dan-asabe, B. An Assessment of the Literature on the Performance of Construction Projects in Nigeria. J. Mek. 2023, 46, 27–38. [Google Scholar] [CrossRef]
- Sharafadeen, O.; Owolabi, B.; Olayinka, A.O. Delay of Building Construction Projects in Nigeria—A Review of Causes, Effects and Solutions. Int. J. Eng. Sci. Manag. Res. 2015, 2, 10. [Google Scholar]
- Daniel, C.O.; Ibrahim, A.U. Project failure and its influence on the performance of construction firms in Nigeria. Int. J. Res. Bus. Econ. Manag. 2019, 3, 86–95. [Google Scholar]
- Werigbelegha, A.P.; Tamunosiki, J.O. The issues and challenges of project management and evaluation in Nigeria. J. Arts Manag. Soc. Sci. 2017, 2, 142–148. [Google Scholar]
- Yahya, M.Y.; Abba, W.A.; Mohamed, S.; Yassin, A.M. Contributing factors of poor construction project performance in Nigeria. Int. J. Prop. Sci. 2019, 9, 1–11. [Google Scholar] [CrossRef]
- Olawale, S.B.; Okesoto, J.O.; Alabi, J.O.; Alabi, O.T.; Iyanda, O.; Aladedokun, T.A. Motivation impacts on Nigerian construction industry workers’ efficiency. Global Sci. J. 2023, 11, 2320–9186. [Google Scholar]
- Ezeokoli, F.O.; Bert-Okonkwor, C.B.N.; Okongwu, M.I.; Fadumo, D.O.; Ohaedeghasi, C.I.; Okoye, N.M. Factors Confronting the Present-Day Construction Practices in South-East, Nigeria: The Professionals’ View. J. Build. Constr. Plan. Res. 2021, 9, 160–169. [Google Scholar] [CrossRef]
- Giri, O.P. Study on the role of project manager in improving the project performance. Technol. J. 2019, 1, 133–139. [Google Scholar] [CrossRef]
- Shenhar, A.J.; Dvir, D.; Levy, O.; Maltz, A.C. Project success: A multidimensional strategic concept. Long-Range Plan. 2001, 34, 699–725. [Google Scholar] [CrossRef]
- Takagi, N.; Varajão, J.; Ventura, T.; Ubialli, D.; Silva, T. Managing success criteria and success factors in a BPM project: An approach using PRINCE2 and Success Management on the public sector. Cogent Bus. Manag. 2024, 11, 2336273. [Google Scholar] [CrossRef]
- Crawford, L.; Pollack, J.; England, D. Uncovering the trends in project management: Journal emphases over the last 10 years. Int. J. Proj. Manag. 2006, 24, 175–184. [Google Scholar] [CrossRef]
- Radujković, M.; Sjekavica, M. Project management success factors. Proc. Eng. 2017, 196, 607–615. [Google Scholar] [CrossRef]
- Ihuah, P.W.; Kakulu, I.I.; Eaton, D. A review of Critical Project Management Success Factors (CPMSF) for sustainable social housing in Nigeria. Int. J. Sustain. Built Environ. 2014, 3, 62–71. [Google Scholar] [CrossRef]
- Crawford, L. Senior management perceptions of project management competence. Int. J. Proj. Manag. 2005, 23, 7–16. [Google Scholar] [CrossRef]
- Turner, J.R.; Müller, R. The project manager’s leadership style as a success factor on projects: A literature review. Proj. Manag. J. 2005, 36, 49–61. [Google Scholar] [CrossRef]
- Aga, D.A.; Noorderhaven, N.; Vallejo, B. Transformational leadership and project success: The mediating role of team-building. Int. J. Proj. Manag. 2016, 34, 806–818. [Google Scholar] [CrossRef]
- Cartwright, C.; Yinger, M. Project management competency development framework—Second edition. In Proceedings of the PMI® Global Congress 2007—EMEA, Budapest, Hungary, 14–16 May 2007; Project Management Institute: Newtown Square, PA, USA, 2007. [Google Scholar]
- Kazaz, A.; Manisali, E.; Ulubeyli, S. Effect of Basic Motivational Factors on Construction Workforce Productivity in Turkey. J. Civ. Eng. Manag. 2008, 14, 95–106. [Google Scholar] [CrossRef]
- Goyal, P.K. Motivation: Concept, theories, and practical implications. Int. Res. J. Commerce Arts Sci. 2015, 6, 71–78. [Google Scholar]
- Chruden, H.J.; Sherman, A.W. Personnel Management, 2nd ed.; South-Western Publishing Co.: Mason, OH, USA, 1963. [Google Scholar]
- Manzoor, Q.A. Impact of employees motivation on organizational effectiveness. Bus. Manag. Strategy 2012, 3, 1–12. [Google Scholar] [CrossRef]
- Maslow, A.H. A theory of human motivation. Psychol. Rev. 1943, 50, 370. [Google Scholar] [CrossRef]
- Herzberg, F.A.; Mausner, B.; Sherwitz, L. The Motivation of Work; John Wiley: New York, NY, USA, 1959. [Google Scholar]
- Oyedele, L.O. Sustaining architects’ and engineers’ motivation in design firms: An investigation of critical success factors. Eng. Constr. Archit. Manag. 2010, 17, 180–196. [Google Scholar] [CrossRef]
- Alderfer, C.P. An empirical test of a new theory of human needs. Organ. Behav. Hum. Perform. 1969, 4, 142–175. [Google Scholar] [CrossRef]
- Griffin, R.; Moorhead, G. Organizational Behavior: Managing People and Organizations, 9th ed.; Macmillan Publishing Solutions: Columbus, OH, USA, 2011. [Google Scholar]
- Kopelman, R.E.; Prottas, D.J.; Falk, D.W. Construct validation of a Theory X/Y behavior scale. Leadersh. Organ. Dev. J. 2010, 31, 120–135. [Google Scholar] [CrossRef]
- Vroom, V.H. Work and Motivation; John Wiley: New York, NY, USA, 1964. [Google Scholar]
- Wanous, J.P.; Keon, T.L.; Latack, J.C. Expectancy theory and occupational/organizational choices: A review and test. Organ. Behav. Hum. Perform. 1983, 32, 66–86. [Google Scholar] [CrossRef]
- Sabo, E.T.L. Effect of Motivational Factors on Workers Productivity in Construction Industry in jos, Plateau State–Nigeria. Int. J. Adv. Eng. Manag. 2022, 4, 1339–1350. [Google Scholar]
- Soetanto, C.H.; Soetanto, R. Motivating factors in UK construction projects. In Proceedings of the Third International World of Construction Project Management Conference, Coventry, UK, 20–22 October 2010; Coventry University: Coventry, UK, 2010. [Google Scholar]
- Gonzales, K.; Asadi, S.; Leicht, R. Exploring Project Manager Motivations in the Construction Industry. In Proceedings of the Construction Research Congress 2016, San Juan, Puerto Rico, May 31–2 June 2016; Volume 10, pp. 1917–1926. [Google Scholar]
- Marisa, A.; Yusof, N.A. Motivation among the managers in construction companies. Int. J. Adv. Eng. Manag. 2012, 6, 166–170. [Google Scholar]
- Ahmed, R.; Philbin, S.P. It takes more than the project manager: The importance of senior management support for successful social sector projects. Proj. Leadersh. Soc. 2022, 3, 100042. [Google Scholar] [CrossRef]
- Al-Abbadi, G.M.D.; Agyekum-Mensah, G. Agyekum-Mensah, The effects of motivational factors on construction professionals productivity in Jordan. Int. J. Constr. Manag. 2022, 22, 820–831. [Google Scholar]
- Opara, V.I.; Apete-Adebola, L.A.; Sofolahan, O.; Akinsanya, A.Y. Effects of Motivation of Operatives on Productivity in the Nigeria Construction Industry. In Proceedings of the 10th-anniversary conference West Africa Built Environment Research (WABER), Accra, Ghana, 5–7 August 2019. [Google Scholar]
- Pathirage, C.P.; Amaratunga, D.G.; Haigh, R.P. Tacit knowledge and organizational performance: Construction industry perspective. J. Knowl. Manag. 2007, 11, 115–126. [Google Scholar] [CrossRef]
- Moser, C.A.; Kalton, G. Survey Methods in Social Investigation, 3rd ed.; Routledge: New York, NY, USA, 2016. [Google Scholar]
- Naoum, S.G. Dissertation Research and Writing for Construction Students, 3rd ed.; Butterworth-Heinemann: Oxford, UK, 1998. [Google Scholar]
- Tam, N.V.; Watanabe, T.; Hai, N.L. Importance of Autonomous Motivation in Construction Labor Productivity Improvement in Vietnam: A Self-Determination Theory Perspective. Buildings 2022, 12, 763. [Google Scholar] [CrossRef]
- King, G.; Keohane, R.O.; Verba, S. Designing Social Inquiry: Scientific Inference in Qualitative Research; Princeton University Press: Princeton, NJ, USA, 2012. [Google Scholar]
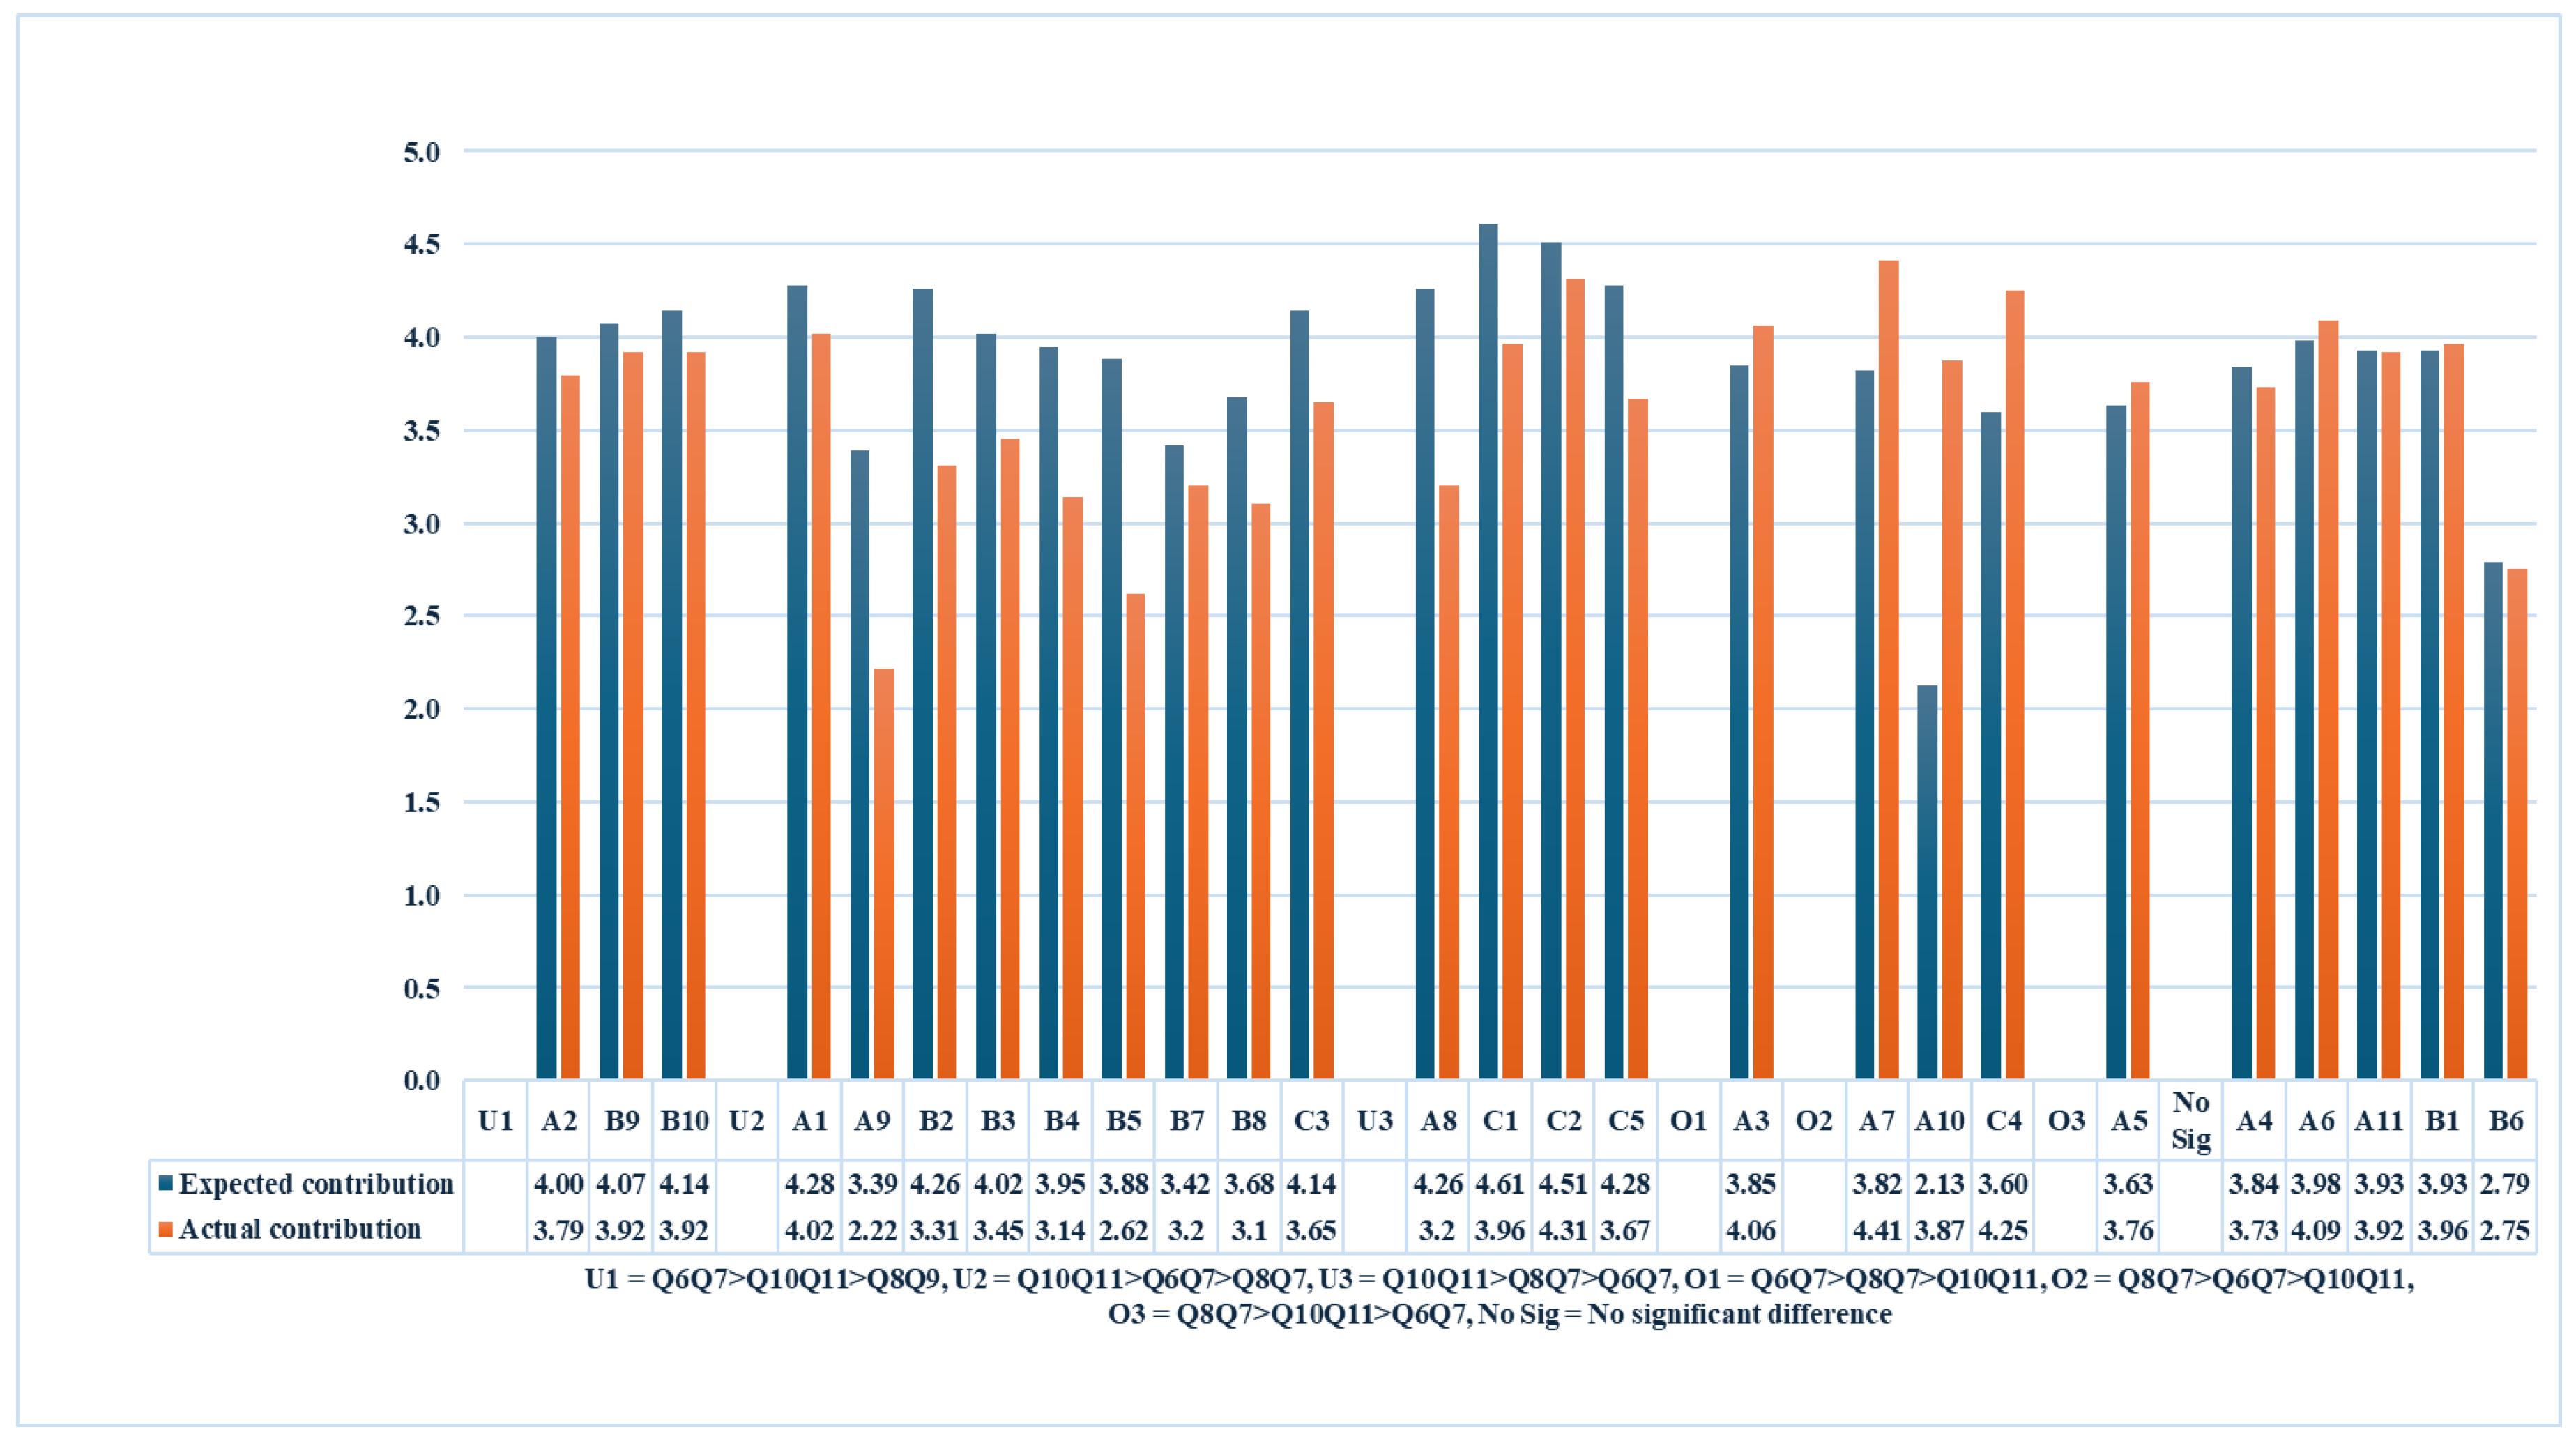
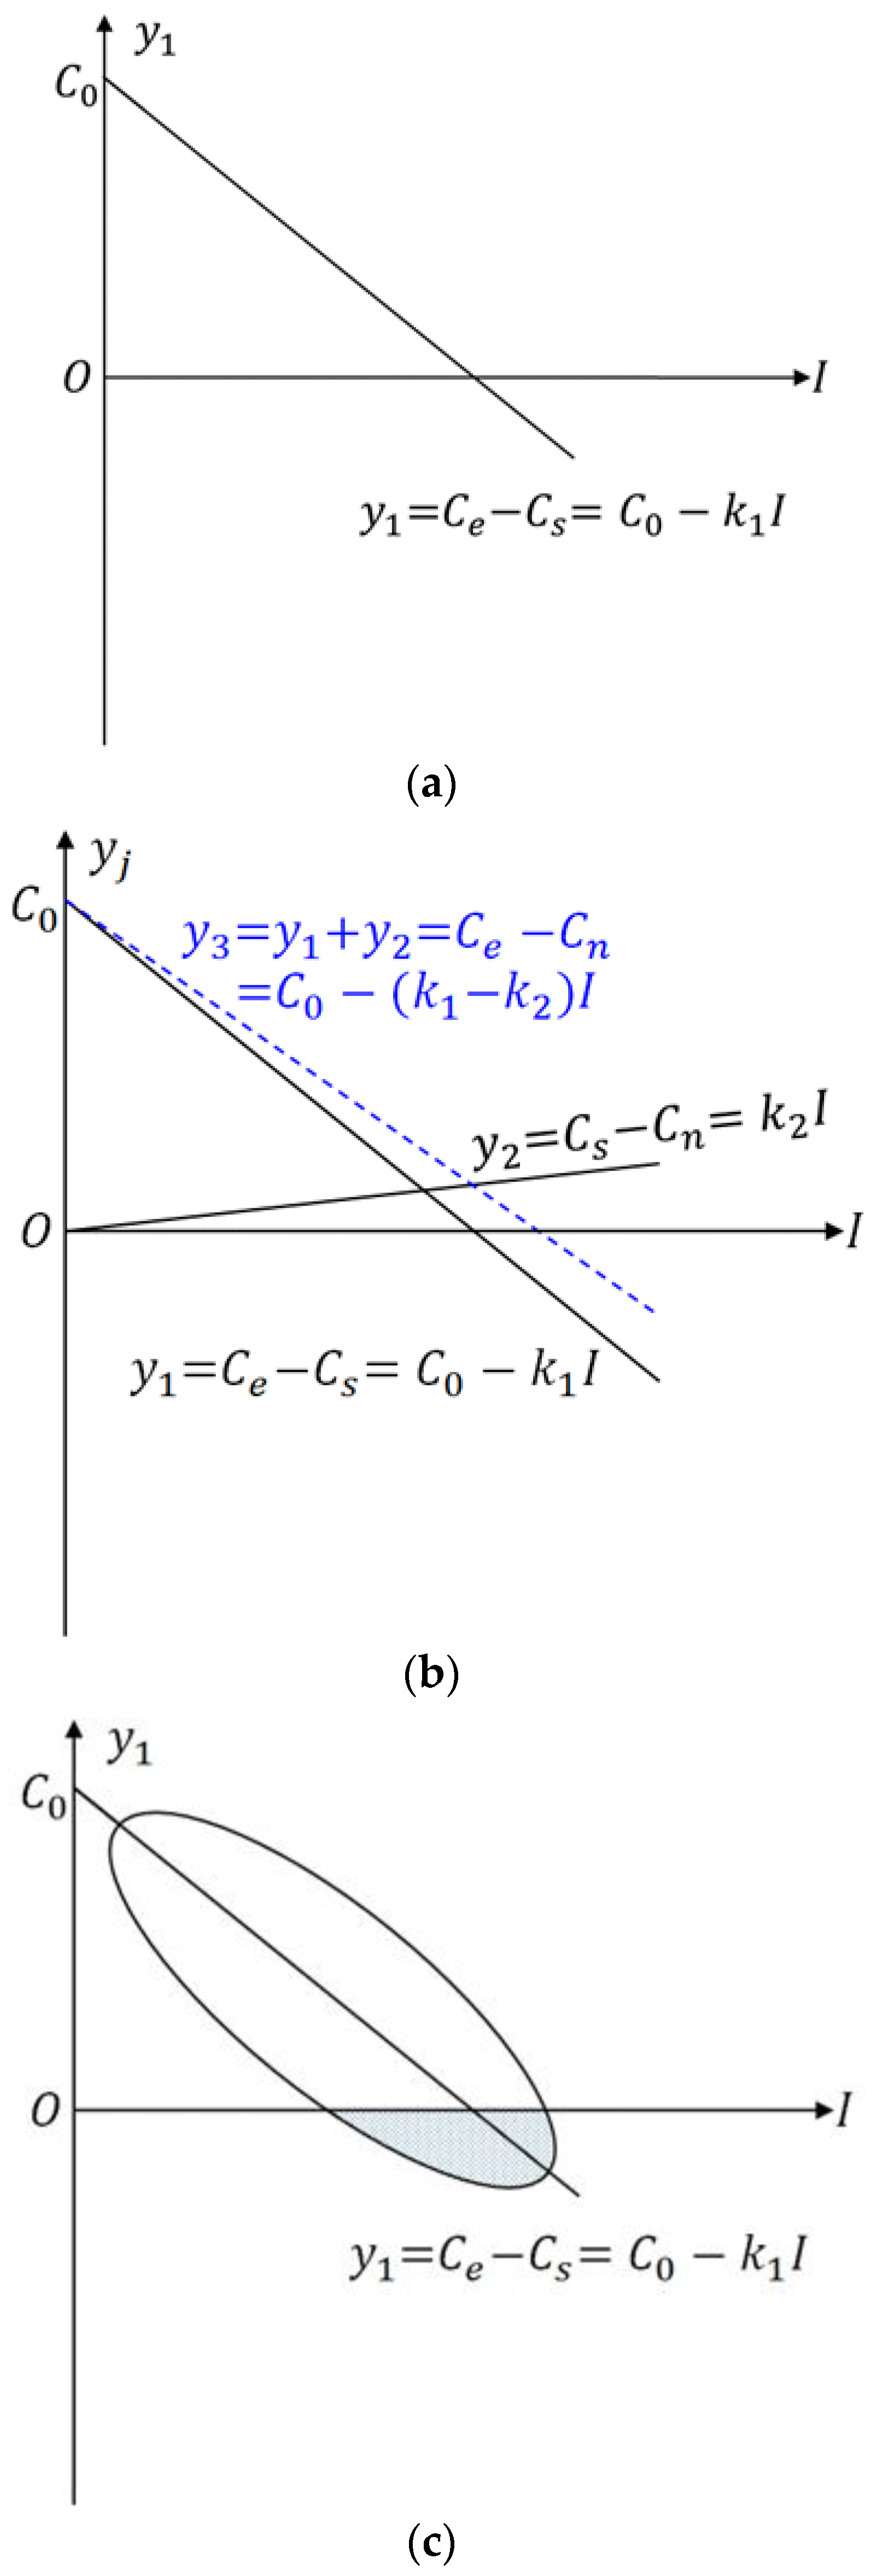
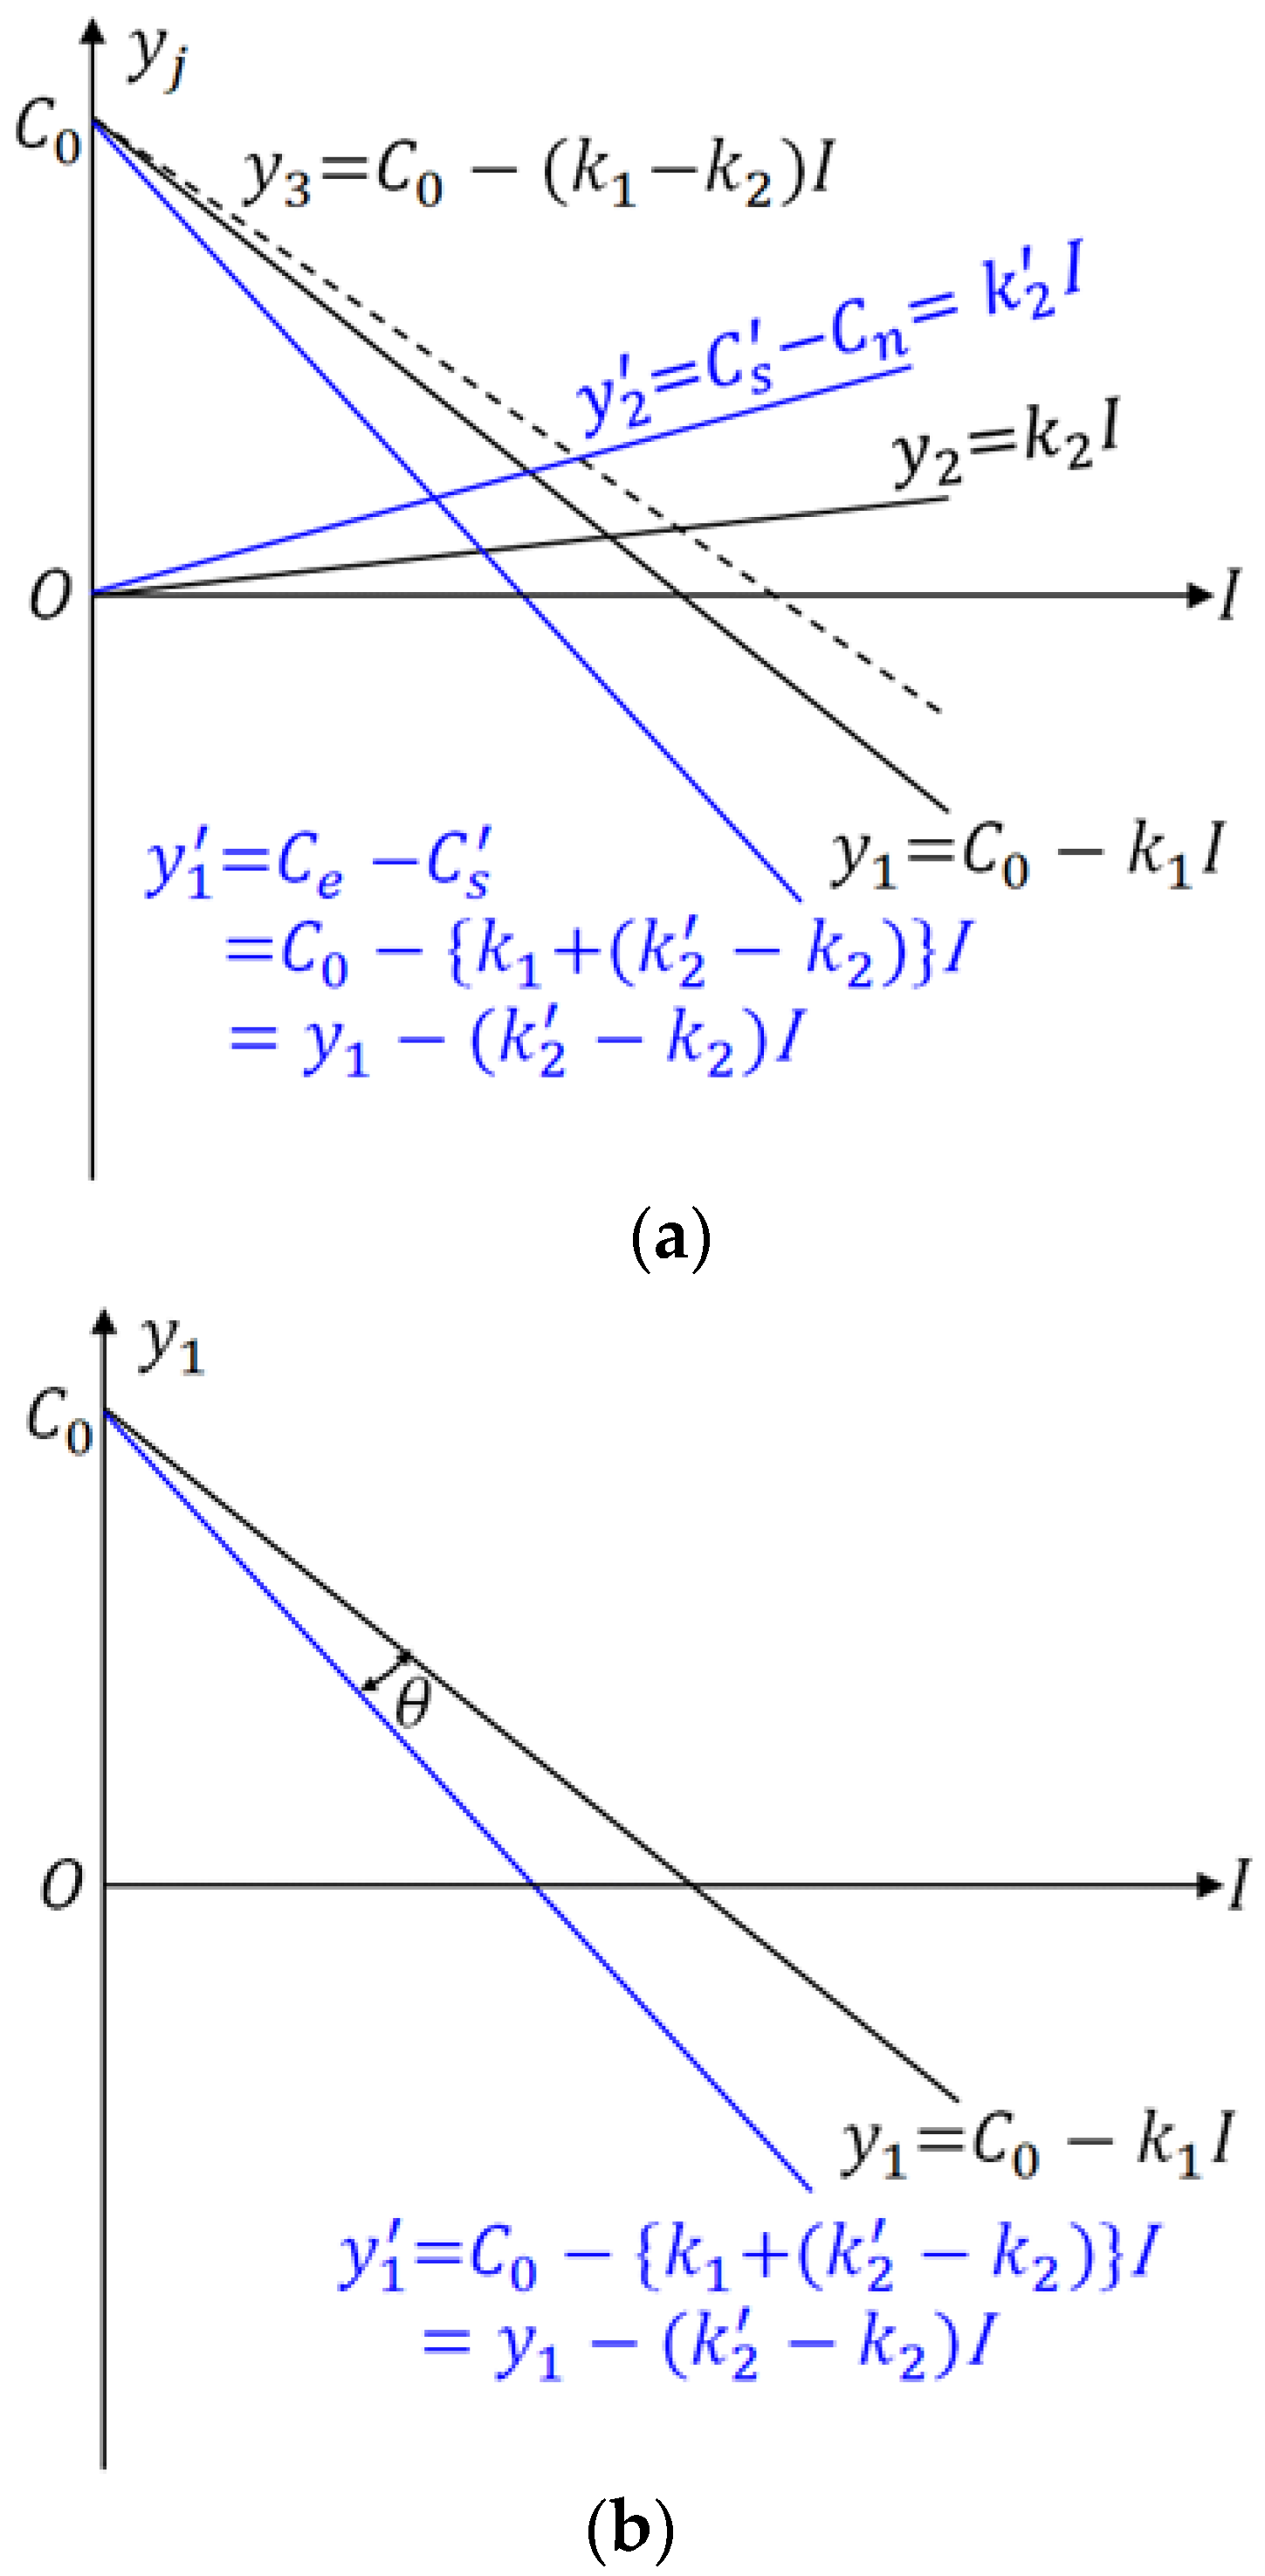
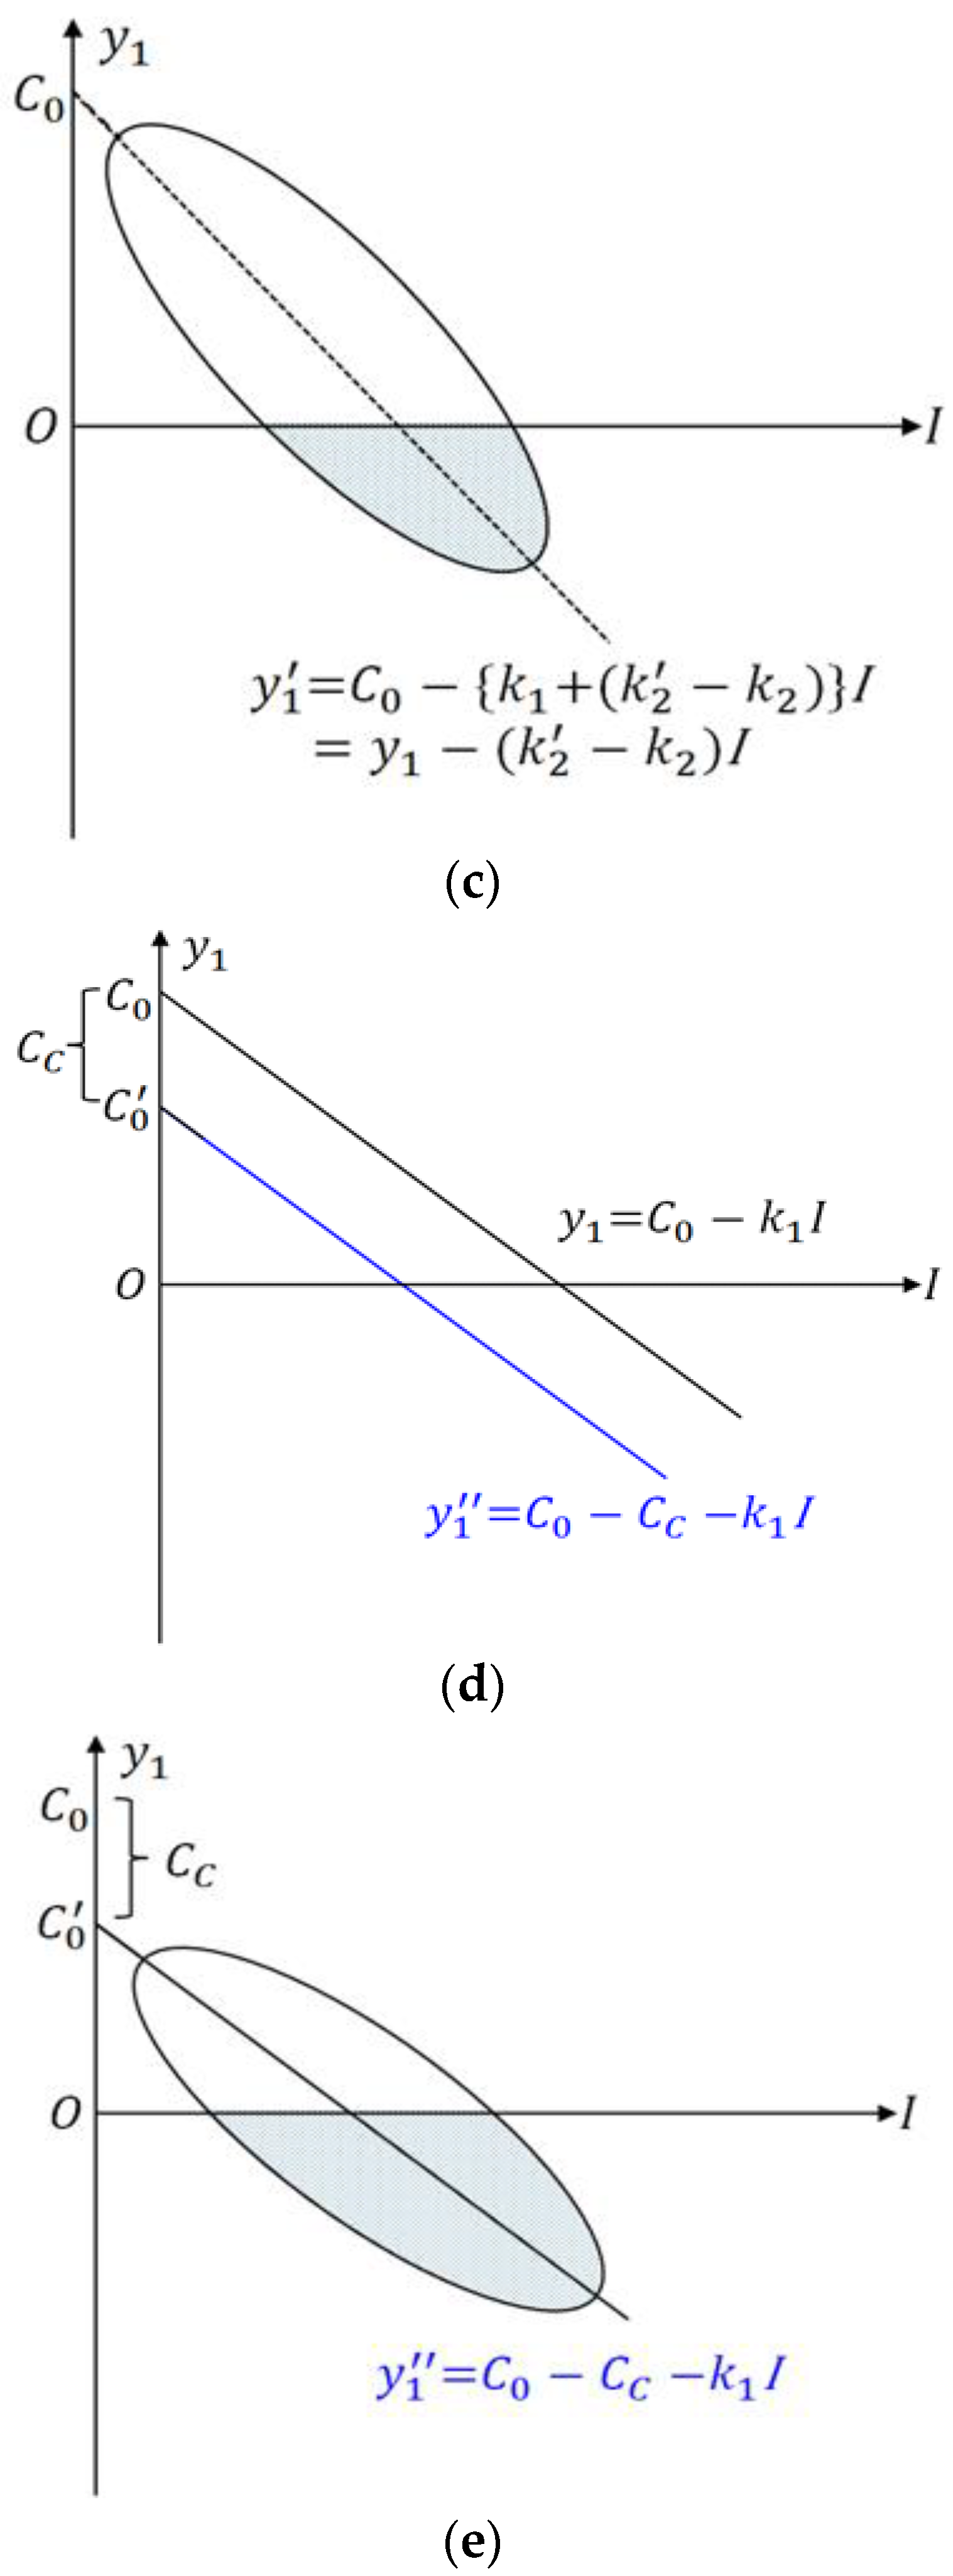
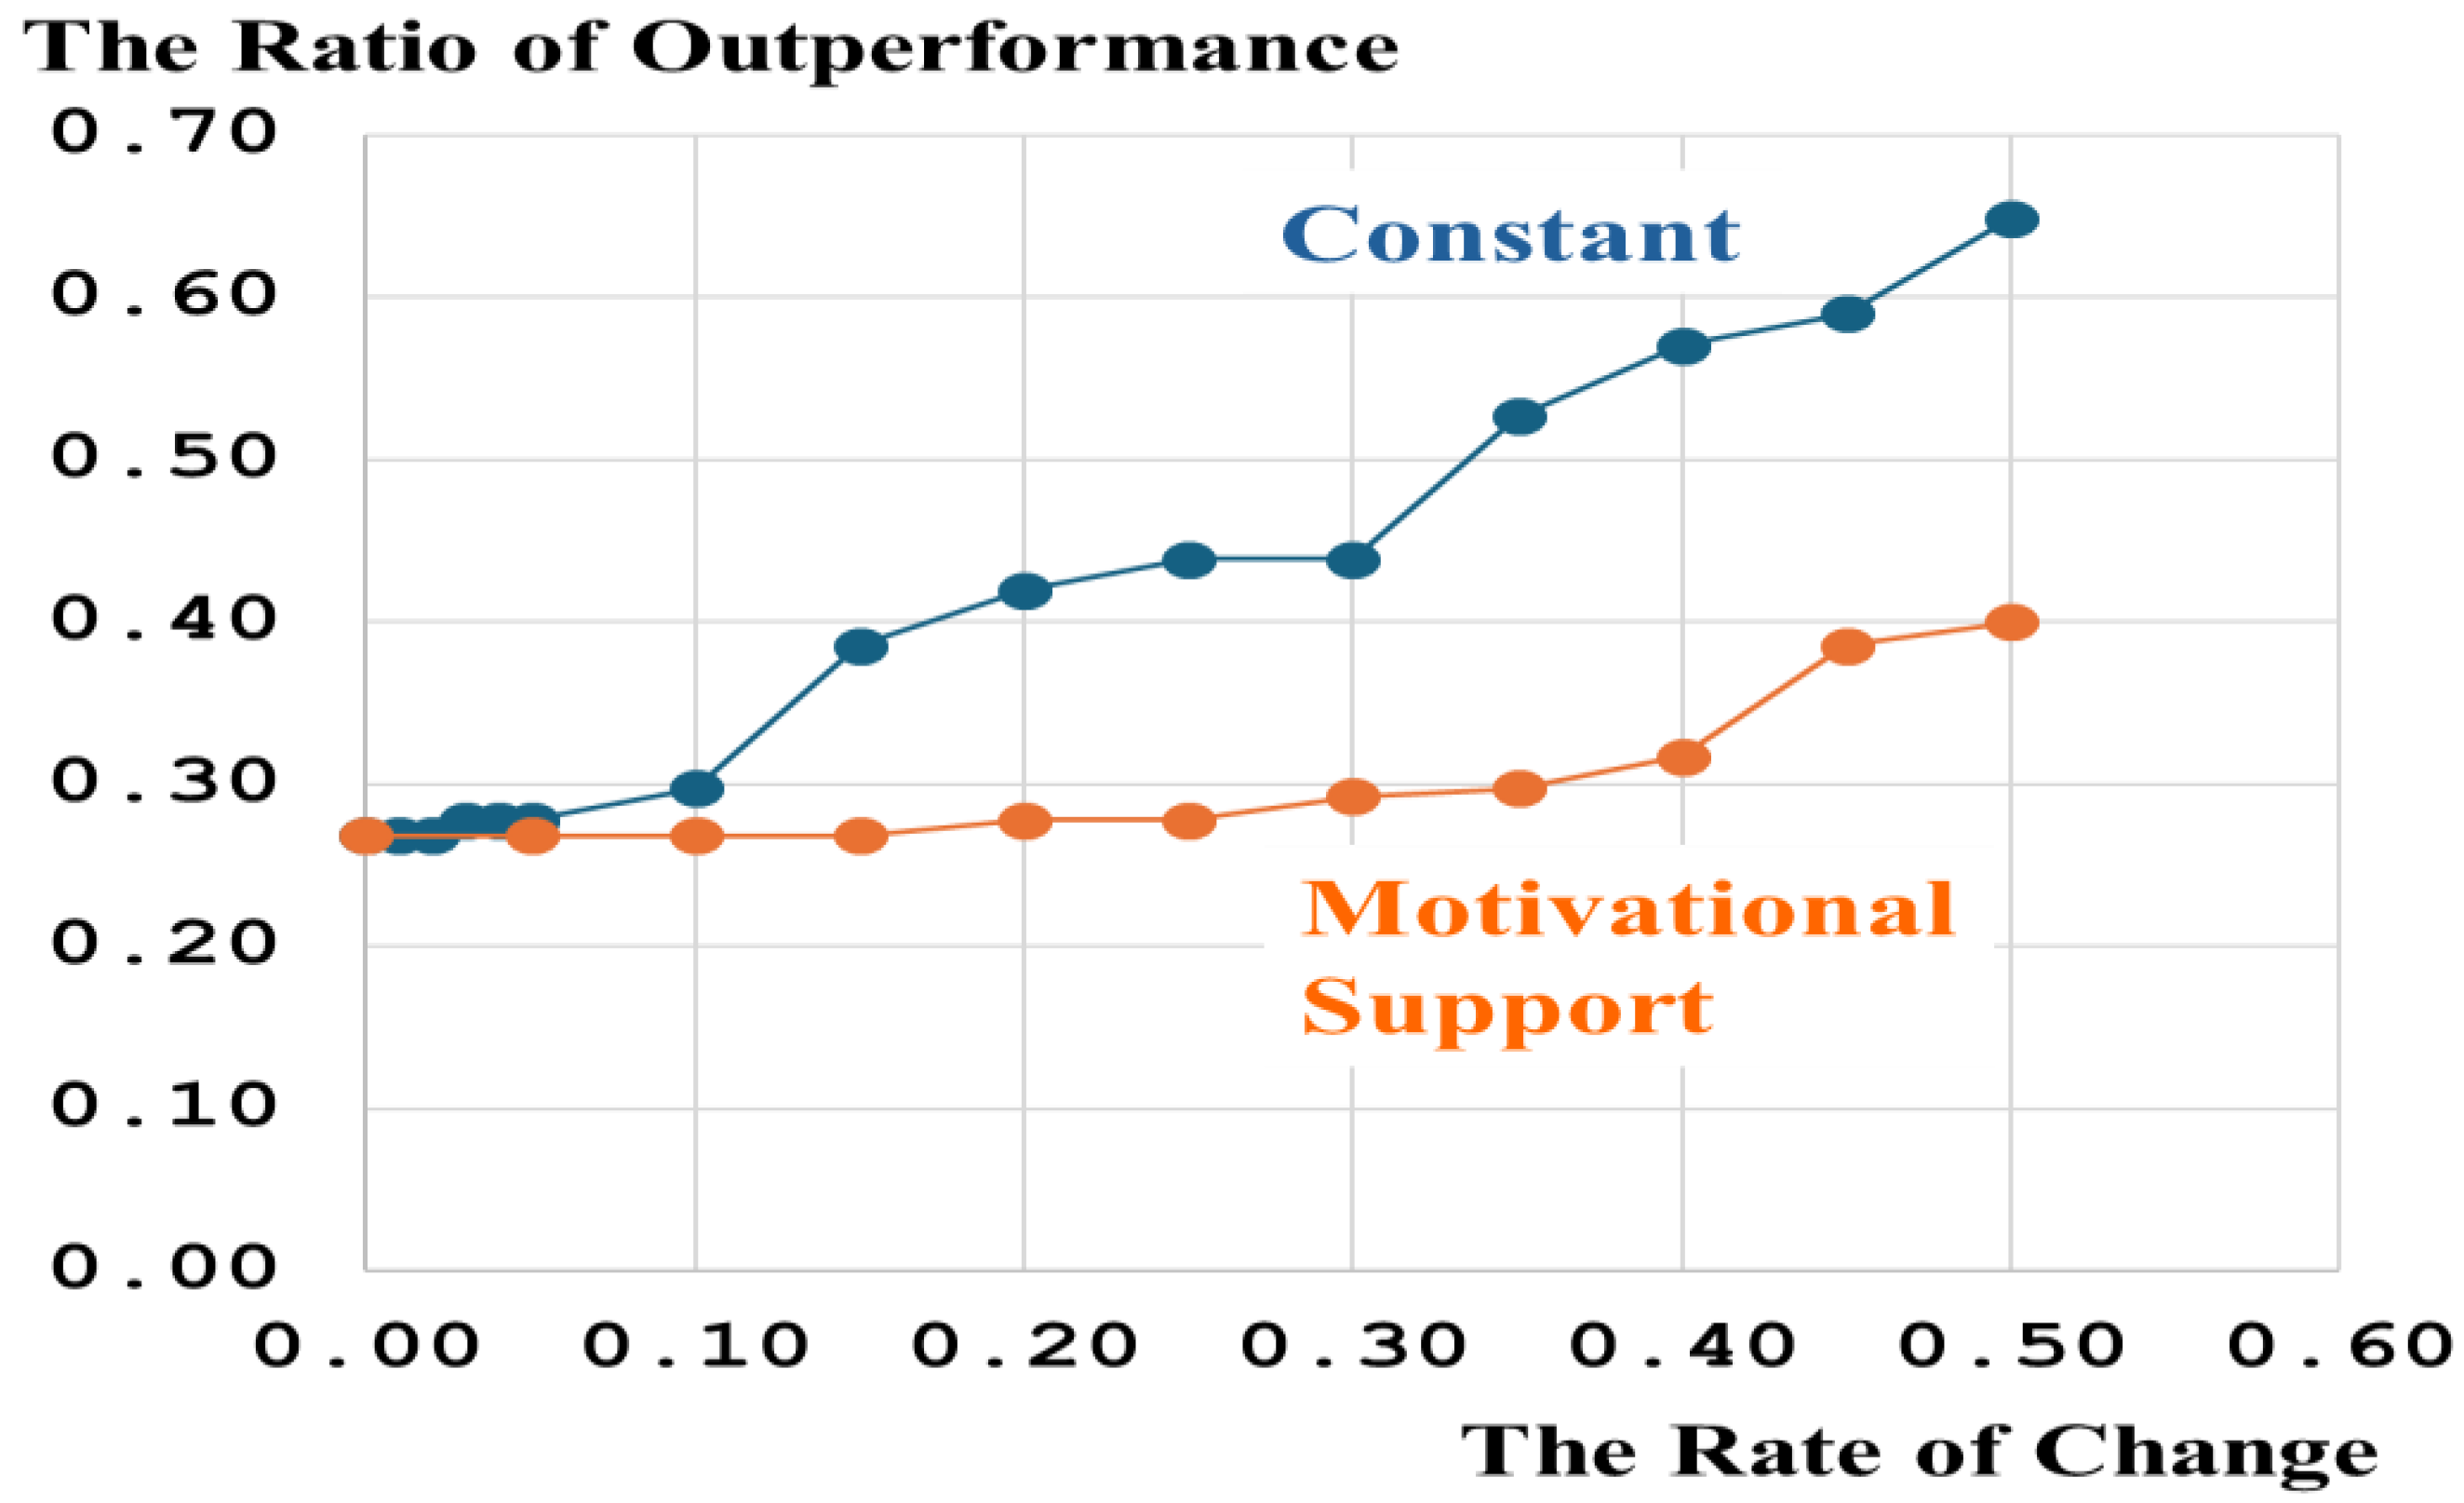
Disclaimer/Publisher’s Note: The statements, opinions and data contained in all publications are solely those of the individual author(s) and contributor(s) and not of MDPI and/or the editor(s). MDPI and/or the editor(s) disclaim responsibility for any injury to people or property resulting from any ideas, methods, instructions or products referred to in the content. |
© 2024 by the authors. Licensee MDPI, Basel, Switzerland. This article is an open access article distributed under the terms and conditions of the Creative Commons Attribution (CC BY) license (https://creativecommons.org/licenses/by/4.0/).