Article

Delayed-Action Mechanism of Buckling-Restrained Brace Using Gusset Plates with Multiple Slot Holes

1
Graduate School of Advanced Science and Engineering, Hiroshima University, Higashi-Hiroshima 739-8527, Japan
2
Structural Design Deptpartment, Tekken Corporation, Chiyoda Ward, Tokyo 101-8366, Japan
3
Architectural Technology Deptpartment, Tekken Corporation, Chiyoda Ward, Tokyo 101-8366, Japan
*
Author to whom correspondence should be addressed.
Buildings 2024, 14(9), 2698; https://doi.org/10.3390/buildings14092698
Submission received: 17 July 2024 / Revised: 15 August 2024 / Accepted: 27 August 2024 / Published: 29 August 2024
(This article belongs to the Section Building Structures)

Abstract

:
Previous research has indicated that buckling-restrained braces (BRBs) increase the lateral story stiffness, resulting in a shortening of the natural period, which leads to an increase in the seismic input into the buildings, especially in high-rise buildings. Additionally, research has also revealed that the long-period seismic motions with a long duration possibly induce a difficulty to ensure the toughness of the BRB members, owing to the large cumulative strains caused by the repeated axial forces. To overcome these issues, this paper proposed a displacement-restraint buckling-restrained brace (DR-BRB) in which no axial force appears initially, and the axial force occurs with a delay under the designated vibration amplitude. Therefore, the natural period can maintain the same level as the moment frame. This study performed five cyclic loading tests to reveal the delayed-action mechanism of BRBs, using gusset plates with multiple slot holes. The test results confirmed that the designated starting point of the brace action is accurate, and the hysteretic behavior of the brace is good. Furthermore, the design equations of the joints were formulated and verified through the test results. Finally, the joint behavior and validity of the proposed design equations were verified by finite element analyses for the single bolt model and the overall joint model.

1. Introduction

Many building structures have been severely damaged in recent large-scale earthquakes. The experiences from these seismic damages have led to an increase in the use of a vibration control system, especially in high-rise buildings and large-scale buildings, which can maintain the high functionality of buildings after strong seismic events. Among the various types of vibration control systems, buckling-restrained braces (BRBs) were adopted in a large number of buildings as damping members for dissipating seismic energy. Previous research [1] has indicated that BRBs increase the lateral story stiffness, resulting in a shortening of the natural period of the building, which increases the seismic energy input to the building, especially in high-rise buildings. Moreover, another study [2] revealed that the long-period seismic motions with a long duration make it difficult to ensure the toughness of the BRB members, owing to the large cumulative strains caused by repeated axial forces. To overcome these issues, this study incorporated the concept of delayed bracing action. Previous studies examined the usage of long cable bracing [3,4,5,6,7,8,9] in which the cable members were slacked or bundled. The steel rod members slacked initially [10] were adopted as delayed bracing members for high-rise building structures.
Figure 1 depicts a fundamental concept of the displacement-restraint (DR) bracing as represented with the seismic force and story drift relationships [3,10]. Within the small story drift range at an early stage of the seismic event, no axial force appears in the brace to take advantage of the bare moment frame in which the seismic energy is dissipated at the frame elements such as the beam-end portions. The axial strain in the brace member can then be minimized to enable it to function in the larger structural vibration. When the story drift reaches the designated value owing to the increase in the seismic force, the brace member acts with a delay to restrain the unacceptably large story drift and prevent collapse. Some benefits of DR bracing have been demonstrated using the 20-story steel buildings [10] in which the story drift amplification in some stories, induced in the bare moment frame, can be reduced by the delayed bracing action, as presented in Figure 2. Watanabe et al. [11] investigated the response control design of moment-resisting steel frames using DR bracing.
This study proposes a DR-BRB with double steel core plates using a hexagonal cross section, the buckling-restraining member made of an aluminum alloy extrusion. To implement the delayed bracing action, gusset plates with multiple slot holes were adopted. The application of slot holes to the double stage yielding bracing has been investigated in previous studies [12,13,14,15,16,17]. The friction damper implemented in the bracing also applies the slot holes to provide a sliding surface along the holes [18,19,20]. The friction pad has been applied to the beam–column joints using steel plates with slot holes [21,22]. The DR-BRBs proposed in this study have a mechanism to control the delayed bracing action by installing several slot holes in the gusset plates at the brace end connections. An important feature of the BRBs proposed in this study are their double core plates to transmit the axial force smoothly. BRBs with two core plates have been investigated in some studies [23,24,25].
This paper presents the cyclic loading test results of the proposed DR-BRBs using full-scale models in which the delayed-action mechanism was implemented by using gusset plates with multiple slot holes. The accuracy of the delayed bracing action and the plastic deformation of both the BRB and the slot hole surface are demonstrated and discussed. Then, the design method of brace members and joint configurations is described. Furthermore, some finite element analysis results are presented and discussed to reveal the detailed performance of the delayed-action mechanism.

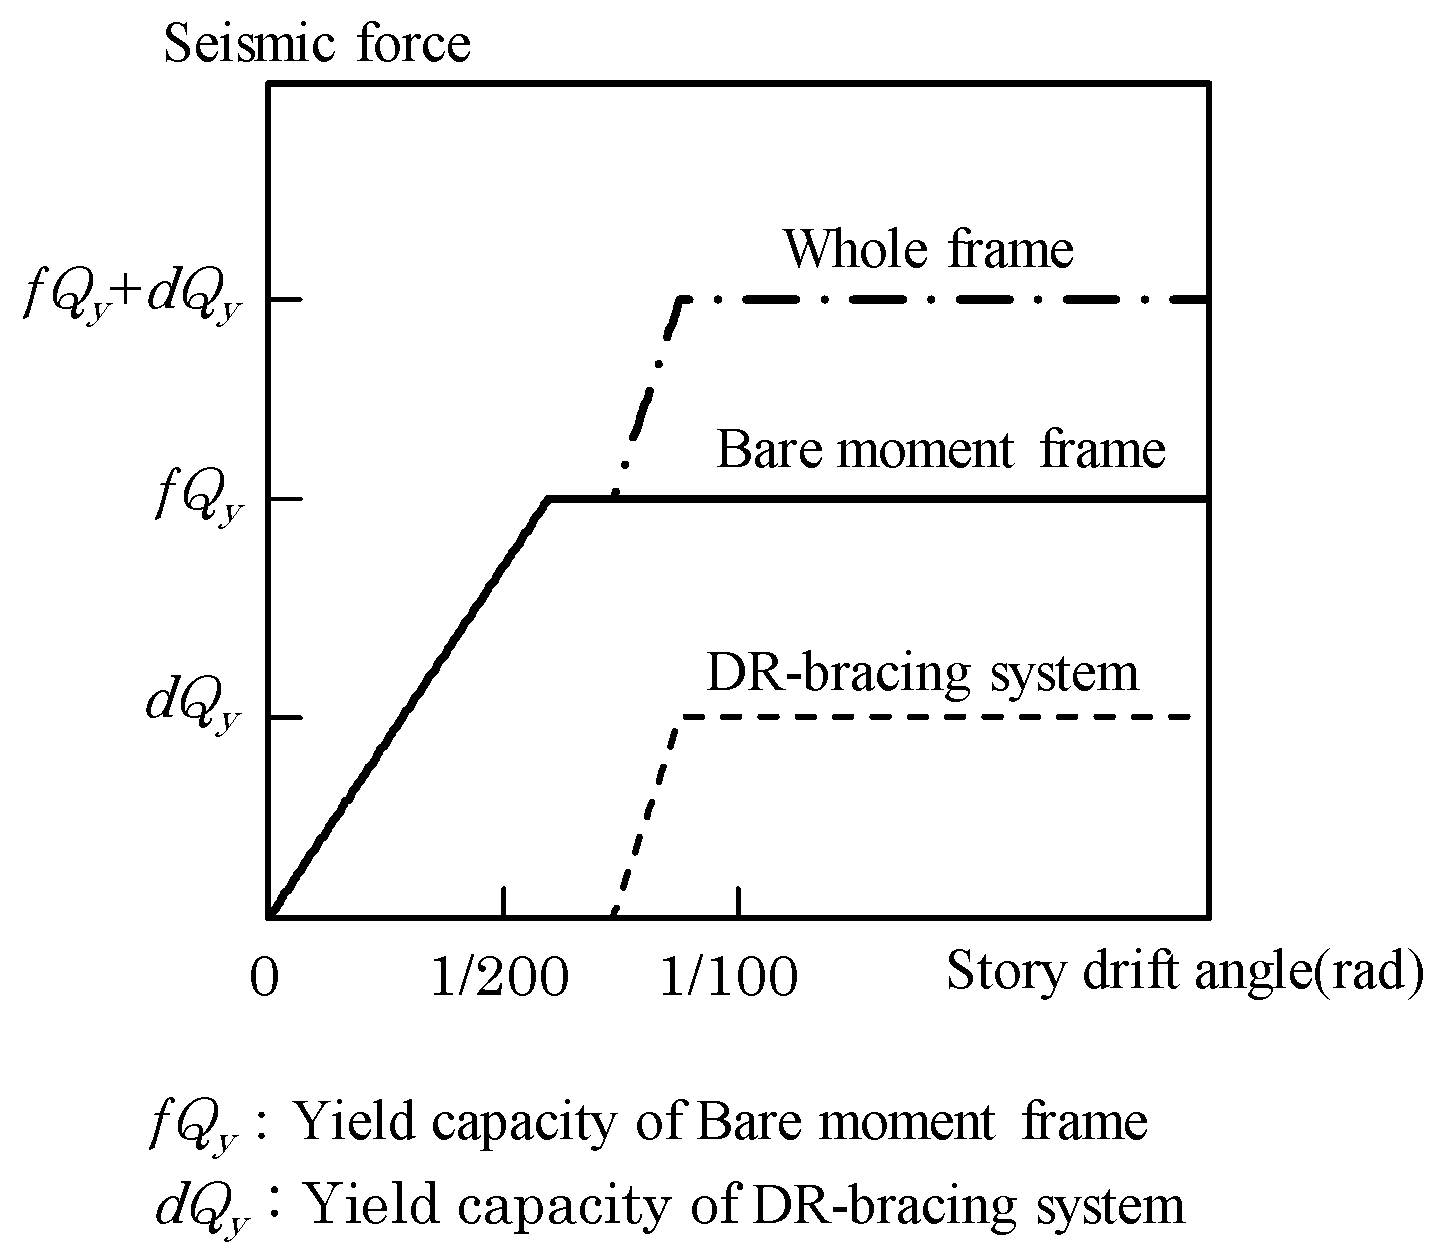
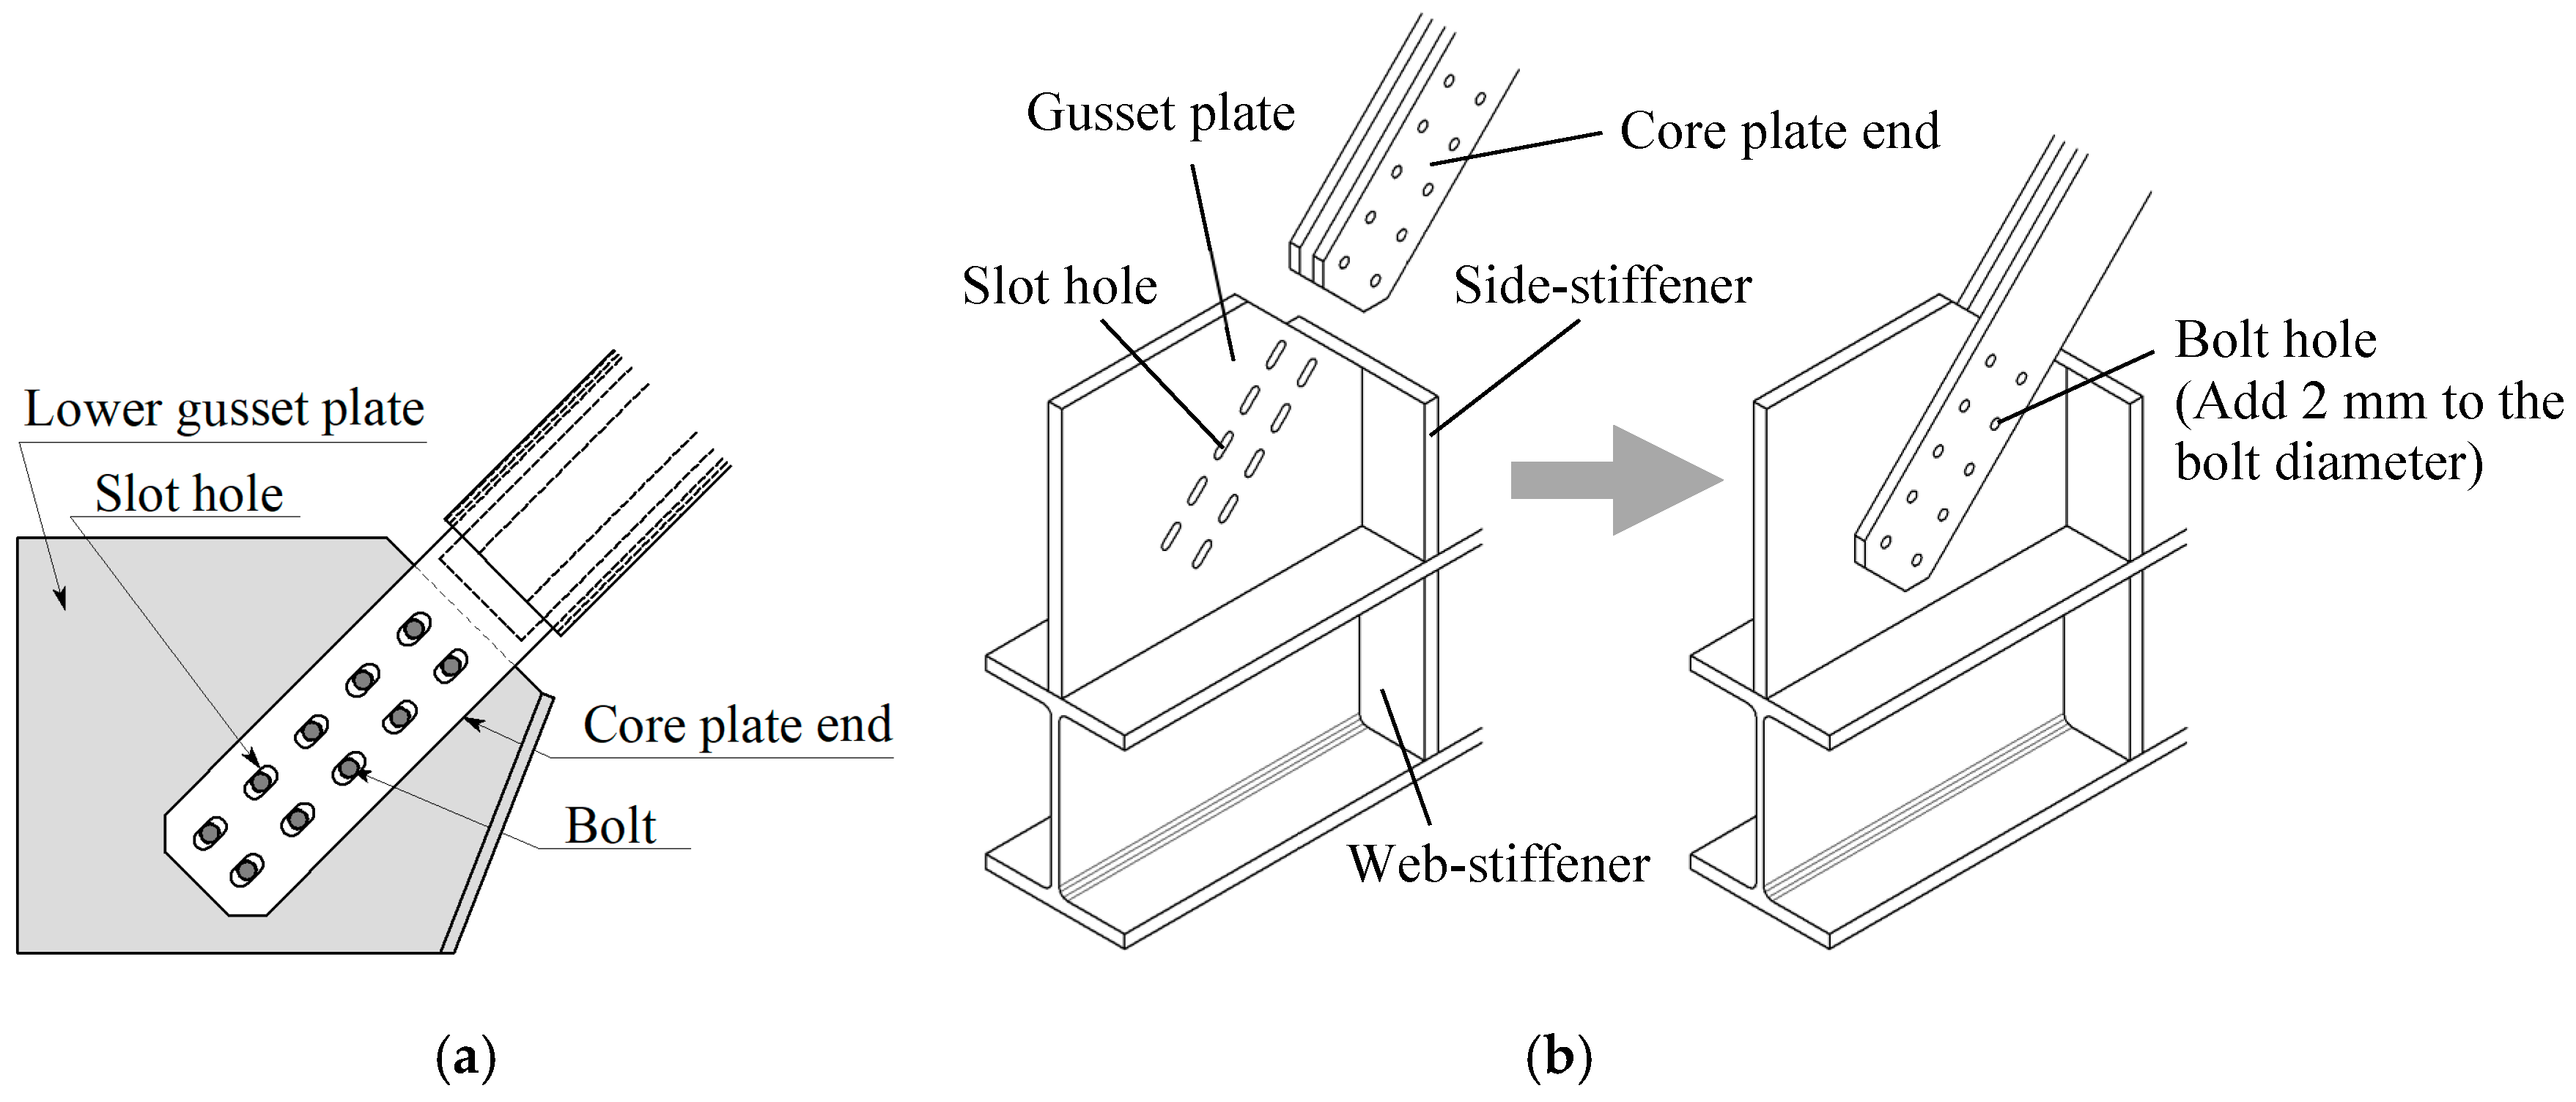
2. Overview of DR-BRB

Details of the BRBs adopted in this study are presented in Figure 3. Figure 3a depicts the core plate configuration where both ends are wider to form the joints. The two core plates separated using spacer plates are inserted into a buckling-restraining member made of an aluminum alloy extrusion, as shown in Figure 3b. The benefits of using aluminum are its light weight and easiness in sectional shape manufacturing. Figure 3c presents the cross-sectional view of three sections. The gap between the core and buckling-restraining member is filled with a cement-based non-shrinkable grouting material.
Details of the brace-end joint at the lower gusset plate are depicted in Figure 4a. The lower and upper gusset plates have slot holes, whereas the core plate ends have the same number of circular holes. The gusset plate is inserted into the double core plates, as illustrated in Figure 4b, and non-high strength bolts are used for the connection. Because no pretension force is introduced into these bolts, the joint can slide smoothly without friction. The authors studied the friction damper [18,19,20,21,22] using the same detailed joint with high-strength bolts and special surfaces treatment, which will be presented in another paper.
Figure 5 illustrates the bolt position in the slot holes of the lower and upper gusset plates. In Figure 5, one combination of the slot hole and the bolt is shown for each gusset plate. Figure 5a shows the bolt position in the initial state where the BRB is loaded downward owing to gravity. Hence, all the bolts are in contact with the lower side of the slot holes. On the BRB tension side, as shown in Figure 5b, the bolt in the lower gusset plate moves upwards and reaches the upper side of the slot hole, inducing the brace tensile force appearance. By contrast, Figure 5c presents the case of the compressive side where the bolt position in the upper gusset plate varies, and the brace compressive force appears after the bolt comes in contact with the upper side of the slot hole. The starting point of the brace delayed action can be adjusted by the length of the slot hole.

3. Cyclic Loading Tests

3.1. Test Specimens

Figure 6 and Figure 7 present the test setup and photographs, respectively. Table 1 lists the five test specimens composed of a BRB connected to 14 mm thick gusset plates with slot holes. In all the specimens, the BRB had two core sections of 14 mm thickness and 80 mm width, a buckling-restrained length Lb of 3300 mm, force point height H of 3480 mm, and brace angle θ of 45°. Each gusset plate was fastened with 10 M20 bolts, where each nut was tightened by hand. To prevent loosening of the nut, a secondary nut and a loosening stopper were installed on each bolt, as shown in Figure 7b. Specimens A1 to A3 were used to examine the brace performance under the cyclic loads with the incremental amplitude. They had different slot hole sizes, giving the slip distances δd as well as the drift angle Rd at which the brace action started. They can be calculated from Equations (1) and (2).
Rd = δd/(H cosθ),
δd = lB + (ϕB),
where l is the slot hole length, H is the height of force point (=3480 mm), θ is the brace angle (=45°), B is the bolt shank diameter (=20 mm), and ϕ is the bolt hole diameter in the core plates and the slot hole diameter in the gusset plates (=22 mm). In practical building design, the slot hole length is determined through seismic response analysis. A previous study [10] examined the influence of the Rd value on the seismic response of steel frames. Usage of several seismic waves with a variety of characteristics ensures the appropriate design of the DR-BRBs.
Specimens B1 and B2, with the same slot hole size as that of specimen A2, were used to examine the fatigue property under the cyclic loads with the constant amplitude. The different drift angle amplitudes were given as listed in Table 1 to examine the influence of the amplitude level.
The tensile coupon test results of the core steel plates are shown in Table 2. After the setup of each test specimen, the midpoint deflection of the brace was measured before the loading started. Table 3 presents the initial deflection and the predicted BRB yield axial force calculated by multiplying the measured cross-sectional area of the core yielding portion by the yield stress as presented in Table 2.

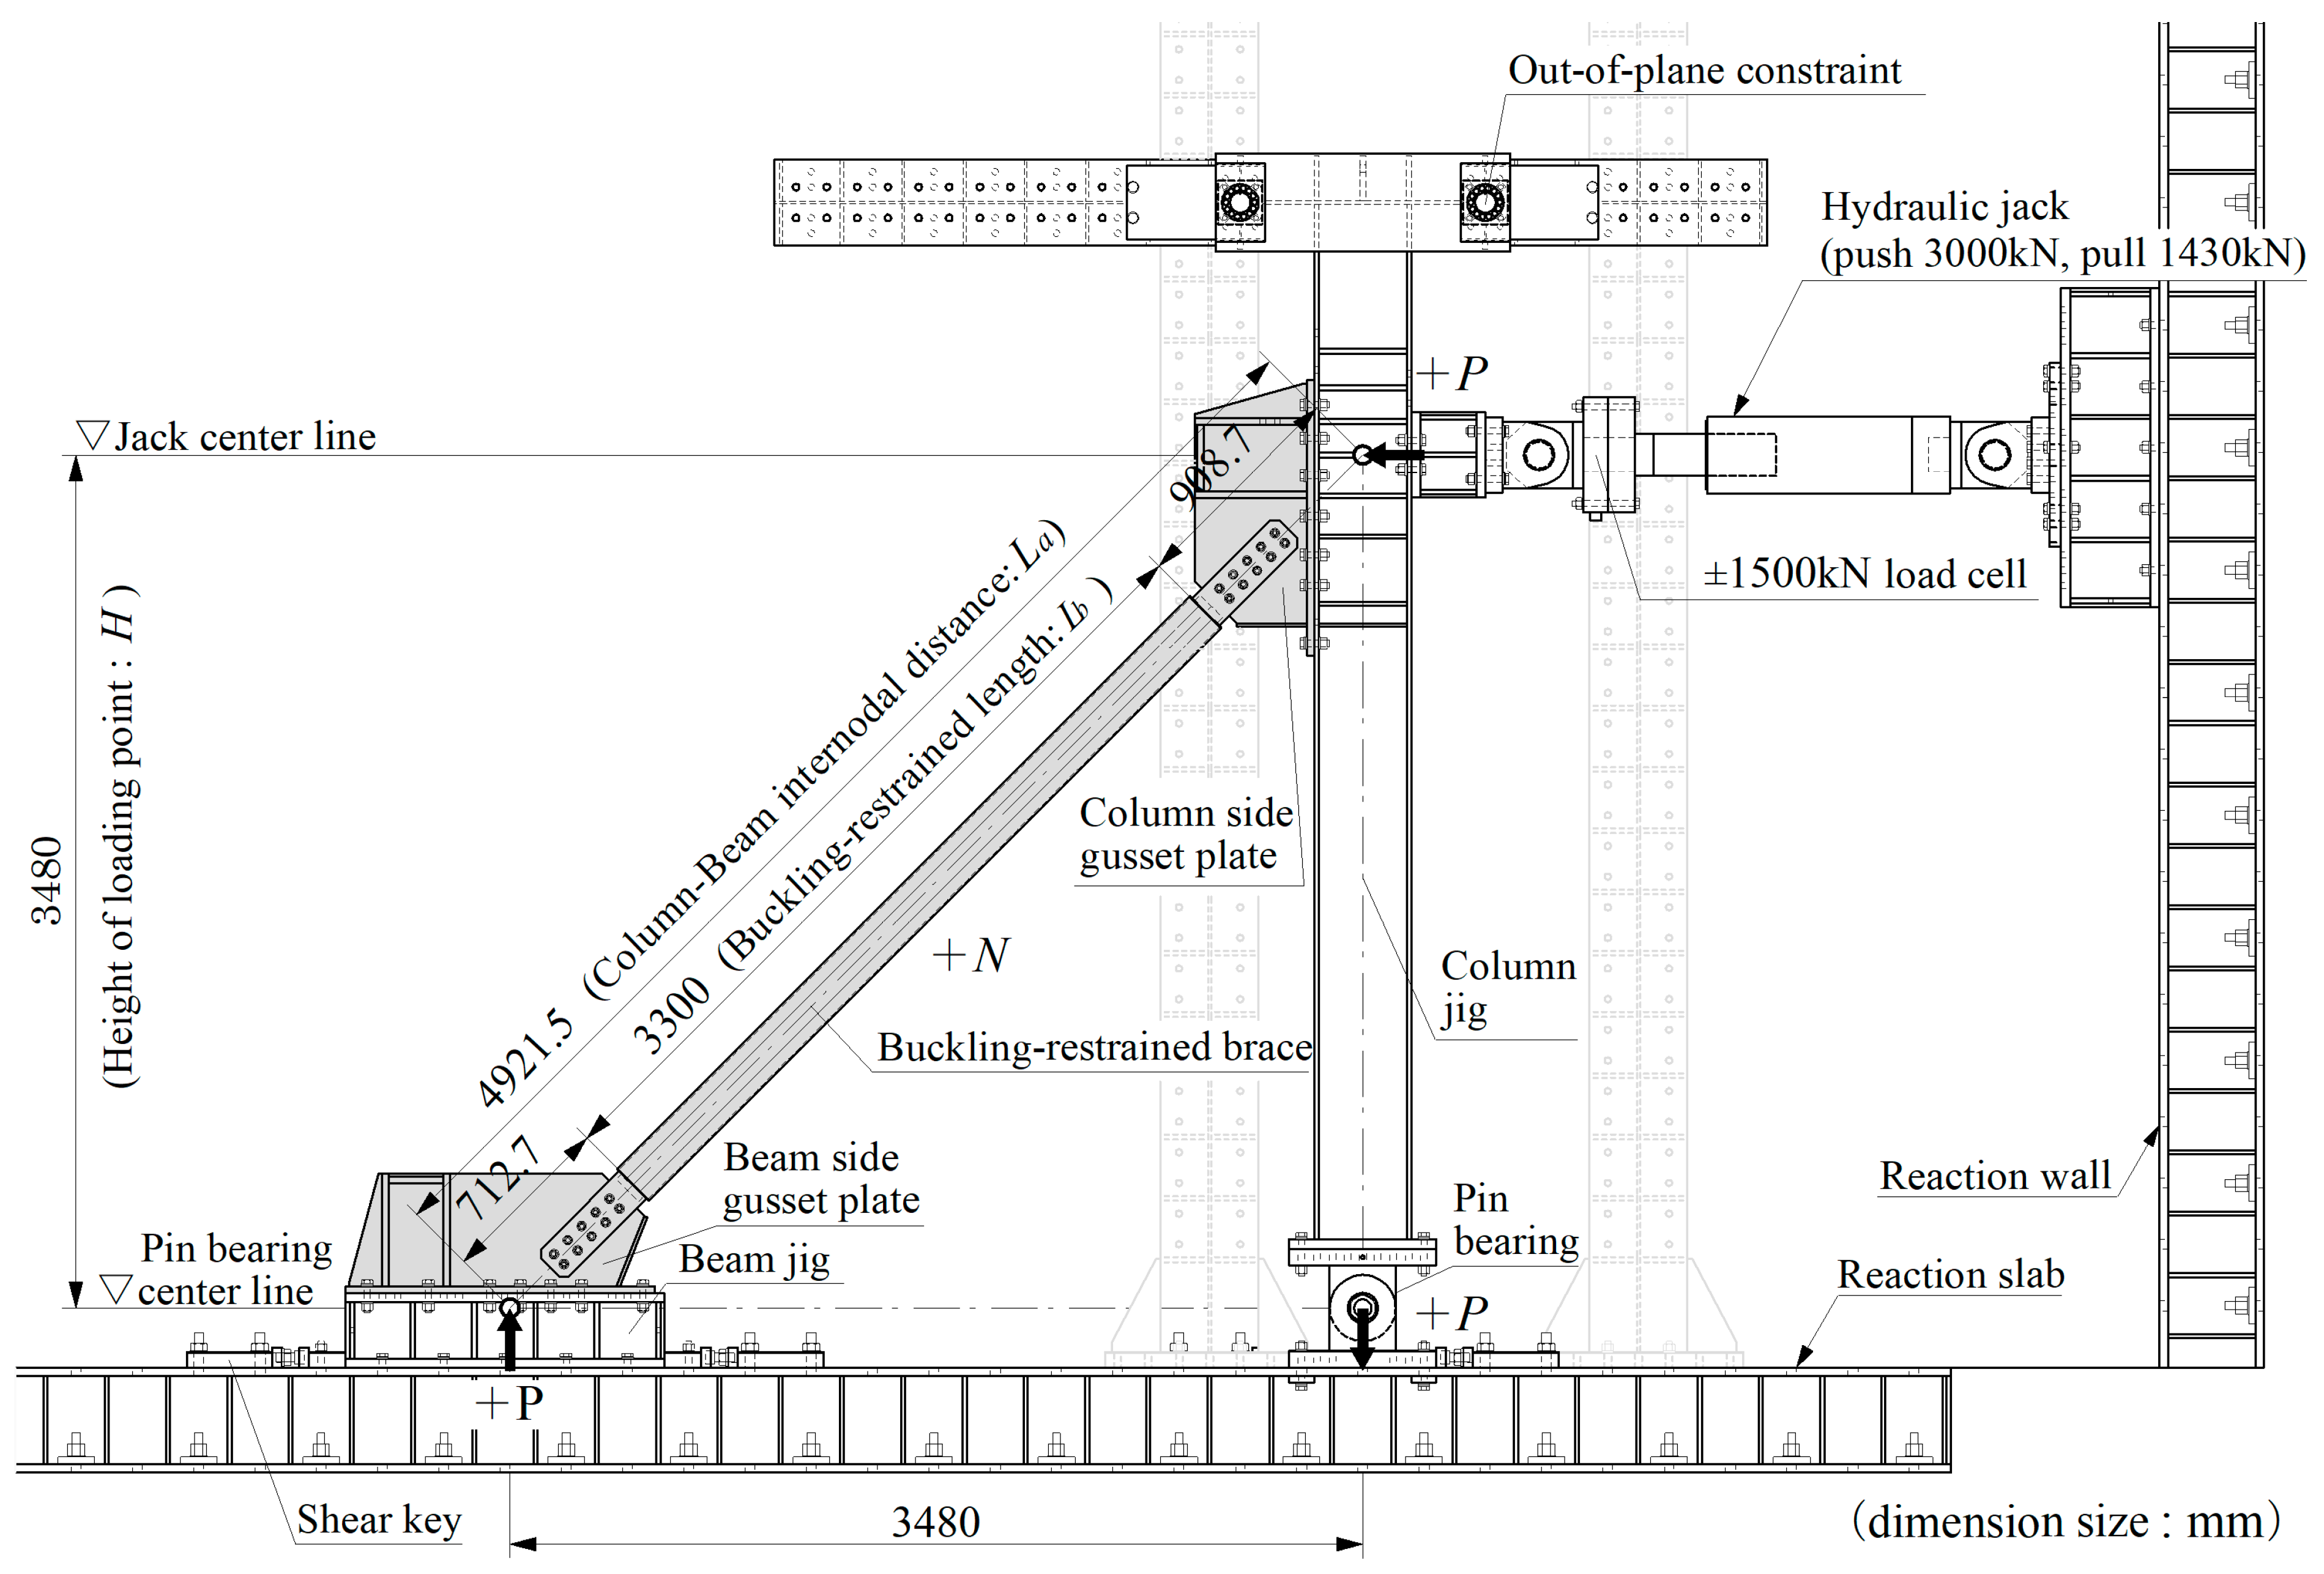
3.2. Loading Method and Measurement

Loading was conducted by applying a horizontal load P with a push–pull type hydraulic jack, as presented in Figure 6. The top of the column jig was sandwiched by the outside holding device to restrain the out-of-plane and torsional movements. The positive force direction was the pushing direction of the hydraulic jack, i.e., the leftward, as depicted in Figure 6. An axial force N of the brace can be obtained using Equation (3).
N = P/(cos45°)
For specimens A1 to A3, the cyclic loading was first controlled by the gradually increasing horizontal load P = ±150 kN, ±300 kN, and ±450 kN for each of the two cycles. Afterward, the cyclic loading was controlled by the drift angle R = ±1/100 (except in specimen A3), ±1/75, ±1/50, ±1/37.5, ±1/30, and ±1/25 rad for each of the two cycles.
For specimens B1 and B2, the cyclic loading was controlled by the constant amplitude of the drift angles R = ±1/50 rad and R = ±1/37.5 rad, respectively, until the lateral strength was reduced to 90% of the maximum load. It is noted that one cycle of positive and negative cyclic loading (not included in the number of cycles of constant amplitude loading) was conducted at the target horizontal load P = ±150 kN to examine the symmetry of the slip distances δd.
The drift angle R was calculated using Equations (4) and (5).
R = δh/H,
δh = (D1 + D2)/2,
where δh is the lateral displacement at the force point obtained as an average value of a pair of two transducers DT1 and DT2.
Figure 8 presents the location of the displacement transducers of DT3 to DT16 to measure the BRB axial deformation. The values obtained using these sensors are denoted by Di for DTi in the following equations.
The axial deformation of the brace, δb, was obtained with Equation (6), and the axial strain in the core yield portion, εa, was obtained with Equations (7) to (9).
δb = (D3 + D4 + D5 + D6 + D7 + D8)/2,
εa = δa/Lc,
δa = δbδe,
δe = N/Ke,
where δa is the axial deformation of the core yield portion, Lc is the length of the core yield portion (=2300 mm), δe is axial deformation of the elastic portion of the brace, and Ke is the stiffness of the elastic portion (=685 kN/mm). D3 and D4 denote the axial deformation of the buckling restrainer, and D5 to D8 denote axial deformation between core and buckling restrainer.
The axial deformation of the joint δj was obtained using Equations (10) to (12).
δj = δjc + δjs,
δjc = (D9 + D10 + D11 + D12)/2,
δjs = (D13 + D14 + D15 + D16)/2,
where δjc is the axial deformation of the core joint and δjs is the axial deformation between core joint and gusset plate. D9 to D12 denote the axial deformation of core joints, and D13 to D16 denote the axial deformation between the core plate end and gusset plate.

4. Test Results

4.1. Load–Deformation Relationships and Fracture Conditions

The horizontal load P and drift angle R relationships are presented in Figure 9. The core compressive yield point is indicated by SCY. The points at the brace buckling and core steel fracture are indicated by BB and FB, respectively. Overall, the hysteretic loops showed a stable spindle-shaped configuration on the positive (compression) and negative (tension) loading sides until the load dropped. As the number of cycles increased, the horizontal load P tended to increase on the positive (compression) side compared to the negative (tension) side.
For specimen A1, the brace buckling (BB) occurred in the weak axis direction of the core plate at the amplitude of R = +1/30 rad on the positive (compression) side, then the load dropped rapidly, and the test was terminated. On the positive (compression) side, the maximum load P+max = +913 kN was reached after 15 cycles. For specimen A2, the brace buckling (BB) occurred in the weak axis direction of the core plate at R = +1/30 rad on the positive (compression) side, and the load dropped rapidly. The maximum load P+max = +953 kN was reached after 15 cycles. For specimen A3, the brace buckling (BB) occurred in the weak axis direction of the core plate at the amplitude of R = +1/25 rad on the positive (compression) side, and the load dropped rapidly. The maximum load P+max = +943 kN was reached after 15 cycles. For specimen B1, the test was terminated when the core plate fractured (FB) with a rupture noise, and the load dropped suddenly below 90% of the maximum load after 58 cycles. The maximum load of P+max = +928 kN was reached after 47 cycles, while the negative (tension) side maximum load Pmax = −753 kN was reached after 37 cycles. For specimen B2, the test was terminated after 14 cycles on the positive (compression) side because the brace buckling (BB) occurred in the weak axial direction of the core plate, and the load dropped rapidly. The positive (compression) side maximum load of P+max = +934 kN was reached after 13 cycles, and the negative (tension) side maximum load of Pmax = −796 kN was reached after 13 cycles.

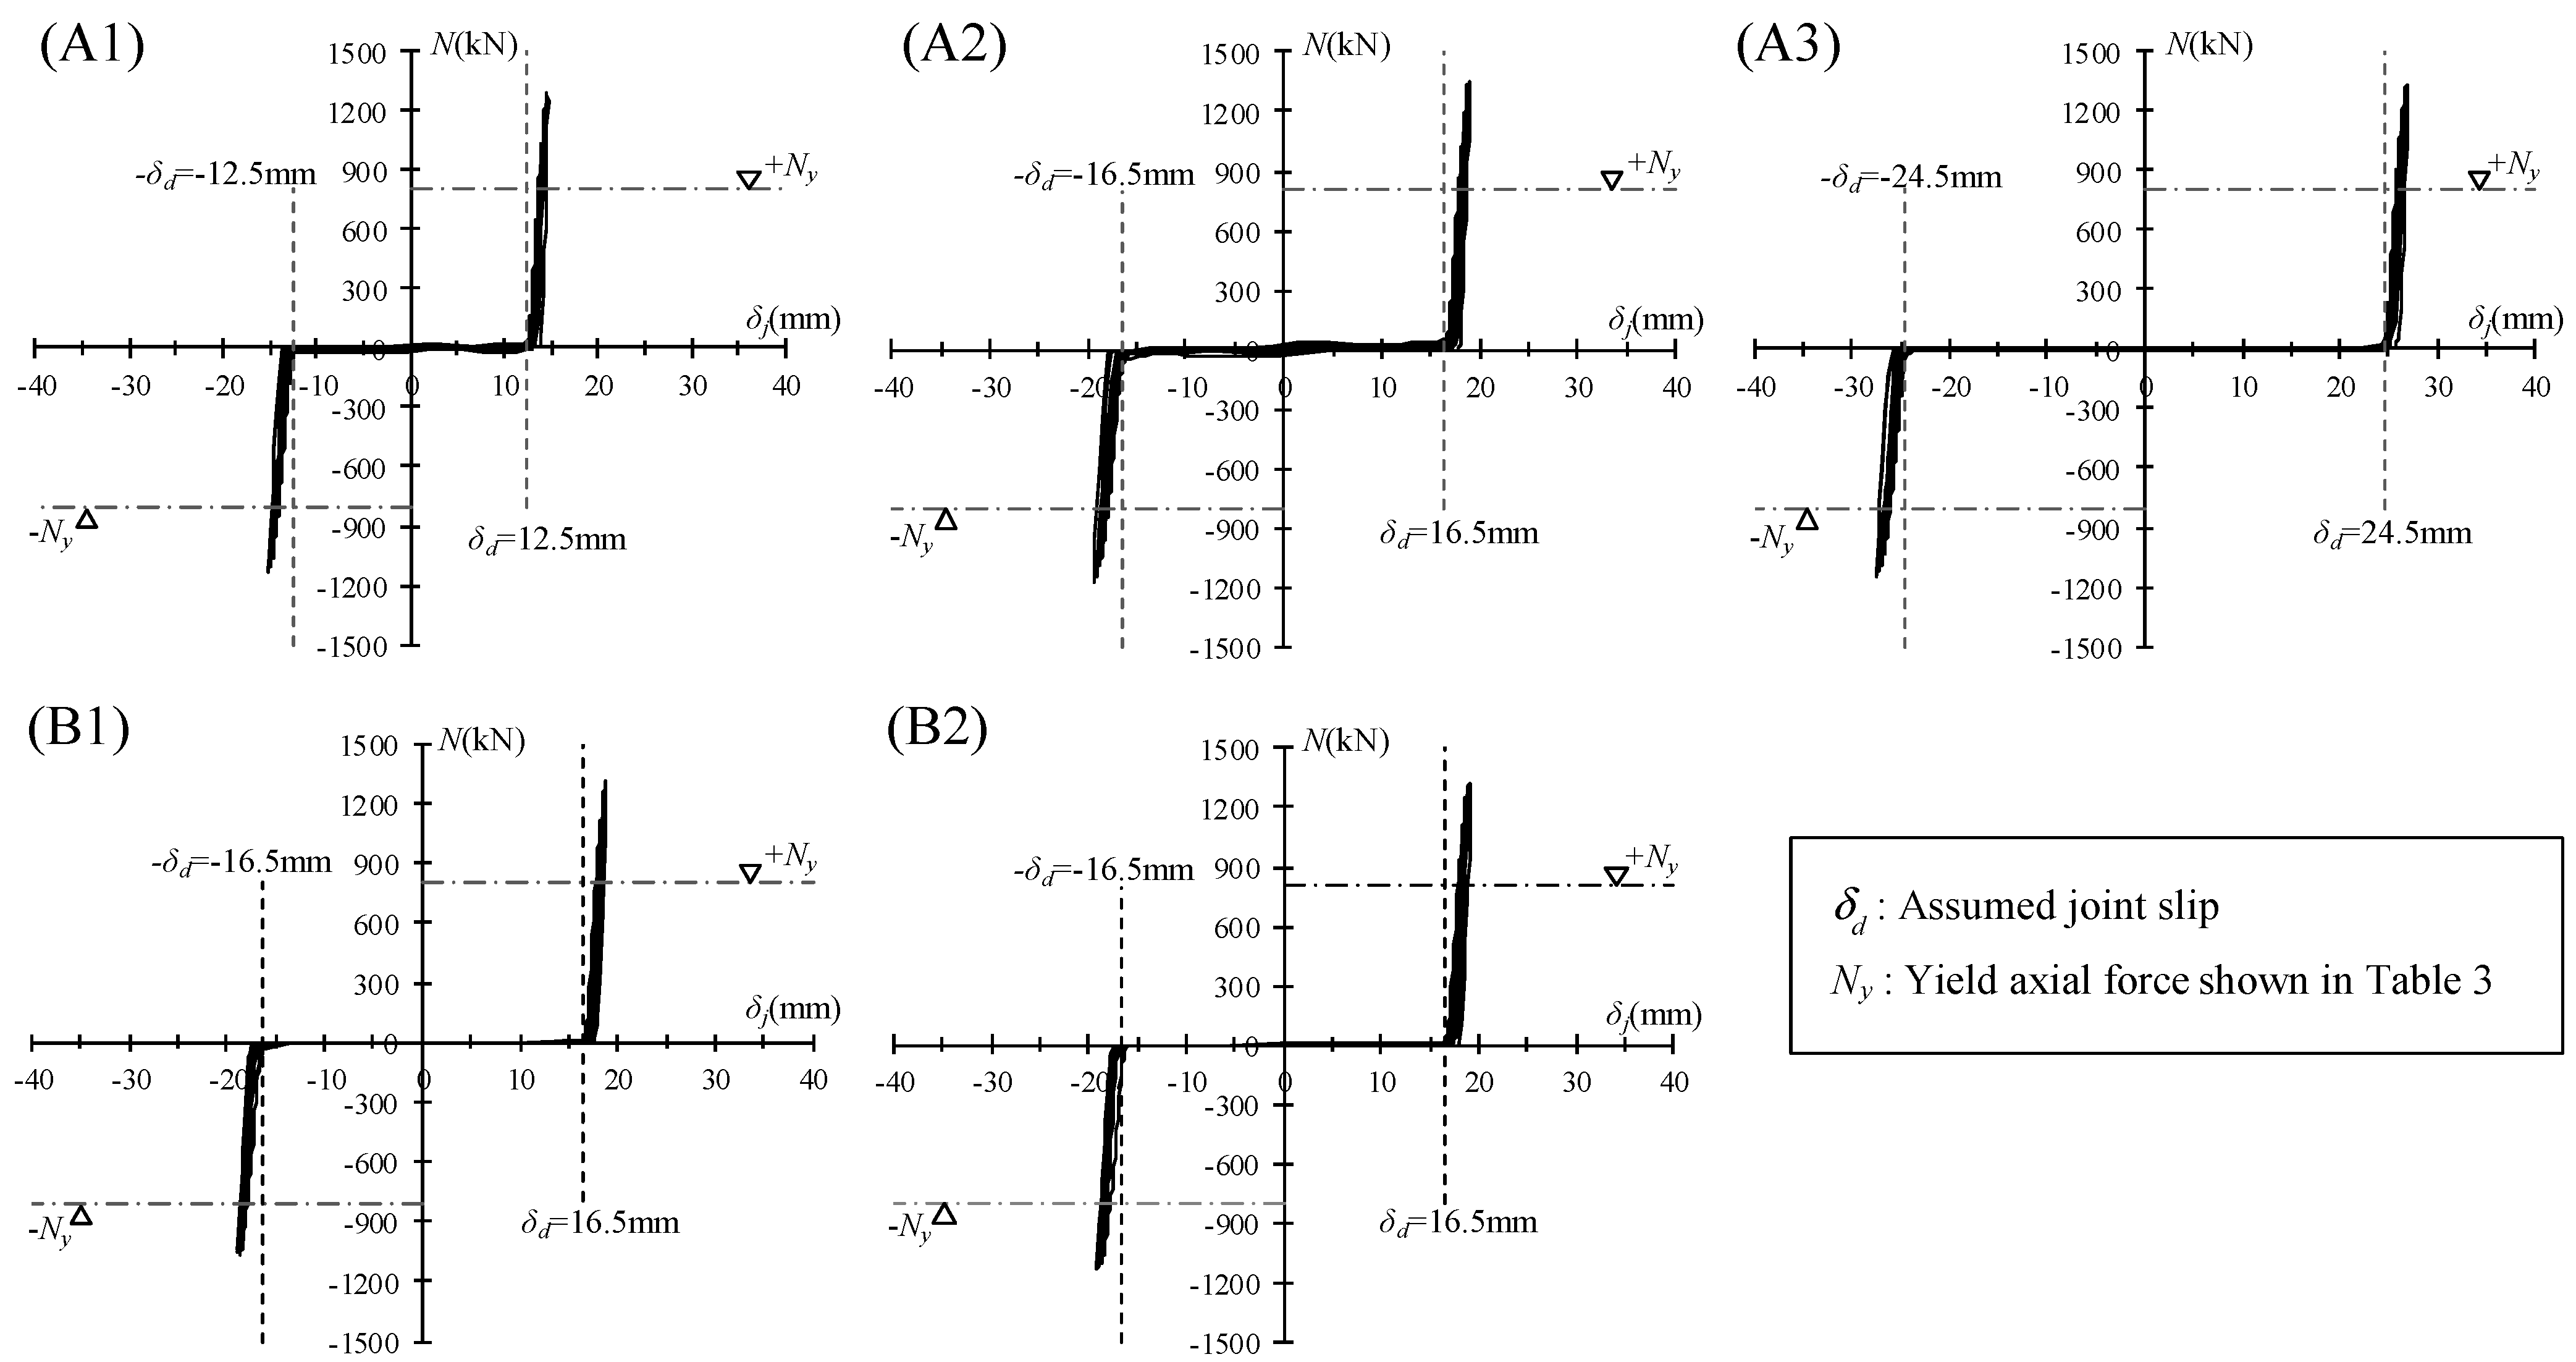
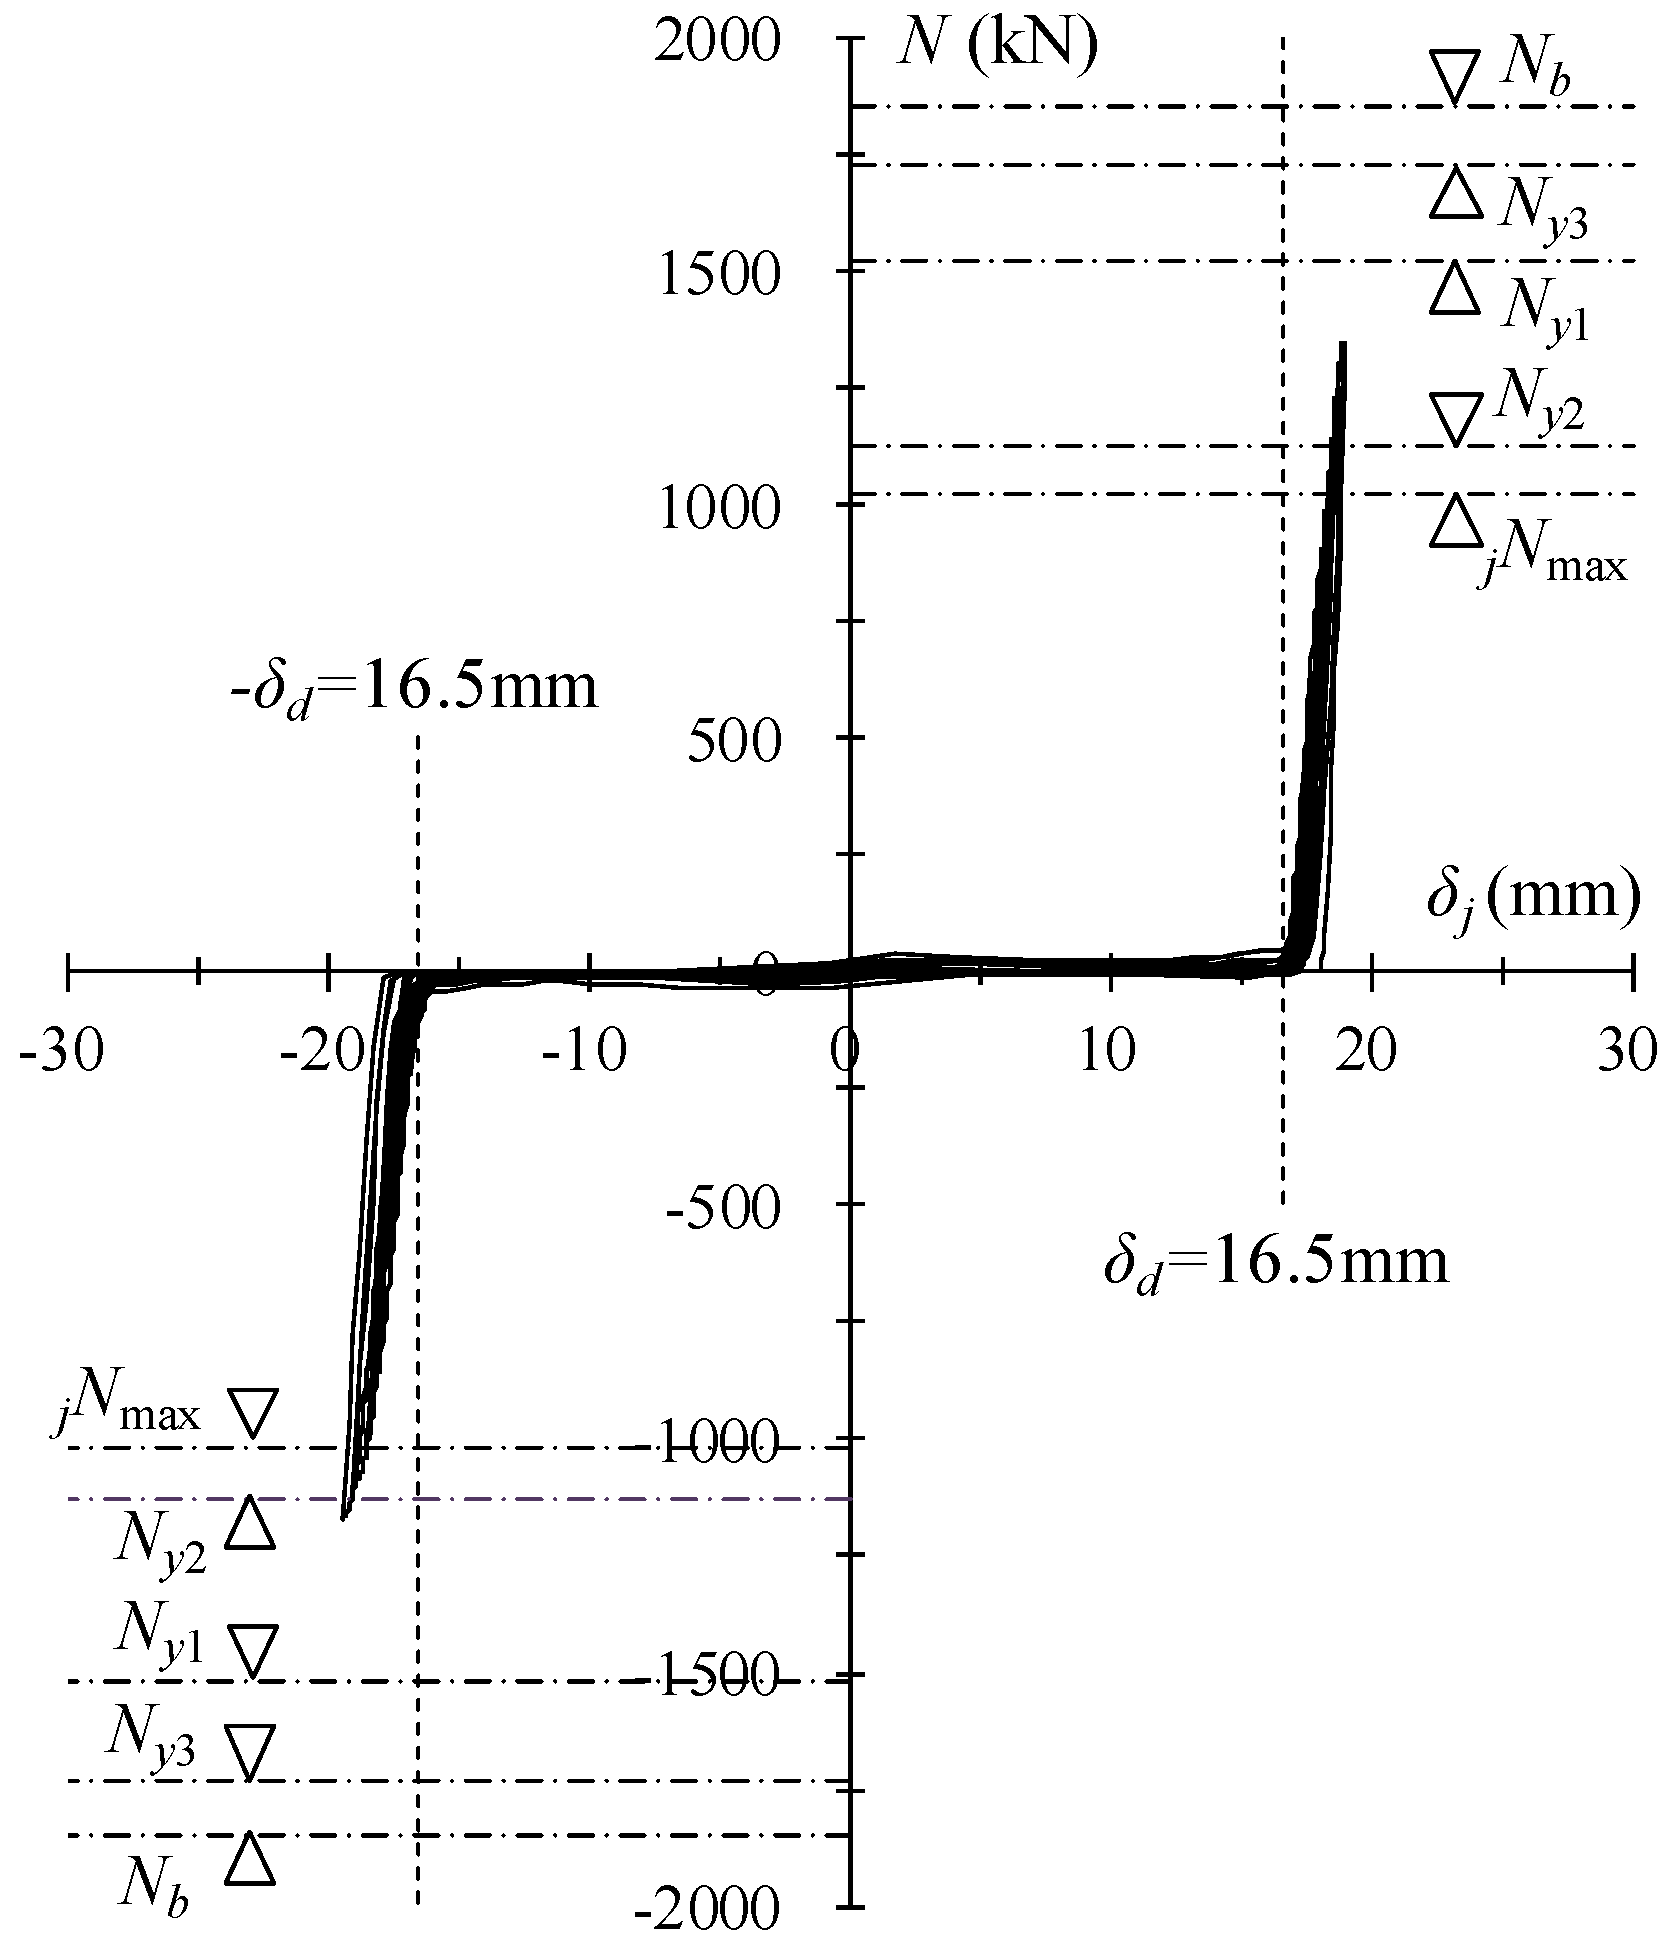
4.2. Brace Axial Force and Joint Axial Displacement Relationships

The brace axial force N and joint axial displacement δj relationships are presented in Figure 10, where Ny denotes the yield axial force of the brace as presented in Table 3. The designated joint slip δd depicted in Figure 10 is obtainable with Equation (2) and listed in Table 1. For all the specimens, the brace axial force started to increase beyond the slip displacement of δd, which corresponds to the designated drift angle Rd at which the brace action started. After the axial force increased, there was no clear reduction in the stiffness of the N and δj relationships, even for the region where the axial brace force exceeded the yield force Ny, owing to the sufficient bucking-restraining effect.

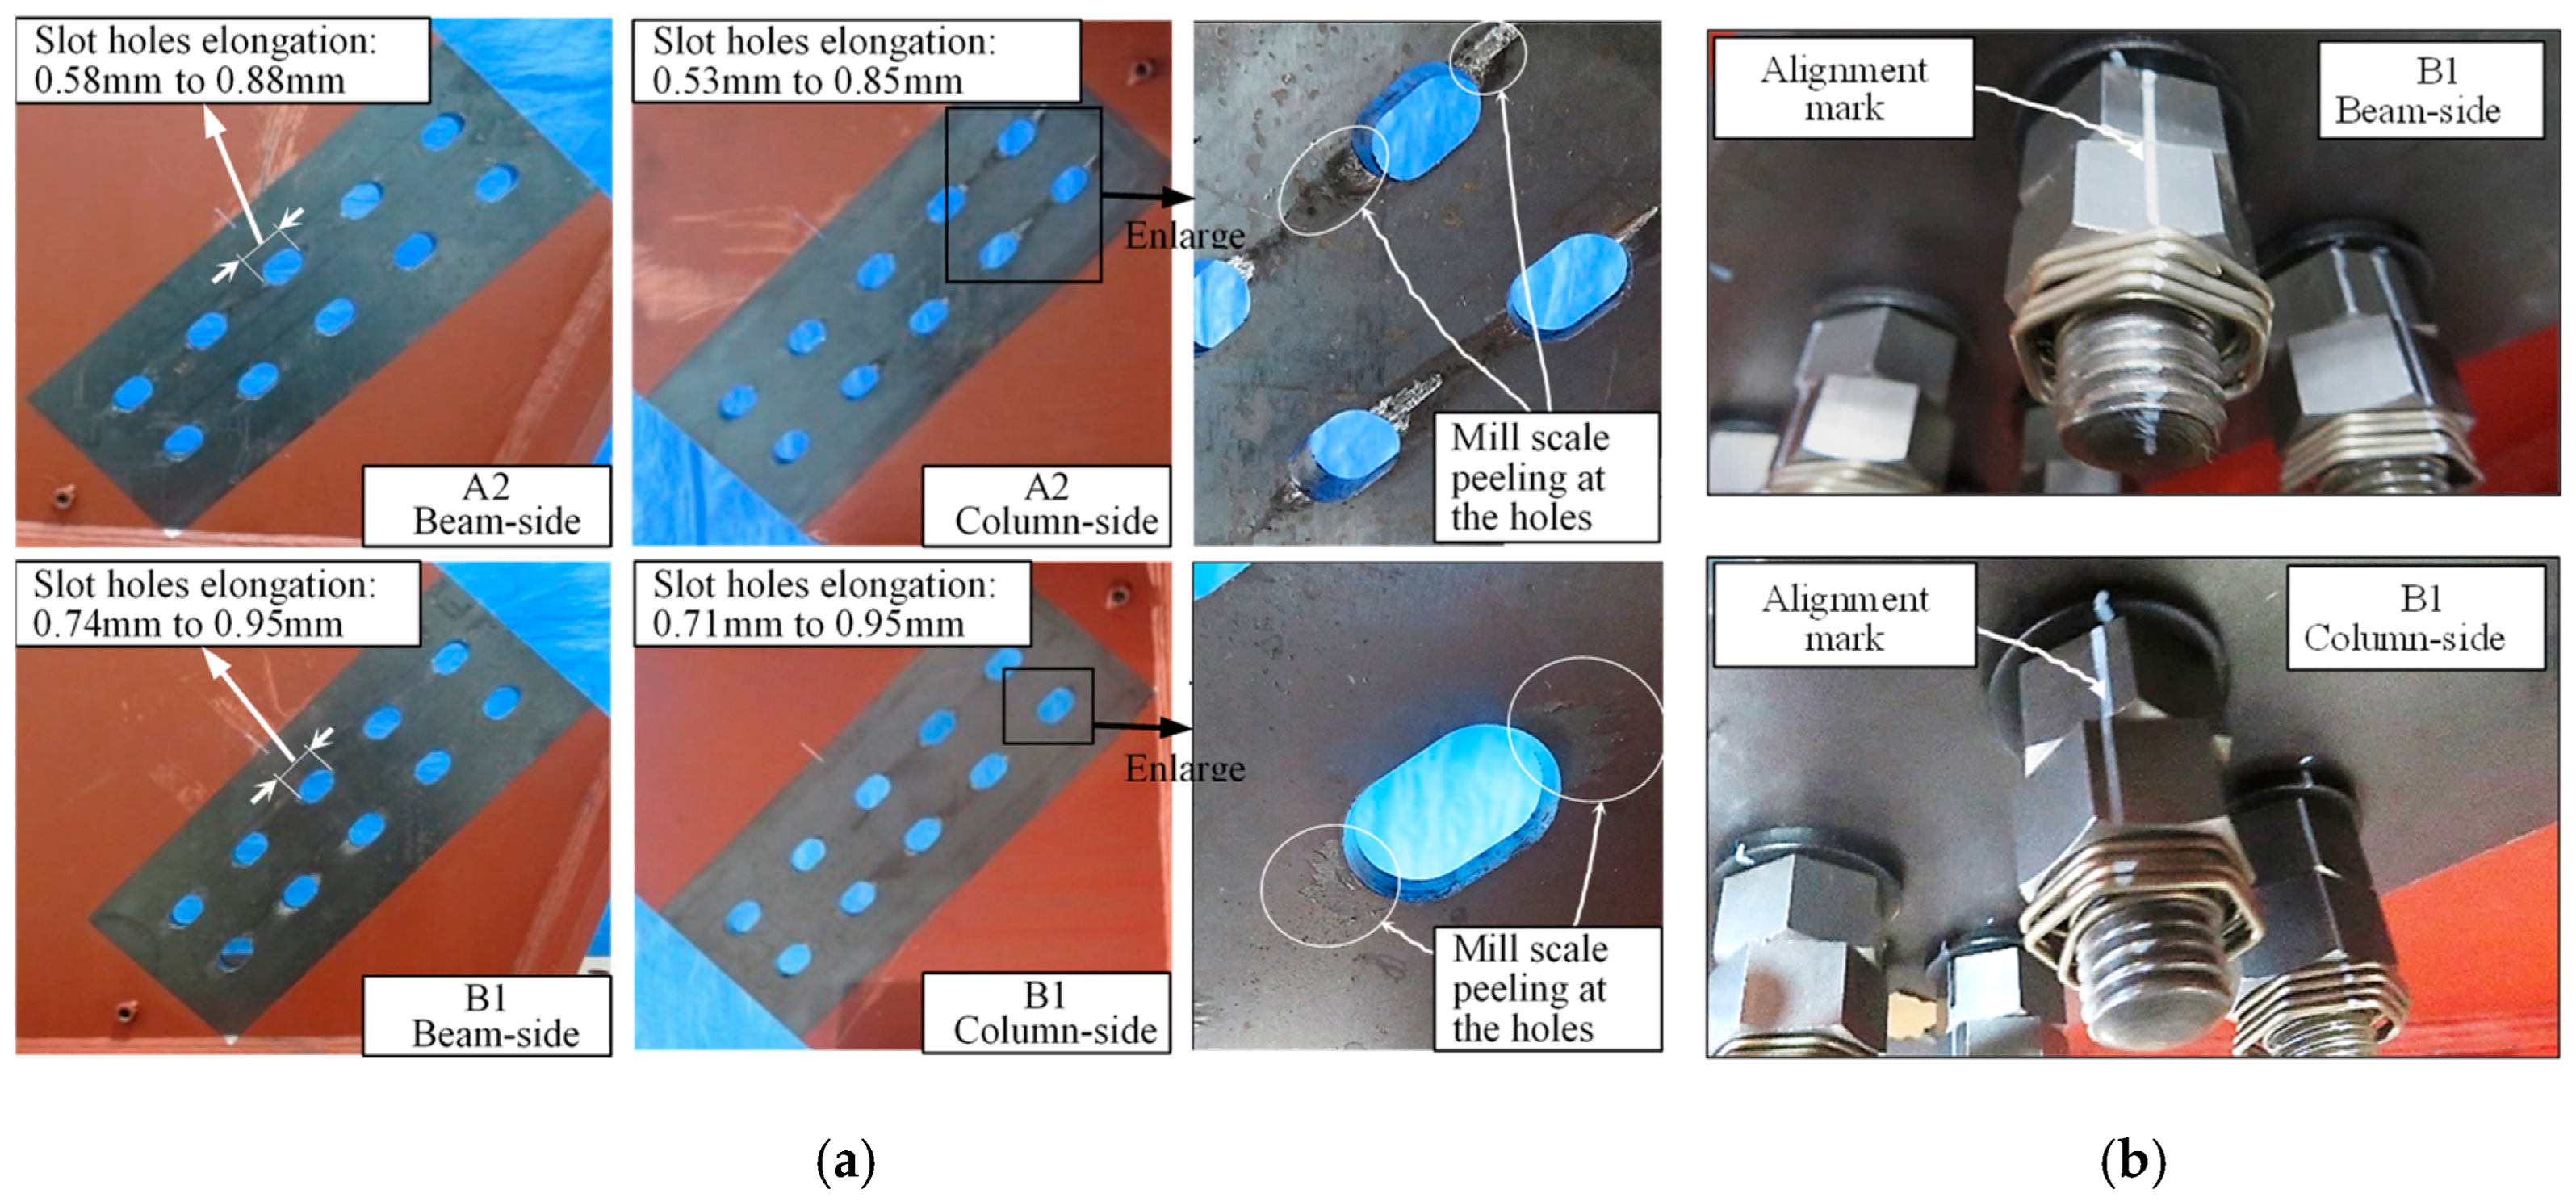
4.3. Post-Test Joint Deformation State

The photographs of the test specimens after the tests are shown in Figure 11. The slot hole elongation and mill scale peeling are shown in Figure 11a. The slot hole elongation of less than 1 mm was measured from the initial slot hole length, indicating localized plastic deformation occurrence due to the bearing force. The alignment marks on the nuts, secondary nuts, anti-looseness clamps, and bolts, which were drawn before the start of the test, were not displaced at the end of the test, and no loosening had occurred in the joint bolts and nuts, as shown in Figure 11b.

4.4. Brace Axial Force and Axial Strain Relationships

Figure 12 presents the relationships between the brace axial force N and axial strain εa defined with Equation (7). For all specimens, the positive (compression) and negative (tension) brace axial forces showed stable spindle-shaped hysteretic loops.
For specimens A1 to A3, the axial strain εa at the maximum axial force ranged from ±2.00% to ±2.56%. The ratio of the strength increases N+max/Ny ranged from 1.59 to 1.67 for the positive (compression) side, and that of |Nmax|/Ny ranged from 1.40 to 1.45 on the negative (tension) side. The maximum axial force ratio N+max/|Nmax| between the positive and negative force sides of each specimen ranged from 1.14 to 1.17, indicating that the compression side exceeds the tension side by 14 to 17%.
For specimen B1, which was subjected to a constant drift angle amplitude of 1/50 rad, the one-side single strain amplitude was 1.18%. The number of cycles up to the sudden reduction in bearing capacity caused by the core fracture was 58. For specimen B2, which was subjected to a constant drift angle amplitude of 1/37.5 rad, the one-sided strain amplitude was 1.88%. The number of cycles up to the sudden reduction in load carrying capacity due to the brace buckling in the weak axial direction of the core plate was 14.

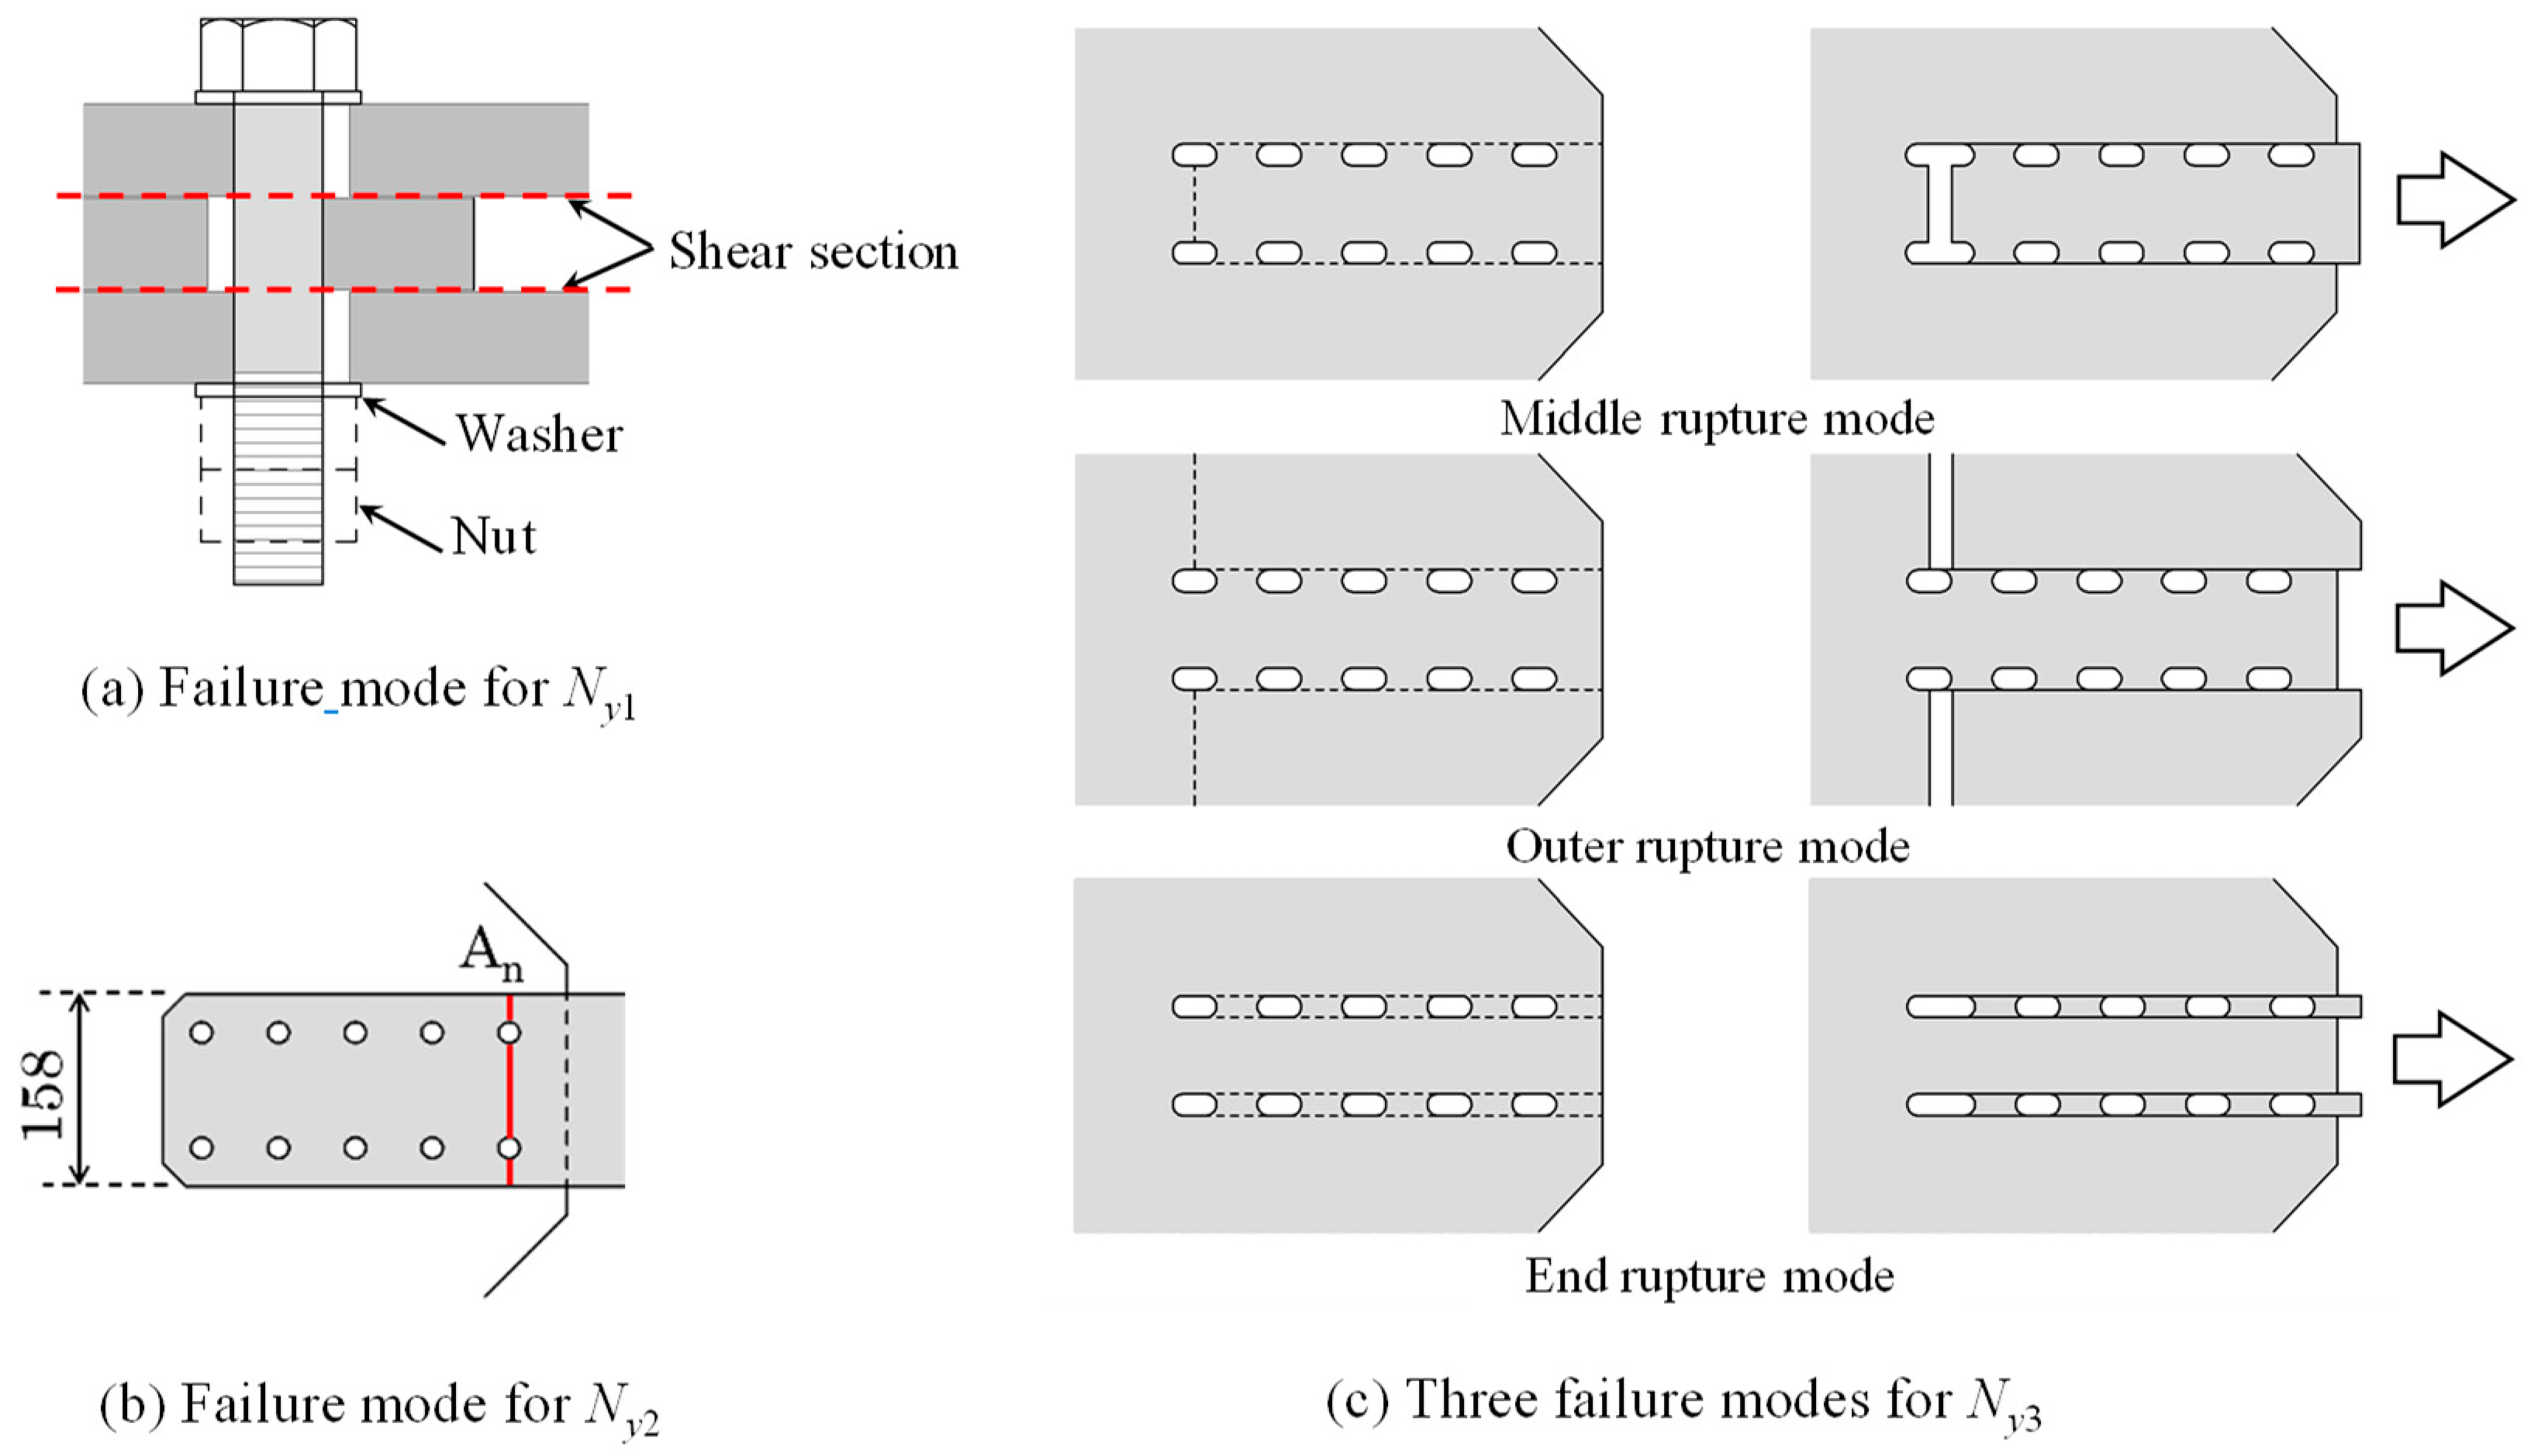
5. Design Equations of the Joint

The joints of the BRBs are commonly designed to remain in the elastic range so that the core members can dissipate seismic energy through plastic deformation. Considering the overstrength and strain hardening of the core plates, this study specifies a maximum axial force jNmax of 1.4Ny, as per Ref. [26]. Equations (13) to (18) are proposed as design equations for the joint bearing capacity based on the formula for determining the strength of the joint specified in Refs. [27,28].
jNyjNmax,
jNy = min{Ny1, Ny2, Ny3, Nb},
Ny1 = 2byAb,
Ny2 = Anσy,
Ny3 = (Ant + 0.5 Ans)σgy,
Nb = fl tg db,
where jNy is the yield capacity of the joint, jNmax is the maximum axial force for the joint design obtained by 1.4Ny, Ny1 is the shear yield capacity for all bolts shown in Figure 13a, Ny2 is the effective sectional yield capacity of the core plate end shown in Figure 13b, Ny3 is the minimum value of the yield capacity among the three gusset plate rupture modes shown in Figure 13c, and Nb is the bearing yield capacity of the slot hole. n and τby denote the bolt number and shear yield strength of bolt shank, respectively. Ab and An denote the cross-sectional area of the bolt shank and core plate end, respectively. Ant and Ans denote the area of the tensile and shear yield portion in the assumed rupture mode, respectively. σy and σgy denote the yield strength of the core and gusset plate, respectively. fl (=1.875σgy), tg and db denote the bearing strength of the slot holes, gusset plate thickness, and bolt shank diameter, respectively.
The experimental results presented in Section 3 confirmed that the joints could maintain an almost elastic range. Table 4 presents the comparison between the joint yield strength and axial force for the joint design of the test specimens. Here, the yield strength of the steel plates at the connection portion is taken as that which was obtained from the coupon test, and the yield strength of the non-high strength bolt is 420 N/mm2 as the specified minimum yield strength of the bolt material. The brace yield capacity Ny is calculated using the specified minimum yield strength (325 N/mm2) of the core steel material. Figure 14 compares the design yield strength values with the experimental result for specimen A2. The maximum experimental force exceeded the joint design axial force jNmax and Ny2 slightly because the loading amplitude was rather large at the final stage.

6. Finite Element Analysis

This section presents the results of finite element analyses to investigate the load transfer mechanism of the joint. This study adopted the FEM program Marc (Ver.2022.2) [29]. A single bolt joint is first modeled, considering the joint geometry of the test specimen A2 (slot hole dimensions: 22 mm wide × 34.5 mm long), to examine the bolt and bolt hole portion in detail. Then, to examine the load transfer characteristics for all the bolts, the overall joint model with ten bolts of specimen A2 is analyzed and compared with the experimental results.

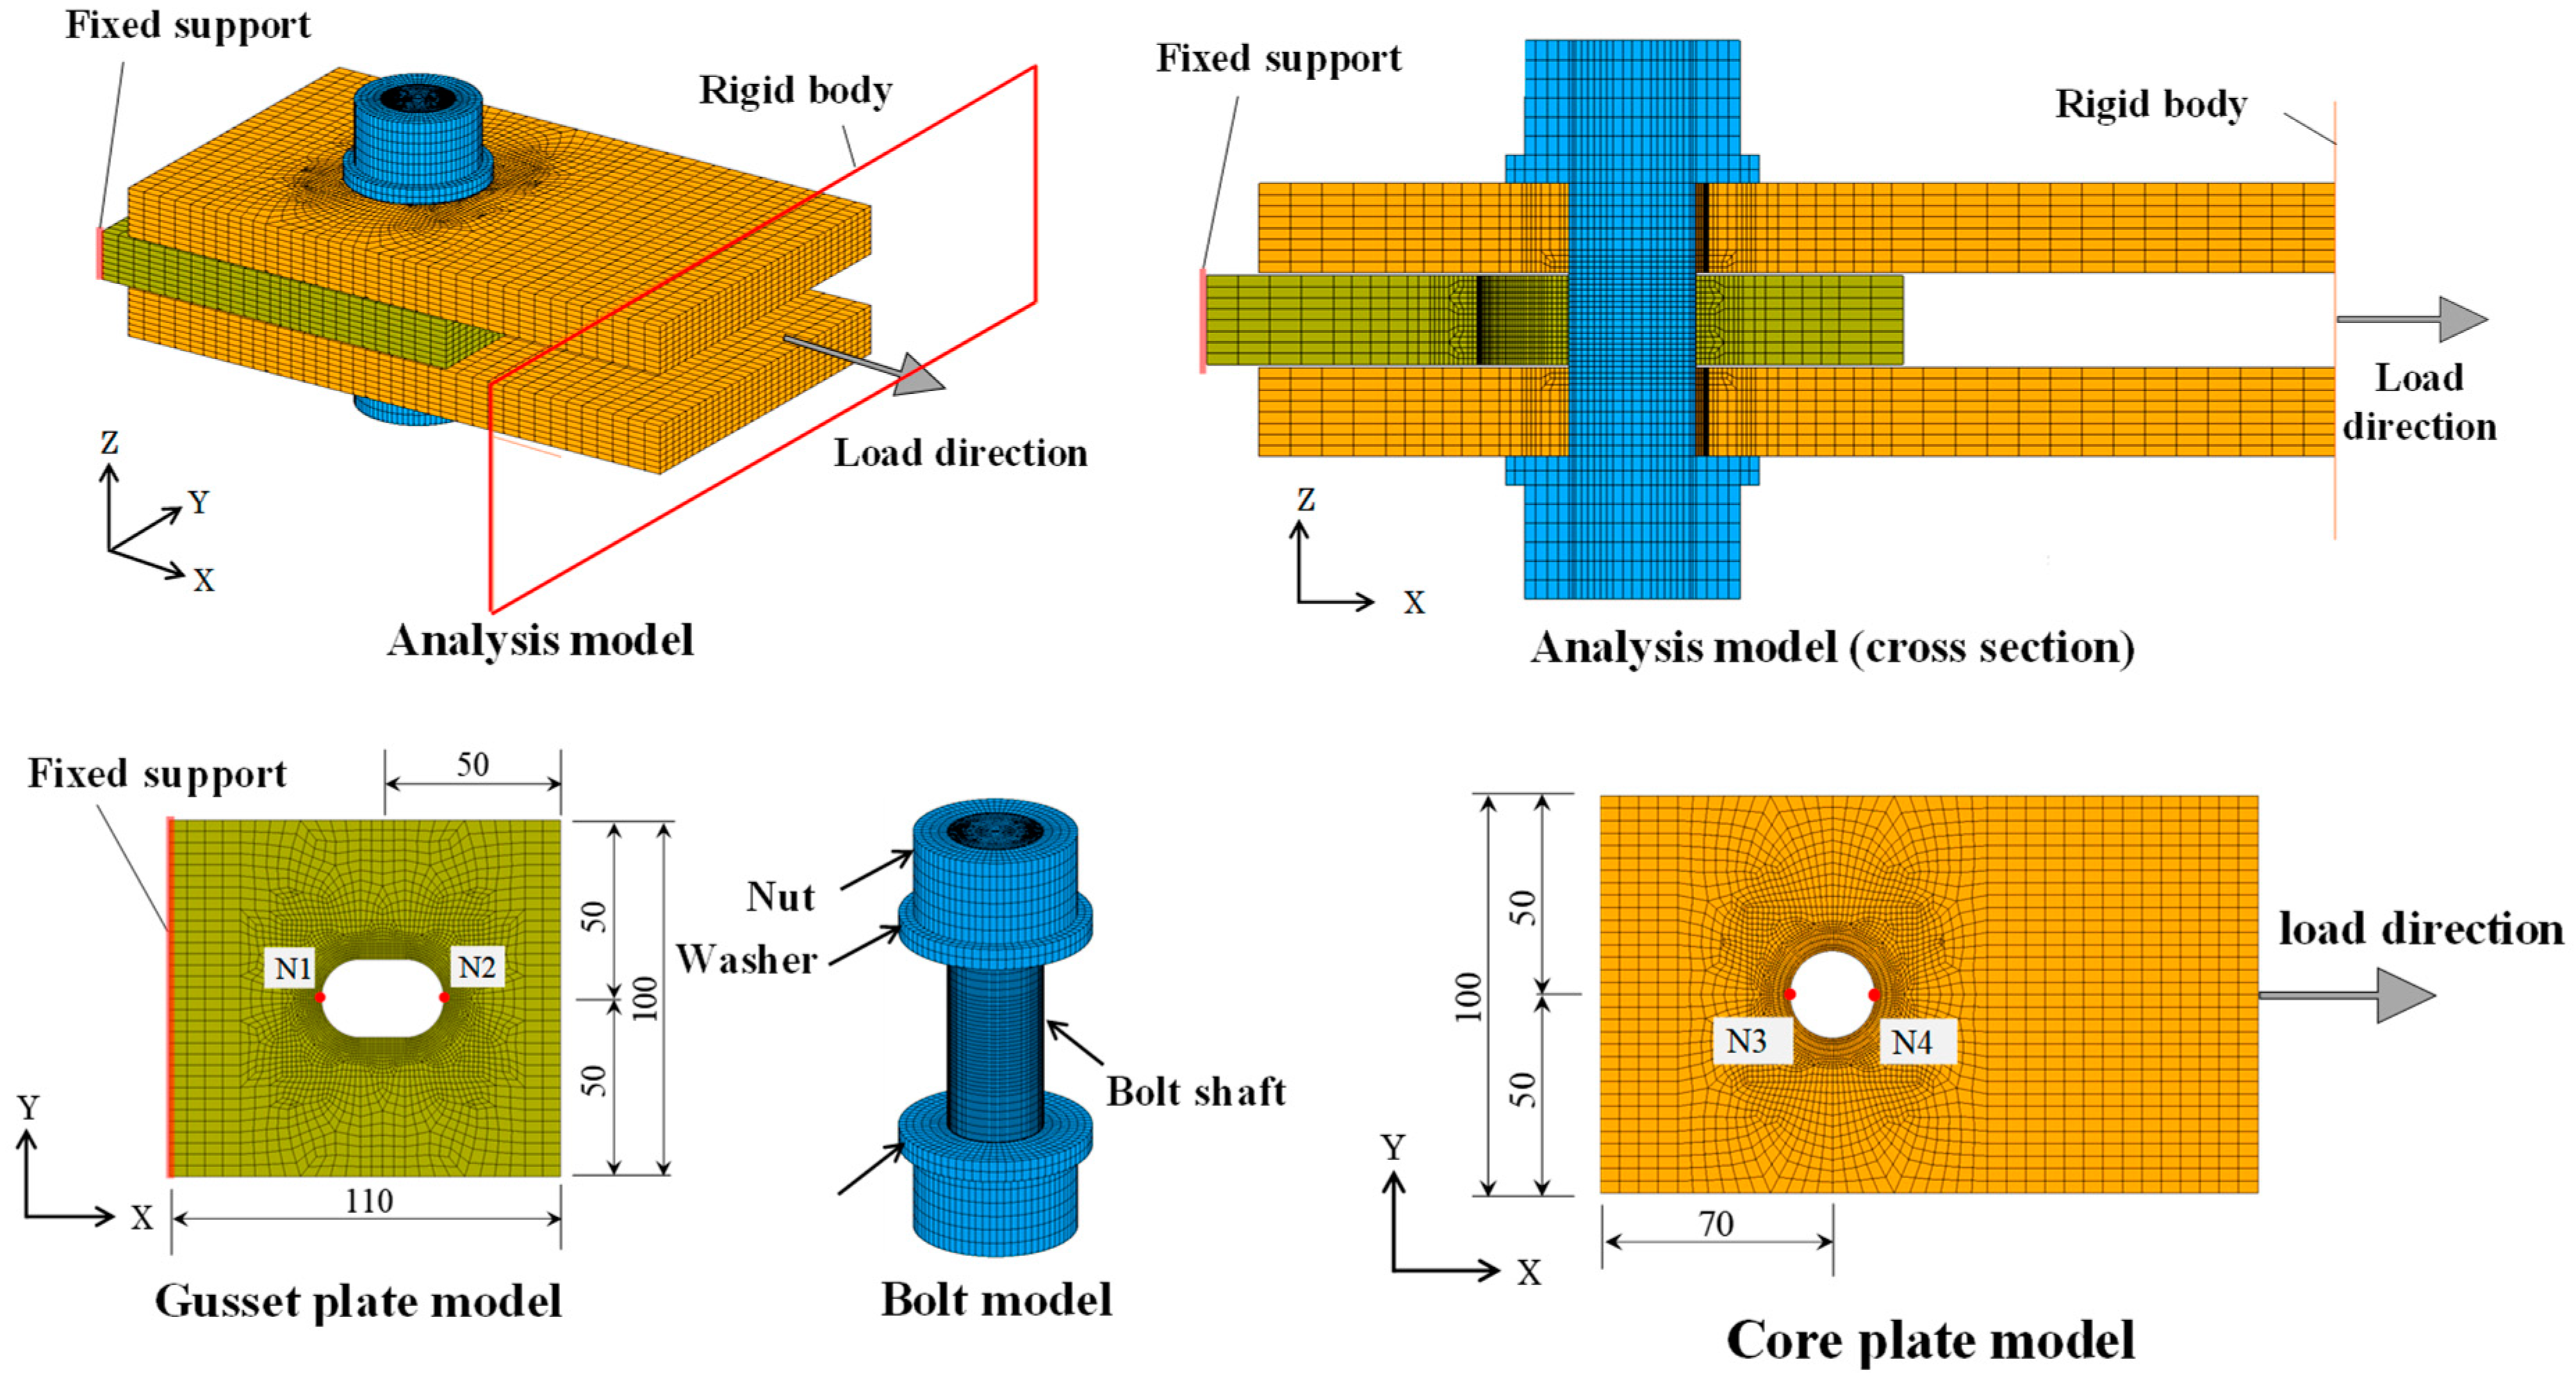
6.1. Analysis Overview of Single Bolt Models

Figure 15 presents the analysis model with a single bolt using eight node hexahedral solid elements. The modeling was conducted with reference to the previous study [30]. The bolt was modeled as a single piece with the nuts and washers. To simulate plasticity accurately, small element sizes were given for the regions around the bolt hole and bolt shank. The contact elements were used between the gusset plate, core plates, and bolts, where friction was not considered. For the fixed support, all six degrees-of-freedom of the nodes on the gusset plate surface were fixed. The tensile axial force was applied monotonically to the rigid body plane sharing nodal points on the core plate ends. In addition to material nonlinearity, geometrical nonlinearity was considered using an updated Lagrangian formulation in the finite element analysis.
For material properties, the Young’s modulus was 2.05 × 10⁵ N/mm2, and Poisson’s ratio was 0.3. The yield strength of the gusset plate and core material was assigned to be 353 N/mm2 based on material test results. The yield strength of the bolts was 528 N/mm2, which is 1.1 times the specified yield strength of 480 N/mm2. A bilinear stress–strain relationship with a hardening ratio of 1/100 was adopted for the steel material. This value of the hardening ratio was determined by previous experiments. The von Mises law was given for a yielding condition. The joint bearing capacities of the single bolt model were computed as Ny1 = 152 kN using Equation (15), Ny2 = 771 kN using Equation (16), Ny3 = 216 kN using Equation (17), and Nb = 185 kN using Equation (18).

6.2. Analysis Results for Single Bolt Models

Figure 16 presents the axial force N and axial deformation δ relationships in which the deformations are obtained as relative axial displacements in nodes N1 to N4, where four lines are defined in the table to the right of the graph. Figure 17 and Figure 18 depict the equivalent stress (von Mises stress) distributions in the bolts and slot holes for four loading levels, respectively. The term “Maximum experimental load” means 1/10 of the maximum load of 1347 kN recorded in test specimen A2 as shown in Figure 12.
The blue line in Figure 16, indicating bolt deformation, suggests that the stiffness reduction started beyond the shear yield capacity of the bolt Ny1. Considering the equivalent stress distribution of the bolt at Ny1, as shown in Figure 17, it can be inferred that the design Equation (15) is almost valid because the range exceeding the yield strength of the bolts spreads over the entire area.
The red line indicating slot hole elongation in the gusset plate demonstrates that the stiffness reduction started when the axial force was approximately 40 kN. The equivalent stress distribution at Ny in the slot hole shown in Figure 18 exhibits the local yielding occurrence at the side surface, owing to bearing pressure. Therefore, it can be inferred that the early stiffness reduction in the load level, smaller than the joint design axial force jNmax, is induced by local yielding of the slot hole, owing to bearing pressure. Because the bearing strength of the slot holes used in the calculation of Nb is 1.875 times the gusset plate yield strength, the local yielding starts to occur at a load much smaller than the bearing yield capacity Nb. It should be noted that Figure 18 shows that the entire surface of the slot hole reaches yield capacity at the load level of Nb.

6.3. Analysis Overview of the Overall Model

Figure 19 presents the analysis model of the overall joint, which is the same as that of test specimen A2. The material properties were set to have the same values as those for the single bolt model, as presented in the previous section. All six degrees-of-freedom of the nodes at the fixed support, as indicated in Figure 19, were fixed. The axial forces of 1.67 Ny and 1.45 Ny were applied to the rigid surfaces in the compressive and tensile directions, respectively. Each applied axial force was determined by considering the maximum axial force in each direction recorded in specimen A2.

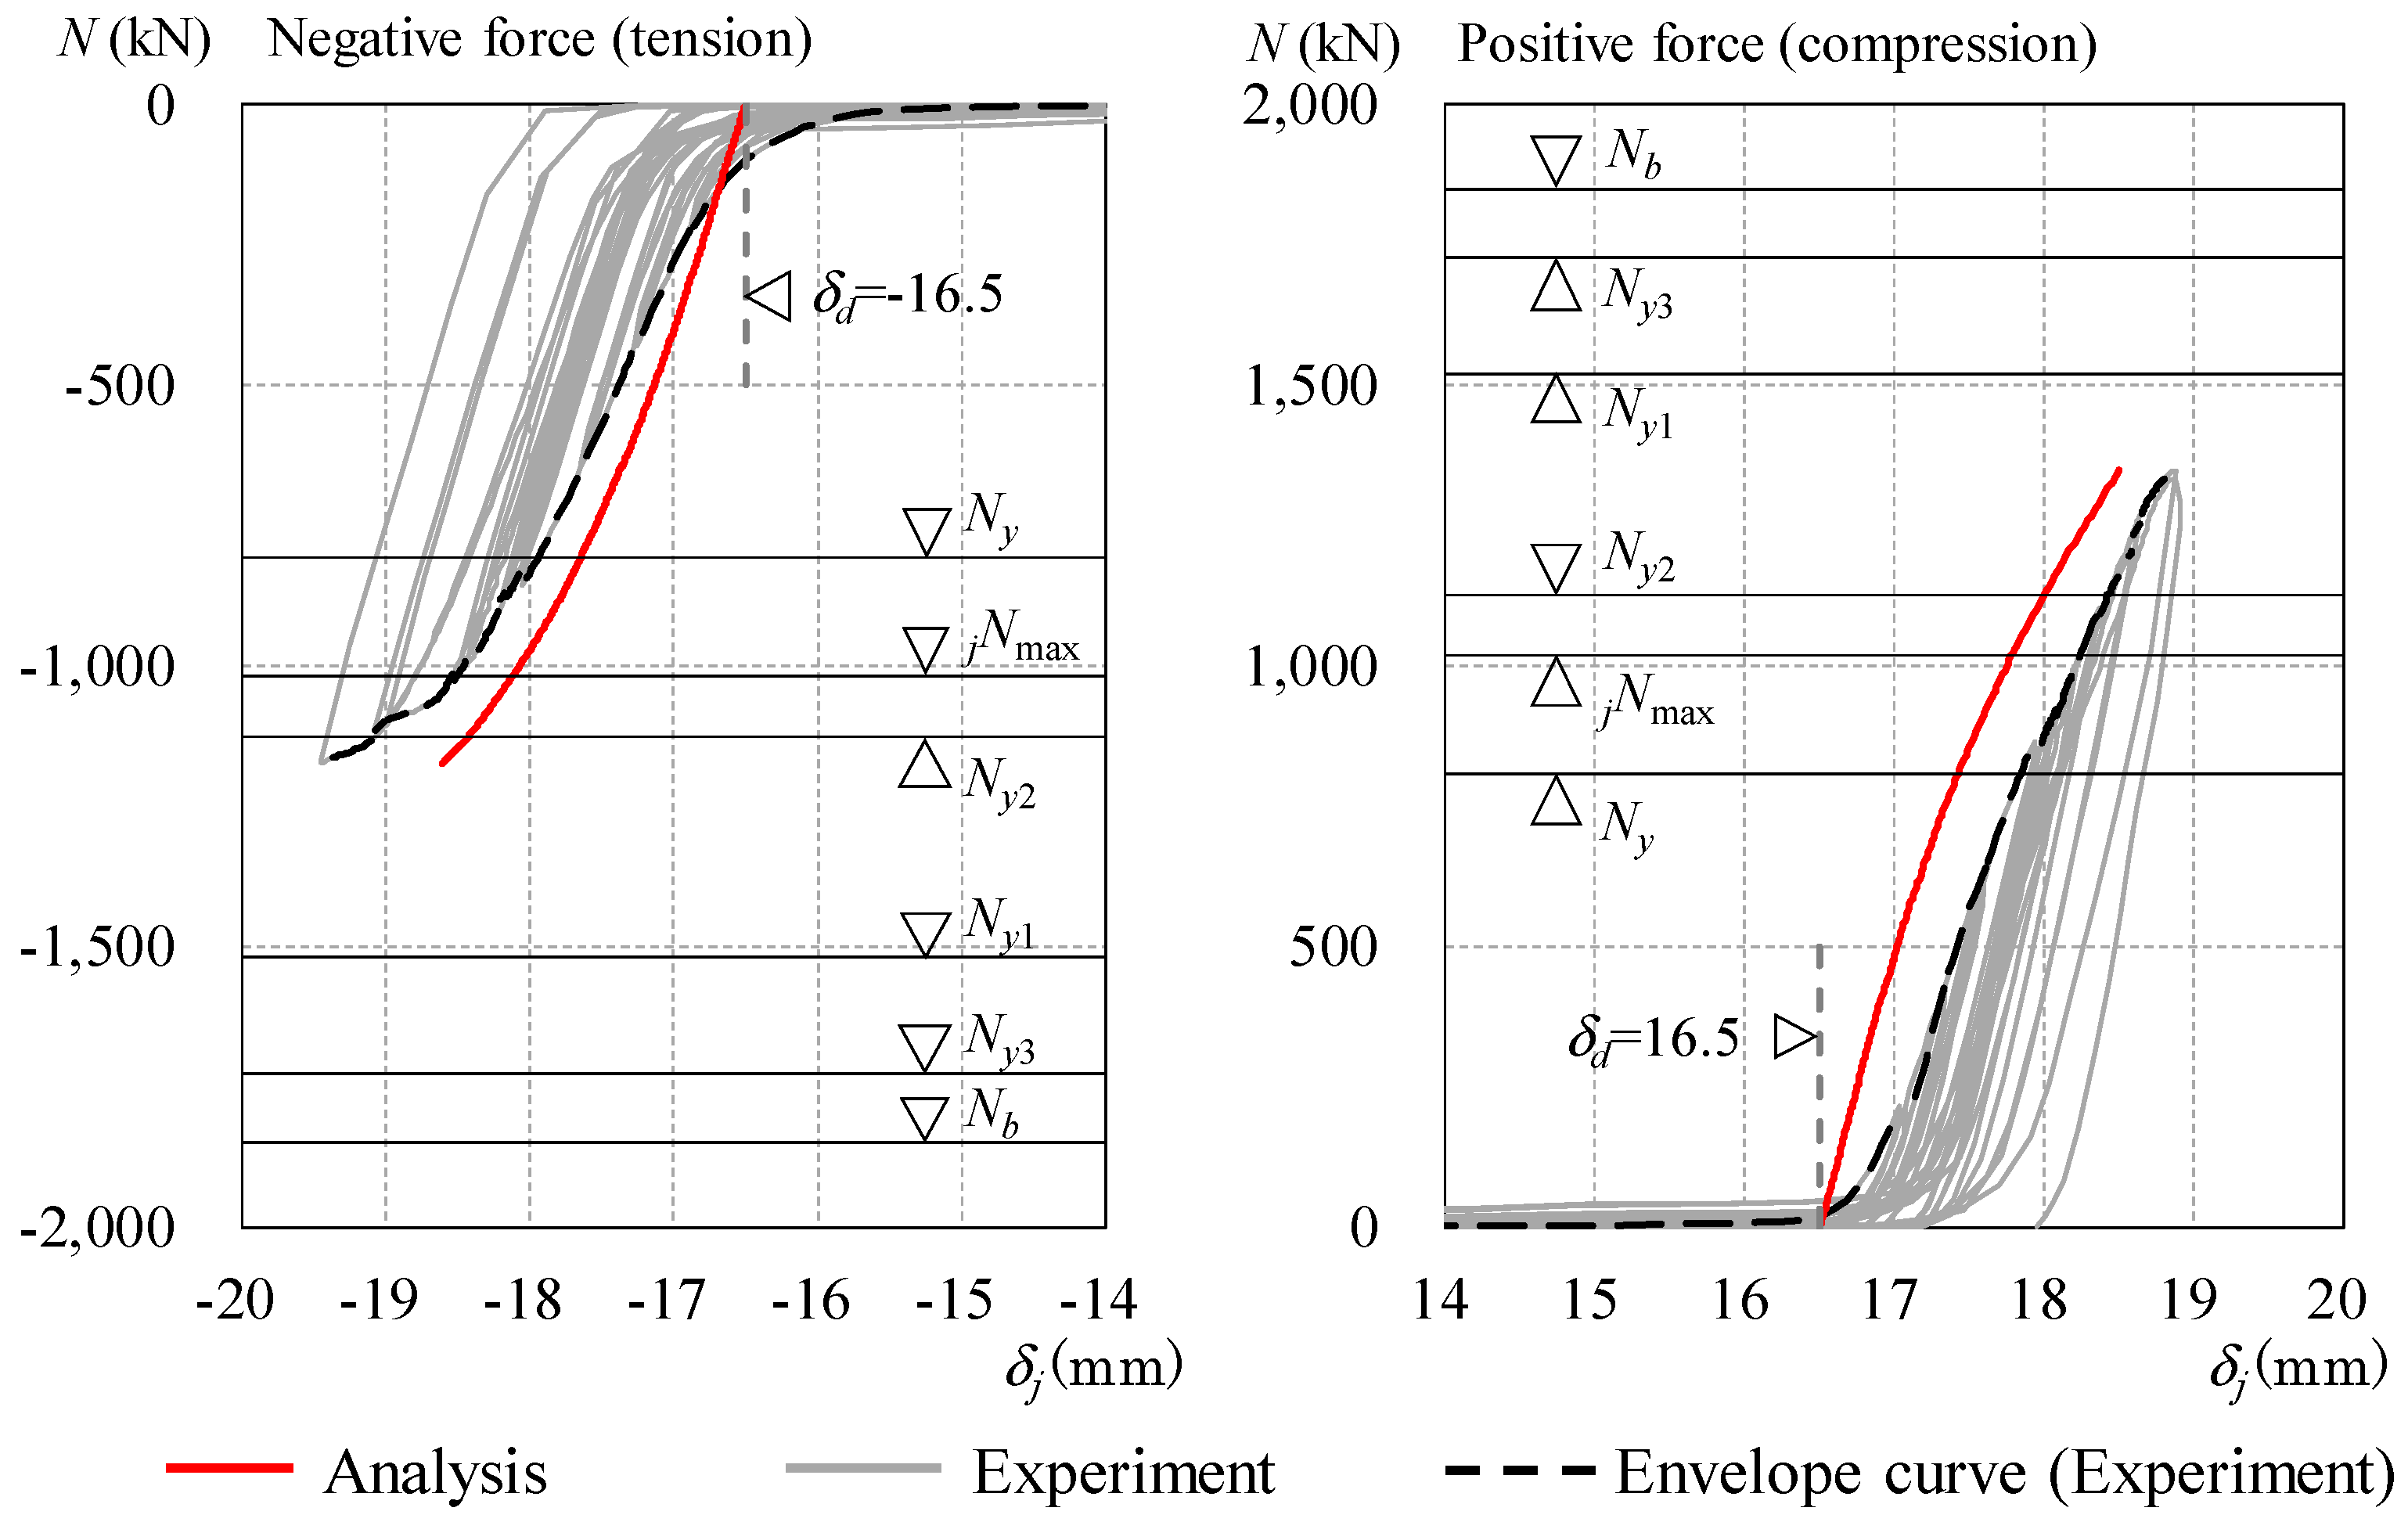
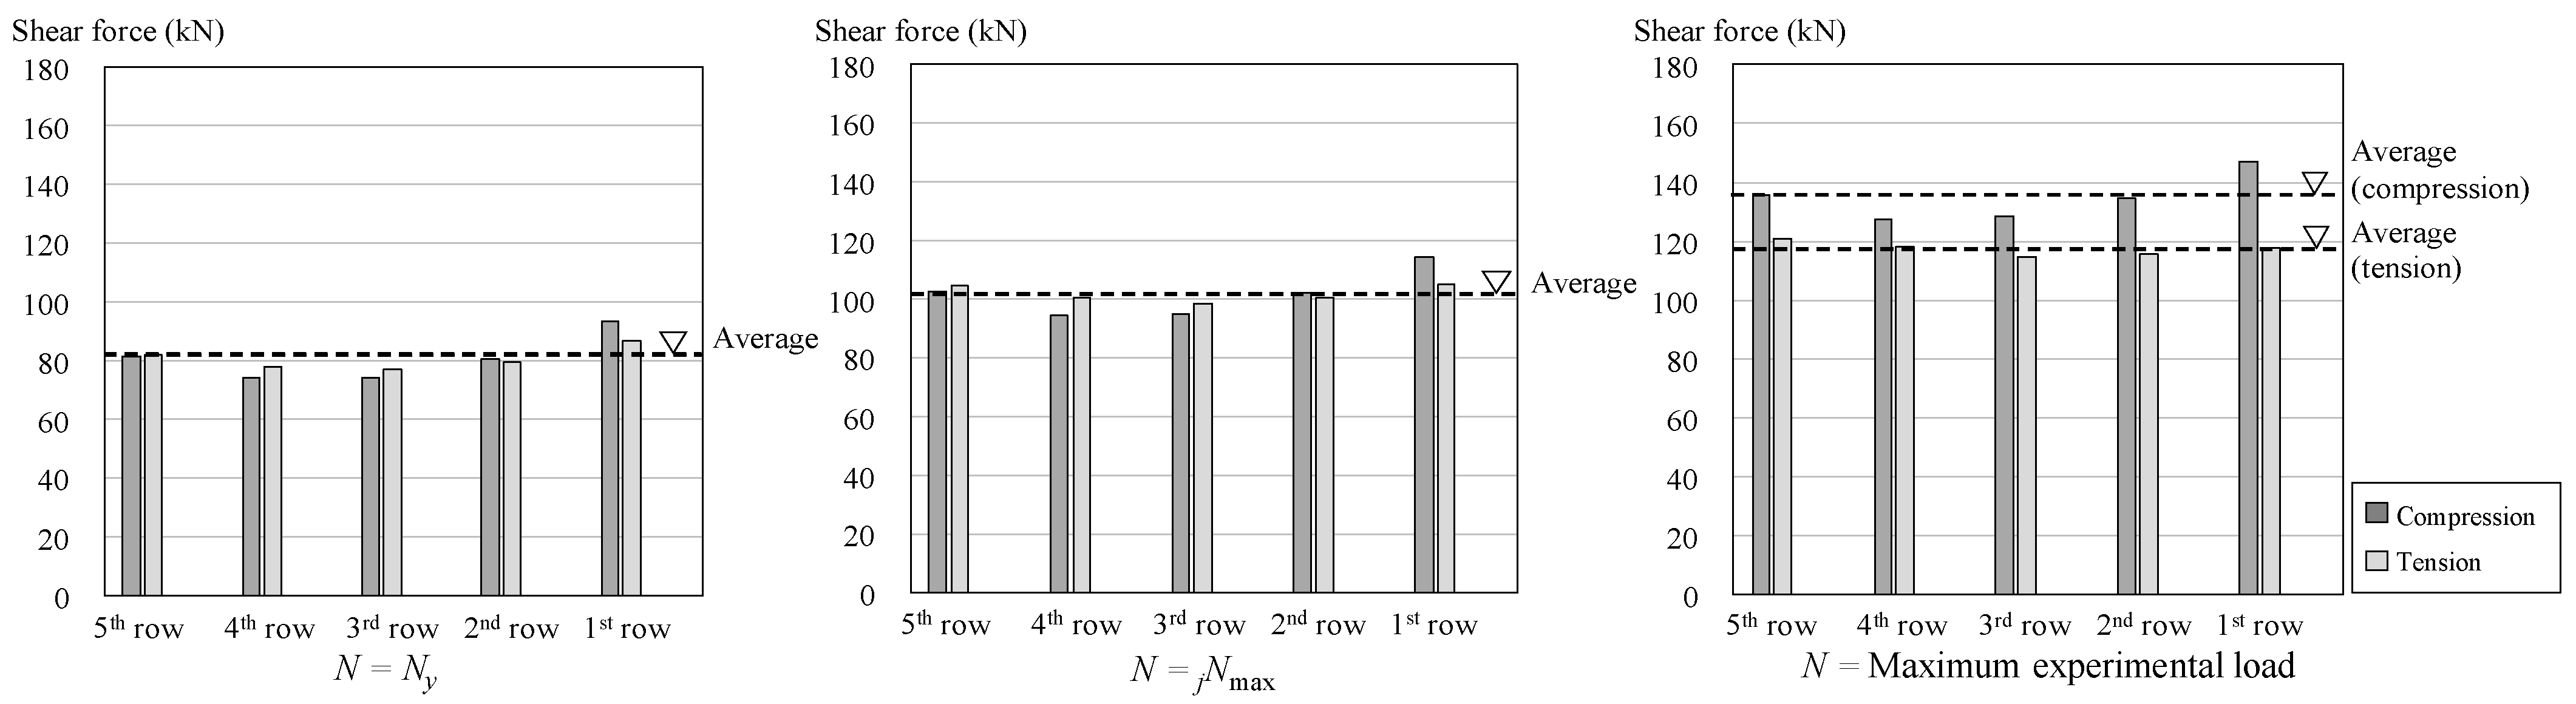
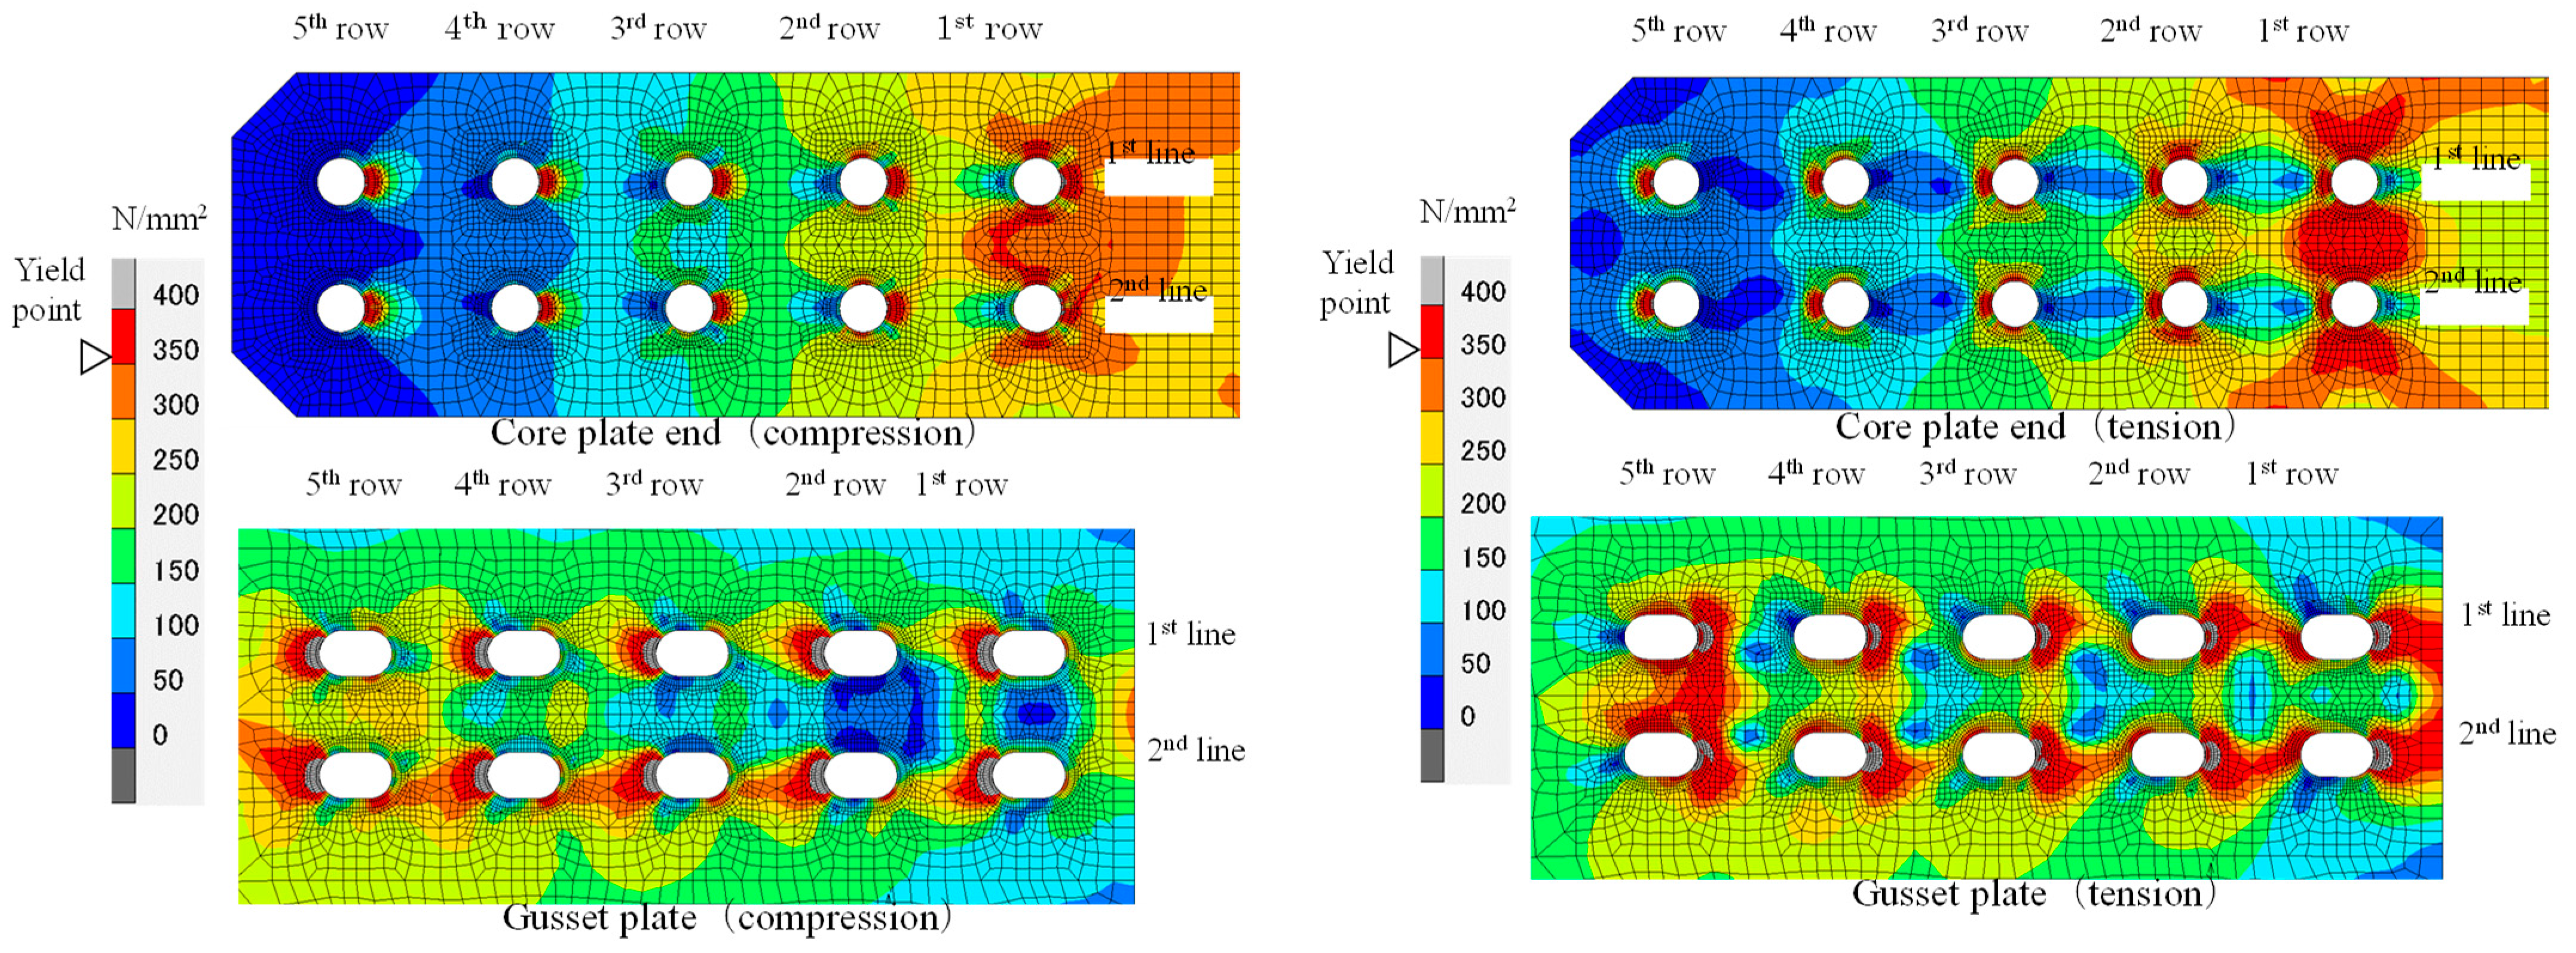
6.4. Analysis Results of the Overall Model

Figure 20 presents the relationships between the axial force N and joint axial deformation δj for the test and analysis results. The experimental results show that the axial force started to increase around the designated joint slip of δd = ±16.5 mm. This behavior was induced by the contact time difference between the 10 bolts, owing to the assembling and manufacturing issues of the test specimen. Nevertheless, the tangential stiffness of the test specimen became close to the initial stiffness in the analysis as the axial force increased. Consequently, the analysis curves and experimental envelope curves were in good agreement. The experimental and analytical results exhibit no clear reduction in stiffness up to the load level of jNmax.
Figure 21 compares the shear forces in the bolt shanks in each row, where each value was obtained as the average of the bolts at lines 1 and 2. The analysis results reveal that the bolts in the first and fifth row bear a slightly larger shear force than those at the medium potion. The variation in the shear forces in each bolt tends to be smaller as the axial force increases.
Figure 22 presents the equivalent stress distribution in the core and gusset plates at the maximum experimental load. In the core plate, the portion around the first row of bolts exhibited the largest stress. Contrariwise, the portion around the fifth-row bolts for the gusset plate showed the largest tress. It can be inferred that this discrepancy of the stress value between the core and gusset plates induced the larger shear force in the first and fifth bolt rows, as presented in Figure 21.

7. Conclusions

This study proposed the displacement-restraint buckling-restrained brace (DR-BRB) using double core plates for vibration control of building structures. The delayed-action mechanism using gusset plates with multiple slot holes was implemented in the DR-BRB, which allows for no axial force to initially appear, and then the axial force occurs with a delay under the designated vibration amplitude, such that the natural period can maintain the same level as the moment frame without bracing, and the concentration of the deformation into the local stories can be avoided for high-rise buildings.
To clarify the cyclic performance of DR-BRBs, cyclic loading tests under the incremental amplitude and constant amplitude loading were conducted. From the test results, it was confirmed that no axial force appeared in DR-BRBs up to the slip amount provided as the designated slot hole length, and that the load increased after the bolts contacted the gusset plates. The hysteretic loops exhibited stable spindle-shaped hysteresis properties with sufficient plastic deformation capacity. It was also confirmed that the slot hole elongation was rather small, although a local plastic deformation was slightly observed at the slot hole surfaces, owing to the bearing pressure force. In practical engineering, the slot hole length is determined based on the seismic response analysis of building structures to be designed considering designated earthquake intensity.
Furthermore, the design equations of the joints were formulated based on the AIJ Recommendations for Design of Connections in Steel Structures. It was revealed that the test results could be evaluated by the proposed design equations.
Finally, the delayed-action mechanism and validity of the proposed design equations were verified using finite element analysis, confirming that the results generally agreed with the experimental results. The equivalent stress distributions on the core plate ends and gusset plates were demonstrated in detail. The load transfer mechanism through each bolt was also discussed.

Author Contributions

Conceptualization, M.S. and H.T.; acquisition of experimental and numerical analysis data, M.U. and M.N.; data validation, X.C. and M.N.; writing draft, M.S. and H.T.; visualization, M.N.; supervision, H.T. All authors have read and agreed to the published version of the manuscript.

Funding

This research received no external funding.

Data Availability Statement

Data are contained within the article.

Acknowledgments

The cooperation of Takamiya Co., Ltd. in the production of the test specimens and the experiments in this study is gratefully acknowledged. The cooperation of Hajime Saito, formerly of Takamiya Corporation, in the planning of this study and in the compilation of the experimental results is also gratefully acknowledged. We would like to express our deepest gratitude to them.

Conflicts of Interest

Authors Makoto Sakai, Makoto Uehara and Makoto Nishimura were employed by the company Tekken Corporation. The remaining authors declare that the research was conducted in the absence of any commercial or financial relationships that could be construed as a potential conflict of interest.

References

  1. Ichimura, S.; Fukushima, T.; Teramoto, T. Study on the seismic design parameters of steel high-rise building, Summaries of technical papers of annual meeting. Archit. Inst. Jpn. 1999, C-1, 305–306. (In Japanese) [Google Scholar]
  2. Araki, Y.; Kim, M.; Nishimoto, A.; Ikago, K.; Uetani, K. Deformation concentration to lower stories in high-rise steel buckling-restrained braced frames subject to long-period earthquake ground motions. J. Struct. Constr. Eng. Trans. AIJ 2013, 78, 743–752. (In Japanese) [Google Scholar] [CrossRef]
  3. Hou, X.; Tagawa, H. Displacement-restraint bracing for seismic retrofit of steel moment frames. J. Constr. Steel Res. 2009, 65, 1096–1104. [Google Scholar] [CrossRef]
  4. Judd, J.P.; Charney, F.A. Seismic collapse prevention system for steel-frame buildings. J. Constr. Steel Res. 2016, 118, 60–75. [Google Scholar] [CrossRef]
  5. Mousavi, S.A.; Zahrai, S.M. Contribution of pre-slacked cable braces to dynamic stability of non-ductile frames; an analytical study. Eng. Struct. 2016, 117, 305–320. [Google Scholar] [CrossRef]
  6. Fanaie, N.; Aghajani, S.; Afsar Dizaj, E. Theoretical assessment of the behavior of cable bracing system with central steel cylinder. Adv. Struct. Eng. 2016, 19, 463–472. [Google Scholar] [CrossRef]
  7. Kaveh, A.; Eslamlou, A.D.; Sheikhi, R. Seismic performance of steel structures retrofitted with optimal slack cable collapse prevention system. J. Build. Eng. 2020, 31, 101392. [Google Scholar] [CrossRef]
  8. Ghasemi, M.; Fanaie, N.; Khorshidi, H. Seismic performance factors of a dual system with IMRF and cable-cylinder bracing. J. Build. Eng. 2021, 39, 102309. [Google Scholar] [CrossRef]
  9. Ghasemi, M.; Zhang, C.; Khorshidi, H.; Sun, L. Seismic performance assessment of steel frames with slack cable bracing systems. Eng. Struct. 2022, 250, 113437. [Google Scholar] [CrossRef]
  10. Tagawa, H.; Inooka, K. Prevention of story drift amplification in a 20-story steel frame structure by tension-rod displacement–restraint bracing. Struct. Des. Tall Build. 2018, 27, e1411. [Google Scholar] [CrossRef]
  11. Watanabe, K.; Yamakawa, M.; Asakawa, T. Response control design of moment-resisting steel frames using displacement-restraint brace and damping mechanism. J. Struct. Eng. (AIJ) 2020, 66B, 433–440. (In Japanese) [Google Scholar]
  12. Pan, P.; Li, W.; Nie, X.; Deng, K.; Sun, J. Seismic performance of a reinforced concrete frame equipped with a double-stage yield buckling restrained brace. Struct. Des. Tall Build. 2017, 26, e1335. [Google Scholar] [CrossRef]
  13. Sun, J.; Pan, P.; Wang, H. Development and experimental validation of an assembled steel double-stage yield buckling restrained brace. J. Constr. Steel Res. 2018, 145, 330–340. [Google Scholar] [CrossRef]
  14. Xie, Q.; Zhou, Z.; Meng, S.P. Experimental investigation of the hysteretic performance of self-centering buckling-restrained braces with friction fuses. Eng. Struct. 2020, 203, 109865. [Google Scholar] [CrossRef]
  15. Friis, T.; Katsanos, E.I.; Saberi, M.; Koss, H. Two-level friction damping and its application for passive multi-functional vibration control of high-rise buildings. Eng. Struct. 2021, 239, 112310. [Google Scholar] [CrossRef]
  16. Zhang, A.; Wang, H.; Jiang, Z.; Guo, K.; Niu, Z. Numerical simulation analysis of double yield points assembled buckling-restrained brace with replaceable inner core. Structures 2022, 35, 1278–1294. [Google Scholar] [CrossRef]
  17. Yang, C.; Xie, L.; An, N.; Li, A.; Liu, Q.; Wang, X. Development of a novel parallel double-stage yielding buckling restrained brace: Theoretical, experimental, and numerical investigations. J. Build. Eng. 2023, 68, 106089. [Google Scholar] [CrossRef]
  18. Shirai, K.; Sano, T.; Suzui, Y. Energy response of a passive variable friction damper and numerical simulation on the control effects for high-rise buildings. Struct. Contr. Health Monit. 2022, 29, e3124. [Google Scholar] [CrossRef]
  19. Chen, L.; Wang, D.; Shi, F.; Zhang, R.; Sun, Z. Hysteretic performance of self-centering buckling-restrained braces with embedded friction spring. Eng. Struct. 2023, 280, 115595. [Google Scholar] [CrossRef]
  20. Lu, Y.; Liu, Y.; Wang, Y.; Liu, J.; Huang, X. Development of a novel buckling-restrained damper with additional friction energy dissipation: Component tests and structural verification. Eng. Struct. 2023, 274, 115188. [Google Scholar] [CrossRef]
  21. Latour, M.; Piluso, V.; Rizzano, G. Free from damage beam-to-column joints: Testing and design of DST connections with friction pads. Eng. Struct. 2015, 85, 219–233. [Google Scholar] [CrossRef]
  22. Maglio, M.; Montuori, R.; Nastri, E.; Piluso, V. Design, analysis and assessment of MRFs equipped with FREEDAM connections and designed by TPMC: Comparison with traditional connections. Lect. Notes Civ. Eng. 2022, 262, 508–516. [Google Scholar]
  23. Guo, Y.L.; Zhang, B.H.; Jiang, Z.Q.; Chen, H. Critical load and application of core-separated buckling-restrained braces. J. Constr. Steel Res. 2015, 106, 1–10. [Google Scholar] [CrossRef]
  24. Zhu, B.L.; Guo, Y.L.; Zhou, P.; Bradford, M.A.; Pi, Y.L. Numerical and experimental studies of corrugated-web-connected buckling-restrained braces. Eng. Struct. 2017, 134, 107–124. [Google Scholar] [CrossRef]
  25. Yuan, Y.; Qing, Y.; Wang, C.L.; Lin, X.; Zhu, M. Development and experimental validation of a partially buckling-restrained brace with dual-plate cores. J. Constr. Steel Res. 2021, 187, 106992. [Google Scholar] [CrossRef]
  26. Architectural Institute of Japan. Recommended Provisions for Seismic Damping Systems Applied to Steel Structures; Architectural Institute of Japan: Tokyo, Japan, 2014. (In Japanese) [Google Scholar]
  27. Architectural Institute of Japan. Recommendations for Design of Connections in Steel Structures; Architectural Institute of Japan: Tokyo, Japan, 2021. (In Japanese) [Google Scholar]
  28. Architectural Institute of Japan. Recommendations for the Design and Fabrication of Light Weight Steel Structures; Architectural Institute of Japan: Tokyo, Japan, 2002. (In Japanese) [Google Scholar]
  29. Marc. Volume A: Theory and User Information; MSC Software Corporation: Newport Beach, CA, USA, 2010. [Google Scholar]
  30. Kuwahara, S.; Yasuhara, S.; Kato, A. Factors influencing slip coefficient of high strength bolted friction joints with slot holes. J. Struct. Eng. (AIJ) 2021, 67B, 351–356. (In Japanese) [Google Scholar]
Figure 1. Concept of the displacement-restraint (DR) bracing.
Buildings 14 02698 g001
Figure 2. Maximum story drift angle distribution for a large earthquake [10].
Buildings 14 02698 g002
Figure 3. Details of buckling-restrained brace.
Buildings 14 02698 g003
Figure 4. Core plate and gusset plate connection. (a) Joint detail; (b) Built-up process.
Buildings 14 02698 g004
Figure 5. Bolt position in the slot holes.
Buildings 14 02698 g005
Figure 6. Test setup.
Buildings 14 02698 g006
Figure 7. Photographs of the test specimen. (a) Overall view (b) Connection at lower gusset plate.
Buildings 14 02698 g007
Figure 8. Displacement measurement position.
Buildings 14 02698 g008
Figure 9. Horizontal load P and drift angle R relationships.
Buildings 14 02698 g009
Figure 10. Brace axial force and joint axial displacement relationships.
Buildings 14 02698 g010
Figure 11. Photographs of test specimen at the final stage of loading. (a) Gusset plates with slot holes (b) Bolt nuts at gusset plates.
Buildings 14 02698 g011
Figure 12. Brace axial force N and axial strain εa at the core yield portion relationships.
Buildings 14 02698 g012
Figure 13. Failure modes for determination of joint yield strength.
Buildings 14 02698 g013
Figure 14. Comparison of design yield strength and experimental result for A2.
Buildings 14 02698 g014
Figure 15. Overview of the analysis model for the single bolt case.
Buildings 14 02698 g015
Figure 16. Axial force N and axial deformation δ relationships for four focus points.
Buildings 14 02698 g016
Figure 17. Equivalent stress distribution in longitudinal and shear planes of the bolt shank.
Buildings 14 02698 g017
Figure 18. Equivalent stress distribution in the slot hole.
Buildings 14 02698 g018
Figure 19. Analysis model of the overall joint.
Buildings 14 02698 g019
Figure 20. Axial force N and joint axial deformation δj relationship.
Buildings 14 02698 g020
Figure 21. Comparison of shear forces in bolt shanks.
Buildings 14 02698 g021
Figure 22. Equivalent stress distribution at maximum experimental loads.
Buildings 14 02698 g022
Table 1. List of test specimens.
Specimen
ID
JointLoading Protocol
Slot Hole Size
(mm)
Slip Distance;
δd (mm)
Drift Angle at Start of the Brace Action
Rd (Rad)
A122 × 30.512.5±1/200Increasing amplitude
A222 × 34.516.5±1/150
A322 × 42.524.5±1/100
B122 × 34.516.5±1/150Constant
amplitude
Drift angle amplitude
±1/50
B2Drift angle amplitude
±1/37.5
Table 2. Tensile test results for core steel plates.
Plate ThicknessSteel GradeYield Stress
σsy (N/mm2)
Ultimate Stress
σsu (N/mm2)
Elongation
(%)
14 mmSN490B35354628
Table 3. Initial deflection and yield axial force of brace.
Specimen
ID
Initial DeflectionYield Axial Force
Ny
A11/8400810 kN
A21/7800808 kN
A31/12,600808 kN
B11/4500808 kN
B21/10,000805 kN
Table 4. Comparison of joint yield capacity and design axial force.
NotationTarget PortionJoint Yield Capacity
(kN)
Brace Yield Capacity
Ny (kN)
Joint Design Axial Force
jNmax (kN)
Ny1Bolts
(10 bolts)
15207281019
Ny2Core plate ends
(2 plates)
1127
Ny3Gusset plateMiddle rupture1728
Outer rupture3377
End rupture3101
NbSlot holes
(10 slots)
1850
Disclaimer/Publisher’s Note: The statements, opinions and data contained in all publications are solely those of the individual author(s) and contributor(s) and not of MDPI and/or the editor(s). MDPI and/or the editor(s) disclaim responsibility for any injury to people or property resulting from any ideas, methods, instructions or products referred to in the content.

