Abstract
A detection and evaluation system containing a two-level index of structural integrity and bearing capacity was constructed based on ground-penetrating radar (GPR) and a falling weight deflector (FWD). This system was constructed to solve problems with the detection, evaluation, and structural and material design of asphalt rehabilitation for the prevention and control of asphalt reflection cracks in asphalt overlaying composite Portland cement pavement. Based on the detected data from the GPR and FWD, the reasonable and recommended thickness range of the stress-absorbing layer was determined by the finite element method, and the optimization design of an anti-reflective crack structure is proposed. Furthermore, a material design and engineering application of the stress-absorbing layer was carried out. The results show that an additional 10 cm layer of repaved asphalt can reduce temperature stress by 64.1%, reduce fatigue stress by 29.3% at the cement slab bottom, and extend the service life by 23.1 years. The reasonable thickness of the stress-absorbing layer ranges from 1.6 cm to 2.0 cm, and the recommended structural combination design is a 4 cm SMA-13 upper layer, a 4 cm AC-16 lower layer, and a 2 cm stress-absorbing layer overlaying existing asphalt overlay. The impact toughness of the designed stress-absorbing layer is 1.05 times and 1.44 times that of the other stress-absorbing layer and the AC-16 asphalt mixture, respectively, which have been successfully used for more than 5 years. The recommended design rehabilitation has good engineering application. The uniformity of the stress-absorbing layer can reach 63%, and an anti-reflective crack effect is expected. The results of this study provide design methodology and experience for composite pavement repaving.
1. Introduction
The reconstruction and expansion of expressways is an important way to ensure the high-quality development of traffic networks in the future [1,2]. At present, domestic expressway reconstruction and expansion projects are mainly distributed within the traffic-developed provinces, and asphalt pavement with a semi-rigid base layer is the main pavement structure. However, there is limited experience with the reconstruction and expansion of repaved asphalt layers on existing composite Portland cement pavements [3]. A composite Portland cement pavement with an asphalt overlay has the characteristics of both traditional cement concrete pavement and asphalt pavement, which is much more complicated in terms of stress and disease characteristics [4,5,6]. Because of the covering of asphalt overlay and the structural properties of rigid cement slabs, its disease has great concealment and uncertainty [7,8].
The service life of composite Portland cement (PCC) pavements can be extended through the application of asphalt overlays, which also enhance driving comfort and reduce road noise [8,9]. However, the effectiveness of such overlays is often compromised by the appearance of reflective cracks that propagate from the underlying PCC layer through the new asphalt layer. This phenomenon not only diminishes the aesthetic quality but also threatens the structural integrity of the pavement. Given the significant economic and safety implications associated with pavement maintenance and rehabilitation, developing innovative techniques for mechanical response analysis and anti-reflective crack design in new asphalt overlays is of paramount importance.
At present, the primary problem with adding a repaved asphalt layer on top of existing composite Portland cement pavement with an asphalt overlay is that there is no detection and evaluation method for concealed and uncertain diseases. The current design codes of pavement maintenance in China are JTG 5142 and JTJ 073, which are the main specifications of highway asphalt pavement maintenance suitable for single asphalt pavement or single cement pavement, but there is no specific regulation for the maintenance and detection of existing composite Portland cement pavement with asphalt overlays [10,11]. In recent years, researchers have performed a lot of work in pavement disease detection, evaluation, and maintenance, including the use of various advanced artificial intelligence (AI) detection methods, as well as the use and development of decision trees and other disease assessment and program decision-making tools [9,12,13,14]. AI detection methods in pavement maintenance exhibit notable advantages, capable of efficiently analyzing vast datasets and accurately predicting future damage, thereby reducing the need for emergency repairs and minimizing long-term costs. However, these methods also entail substantial initial investments and require specialized knowledge, relying on high-quality training data. Additionally, they may face challenges related to model generalization capabilities and may not be directly applicable in specific regions [15,16]. In engineering, the detection and maintenance design of composite Portland cement pavement with an asphalt overlay generally refers to the technical specification of asphalt pavement maintenance. Engineers view the functional repair of the existing asphalt overlay as the main goal, based on the surface check data for main cracks and pit defects, which does not involve checking the calculation and design of the existing pavement structure [17]. In some cases, the existing asphalt overlay is first milled, the maintenance technical specification of cement pavement is referenced, and then the existing cement concrete slab is tested by FWD for the void and joint load transfer capacity, and the bending and tensile strengths are tested from a drilling core; the checking calculation of the pavement structure refers to JTG D40-2011 [18]. However, there are some problems. Firstly, milling an existing asphalt overlay will result in asset waste and solid waste pollution. Secondly, the mechanical parameters of a thin or broken asphalt overlay or loose and low-strength cement-stabilized base layer under a cement slab cannot be obtained. Thus, the design of the overlay and stress-absorbing layer usually depends on empirical parameters. The structure and material of the stress-absorbing layer do not align with the actual stress response of existing composite Portland cement pavement with an asphalt overlay [19,20,21,22]. This is one of the main reasons that reflective cracks develop in asphalt overlays [23,24]. Generally, there is no systematic method for detecting and evaluating existing composite Portland cement pavements with an asphalt overlay. The design of additional repaving overlays tends to be overly experiential, leading to potential over-design or an unreliable design [25,26].
To address the issues of inadequate detection and evaluation methods, as well as the heavy reliance on empirical design in structure and materials, ground-penetrating radar (GPR) and a falling weight deflectometer (FWD) were employed. These tools obtained mechanical parameters based on the reconstruction and expansion project of the western section of the Shenzhen–Shanwei Expressway. Subsequently, the mechanical response of the existing composited Portland cement pavement with an asphalt overlay was investigated using Abaqus commercial software version 6.14. Furthermore, the structure and material design of additional repaving overlay is proposed for improving the anti-reflective cracking ability.
2. Project
The reconstruction and expansion project of the western section of the Shenzhen–Shanwei Expressway is a crucial segment of the Shenyang–Haikou National Expressway in China. With a maximum annual average daily traffic volume of 62,418 passenger car units, it serves as the primary thoroughfare linking the core of the Pearl River Delta with eastern Guangdong. The road was constructed and opened to traffic in 1996, and it underwent significant rehabilitation during 2008–2009. The distribution proportions of the current pavement structure and various combinations of pavement structures are presented in Table 1 and Table 2, respectively.

Table 1.
Current pavement structure combination.
Table 2.
Ratio of the current pavement structure combination.
In Table 1 and Table 2, it can be seen that the main type of pavement structure in the reconstruction and extension project is Type B, commonly known as existing composited Portland cement pavement with an asphalt overlay. Types B-1 and B-2 are almost identical except for the difference in the thickness of their structural layers, which, together, account for more than 75% of the total length of the route. This research focused on the study and practical implementation of anti-reflective crack structures and material designs for Type B pavements.
3. Detection and Evaluation
In this study, 3D GPR and a FWD were employed to develop a detection and evaluation system [27,28,29,30,31,32]. This system assesses the structural integrity, thickness, and mechanical condition of the pavement layers. Additionally, dynamic monitoring and evaluation of typical sections of Type B pavement structures were conducted. The aim was to enhance the anti-reflective cracking capability of newly added repaving asphalt layers and to extend the pavement’s service life.
3.1. Pavement Structural Integrity
Three-dimensional GPR was used to assess the condition of the pavement in the section from K10+150 to K12+550. The results indicate that there are only a few minor voids beneath the cement slab, with none exceeding 0.2 m2 in the light-duty driveway and none larger than 0.8 m2 in the heavy-duty driveway. The cement slab exhibited good integrity. Surface diseases were also detected and evaluated using manual detection methods. The data revealed that the predominant surface disease was the relatively uniform distribution of transverse cracks, with densities of 18.5 cracks/km in the light-duty driveway and 98.5 cracks/km in the heavy-duty driveway. Notably, the density of transverse cracks in the asphalt layer of the heavy-duty driveway was significantly higher than that in the light-duty driveway.
According to the results from the 3D GPR and core drilling verification (see Figure 1), the characteristics of surface cracks in the existing asphalt overlay were analyzed. Approximately 63% of the transverse cracks were located directly above the joint of adjacent cement slabs. These cracks typically had a small width at the top and a large width at the bottom. The horizontal distance between the transverse crack and the center of the joint ranged from 3.1 cm to 30.5 cm and was characterized by a large width at the top and a small width at the bottom. The characteristics of these fractures align with those observed by Kim et al. [7,33,34]. A high probability of shear-type cracks occurred when the offset distance from the joint was 12.5 cm, but both shear-type and tension-type cracks were present within this range.
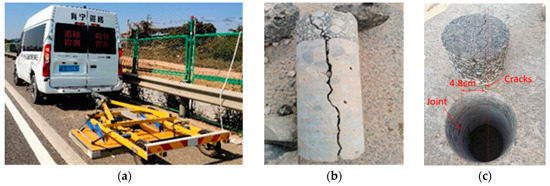
Figure 1.
Ground-penetrating radar detection and core drill verification. (a) Three-dimensional GPR; (b) right above the transverse crack; (c) offset from the joint by 4.8 cm.
As shown in Figure 2, the offset distance between the surface transverse cracks detected by manual walking inspection and the joint center of the adjacent cement slabs detected by 3D GPR in both the light-duty driveway and heavy-duty driveway within the section from K10+150 to K12+550 was analyzed statistically. For the light-duty driveway, the offset distance of the cracks ranged from 3.1 cm to 16.1 cm, with a 95% confidence interval for the mean offset distance ranging from 8.1 cm to 9.1 cm. In contrast, for the heavy-duty driveway, the offset distance of the cracks ranged from 8.3 cm to 30.6 cm, and the 95% confidence interval for the mean offset distance ranged from 13.5 cm to 13.9 cm. It can be concluded that increases in the load grade correspond to a greater influence distance of the joint on pavement transverse cracks.
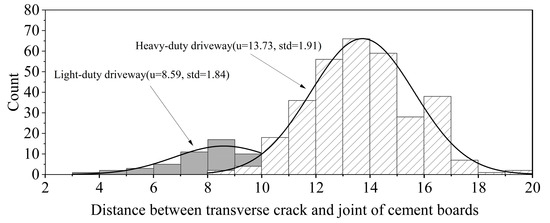
Figure 2.
Distribution of distance of transverse cracks from the center of the joint.
3.2. Pavement Layer Thickness
The thickness of the existing pavement asphalt overlay and the cement slab were tested using 3D GPR and calibrated by the in situ core drilling method. The results are shown in Table 3.
Table 3.
Structural layer thickness of composited Portland cement pavement with asphalt overlay.
From Table 3, it is evident that both the asphalt overlay thickness and the cement slab thickness were less than the designed values. Only 38.2% of the asphalt overlay measurements were thicker than the design thickness, while none of the cement slab measurements exceeded the design thickness. Concurrently, 3D GPR was used to determine the length of the cement slabs. The average length of the cement slabs was 5.0 m, with a coefficient of variation of 3.11%.
3.3. Pavement Bearing Capacity
In order to assess the safety reserve status of the Type B pavement in the section from K10+150 to K12+550, the mechanical state was detected and evaluated using the FWD. The Fourier method was then applied to normalize the load amplitude and load frequency of the deflection data [35]. The standard load amplitude was set at 50 kN, and the standard load frequency was 15 Hz [36,37]. The modulus of each layer of the Type B pavement was backcalculated based on the normalized FWD deflection basin [38,39,40]. The main steps in the modulus backcalculation process were as follows:
- Considering the requirement for the minimum parameters in pavement structure assessment and the convenience of structure evaluation, the pavement layer beneath the cement slab was considered as a layer of elastic half-space foundation. The pavement combination of Type B is thus represented as GAC-13C (modified), AC-25C (modified), cement concrete slab, and equivalent subgrade from top to bottom.
- The thickness range and modulus range of the four structural layers were specified, respectively. Subsequently, 5000 sets of theoretical pavement structures were randomly generated. The theoretical deflection basins for each of these pavement structures were then computed using the pavement analysis software KENLAYER.
- A database of defection basin parameters was constructed, which included indices such as the single deflection value, deflection ratio, deflection difference, curvature, shape factor, slope, area, and more. The relationship between these defection basin parameters from the theoretical deflection basins and the modulus of each pavement structural layer was established using a neural network model.
- According to (3), the defection basin parameters of the in situ measured deflection basin were computed, and the four moduli of the structural layer were predicted using the established neural network model. Subsequently, these four modulus values, along with the thickness measurements obtained by GPR, were input into KENLAYER to obtain the calculated modulus deflection basin. When the root mean square error (RMSE) is less than 10%, an acceptable backcalculated modulus combination of pavement structure can be obtained.
- The modulus combinations for each measured deflection basin were statistically analyzed. The mean modulus of each structure layer, along with the representative value at a 95% guarantee rate, are listed in Table 4.
Table 4. Modulus combination of Type B pavement.
At the same time, in order to verify the accuracy of the backcalculated modulus, 13 random core samples from in situ cement concrete slabs were tested for their bending tensile strength and bending elastic modulus. The representative bending tensile strength was found to be no less than 3.58 MPa at a 95% guarantee rate. According to the JTG D40-2011, the bending tensile strength of cement slab was converted into the bending elastic modulus of cement slab [41], as shown in Equation (1).
where is the bending strength of the cement concrete plate, MPa; is the conversion of the bending elastic modulus of the cement concrete plate, MPa. The results show that the difference between the tested modulus and the calculated modulus is less than 2.5%.
When utilizing the backcalculated dynamic modulus combination presented in Table 4 for pavement structure verification, the dynamic modulus master curve model was initially employed to adjust the temperature of the backcalculated dynamic modulus for the asphalt layer [37,42]. Furthermore, based on the designed traffic volume data, modulus combinations, and the thickness measured by 3D GPR, the methods described in JTG D40-2011 and the literature [40] were applied to verify and calculate the mechanical response and predict the service life of the Type B pavement. The detailed steps for life prediction are as follows:
(1) Based on the calculation model of the cumulative number of design axle loads on the design driveway during the design reference period described in JTG D40-2011 [41], see Equation (2).
where, is the number of design axle loads per day in the initial stage of the design lane, is the growth rate of traffic volume, and is the design reference period.
(2) From the perspective of reverse design, is understood as the number of residual axle load actions of the existing pavement structure considering its bearing capacity, and then the remaining service life of the existing pavement structure can be calculated by Equation (3) with the corresponding traffic growth rate.
(3) The number of residual axles loads that the existing pavement structure can endure is related to the current state of the pavement structure’s fatigue performance; see Equation (4).
where is a fatigue stress coefficient that takes into account the cumulative fatigue action of the load stress during the design reference period, and is the material fatigue index, which is usually 0.057.
(4) According to JTG D40-2011, can be determined by Equation (5).
where is the composite coefficient of stress, which is usually 1.15 for highways; is the coefficient of stress reduction, which is usually 0.85; is the load stress produced by the design axle load at the critical load position of the four-side free plate, which is calculated using Equation (6).
where is the grade of the design axle load, 100 kN; is the thickness of the concrete slab; is the relative stiffness radius, which is calculated using Equation (7).
where is the equivalent modulus of the top surface of the base measured by FWD backcalculation, as listed in Table 4; is the bending stiffness of the cement slab section, which is calculated using Equation (8).
where is the modulus of cement plate measured by FWD backcalculation, as listed in Table 4; is the Poisson ratio of the cement slab, which is usually 0.15. Moreover, in Equation (5) is the load fatigue stress produced by the design axle load at the critical load position of the slab, which can be calculated by Equation (9).
where is the standard bending tensile strength of cement slabs. is the guarantee factor, which is usually 1.64 for highways. is the temperature fatigue stress at the critical load position of concrete slabs, which is calculated by Equation (10).
where is the temperature fatigue stress coefficient, which is calculated using Equation (11).
where is 0.841, is 1.323, and is 0.058, which were determined according to the climate and environment of Guangdong Province. is the maximum temperature gradient produced by the slab, calculated as Equation (12).
where is the coefficient of the linear expansion of concrete, which is usually 1.1 × °C; is the maximum temperature gradient of the highway location in 50 years in the Guangdong area, which is generally 88 °C/m.
And is the thermal stress coefficient, which combines the thermal warping stress and the internal stress, calculated using Equations (14)–(16).
where is the temperature warping stress coefficient of concrete slabs; is the spacing of the transverse cracks in the concrete slabs. Considering the influence of asphalt overlay on temperature and the load stress of cement concrete slabs, the corrections of Equations (17) and (18) are as follows:
where and are determined according to the data provided by JTG D40-2011. The fitted models are the following Equations (19) and (20).
Using Equations (2)–(20), the remaining service life of cement pavement or existing composite Portland cement concrete pavement with an asphalt overlay can be calculated.
The results of the mechanical response and service life prediction for the Type B pavement structure in the section from K10+150 to K12+550, under the design traffic volume, are listed in Table 5.
Table 5.
Structural response and predicted service life under the design traffic volume.
Due to the influence of a thin structural layer, weak material, and increasing traffic volume, the service life prediction for the Type B pavement in the section from K10+150 to K12+550 was completed. Currently, the fatigue stress at the bottom of the cement concrete slab has decreased by 29.3%, while the temperature stress at the slab’s bottom has decreased by 64.1%. Consequently, the predicted service life of the Type B pavement is now 23.1 years.
4. Optimization Design of Repaving Structure
4.1. Optimization Principle of Repaving Structure Design
The challenges of repaving an asphalt layer on composite Portland cement concrete pavements with an asphalt overlay primarily encompass two aspects. The first is ensuring that the composite pavement structure can withstand sufficient traffic axle loads post-repaving. The second is guaranteeing that the repaved asphalt layer can effectively inhibit reflection cracks [43]. In this study, the feasibility of combining a 4 cm SMA-13 layer with a 6 cm AC-20 layer was preliminary affirmed through the establishment of a residual life prediction model based on 3D GPR and FWD data. However, this design does not fully address the requirement for anti-reflective cracking in the existing asphalt overlay and the repaving asphalt layer.
In this paper, a stress-absorbing layer is designed to dissipate the tensile and shear stresses at the bottom of the additional repaving asphalt layer and on the existing asphalt overlay. However, the combined thickness of the stress-absorbing layer and the AC-20 is 6 cm, which is constrained by the elevation of the pavement, and the total thickness of the additional repaving asphalt layer must be less than 10 cm.
4.2. Thickness Design of Stress-Absorbing Layer
Abaqus was utilized to calculate and analyze the impact of different thicknesses of the stress-absorbing layer on the stress at the bottom of the repaving asphalt layer, thereby determining the reasonable thickness of the stress-absorbing layer [44,45,46]. The primary parameters of the finite element model were as follows: the existing cement slab measured 5 m in length and 4.50 m in width, with a joint width of 5 mm. The load applied was BZZ-100, exerting a tire pressure of 707 kPa, with a tire width of 18.9 cm and a gap distance of 13.1 cm between the two tires. The load is positioned adjacent to the joint of the existing cement slab. The three-dimensional solid element (C3D8R) was employed for finite element mesh division. The boundary conditions were set to full constraints, and the interlayer was configured for complete continuity. Points A, B, and C represent the calculation points for stress response at the bottom of the new asphalt overlay, the stress-absorbing layer, and old asphalt overlay, respectively, as depicted in Figure 3.

Figure 3.
Parameters and results of finite element analysis. (a) Schematic diagram of load and stress calculation points; (b) boundary conditions; (c) cloud map of finite element numerical calculations.
The parameters of the existing pavement structure and material are shown in Table 4. The parameters of the repaving asphalt layer are referenced from JTG D50-2017 [47]. The modulus of SMA-13 and AC-20 were 12,000 MPa and 10,000 MPa respectively, and their Poisson’s ratios were both 0.25. The modulus of the stress-absorbing layer was 4000 MPa according to reference [48]. The relationship between the stress response at points A, B, C, and the thickness of the stress-absorbing layer is illustrated in Figure 4.
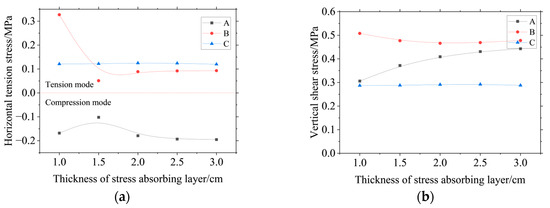
Figure 4.
Relationship between stress response and stress-absorbing layer thickness. (a) Horizontal tension stress; (b) vertical shear stress.
According to Figure 4, the horizontal tensile stress and vertical shear stress at point C, located at the bottom of the existing asphalt overlay, are not sensitive to the thickness of the stress-absorbing layer. The horizontal tensile stress remains relatively stable at approximately 0.121 MPa, while the vertical shear stress is generally consistent at about 0.289 MPa.
When comparing the horizontal tensile stress at points A, B, and C, it was observed that point B, at the bottom of stress-absorbing layer, and point C, at the bottom of the existing asphalt overlay, were both under tension, while point A, at the bottom of the new asphalt overlay, remained under compression. When the thickness of the stress-absorbing layer was less than 1.2 cm, the risk of tensile cracking was greatest at point B. As the thickness of the stress-absorbing layer approached 1.2 cm, the risk of tensile cracking shifted to point C. When the thickness of the stress-absorbing layer reached approximately 1.5 cm, the tensile stress at point B decreased significantly, reaching its lowest value of 0.089 MPa. Beyond a thickness of 1.5 cm, the tensile stress at point B slowly began to increase again. After the thickness exceeded 2 cm, the tensile stress at point B remained relatively unchanged. Therefore, when the thickness of the stress-absorbing layer was 1.5 cm, the risk of tension crack at its bottom was minimized.
Based on the comparison of the stresses at points A, B, and C, the vertical shear stress at point B, located at the bottom of the stress-absorbing layer, was the largest. When the thickness of the stress-absorbing layer was 2.0 cm, the minimum vertical shear stress at point B was 0.466 MPa. The second largest was the vertical shear stress at point A, which was at the bottom of the repaving asphalt layer, and this stress increased with the thickness of the stress-absorbing layer. However, the rate of increase in the vertical shear stress at point A slowed down when the thickness of the stress-absorbing layer exceeded 2.0 cm. The vertical shear stress at point C, at the bottom of the existing asphalt overlay, was the smallest and remained almost constant.
Upon combining the results of the horizontal tensile stress and vertical shear stress, it was determined that when the thickness of the stress-absorbing layer ranged from 1.5 cm to 2.0 cm, the risk of tensile and shear failure at point B, located at the bottom of the stress-absorbing layer, was minimized. Concurrently, the shear stress at point A, which was at the bottom of the additional repaving asphalt overlay, remained at a relatively low level. Therefore, the reasonable thickness of the stress-absorbing layer is concluded to be between 1.5 cm and 2.0 cm. Considering the practicality of spreading the stress-absorbing layer, a thickness of 2.0 cm was ultimately chosen. Consequently, the structure and thickness combination for the additional repaving asphalt layer on the existing asphalt overlay over the composite Portland cement concrete pavement was established as a 4 cm SMA-13, a 4 cm AC-20, and a 2 cm stress-absorbing layer.
5. Material Design of Stress-Absorbing Layer
5.1. Requirements and Objectives
Taking into account the compatibility of thickness and the nominal maximum particle size during on-site paving and rolling, as well as the reliability of uniformity control in asphalt mixture construction, the 4 cm AC-20 was modified to 4 cm AC-16 during the material design phase. The additional repaving asphalt layer on the existing composite pavement comprises three types of materials, that is, a 4 cm SMA-13 for the surface wear layer, a 4 cm AC-16 for the middle anti-rut layer, and a 2 cm stress-absorption layer for anti-reflective cracking. This paper primarily focuses on the material design of the stress-absorbing layer. According to Figure 4, the bottom of the stress-absorbing layer is mainly subjected to compressive stress and shear stress. Therefore, enhancing the compressive and high-temperature shear performance of the stress-absorbing layer mixture is both the requirement and goal of the material design.
It should be noted that to facilitate the concurrent preparation of material with 3–5 mm macadam, the maximum nominal particle size of the stress-absorbing layer was established at 5 mm.
5.2. Mixture Design of Stress-Absorbing Layer
5.2.1. Raw Materials
The aggregates consisted of 0–3 mm and 3–5 mm sandstone. The filler was limestone powder. The cement was P. O 32.5 retarded cement produced by Tower. The asphalt binder was produced by shell-graded PG 76-22. In addition, some high-performance modified asphalt was also suitable for the design of the stress-absorption layer [49,50]. The density of the aggregates, cement, filler, and asphalt binder are listed in Table 6, and the gradation of the aggregates is listed in Table 7.
Table 6.
Raw material performance.
Table 7.
Raw material grading.
5.2.2. Grading Design
Discontinuous skeleton density gradation design using the CAVF (coarse aggregate void filling) method [51,52,53] was carried out by the following steps:
Step 1: According to Equation (21), the coarse aggregate tight void was determined.
where is the compact density of the coarse aggregate, and is the apparent density of the coarse aggregate.
The initial contents of asphalt, filler, and design void were determined according to the design experience of the stress-absorbing layer. The initial asphalt content was set at 8.5%, the filler content at 8.0%, and the cement content at 1.5%, with a design void of 4.0%.
On the basis of Equations (22) and (23), the amounts of coarse and fine aggregate were determined using Equations (22) and (23):
where , , , , and are the mass percentages of coarse aggregate, fine aggregate, filler, cement, and asphalt binder, respectively. is the design void. , , , and are the apparent densities of fine aggregate, filler, cement, and asphalt binder, respectively. According to Equations (22) and (23), the mass percentages of coarse aggregate and fine aggregate were 69.0% and 21.5%, respectively. The gradation curve of the asphalt mixture is shown in Table 8.
Table 8.
Mixture grade design of stress-absorbing layer.
5.3. Performance Verification of Stress-Absorption Layer
According to the design results of Section 4.2, the asphalt binder content for the stress-absorbing layer was determined to be 8.5%, with percentages of 3–5 mm sandstone and 0–3 mm sandstone of 69% and 21.5%, respectively. The filler content was established at 8%, and the cement content at 1.5%. Indoor Marshall tests and related performance verification tests were performed. A slice of the test sample is shown in Figure 5, and the results are listed in Table 9.

Figure 5.
Marshall test specimens of asphalt mixture of stress-absorbing layer. (a) Top of specimens; (b) transverse slices.
Table 9.
Marshall test results of stress-absorbing layer.
The residual stability was 93.2%, the rutting tested at 60 °C was 5364 times/mm, and the rutting tested at 70 °C was 3773 times/mm. The water stability and high-temperature shear resistance were also ideal. The shear strength of the designed asphalt mixture for the stress-absorbing layer was 0.514 MPa, which exceeded the maximum vertical shear stress (0.466 MPa) when the thickness of the stress-absorbing layer was 2.0 cm.
Because the primary function of the stress-absorption in this section of Type B pavement plays is to absorb stress, the impact toughness test was used to evaluate and verify its stress-absorption capability [53]. The dimensions of the beam specimens were 250 mm × 35 mm × 35 mm, and three parallel specimens were tested. The load and mid-span displacement of the beams were obtained, as shown in Figure 6.
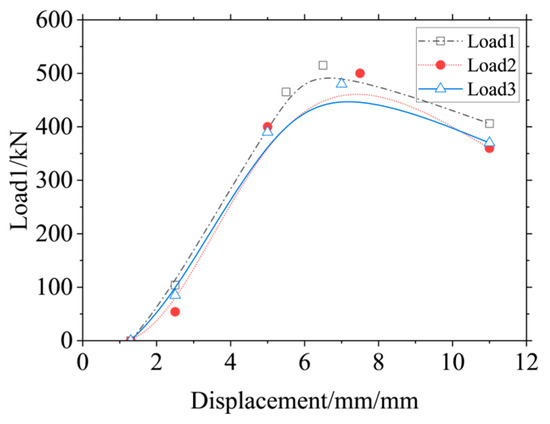
Figure 6.
Load–displacement curve of stress-absorbing layer samples.
The load–displacement area was calculated by the integral method according to Equation (24).
where is the impact toughness value of the tested stress-absorbing layer specimen. and are the peak values of failure load and the starting point of displacement of the beam specimen when the load is greater than 0. and are the load and mid-span displacements of the beams under a three-point bending test.
Upon calculating the impact toughness values of three parallel specimens, the impact toughness test value for the designed stress-absorbing layer was about 1599 N∙mm. This value is about 1.05 times and 1.44 times that of the stress-absorbing layer that has been used successfully for four years and the AC-16 asphalt mixture, respectively. It has been proven that the designed stress-absorbing layer in this paper has excellent stress-absorbing capability. The stress-absorbing layer is constructed using a spreading machine, and the construction technology is fundamentally similar to that of a hot mix asphalt mixture. The construction and workability of the stress-absorbing layer are ideal, with the in situ void ratio being controlled within the designed void range of 63%.
6. Conclusions
In this research, the mechanical response and anti-reflective crack design of a newly repaved asphalt layer and materials on the existing asphalt overlay of composite pavement were investigated based on the mechanical parameters obtained from GPR and FWD. The main conclusions are as follows:
- (1)
- A detection and evaluation system utilizing 3D GPR and FWD was developed to assess the structural integrity and bearing capacity. It accurately measures the layer thickness and modulus, with errors of less than 3%. Transverse cracks in asphalt overlays primarily arise from load-induced grade stresses and slab joint effects.
- (2)
- Additionally repaving with a 10 cm new asphalt layer can reduce temperature stress by 64.1% and fatigue stress by 29.3% at the cement slab bottom, and theoretically extends the service life by 23.1 years. To combat reflective cracking, the reasonable thickness of the stress-absorbing layer ranges from 1.5 cm to 2.0 cm. The optimal design for a Type B pavement repaving asphalt layer consists of a 4 cm SMA-13 for the surface wear layer, a 4 cm AC-16 for the anti-rutting layer, and a 2 cm stress-absorbing layer for anti-reflective cracking.
- (3)
- The ratio of asphalt binder to aggregate is 8.5%, with percentages of 3–5 mm sandstone and 0–3 mm sandstone of 69% and 21.5%, respectively. The impact toughness of the designed stress-absorbing layer was about 1599 N∙mm, which is about 1.05 times and 1.44 times that of the stress-absorbing layer that has been successfully used for four years and the AC-16 asphalt mixture, respectively. This proves that the stress-absorbing layer designed in this paper has excellent stress-absorbing capability.
Future Works
Since the finite element model discussed in this study is a static model and does not take into account the influence of the dynamic nonlinearity of structural materials, the effect of crack growth on the mechanical response will be further studied using a finite element method such as XFEM.
Author Contributions
Conceptualization, Z.Q. and C.X.; methodology, J.G.; investigation, J.G. and C.X.; formal analysis, J.G.; writing—review and editing, J.G. and C.X. All authors have read and agreed to the published version of the manuscript.
Funding
The authors would like to acknowledge the financial support provided by the National Natural Science Foundation of China (52178426), the Fundamental Research Funds for the Central Universities (2022ZYGXZR066 and 2023ZYGXZR001), and the Special Project of Foshan Science and Technology Innovation Team (2120001010776).
Institutional Review Board Statement
Not applicable.
Informed Consent Statement
Informed consent was obtained from all subjects involved in the study.
Data Availability Statement
The data presented in this study are available upon request from the corresponding author.
Acknowledgments
The authors would also like to acknowledge the project support from Guangdong Provincial Freeway Co., Ltd.
Conflicts of Interest
Authors Jianping Gao and Zhixiong Qiu were employed by the company Guangdong Provincial Freeway Co., Ltd. Author Chunlong Xiong was employed by the company Guangzhou Xiaoning Roadway Engineering Technology Research Institute Co., Ltd. The remaining authors declare that the research was conducted in the absence of any commercial or financial relationships that could be construed as a potential conflict of interest.
References
- Li, J.; Liao, C.; Xiong, C.; Chen, C.; Wang, Z.; Wu, C.; Li, S.; Li, W.; Xu, X. Research on distresses detection, evaluation and maintenance decision-making for highway pavement in reconstruction and expansion project. Case Stud. Constr. Mater. 2023, 19, e02451. [Google Scholar] [CrossRef]
- Itani, H.; Saad, G.; Chehab, G. The use of geogrid reinforcement for enhancing the performance of concrete overlays: An experimental and numerical assessment. Constr. Build. Mater. 2016, 124, 826–837. [Google Scholar] [CrossRef]
- Deng, H.; Fu, X.; Gao, W.; Ni, T.; Chen, K. Research on New Technology to Control Highway Semi-Rigid Base Asphalt Pavement Cracks. Adv. Eng. Mater. 2011, 194–196, 1632–1638. [Google Scholar]
- Li, S.; Liu, Z.; Chen, X. Application Technology of Thin Asphalt Concrete Overlay on Old Pavement. Adv. Eng. Mater. 2011, 282–283, 124. [Google Scholar]
- Ning, P.; Zhang, J.; Tian, Q. Numerical simulation analysis of the application of cement-mixed pile curtain in an expressway extension project. Int. J. Pavement Eng. 2018, 21, 170–176. [Google Scholar] [CrossRef]
- Li, Q.; Chen, Z.; Luo, S. Reflection Crack Analysis of Asphalt Overlay on Cement Concrete Pavement Based on XFEM. Adv. Civ. Eng. 2021, 2021, 1230447. [Google Scholar] [CrossRef]
- Zhao, Z.; Guan, X.; Xiao, F.; Xie, Z.; Xia, P.; Zhou, Q. Applications of asphalt concrete overlay on Portland cement concrete pavement. Constr. Build. Mater. 2020, 264, 120045. [Google Scholar] [CrossRef]
- Jin, T.; Liu, L.; Yang, R.; Sun, L.; Yuan, J. Investigation of interlayer bonding performance between asphalt concrete overlay and Portland cement concrete using inclined shear fatigue test. Constr. Build. Mater. 2023, 400, 132681. [Google Scholar] [CrossRef]
- Naseri, H.; Shokoohi, M.; Jahanbakhsh, H.; Golroo, A.; Gandomi, A.H. Evolutionary and swarm intelligence algorithms on pavement maintenance and rehabilitation planning. Int. J. Pavement Eng. 2022, 23, 4649–4663. [Google Scholar] [CrossRef]
- JTG/T 5142-01—2021; Technical Specifications for Maintenance of Highway Asphalt Pavement. Ministry of Transport of the People’s Republic of China: Beijing, China, 2021.
- JTJ 073.1—2001; Technical Specifications of Cement Concrete Pavement Maintenance for Highway. Ministry of Transport of the People’s Republic of China: Beijing, China, 2001.
- Vyas, V.; Singh, A.P. Modeling asphalt pavement condition using artificial neural networks. Mater. Today 2022, 62, 1671–1676. [Google Scholar] [CrossRef]
- Solatifar, N.; Lavasani, S.M. Development of an artificial neural network model for asphalt pavement deterioration using LTPP data. J. Rehabil. Civ. Eng. 2020, 8, 121–132. [Google Scholar] [CrossRef]
- Hoang, N.-D. An Artificial Intelligence Method for Asphalt Pavement Pothole Detection Using Least Squares Support Vector Machine and Neural Network with Steerable Filter-Based Feature Extraction. Adv. Civ. Eng. 2018, 2018, 7419058. [Google Scholar] [CrossRef]
- Xu, Y.; Zhang, Z. Review of applications of artificial intelligence algorithms in pavement management. J. Transp. Eng. B Pavements 2022, 148, 03122001. [Google Scholar] [CrossRef]
- Peraka, N.S.P.; Biligiri, K.P. Pavement asset management systems and technologies: A review. Autom. Constr. 2020, 119, 103336. [Google Scholar] [CrossRef]
- Thives, L.P.; Pais, J.; Pereira, P.A.A.; Minhoto, M.J.C.; Triches, G. Performance of Asphalt Rubber Mixture Overlays to Mitigate Reflective Cracking. Materials 2022, 15, 2375. [Google Scholar] [CrossRef] [PubMed]
- Kim, K.W.; Doh, Y.S.; Lim, S. Mode I reflection cracking resistance of strengthened asphalt concretes. Constr. Build. Mater. 1999, 13, 243–251. [Google Scholar] [CrossRef]
- Xu, L.; Li, X.; Jiang, F.; Yu, X.; Wang, J.; Xiao, F. Thermosetting characteristics and performances of polyurethane material on airport thin-overlay. Constr. Build. Mater. 2022, 344, 128252. [Google Scholar] [CrossRef]
- Seferoğlu, M.T.; Seferoğlu, A.G.; Çelik, M.; Akpinar, M.V. Investigating the Influence of Joint Reinforcements of Portland Cement Concrete Slabs Under Asphalt Concrete Overlays on Vertical Deflections Using Accelerated Pavement Testing. Transp. Res. Rec. 2022, 2676, 296–305. [Google Scholar] [CrossRef]
- Li, X.; Wen, H. Effects of Preoverlay Pavement Conditions and Preoverlay Repair Methods on the Performance of Asphaltic Concrete Overlays. J. Transp. Eng. 2014, 140, 42–49. [Google Scholar] [CrossRef]
- Habbouche, J. Evaluation of Thin Asphalt Overlays for Pavement Preservation in Nevada. Master’s Thesis, University of Nevada, Reno, NV, USA, 2015. [Google Scholar]
- Das, A.; Bhuyan, M.R.; Khattak, M.J.; Zhang, Q. Mitigating reflective cracking in composite pavements through the use of a ductile concrete interlayer. Constr. Build. Mater. 2020, 259, 120383. [Google Scholar] [CrossRef]
- Dave, E.V.; Buttlar, W.G. Thermal reflective cracking of asphalt concrete overlays. Int. J. Pavement Eng. 2011, 11, 477–488. [Google Scholar] [CrossRef]
- Chen, D.; Won, M. CAM and SMA mixtures to delay reflective cracking on PCC pavements. Constr. Build. Mater. 2015, 96, 226–237. [Google Scholar] [CrossRef]
- Oshone, M.; Dave, E.V.; Sias, J.E. Asphalt mix fracture energy based reflective cracking performance criteria for overlay mix selection and design for pavements in cold climates. Constr. Build. Mater. 2019, 211, 1025–1033. [Google Scholar] [CrossRef]
- Khudoyarov, S.; Kim, N.; Lee, J.-J. Three-dimensional convolutional neural network–based underground object classification using three-dimensional ground penetrating radar data. Struct. Health Monit. 2020, 19, 1884–1893. [Google Scholar] [CrossRef]
- Xiong, X.; Tan, Y.; Hu, J.; Hong, X.; Tang, J. Evaluation of Asphalt Pavement Internal Distresses Using Three-Dimensional Ground-Penetrating Radar. Int. J. Pavement Res. Technol. 2024, 1–12. [Google Scholar] [CrossRef]
- Dong, Z.; Ye, S.; Gao, Y.; Fang, G.; Zhang, X.; Xue, Z.; Zhang, T. Rapid detection methods for asphalt pavement thicknesses and defects by a vehicle-mounted ground penetrating radar (GPR) system. Sensors 2016, 16, 2067. [Google Scholar] [CrossRef] [PubMed]
- Liu, H.; Zheng, J.; Yu, J.; Xiong, C.; Li, W.; Deng, J. Clustering of Asphalt Pavement Maintenance Sections Based on 3D Ground-Penetrating Radar and Principal Component Techniques. Buildings 2023, 13, 1752. [Google Scholar] [CrossRef]
- Vyas, V.; Singh, A.P.; Srivastava, A. Prediction of asphalt pavement condition using FWD deflection basin parameters and artificial neural networks. Road Mater. Pavement Des. 2021, 22, 2748–2766. [Google Scholar] [CrossRef]
- Mehta, Y.; Roque, R. Evaluation of FWD data for determination of layer moduli of pavements. J. Mater. Civ. Eng. 2003, 15, 25–31. [Google Scholar] [CrossRef]
- Kapela, R.; Śniatała, P.; Turkot, A.; Rybarczyk, A.; Pożarycki, A.; Rydzewski, P.; Wyczałek, M.; Błoch, A. Asphalt surfaced pavement cracks detection based on histograms of oriented gradients. In Proceedings of the 2015 22nd International Conference Mixed Design of Integrated Circuits & Systems (MIXDES), Torun, Poland, 25–27 June 2015; pp. 579–584. [Google Scholar]
- Fujita, Y.; Shimada, K.; Ichihara, M.; Hamamoto, Y. A method based on machine learning using hand-crafted features for crack detection from asphalt pavement surface images. In Proceedings of the Thirteenth International Conference on Quality Control by Artificial Vision 2017, Tokyo, Japan, 14 May 2017; pp. 117–124. [Google Scholar]
- Luo, X.; Gu, F.; Zhang, Y.; Lytton, R.L.; Birgisson, B. Kinetics-based aging evaluation of in-service recycled asphalt pavement. J. Clean. Prod. 2018, 200, 934–944. [Google Scholar] [CrossRef]
- Deng, Y.; Luo, X.; Zhang, Y.; Lytton, R.L. Determination of complex modulus gradients of flexible pavements using falling weight deflectometer and artificial intelligence. Mater. Struct. 2020, 53, 100. [Google Scholar] [CrossRef]
- Xiong, C.; Yu, J.; Zhang, X.; Korolev, E.; Svetlana, S.; Chen, B.; Chen, F.; Yang, E. Modulus backcalculation methodology based on full-scale testing road and its rationality and feasibility analysis. Int. J. Pavement Eng. 2022, 24, 2111424. [Google Scholar] [CrossRef]
- Kheradmandi, N.; Modarres, A. Precision of back-calculation analysis and independent parameters-based models in estimating the pavement layers modulus-Field and experimental study. Constr. Build. Mater. 2018, 171, 598–610. [Google Scholar] [CrossRef]
- Zhao, W.; Yang, Q.; Wu, W.; Liu, J. Improving the accuracy of pavement structural quality assessment by correcting numerical hypothetical model of modulus Back-Calculation through GPR. Constr. Build. Mater. 2022, 333, 127422. [Google Scholar] [CrossRef]
- Hong, X.; Tan, W.; Xiong, C.; Qiu, Z.; Yu, J.; Wang, D.; Wei, X.; Li, W.; Wang, Z. A Fast and Non-Destructive Prediction Model for Remaining Life of Rigid Pavement with or without Asphalt Overlay. Buildings 2022, 12, 868. [Google Scholar] [CrossRef]
- JTG D40—2011; Specifications for Design of Highway Cement Concrete Pavement. Ministry of Transport of the People’s Republic of China: Beijing, China, 2011.
- Vestena, P.M.; Schuster, S.L.; Almeida Jr, P.O.B.d.; Faccin, C.; Specht, L.P.; Pereira, D.d.S. Dynamic modulus master curve construction of asphalt mixtures: Error analysis in different models and field scenarios. Constr. Build. Mater. 2021, 301, 124343. [Google Scholar] [CrossRef]
- Zhang, J.; Dai, L.; Zheng, J.; Wu, H. Reflective Crack Propagation and Control in Asphalt Pavement Widening. J. Test. Eval. 2016, 44, 838–846. [Google Scholar] [CrossRef]
- Li, S. Numerical investigation on viscoelastic response of asphalt mixture under tire braking slip. Case Stud. Constr. Mater. 2023, 18, e02009. [Google Scholar] [CrossRef]
- Sun, H.-g. Development of an indoor test method for evaluating the anti-reflection crack performance of asphalt overlay. Case Stud. Constr. Mater. 2023, 19, e02241. [Google Scholar] [CrossRef]
- Ban, H.; Im, S.; Kim, Y.-R.; Jung, J.S. Laboratory tests and finite element simulations to model thermally induced reflective cracking of composite pavements. Int. J. Pavement Eng. 2018, 19, 220–230. [Google Scholar] [CrossRef]
- JTG D50—2017; Design Specification for Asphalt Pavement of Highways. Ministry of Transport of the People’s Republic of China: Beijing, China, 2017.
- Dempsey, B.J. Development and performance of interlayer stress-absorbing composite in asphalt concrete overlays. Transp. Res. Rec. 2002, 1809, 175–183. [Google Scholar] [CrossRef]
- Zhang, K.; Zhang, Z.; Luo, Y.J. Material Composition Design and Anticracking Performance Evaluation of Asphalt Rubber Stress-Absorbing Membrane Interlayer (AR-SAMI). Adv. Mater. 2018, 2018, 8560604. [Google Scholar] [CrossRef]
- Joumblat, R.; Kassem, H.A.; Al Basiouni Al Masri, Z.; Elkordi, A.; Al-Khateeb, G.; Absi, J. Performance evaluation of hot-mix asphalt with municipal solid waste incineration fly ash using the stress sweep rutting test. Innov. Infrastruct. So. 2023, 8, 261. [Google Scholar] [CrossRef]
- Hassan, H.M.Z.; Wu, K.; Huang, W.; Chen, S.; Zhang, Q.; Xie, J.; Cai, X. Study on the influence of aggregate strength and shape on the performance of asphalt mixture. Constr. Build. Mater. 2021, 294, 123599. [Google Scholar] [CrossRef]
- Wang, Y.; Liu, C.; Wang, Y.; Li, Q.; Liu, H. Time-and-Depth-Dependent Model of Chloride Diffusion Coefficient for Concrete Members Considering the Effect of Coarse Aggregate. J. Mater. Civ. Eng. 2018, 30, 04017302. [Google Scholar] [CrossRef]
- Yu, J.; Chen, F.; Deng, W.; Ma, Y.; Yu, H. Design and performance of high-toughness ultra-thin friction course in south China. Constr. Build. Mater. 2020, 246, 118508. [Google Scholar] [CrossRef]
Disclaimer/Publisher’s Note: The statements, opinions and data contained in all publications are solely those of the individual author(s) and contributor(s) and not of MDPI and/or the editor(s). MDPI and/or the editor(s) disclaim responsibility for any injury to people or property resulting from any ideas, methods, instructions or products referred to in the content. |
© 2024 by the authors. Licensee MDPI, Basel, Switzerland. This article is an open access article distributed under the terms and conditions of the Creative Commons Attribution (CC BY) license (https://creativecommons.org/licenses/by/4.0/).