Abstract
The quality inspection of each precast utility tunnel segment is crucial, especially the cross-sectional dimensions and surface smoothness, since they influence the assembly precision at the construction site. Traditional manual inspection methods are not only time-consuming and costly but also limited in accuracy. In order to achieve a high-precision and high-efficiency geometric quality inspection for multi-type precast utility tunnel segments, this paper proposes an automated inspection method based on the Building Information Model (BIM) and Light Detection and Ranging (LiDAR). Initially, the point cloud data (PCD) of the precast utility tunnel segment are acquired through LiDAR and preprocessed to obtain independent point clouds of the precast utility tunnel segment. Then, the shape of the precast utility tunnel segment is identified using the proposed Cross-Sectional Geometric Ratio Feature Identification (CSGRFI) algorithm. Subsequently, the geometric features of the components are extracted based on preset conditions, and the geometric dimensions are calculated. Finally, the quality inspection results are obtained by comparing with the design information provided by the BIM. The proposed method was validated in a real precast component factory. The results indicate that the method achieved a 100% success rate in identifying the cross-sectional shapes of the segments. Compared with the manual measurement method, the proposed method demonstrated a higher accuracy in the geometric quality assessment and an improved time efficiency by 44%. The proposed method enables the efficient geometric quality inspection of tunnel segments, effectively addressing the construction industry’s need for large-scale, high-quality tunnel projects.
1. Introduction
To optimize the utilization of subterranean spaces and enhance the management efficiency of municipal pipelines, modern metropolises are increasingly investing in the construction of underground comprehensive utility corridors. The deployment of precast utility tunnel segment components significantly boosts the construction efficiency of these corridors. Ensuring the seamless integration of utility corridors at construction sites necessitates rigorous geometric quality inspections of the precast utility tunnel segment components fabricated in factories. Conventional methods for a geometric quality inspection, such as ruler, optical, and laser techniques, are commonly employed [1]. Ruler methods, involving direct or indirect measurements with tools like steel rulers and angle gauges, although straightforward and easy to implement, offer lower precision and are vulnerable to human errors. Previous statistical data indicate that 54% of construction defects are caused by insufficient worker experience or other subjective factors, while 12% are due to system issues [2]. As construction requirements become more stringent, traditional manual inspection methods using rulers and compasses can no longer meet the increasing demands [3]. Optical methods, utilizing instruments such as total stations or photogrammetric cameras, enhance the accuracy through computerized processing but are highly sensitive to environmental variables like lighting and require skilled technicians for their operation. Laser methods, particularly through Light Detection and Ranging (LiDAR), have become prevalent in structure quality inspections due to their superior accuracy, extensive coverage, and automation [4,5,6]. Compared to traditional methods, the approach based on LiDAR is more time-efficient and cost-beneficial, with time efficiency improved by approximately 59% and cost efficiency reduced by 35% [7]. LiDAR technology surpasses photogrammetric methods in terms of data quality and accuracy, point density, and noise minimization [8]. Nonetheless, data processing in LiDAR is intricate, necessitating the integration of both geometric and semantic information for effective feature extraction. The Building Information Model (BIM) provides a comprehensive repository of geometric and semantic data. In this paper, BIM-assisted point cloud data processing is utilized, and the results of the data processing are automatically compared with the design information of the BIM, achieving a workflow that starts and ends with the BIM.
The main contributions are concluded as follows: (1). This paper proposes a method for the geometric quality automated inspection of multi-type precast utility tunnel segment components using the BIM and LiDAR. (2). This paper proposes the Cross-Sectional Geometric Ratio Feature Identification (CSGRFI) algorithm for identifying the types of precast utility tunnel segment components based on their sectional characteristics. (3). This paper proposes a method for calculating the dimensions of the tunnel segments based on the topological relationship of the surfaces, lines, and points. It involves deriving the lines from the surfaces and the points from the lines and ultimately calculating the dimensions based on the points.
The remainder of this paper is structured as follows: Section 2 reviews the existing methods for point cloud-based geometric feature extraction and quality inspection. Section 3 details the proposed methodology. Section 4 discusses the validation of this method through the point cloud data (PCD) obtained from real precast tunnel segments. Section 5 concludes this study and outlines directions for future research.
2. Related Work
2.1. Point Cloud-Based Geometric Feature Extraction
To date, various methods have been developed for the geometric quality inspection of structures using PCD, focusing on the identification of the points forming specific shapes or exhibiting key topological relationships, such as lines, planes, cylinders, and spheres. Hu et al. [9] advanced a technique for extracting line segments from extensive point clouds via enhanced geometric features and hierarchical topological optimization, yet this approach falls short in delineating nonlinear or non-planar regions. Shao et al. [10] introduced a framework combining a spatial transformation network with a multi-layer perceptron to encode and decode point clouds, aiming to capture local geometric nuances; however, their method underperforms in segmenting detailed boundaries. Xiang et al. [11] developed a method for extracting local structural information from point clouds using spatial filling curves, but the technique has limited applicability in complex and non-uniform environments. He et al. [12] proposed a trunk extraction algorithm leveraging geometric features and point cloud attributes, employing clustering algorithms for detecting skeleton nodes, although it remains sensitive to noise and occlusions. Zhou et al. [13] presented an analysis method based on the Local Feature Extraction Network (LFENet); however, it overlooks global contextual relationships. Zhu et al. [14] put forward a technique for natural forest trunk extraction using geometric features and DBSCAN, which still encounters challenges with false positives or negatives in dense or overlapping structures. Lastly, Zhang et al. [15] discussed an automatic anchor point extraction approach based on geometric features, yet this method requires further enhancements to handle non-uniform sampling and severe occlusions effectively.
2.2. Point Cloud-Based Geometric Quality Inspection
Geometric quality inspection leveraging LiDAR technology has been extensively explored in various studies. Tan et al. [16] utilized a 3D laser scanner to capture point cloud data (PCD), extracting key geometric features such as corners by detecting planes and edges, and then computed the geometric dimensions to conduct quality inspections of the prefabricated housing units. Addressing the limitations of stationary 3D laser scanners, which face blind spots in data capture, Kim et al. [17] introduced a novel mirror-assisted scanning technique to acquire the comprehensive surface data of prefabricated concrete components. Similarly, Li et al. [18] developed an automated algorithm for flatness detection on building surfaces and components, extracting intersection points as corners to measure the dimensions of the prefabricated elements. Zhao et al. [19] employed the alpha shape algorithm to delineate the boundary dimensions of rectangular column nodes and used OC-SVM along with unsupervised learning techniques to determine the lengths of reinforcements and the dimensions of sleeve ports.
Although LiDAR provides geometric information for existing components, the extracted geometric information needs to be compared with the design information for the dimension detection. Some studies [20,21,22,23] have focused on comparing point cloud models to BIMs to accomplish detection. For instance, Kim et al. [24] measured the geometric dimensions of prefabricated composite slab bottom plates, such as the length, width, and verticality, through sophisticated edge and corner detection algorithms, comparing these metrics against BIMs to ensure quality control. Further, Tan et al. [25] proposed a method for assessing the geometric quality of prefabricated steel box girder components by integrating 3D laser scanning data with BIM technology. Bahreini and Hammad [26] proposed a method for the semantic segmentation of concrete defects from LiDAR point cloud data and a semi-automated process for integrating the results into the inspected BIM. Tan et al. [22] utilized LiDAR and a BIM for road damage detection and employed Dynamo for batch processing the information within the BIM. Truong-Hong and Lindenbergh [27] introduced a method for the automated extraction of floors, ceilings, walls, columns, and beams from raw point clouds using a BIM, spatial information, and contextual knowledge, but did not describe the quality inspection process. Shu et al. [28] developed a method that combines synthetic dataset generation, a segmentation network (PCCR-Net), and a measurement protocol for accurately identifying components and estimating dimensions. Some studies have focused on directly comparing scan data with design models for enhanced quality inspection. Selvaraj and Madhavan [29] estimated the size deviations in cold-formed section steel components by contrasting 3D CAD model cross sections with scanned PCD, while Xia and Blum [30] assessed the geometric imperfections in thin-walled cold-formed steel components by comparing key and nominal nodes of PCD against design dimensions. However, these methods often require significant manual intervention due to the complexity of the point cloud processing software. Liu, Zhang, Wu, and Zhao [5] calculated the discrepancies between scanned PCD and designed BIMs to evaluate the dimensional accuracy of spatial structural elements. Additionally, Cha et al. [31] deployed a ground-based laser scanner to measure structural deflection variations in steel box girders using an octree-shaped information model, demonstrating its capability to detect deviations exceeding 4 mm. Xu et al. [32] utilized a handheld laser scanner to capture the geometric forms of steel components, integrating these data into generic finite element software for predicting both overall and localized initial geometric defects.
In summary, while numerous studies have investigated geometric quality inspections using LiDAR technology, most research focuses on specific components or individual metrics. There is a notable gap in comprehensive geometric quality inspection methodologies specifically designed for the complex assembly of precast utility tunnel segments. This necessitates the development of a systematic approach that can identify and subsequently inspect each constituent unit.
3. Methodology
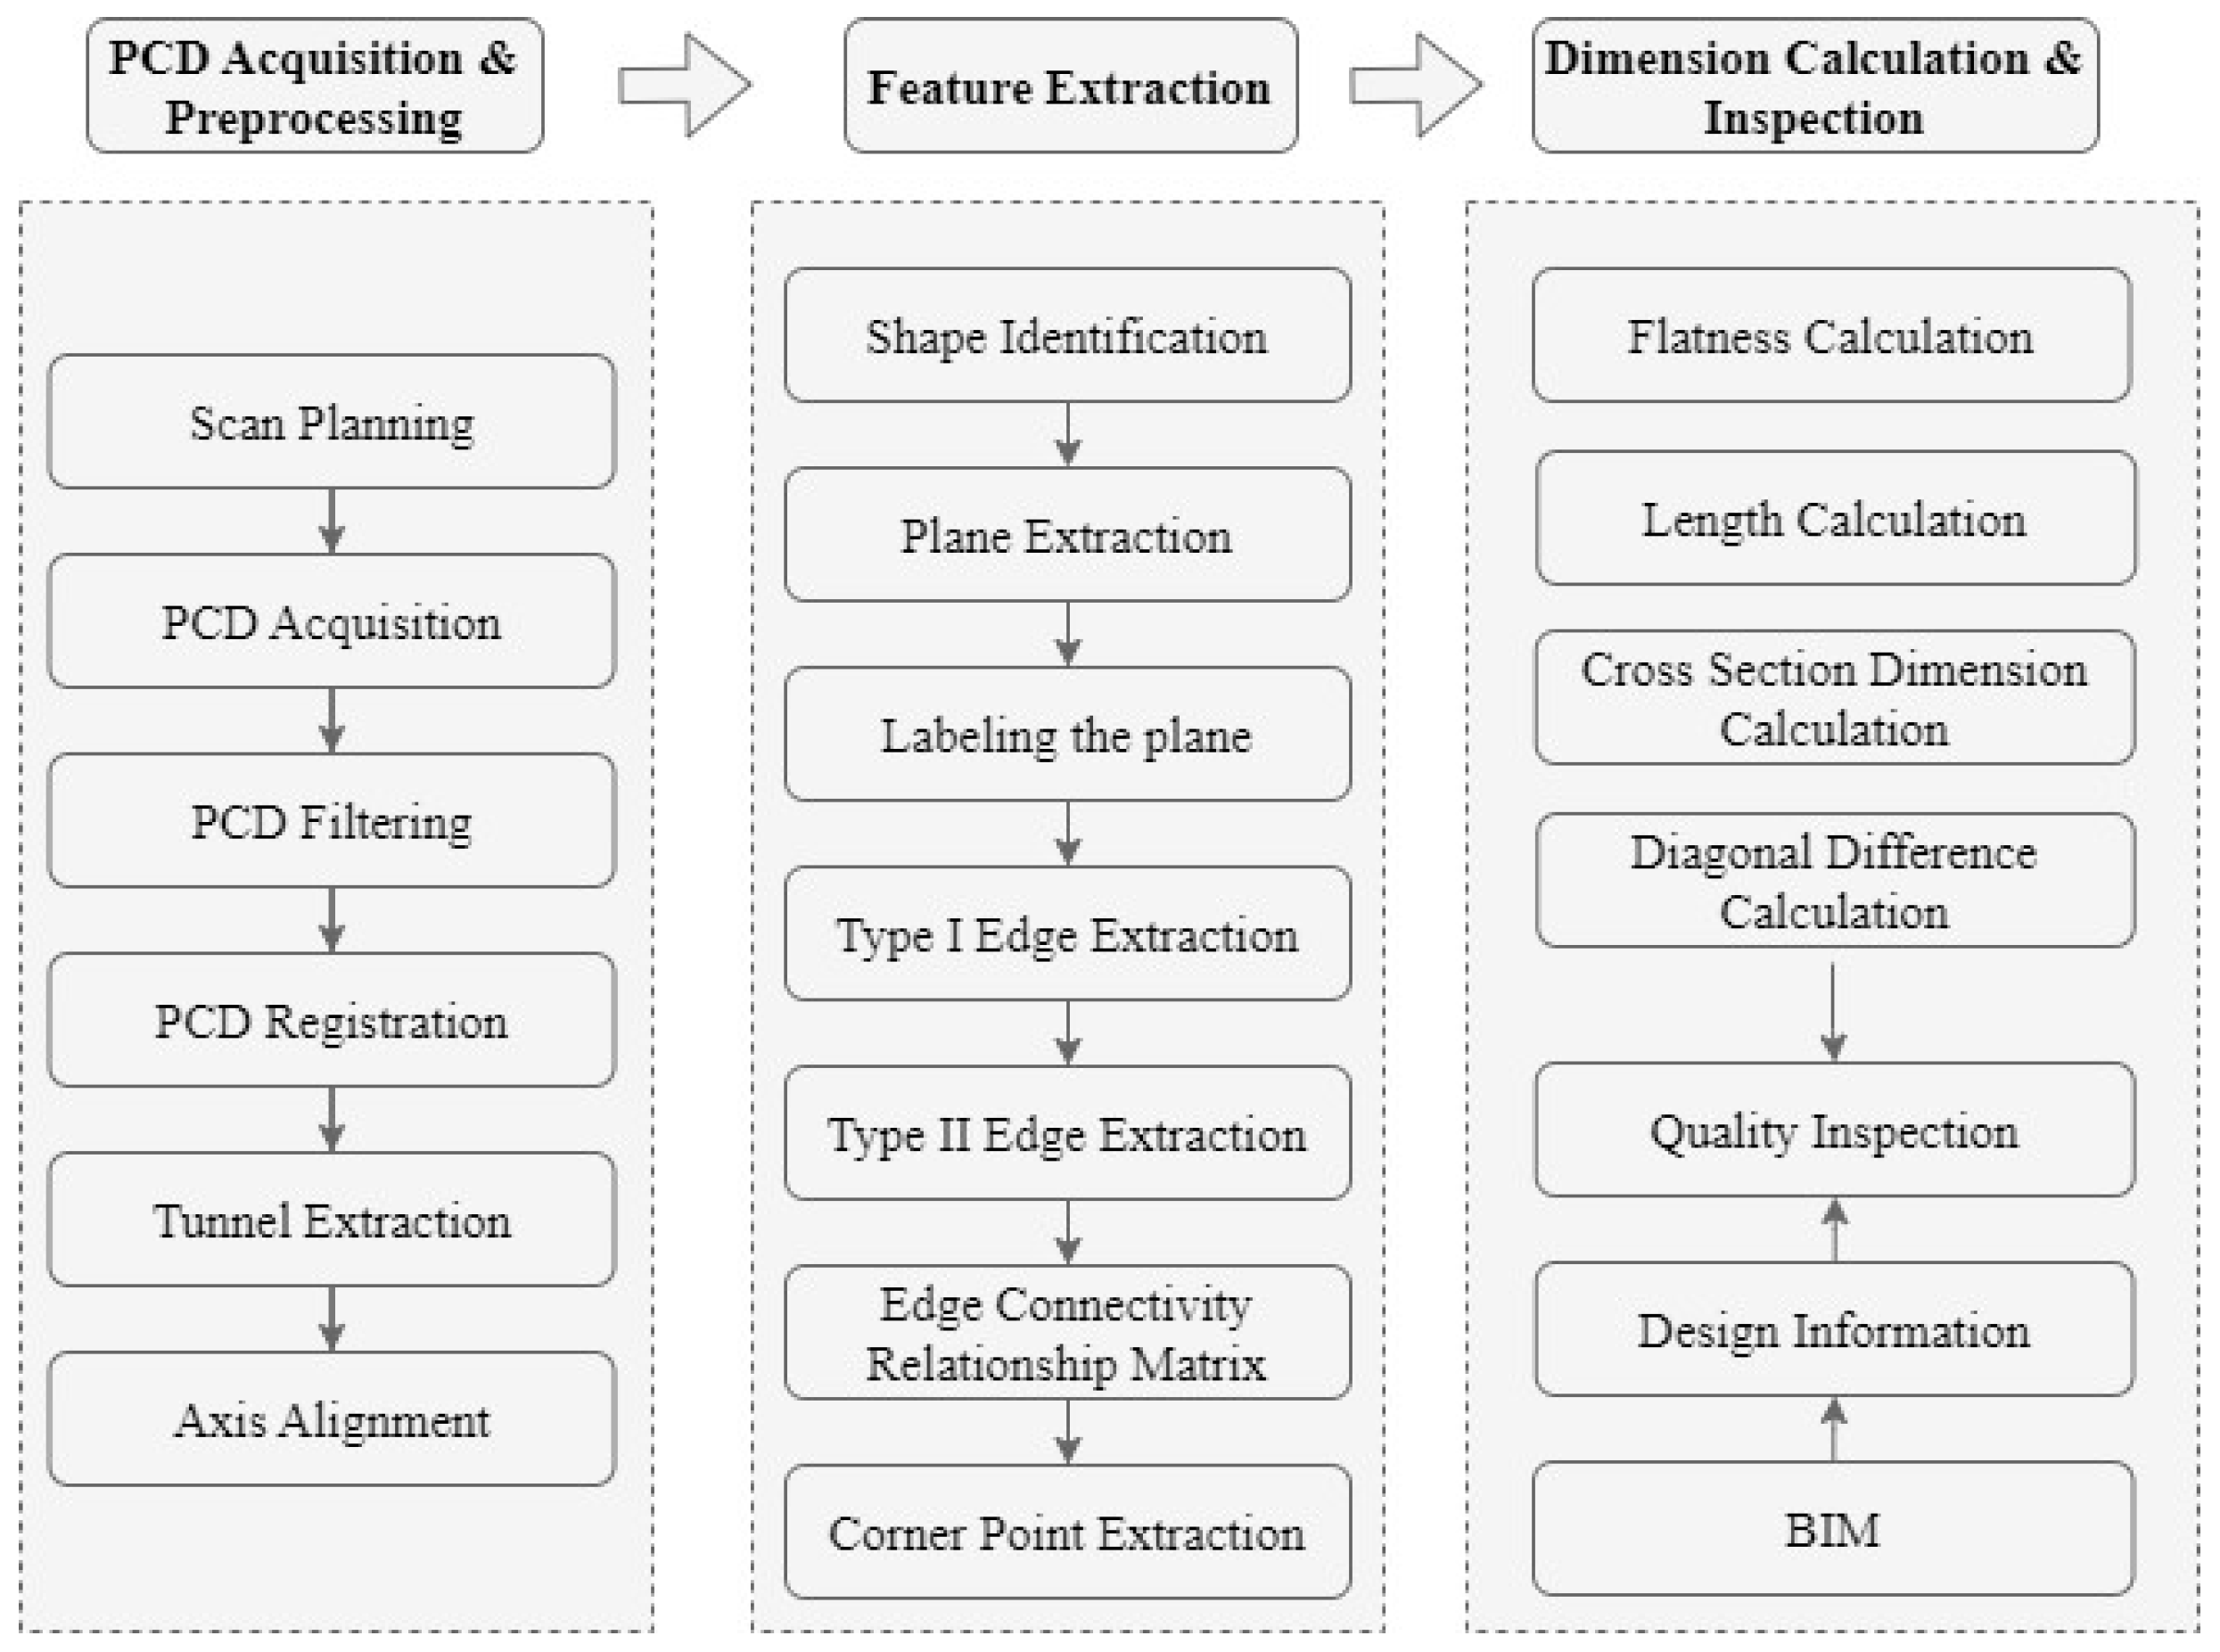
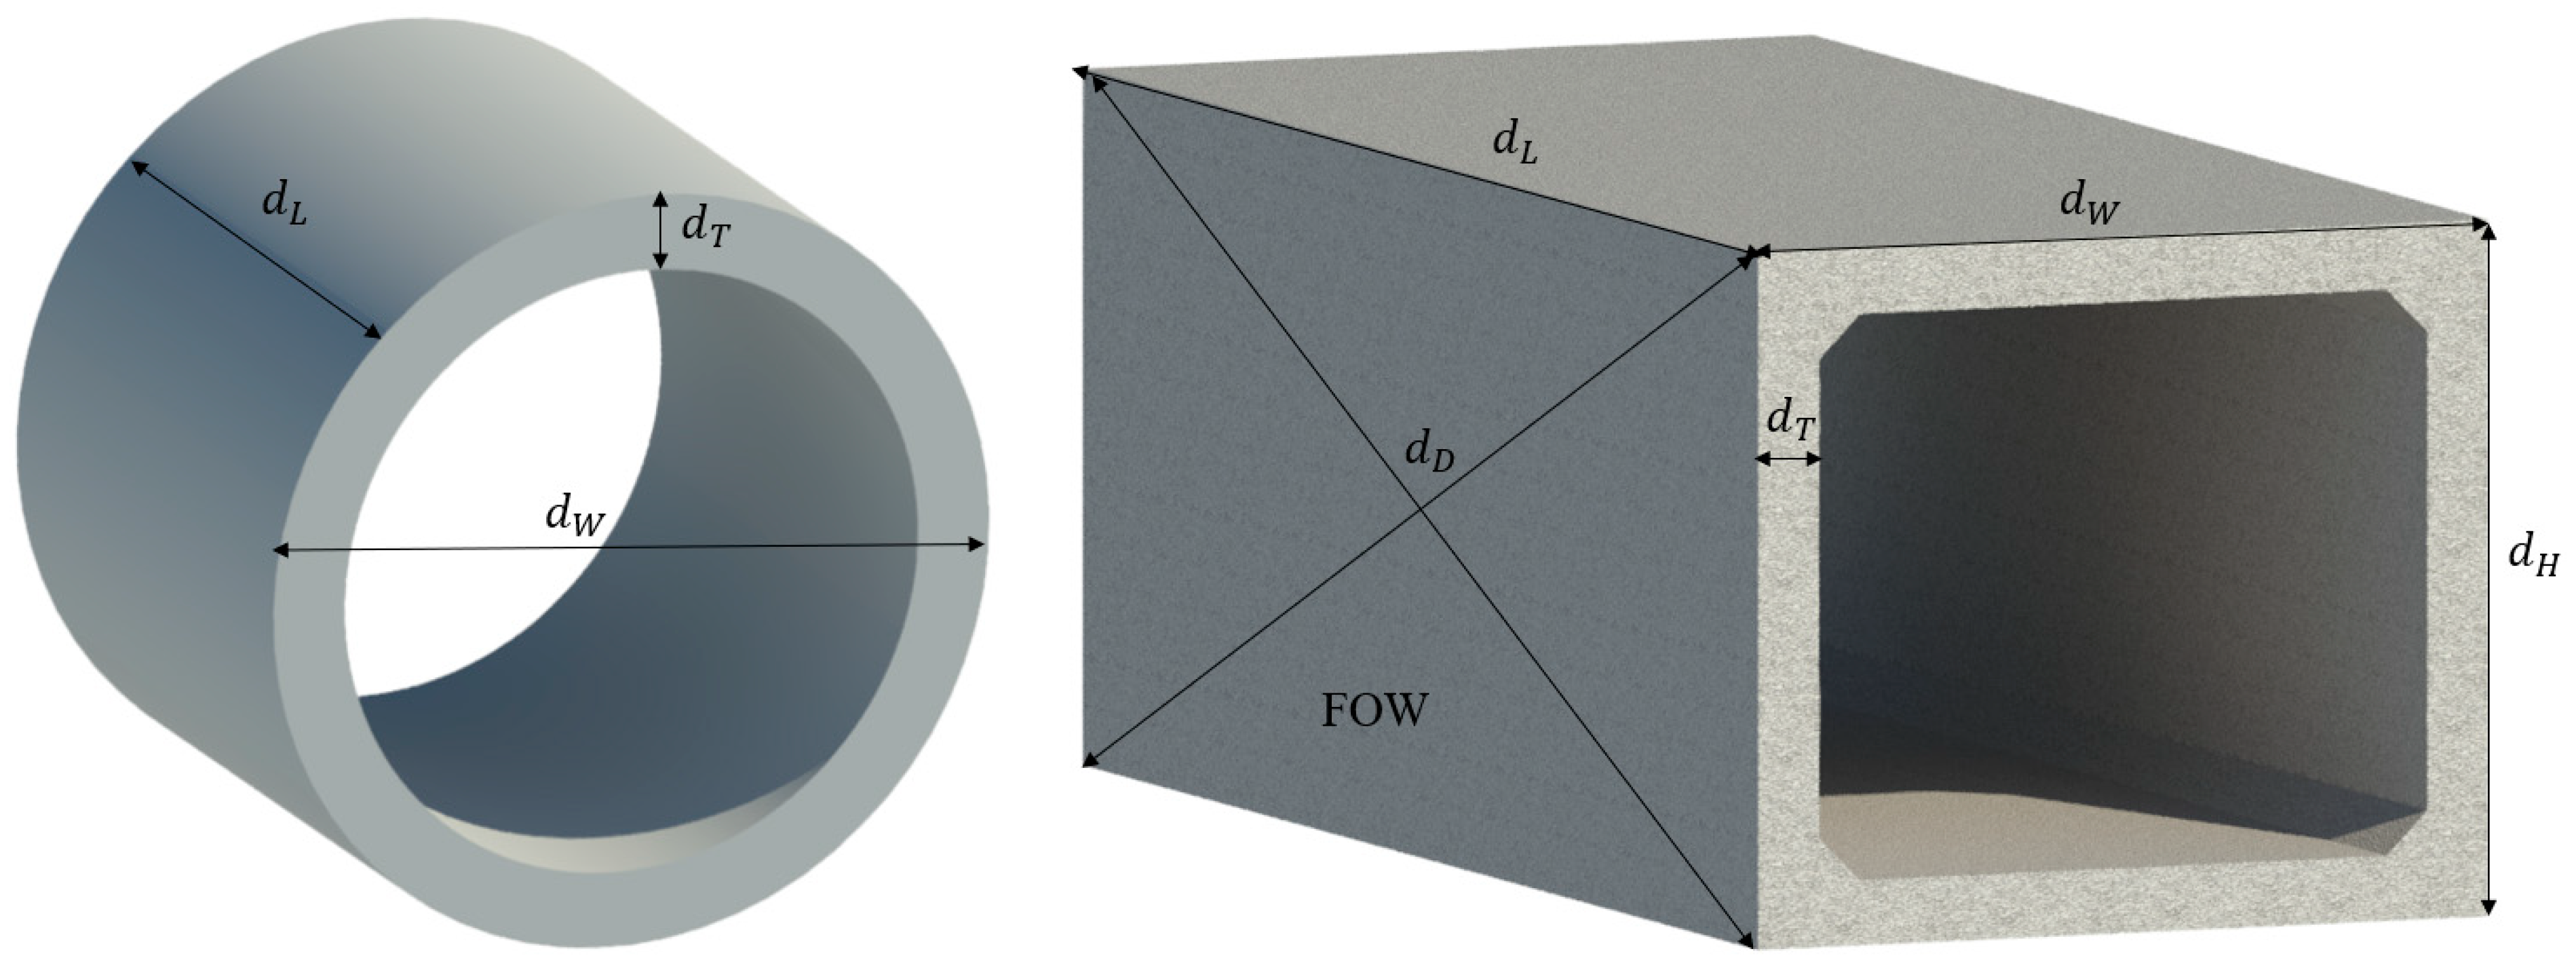
To address the shortcomings of existing geometric quality inspection methods and to achieve a faster and more accurate geometric quality inspection for precast utility tunnel segments, this paper proposes a method that integrates the BIM and LiDAR technologies. The specific processing workflow is illustrated in Figure 1. The method comprises the following steps: (1) the acquisition and preprocessing of PCD; (2) the extraction of the geometric features of the precast utility tunnel; (3) the computation of the dimensions for the detected indicators of the tunnel; (4) an abnormality inspection of the dimensions of the precast utility tunnel based on the design information provided by the BIM and quality acceptance specifications. Table 1 summarizes the geometric quality checklist of precast utility tunnel segments according to DBJ/T15-254-2023 [33]. As depicted in Figure 2, the precast utility tunnel segments can be classified into rectangular and circular sections. The geometric quality inspection items for rectangular utility tunnels include flatness, length, width, height, thickness, and diagonal difference, while, for circular utility tunnels, the inspection items include length, inner wall diameter, and outer wall diameter.

Figure 1.
Workflow of the proposed method.

Table 1.
The geometric quality checklist of precast utility tunnel segments.
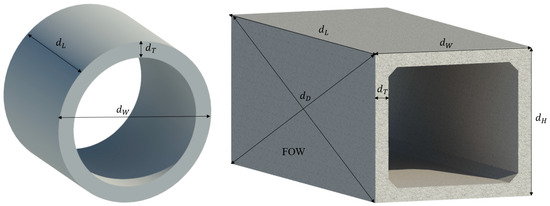
Figure 2.
Inspection items for geometric quality.
3.1. Acquisition and Preprocessing of the PCD
3.1.1. Scan Planning
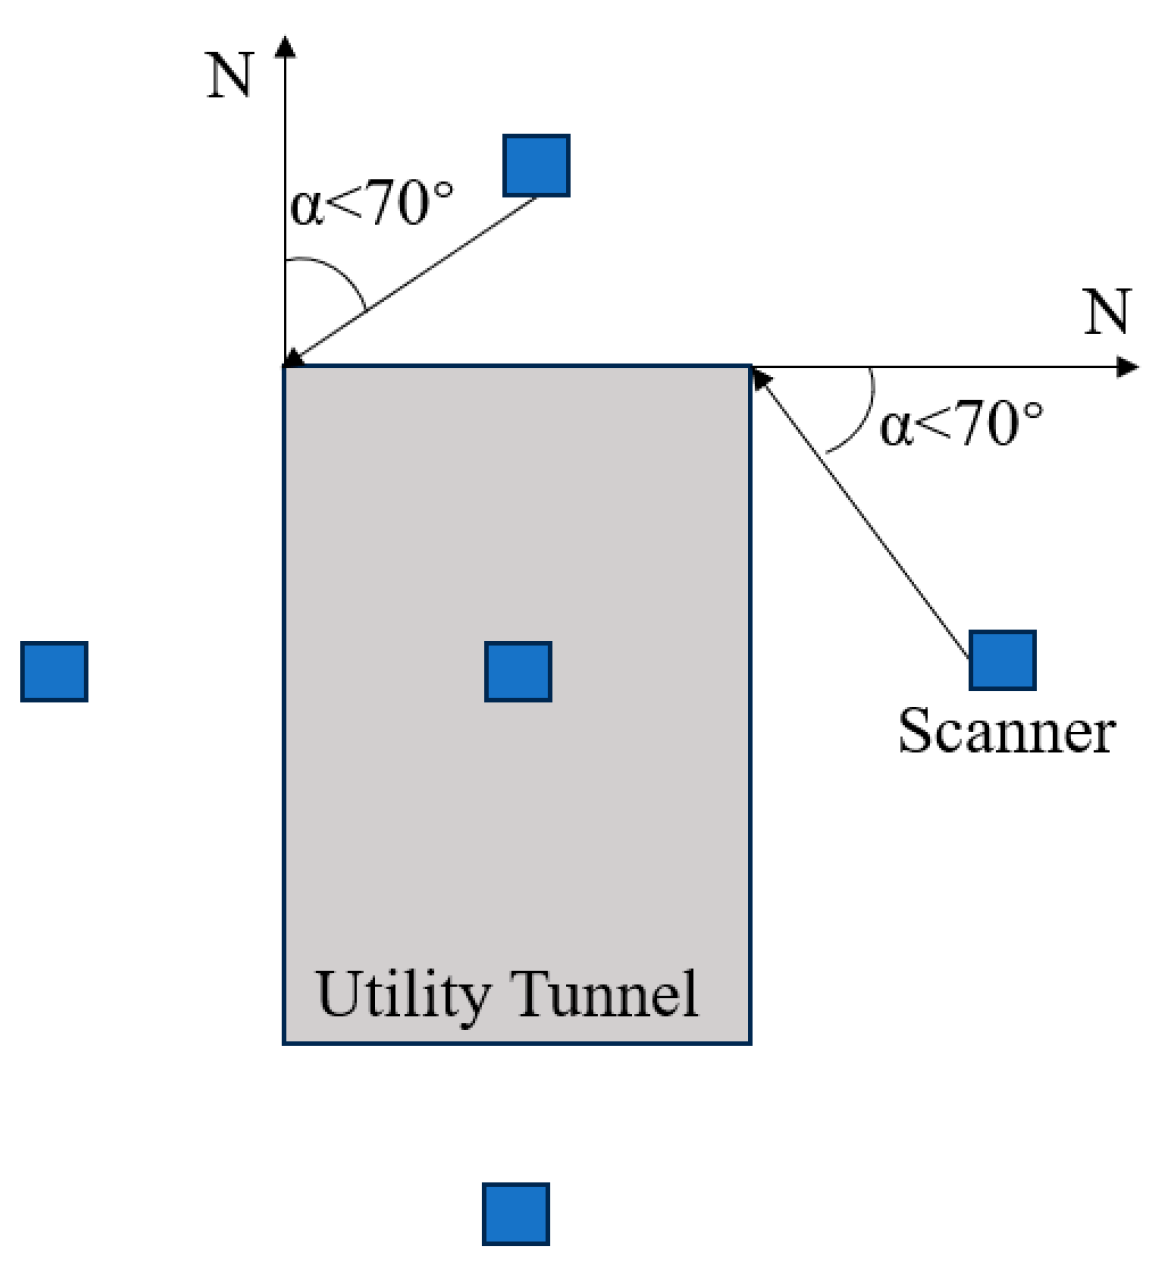
In order to obtain the complete PCD of the utility tunnel, it is necessary to set up multiple scanning positions for the scanning, as shown in Figure 3. Considering the impact of the incident angle on the point accuracy, the incident angle from the scanner to the surface of the tunnel should not exceed 70 degrees [34]. At each position, the scanner is configured with an appropriate angular resolution to capture the PCD that meet the quality standards.
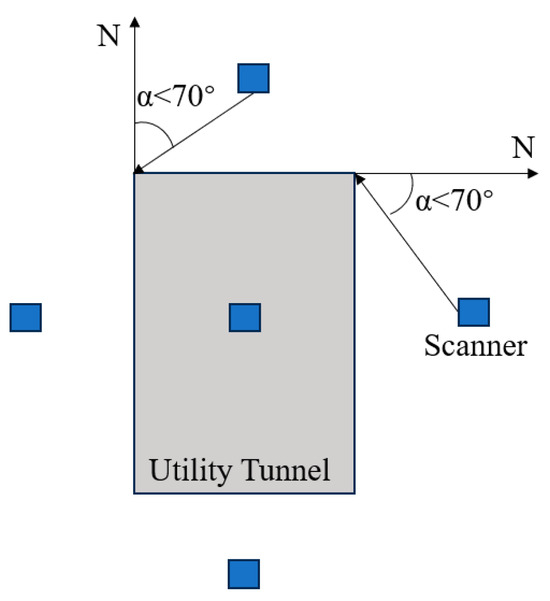
Figure 3.
Position arrangement for PCD acquisition.
3.1.2. PCD Filtering
To improve the quality of the PCD acquired at each position and enhance the accuracy of the registration, it is necessary to filter the PCD. Typically, two components need to be removed from the acquired raw PCD: background points and noise points. Background points refer to the PCD of structures other than the target object, usually located at a considerable distance from the target. Compared to the background points, noise points are closer to the target object and have less defined positions. When filtering the raw point cloud, this paper suggests improving efficiency by first filtering out large-scale background points and then filtering out small-scale noise points. To efficiently and effectively remove background points, a bounding box constructed based on the scanner’s station position is used to extract the point cloud of interest. Common noise point filters include statistical filters and radius filters. Statistical filters calculate the distance between each point and its neighbors within a certain range, derive a Gaussian distribution concerning the distance, and set a threshold to filter out any outliers.
3.1.3. PCD Registration
To register the PCD at each position, coarse registration is first performed by selecting three pairs of corresponding point pairs, followed by fine registration using the Iterative Closest Point (ICP) algorithm. However, the registered PCD may become excessively large, hindering subsequent processing and computations. Therefore, down-sampling the PCD using voxelization is employed. Voxelization partitions the three-dimensional space occupied by the point cloud into multiple cubes, each referred to as a voxel. All PCD within each voxel are represented by its centroid, effectively reducing the data volume of the point cloud.
3.1.4. Tunnel Extraction
To better extract the geometric features of the pipeline components from the PCD, it is necessary to remove the ground points and individually extract each tunnel from the original point cloud. Firstly, in this paper, the ground points are identified by the angle between their normal vectors and the Z-axis. To reduce computational overhead, the points with elevations greater than the elevation threshold are retained. For the points with elevations below the threshold, their normal vectors are calculated based on their neighboring points. When the angle between the normal vector and the direction vector of the Z-axis is less than the threshold , the point is identified as a ground point and removed, as shown in Figure 4. The remaining data constitute the point cloud of the tunnel segment.
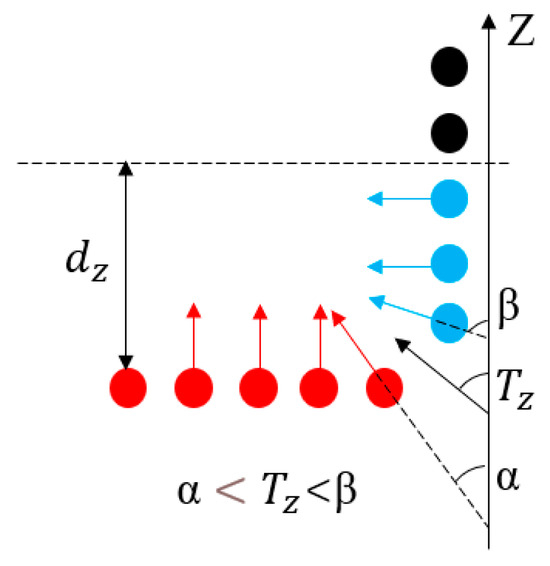
Figure 4.
Ground point removal.
At this stage, the tunnel point cloud data contain multiple segments, making it difficult to apply the algorithm directly. The Euclidean clustering algorithm is used to individually extract each tunnel segment. This algorithm clusters the point cloud into different-sized clusters based on a distance threshold. To ensure good segmentation results, the distance threshold should be slightly smaller than the distance between the tunnel segments.
3.1.5. Axis Alignment
To facilitate the semantic segmentation of the planes based on the direction of the plane normal vectors, it is necessary to align the point cloud of the tunnel segment with the coordinate axes. First, the centroid of the tunnel point cloud is calculated (Equation (1)), and the tunnel is translated along the X- and Y-axes to move the centroid to the origin of the global coordinate system in the XOY plane, as shown in Figure 5a,b. Next, the major axis of the point cloud is determined using Principal Component Analysis (PCA) (Equation (2)), and the angle between the major axis and the Y-axis is calculated (Equation (3)). To rotate the point cloud around the Z-axis to align the major axis with the Y-axis, a rotation matrix is calculated based on the angle (Equation (4)). Finally, the rotation matrix is applied to rotate the point cloud by degrees, aligning the major axis with the Y-axis, as shown in Figure 5c.
where N represents the number of point clouds in the tunnel, denotes the main axis direction vector of the tunnel point clouds, represents the Y-axis direction vector, and signifies the angle measured in radians.
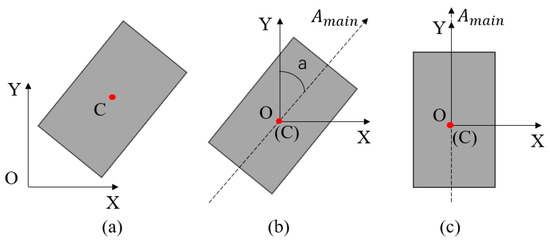
Figure 5.
Coordinate alignment: (a) initial position; (b) calculate rotation angle; (c) perform rotation.
3.2. Feature Extraction
In the geometric quality inspection of precast utility tunnels, feature extraction is a crucial step. Different section shapes of precast utility tunnels require different methods of feature extraction. The purpose of this section is to first identify the section shape of the precast utility tunnel components and then extract the geometric features using different methods based on the shape of the utility tunnels.
3.2.1. Shape Identification
To successfully apply different detection algorithms to tunnel segments of varying shapes, the automated shape recognition of the tunnel segments is required. To identify the shape of the prefabricated pipe gallery components, this paper proposes the Cross-Sectional Geometric Ratio Feature Identification (CSGRFI) algorithm. The proposed method effectively avoids the overfitting or underfitting issues commonly encountered in existing deep learning-based shape recognition methods. Figure 6 illustrates the workflow of the CSGRFI algorithm. The tunnel point cloud is first projected onto a plane perpendicular to the main axis direction vector , resulting in a cross-sectional plane point cloud at the center of the tunnel component. An Oriented Bounding Box (OBB) is then used to determine the geometric center of the cross-sectional plane point cloud, and the distance from each point on the plane to is calculated. Finally, the ratio R of the maximum distance, , to the minimum distance, , is computed. Figure 7 shows the cross-sectional shapes of two types of utility tunnel segments. For the circular segment, since the thickness of the utility tunnel is always less than its inner diameter (Equation (6)), it can be derived that (Equation (7)). For the rectangular segment, is the dimension of the longest side of the rectangular utility tunnel cross section, and is the dimension of the shortest side of the rectangular utility tunnel cross section, which always satisfies Equation (8). Using the theorem of triangle side lengths, Equation (9) can be obtained, and it can be derived through inequality that (Equation (10)).
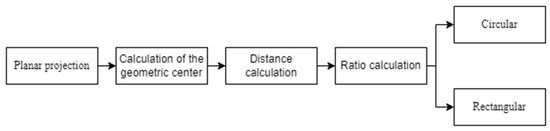
Figure 6.
Workflow of the CSGRFI algorithm.
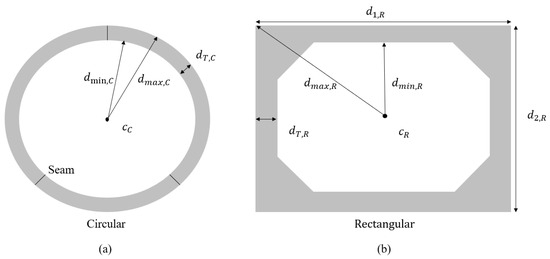
Figure 7.
Cross-Sectional Geometric Ratio Feature: (a) the circular cross-section; (b) the rectangular cross-section.
3.2.2. Rectangular Tunnel Feature Extraction
For the extracted rectangular prefabricated tunnel, the point cloud data of the tunnel serve as the input for feature extraction, aiming to recognize and extract the planes, edges, and key corner points of the tunnel segment, thereby calculating the geometric dimensions of the components. Figure 8 illustrates the process of feature extraction. The feature extraction of the rectangular precast utility tunnels mainly involves three steps: firstly, there is surface segmentation. In this paper, the region growing algorithm and RANSAC algorithm are employed to segment and fit the surface, obtaining the point cloud data and the expressions of the planes. Then, the edge extraction is conducted. Based on the adjacency relationship and expressions of the planes, one type of edge is calculated, and a second type of edge is obtained using edge detection algorithms. Finally, the positions of the corner points are determined. Based on the connectivity between the edges, this paper employs the multi-line closest point algorithm to locate the corner points.
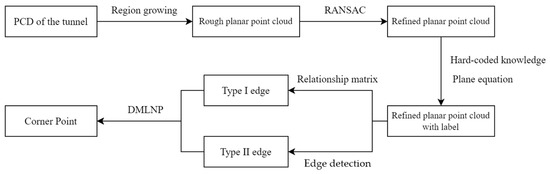
Figure 8.
Process of feature extraction.
Plane Extraction
To estimate the positions of the corner points on the tunnel segments, it is essential to obtain segmentation data for each plane. In this study, the plane segmentation is performed using the region growing algorithm, and the plane equation is estimated using the RANSAC algorithm. The region growing algorithm is a segmentation method based on expanding the neighborhood around seed points. It involves calculating the normal vector and curvature for each point based on neighborhood information, and the segmentation is controlled by the curvature threshold and normal vector angle threshold , ensuring that the segmented PCD satisfy the same conditions. The acquired data for each plane are stored in a column vector of order , where represents the total number of obtained planes, reflecting the extraction sequence. The RANSAC algorithm is employed to estimate the equation of each segmented plane. RANSAC iteratively samples random subsets from the dataset and computes the plane equation based on the sampled points. For each estimated plane, the number of inliers (points sufficiently close to the plane) is calculated, and the plane with the maximum number of inliers is ultimately selected. The fitting coefficients for each set of data in the plane list are represented by a coefficient matrix of order .
Labeling the Plane
Due to the alignment of the main axis direction of the tunnel point cloud with the coordinate axes, the plane identification can be achieved through the normal vector and center position of the plane. Firstly, the planes that need to be extracted from the tunnel are assigned unique identifiers. Subsequently, unique hard-coded knowledge [35] is established based on the direction and position of the plane’s normal vector, as illustrated in Table 2. Finally, the plane normal vectors and center point coordinates for all the segmented planes are calculated (Equation (12)), and the matching conditions are used to search for the corresponding plane identifiers. Based on the established unique hard-coded knowledge, the plane connectivity relationship matrix shown in Table 3 is obtained, which is used for subsequent edge extraction.
Table 2.
The information on plane matching.
Table 3.
Plane connectivity relationship matrix .
Edge Extraction
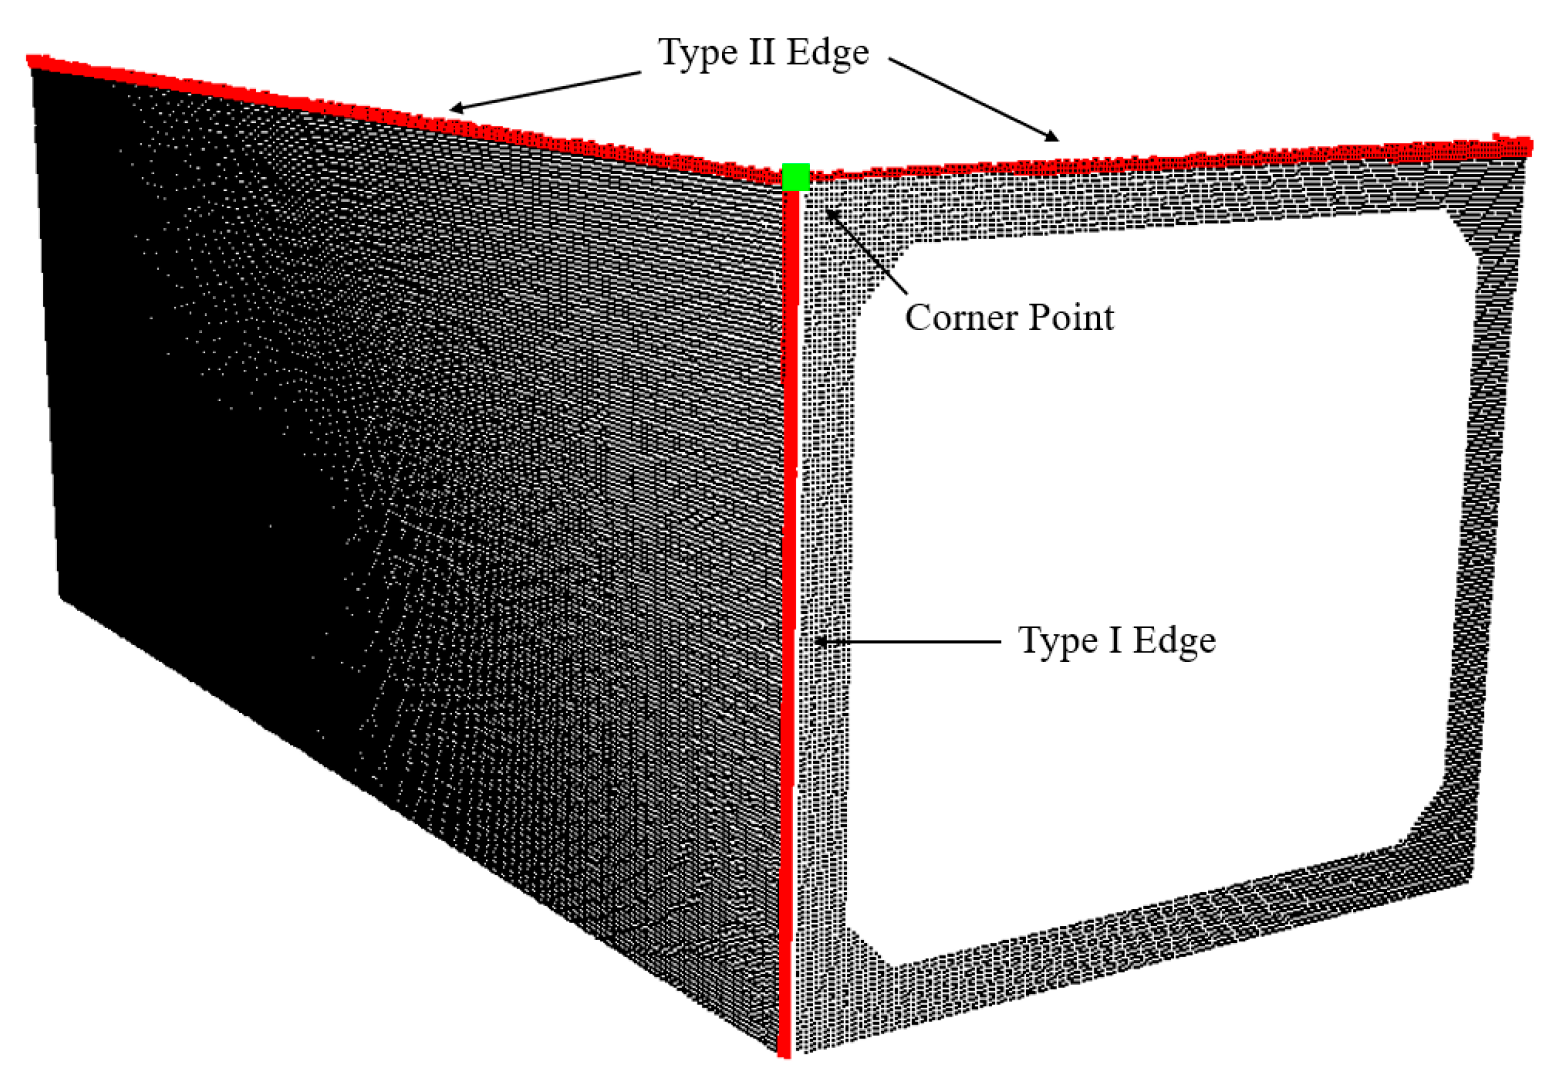
To estimate the positions of the corner points in the precast tunnel sections, it is necessary to extract the edge of each plane in the precast tunnel. The edges of the PCD can be classified into two types, as illustrated in Figure 9. A Type I edge connects two planes that are both scanned, while a Type II edge connects two planes where only one plane is scanned. Therefore, two different methods are required to extract these two types of edges.
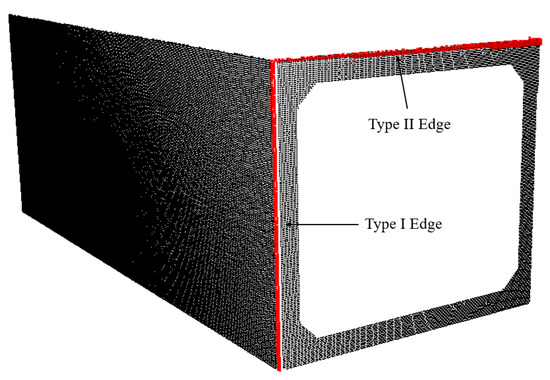
Figure 9.
Two types of edges.
A Type I edge connects two planes that have both been scanned. Therefore, an approximate line for this edge is estimated using these two planes. When calculating the line, each adjacent plane for every plane is traversed in the order of rows and columns in the relationship matrix . The system of simultaneous equations for the plane equation is then solved based on the plane coefficient matrix . This process yields the direction vector of the edge and the coordinates of a point on the edge.
For each Type II edge, an edge detection algorithm based on the position relationship of neighboring points is employed to identify the edge points based on the location of the edge within the plane. To enhance computational efficiency, a coarse segmentation is initially performed on the planes from which Type II edges need to be extracted, isolating the points near the edges. In the tunnel point cloud, the Type II edges are parallel to the ground. Leveraging the elevation information, the Type II edges can be distinguished as upper edges and lower edges. For the upper edges, a height threshold is set, segmenting the portions above the height threshold to complete the coarse segmentation. Similarly, for the lower edges, a height threshold is set, segmenting the portions below the height threshold to complete the coarse segmentation. For the coarsely segmented edges, a k-d tree is used to obtain the neighborhood points for each point, and the direction vectors from each point to its neighborhood points are calculated. For the upper edges, a point is considered an edge point when the angle between its direction vector and the Z-axis exceeds the angle threshold , as shown in Figure 10a. For the lower edges, a point is considered an edge point when the angle between its direction vector and the negative Z-axis exceeds the angle threshold , as shown in Figure 10b. In the Figure 10, red points represent the identified edge points, while yellow points indicate the points that prevent the current point from being recognized as an edge point. The RANSAC algorithm is then applied to fit the identified edge points, obtaining the linear equation expression for the edge, as illustrated in Figure 11.

Figure 10.
Edge detection: (a) upper edge detection; (b) lower edge detection.

Figure 11.
Type II edge extraction.
The Type I edge and the Type II edge are stored in a column vector of order based on the extraction sequence. The coefficients of the parametric equations for each edge are represented by a coefficient matrix of order .
Edge Connectivity Relationship Matrix
To determine the corner points on the tunnel, it is necessary to establish the connection relationships between the adjacent edges. Similar to the storage of the plane connectivity relationships, a relationship matrix is used to store the adjacency relationships between different edges. Since there is a gap between the ends of each pair of edges obtained from the edge extraction, this study adopts a distance threshold to detect the connection relationships between edges. A k-d tree structure is employed to calculate the distance between the nearest point pairs of two edges. If the distance between the nearest point pairs of two edges is less than , it indicates that the PCD for these two edges are adjacent. The is set as half of the distance between the adjacent parallel edges. Once the connection relationships between the edges are determined, this information is stored in an order relationship matrix . Here, is a logical matrix with elements of only 0 and 1, where 1 indicates the presence of an adjacency relationship between two edges and 0 indicates no such relationship.
Corner Point Extraction
To calculate the corner point coordinates of the tunnel segments, this paper proposes the Distance Multi-Line Nearest Point (DMLNP) algorithm, which estimates the position of the corner points using multiple edges connected to the corner points. Using the relationship matrix , the connected line numbers can be identified. Subsequently, by searching the coefficient matrix , the equations for all connected lines can be obtained. Next, the efficient matrix method proposed by HAN and BANCROFT [36] is used to compute the nearest points of multiple lines, yielding the corner point positions of the tunnel segments, as shown in Figure 12. The coordinates of the intersection points are stored in an order matrix based on the calculation sequence.
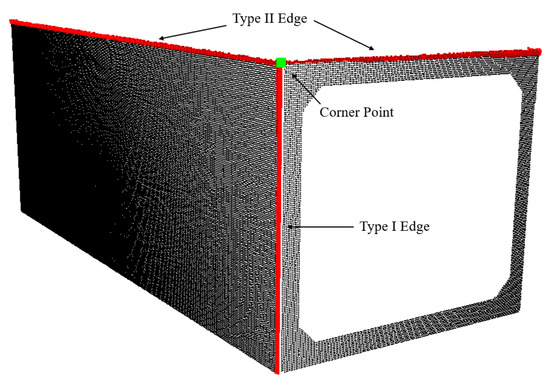
Figure 12.
Corner point extraction.
3.2.3. Circular Tunnel Feature Extraction
For circular precast utility tunnels, the point cloud data of the precast utility tunnel serve as the input for feature extraction, whereby the length and diameter of the utility tunnel are obtained through projection algorithms and the RANSAC algorithm. As the components of circular precast utility tunnels typically exhibit cylindrical shapes, traditional methods directly utilizing the RANSAC algorithm to fit cylinders encounter significant deviations in practical applications. Therefore, this paper proposes a precise method for extracting the geometric features of the cylindrical components.
Firstly, the RANSAC algorithm is employed to fit circles to the cross-sectional point cloud data of the utility tunnel, obtaining an accurate inner radius and outer radius of the circular prefabricated utility tunnel segment. Subsequently, is used as a preset parameter for the RANSAC algorithm to fit the circular utility tunnel point cloud, obtaining the parameters of the central axis of the circular utility tunnel point cloud. Finally, the perpendicular distance from each point in the utility tunnel segment point cloud to the central axis is calculated, and the points with an absolute difference greater than the threshold from are filtered out. Through this process, the portions of the point cloud not belonging to the circular precast utility tunnel can effectively be removed. Next, the remaining point cloud is projected onto the fitted central axis, and the distance between the two endpoints is calculated to determine the length of the circular precast utility tunnel segment.
3.3. Dimension Calculation and Inspection
3.3.1. Flatness Calculation
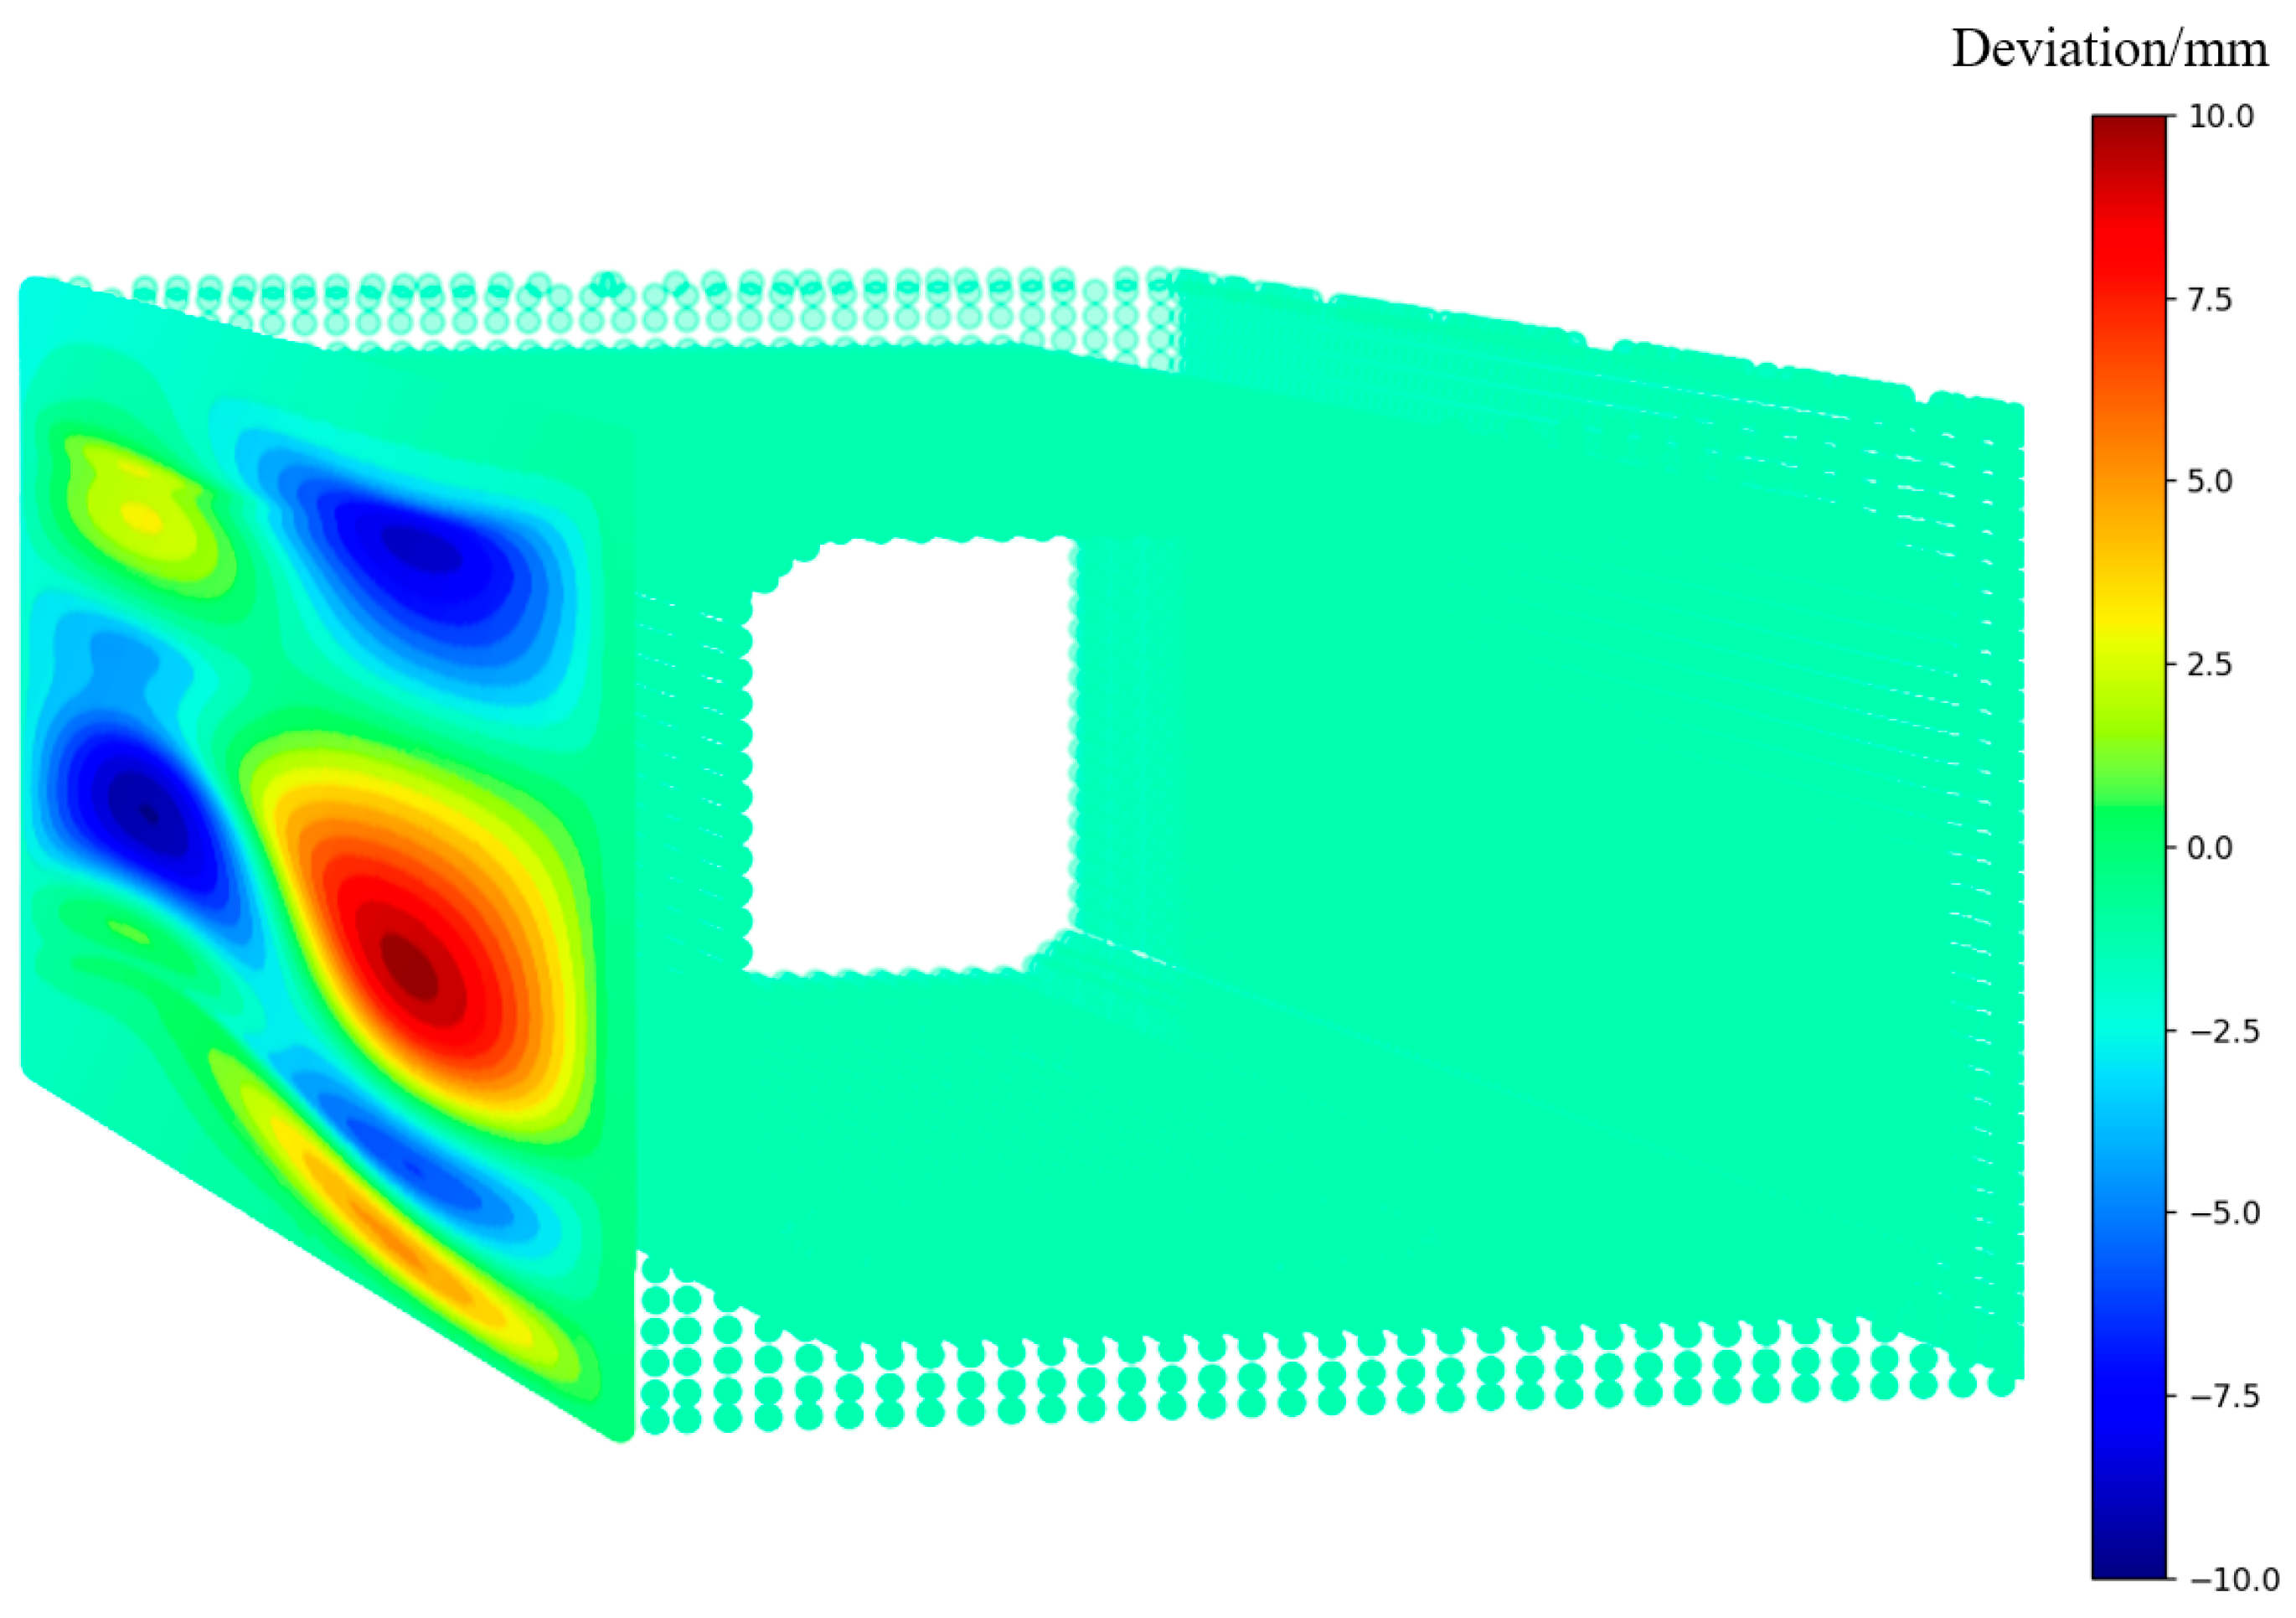
The detection of the surface flatness based on the PCD fundamentally involves computing the relative elevation differences at different positions on the scanned surface. In Section 3.2, the reference planes for each surface were already obtained. By calculating the angle between the normal vector of each point to its corresponding plane and the normal vector of the reference plane, the convexity or concavity of the scanned surface can be determined. The distance from each data point to the reference plane is calculated as the relative elevation difference at the data point’s position, with its sign determined by the unit normal vector of the reference plane. Consequently, the flatness of the detected surface can be displayed using different colors based on the relative elevation differences of each data point, as shown in Figure 13. In the algorithm presented in this chapter, a color representation range, with a threshold , is set as an input parameter to generate a color-coded difference map [37]. The interval is divided into several segments. Within these segments, the color coding gradually transitions from blue to red. Blue represents concavity, while red represents convexity.
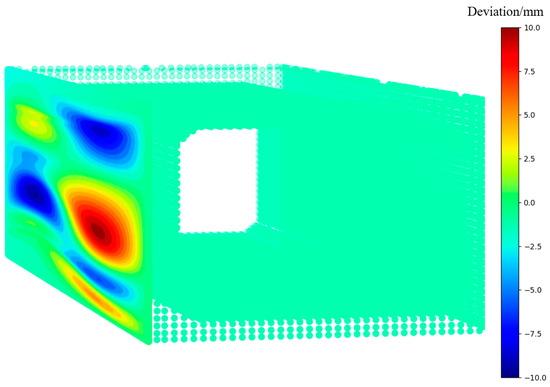
Figure 13.
The schematic diagram of the flatness detection results.
3.3.2. Length Calculation
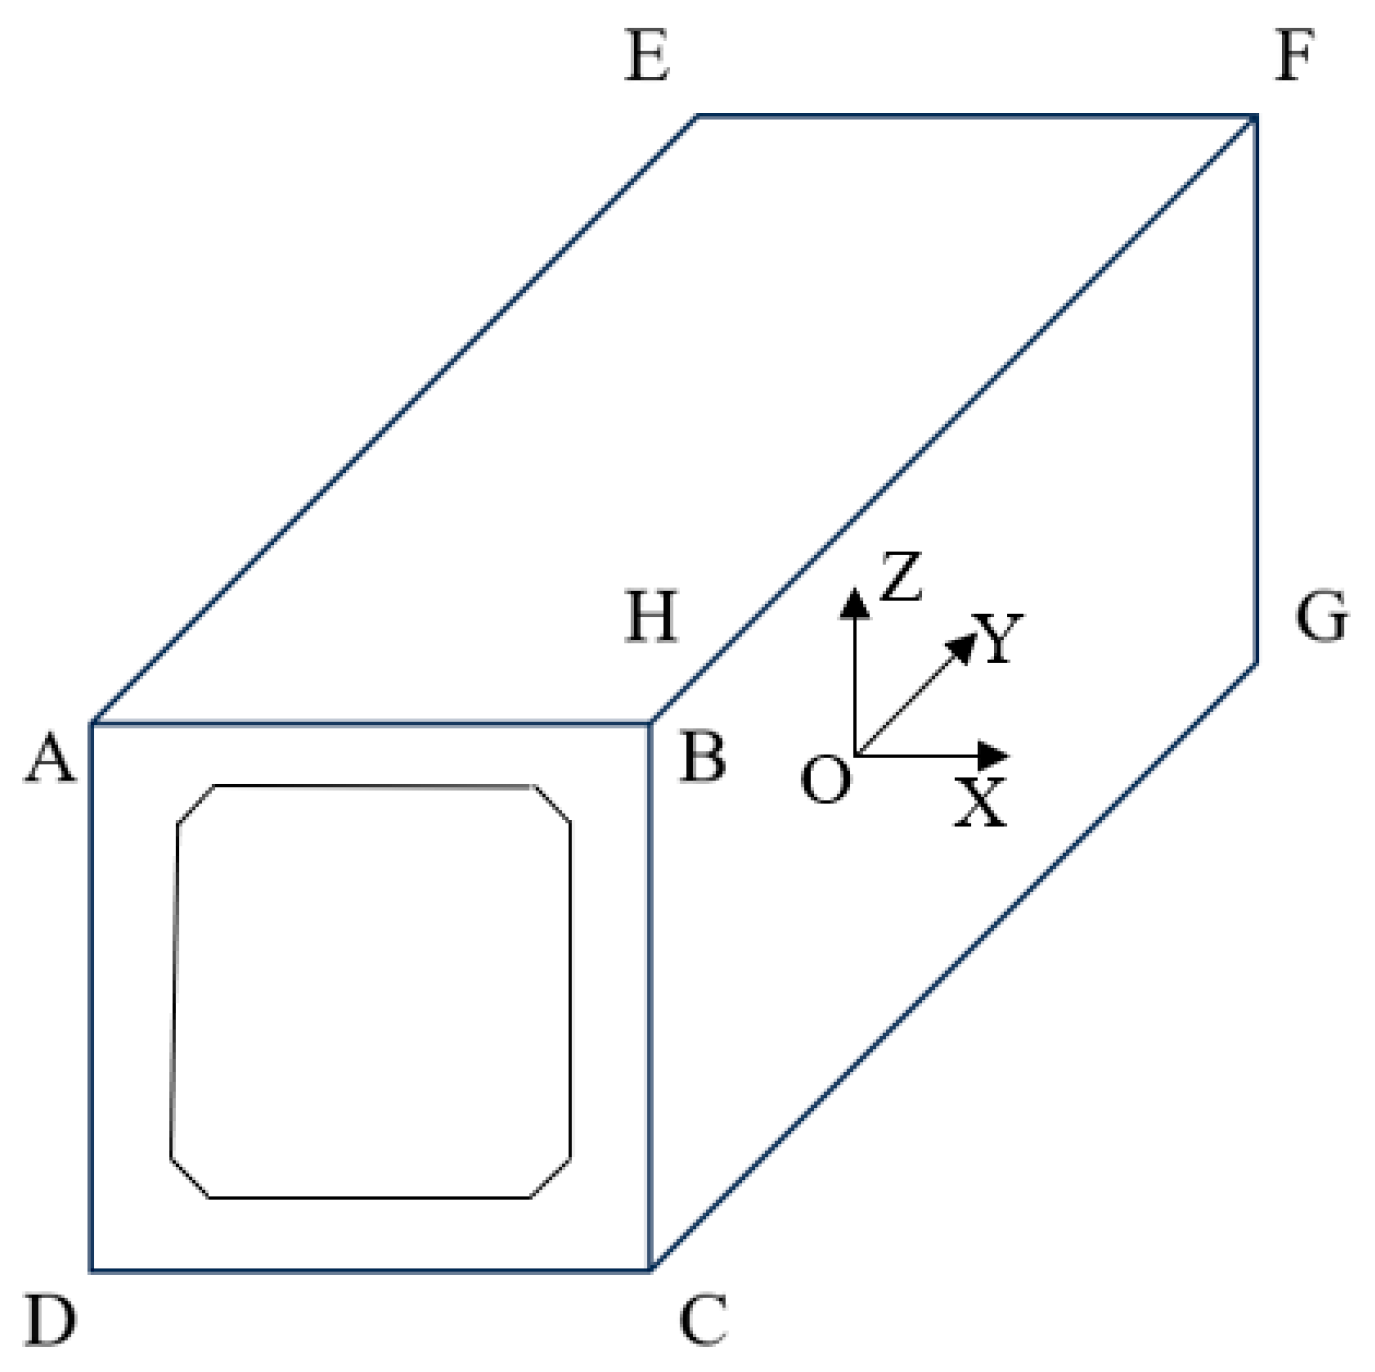
Different methods are required for calculating the lengths of the components in circular and rectangular utility tunnels. For the rectangular components, the point pairs used for calculating the different parameters can be determined based on the spatial relationship between the corner points, as shown in Figure 14. Therefore, for the length calculation, the point pairs with the same X-axis and Z-axis coordinates are selected, such as AE, BF, CG, and DH. For the circular components, the method described in Section 3.2.3 can be employed to obtain the length of the component.
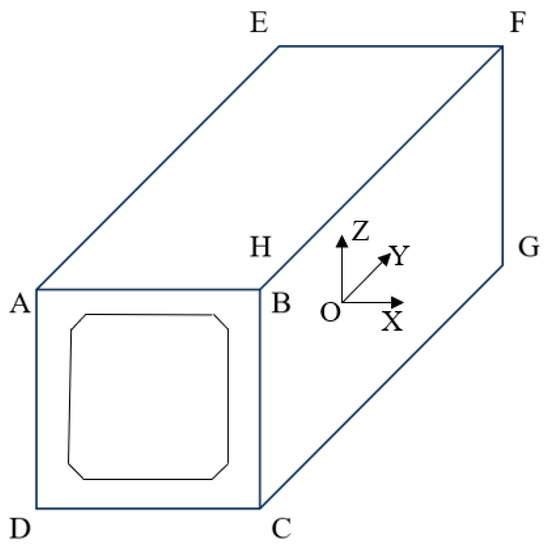
Figure 14.
Corner point numbering annotation.
3.3.3. Cross Section Dimension Calculation
For the width calculations, the point pairs with the same coordinates along the Y- and Z-axes are chosen, such as AB, DC, EF, and HG. For the height calculations, the point pairs with the same coordinates along the X- and Y-axes are selected, such as AD, BC, EH, and FG.
For the two planes for which the thickness needs to be calculated, the process involves first computing the average distance from all points on one plane to the other fitted plane. Then, the average of these two average distances is taken as the thickness.
3.3.4. Diagonal Difference Calculation
Diagonal difference refers to the difference in length between two diagonals on a plane. The first step is to determine the lengths of the diagonals. Point pairs are selected where the X-axis coordinates are the same and the Y- and Z-axis coordinates are opposite. These point pairs provide the lengths of the diagonals. The diagonal difference is then obtained by calculating the difference between the lengths of two diagonals with the same X-axis coordinates.
3.3.5. Quality Inspection
Design of Information Extraction
After obtaining the geometric dimensions of the tunnel, it is necessary to perform quality checks by comparing the dimensions with the design information. Industry Foundation Classes (IFC), based on EXPRESS language, serve as a universal data standard for the BIM, encompassing the fundamental project structures and geometric information. This study parses the IFC files based on standard information descriptions, extracting the standard geometric information for tunnels from the BIM.
In this paper, a tree data structure is employed to represent and organize the component information when processing the IFC files. Each branch node in this structure represents a component in the IFC model, containing basic information such as name, description, globally unique identifier (GUID), and IFC category. Additionally, each branch node includes a list pointing to its child nodes, reflecting the hierarchical and spatial relationships among the components. The extraction process is based on the principle of recursive traversal, starting from the root node of the IFC model and parsing each component layer by layer. During this process, each component is first checked to determine if it has already been visited to avoid redundant processing. For each unvisited component, its basic attributes (such as class name, ID, name, and description) are extracted. When parsing the components, particular attention is given to key characteristics such as spatial location (coordinates and orientation), dimensions (length, width, height, and thickness), and relationships with other components.
Component Matching and Quality Inspection
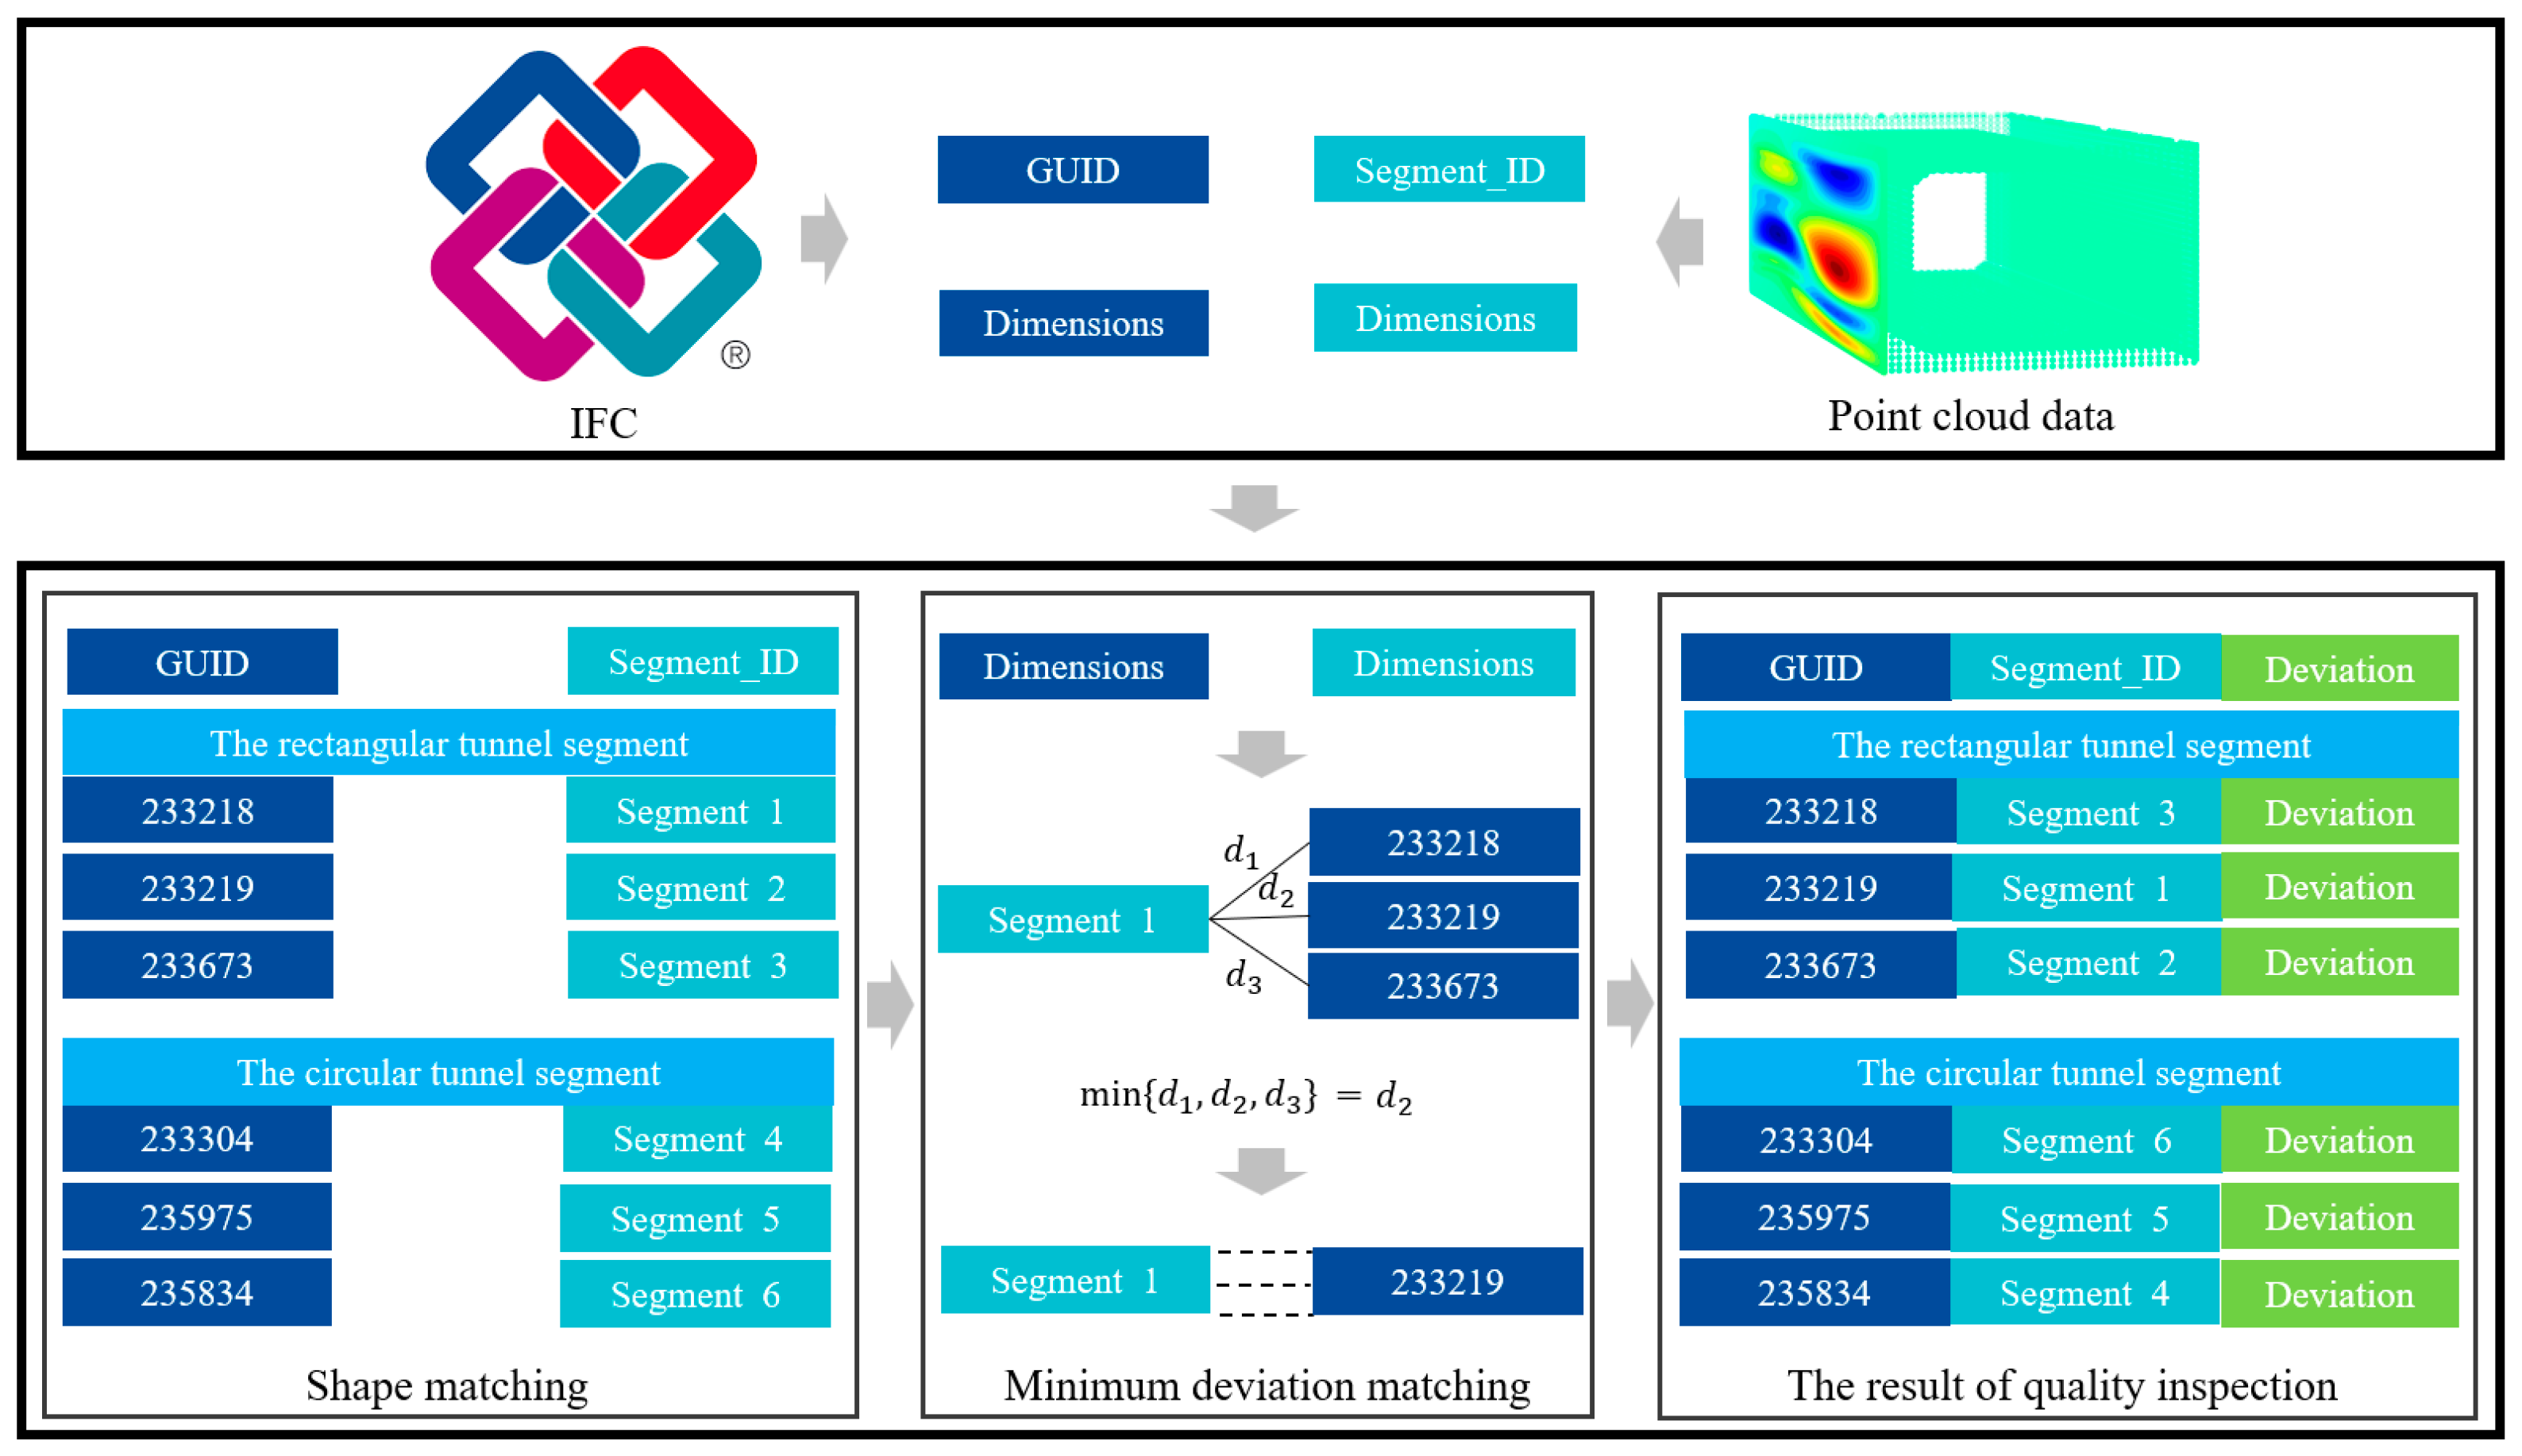
The calculated geometric information of the tunnel segment point cloud is referred to as the computed dataset (C dataset), which includes the segment’s ID and geometric details. The information extracted from the BIM is referred to as the design dataset (D dataset), containing the segment’s GUID and geometric details. The segment numbering in the BIM (GUID) differs from the self-defined ID in the computed dataset, making it difficult to directly link the component information between the two datasets.
To automate the comparison of the geometric information between the calculated values and the design values, this paper proposes a two-stage automated matching method. In the first stage, preliminary shape matching is performed between the C dataset and the D dataset based on the shapes of the tunnel segment point clouds obtained using the CSGRFI method. In the second stage, for any segment in the C dataset, the sum of the deviations in length, width, and height from the D dataset is calculated. The design information with the smallest deviation sum is identified as the corresponding design information for that segment, completing the matching between the C dataset and the D dataset. Finally, the geometric deviation results are the output based on the matching results.
The matching process is illustrated in Figure 15, where d represents the sum of the deviations in length, width, and height between the design dataset and the measured dataset.

Figure 15.
BIM-based quality inspection.
4. Case Study
To validate the accuracy of the proposed method in calculating the geometric information of precast tunnel segments, real precast tunnel segments from a factory in Guangdong Province, China, were used for the experiment. In the precast component factory, a large number of tunnel segments are placed, among which four rectangular segments and four circular segments were used for this experiment. The point cloud data of the segments were processed using the proposed method, and the obtained geometric dimensions were compared with the manual measurements to evaluate the accuracy of the proposed method. The algorithm presented in Section 3 was implemented in C++ on Visual Studio 2019, using an open-source implementation of Point Cloud Library (PCL). The data processing was performed using the following computing devices: Intel® Core™ i9-12950HX 2.3 GHz, 64 GB RAM, NVIDIA GeForce RTX 3080Ti Laptop GPU.
The Trimble X7 laser scanner was used for acquiring the 3D point cloud in this study. The performance parameters of Trible X7 are shown in Table 4. Prior to scanning, the scanning stations were planned to obtain high-quality point cloud data with as few stations as possible. Multiple stations were set up to complete the data acquisition for both the rectangular and circular tunnels, as shown in Figure 16.
Table 4.
The performance parameters of Trimble X7.
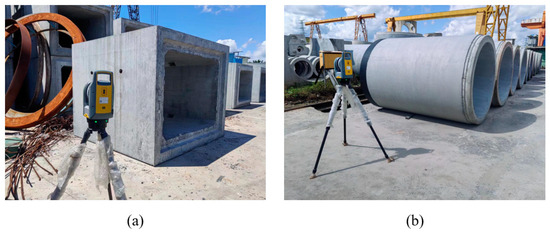
Figure 16.
The acquisition of the point cloud data: (a) the rectangular tunnel; (b) the circular tunnel.
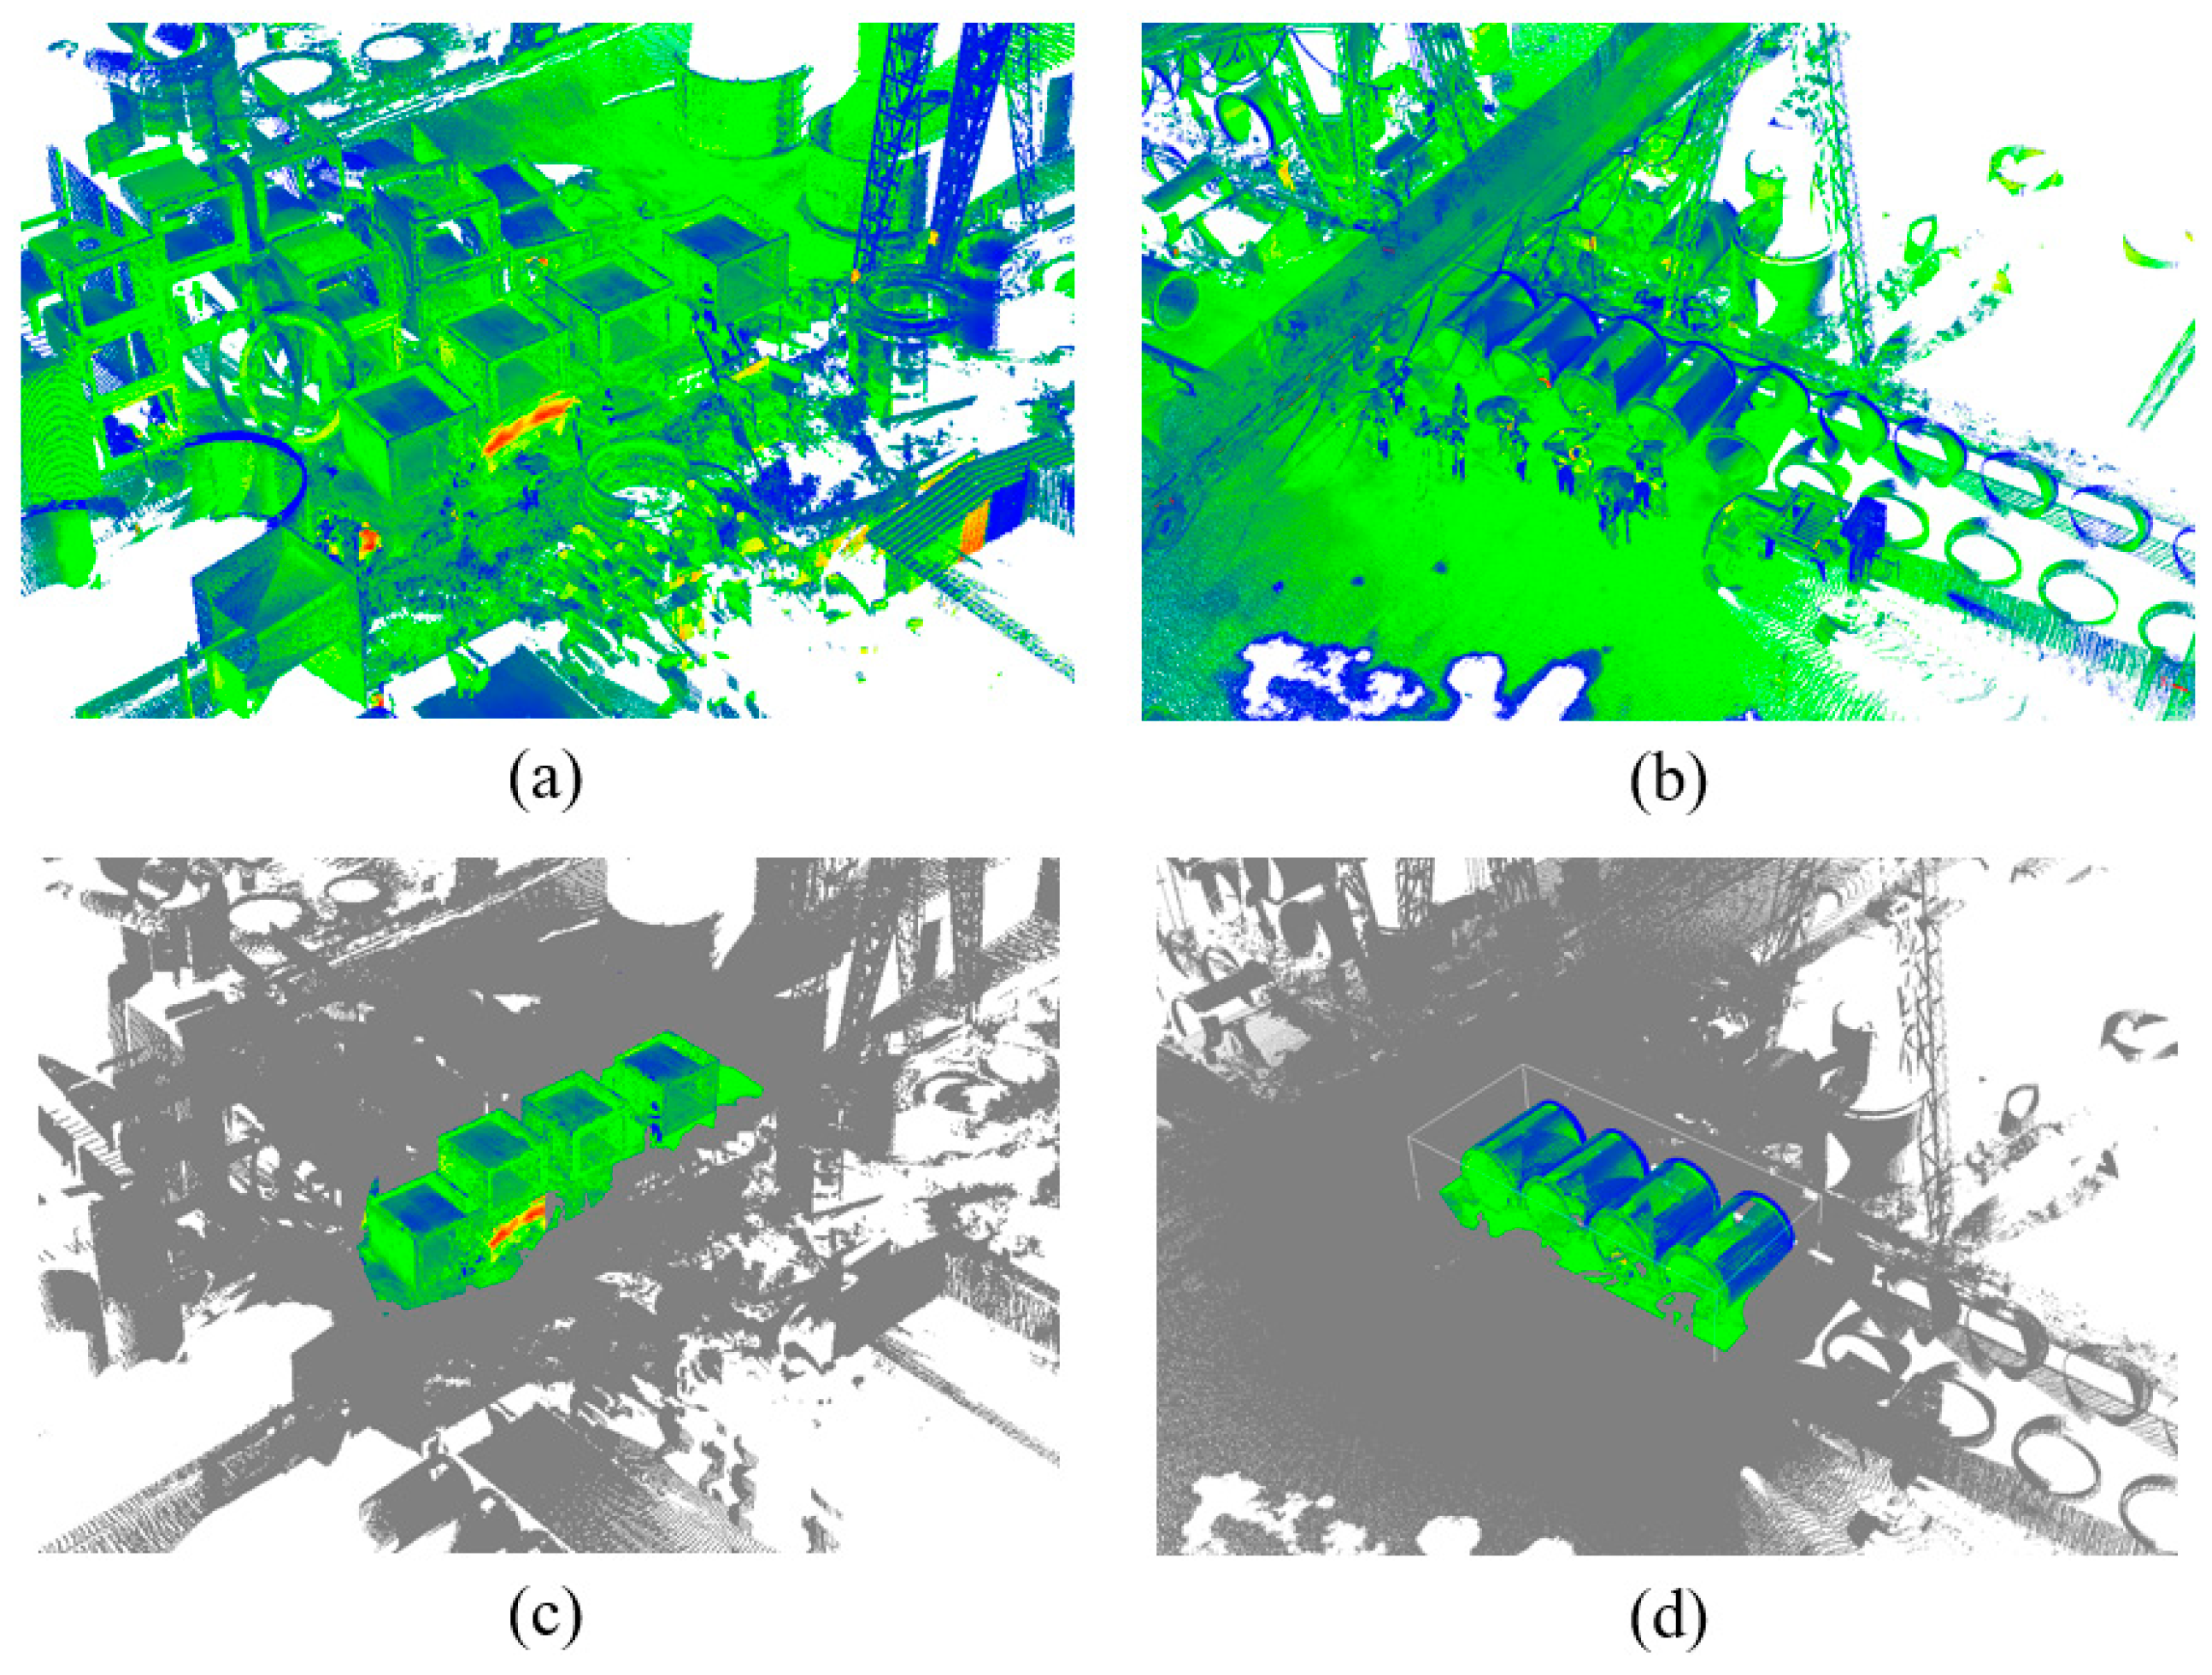
Figure 17a,b show the point clouds collected for the rectangular and circular tunnels, respectively. In this study, 17 stations were set up to capture the point clouds for four rectangular tunnels, resulting in a total of 107,408,996 points. Additionally, 13 stations were used to acquire the point clouds for four circular tunnels, yielding 63,109,140 points. The point clouds were segmented based on the station positions to preliminarily obtain the point clouds of the components of interest, as shown in Figure 17c,d.
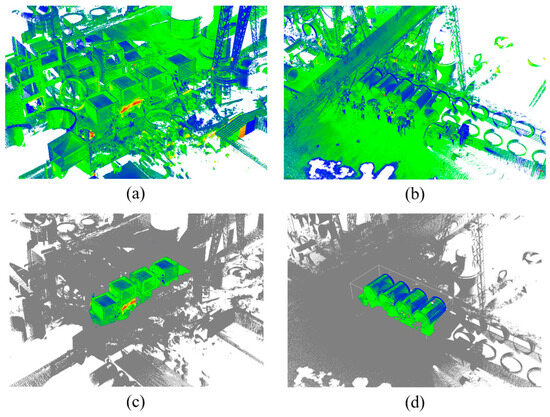
Figure 17.
Precast utility tunnel point cloud data: (a) the original point cloud of the rectangular tunnel; (b) the original point cloud of the circular tunnel; (c) the point cloud of the rectangular tunnel after extracting the region of interest; and (d) the point cloud of the circular tunnel after extracting the region of interest.
4.1. Feasibility of the Proposed Method
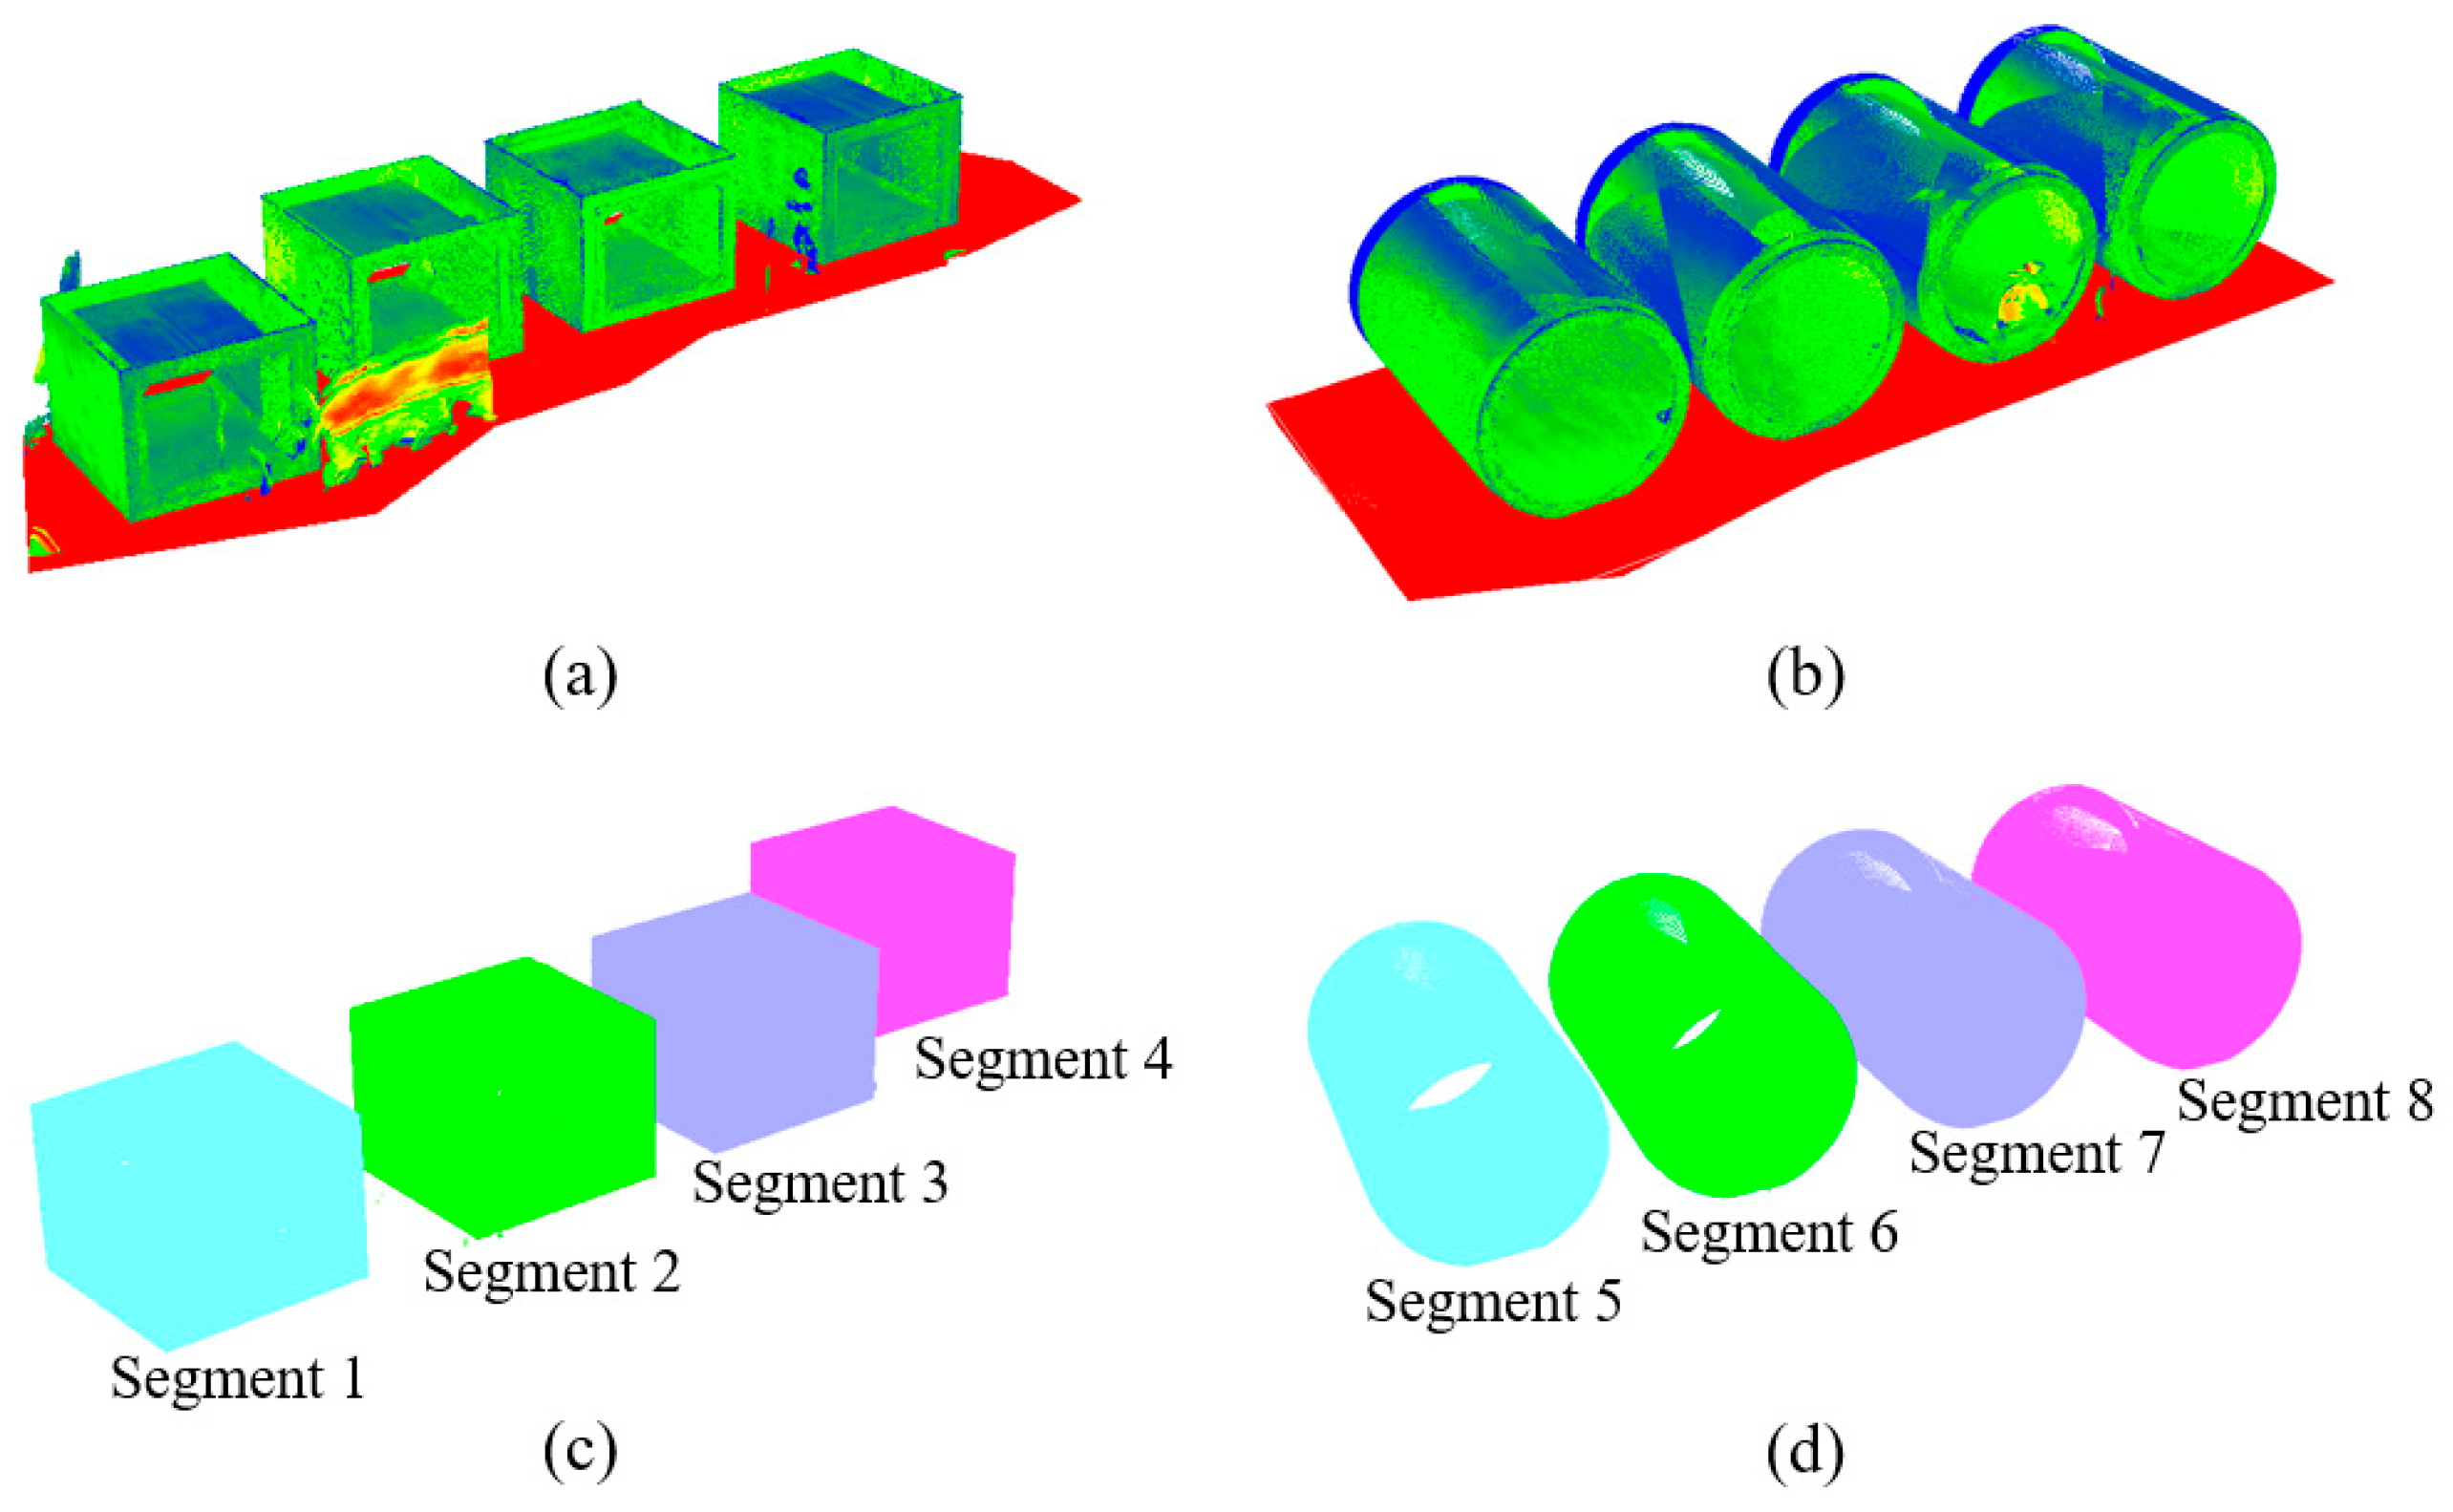
The proposed method is applied to process the PCD of the segment. The first step is the preprocessing of the PCD. To eliminate the ground points from the PCD, an elevation threshold of 0.1 m and an angle threshold of 40 degrees is set. As shown in Figure 18a,b, the ground points are identified and segmented. The Euclidean algorithm is used to process the point clouds after removing the ground, clustering the point clouds based on distance thresholds. Figure 18c,d show the clustering results, where the point clouds are grouped and segmented into distinct segment point clouds.

Figure 18.
Preprocessing of point cloud: (a) ground removal from the rectangular tunnel point cloud; (b) ground removal from the circular tunnel point cloud; (c) Euclidean algorithm segmentation of the rectangular tunnel segments; and (d) Euclidean algorithm segmentation of the circular tunnel segments.
To improve subsequent computational efficiency, the original point cloud is down-sampled with a voxel size of 0.01 m. For example, the Segment 1 point cloud data consist of 7,816,989 points. This down-sampling process significantly reduces the number of points to 454,161. The centroid coordinates of the obtained tunnel point cloud are calculated, and the entire tunnel point cloud is translated to align the centroid with the origin of the global coordinate system. The PCA method is employed to compute the main axis of the tunnel point cloud. By calculating the rotation matrix based on the angle between the main axis and the y-axis direction, the tunnel point cloud is rotated around its centroid to align the main axis with the y-axis direction while keeping the centroid at the center.
The shape of the tunnel is recognized using the CSGRFI algorithm, and different methods are employed to extract the geometric features. Table 5 presents the recognition results of the CSGRFI algorithm applied to eight segments. The results indicate that the proposed CSGRFI algorithm achieved a 100% success rate in identifying the two types of cross-sectional shapes. The average time to complete the shape recognition was only 131 milliseconds. The experimental data demonstrate that the CSGRFI algorithm exhibits excellent performance in identifying the cross-sectional shapes of the segments. Segment 1 was identified as a rectangular tunnel, while Segment 5 was identified as a circular tunnel.
Table 5.
The results of the segment shape recognition.
For Segment 1, the region growing algorithm and RANSAC algorithm are employed to identify and segment the planes, as shown in Figure 19a. A plane connectivity matrix is constructed to extract one type of edge, and the proposed edge detection algorithm is used to extract the second type of edge, as depicted in Figure 19b. The corner points on the tunnel are determined based on the edges, as shown in Figure 19c. For Segment 5, the inner and outer diameters, as well as the length of the pipeline, are obtained by fitting the cross section, as shown in Figure 19d,e.
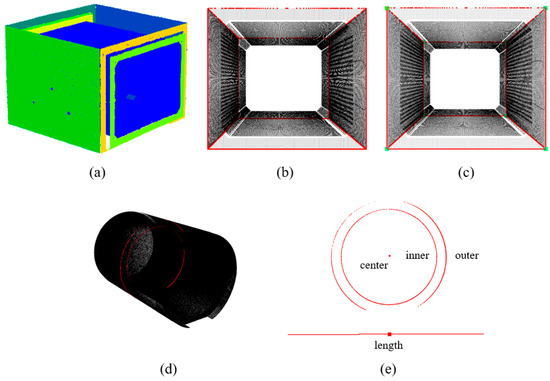
Figure 19.
Application of the proposed geometric information extraction method: (a) the plane extraction of the rectangular segment; (b) the edge extraction of the rectangular segment; (c) the corner point extraction of the rectangular segment; (d) the section fitting of the circular segment; and (e) the geometric information extraction of the circular segment.
After completing feature extraction, the first step is to calculate the surface flatness. The distance from each point on each plane to the reference plane is computed, and the flatness at that location is determined based on the distance. Next, dimensions such as the length, width, and height are calculated based on the corner points. Finally, the calculated results are compared with the design information.
4.2. Result
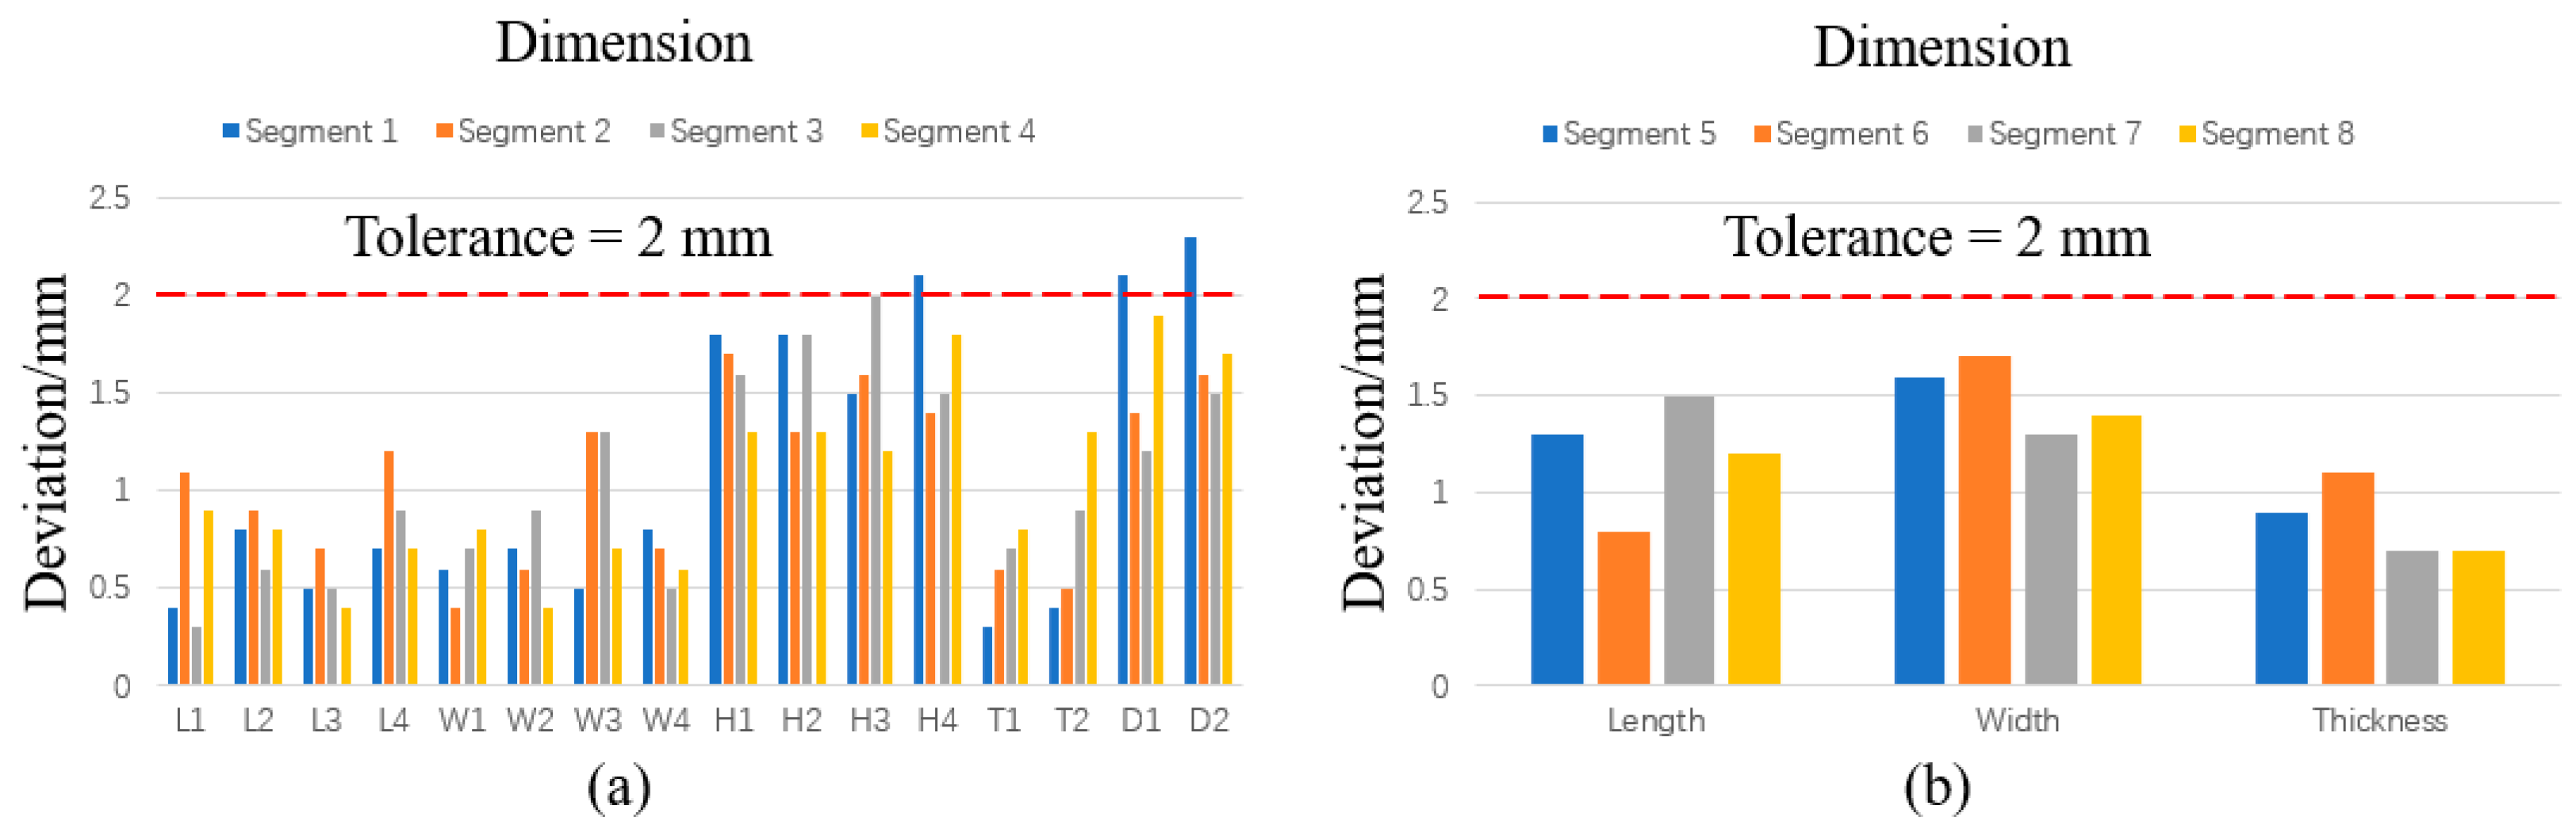
To verify the accuracy of the proposed method for detecting the dimensions of the tunnel segments, the results obtained by the manual measurement methods, as shown in Figure 20, were compared with those obtained by the proposed method. Table 6 and Table 7, respectively, record the deviation in the dimension detection results for the rectangular and circular segments. Figure 21 presents the histogram of the deviation analysis between the segments’ geometric quality assessment and the manual measurement method. The results indicate that the dimensional detection deviations for all items are less than 2 mm. Therefore, the proposed method demonstrates the capability to accurately calculate the geometric dimensions of the tunnel segments.
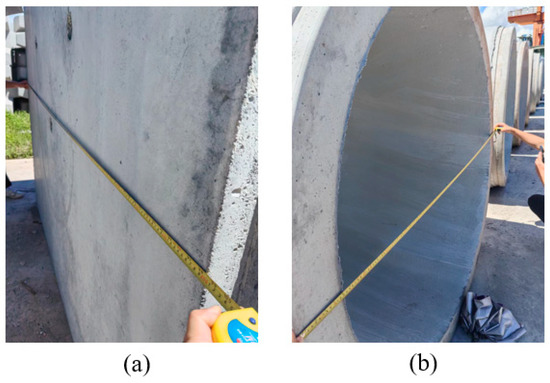
Figure 20.
The manual measurement methods: (a) the rectangular tunnel; (b) the circular tunnel.
Table 6.
The deviation between the proposed method and manual measurement for the rectangular segments (unit: mm).
Table 7.
The deviation between the proposed method and manual measurement for the circular segments (unit: mm).
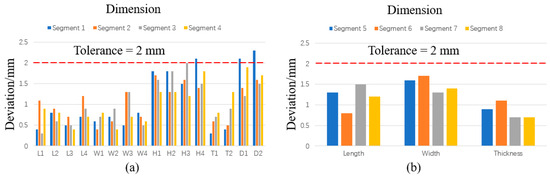
Figure 21.
Comparison of geometric quality assessment results between the proposed method and manual measurements: (a) rectangular segments; and (b) circular segments.
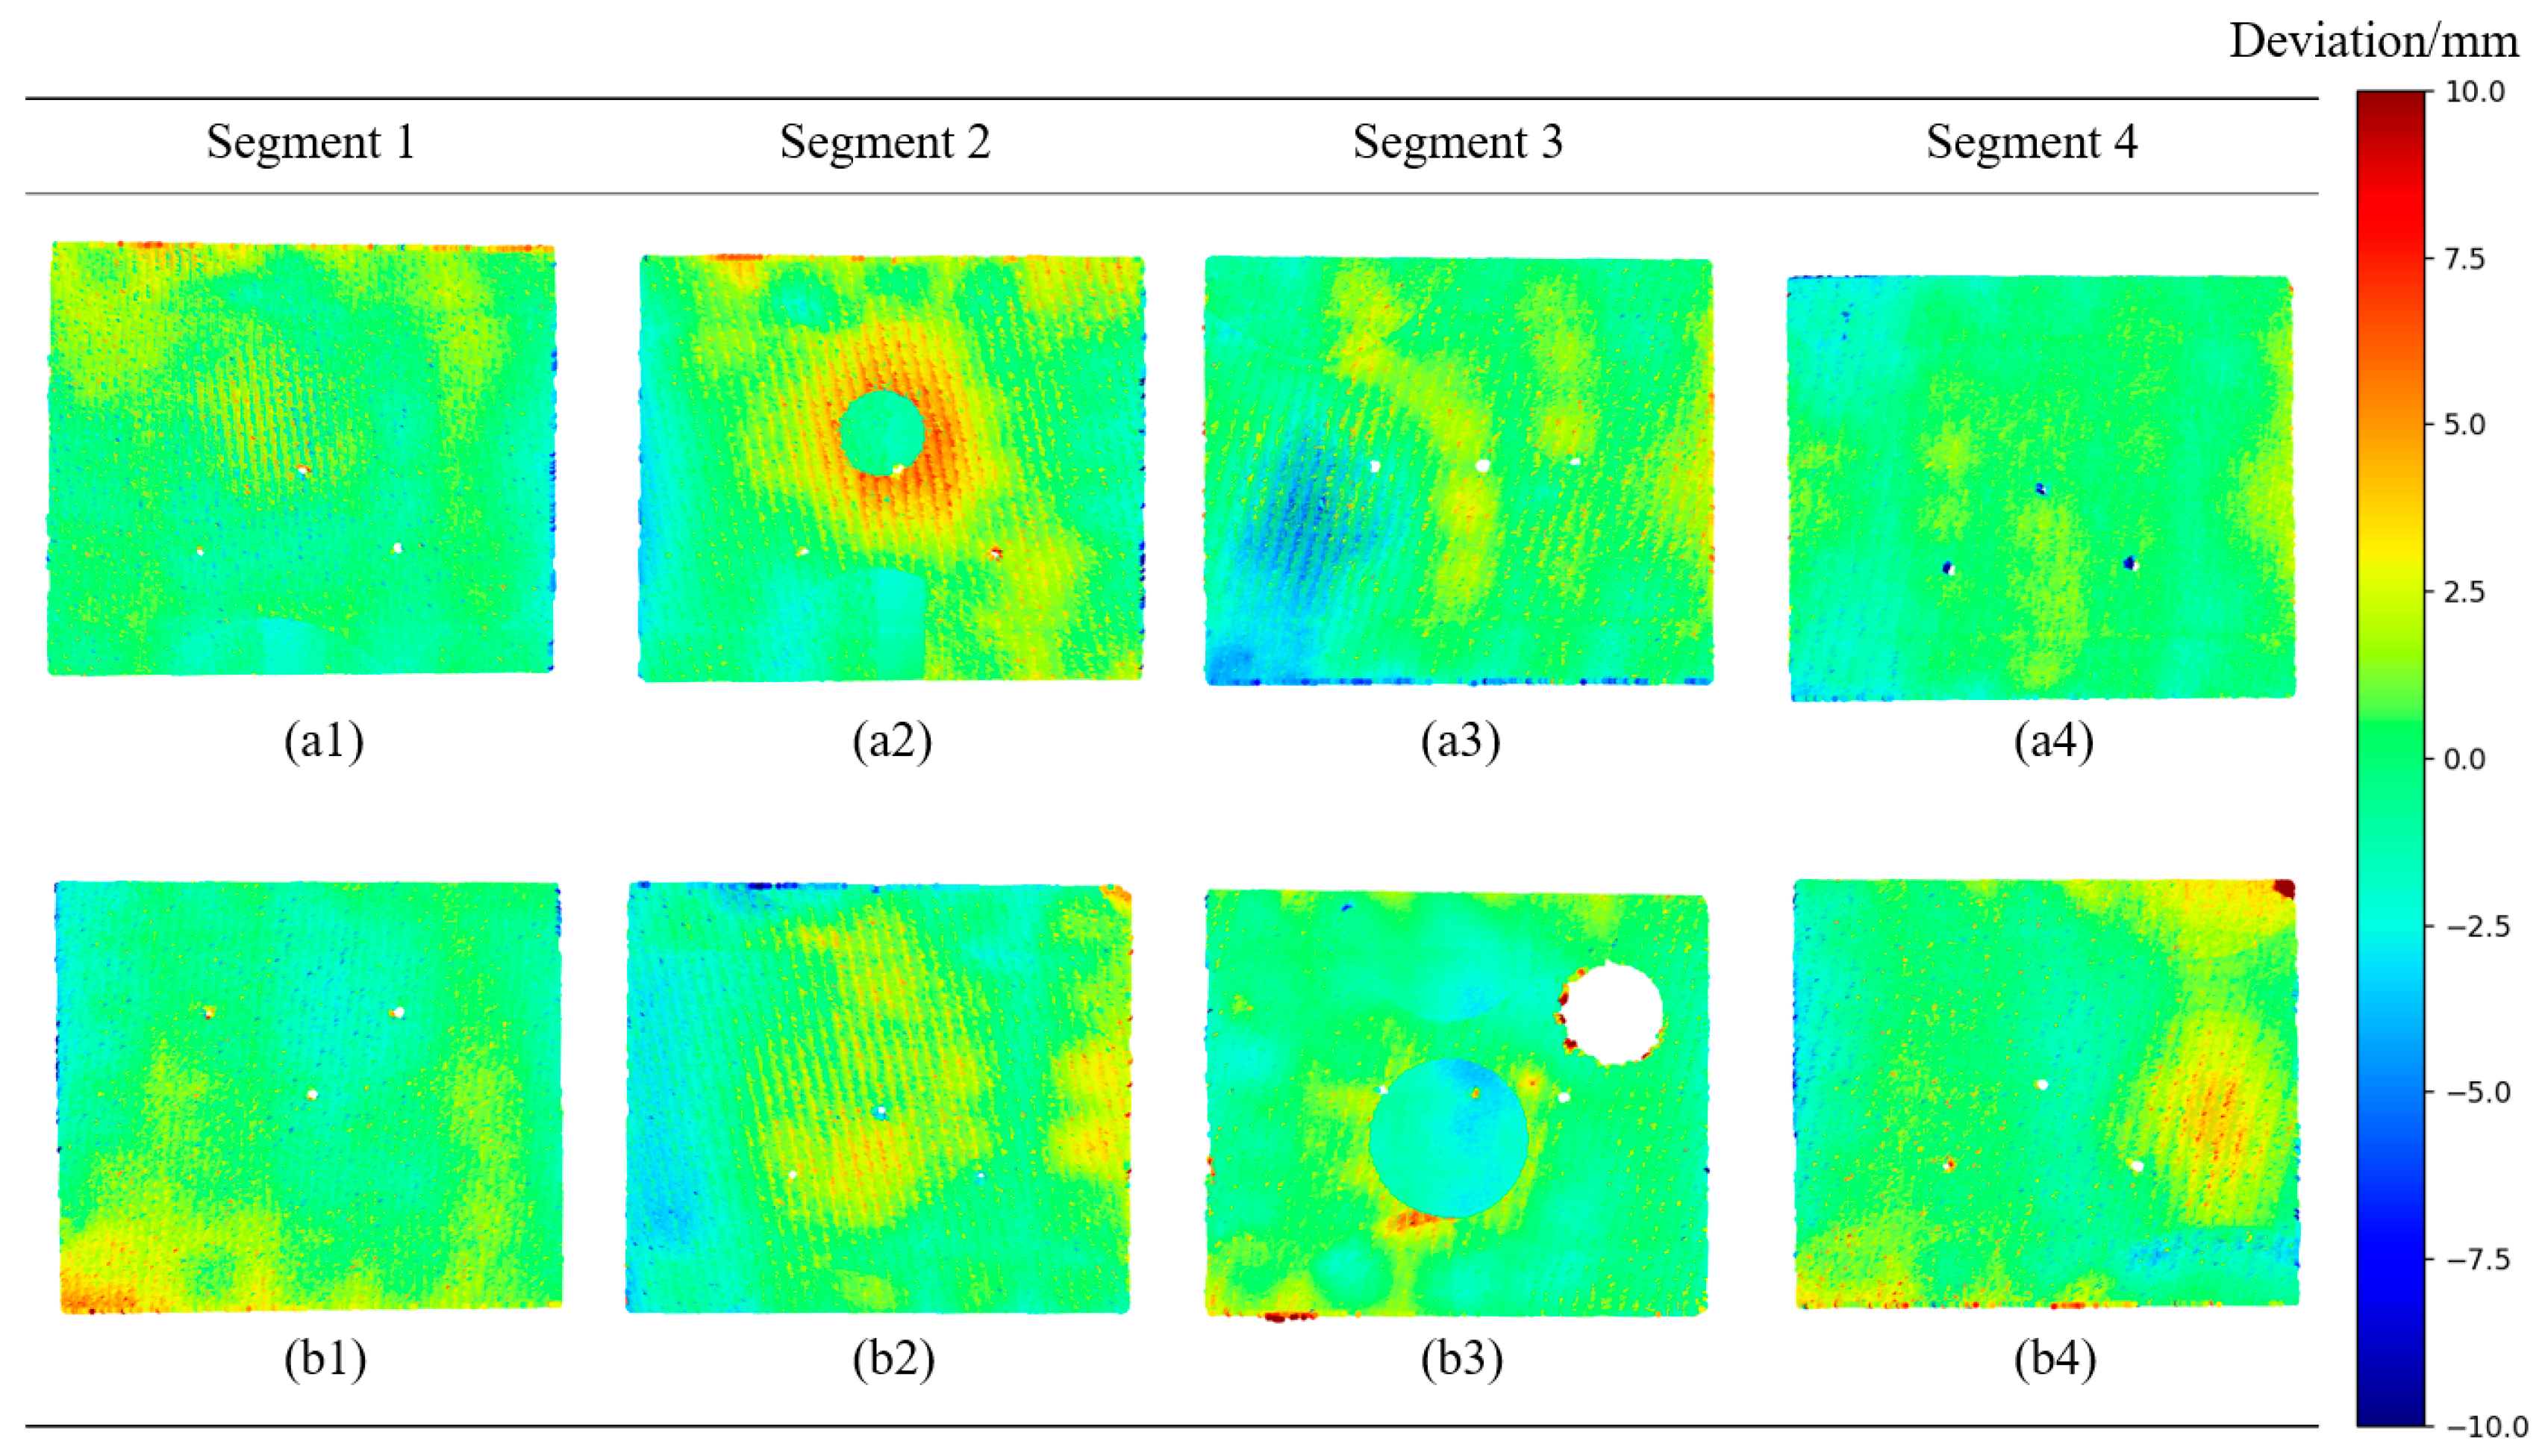
Figure 22 shows the flatness detection results for the outer surfaces of the four rectangular segments. The results indicate that the outer surfaces of the four segments have few concave areas, with most areas being unevenly convex and the majority of these convex areas protruding more than 3 mm. According to the standards specified in Table 1, the flatness detection of these four rectangular segments is deemed non-compliant. To repair these segments, workers can refer to Figure 18 to fill all concave areas and grind down all areas that protrude more than 3 mm. Therefore, the proposed method is capable of accurately assessing the flatness of the tunnel surface.
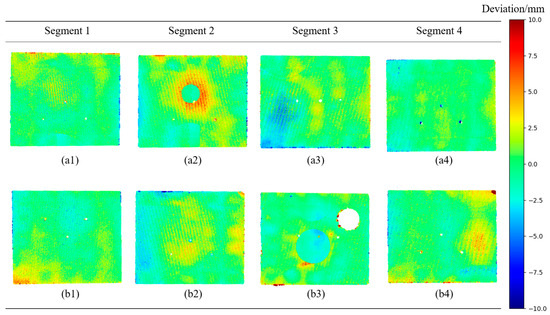
Figure 22.
The results of the flatness detection: (a1) detection results for one side of segment 1; (b1) detection results for the other side of segment 1; (a2) detection results for one side of segment 2; (b2) detection results for the other side of segment 2; (a3) detection results for one side of segment 3; (b3) detection results for the other side of segment 3; (a4) detection results for one side of segment 4; (b4) detection results for the other side of segment 4.
Table 8 shows the time required to inspect eight segments using the proposed detection method and the traditional manual measurement method. Compared with the manual measurement method, the proposed method saved about 88 min or 44% of the total detection time.
Table 8.
Time comparison between the detection method proposed in this paper and the manual measurement method.
5. Discussion
When calculating the geometric dimensions of the tunnel segments, the proposed method in this study still shows some degree of deviation compared to manual measurements. The sources of deviation may originate from two aspects. First, the results of the manual measurements are influenced by human operation and cannot be entirely accurate. Second, if the segments are too close to the ground, the ground segmentation algorithm might affect the estimation of the segment height. As shown in Figure 21, the average deviation in height is greater than in other detection items. Therefore, to achieve more accurate detection results, it is recommended in this study to ensure that the segments are not in contact with the ground during the detection.
Additionally, during the experiments conducted in real-world scenarios, challenges were encountered during the data acquisition phase. When using LiDAR to acquire the point cloud data, conflicts with the production operations are likely. The movement of machinery on-site can obstruct the point cloud acquisition process. To address this issue, it is essential to plan the scanning operation’s scope and timing in advance and communicate with on-site management personnel.
6. Conclusions
This paper proposes a method for the geometric quality automated inspection of multi-type precast utility tunnel segment components using the BIM and LiDAR. The proposed method initially preprocesses the acquired point cloud, filtering out noise points and ground portions, and aligns the point cloud of the tunnel. Subsequently, different shapes of tunnel are accurately identified using the proposed CSGRFI algorithm. Various feature extraction methods are employed based on the shape of the tunnel. The region growing and RANSAC algorithms are employed for the plane segmentation, identifying the planes based on the plane normal vectors and point counts. Following this, a plane connection relationship matrix and the proposed edge detection algorithm are utilized to extract the Type I edge and the Type II edge. The edge connection relationship matrix and the DMLNP algorithm are applied to extract the corner points on the utility tunnel. Finally, using the extracted features, the geometric dimensions and flatness of the utility tunnel are calculated and compared with the design information.
The proposed method was validated in a real precast component factory. When applied to eight real tunnel segments, the method achieved a 100% success rate in identifying the cross-sectional shapes of the segments. The geometric dimension extraction method proposed yielded detection results with an average deviation of less than 2 mm when compared to manual methods. The flatness detection visualization results obtained by the proposed method accurately reflected the flatness condition of the segment surfaces. Therefore, the proposed method can effectively achieve the automated geometric quality inspection of precast tunnel segments. Compared with the manual measurement method, the time efficiency of the proposed method was improved by 44%. The proposed method enables the efficient geometric quality inspection of tunnel segments, effectively addressing the construction industry’s need for large-scale, high-quality tunnel projects.
However, there are some limitations to the proposed method. Firstly, the current data collection for tunnel segments still heavily relies on manual processes. Secondly, the focus is currently on the geometric quality inspection of individual tunnel segments, without considering the quality inspection of the segment assembly. Therefore, future research will continue to explore methods for the automated point cloud data collection and quality inspection of multi-segment assembly.
Author Contributions
Conceptualization, Z.G.; methodology, Z.G. and Y.Z.; software, G.W., R.Y., X.H. and D.W.; validation, Z.L., L.L. and S.L. (Shengzhen Li); formal analysis, Z.G., R.Y., X.H., S.L. (Shenghan Li) and D.W.; data curation, Z.G. and Y.Z.; writing—original draft, Z.G., G.W. and Y.Z.; writing—review and editing, Z.L. and L.L.; visualization, Z.G.; supervision, Y.Z. and S.L. (Shengzhen Li); project administration, R.Y. and X.H.; resources, S.L. (Shenghan Li) and D.W.; and funding acquisition, S.L. (Shenghan Li). All authors have read and agreed to the published version of the manuscript.
Funding
This research is supported by the Natural Science Foundation of Guangdong Province of China (No. 2023A1515011119).
Data Availability Statement
Some of the data, models, or code that support the findings of this study are available from the corresponding author upon reasonable request.
Conflicts of Interest
Authors Zhigang Guo, Zhengxiong Liu and Lingfeng Liu were employed by the company Shenzhen Municipal Group Co., Ltd. Author Ran Yang was employed by the company CCDC Shuyu Engineering Construction Co., Ltd. Author Daochu Wang was employed by the company Guangzhou Construction Engineering Co., Ltd. The remaining authors declare that the research was conducted in the absence of any commercial or financial relationships that could be construed as a potential conflict of interest.
References
- Guo, M.; Sun, M.; Pan, D.; Huang, M.; Yan, B.; Zhou, Y.; Nie, P.; Zhou, T.; Zhao, Y. High-precision detection method for large and complex steel structures based on global registration algorithm and automatic point cloud generation. Measurement 2021, 172, 108765. [Google Scholar] [CrossRef]
- Opfer, N. Construction defect education in construction management. In Proceedings of the ASC 35th Annual Conference, California Polytechnic University, ASC, San Luis Obispo, CA, USA, 7–10 April 1999. [Google Scholar]
- Cao, Y.; Liu, J.; Feng, S.; Li, D.; Zhang, S.; Qi, H.; Cheng, G.; Chen, Y.F. Towards automatic flatness quality assessment for building indoor acceptance via terrestrial laser scanning. Measurement 2022, 203, 111862. [Google Scholar] [CrossRef]
- Kim, M.-K.; Wang, Q.; Li, H. Non-contact sensing based geometric quality assessment of buildings and civil structures: A review. Autom. Constr. 2019, 100, 163–179. [Google Scholar] [CrossRef]
- Liu, J.; Zhang, Q.; Wu, J.; Zhao, Y. Dimensional accuracy and structural performance assessment of spatial structure components using 3D laser scanning. Autom. Constr. 2018, 96, 324–336. [Google Scholar] [CrossRef]
- Li, D.; Liu, J.; Feng, L.; Zhou, Y.; Liu, P.; Chen, Y.F. Terrestrial laser scanning assisted flatness quality assessment for two different types of concrete surfaces. Measurement 2020, 154, 107436. [Google Scholar] [CrossRef]
- Guo, J.; Yuan, L.; Wang, Q. Time and cost analysis of geometric quality assessment of structural columns based on 3D terrestrial laser scanning. Autom. Constr. 2020, 110, 103014. [Google Scholar] [CrossRef]
- Mohammadi, M.; Rashidi, M.; Mousavi, V.; Karami, A.; Yu, Y.; Samali, B. Quality Evaluation of Digital Twins Generated Based on UAV Photogrammetry and TLS: Bridge Case Study. Remote Sens. 2021, 13, 3499. [Google Scholar] [CrossRef]
- Hu, Z.; Chen, C.; Yang, B.; Wang, Z.; Ma, R.; Wu, W.; Sun, W. Geometric feature enhanced line segment extraction from large-scale point clouds with hierarchical topological optimization. Int. J. Appl. Earth Obs. Geoinf. 2022, 112, 102858. [Google Scholar] [CrossRef]
- Shao, Y.; Tong, G.; Peng, H. Mining local geometric structure for large-scale 3D point clouds semantic segmentation. Neurocomputing 2022, 500, 191–202. [Google Scholar] [CrossRef]
- Xiang, X.; Wang, L.; Zong, W.; Li, G. Extraction of local structure information of point clouds through space-filling curve for semantic segmentation. Int. J. Appl. Earth Obs. Geoinf. 2022, 114, 103027. [Google Scholar] [CrossRef]
- He, G.; Yang, J.; Behnke, S. Research on geometric features and point cloud properties for tree skeleton extraction. Pers. Ubiquitous Comput. 2018, 22, 903–910. [Google Scholar] [CrossRef]
- Zhou, Z.; Tai, Y.; Chen, J.; Zhang, Z. Local Feature Extraction Network for Point Cloud Analysis. Symmetry 2021, 13, 321. [Google Scholar] [CrossRef]
- Zhu, X.; Zhang, Z.; Ruan, J.; Liu, H.; Sun, H. ResSANet: Learning Geometric Information for Point Cloud Processing. Sensors 2021, 21, 3227. [Google Scholar] [CrossRef]
- Zhang, J.; Wang, J.; Dong, P.; Ma, W.; Liu, Y.; Liu, Q.; Zhang, Z. Tree stem extraction from TLS point-cloud data of natural forests based on geometric features and DBSCAN. Geocarto Int. 2022, 37, 10392–10406. [Google Scholar] [CrossRef]
- Tan, Y.; Li, S.; Wang, Q. Automated Geometric Quality Inspection of Prefabricated Housing Units Using BIM and LiDAR. Remote Sens. 2020, 12, 2492. [Google Scholar] [CrossRef]
- Kim, M.-K.; Wang, Q.; Yoon, S.; Sohn, H. A mirror-aided laser scanning system for geometric quality inspection of side surfaces of precast concrete elements. Measurement 2019, 141, 420–428. [Google Scholar] [CrossRef]
- Li, D.; Liu, J.; Feng, L.; Zhou, Y.; Qi, H.; Chen, Y.F. Automatic modeling of prefabricated components with laser-scanned data for virtual trial assembly. Comput. Aided Civ. Infrastruct. Eng. 2020, 36, 453–471. [Google Scholar] [CrossRef]
- Zhao, W.; Jiang, Y.; Liu, Y.; Shu, J. Automated recognition and measurement based on three-dimensional point clouds to connect precast concrete components. Autom. Constr. 2022, 133, 104000. [Google Scholar] [CrossRef]
- Tan, Y.; Chen, L.; Huang, M.; Li, J.; Zhang, G. Automated geometric quality inspection for modular boxes using BIM and LiDAR. Autom. Constr. 2024, 164, 105474. [Google Scholar] [CrossRef]
- Tang, D.; Li, S.; Wang, Q.; Li, S.; Cai, R.; Tan, Y. Automated Evaluation of Indoor Dimensional Tolerance Compliance Using the TLS Data and BIM. In Proceedings of the 25th International Symposium on Advancement of Construction Management and Real Estate; Springer: Singapore, 2021; pp. 625–641. [Google Scholar]
- Tan, Y.; Deng, T.; Zhou, J.; Zhou, Z. LiDAR-Based Automatic Pavement Distress Detection and Management Using Deep Learning and BIM. J. Constr. Eng. Manag. 2024, 150, 04024069. [Google Scholar] [CrossRef]
- Chen, L.; Li, S.; Tan, Y. Automated detection for the reserved rebars of bridge pile caps based on point cloud data and BIM. In International Symposium on Advancement of Construction Management and Real Estate; Springer: Singapore, 2022; pp. 1147–1162. [Google Scholar]
- Kim, M.-K.; Wang, Q.; Park, J.-W.; Cheng, J.C.P.; Sohn, H.; Chang, C.-C. Automated dimensional quality assurance of full-scale precast concrete elements using laser scanning and BIM. Autom. Constr. 2016, 72, 102–114. [Google Scholar] [CrossRef]
- Tan, Y.; Chen, L.; Wang, Q.; Li, S.; Deng, T.; Tang, D. Geometric Quality Assessment of Prefabricated Steel Box Girder Components Using 3D Laser Scanning and Building Information Model. Remote Sens. 2023, 15, 556. [Google Scholar] [CrossRef]
- Bahreini, F.; Hammad, A. Dynamic graph CNN based semantic segmentation of concrete defects and as-inspected modeling. Autom. Constr. 2024, 159, 105282. [Google Scholar] [CrossRef]
- Truong-Hong, L.; Lindenbergh, R. Extracting structural components of concrete buildings from laser scanning point clouds from construction sites. Adv. Eng. Inform. 2022, 51, 101490. [Google Scholar] [CrossRef]
- Shu, J.; Li, W.; Zhang, C.; Gao, Y.; Xiang, Y.; Ma, L. Point cloud-based dimensional quality assessment of precast concrete components using deep learning. J. Build. Eng. 2023, 70, 106391. [Google Scholar] [CrossRef]
- Selvaraj, S.; Madhavan, M. Geometric Imperfection Measurements and Validations on Cold-Formed Steel Channels Using 3D Noncontact Laser Scanner. J. Struct. Eng. 2018, 144, 04018010. [Google Scholar] [CrossRef]
- Xia, Y.; Blum, H.B. Geometric imperfection measurements of cold-formed steel members using a portable non-contact 3D laser scanner. In Proceedings of the Annual Stability Conference Structural Stability Research Council, Atlanta, GA, USA, 21–24 April 2020. [Google Scholar]
- Cha, G.; Park, S.; Oh, T. A terrestrial LiDAR-based detection of shape deformation for maintenance of bridge structures. J. Constr. Eng. Manag. 2019, 145, 04019075. [Google Scholar] [CrossRef]
- Xu, D.; Wang, Y.; Liu, X.; Chen, B.; Bu, Y. A novel method and modelling technique for determining the initial geometric imperfection of steel members using 3D scanning. Structures 2023, 49, 855–874. [Google Scholar] [CrossRef]
- Guangdong Provincial Department of Housing and Urban-Rural Development. Standard for Construction and Acceptance of Assembled Utility Tunnel; China City Press: Beijing, China, 2023; pp. 18–19.
- Soudarissanane, S.; Lindenbergh, R.; Menenti, M.; Teunissen, P. Scanning geometry: Influencing factor on the quality of terrestrial laser scanning points. ISPRS J. Photogramm. Remote Sens. 2011, 66, 389–399. [Google Scholar] [CrossRef]
- Wang, Q.; Tan, Y.; Mei, Z. Computational methods of acquisition and processing of 3D point cloud data for construction applications. Arch. Comput. Methods Eng. 2020, 27, 479–499. [Google Scholar] [CrossRef]
- Han, L.; Bancroft, J.C. Nearest approaches to multiple lines in n-dimensional space. Crewes Res. Rep. 2010, 22, 1–17. [Google Scholar]
- Tan, Y.; Liu, X.; Jin, S.; Wang, Q.; Wang, D.; Xie, X. A Terrestrial Laser Scanning-Based Method for Indoor Geometric Quality Measurement. Remote Sens. 2023, 16, 59. [Google Scholar] [CrossRef]


Disclaimer/Publisher’s Note: The statements, opinions and data contained in all publications are solely those of the individual author(s) and contributor(s) and not of MDPI and/or the editor(s). MDPI and/or the editor(s) disclaim responsibility for any injury to people or property resulting from any ideas, methods, instructions or products referred to in the content. |
© 2024 by the authors. Licensee MDPI, Basel, Switzerland. This article is an open access article distributed under the terms and conditions of the Creative Commons Attribution (CC BY) license (https://creativecommons.org/licenses/by/4.0/).