
The Influence of Fly Ash and Slag on the Mechanical Properties of Geopolymer Concrete


 ,
,  and
and 
Abstract
:1. Introduction
2. Materials and Methods
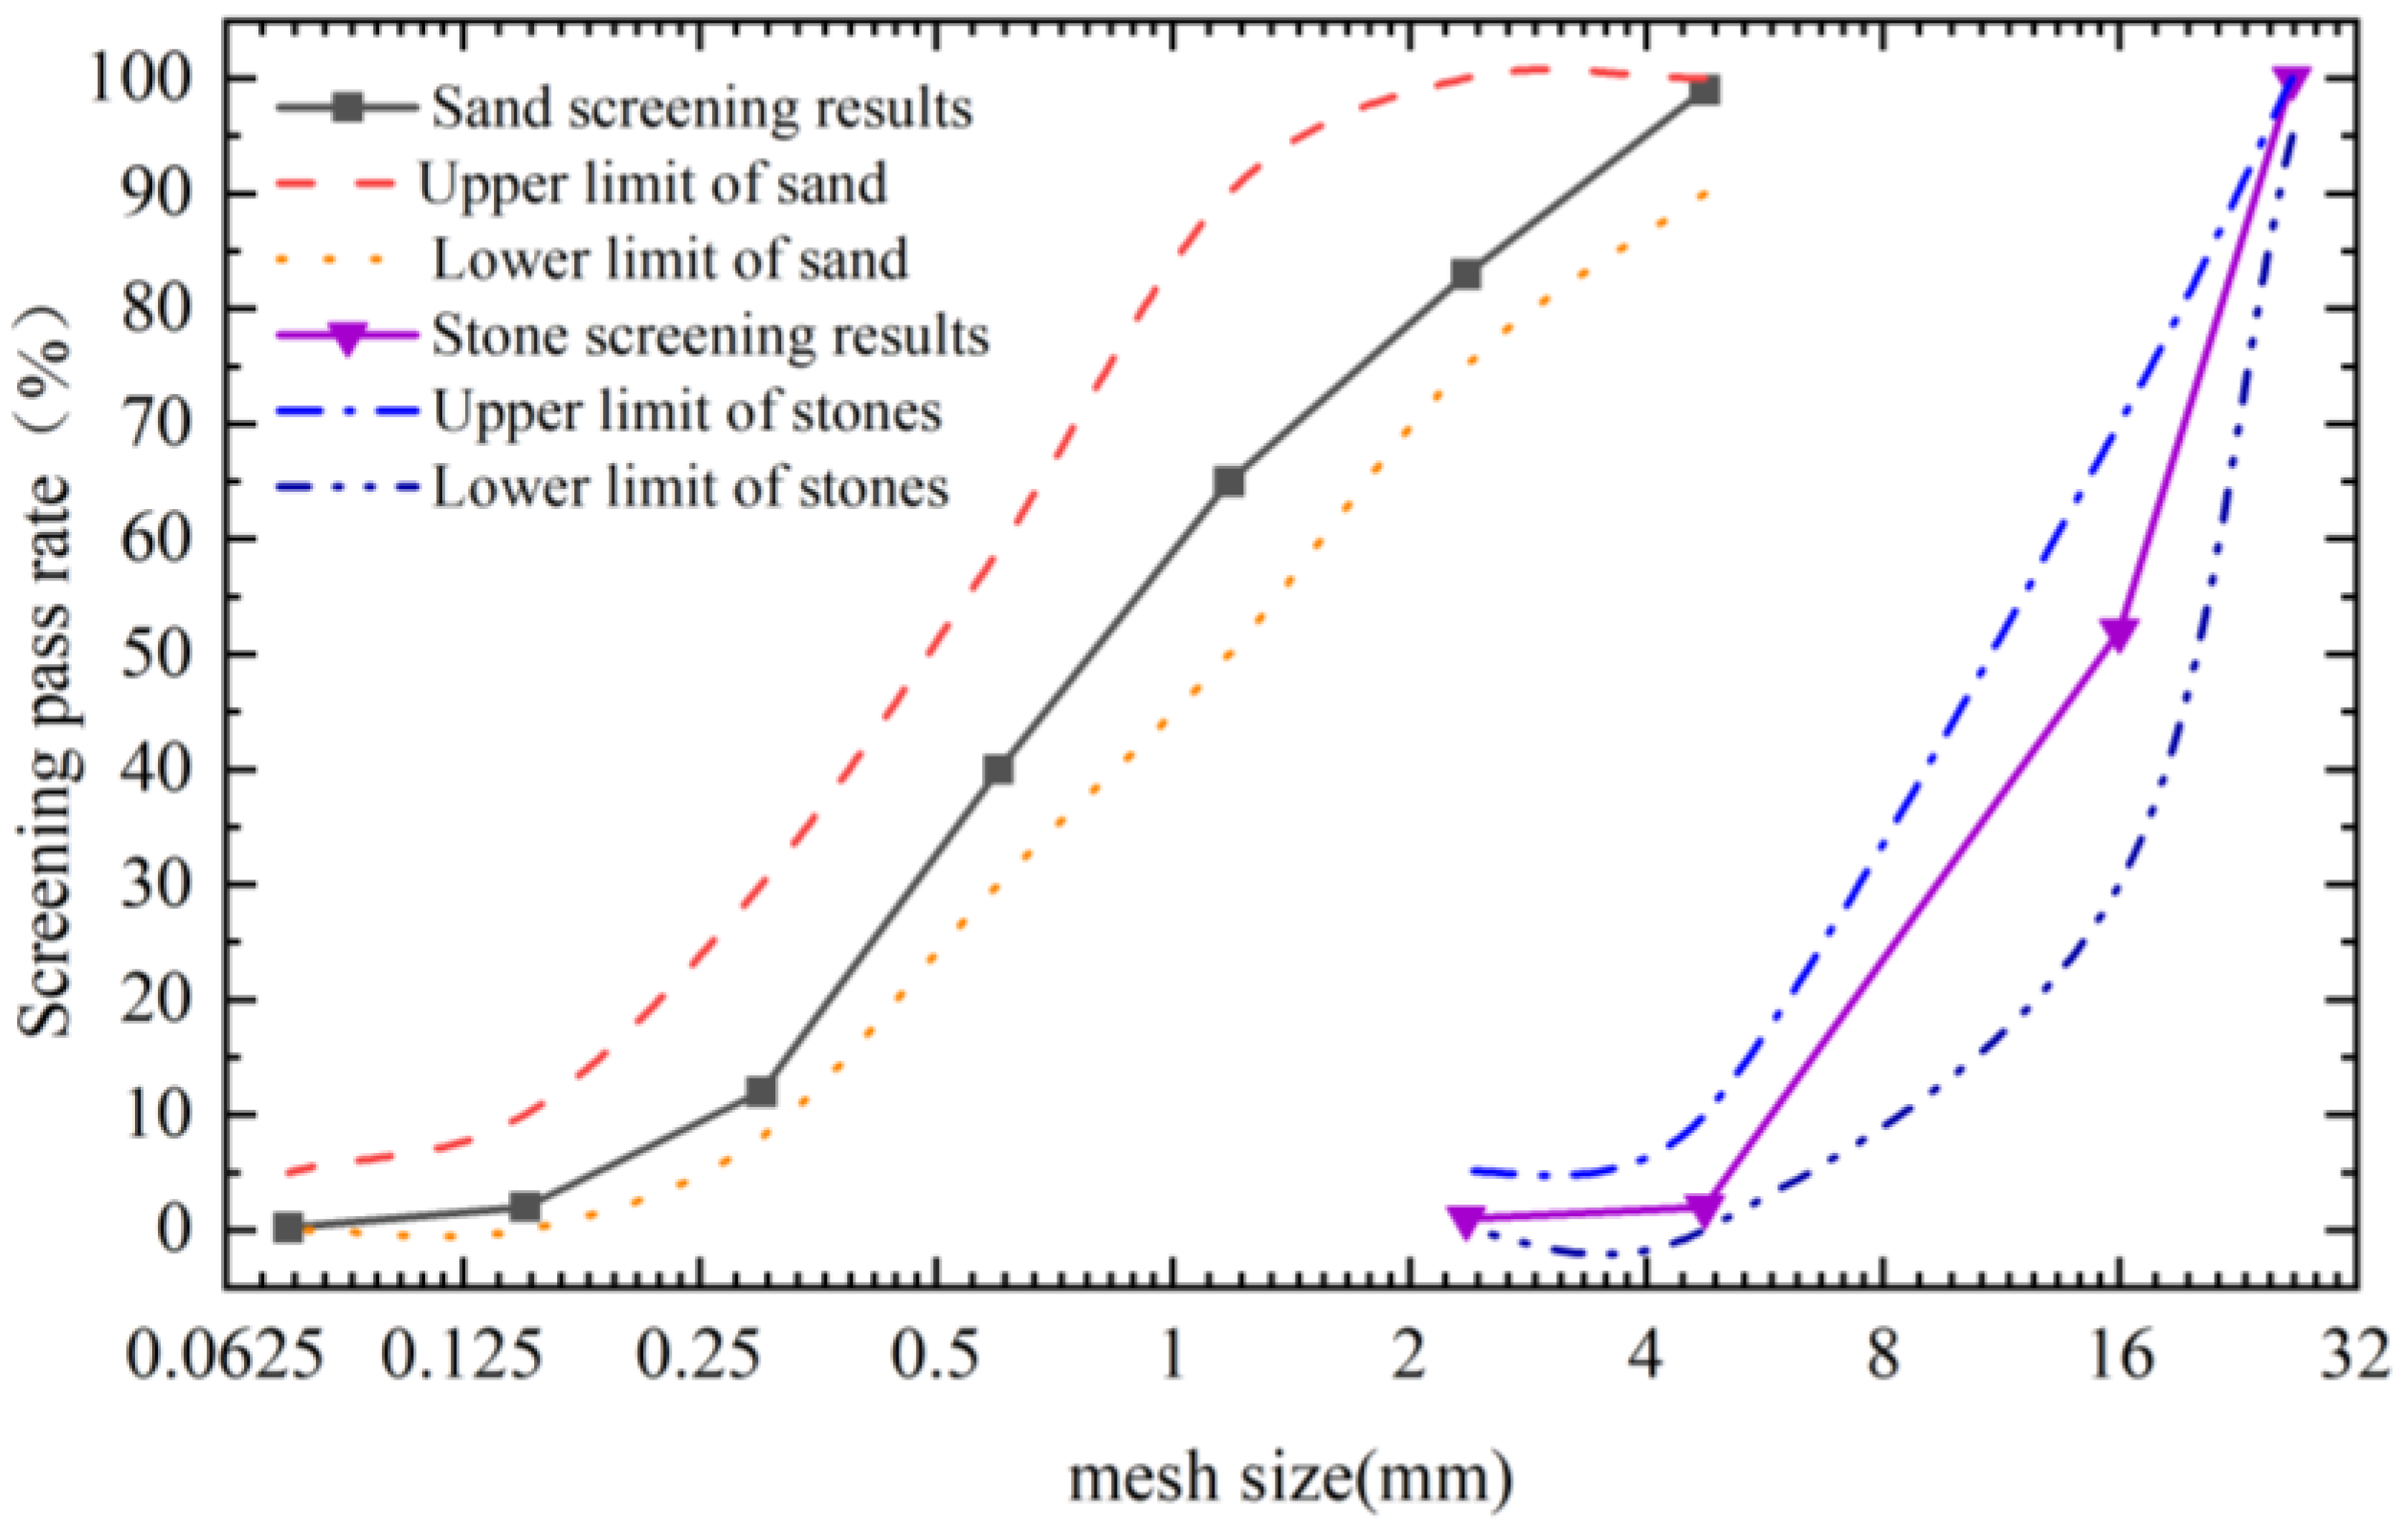
2.1. Raw Materials
2.2. Response Surface Method
2.3. Mixing Ratio Design and Preparation
- Fly ash and slag were mixed for 120 s;
- Aggregates were added and mixed for a further 120 s;
- Alkali stimulant solution was added and mixed for a further 180 s to obtain a homogeneous GPC mix;
- GPC mix was poured into the mould and placed on the vibrating table for 60 s to remove air bubbles and improve the compactness;
- The mould was covered with a film to prevent water evaporation and the specimens were demoulded after 24 h at room temperature;
- Specimens were subjected to a curing process at a temperature of 20 ± 2 °C and a humidity of ≥95% for a period of 28 days, after which they were tested for mechanical properties.
2.4. Test Methods
2.4.1. Mechanical Properties Test Methods
2.4.2. Microscopic Test Methods
- Clean the sample table with an alcohol cotton ball and blow dry;
- Fix the specimen pieces to the sample stage using conductive adhesive;
- Carry out the vacuuming and gold-spraying step;
- Perform the test using SEM and pick up the images at the desired magnification.
3. Results and Discussion
3.1. Experimental Results
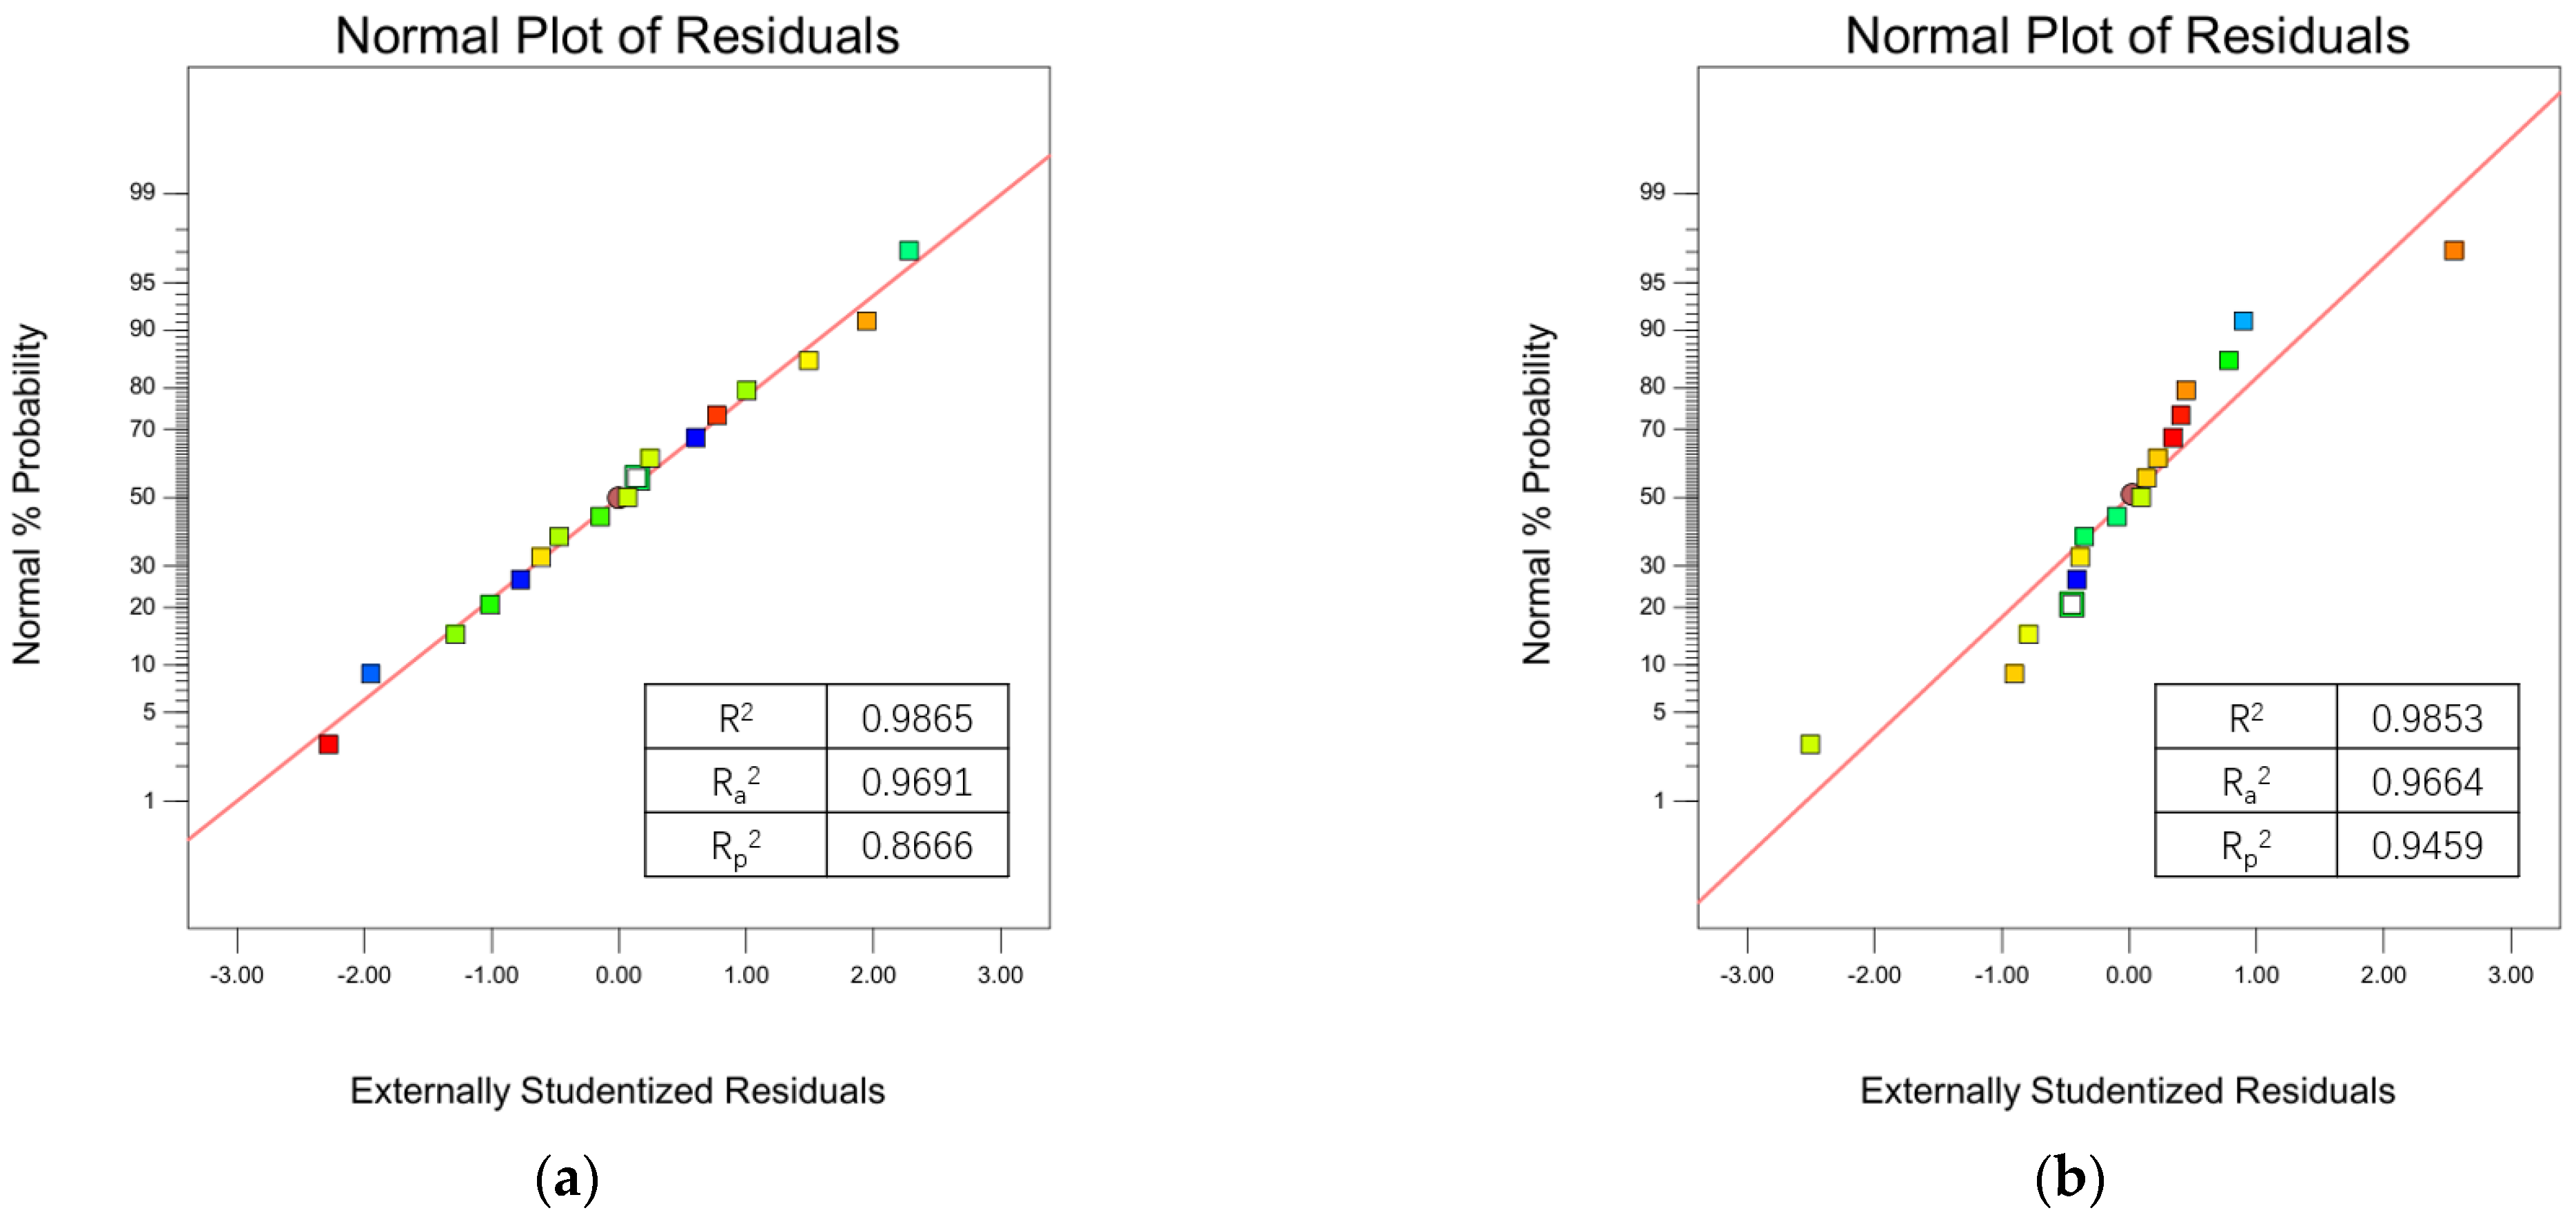
3.2. Response Surface Fitting and Validation
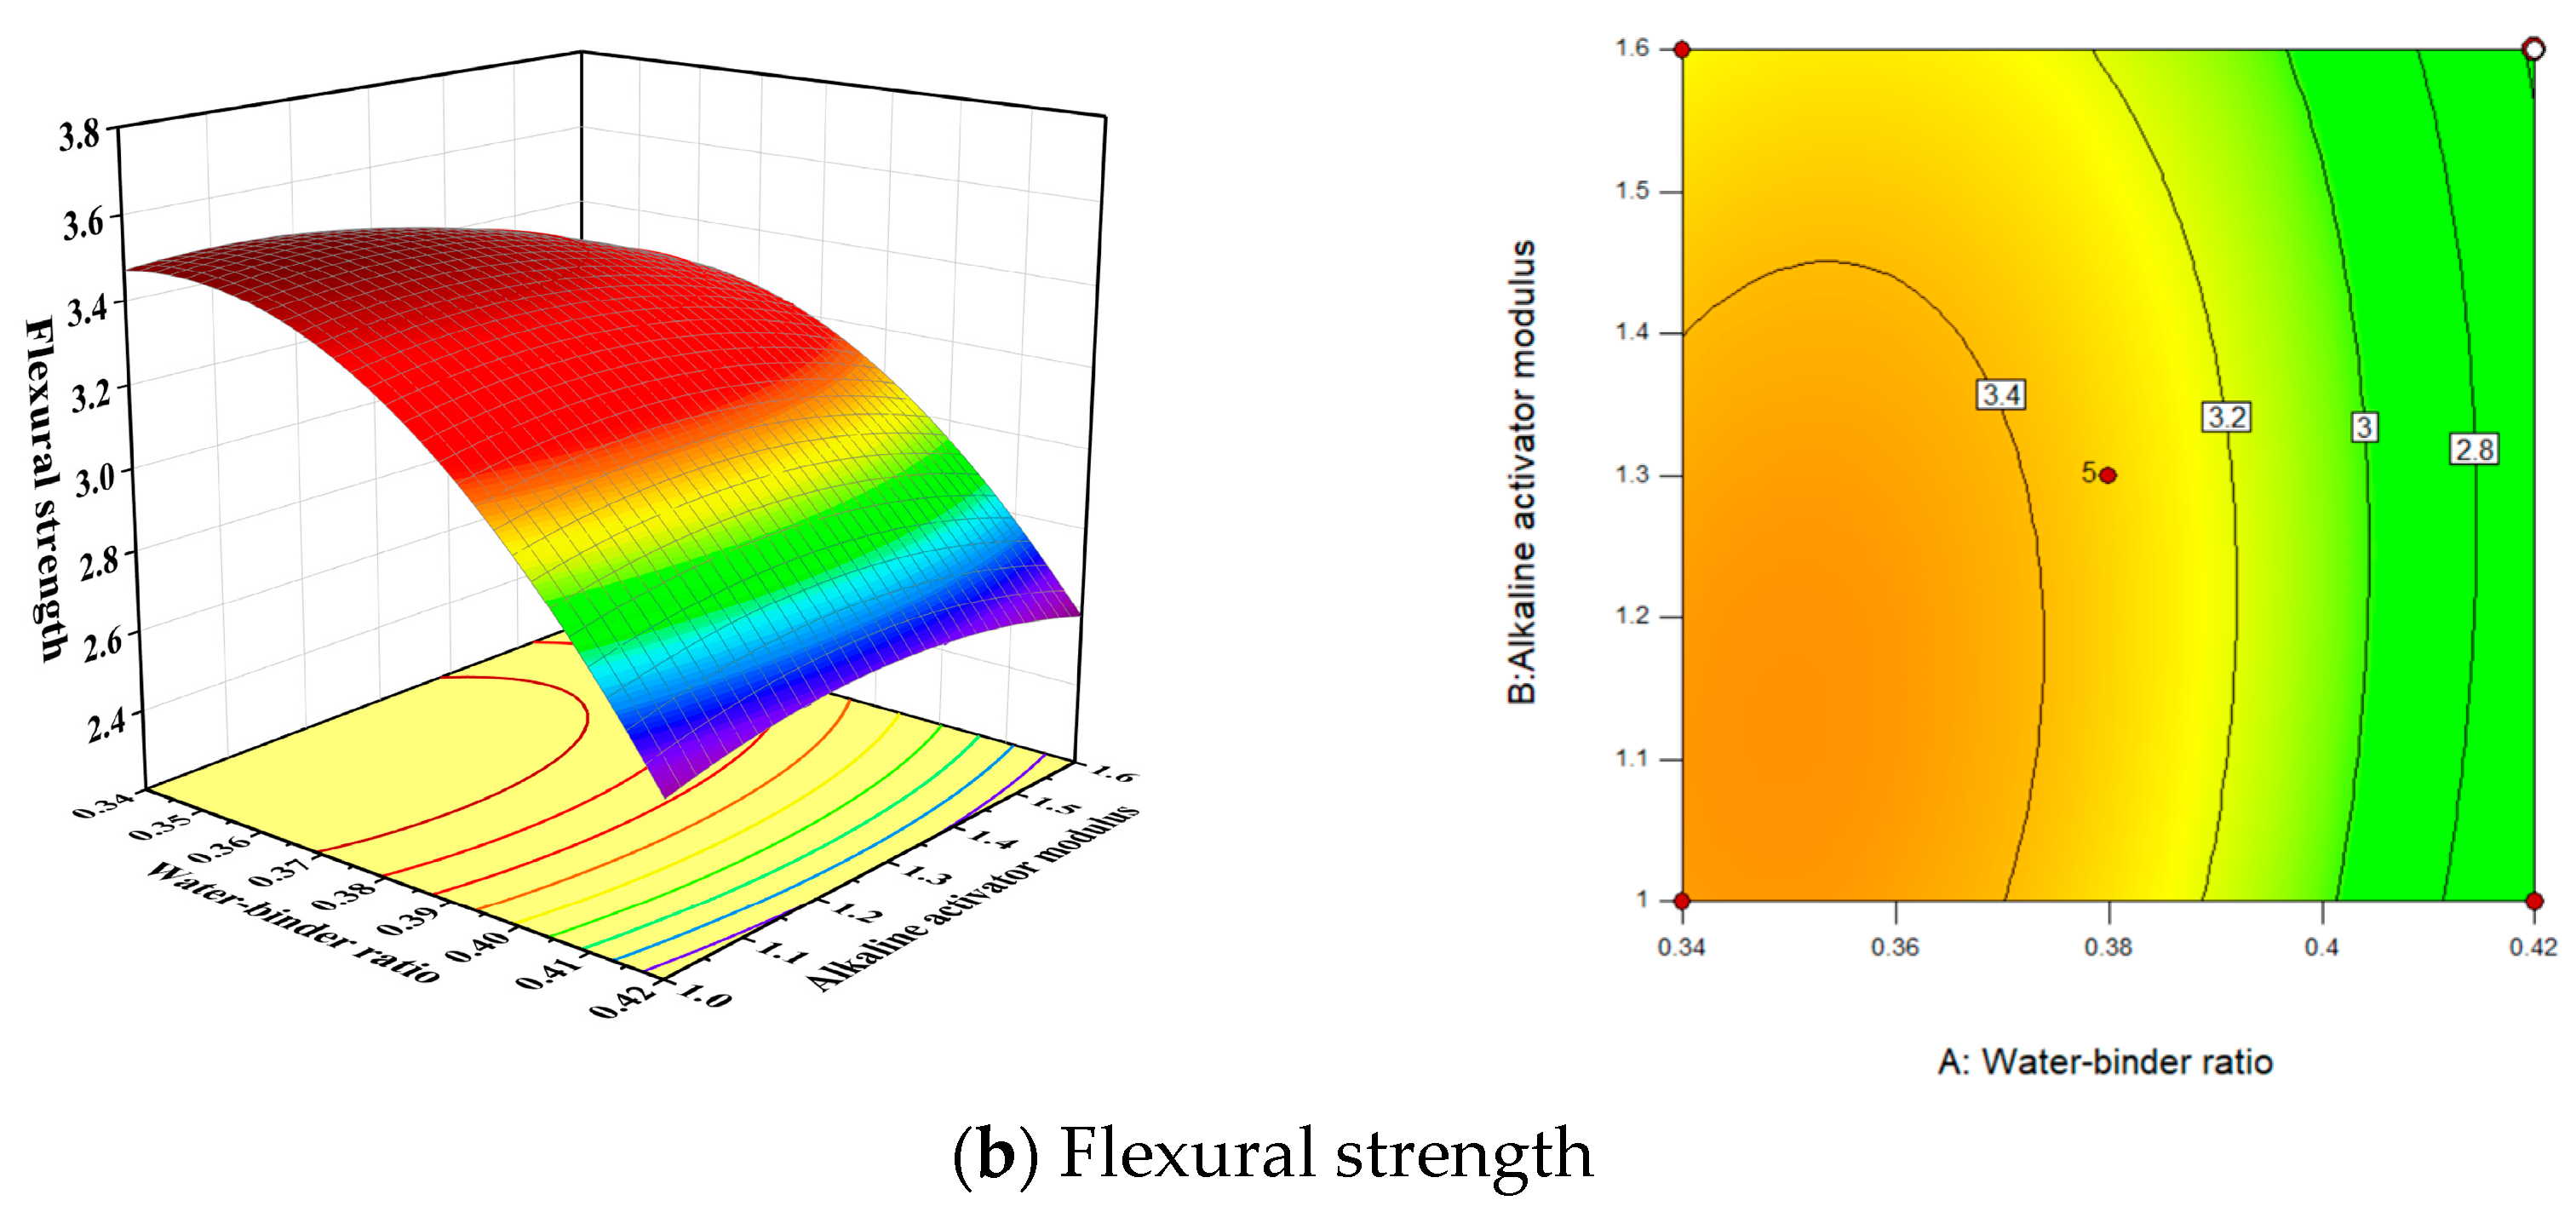
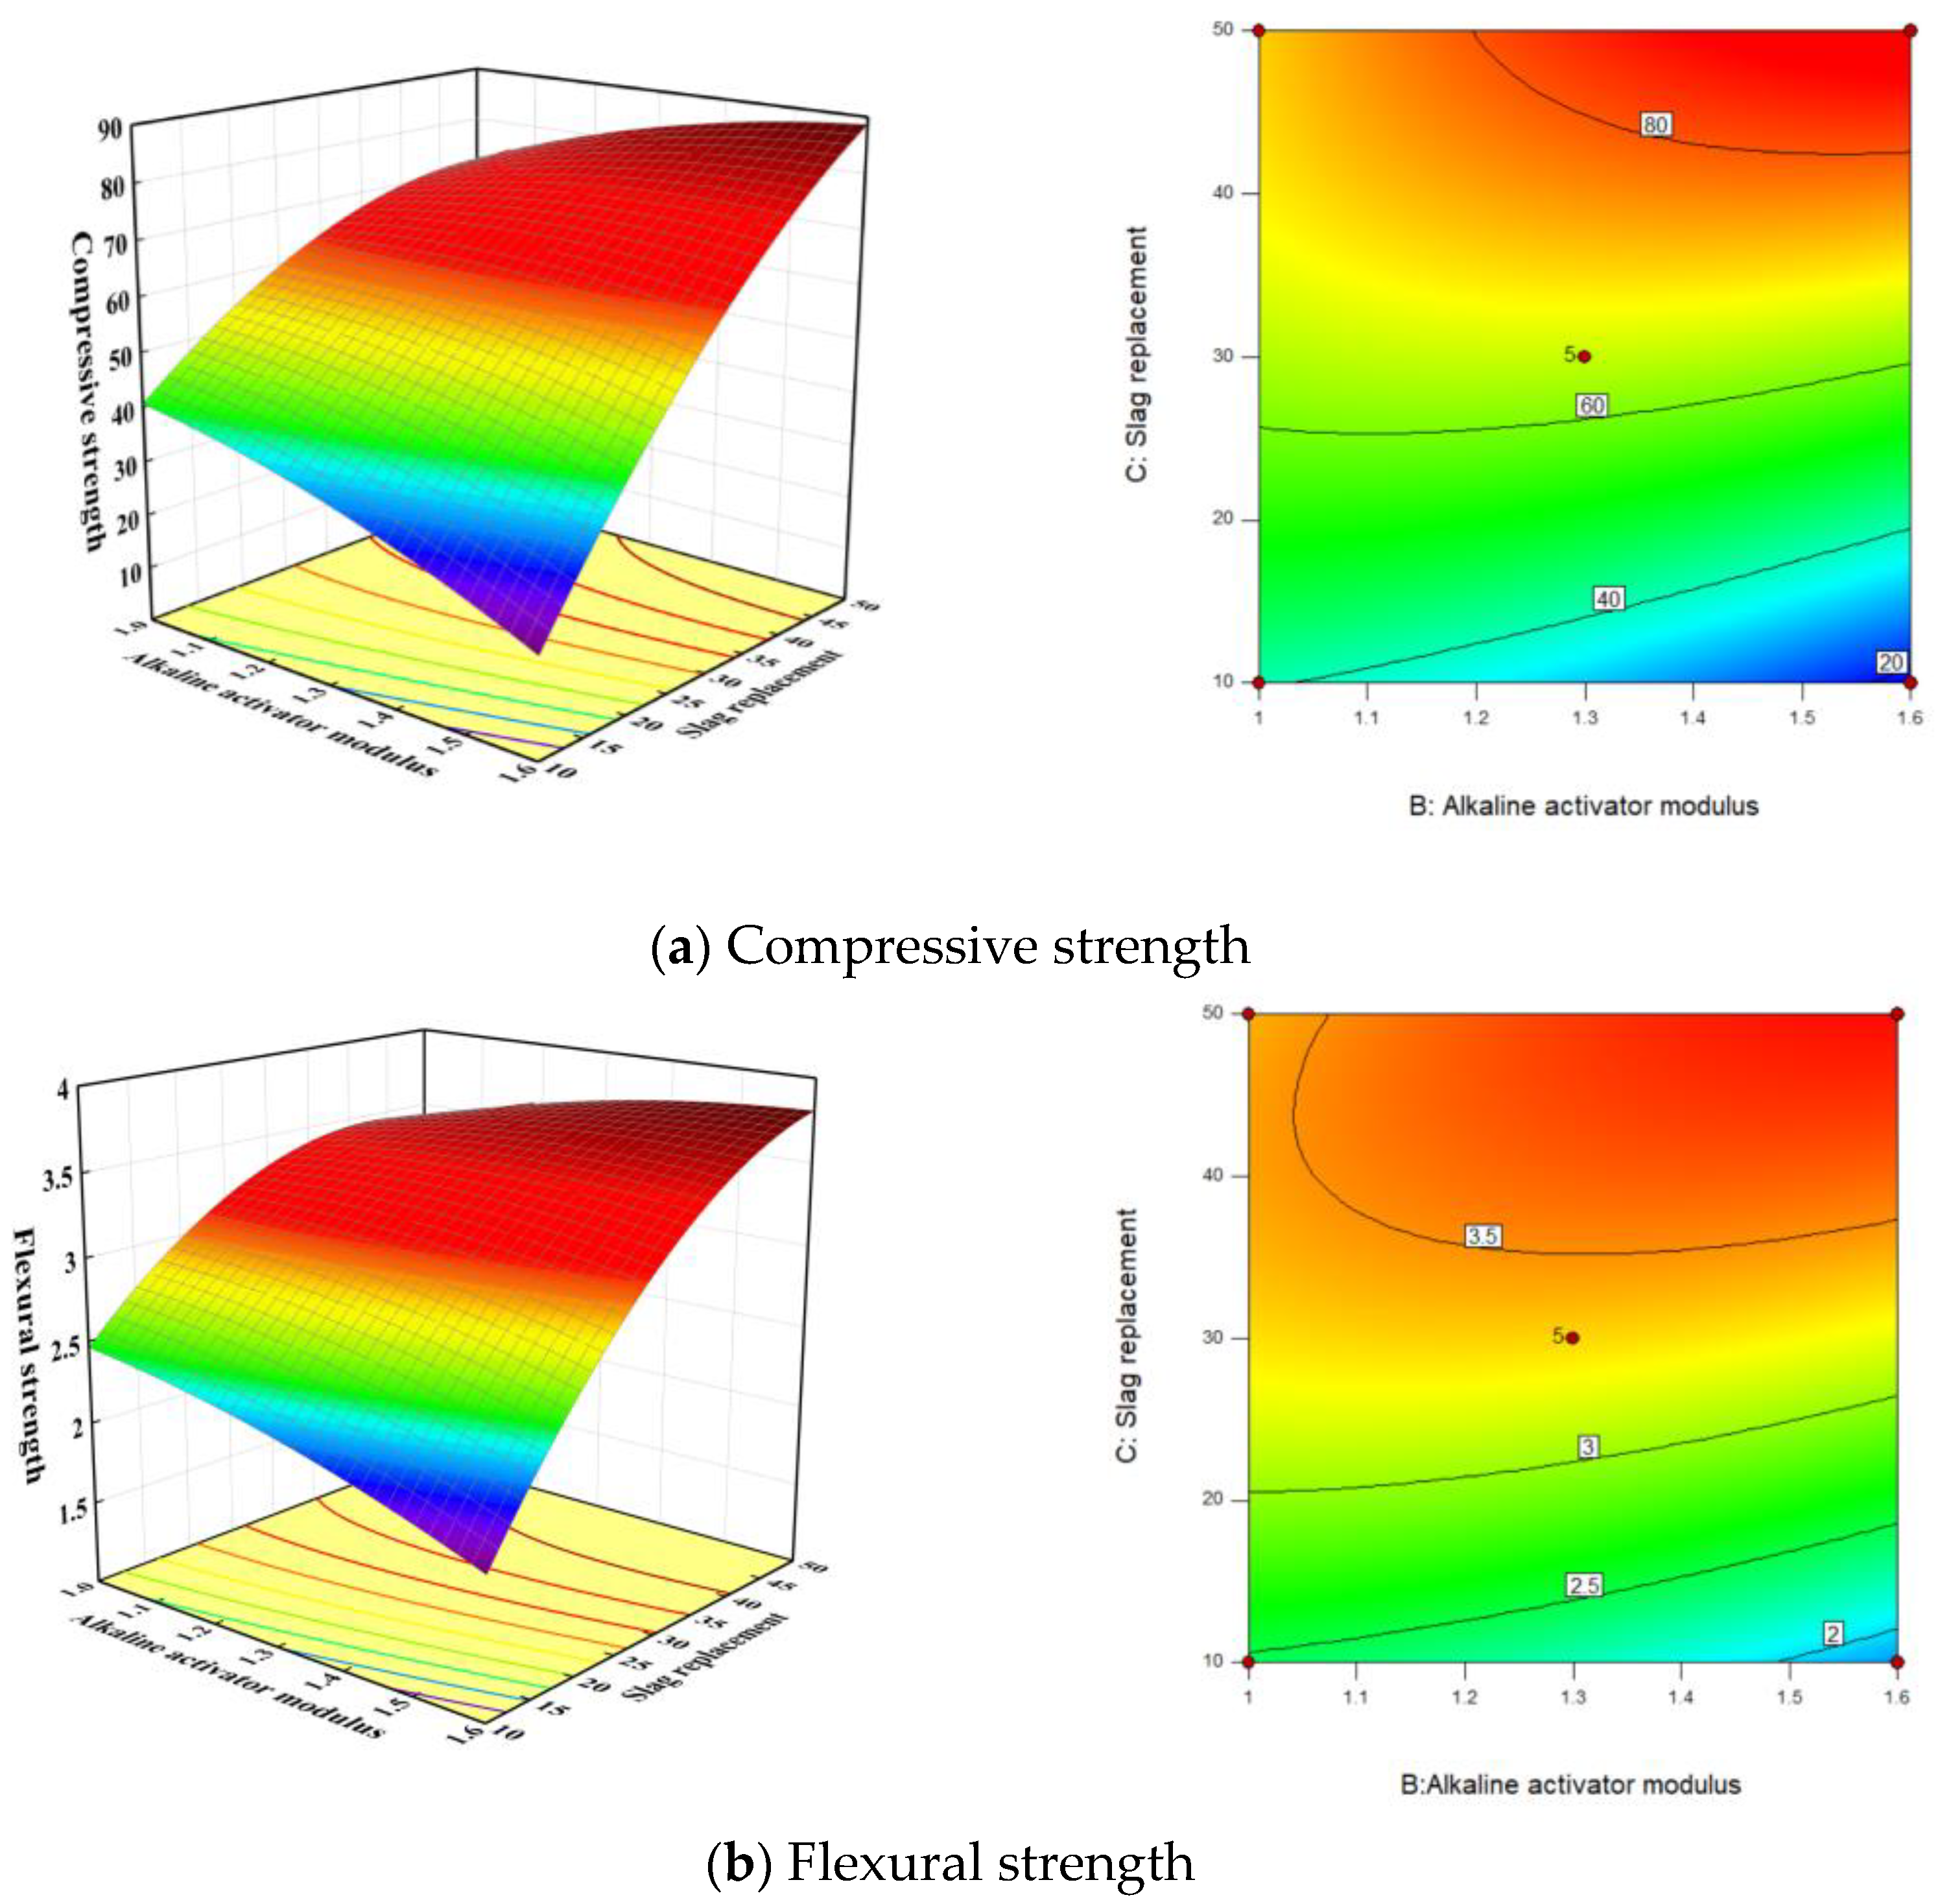
3.3. Response Surface Analysis
3.4. Multi-Objective Optimisation
3.5. Microstructure
4. Conclusions and Recommendations
- (1)
- Within the scope of the experimental design, the compressive strength would first increase and then decrease with the increase in the water–binder ratio, and would increase with the growth of slag replacement, while the flexural strength would increase with the decrease in the water–binder ratio and the increase in slag replacement. The impact of the alkaline activator solution modulus was not as significant as the other two influencing factors.
- (2)
- The strength of GPC would be influenced by the interaction among factors. When the slag replacement was high, the strength raised with the increase in the modulus of the alkaline exciter solution; conversely, when the slag replacement was low, the strength declined with the increase in the modulus of the alkaline exciter solution.
- (3)
- The water–binder ratio of 3.50, the modulus of alkaline exciter solution of 1.54, and the slag replacement of 47% were the optimal design of the proposed GPC.
- (4)
- Too high or too low water–binder ratio led to the appearance of pores and voids in the structure, which was detrimental to the formation of the gel network. The crumbly structure of GPC would be formatted when the slag replacement was too low, while cracks could occur in the structure when the slag replacement was too high.
- (1)
- An appropriate design method should be selected according to actual demand when optimizing the mix proportion of GPC.
- (2)
- The interaction between multiple influencing factors should be considered for the study of the performance of GPC.
- (3)
- In the future, nanotechnology might be used to improve the dispersibility and activity of fly ash and slag, thereby improving the microstructure, strength, and durability of geopolymer materials.
Author Contributions
Funding
Data Availability Statement
Conflicts of Interest
References
- Rambabu, D.; Sharma, S.K.; Akbar, M.A. Evaluation of roller compacted concrete for its application as high traffic resisting pavements with fatigue analysis. Constr. Build. Mater. 2023, 401, 132977. [Google Scholar] [CrossRef]
- Makoond, N.; Setiawan, A.; Orton, S.L.; Adam, J.M. The effect of continuity reinforcement on the progression of collapse in reinforced concrete buildings. Structures 2024, 61, 105981. [Google Scholar] [CrossRef]
- Filizadeh, R.; Hernandez, E.M.; Rosowsky, D.V. Risk-based framework for post-earthquake monitoring and evaluation of reinforced concrete bridges subject to multiple hazards. Reliab. Eng. Syst. Saf. 2024, 245, 109992. [Google Scholar] [CrossRef]
- Almutairi, A.L.; Tayeh, B.A.; Adesina, A.; Isleem, H.F.; Zeyad, A.M. Potential applications of geopolymer concrete in construction: A review. Case Stud. Constr. Mater. 2021, 15, e00733. [Google Scholar] [CrossRef]
- Ni, S.; Liu, H.; Li, Q.; Quan, H.Z.; Gheibi, M.; Fathollahi-Fard, A.M.; Tian, G. Assessment of the engineering properties, carbon dioxide emission and economic of biomass recycled aggregate concrete: A novel approach for building green concretes. J. Clean. Prod. 2022, 365, 132780. [Google Scholar] [CrossRef]
- Biernacki, J.J.; Bullard, J.W.; Sant, G.; Banthia, N.; Brown, K.; Glasser, F.P.; Jones, S.; Ley, T.; Livingston, R.; Nicoleau, L.; et al. Cements in the 21st century: Challenges, perspectives, and opportunities. J. Am. Ceram. Soc. 2017, 100, 2746–2773. [Google Scholar] [CrossRef]
- Yankelevsky, D.Z.; Karinski, Y.S.; Zhutovsky, S.; Feldgun, V.R. Isotropic triaxial tests of equal strength concrete with different mix compositions. Constr. Build. Mater. 2023, 408, 133717. [Google Scholar] [CrossRef]
- Jin, H.; Cheng, L.; Liu, J.; Zhong, S. Investigation of natural diffusion behavior in concrete using iodide replacing chloride ions: The impact of mineral admixtures types and dosages. J. Mater. Res. Technol. 2024, 29, 1834–1861. [Google Scholar] [CrossRef]
- Marey, H.; Kozma, G.; Szabó, G. Green concrete materials selection for achieving circular economy in residential buildings using system dynamics. Clean. Mater. 2024, 11, 100221. [Google Scholar] [CrossRef]
- Khan, M.; Javed, M.F. Towards sustainable construction: Machine learning based predictive models for strength and durability characteristics of blended cement concrete. Mater. Today Commun. 2023, 37, 107428. [Google Scholar] [CrossRef]
- Khankhaje, E.; Kim, T.; Jang, H.; Kim, C.S.; Kim, J.; Rafieizonooz, M. A review of utilization of industrial waste materials as cement replacement in pervious concrete: An alternative approach to sustainable pervious concrete production. Heliyon 2024, 10, e26188. [Google Scholar] [CrossRef] [PubMed]
- Akbar, A.; Liew, K.M. Assessing recycling potential of carbon fiber reinforced plastic waste in production of eco-efficient cement-based materials. J. Clean. Prod. 2020, 274, 123001. [Google Scholar] [CrossRef]
- Danish, A.; Torres, A.S.; Moro, C.; Salim, M.U. Hope or hype? Evaluating the environmental footprint of reclaimed fly ash in geopolymer production. Resour. Conserv. Recycl. 2024, 205, 107564. [Google Scholar] [CrossRef]
- Li, C.; Cui, S.; Nie, Z.; Gong, X.; Wang, Z.; Itsubo, N. The LCA of portland cement production in China. Int. J. Life Cycle Assess. 2015, 20, 117–127. [Google Scholar] [CrossRef]
- Azunna, S.U.; Aziz, F.N.; Al-Ghazali, N.A.; Rashid, R.S.M.; Bakar, N.A. Review on the mechanical properties of rubberized geopolymer concrete. Clean. Mater. 2024, 11, 100225. [Google Scholar] [CrossRef]
- He, Z.; Shen, A.; Lyu, Z.; Li, Y.; Wu, H.; Wang, W. Effect of wollastonite microfibers as cement replacement on the properties of cementitious composites: A review. Constr. Build. Mater. 2020, 261, 119920. [Google Scholar] [CrossRef]
- Jamora, J.B.; Go, A.W.; Gudia, S.E.L.; Giduquio, M.B.; Loretero, M.E. Evaluating the use of rice residue ash in cement-based industries in the Philippines—Greenhouse gas reduction, transportation, and cost assessment. J. Clean. Prod. 2023, 398, 136623. [Google Scholar] [CrossRef]
- Olsson, J.A.; Miller, S.A.; Kneifel, J.D. A review of current practice for life cycle assessment of cement and concrete. Resour. Conserv. Recycl. 2024, 206, 107619. [Google Scholar] [CrossRef]
- Sahoo, N.; Kumar, A. Design of solar cement plant for supplying thermal energy in cement production. J. Clean. Prod. 2023, 426, 139151. [Google Scholar] [CrossRef]
- Andrew, R.M. Global CO2 emissions from cement production, 1928–2018. Earth Syst. Sci. Data 2019, 11, 1675–1710. [Google Scholar] [CrossRef]
- Zeyad, A.M. Sustainable concrete Production: Incorporating recycled wastewater as a green building material. Constr. Build. Mater. 2023, 407, 133522. [Google Scholar] [CrossRef]
- Eti, S.; Dinçer, H.; Yüksel, S.; Uslu, Y.D.; Gökalp, Y.; Kalkavan, H.; Mikhaylov, A.; Pinter, G. Determination of priority criteria in green building transformation: An analysis on the service industry. Res. Glob. 2023, 7, 100164. [Google Scholar] [CrossRef]
- Hamada, H.M.; Al-Attar, A.A.A.; Yahaya, F.M.; Muthusamy, K.; Tayeh, B.A.; Humada, A.M. Effect of high-volume ultrafine palm oil fuel ash on the engineering and transport properties of concrete. Case Stud. Constr. Mater. 2020, 12, e00318. [Google Scholar] [CrossRef]
- Davidovits, J. Properties of geopolymer cements. In Proceedings of the First International Conference on Alkaline Cements and Concretes, Scientific Research Institute on Binders and Materials, Kiev State Technical University, Kiev, Ukraine, 11–14 October 1994; pp. 131–149. [Google Scholar]
- Alouani, M.E.L.; Saufi, H.; Aouan, B.; Bassam, R.; Alehyen, S.; Rachdi, Y.; Hadki, H.E.L.; Mabrouki, J.; Belaaouad, S.; Ez-Zaki, H.; et al. A comprehensive review of synthesis, characterization, and applications of aluminosilicate materials-based geopolymers. Environ. Adv. 2024, 16, 100524. [Google Scholar] [CrossRef]
- Kaze, R.C.; Naghizadeh, A.; Tchadjie, L.; Adesina, A.; Djobo, J.N.Y.; Nemaleu, J.G.D.; Kamseu, E.; Melo, U.C.; Tayeh, B.A. Lateritic soils based geopolymer materials: A review. Constr. Build. Mater. 2022, 344, 128157. [Google Scholar] [CrossRef]
- Li, J.-S.; Zhang, W.; Lang, L.; Dong, C.-X.; Huang, K. Preparation and properties of geopolymer containing phosphoric acid-activated fly ash and mechanically-milled kaolinite: Experiments and density function theory. J. Clean. Prod. 2024, 441, 140992. [Google Scholar] [CrossRef]
- Huang, D.; Liu, Z.; Lin, C.; Lu, Y.; Li, S. Effects and mechanisms of component ratio and cross-scale fibers on drying shrinkage of geopolymer mortar. Constr. Build. Mater. 2024, 411, 134299. [Google Scholar] [CrossRef]
- Shamsol, A.L.S.; Apandi, N.M.; Zailani, W.W.A.; Izwan, K.N.K.; Zakaria, M.; Zulkarnain, N.N. Graphene oxide as carbon-based materials: A review of geopolymer with addition of graphene oxide towards sustainable construction materials. Constr. Build. Mater. 2024, 411, 134410. [Google Scholar] [CrossRef]
- Izadifar, M.; Valencia, N.C.; Xiao, P.; Ukrainczyk, N.; Koenders, E. 3D Off-Lattice Coarse-Grained Monte Carlo Simulations for Nucleation of Alkaline Aluminosilicate Gels. Materials 2023, 16, 1863. [Google Scholar] [CrossRef]
- Izadifar, M.; Ukrainczyk, N.; Koenders, E. Silicate Dissolution Mechanism from Metakaolinite Using Density Functional Theory. Nanomaterials 2023, 13, 1196. [Google Scholar] [CrossRef]
- Afzali, S.A.E.; Shayanfar, M.A.; Ghanooni-Bagha, M.; Golafshani, E.; Ngo, T. The use of machine learning techniques to investigate the properties of metakaolin-based geopolymer concrete. J. Clean. Prod. 2024, 446, 141305. [Google Scholar] [CrossRef]
- Hamed, Y.R.; Elshikh, M.M.Y.; Elshami, A.A.; Matthana, M.H.S.; Youssf, O. Mechanical properties of fly ash and silica fume based geopolymer concrete made with magnetized water activator. Constr. Build. Mater. 2024, 411, 134376. [Google Scholar] [CrossRef]
- Anggraini, V.; Asadi, A.; Syamsir, A.; Huat, B.B.K. Three point bending flexural strength of cement treated tropical marine soil reinforced by lime treated natural fiber. Measurement 2017, 111, 158–166. [Google Scholar] [CrossRef]
- Khair, S.; Rahman, S.M.A.; Shaikh, F.U.A.; Sarker, P.K. Evaluating lithium slag for geopolymer concrete: A review of its properties and sustainable construction applications. Case Stud. Constr. Mater. 2024, 20, e02822. [Google Scholar] [CrossRef]
- Kumar, A.; Saravanan, T.J.; Bisht, K.; Kabeer, K.I.S.A. A review on the utilization of red mud for the production of geopolymer and alkali activated concrete. Constr. Build. Mater. 2021, 302, 124170. [Google Scholar] [CrossRef]
- Alrowaili, Z.A.; Alnairi, M.M.; Olarinoye, I.O.; Alhamazani, A.; Alshammari, G.S.; Al-Buriahi, M.S. Radiation attenuation of fly ash and rice husk ash-based geopolymers as cement replacement in concrete for shielding applications. Radiat. Phys. Chem. 2024, 217, 111489. [Google Scholar] [CrossRef]
- Feng, X.; Liu, N.; Lu, X. Investigation of un-calcined coal gangue together with ground granulated blast furnace slag and fly ash to ambient-curing production high-strength geopolymer. J. Mater. Res. Technol. 2023, 25, 3985–3997. [Google Scholar] [CrossRef]
- Xu, W.; Niu, X.; Zhu, Y. Deformation behavior and damage evaluation of fly ash-slag based geopolymer concrete under cyclic tension. J. Build. Eng. 2024, 86, 108664. [Google Scholar] [CrossRef]
- Deb, P.S.; Nath, P.; Sarker, P.K. Drying Shrinkage of Slag Blended Fly Ash Geopolymer Concrete Cured at Room Temperature. Procedia Eng. 2015, 125, 594–600. [Google Scholar] [CrossRef]
- Xing, Z.Q. Study on Mechanical Properties and Durability Offiber-Polymer Mortar and Concrete. Doctoral Dissertation, Northeast Forestry University, Harbin, China, 2021. [Google Scholar]
- Li, Z.; Zhang, Y. Development of Sustainable Cementitious Materials. In Proceedings of the International Workshop on Sustainable Development and Concrete Technology American Concrete Institute International, Northwestern University, Iowa State University, Changjiang Water Resources Commission, China Building Material Academy, Beijing, China, 20–21 May 2004. [Google Scholar]
- Duxson, P.; Provis, J.L.; Lukey, G.C.; Deventer, J.S.J. The role of inorganic polymer technology in the development of ‘green concrete’. Cem. Concr. Res. 2007, 37, 1590–1597. [Google Scholar] [CrossRef]
- Gopalakrishna, B.; Pasla, D. Development of metakaolin based high strength recycled aggregate geopolymer concrete. Constr. Build. Mater. 2023, 391, 131810. [Google Scholar] [CrossRef]
- Niyazuddin, B.U. Mechanical and durability properties of standard and high strength geopolymer concrete using particle packing theory. Constr. Build. Mater. 2023, 400, 132722. [Google Scholar] [CrossRef]
- Pratap, B.; Mondal, S.; Rao, B.H. NaOH molarity influence on mechanical and durability properties of geopolymer concrete made with fly ash and phosphogypsum. Structures 2023, 56, 105035. [Google Scholar] [CrossRef]
- Upadhyay, D.; Chanda, A.; Thakkar, S. Mixture Design of High-Strength Geopolymer Concrete. Mater. Today Proc. 2023, 93, 335–339. [Google Scholar] [CrossRef]
- Kanagaraj, B.; Anand, N.; Jerry, R.; Raj, R.S.; Andrushia, D.; Lubloy, E. Influence of protective coating on flexural behaviour of high strength self-compacting geopolymer concrete beams exposed to standard fire temperature. Case Stud. Constr. Mater. 2023, 19, e02468. [Google Scholar] [CrossRef]
- Kanagaraj, B.; Anand, N.; Jerry, R.; Raj, R.S.; Lubloy, E. Axial compressive behaviour and physical characteristics of high strength self-compacting geopolymer concrete (HSGC) columns exposed to elevated temperature. Constr. Build. Mater. 2023, 401, 132866. [Google Scholar] [CrossRef]
- Turkey, F.A.; Beddu, S.B.; Ahmed, A.N.; Al-Hubboubi, S.K. Effect of high temperatures on the properties of lightweight geopolymer concrete based fly ash and glass powder mixtures. Case Stud. Constr. Mater. 2022, 17, e01489. [Google Scholar] [CrossRef]
- Javed, U.; Shaikh, F.U.A.; Sarker, P.K. Corrosive effect of HCl and H2SO4 exposure on the strength and microstructure of lithium slag geopolymer mortars. Constr. Build. Mater. 2024, 411, 134588. [Google Scholar] [CrossRef]
- Zhang, B. Durability of low-carbon geopolymer concrete: A critical review. Sustain. Mater. Technol. 2024, 40, e00882. [Google Scholar] [CrossRef]
- Wasim, M.; Ngo, T.D.; Law, D. Durability performance of reinforced waste-based geopolymer foam concrete under exposure to various corrosive environments. Case Stud. Constr. Mater. 2021, 15, e00703. [Google Scholar]
- Li, Q.; Wang, J.; Zhou, Z.; Du, P.; Zhang, X. Effect of BaCl2 on the hydration properties of ultrahigh performance geopolymer concrete. Constr. Build. Mater. 2023, 403, 133074. [Google Scholar] [CrossRef]
- Oyebisi, S.; Olutoge, F.; Kathirvel, P.; Oyaotuderekumor, I.; Lawanson, D.; Nwani, J.; Ede, A.; Kaze, R. Sustainability assessment of geopolymer concrete synthesized by slag and corncob ash. Case Stud. Constr. Mater. 2022, 17, e01665. [Google Scholar] [CrossRef]
- Chen, G.; Zheng, D.-P.; Chen, Y.-W.; Lin, J.-X.; Lao, W.-J.; Guo, Y.-C.; Chen, Z.-B.; Lan, X.-W. Development of high performance geopolymer concrete with waste rubber and recycle steel fiber: A study on compressive behavior, carbon emissions and economical performance. Constr. Build. Mater. 2023, 393, 131988. [Google Scholar] [CrossRef]
- Singh, S.; Sharma, S.K.; Akbar, M.A. Developing zero carbon emission pavements with geopolymer concrete: A comprehensive review. Transp. Res. Part D Transp. Environ. 2022, 110, 103436. [Google Scholar] [CrossRef]
- Kumar, M.; Kumar, A.; Solanki, D.; Mungule, M. Low molarity geopolymer concrete: Effects on compressive strength, elastic modulus, sorptivity and chloride migration. Constr. Build. Mater. 2023, 409, 134065. [Google Scholar] [CrossRef]
- Guo, T.; Zhang, G.; Ma, F.; Shen, P.; Wang, R.; Song, W.; Wang, L.; Han, P.; Bai, X. Mechanical properties and microstructure of red mud-coal metakaolin geopolymer concrete based on orthogonal tests. J. Build. Eng. 2023, 79, 107789. [Google Scholar] [CrossRef]
- Chokkalingam, P.; El-Hassan, H.; El-Dieb, A.; El-Mir, A. Development and characterization of ceramic waste powder-slag blended geopolymer concrete designed using Taguchi method. Constr. Build. Mater. 2022, 349, 128744. [Google Scholar] [CrossRef]
- Li, N.; Shi, C.; Zhang, Z.; Zhu, D.; Hwang, H.-J.; Zhu, Y.; Sun, T. A mixture proportioning method for the development of performance-based alkali-activated slag-based concrete. Cem. Concr. Compos. 2018, 93, 163–174. [Google Scholar] [CrossRef]
- Abdullah, N.; Chin, N.L. Simplex-centroid mixture formulation for optimised composting of kitchen waste. Bioresour. Technol. 2010, 101, 8205–8210. [Google Scholar] [CrossRef]
- GGencel, O.; del Coz Diaz, J.J.; Sutcu, M.; Koksal, F.; Rabanal, F.P.A.; Martinez-Barrera, G.; Brostow, W. Properties of gypsum composites containing vermiculite and polypropylene fibers: Numerical and experimental results. Energy Build. 2014, 70, 135–144. [Google Scholar] [CrossRef]
- Nemati, M.; Nematzadeh, M.; Rahimi, S. Effect of fresh concrete compression technique on pre- and post-heating compressive behavior of steel fiber-reinforced concrete: Experiments and RSM-based optimization. Constr. Build. Mater. 2023, 400, 132786. [Google Scholar] [CrossRef]
- Xie, L.; Zhou, Y.; Xiao, S.; Miao, X.; Murzataev, A.; Kong, D.; Wang, L. Research on basalt fiber reinforced phosphogypsum-based composites based on single factor test and RSM test. Constr. Build. Mater. 2022, 316, 126084. [Google Scholar] [CrossRef]
- Ali, M.; Kumar, A.; Yvaz, A.; Salah, B. Central composite design application in the optimization of the effect of pumice stone on lightweight concrete properties using RSM. Case Stud. Constr. Mater. 2023, 18, e01958. [Google Scholar] [CrossRef]
- Driouich, A.; Chajri, F.; Hassani, S.E.A.E.; Britel, O.; Belouafa, S.; Khabbazi, A.; Chaair, H. Optimization synthesis geopolymer based mixture metakaolin and fly ash activated by alkaline solution. J. Non-Cryst. Solids 2020, 544, 120197. [Google Scholar] [CrossRef]
- Santana, H.A.; Neto, J.S.A.; Júnior, N.S.A.; Ribeiro, D.V.; Cilla, M.S.; Dias, C.M. Self-compacting geopolymer mixture: Dosing based on statistical mixture design and simultaneous optimization. Constr. Build. Mater. 2020, 249, 118677. [Google Scholar] [CrossRef]
- Long, X.; Cai, L.; Li, W. RSM-based assessment of pavement concrete mechanical properties under joint action of corrosion, fatigue, and fiber content. Constr. Build. Mater. 2019, 197, 406–420. [Google Scholar] [CrossRef]
- Rathnayaka, M.; Karunasinghe, D.; Gunasekara, C.; Wijesundara, K.; Lokuge, W.; Law, D.W. Machine learning approaches to predict compressive strength of fly ash-based geopolymer concrete: A comprehensive review. Constr. Build. Mater. 2024, 419, 135519. [Google Scholar] [CrossRef]
- Ali, A.; Khan, Q.U.Z.; Mehboob, S.S.; Tayyab, A.; Hayyat, K.; Haq, I.U. Enhancing multi-objective mix design for GGBS-based geopolymer concrete with natural mineral blends under ambient curing: A Taguchi-Grey relational optimization. Ain Shams Eng. J. 2024, 15, 102708. [Google Scholar] [CrossRef]
- Win, T.T.; Wattanapornprom, R.; Prasittisopin, L.; Pansuk, W.; Pheinsusom, P. Investigation of Fineness and Calcium-Oxide Content in Fly Ash from ASEAN Region on Properties and Durability of Cement–Fly Ash System. Eng. J. 2022, 26, 77–90. [Google Scholar] [CrossRef]
- Gai, W.; Dai, F.; He, B.; Zhou, C.; Wei, M.; Liu, Y. Influence of GGBFS and alkali activators on macro-mechanical performance and micro-fracture mechanisms of geopolymer concrete in split Hopkinson pressure bar tests. Constr. Build. Mater. 2024, 434, 136736. [Google Scholar] [CrossRef]
- Maaze, M.R.; Shrivastava, S. Design development of sustainable brick-waste geopolymer brick using full factorial design methodology. Constr. Build. Mater. 2023, 370, 130655. [Google Scholar] [CrossRef]
- Driouich, A.; Hassani, S.E.A.E.; Labjar, H.; Kassbi, S.; Kambuyi, T.N.; Britel, O.; Sallek, B.; Digua, K.; Chroqui, R.; Chaair, H. Modeling and optimizing synthesis of irreversible gel by sol-gel using experimental design. Phosphorus Sulfur Silicon Relat. Elem. 2019, 195, 50–59. [Google Scholar] [CrossRef]
- Balti, S.; Boudenne, A.; Hamdi, N. Characterization and optimization of eco-friendly gypsum materials using response surface methodology. J. Build. Eng. 2023, 69, 106219. [Google Scholar] [CrossRef]
- Ojha, A.; Aggarwal, P. Durability performance of low calcium Flyash-Based geopolymer concrete. Structures 2023, 54, 956–963. [Google Scholar] [CrossRef]
- Shi, X.; Zhang, C.; Wang, X.; Zhang, T.; Wang, Q. Response surface methodology for multi-objective optimization of fly ash-GGBS based geopolymer mortar. Constr. Build. Mater. 2022, 315, 125644. [Google Scholar] [CrossRef]
- Jumaa, N.H.; Ali, I.M.; Nasr, M.S.; Falah, M.W. Strength and microstructural properties of binary and ternary blends in fly ash-based geopolymer concrete. Case Stud. Constr. Mater. 2022, 17, e01317. [Google Scholar] [CrossRef]
- GB/T 50081-2019; Standard for Test Methods of Concrete Physical and Mechanical Properties. Research Institute of Standards and Norms Ministry of Housing and Urban-Rural Development: Beijing, China, 2019.
- GB/T 50107-2010; Standard for Evaluation of Concrete Compressive Strength. Research Institute of Standards and Norms Ministry of Housing and Urban-Rural Development: Beijing, China, 2010.
- He, H.; Cheng, S.; Chen, Y.; Lan, B. Compression performance analysis of multi-scale modified concrete based on response surface method. Case Stud. Constr. Mater. 2022, 17, e01312. [Google Scholar] [CrossRef]
- Arioz, E.; Arioz, O.; Kockar, O.M. An Experimental Study on the Mechanical and Microstructural Properties of Geopolymers. Procedia Eng. 2012, 42, 100–105. [Google Scholar] [CrossRef]
- Kanagaraj, B.; Anand, N.; Andrushia, A.D.; Lubloy, E. Investigation on engineering properties and micro-structure characteristics of low strength and high strength geopolymer composites subjected to standard temperature exposure. Case Stud. Constr. Mater. 2022, 17, e01608. [Google Scholar] [CrossRef]
- Raza, M.H.; Khan, M.; Zhong, R.Y. Investigating the impact of alkaline activator on the sustainability potential of geopolymer and alternative hybrid materials. Mater. Today Sustain. 2024, 26, 100742. [Google Scholar] [CrossRef]
- Lee, N.K.; Lee, H.K. Reactivity and reaction products of alkali-activated, fly ash/slag paste. Constr. Build. Mater. 2015, 81, 303–312. [Google Scholar] [CrossRef]
- Waqas, R.M.; Butt, F.; Zhu, X.; Jiang, T.; Tufail, R.F. A Comprehensive Study on the Factors Affecting the Workability and Mechanical Properties of Ambient Cured Fly Ash and Slag Based Geopolymer Concrete. Appl. Sci. 2021, 11, 8722. [Google Scholar] [CrossRef]
- Deb, P.S.; Nath, P.; Sarker, P.K. The effects of ground granulated blast-furnace slag blending with fly ash and activator content on the workability and strength properties of geopolymer concrete cured at ambient temperature. Mater. Des. 2014, 62, 32–39. [Google Scholar] [CrossRef]
- Hussein, S.S.; Fawzi, N.M. Influence of using various percentages of slag on mechanical properties of fly ash-based geopolymer concrete. J. Eng. 2021, 27, 5067. [Google Scholar] [CrossRef]
- Nadondu, B.; Surin, P.; Deeying, J. Multi-objective optimization on mechanical properties of glass-carbon and durian skin fiber reinforced poly(lactic acid) hybrid composites using the extreme mixture design response surface methodology. Case Stud. Constr. Mater. 2022, 17, e01675. [Google Scholar] [CrossRef]
- Gorde, P.; Thongire, O.; Kadam, G.; Shekh, S.; Sonawane, V.; Kulkarni, D. Review of geopolymer concrete in high grade infrastructure construction. Mater. Today Proc. 2023; in press. [Google Scholar] [CrossRef]
- Kumar, S.; Kumar, R.; Mehrotra, S.P. Influence of granulated blast furnace slag on the reaction, structure and properties of fly ash based geopolymer. J. Mater. Sci. 2010, 45, 607–615. [Google Scholar] [CrossRef]
- Fan, L.F.; Chen, D.K.; Zhong, W.L. Effects of slag and alkaline solution contents on bonding strength of geopolymer-concrete composites. Constr. Build. Mater. 2023, 406, 133391. [Google Scholar] [CrossRef]


| Chemical Composition | Mass Fraction/% | |
|---|---|---|
| Fly Ash | Slag | |
| SiO2 | 55.04 | 28.11 |
| Al2O3 | 25.50 | 12.36 |
| CaO | 4.39 | 42.99 |
| SO3 | 3.23 | 2.08 |
| Fe2O3 | 3.76 | 1.82 |
| K2O | 1.87 | 1.26 |
| Na2O | 1.74 | 0.60 |
| MgO | 1.58 | 5.32 |
| TiO2 | 1.16 | 1.93 |
| SrO | 0.87 | 0.14 |
| MnO | 0.12 | 2.75 |
| P2O5 | 0.27 | 0.45 |
| Cl | 0.21 | 0.18 |
| Concentration/(°Bé) | Sodium Silicate Modulus | Mass Fraction/% | ||
|---|---|---|---|---|
| H2O | Na2O | SiO2 | ||
| 40 | 3.29 | 65.85 | 8.15 | 26 |
| Material | Specific Gravity | Compacted Dry Density (kg/m3) | Water Absorption (%) | Fineness Modulus |
|---|---|---|---|---|
| Natural sand | 2.96 | 1710 | 1.30 | 2.96 |
| Crushed stone | 2.88 | 1675 | 0.58 | 6.65 |
| Influence Factor | Code | Level | ||
|---|---|---|---|---|
| −1 | 0 | 1 | ||
| Water–binder ratio | A | 0.34 | 0.38 | 0.42 |
| Alkaline activator modulus | B | 1 | 1.3 | 1.6 |
| Slag replacement | C | 10% | 30% | 50% |
| No. | Water–Binder Ratio | Alkaline Activator Modulus | Slag Replacement | Mix Proportion/(kg/m3) | |||||||
|---|---|---|---|---|---|---|---|---|---|---|---|
| Fly Ash | Slag | Sodium Silicate | Sodium Hydroxide | Water | Fine Aggregate | Coarse Aggregate | |||||
| I | 1 | 0.38 | 1.3 | 30% | 297.34 | 127.43 | 147.04 | 23.68 | 93.18 | 694 | 1041 |
| 2 | 0.38 | 1.3 | 30% | 297.34 | 127.43 | 147.04 | 23.68 | 93.18 | 694 | 1041 | |
| 3 | 0.38 | 1.3 | 30% | 297.34 | 127.43 | 147.04 | 23.68 | 93.18 | 694 | 1041 | |
| II | 1 | 0.34 | 1.3 | 50% | 212.39 | 212.39 | 147.04 | 23.68 | 73.18 | 702 | 1053 |
| 2 | 0.34 | 1.3 | 50% | 212.39 | 212.39 | 147.04 | 23.68 | 73.18 | 702 | 1053 | |
| 3 | 0.34 | 1.3 | 50% | 212.39 | 212.39 | 147.04 | 23.68 | 73.18 | 702 | 1053 | |
| III | 1 | 0.38 | 1.3 | 30% | 297.34 | 127.43 | 147.04 | 23.68 | 93.18 | 694 | 1041 |
| 2 | 0.38 | 1.3 | 30% | 297.34 | 127.43 | 147.04 | 23.68 | 93.18 | 694 | 1041 | |
| 3 | 0.38 | 1.3 | 30% | 297.34 | 127.43 | 147.04 | 23.68 | 93.18 | 694 | 1041 | |
| IV | 1 | 0.38 | 1.6 | 50% | 212.39 | 212.39 | 147.04 | 16.34 | 93.18 | 694 | 1041 |
| 2 | 0.38 | 1.6 | 50% | 212.39 | 212.39 | 147.04 | 16.34 | 93.18 | 694 | 1041 | |
| 3 | 0.38 | 1.6 | 50% | 212.39 | 212.39 | 147.04 | 16.34 | 93.18 | 694 | 1041 | |
| V | 1 | 0.34 | 1.0 | 30% | 297.34 | 127.43 | 147.04 | 35.42 | 73.18 | 702 | 1053 |
| 2 | 0.34 | 1.0 | 30% | 297.34 | 127.43 | 147.04 | 35.42 | 73.18 | 702 | 1053 | |
| 3 | 0.34 | 1.0 | 30% | 297.34 | 127.43 | 147.04 | 35.42 | 73.18 | 702 | 1053 | |
| VI | 1 | 0.34 | 1.6 | 30% | 297.34 | 127.43 | 147.04 | 16.34 | 73.18 | 702 | 1053 |
| 2 | 0.34 | 1.6 | 30% | 297.34 | 127.43 | 147.04 | 16.34 | 73.18 | 702 | 1053 | |
| 3 | 0.34 | 1.6 | 30% | 297.34 | 127.43 | 147.04 | 16.34 | 73.18 | 702 | 1053 | |
| VII | 1 | 0.38 | 1.0 | 50% | 212.39 | 212.39 | 147.04 | 35.42 | 93.18 | 694 | 1041 |
| 2 | 0.38 | 1.0 | 50% | 212.39 | 212.39 | 147.04 | 35.42 | 93.18 | 694 | 1041 | |
| 3 | 0.38 | 1.0 | 50% | 212.39 | 212.39 | 147.04 | 35.42 | 93.18 | 694 | 1041 | |
| VIII | 1 | 0.42 | 1.3 | 50% | 212.39 | 212.39 | 147.04 | 23.68 | 113.18 | 686 | 1029 |
| 2 | 0.42 | 1.3 | 50% | 212.39 | 212.39 | 147.04 | 23.68 | 113.18 | 686 | 1029 | |
| 3 | 0.42 | 1.3 | 50% | 212.39 | 212.39 | 147.04 | 23.68 | 113.18 | 686 | 1029 | |
| IX | 1 | 0.42 | 1.0 | 30% | 297.34 | 127.43 | 147.04 | 35.42 | 113.18 | 686 | 1029 |
| 2 | 0.42 | 1.0 | 30% | 297.34 | 127.43 | 147.04 | 35.42 | 113.18 | 686 | 1029 | |
| 3 | 0.42 | 1.0 | 30% | 297.34 | 127.43 | 147.04 | 35.42 | 113.18 | 686 | 1029 | |
| X | 1 | 0.38 | 1.0 | 10% | 382.30 | 42.48 | 147.04 | 35.42 | 93.18 | 694 | 1041 |
| 2 | 0.38 | 1.0 | 10% | 382.30 | 42.48 | 147.04 | 35.42 | 93.18 | 694 | 1041 | |
| 3 | 0.38 | 1.0 | 10% | 382.30 | 42.48 | 147.04 | 35.42 | 93.18 | 694 | 1041 | |
| XI | 1 | 0.38 | 1.6 | 10% | 382.30 | 42.48 | 147.04 | 16.34 | 93.18 | 694 | 1041 |
| 2 | 0.38 | 1.6 | 10% | 382.30 | 42.48 | 147.04 | 16.34 | 93.18 | 694 | 1041 | |
| 3 | 0.38 | 1.6 | 10% | 382.30 | 42.48 | 147.04 | 16.34 | 93.18 | 694 | 1041 | |
| XII | 1 | 0.38 | 1.3 | 30% | 297.34 | 127.43 | 147.04 | 23.68 | 93.18 | 694 | 1041 |
| 2 | 0.38 | 1.3 | 30% | 297.34 | 127.43 | 147.04 | 23.68 | 93.18 | 694 | 1041 | |
| 3 | 0.38 | 1.3 | 30% | 297.34 | 127.43 | 147.04 | 23.68 | 93.18 | 694 | 1041 | |
| XIII | 1 | 0.38 | 1.3 | 30% | 297.34 | 127.43 | 147.04 | 23.68 | 93.18 | 694 | 1041 |
| 2 | 0.38 | 1.3 | 30% | 297.34 | 127.43 | 147.04 | 23.68 | 93.18 | 694 | 1041 | |
| 3 | 0.38 | 1.3 | 30% | 297.34 | 127.43 | 147.04 | 23.68 | 93.18 | 694 | 1041 | |
| XIV | 1 | 0.38 | 1.3 | 30% | 297.34 | 127.43 | 147.04 | 23.68 | 93.18 | 694 | 1041 |
| 2 | 0.38 | 1.3 | 30% | 297.34 | 127.43 | 147.04 | 23.68 | 93.18 | 694 | 1041 | |
| 3 | 0.38 | 1.3 | 30% | 297.34 | 127.43 | 147.04 | 23.68 | 93.18 | 694 | 1041 | |
| XV | 1 | 0.42 | 1.3 | 10% | 382.30 | 42.48 | 147.04 | 23.68 | 113.18 | 686 | 1029 |
| 2 | 0.42 | 1.3 | 10% | 382.30 | 42.48 | 147.04 | 23.68 | 113.18 | 686 | 1029 | |
| 3 | 0.42 | 1.3 | 10% | 382.30 | 42.48 | 147.04 | 23.68 | 113.18 | 686 | 1029 | |
| XVI | 1 | 0.42 | 1.6 | 30% | 297.34 | 127.43 | 147.04 | 16.34 | 113.18 | 686 | 1029 |
| 2 | 0.42 | 1.6 | 30% | 297.34 | 127.43 | 147.04 | 16.34 | 113.18 | 686 | 1029 | |
| 3 | 0.42 | 1.6 | 30% | 297.34 | 127.43 | 147.04 | 16.34 | 113.18 | 686 | 1029 | |
| XVII | 1 | 0.34 | 1.3 | 10% | 382.30 | 42.48 | 147.04 | 23.68 | 73.18 | 702 | 1053 |
| 2 | 0.34 | 1.3 | 10% | 382.30 | 42.48 | 147.04 | 23.68 | 73.18 | 702 | 1053 | |
| 3 | 0.34 | 1.3 | 10% | 382.30 | 42.48 | 147.04 | 23.68 | 73.18 | 702 | 1053 | |
| Test Group No. | Compressive Strength/MPa | Flexural Strength/MPa | ||||||
|---|---|---|---|---|---|---|---|---|
| 1 | 2 | 3 | Test Value | 1 | 2 | 3 | Test Value | |
| I | 63.1 | 68.3 | 64.6 | 65.4 | 3.45 | 3.38 | 3.20 | 3.35 |
| II | 69.4 | 83.1 | 81.8 | 81.8 | 4.54 | 3.77 | 3.53 | 3.77 |
| III | 69.0 | 66.0 | 73.4 | 69.5 | 3.62 | 3.48 | 3.51 | 3.54 |
| IV | 83.0 | 85.6 | 88.0 | 85.5 | 3.86 | 3.87 | 3.75 | 3.83 |
| V | 60.7 | 53.4 | 56.2 | 56.7 | 3.88 | 3.43 | 3.20 | 3.50 |
| VI | 62.3 | 64.9 | 60.8 | 62.5 | 3.43 | 3.17 | 3.02 | 3.20 |
| VII | 67.3 | 76.4 | 68.8 | 70.8 | 3.61 | 3.08 | 3.38 | 3.36 |
| VIII | 77.2 | 78.6 | 68.6 | 74.7 | 2.93 | 3.11 | 3.28 | 3.11 |
| IX | 57.6 | 54.5 | 51.3 | 54.4 | 2.66 | 2.84 | 2.45 | 2.65 |
| X | 46.1 | 43.8 | 41.7 | 43.8 | 2.42 | 2.42 | 2.46 | 2.44 |
| XI | 20.3 | 18.0 | 18.5 | 18.9 | 2.02 | 1.92 | 1.69 | 1.88 |
| XII | 60.7 | 62.1 | 61.0 | 61.3 | 3.17 | 3.01 | 3.20 | 3.13 |
| XIII | 59.8 | 63.6 | 73.6 | 63.6 | 3.50 | 3.28 | 3.29 | 3.36 |
| XIV | 69.9 | 67.4 | 60.9 | 66.0 | 3.39 | 3.21 | 3.26 | 3.29 |
| XV | 21.0 | 19.4 | 20.5 | 20.3 | 1.44 | 1.47 | 1.54 | 1.48 |
| XVI | 46.9 | 46.5 | 46.3 | 46.6 | 2.65 | 2.46 | 2.55 | 2.55 |
| XVII | 24.9 | 26.2 | 25.0 | 25.4 | 2.40 | 2.45 | 1.93 | 2.40 |
| No. | Compressive Strength | Flexural Strength | |||||
|---|---|---|---|---|---|---|---|
| Measured Value/MPa | Predicted Value/MPa | Relative Error/% | Measured Value/MPa | Predicted Value/MPa | Relative Error/% | ||
| I | 1 | 63.1 | 65.2 | 3.3 | 3.45 | 3.33 | −3.48 |
| 2 | 68.3 | −4.5 | 3.38 | −1.48 | |||
| 3 | 64.6 | 0.9 | 3.20 | 4.06 | |||
| Test value | 65.4 | −0.3 | 3.35 | −0.60 | |||
| II | 1 | 69.4 | 80.4 | 15.9 | 4.54 | 3.74 | −17.62 |
| 2 | 83.1 | −3.2 | 3.77 | −0.80 | |||
| 3 | 81.8 | −1.7 | 3.53 | 5.95 | |||
| Test value | 81.8 | −1.7 | 3.77 | −0.80 | |||
| III | 1 | 69.0 | 65.2 | −5.5 | 3.62 | 3.33 | −8.01 |
| 2 | 66.0 | −1.2 | 3.48 | −4.31 | |||
| 3 | 73.4 | −11.2 | 3.51 | −5.13 | |||
| Test value | 69.5 | −6.2 | 3.54 | −5.93 | |||
| IV | 1 | 83.0 | 88.7 | 6.9 | 3.86 | 3.81 | −1.30 |
| 2 | 85.6 | 3.6 | 3.87 | −1.55 | |||
| 3 | 88.0 | 0.8 | 3.75 | 1.60 | |||
| Test value | 85.5 | 3.7 | 3.83 | −0.52 | |||
| V | 1 | 60.7 | 57.0 | −6.1 | 3.88 | 3.47 | −10.57 |
| 2 | 53.4 | 6.7 | 3.43 | 1.17 | |||
| 3 | 56.2 | 1.4 | 3.20 | 8.44 | |||
| Test value | 56.7 | 0.5 | 3.50 | −0.86 | |||
| VI | 1 | 62.3 | 60.7 | −2.6 | 3.43 | 3.25 | −5.25 |
| 2 | 64.9 | −6.5 | 3.17 | 2.52 | |||
| 3 | 60.8 | −0.2 | 3.02 | 7.62 | |||
| Test value | 62.5 | −2.9 | 3.20 | 1.56 | |||
| VII | 1 | 67.3 | 71.9 | 6.8 | 3.61 | 3.42 | −5.26 |
| 2 | 76.4 | −5.9 | 3.08 | 11.04 | |||
| 3 | 68.8 | 4.5 | 3.38 | 1.18 | |||
| Test value | 70.8 | 1.6 | 3.36 | 1.79 | |||
| VIII | 1 | 77.2 | 71.8 | −7.0 | 2.93 | 3.10 | 5.80 |
| 2 | 78.6 | −8.7 | 3.11 | −0.32 | |||
| 3 | 68.6 | 4.7 | 3.28 | −5.49 | |||
| Test value | 74.7 | −3.9 | 3.11 | −0.32 | |||
| IX | 1 | 57.6 | 56.2 | −2.4 | 2.66 | 2.60 | −2.26 |
| 2 | 54.5 | 3.1 | 2.84 | −8.45 | |||
| 3 | 51.3 | 9.6 | 2.45 | 6.12 | |||
| Test value | 54.4 | 3.3 | 2.65 | −1.89 | |||
| X | 1 | 46.1 | 40.6 | −11.9 | 2.42 | 2.46 | 1.65 |
| 2 | 43.8 | −7.3 | 2.42 | 1.65 | |||
| 3 | 41.7 | −2.6 | 2.46 | 0.00 | |||
| Test value | 43.8 | −7.3 | 2.44 | 0.82 | |||
| XI | 1 | 20.3 | 17.8 | −12.3 | 2.02 | 1.83 | −9.41 |
| 2 | 18.0 | −1.1 | 1.92 | −4.69 | |||
| 3 | 18.5 | −3.8 | 1.69 | 8.28 | |||
| Test value | 18.9 | −5.8 | 1.88 | −2.66 | |||
| XII | 1 | 60.7 | 65.2 | 7.4 | 3.17 | 3.33 | 5.05 |
| 2 | 62.1 | 5.0 | 3.01 | 10.63 | |||
| 3 | 61.0 | 6.9 | 3.20 | 4.06 | |||
| Test value | 61.3 | 6.4 | 3.13 | 6.39 | |||
| XIII | 1 | 59.8 | 65.2 | 9.0 | 3.50 | 3.33 | −4.86 |
| 2 | 63.6 | 2.5 | 3.28 | 1.52 | |||
| 3 | 73.6 | −11.4 | 3.29 | 1.22 | |||
| Test value | 63.6 | 2.5 | 3.36 | −0.89 | |||
| XIV | 1 | 69.9 | 65.2 | −6.7 | 3.39 | 3.33 | −1.77 |
| 2 | 67.4 | −3.3 | 3.21 | 3.74 | |||
| 3 | 60.9 | 7.1 | 3.26 | 2.15 | |||
| Test value | 66.0 | −1.2 | 3.29 | 1.22 | |||
| XV | 1 | 21.0 | 21.7 | 3.3 | 1.44 | 1.51 | 4.86 |
| 2 | 19.4 | 11.9 | 1.47 | 2.72 | |||
| 3 | 20.5 | 5.9 | 1.54 | −1.95 | |||
| Test value | 20.3 | 6.9 | 1.48 | 2.03 | |||
| XVI | 1 | 46.9 | 46.3 | −1.3 | 2.65 | 2.58 | −2.64 |
| 2 | 46.5 | −0.4 | 2.46 | 4.88 | |||
| 3 | 46.3 | 0.0 | 2.55 | 1.18 | |||
| Test value | 46.6 | −0.6 | 2.55 | 1.18 | |||
| XVII | 1 | 24.9 | 28.3 | 13.7 | 2.40 | 2.41 | 0.42 |
| 2 | 26.2 | 8.0 | 2.45 | −1.63 | |||
| 3 | 25.0 | 13.2 | 1.93 | 24.87 | |||
| Test value | 25.4 | 11.4 | 2.40 | 0.42 | |||
| Response | Source | Sum of Squares | Degree of Freedom | Mean Square | F-Value | p-Value | Notes |
|---|---|---|---|---|---|---|---|
| Y1 | Model | 6330.43 | 9 | 703.38 | 56.71 | <0.0001 | significant |
| A | 115.52 | 1 | 115.52 | 9.31 | 0.0185 | ||
| B | 18.60 | 1 | 18.60 | 1.50 | 0.2603 | ||
| C | 5222.42 | 1 | 5222.42 | 421.08 | <0.0001 | ||
| AB | 46.24 | 1 | 46.24 | 3.73 | 0.0948 | ||
| AC | 1.00 | 1 | 1.00 | 0.081 | 0.7847 | ||
| BC | 392.04 | 1 | 392.04 | 31.61 | 0.0008 | ||
| A2 | 215.55 | 1 | 215.55 | 17.38 | 0.0042 | ||
| B2 | 36.77 | 1 | 36.77 | 2.96 | 0.1288 | ||
| C2 | 234.01 | 1 | 234.01 | 18.87 | 0.0034 | ||
| Residual | 86.82 | 7 | 12.40 | ||||
| Lack of Fit | 49.88 | 3 | 16.63 | 1.80 | 0.2865 | not significant | |
| Pure Error | 36.93 | 4 | 9.23 | ||||
| Cor Total | 6417.25 | 16 | |||||
| Y2 | Model | 6.82 | 9 | 0.76 | 52.07 | < 0.0001 | significant |
| A | 1.19 | 1 | 1.19 | 81.50 | < 0.0001 | ||
| B | 0.030 | 1 | 0.030 | 2.06 | 0.1941 | ||
| C | 4.31 | 1 | 4.31 | 296.04 | < 0.0001 | ||
| AB | 0.01 | 1 | 0.01 | 0.69 | 0.4344 | ||
| AC | 0.017 | 1 | 0.017 | 1.16 | 0.3169 | ||
| BC | 0.27 | 1 | 0.27 | 18.23 | 0.0037 | ||
| A2 | 0.31 | 1 | 0.31 | 21.61 | 0.0023 | ||
| B2 | 0.031 | 1 | 0.031 | 2.13 | 0.1880 | ||
| C2 | 0.58 | 1 | 0.58 | 39.78 | 0.0004 | ||
| Residual | 0.10 | 7 | 0.015 | ||||
| Lack of Fit | 0.015 | 3 | 0.004975 | 0.23 | 0.8721 | not significant | |
| Pure Error | 0.087 | 4 | 0.022 | ||||
| Cor Total | 6.92 | 16 |
| Model | Standard Deviation | Mean | R2 | Ra2 | Rp2 | C.V./% |
|---|---|---|---|---|---|---|
| Y1 | 3.52 | 56.89 | 0.9865 | 0.9691 | 0.8666 | 6.19 |
| Y2 | 0.12 | 2.99 | 0.9853 | 0.9664 | 0.9459 | 4.03 |
| Water–Binder Ratio | Alkaline Activator Modulus | Slag Replacement | Compressive Strength/MPa | Flexural Strength/MPa | |
|---|---|---|---|---|---|
| Predicted value | 3.5 | 1.54 | 47% | 86.3 | 3.82 |
| Tested value | 82.5 | 4.02 |
Disclaimer/Publisher’s Note: The statements, opinions and data contained in all publications are solely those of the individual author(s) and contributor(s) and not of MDPI and/or the editor(s). MDPI and/or the editor(s) disclaim responsibility for any injury to people or property resulting from any ideas, methods, instructions or products referred to in the content. |
© 2024 by the authors. Licensee MDPI, Basel, Switzerland. This article is an open access article distributed under the terms and conditions of the Creative Commons Attribution (CC BY) license (https://creativecommons.org/licenses/by/4.0/).
Share and Cite
Zhang, Z.; Su, T.; Zhang, L.; Zheng, R.; Ma, K.; Zhang, L.; Amaechi, C.V.; Wang, C. The Influence of Fly Ash and Slag on the Mechanical Properties of Geopolymer Concrete. Buildings 2024, 14, 2720. https://doi.org/10.3390/buildings14092720
Zhang Z, Su T, Zhang L, Zheng R, Ma K, Zhang L, Amaechi CV, Wang C. The Influence of Fly Ash and Slag on the Mechanical Properties of Geopolymer Concrete. Buildings. 2024; 14(9):2720. https://doi.org/10.3390/buildings14092720
Chicago/Turabian StyleZhang, Zhenyang, Tian Su, Lu Zhang, Run Zheng, Keshun Ma, Lin Zhang, Chiemela Victor Amaechi, and Chunguang Wang. 2024. "The Influence of Fly Ash and Slag on the Mechanical Properties of Geopolymer Concrete" Buildings 14, no. 9: 2720. https://doi.org/10.3390/buildings14092720
APA StyleZhang, Z., Su, T., Zhang, L., Zheng, R., Ma, K., Zhang, L., Amaechi, C. V., & Wang, C. (2024). The Influence of Fly Ash and Slag on the Mechanical Properties of Geopolymer Concrete. Buildings, 14(9), 2720. https://doi.org/10.3390/buildings14092720