
Numerical Investigation on Stability of Lanxi’s Ancient City Wall during a Major Flood Propagation Process
 ,
,
Abstract
:1. Introduction
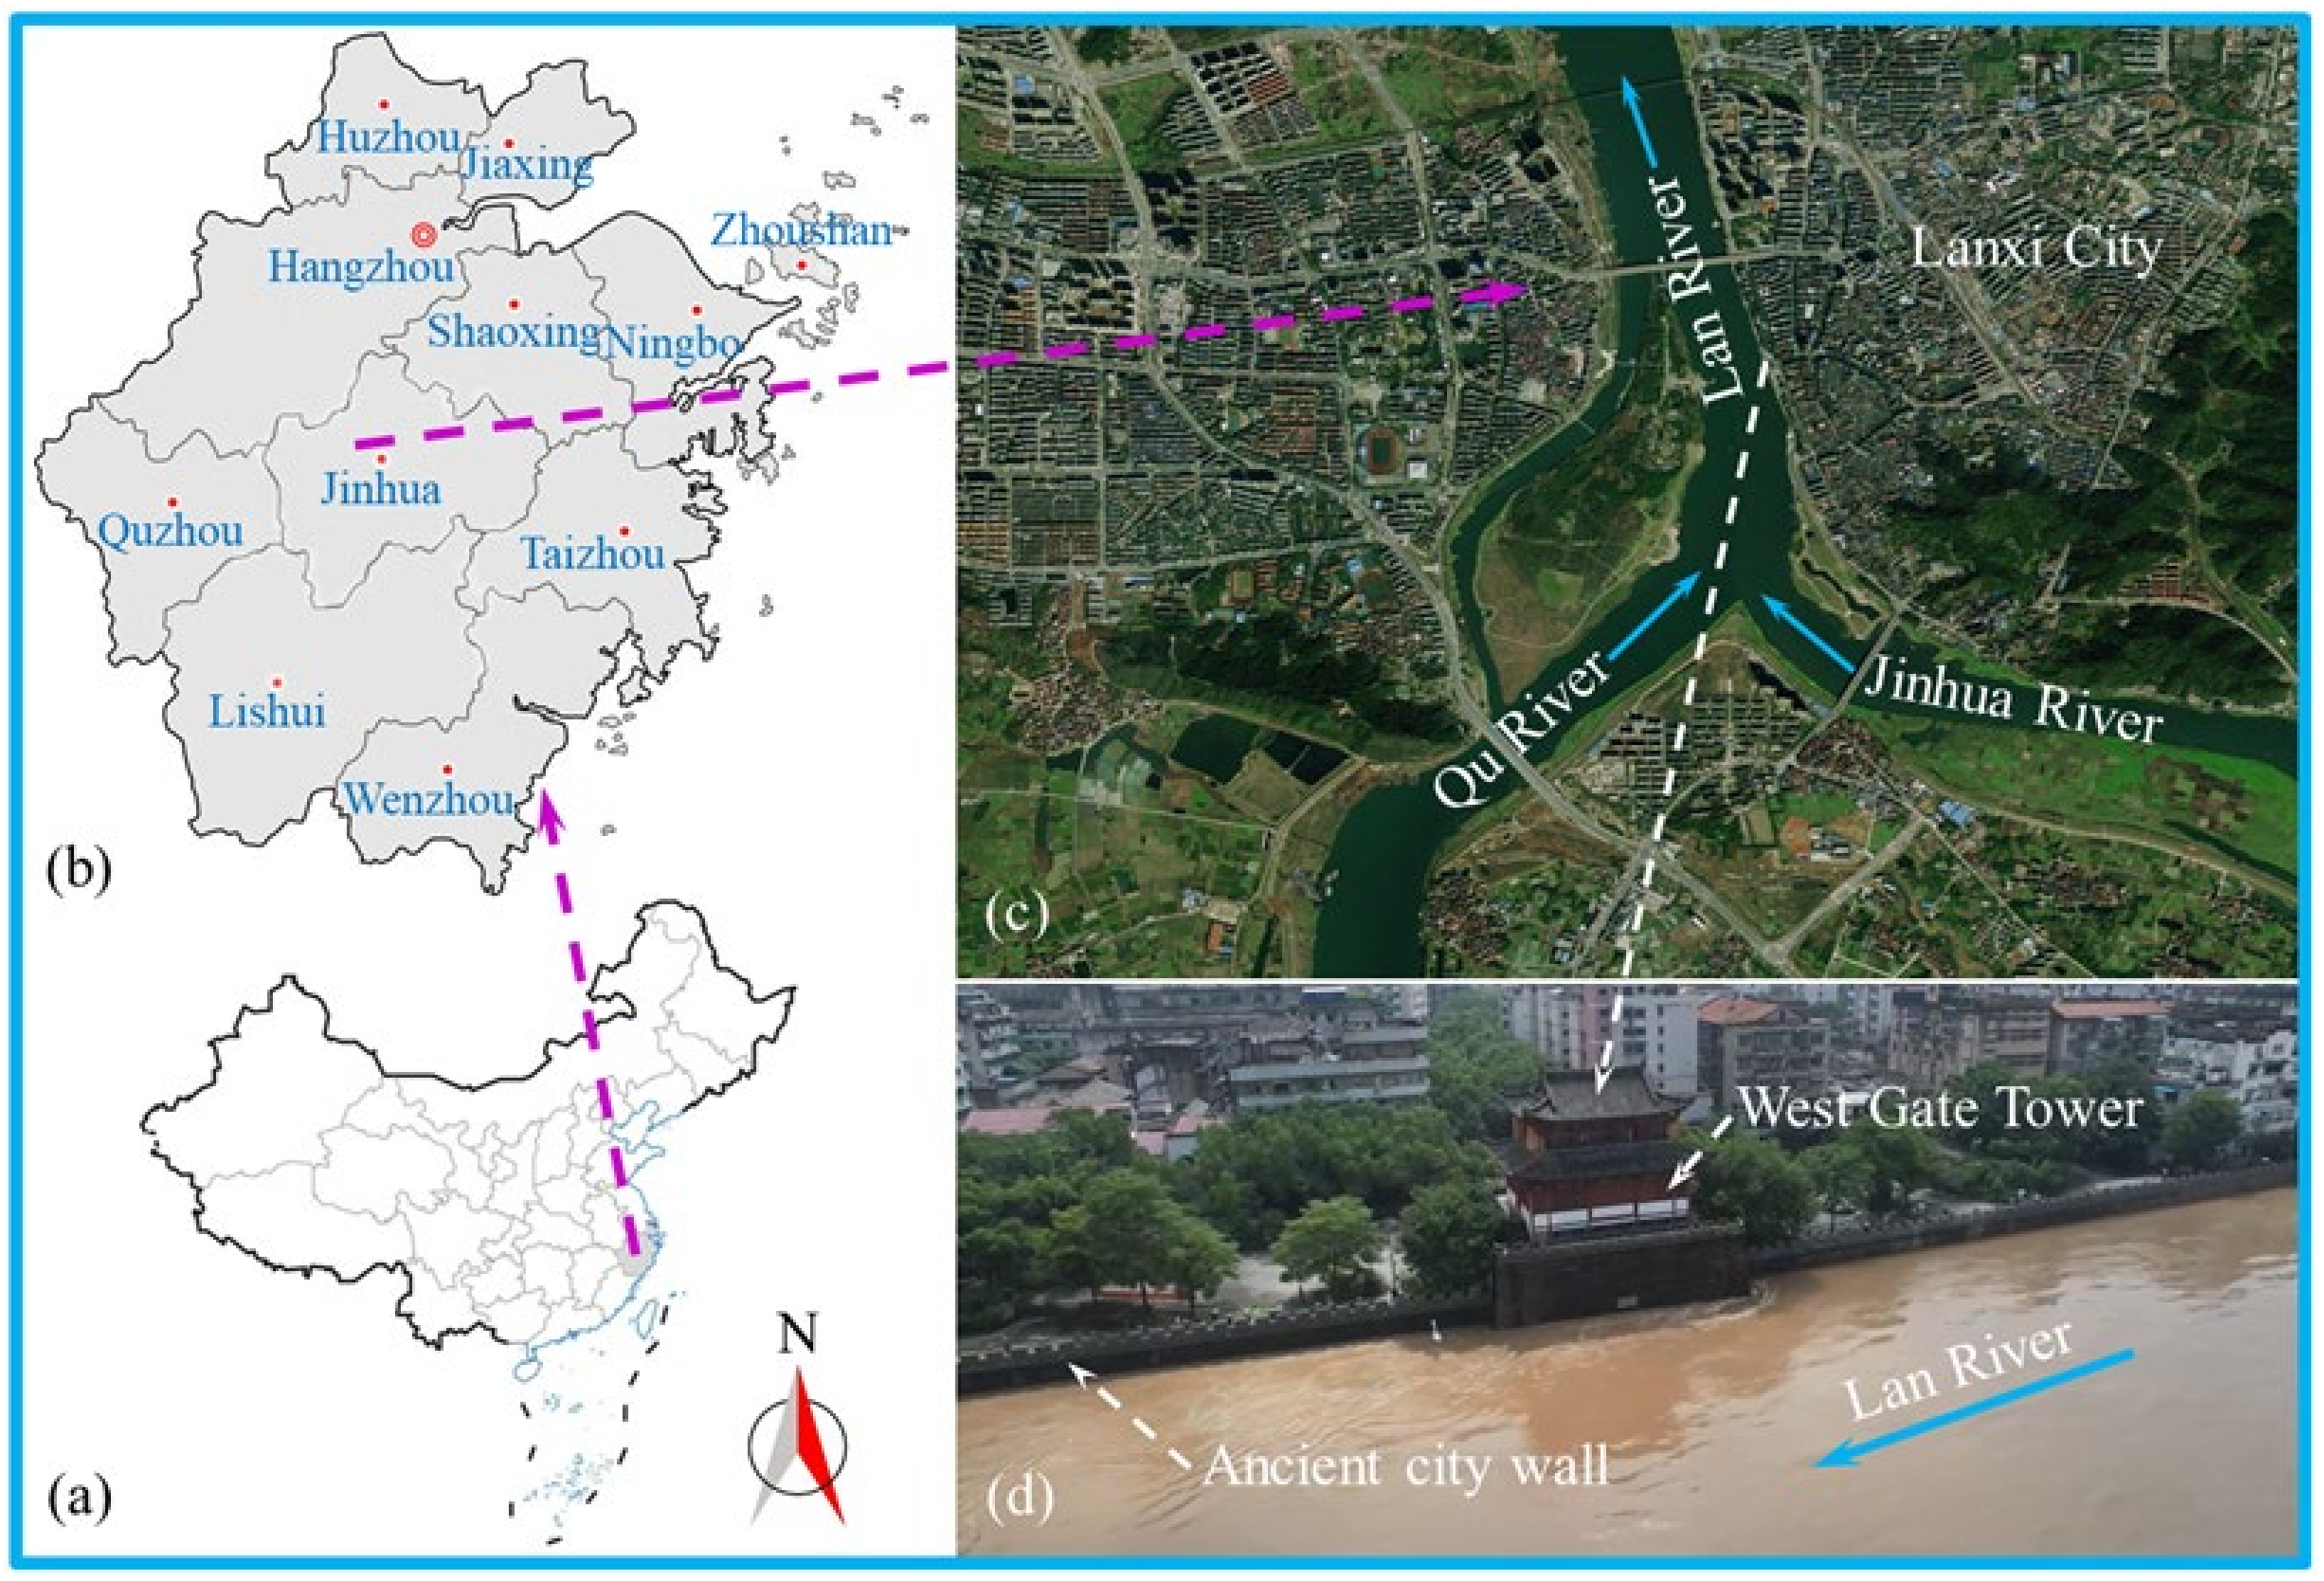
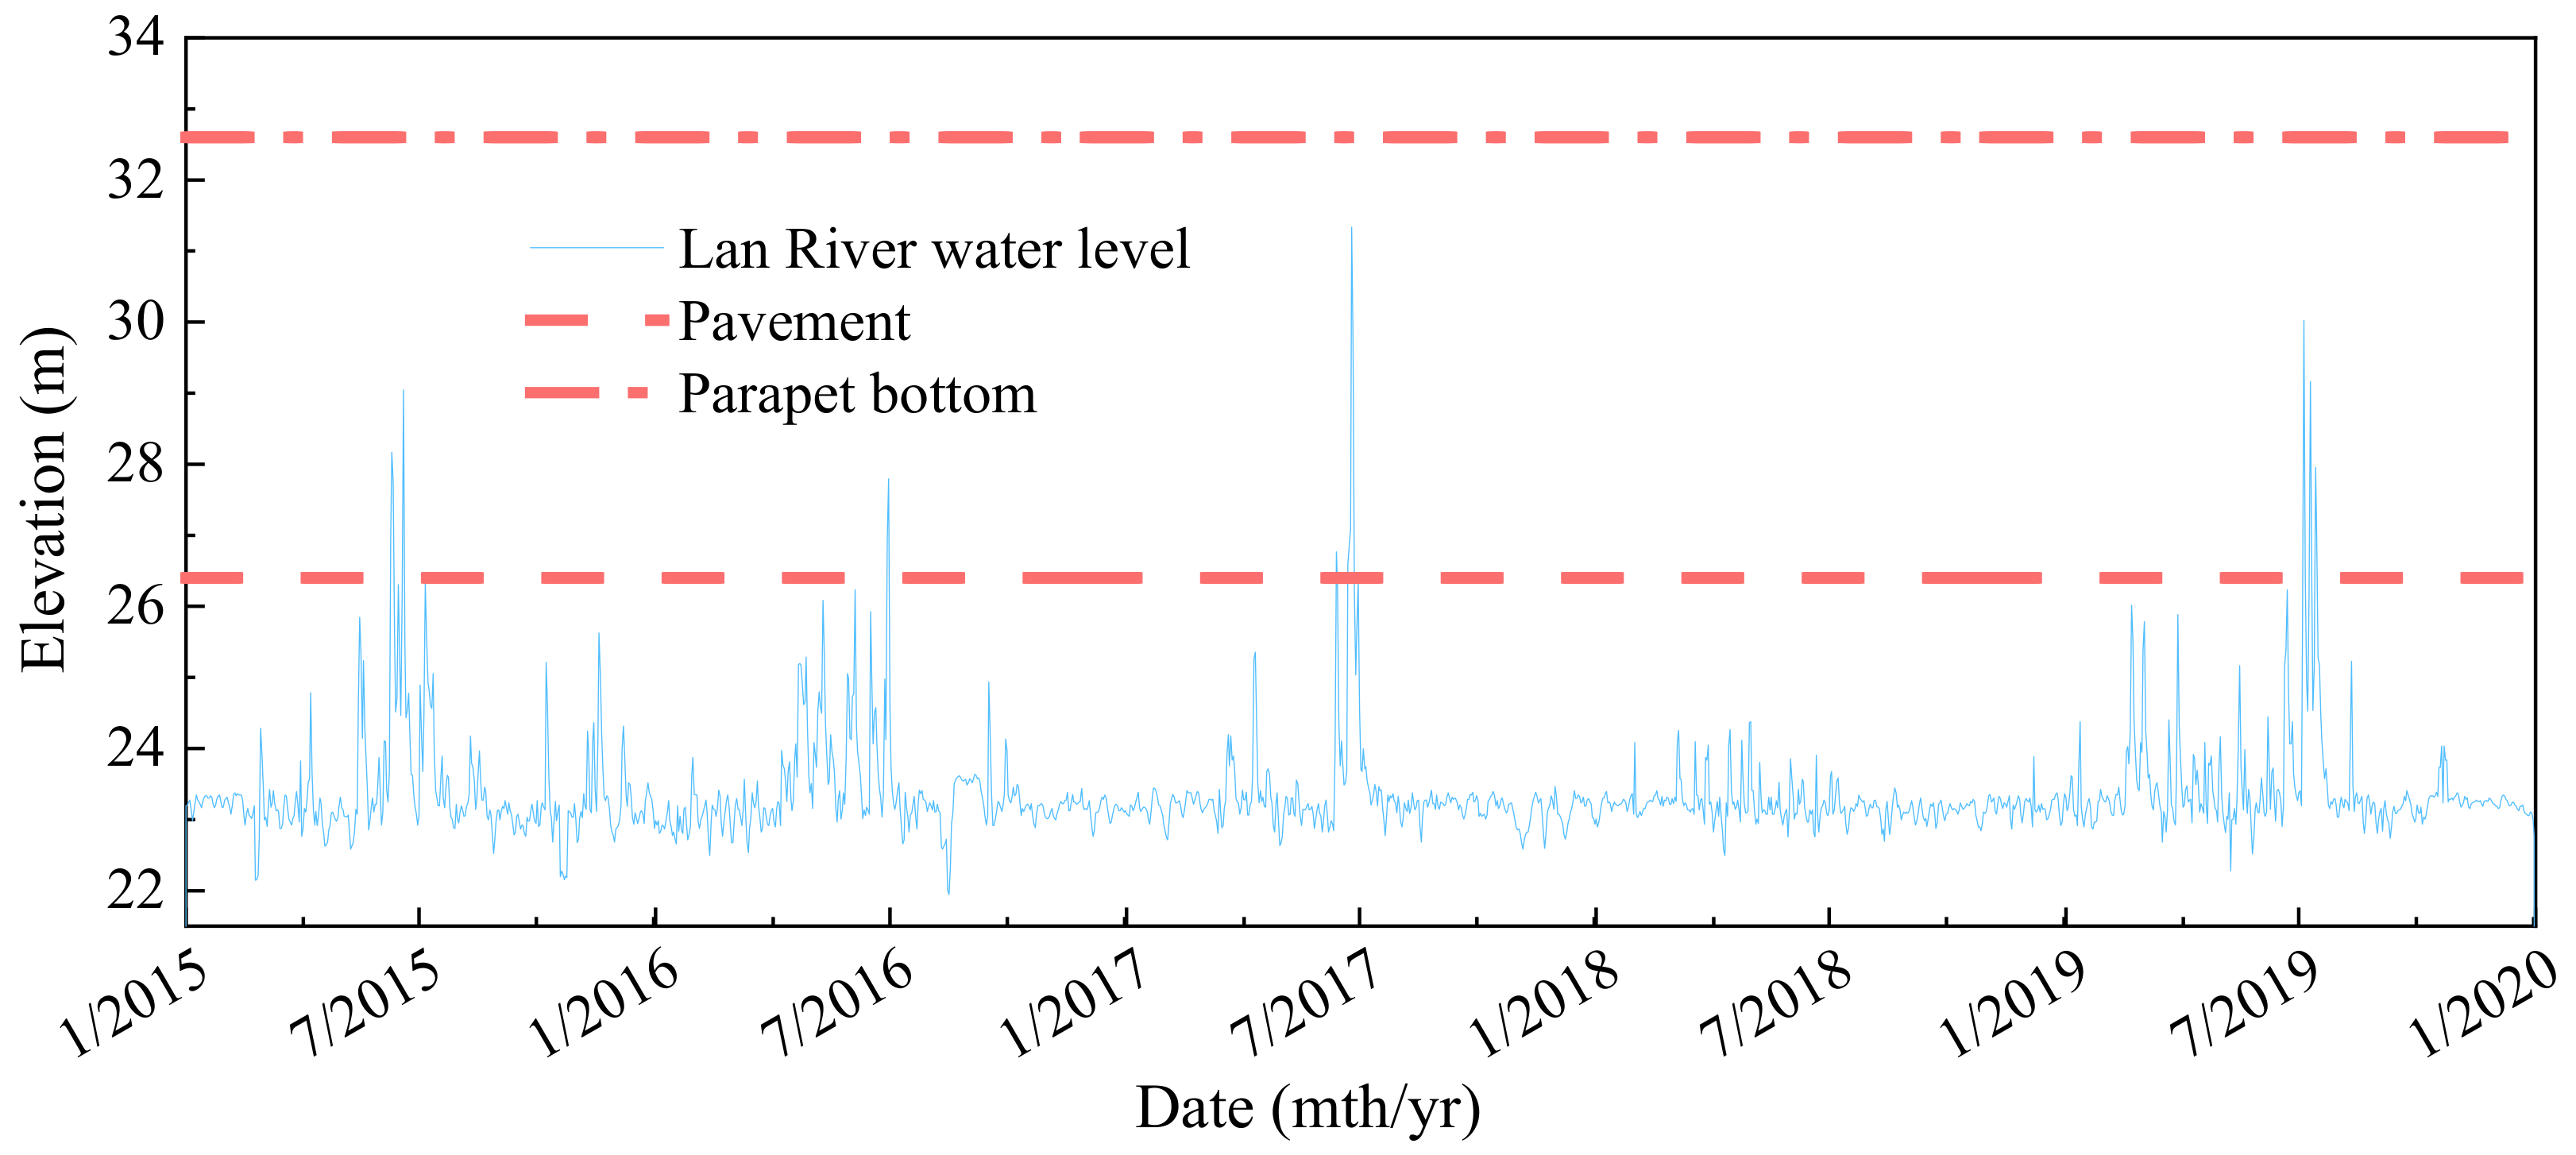
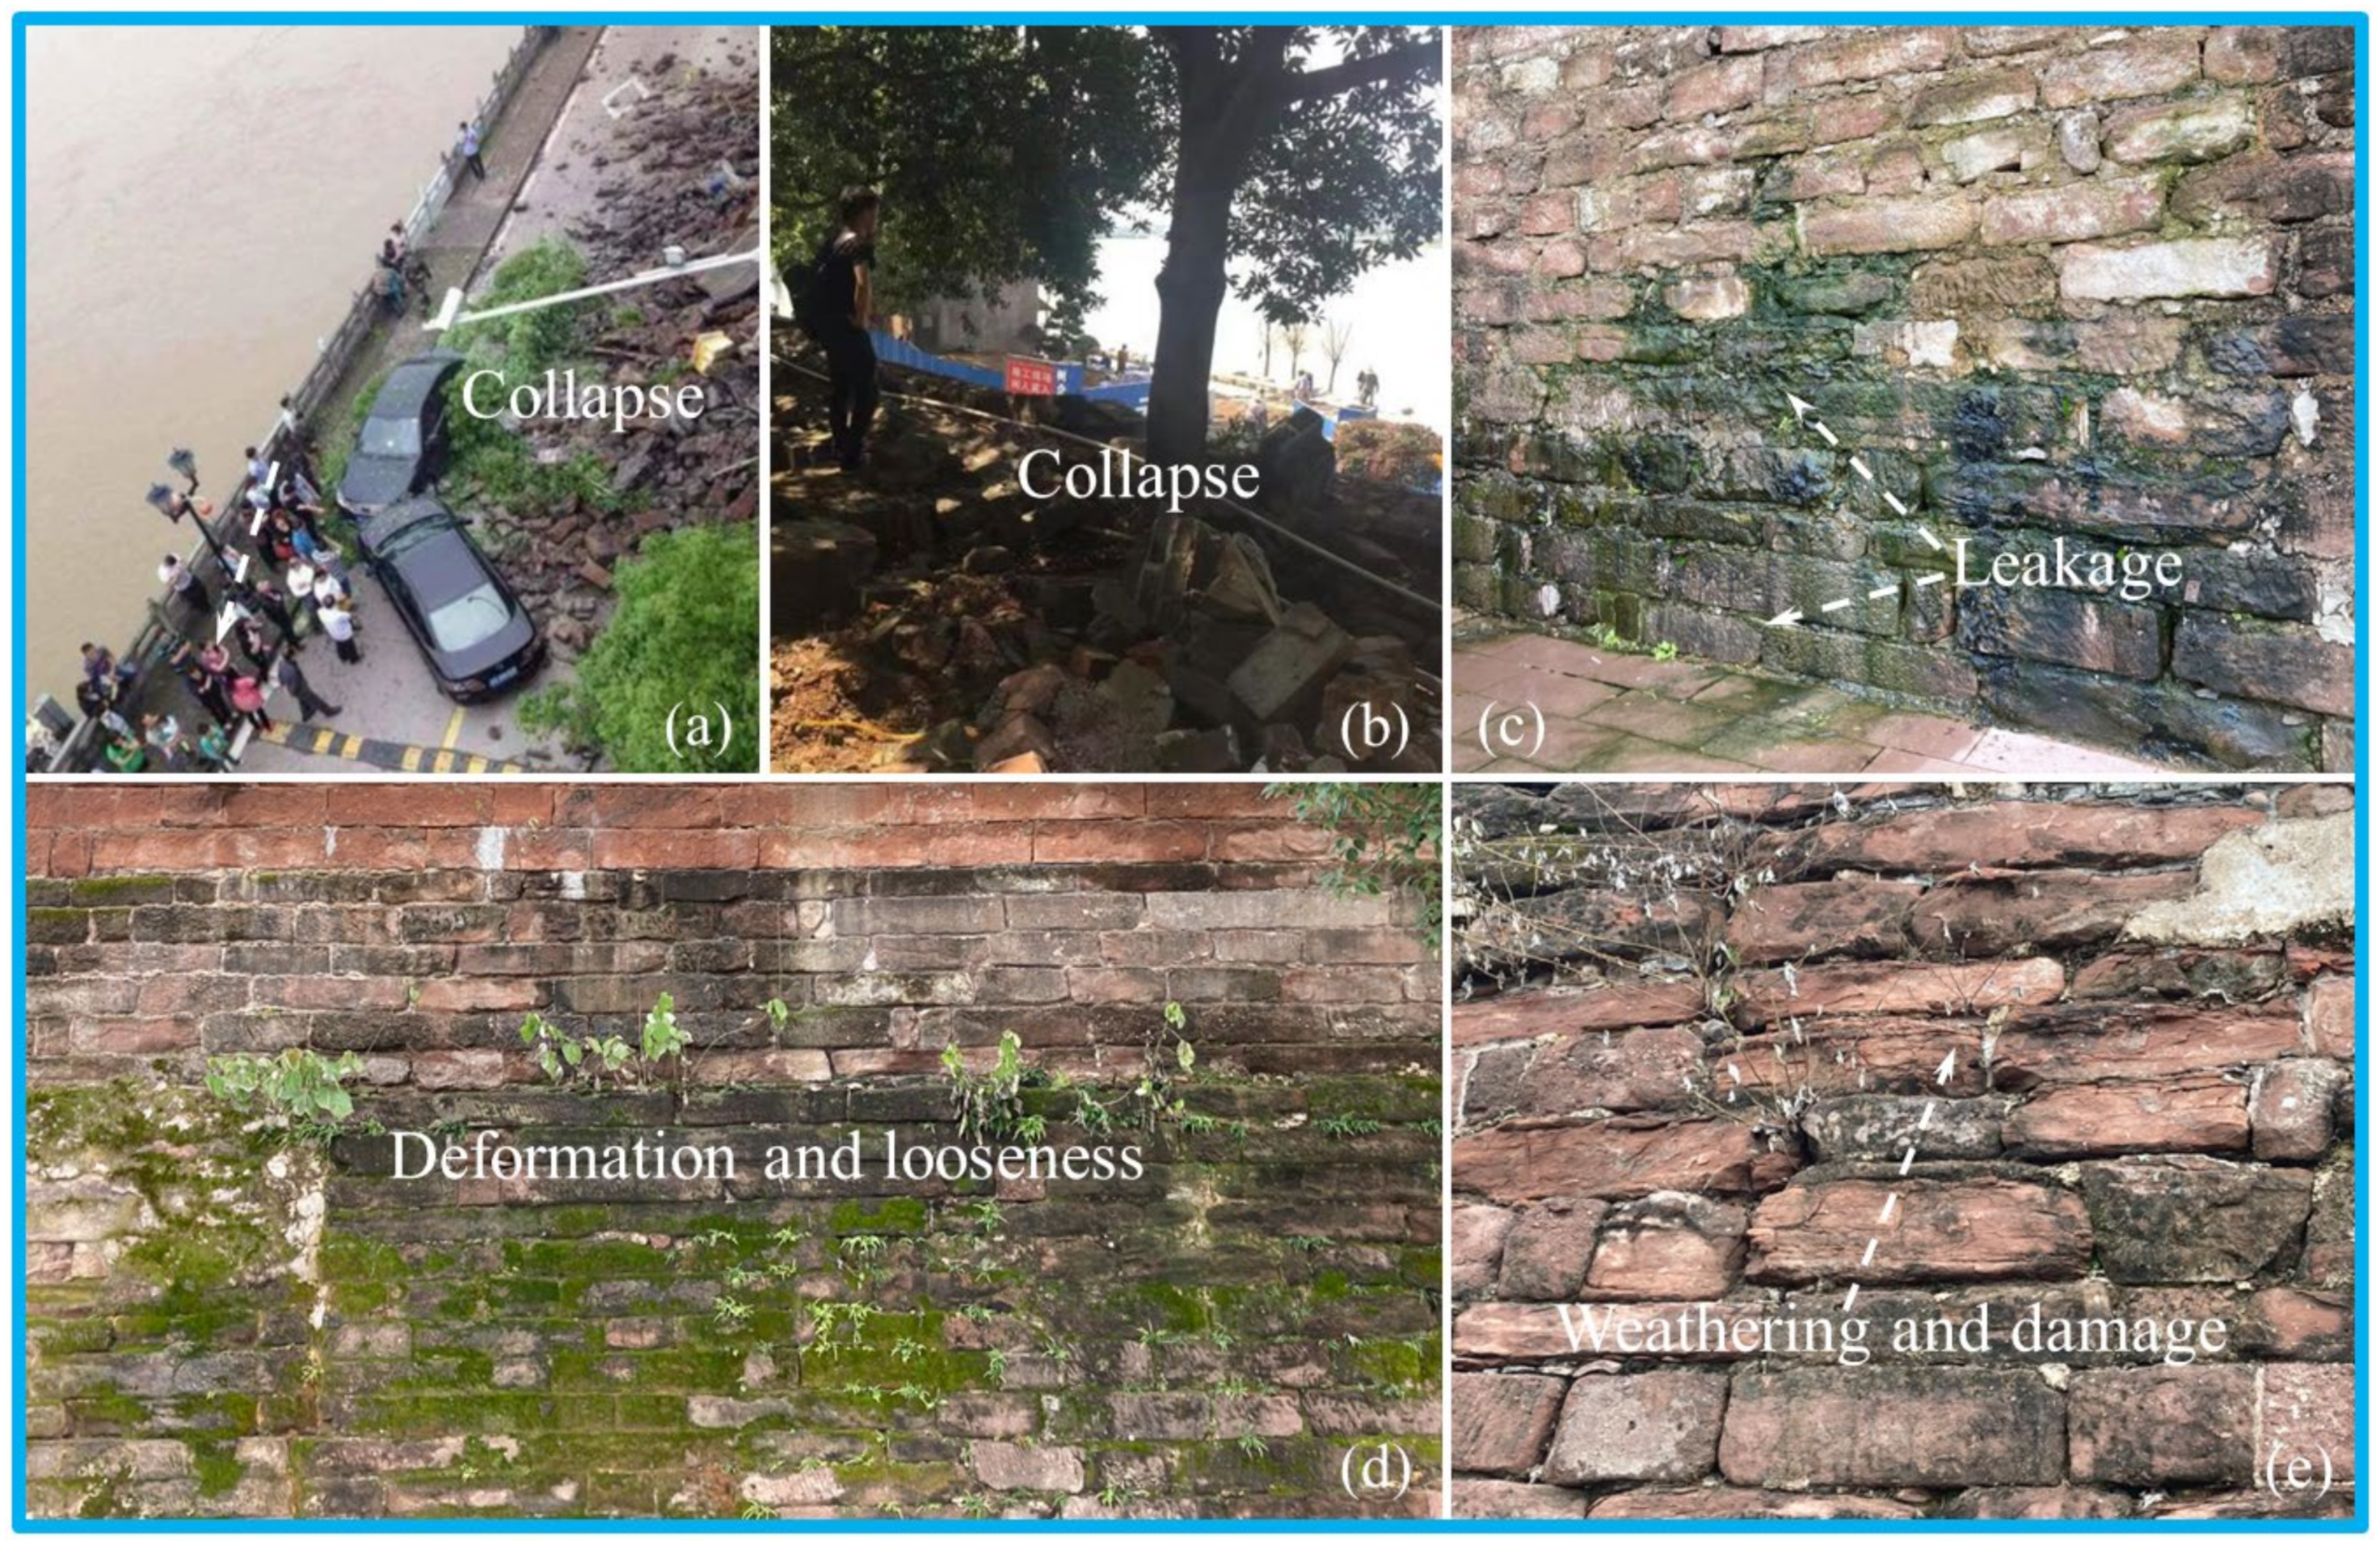
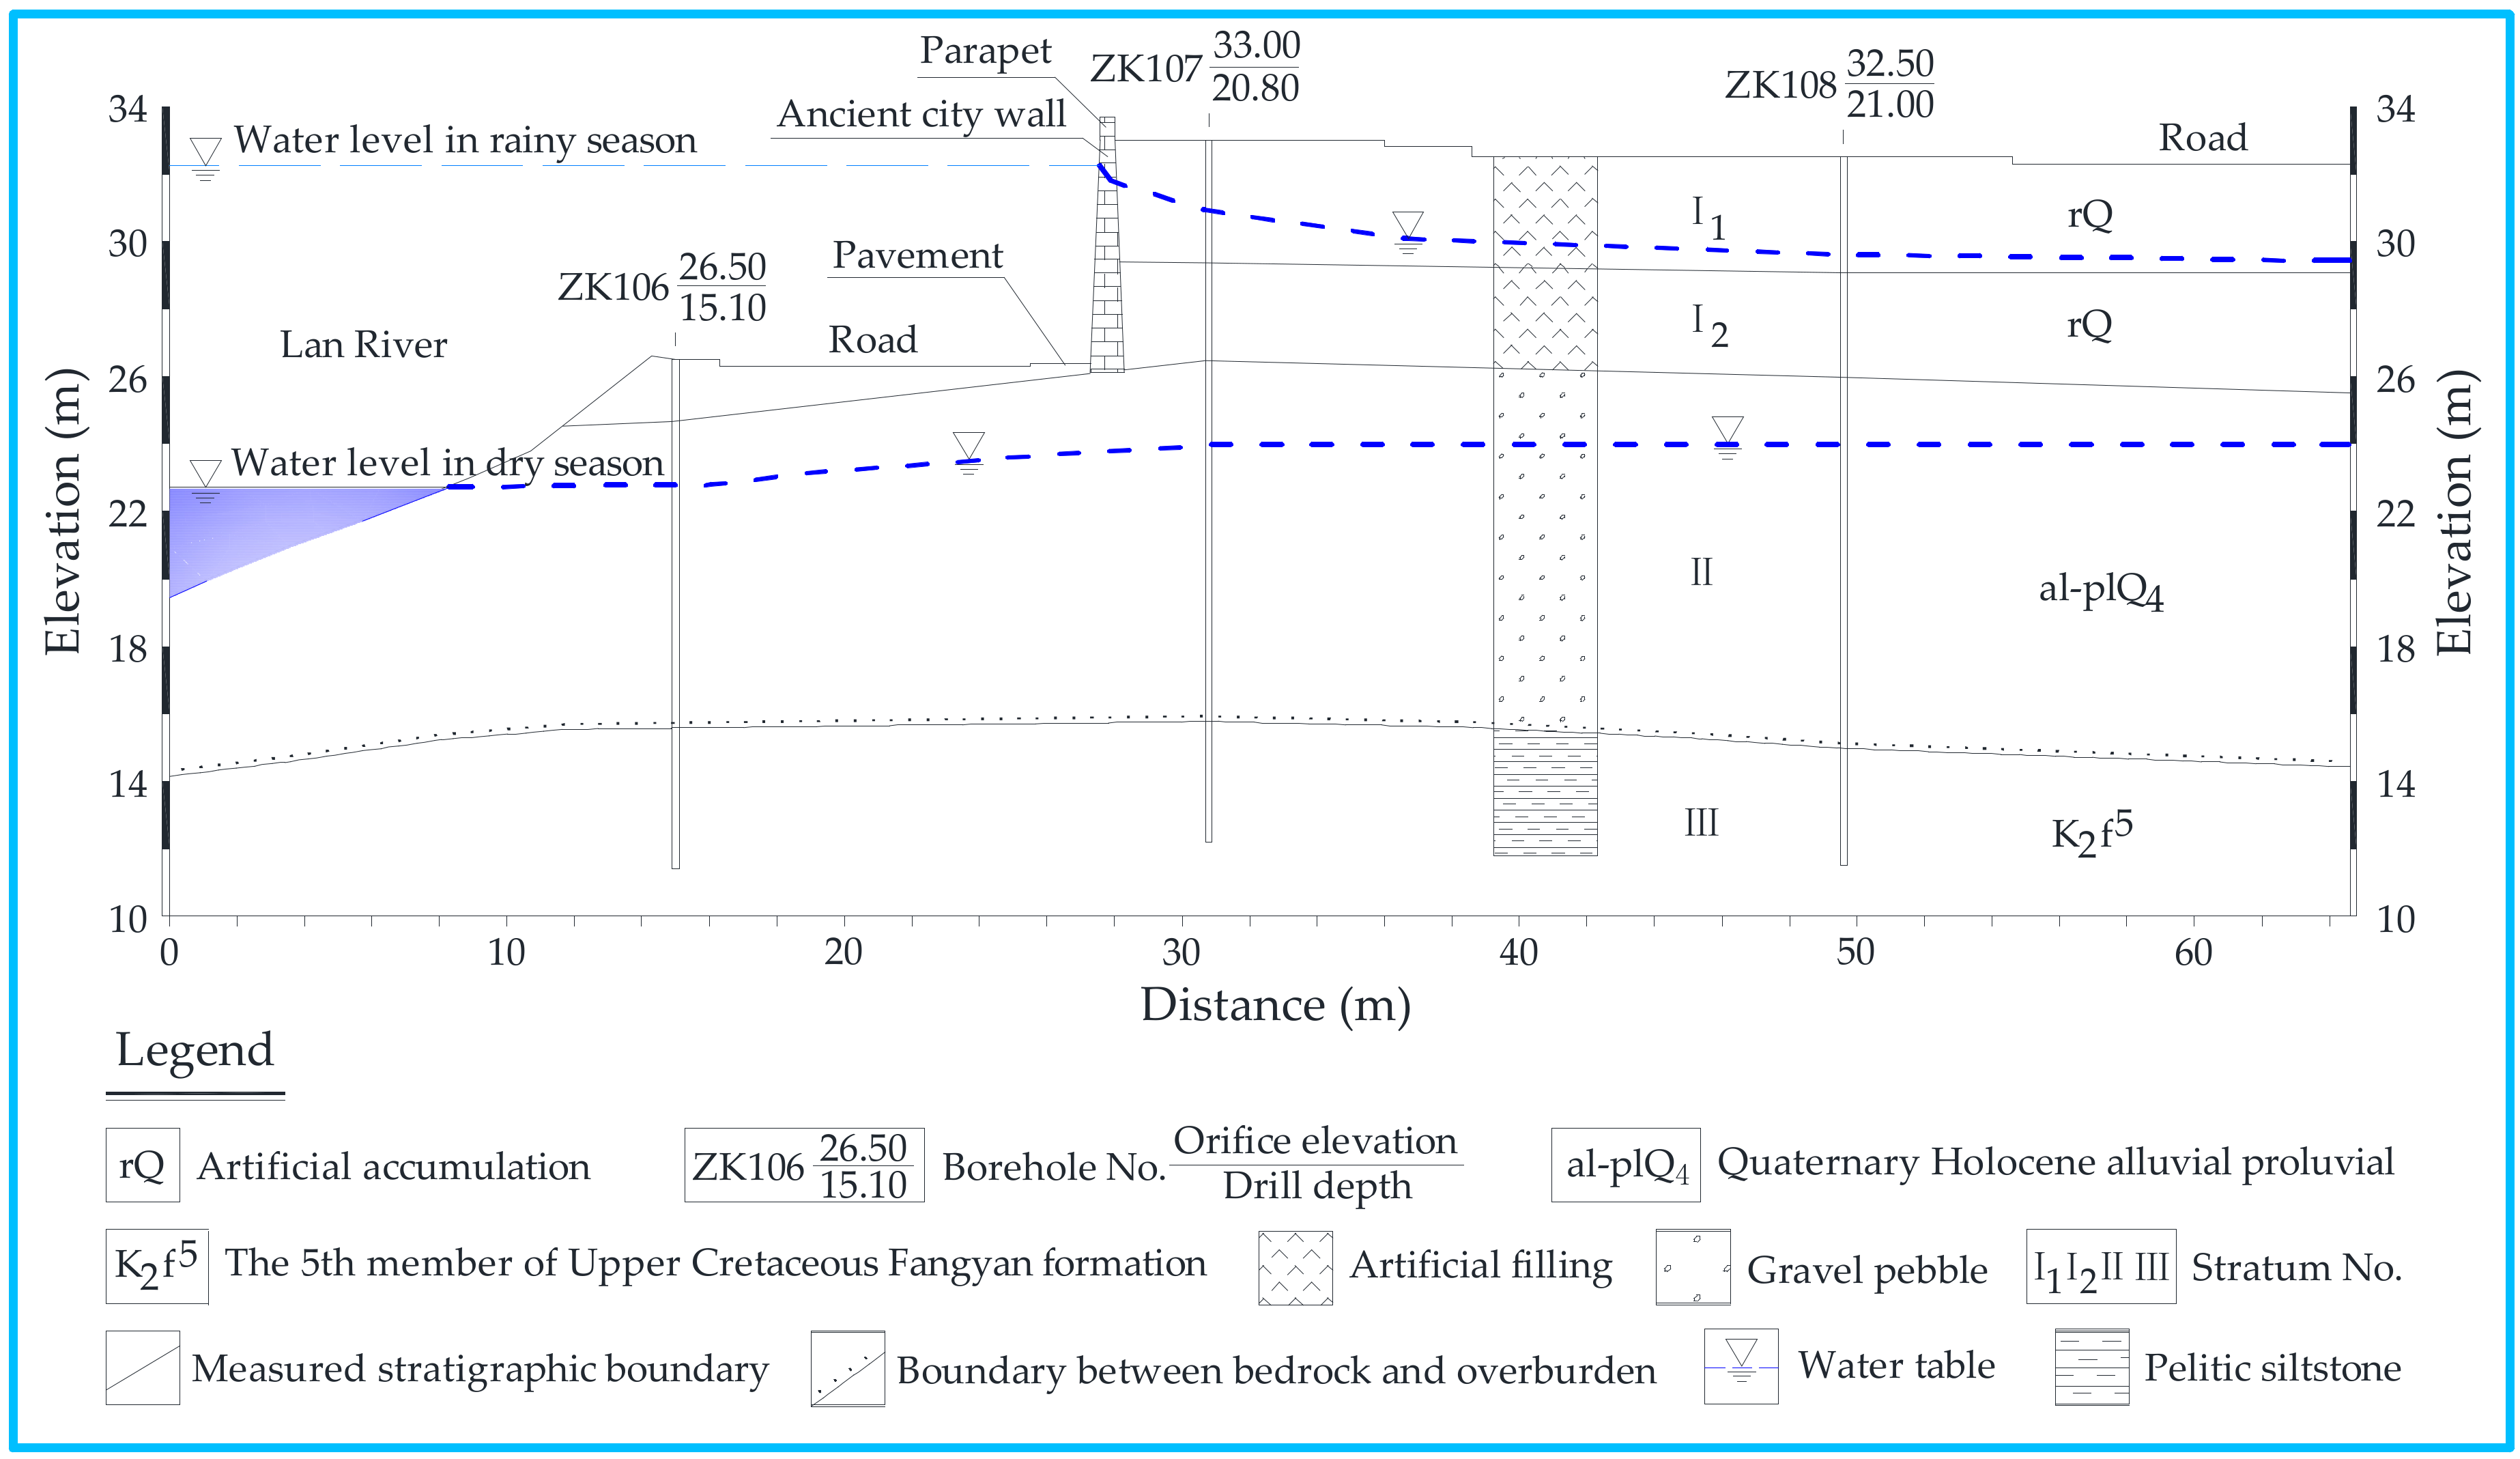
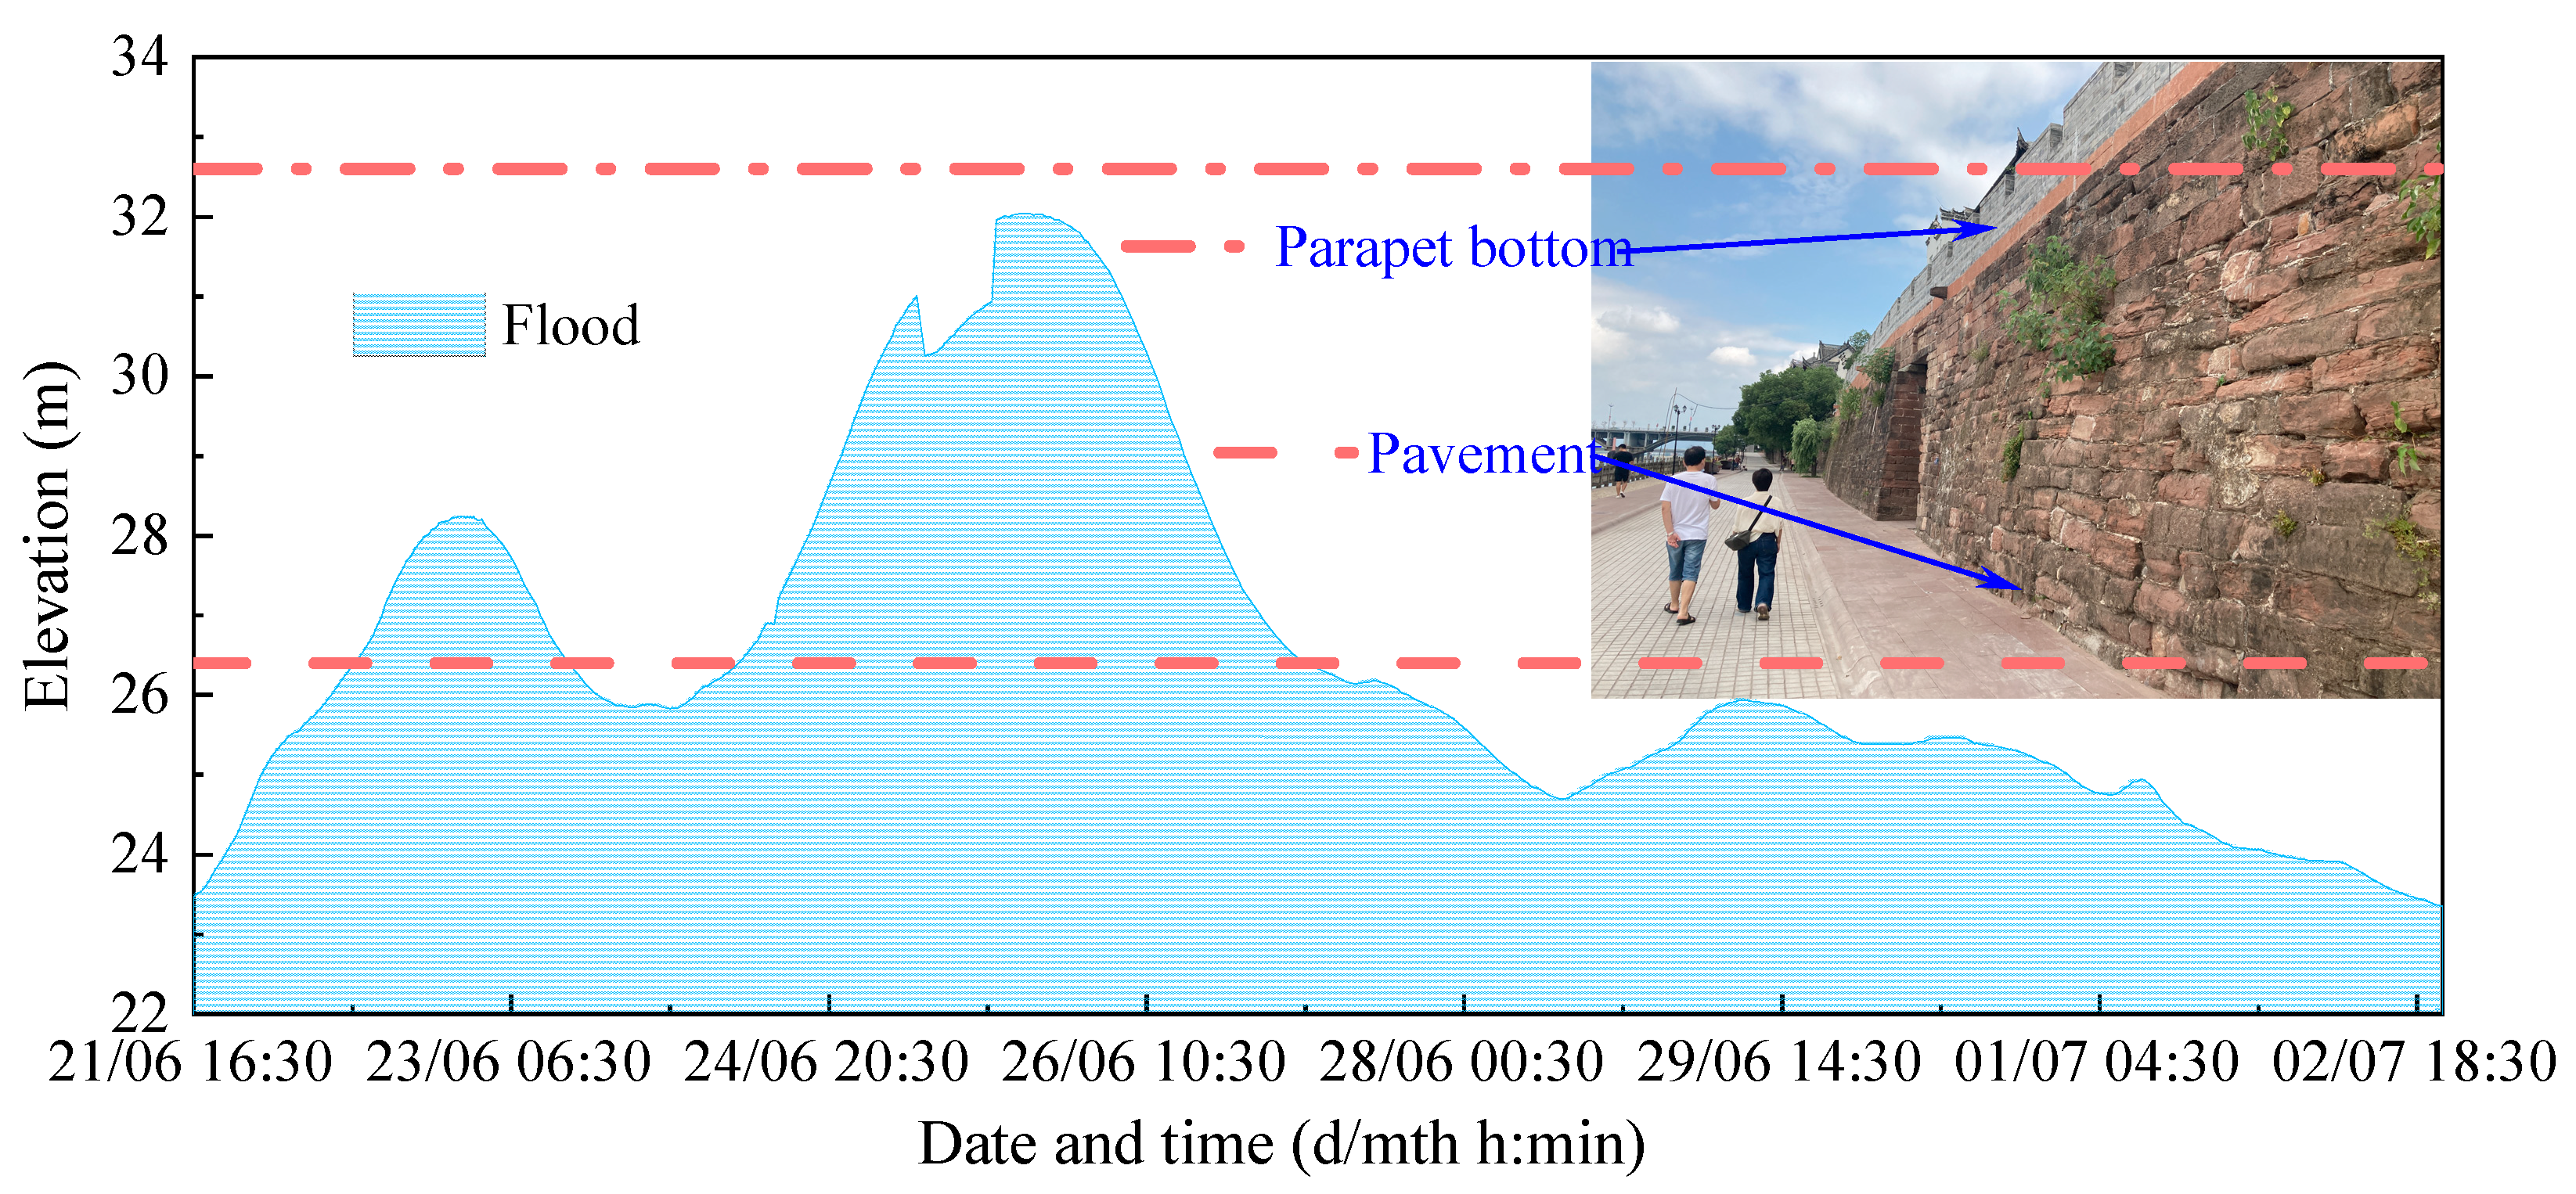
2. Overview of Study Project
3. Methods and Materials of Numerical Investigation
3.1. Theory of Calculation
3.1.1. Theory of Seepage Calculation
3.1.2. Theory of Stability Calculation
3.2. Numerical Calculation Model
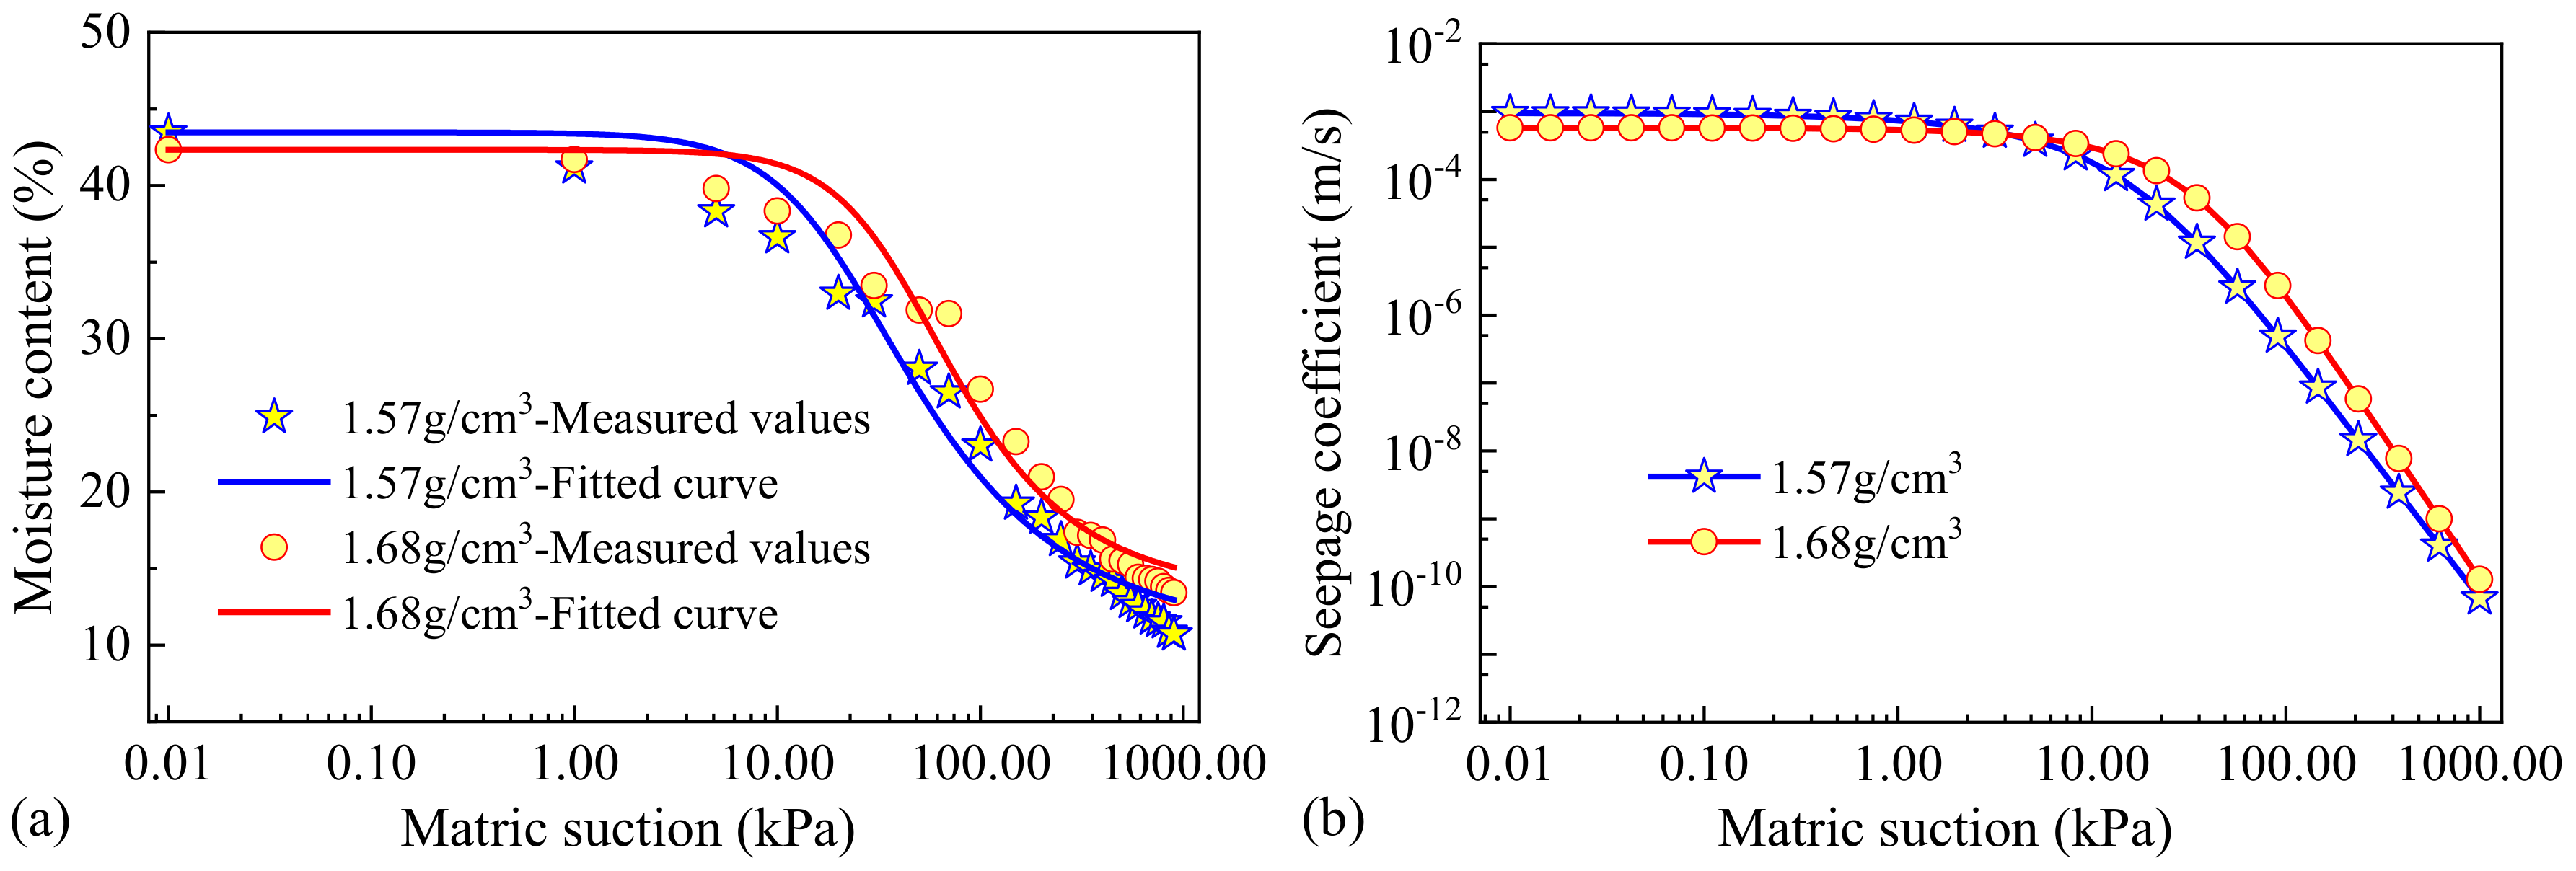
3.2.1. Calculation Parameters
3.2.2. Boundary Conditions of Numerical Model
3.2.3. Calculation Duration
4. Results and Discussions of Numerical Investigation
4.1. Seepage Analyses
4.2. Displacement and Stress Analyses
4.3. Stability Analyses
5. Conclusions
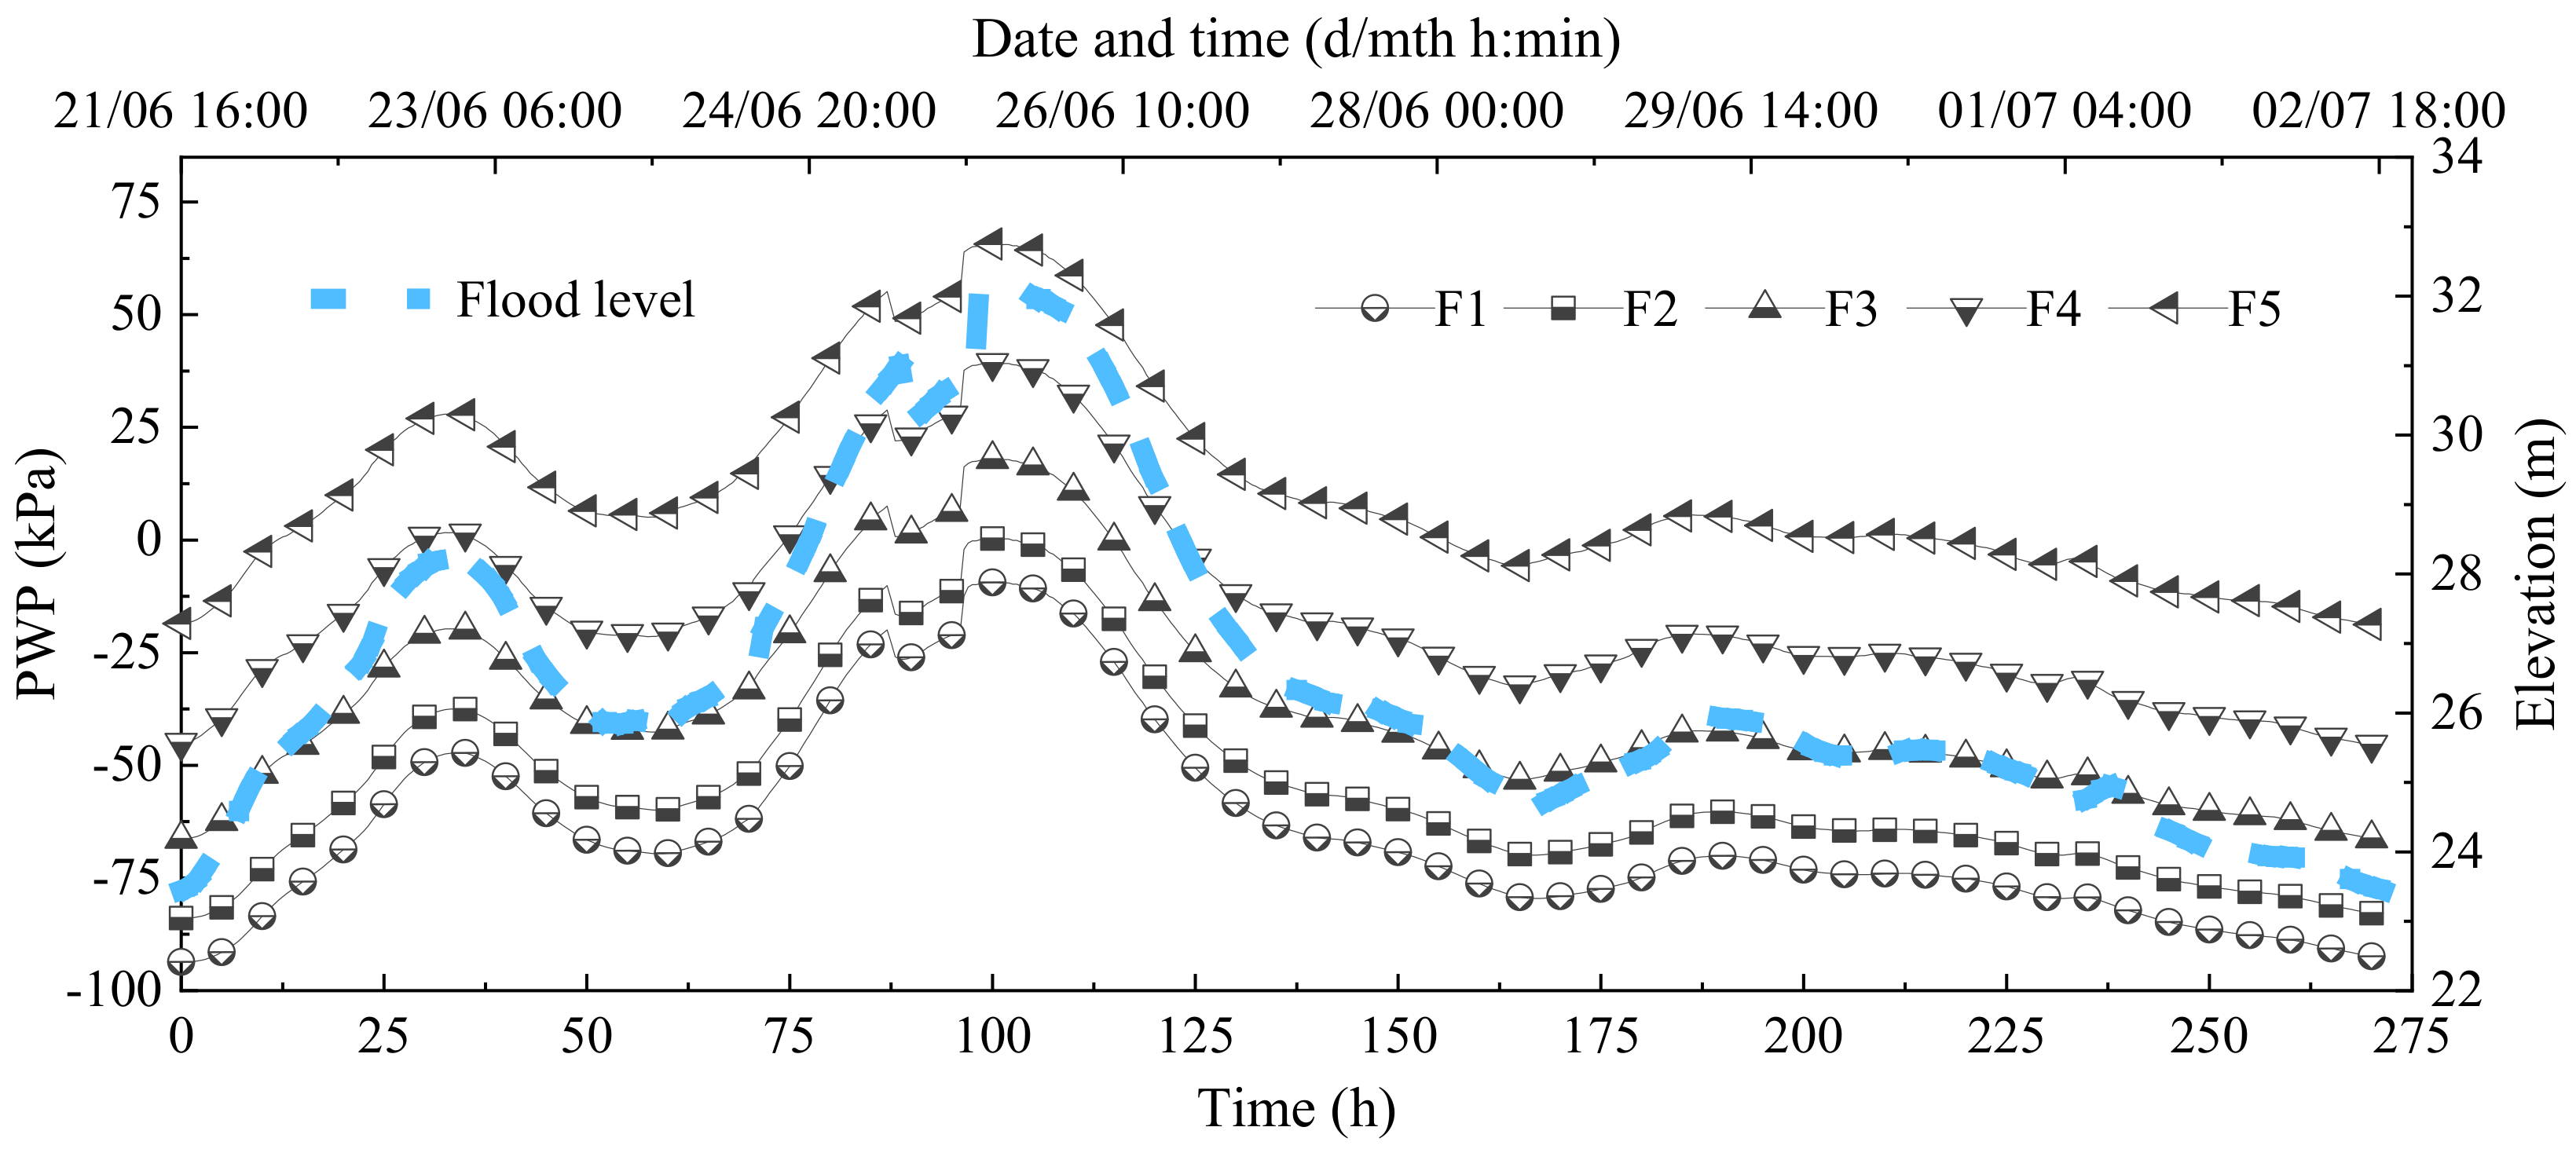
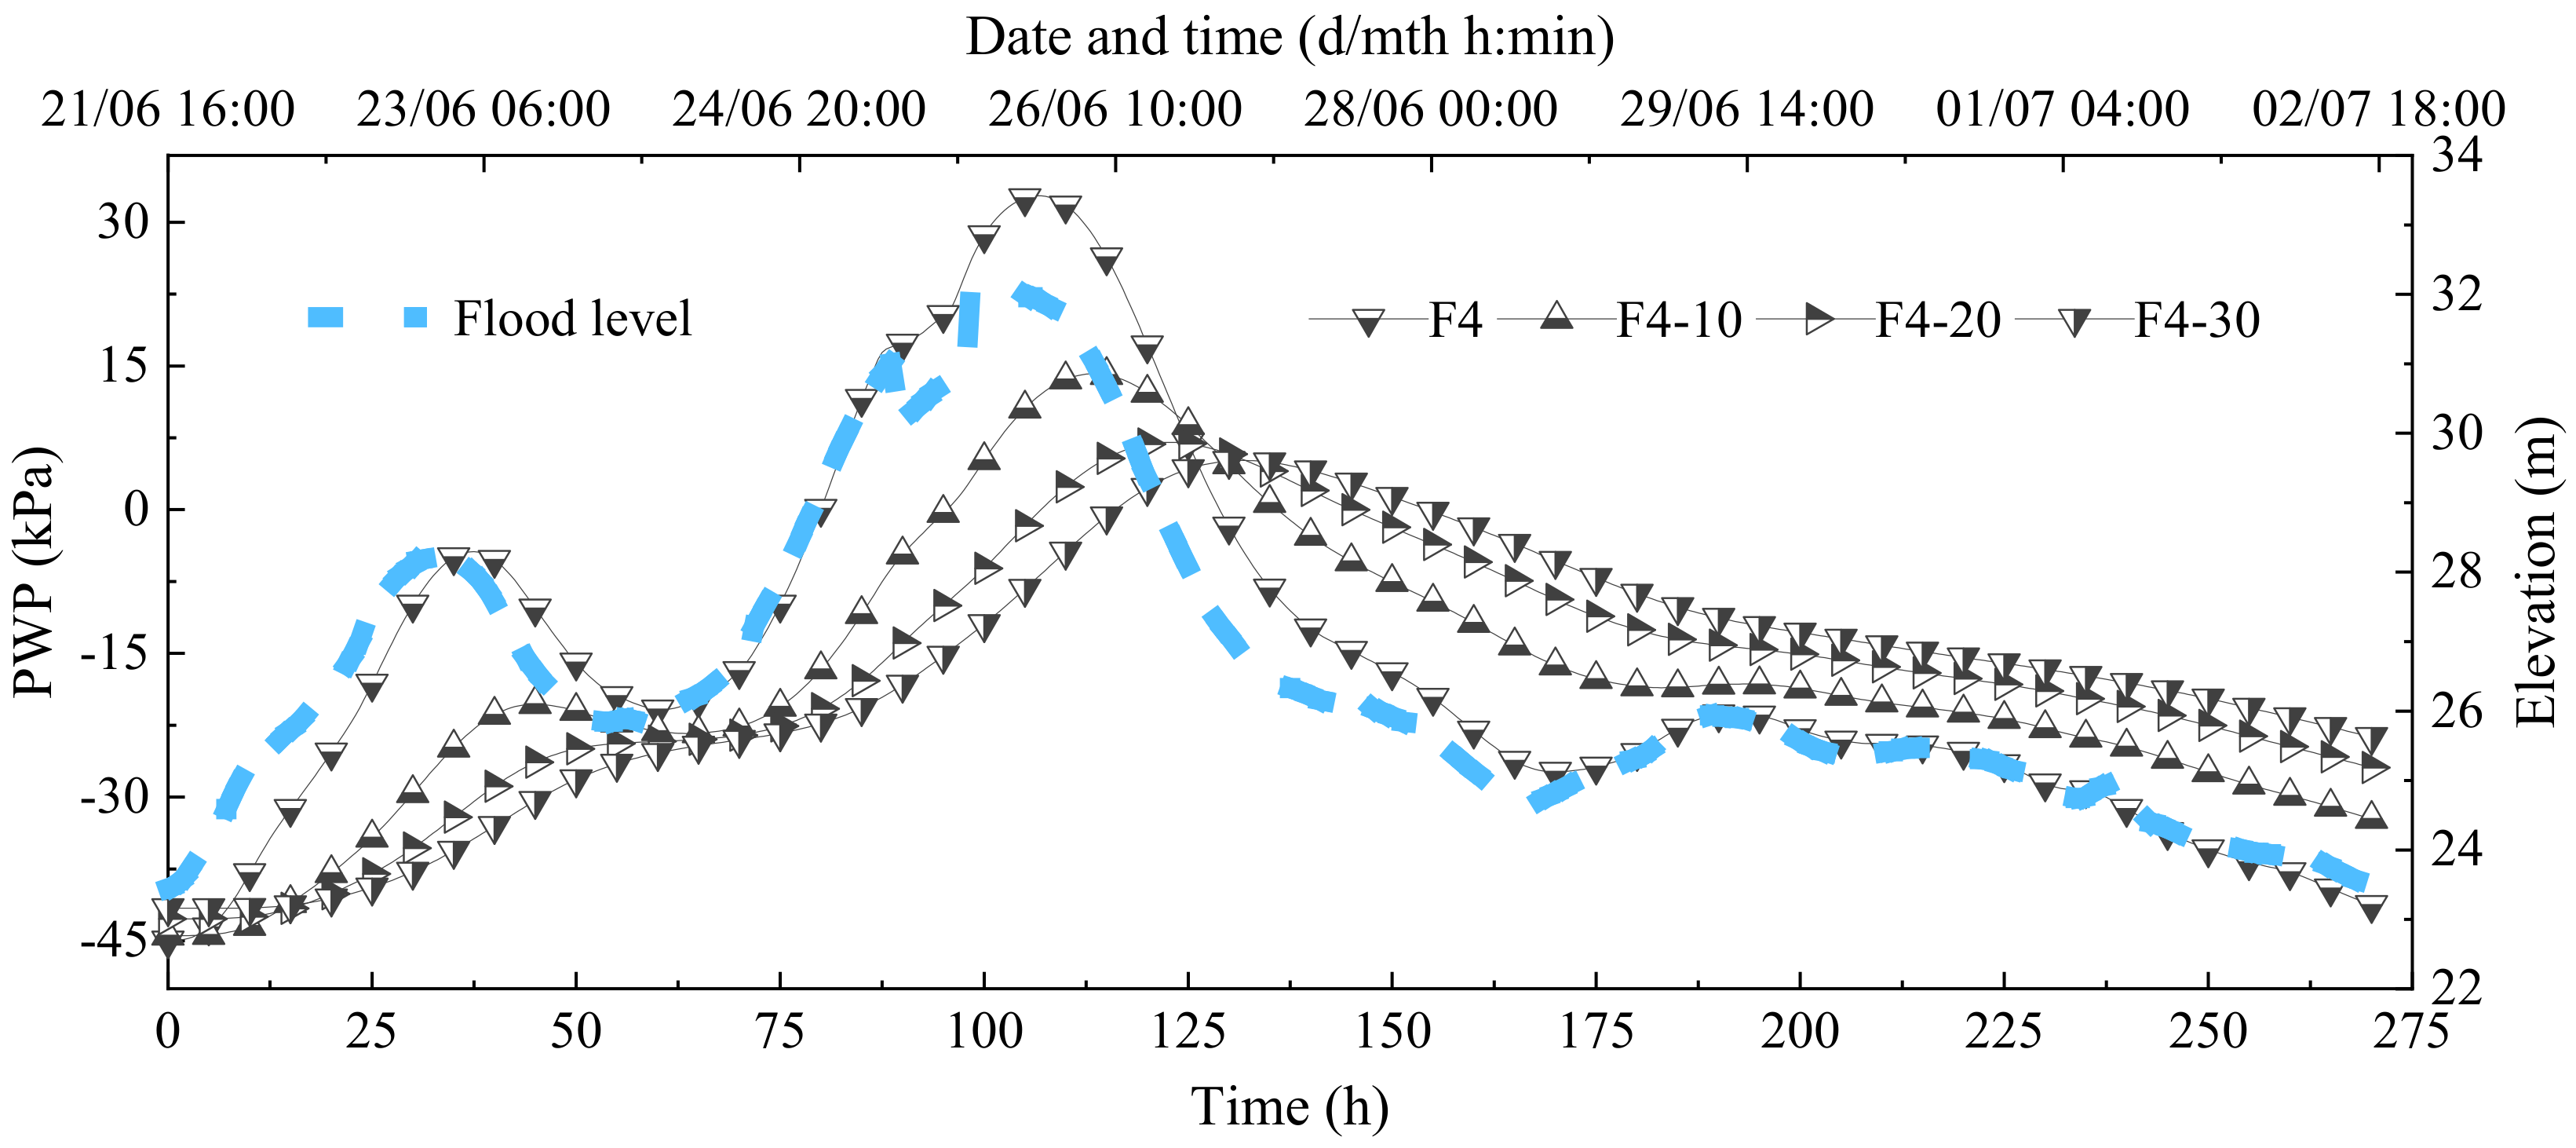
- (1)
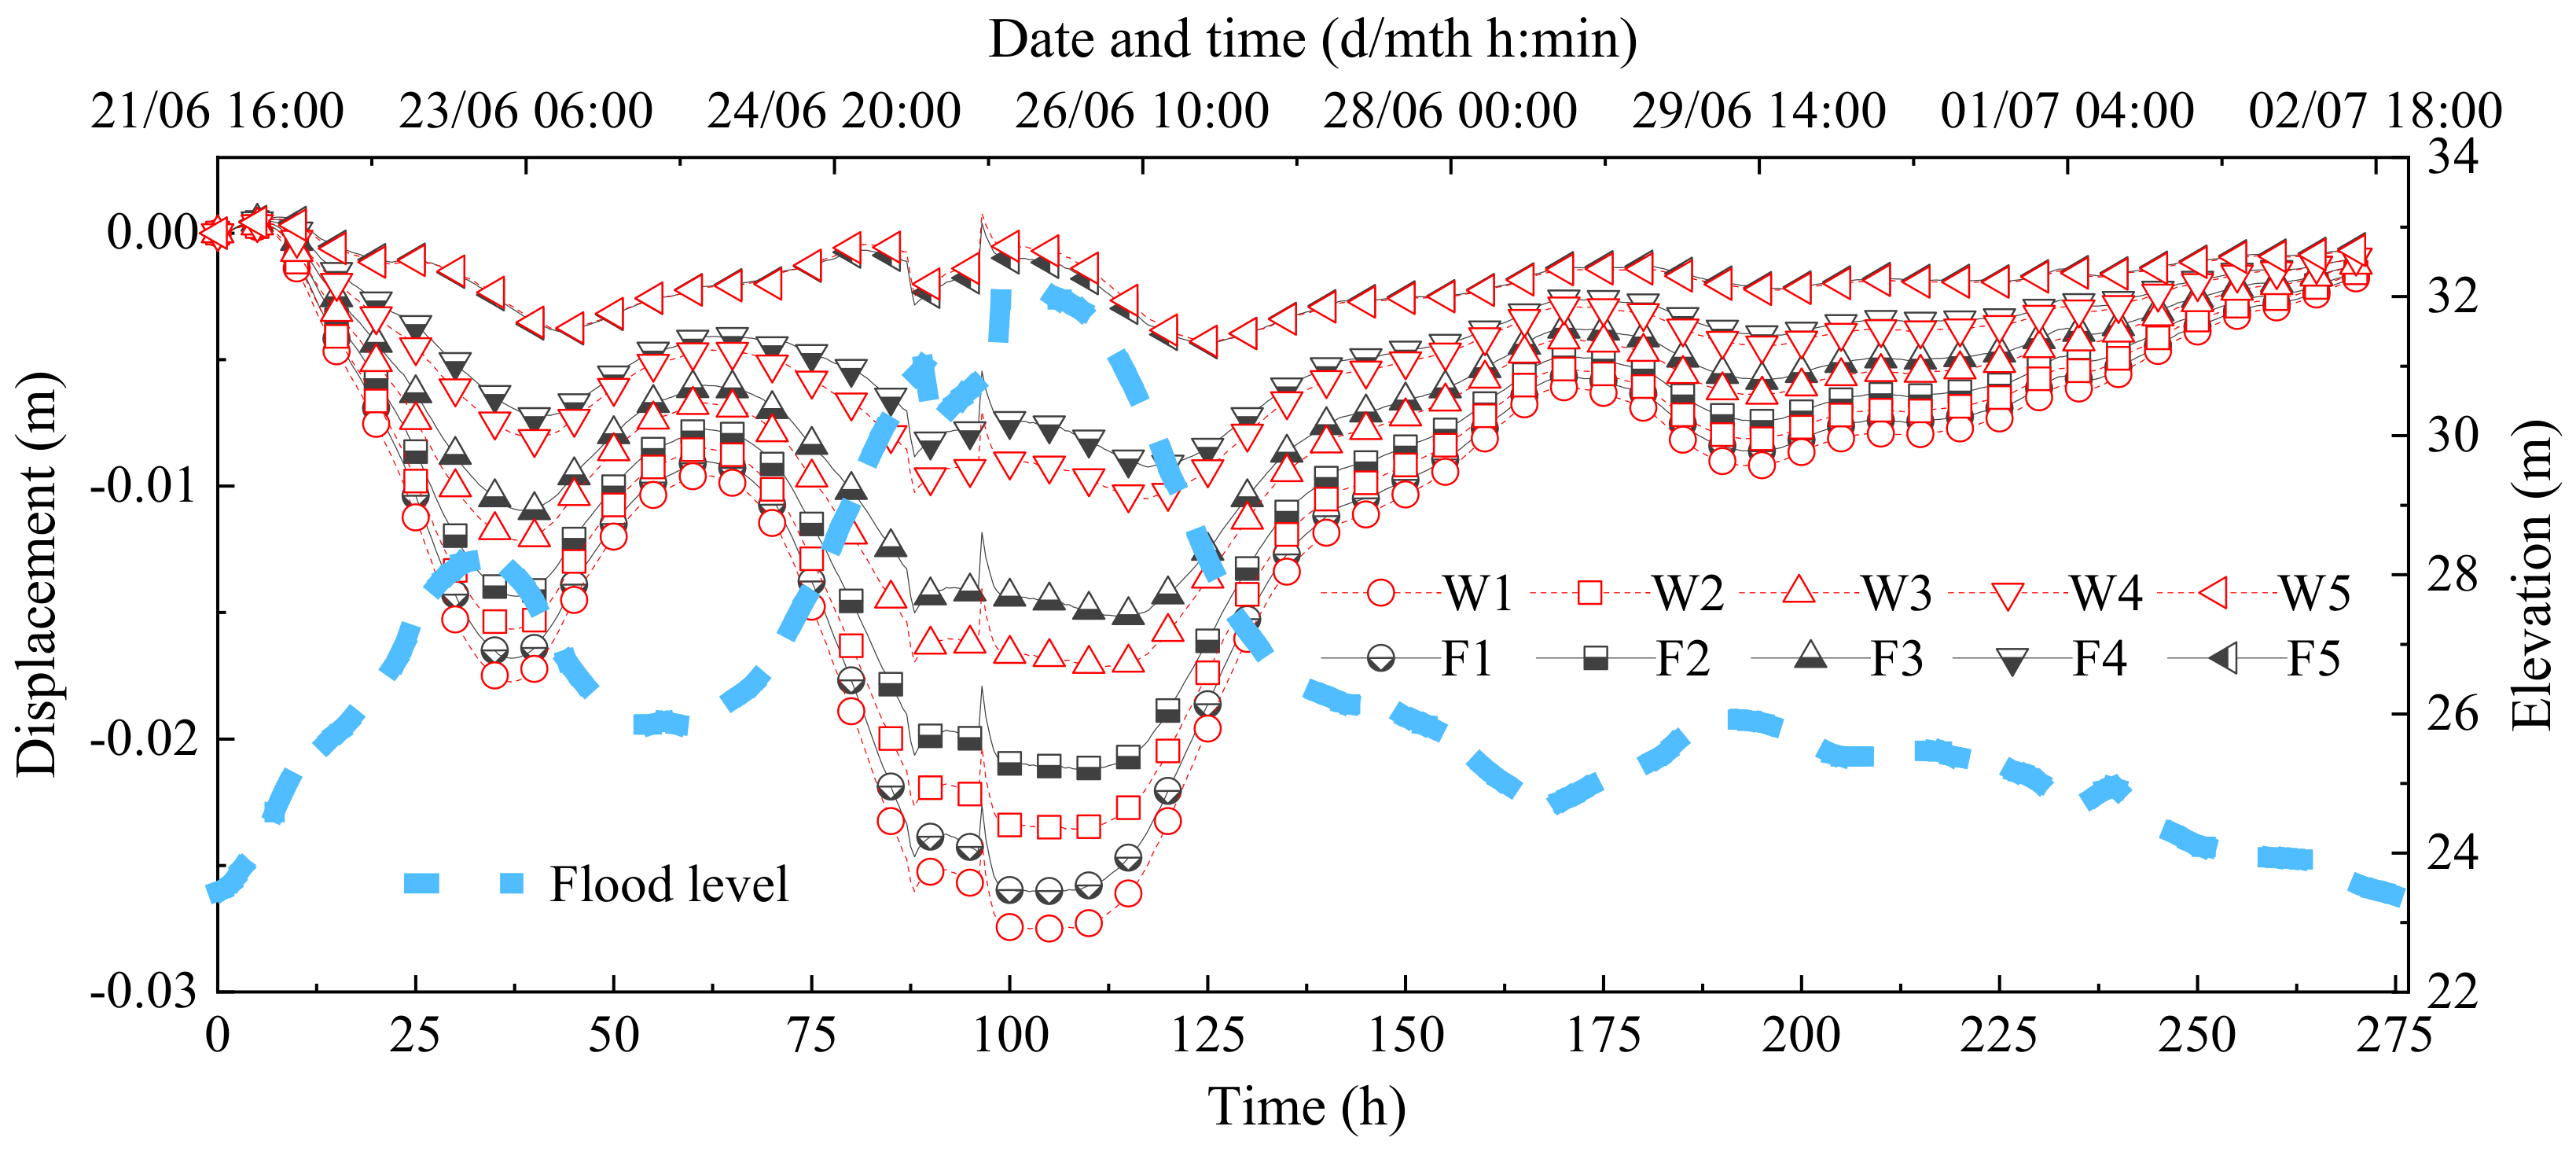
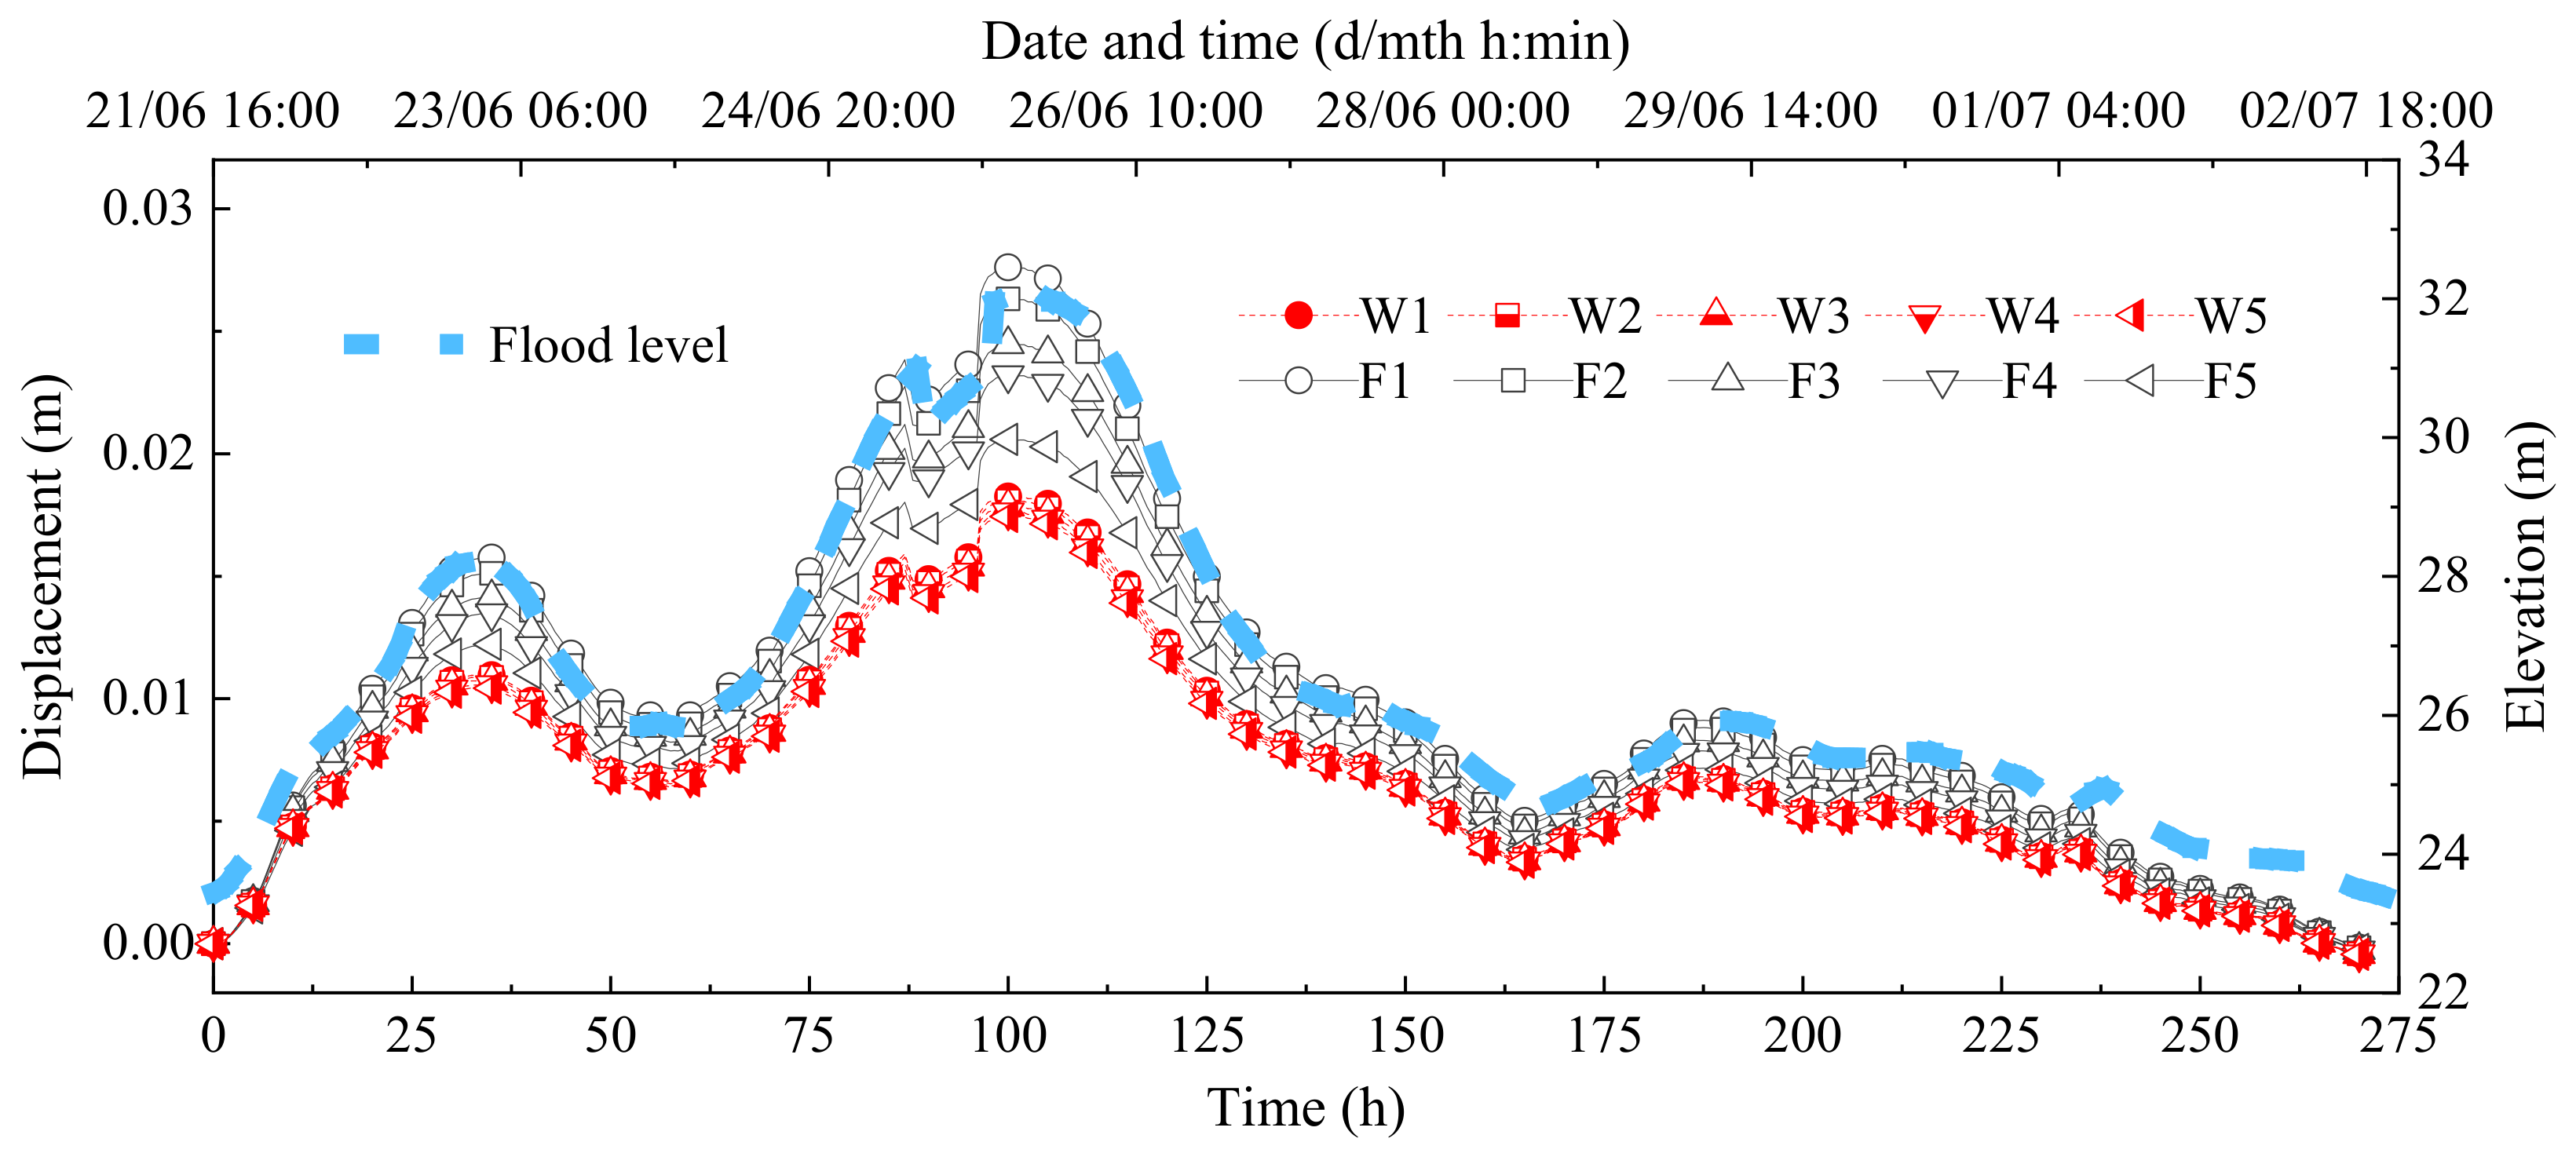
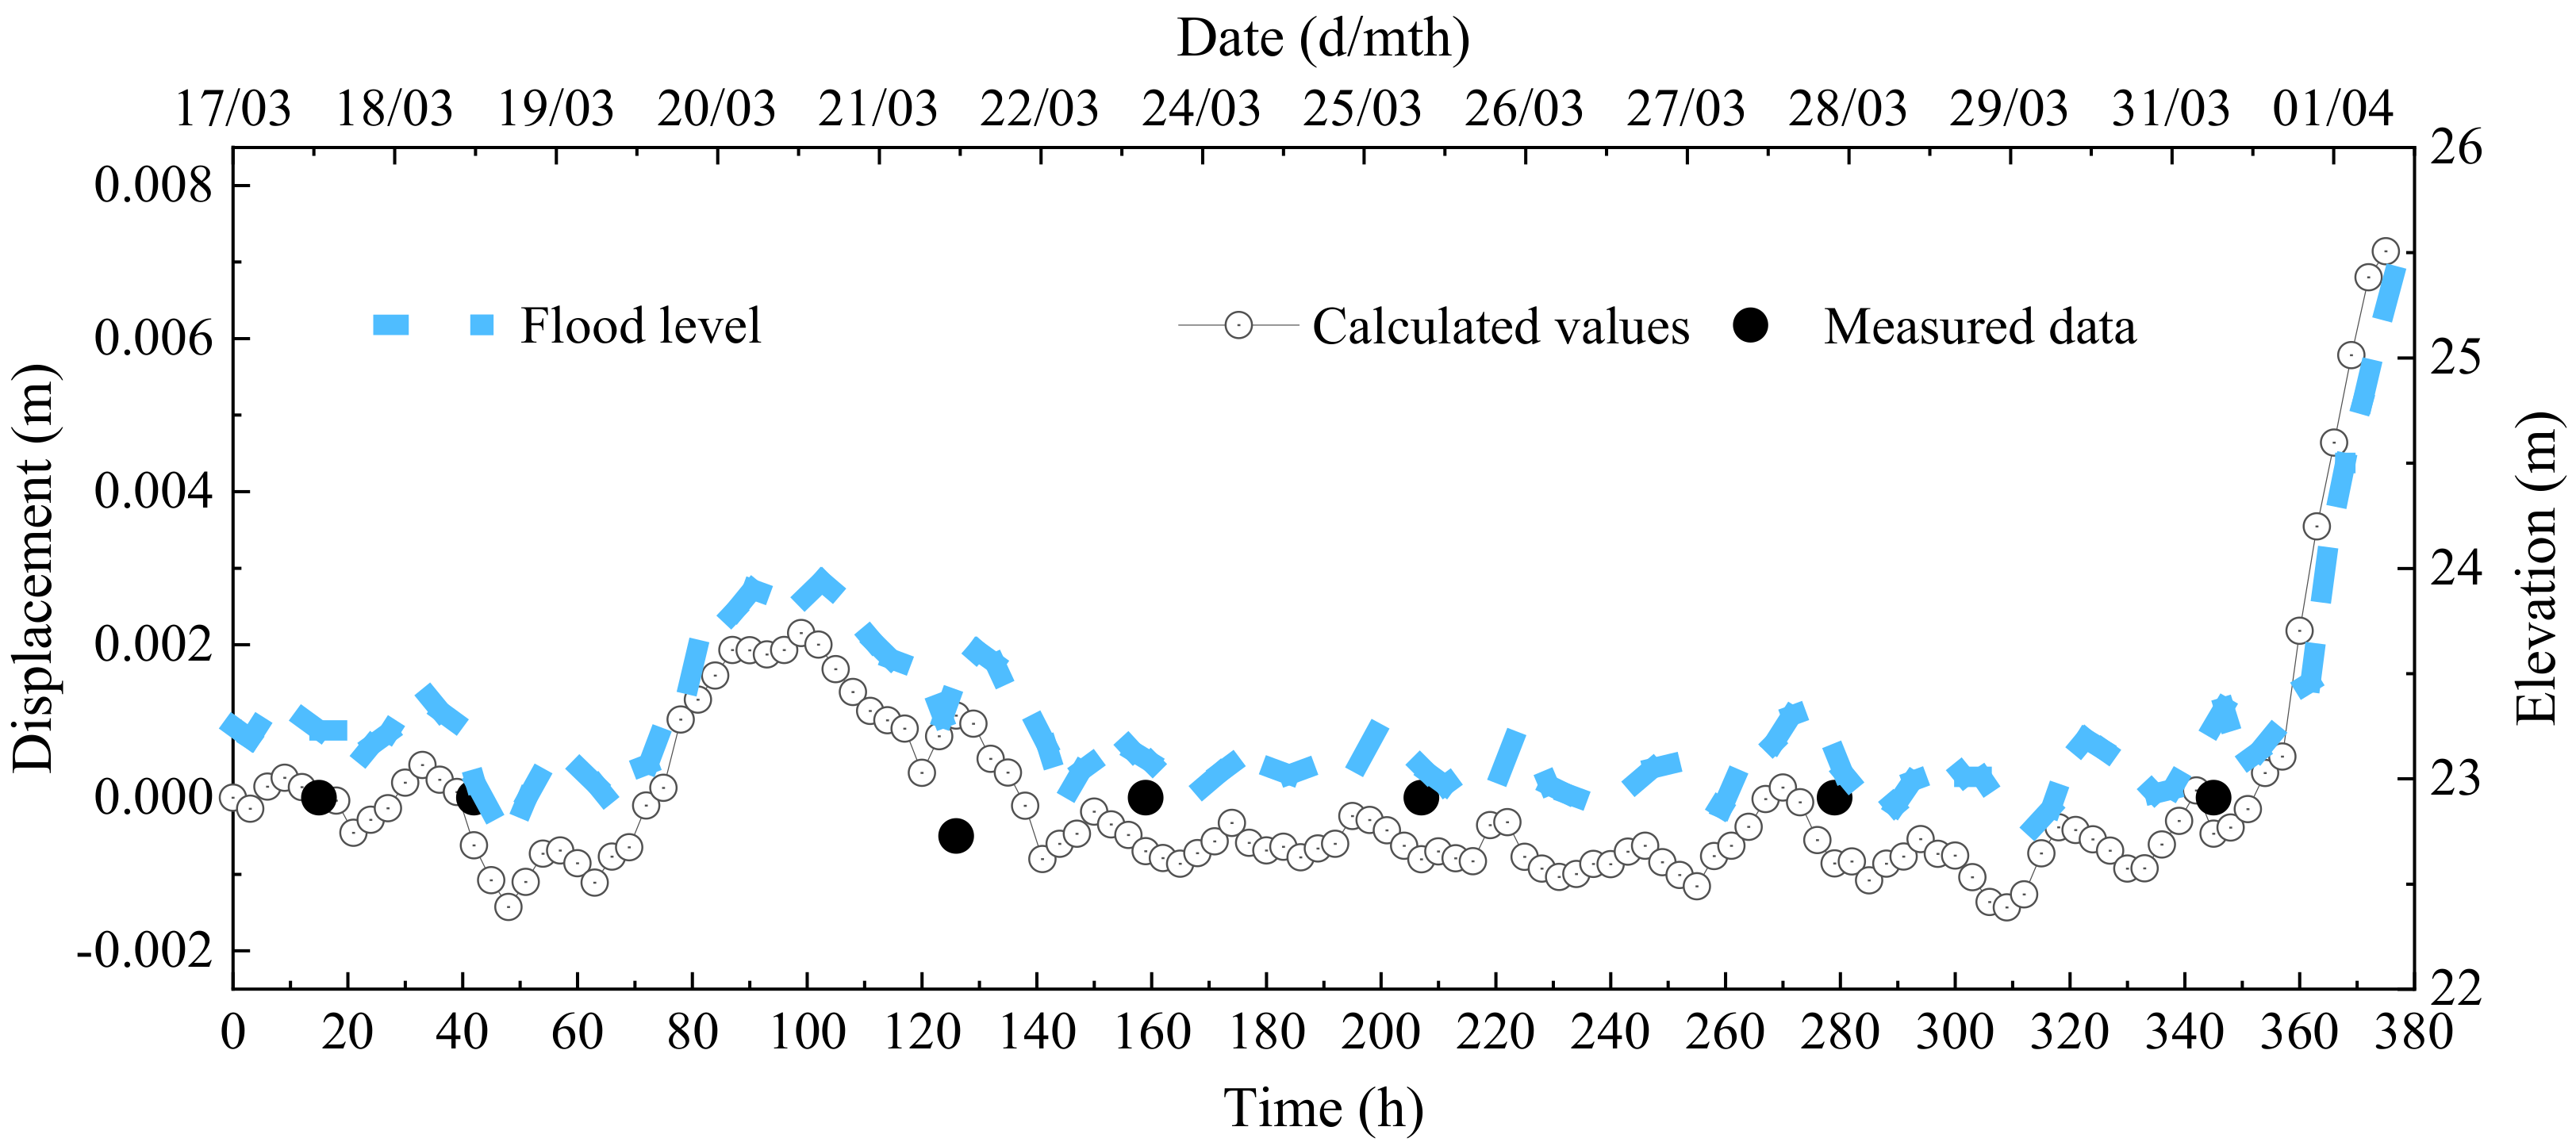
- The changing patterns of the fillings’ PWPs are similar to flood level variations, and the rate and range of changes in their values are slightly reduced compared to those of flood levels. The PWP variations in the lower part of the fillings change more dramatically, and their changing amplitudes gradually decrease when the distance between the soil and the wall increases. Meanwhile, the displacement changes of the wall are significantly affected by the deformation of the backfill soil during flood propagation period. The maximal displacement in the horizontal direction is mainly caused by soil extrusion, and that in the vertical direction is primarily caused by soil seepage deformation. When reinforcing the waterfront ancient city walls, the influence of seepage should be fully considered, and anti-seepage and drainage facilities should be reasonably set up.
- (2)
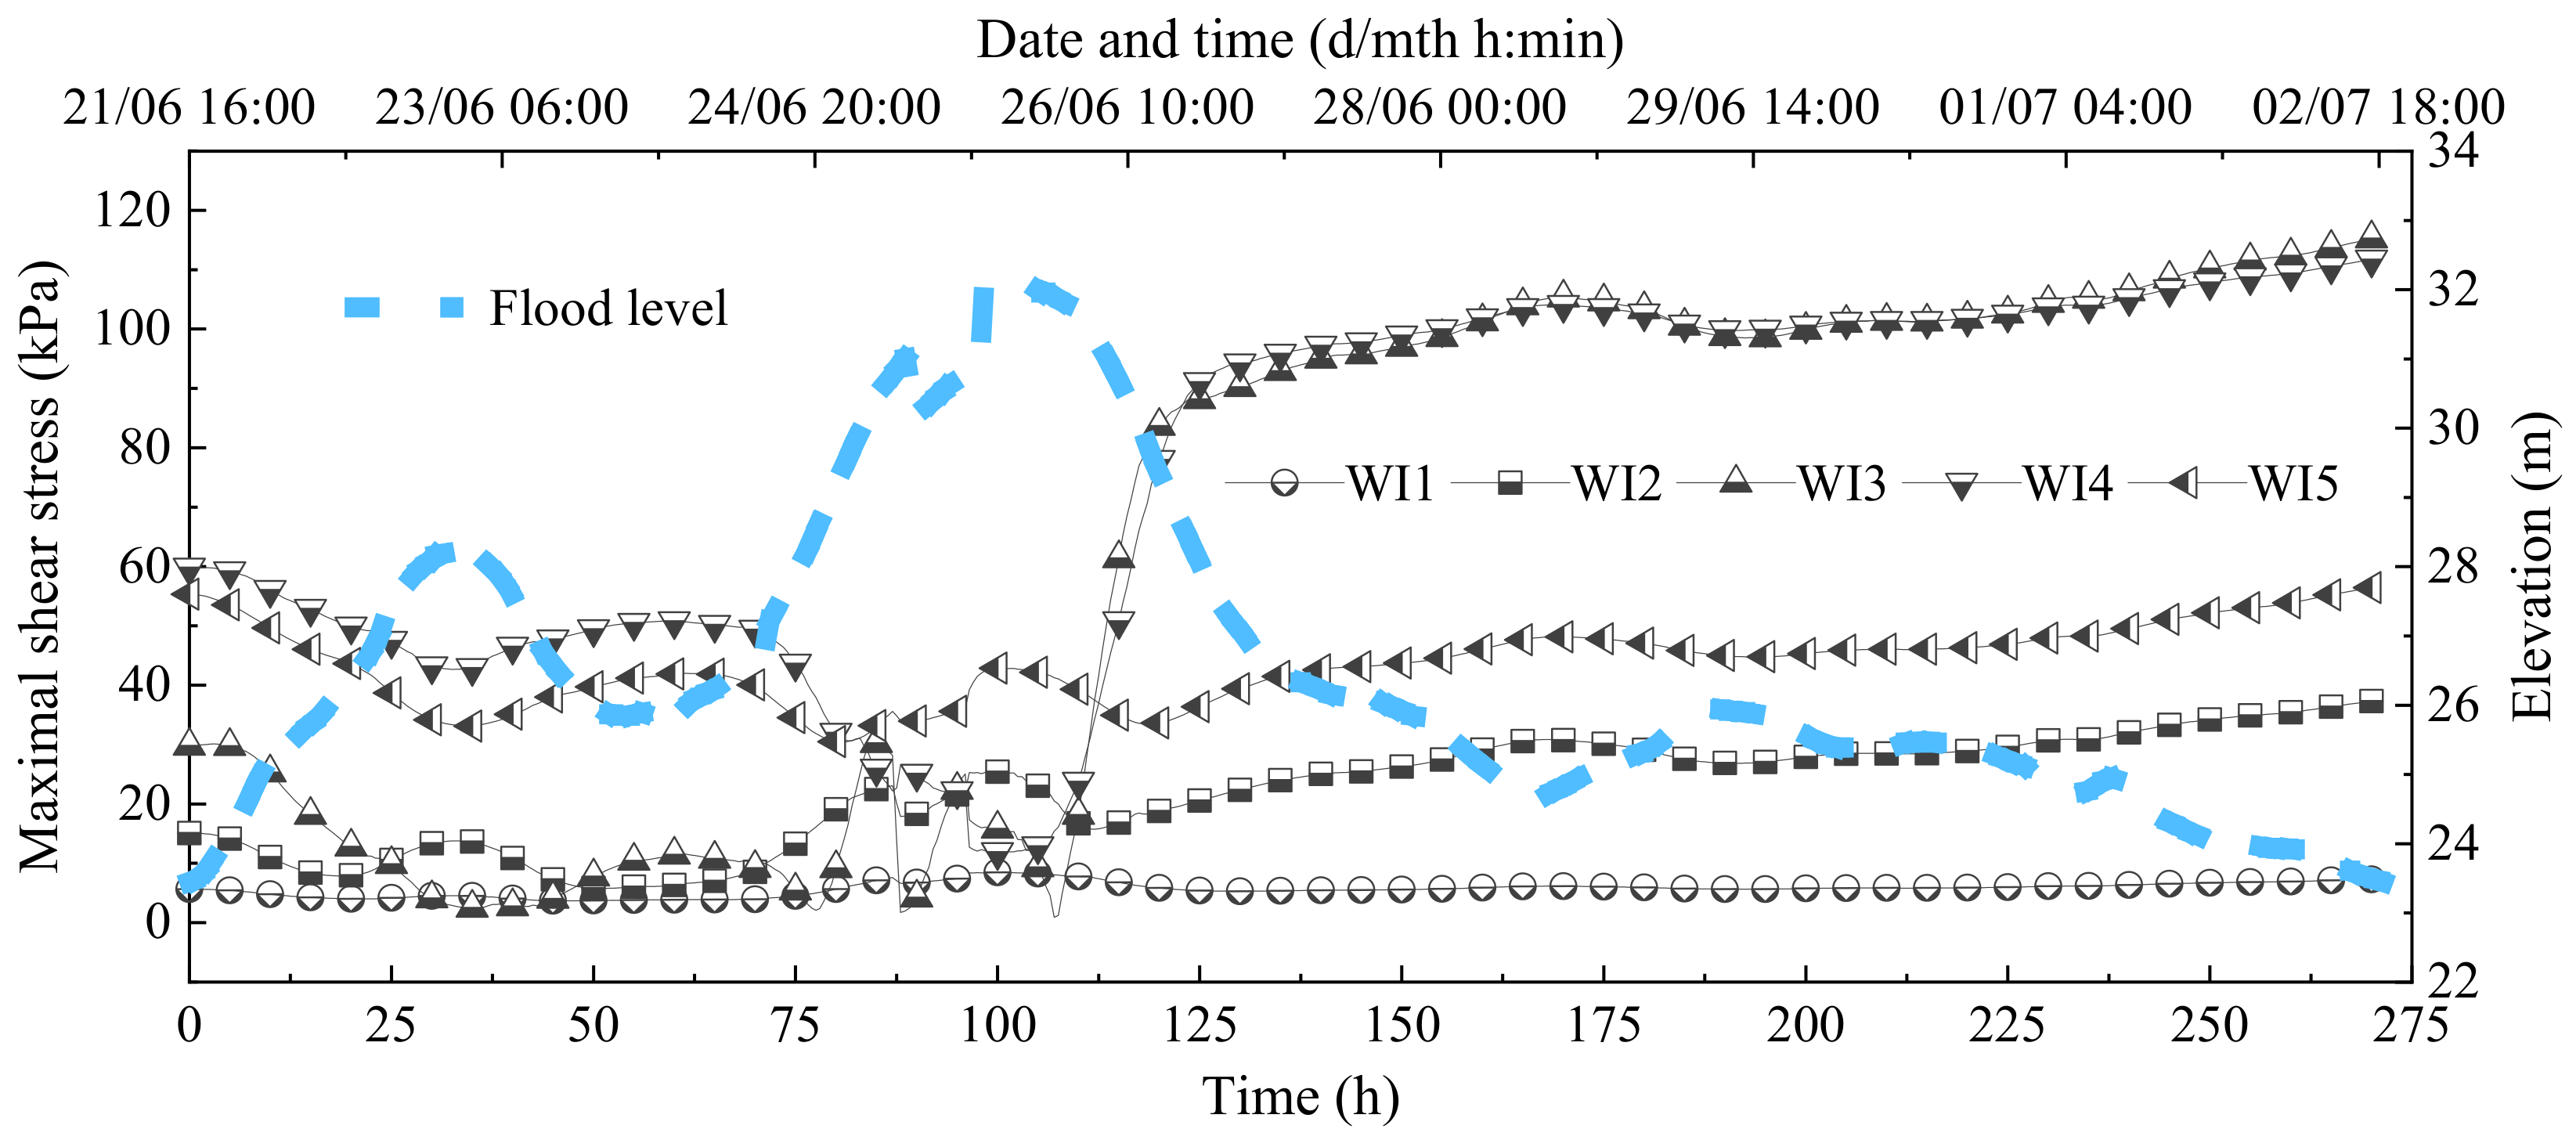
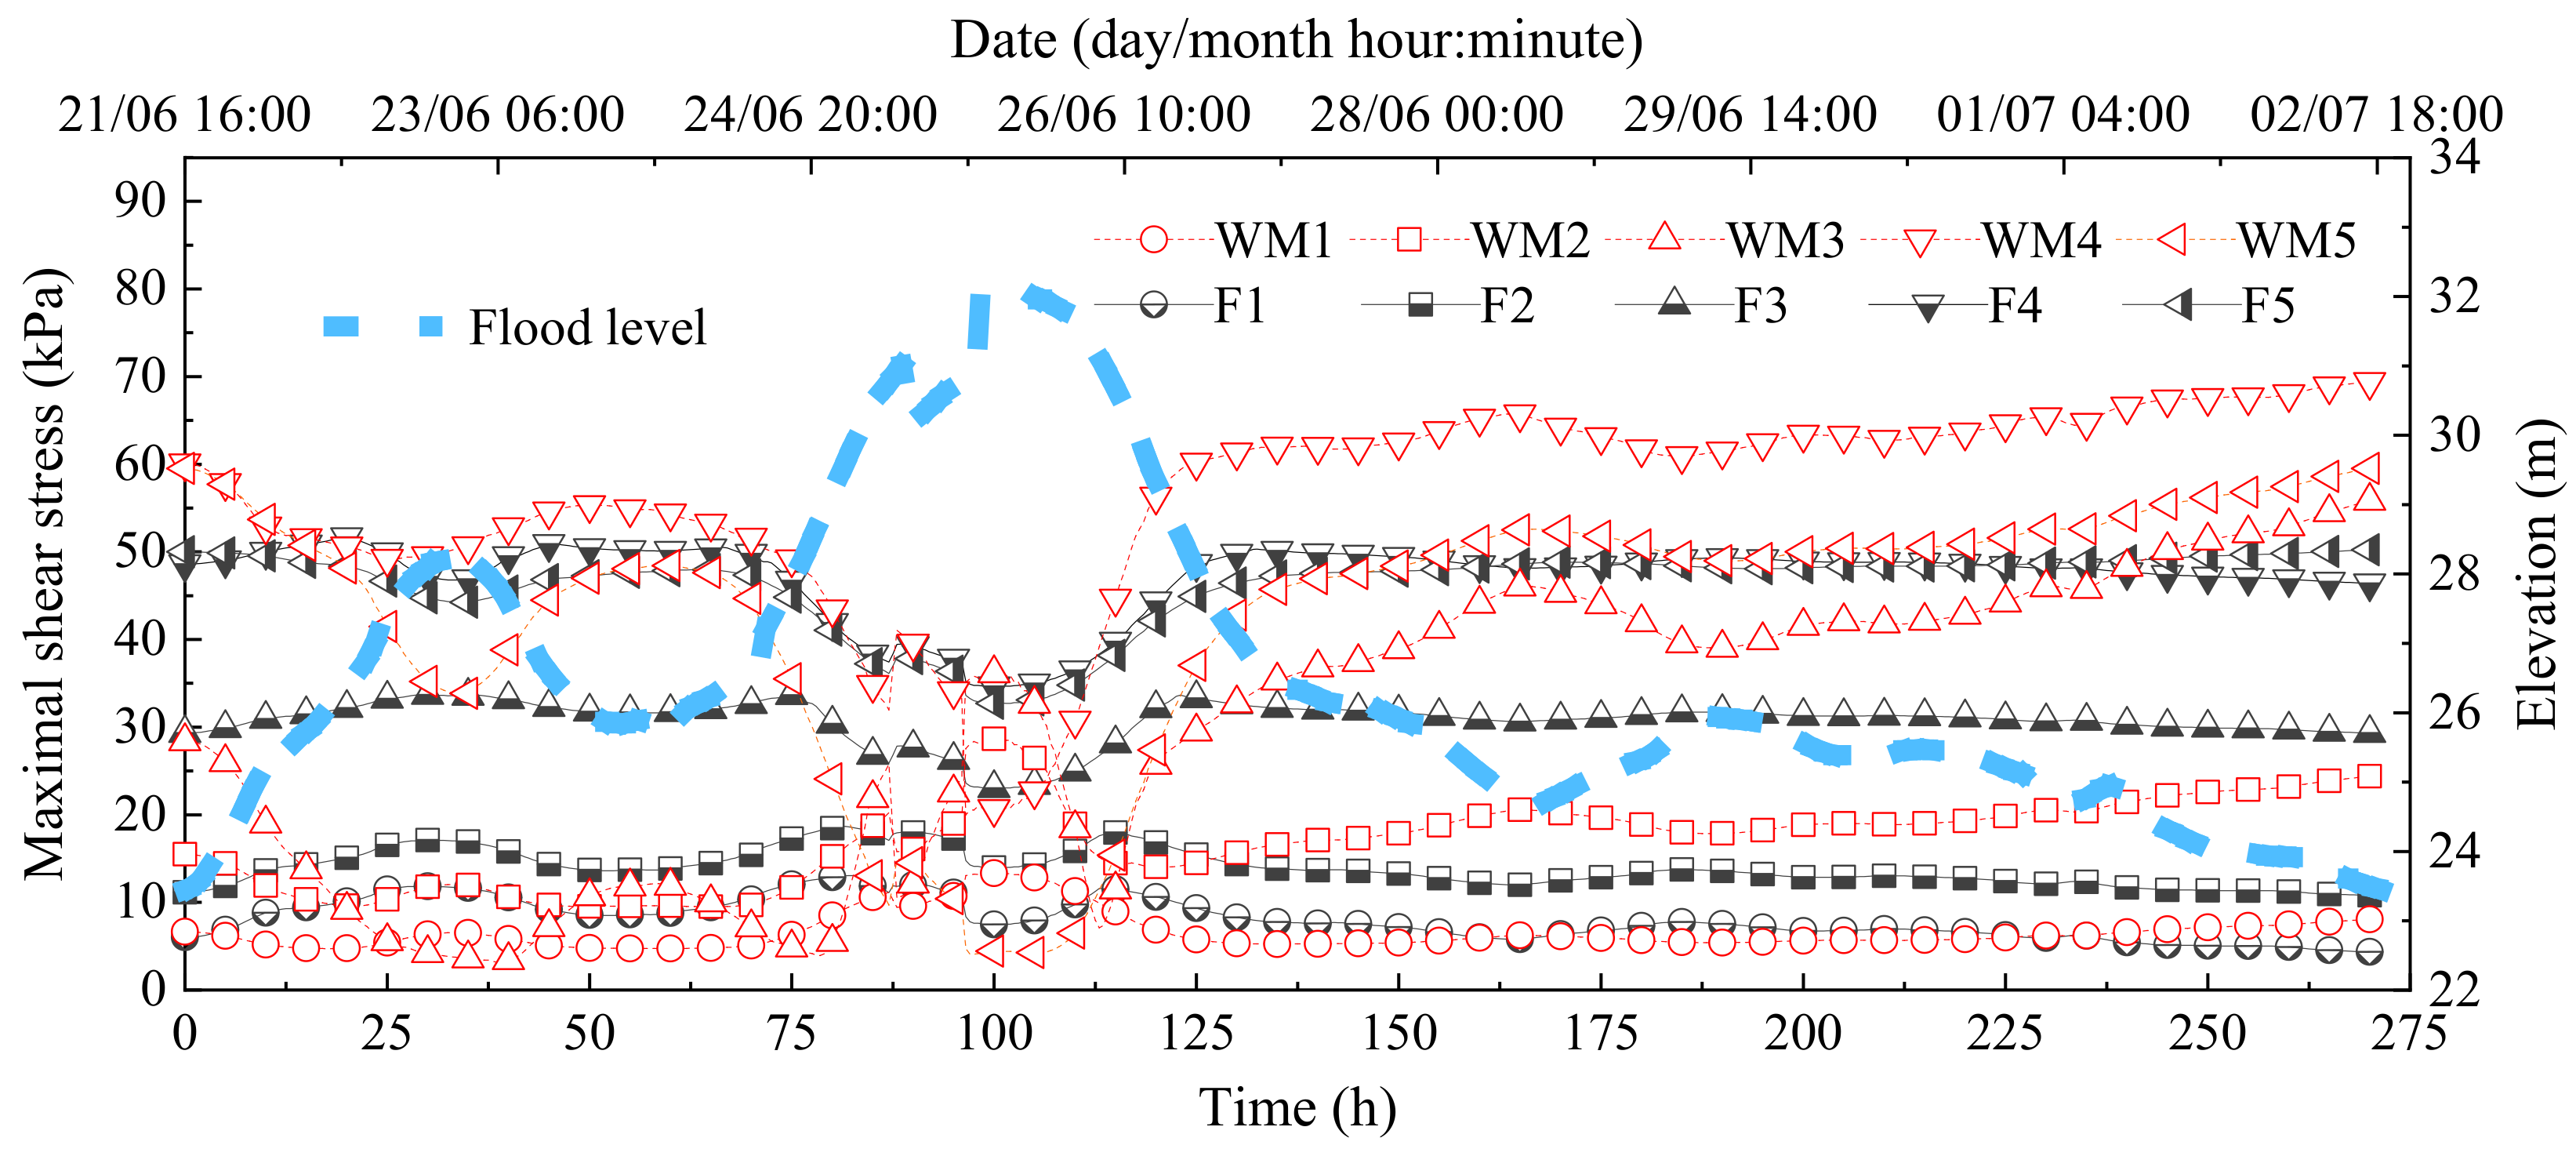
- The deluge has a significant influence on the stress changes of the walls and fillings below the flood level when the flood moves forward. The maximal shear stresses at Points W3 and W4 on the outer wall are 138.25 kPa and 145.99 kPa, respectively, and the maximal shear stresses of Points WI3 and WI4 on the inner wall are more than 110 kPa. The maximal shear stresses are less than the red sandstone’s shear strength, thus the wall will not experience shear strength failure. However, with the weathering of wall masonry materials, their strength will decrease, which may lead to instability and damage of ancient city walls under the influence of various factors such as flood levels, rainfall and pollution emissions.
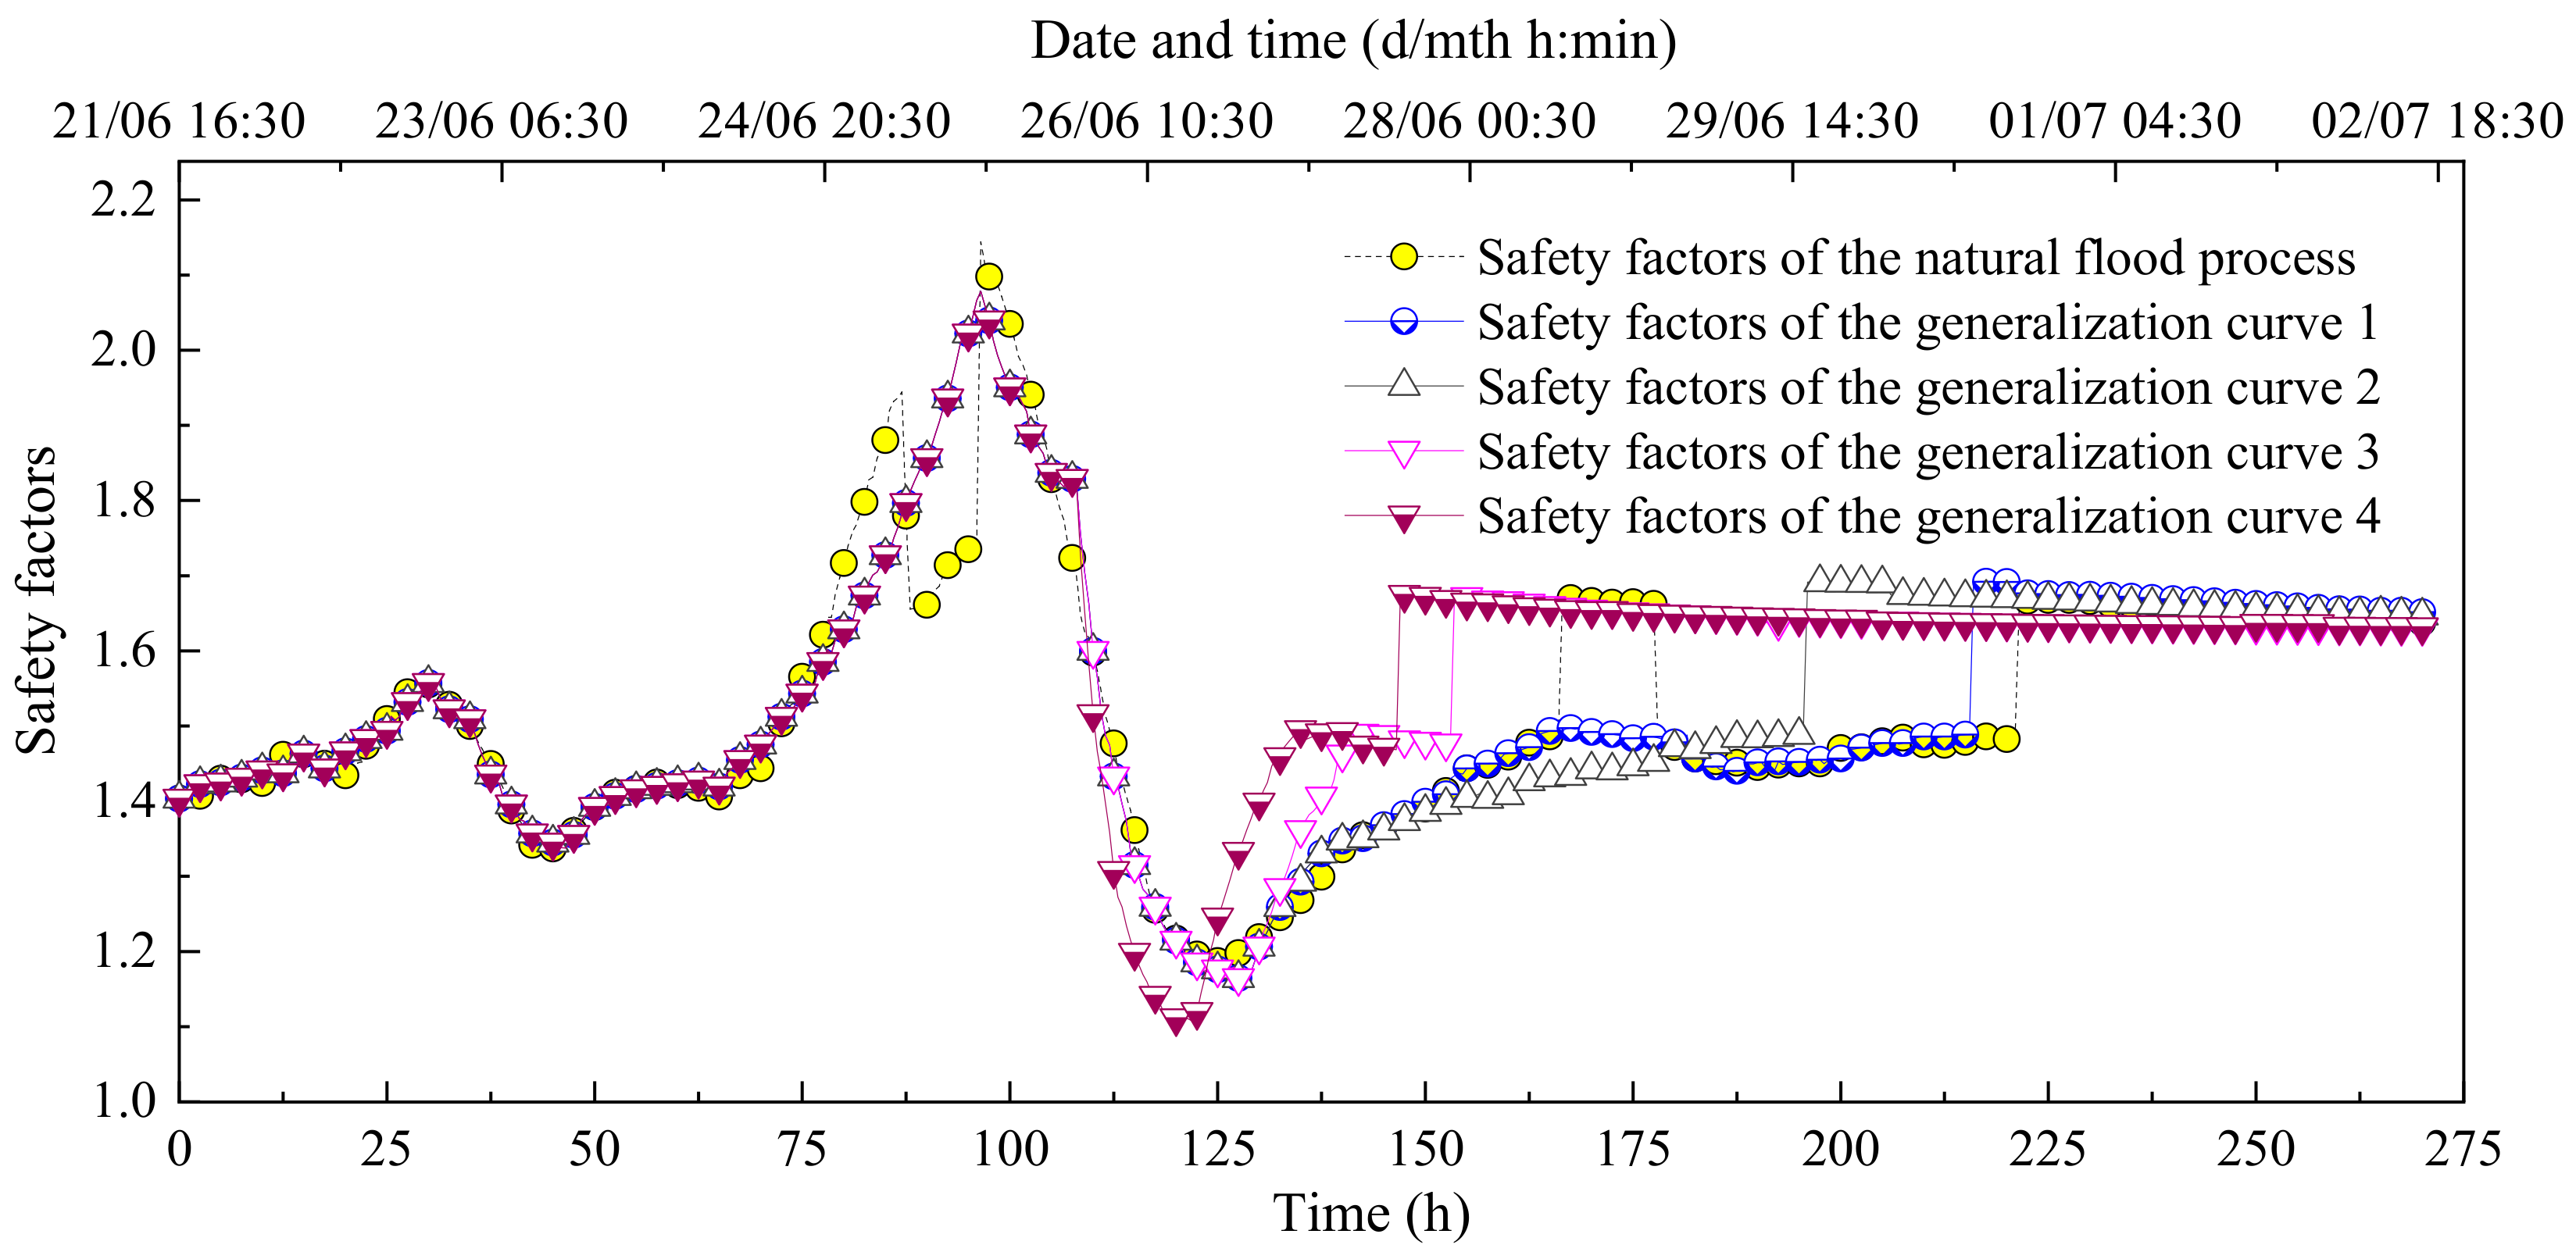
- (3)
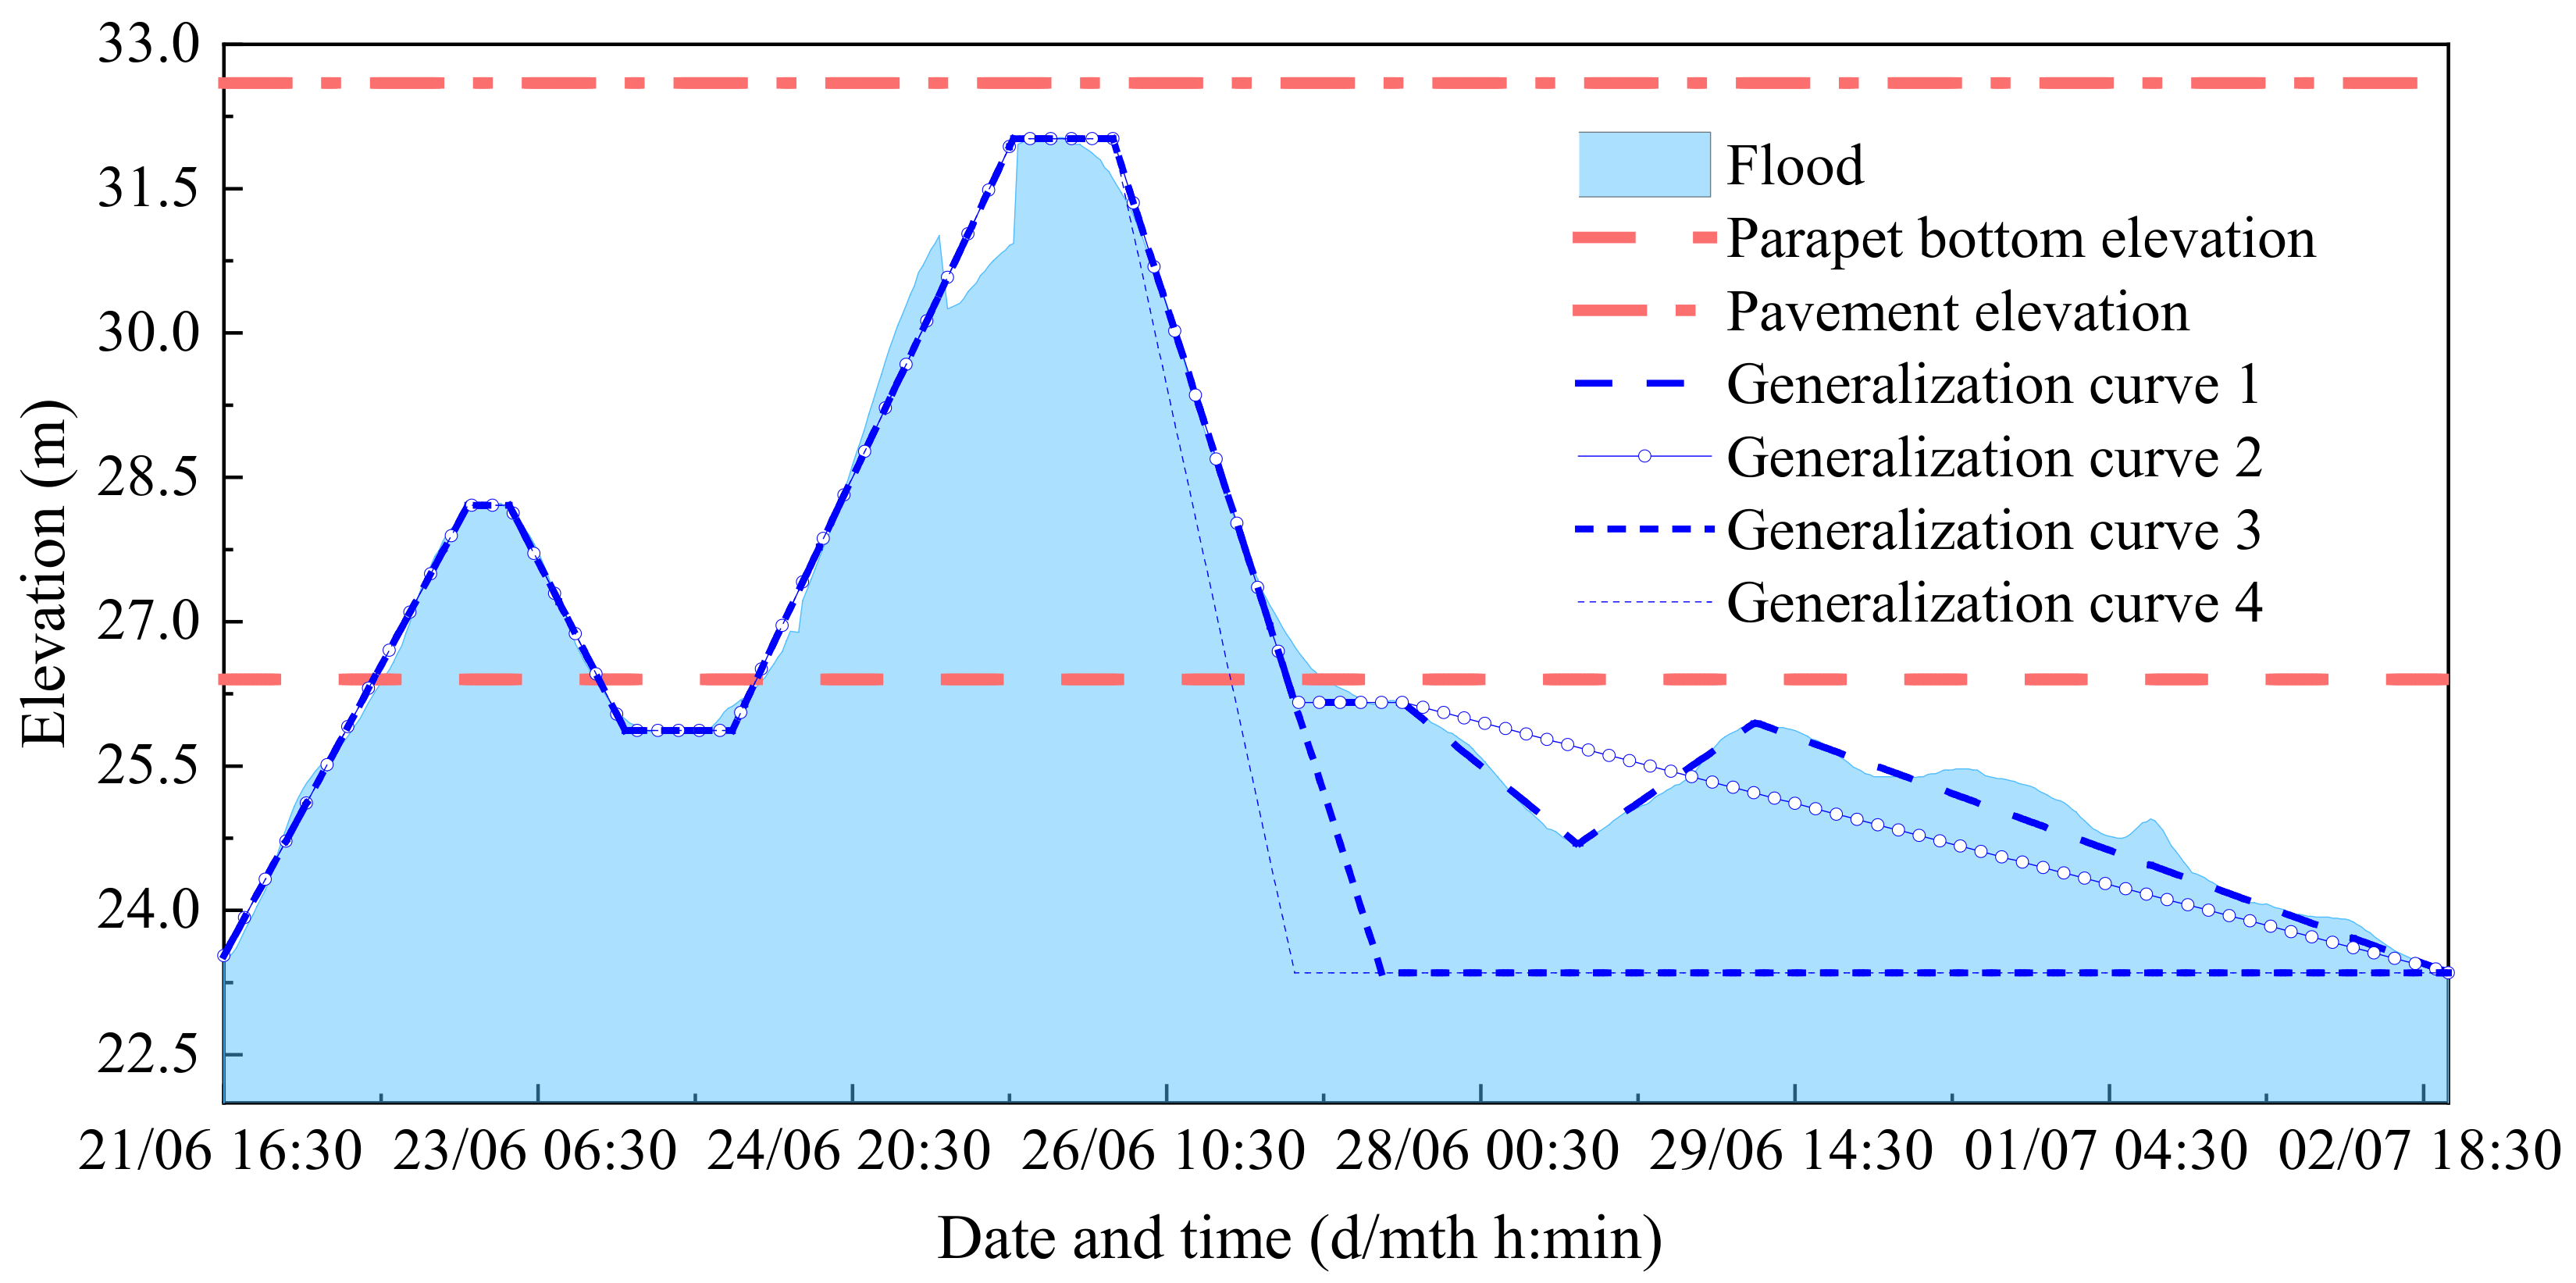
- The safety factor variation is more intense in a major flood process, and their changing rates measurably exceed that of the flood level, especially during the stage of flood level decline, and the minimum is 1185. The changing range of the flood level significantly affects the safety factors when it is near and above the wall foot. The minimum of the safety factors decreases with the increasing flood level falling rate when it drops near the wall foot at different rates. Therefore, in the process of protecting waterfront ancient city walls, it is necessary to strengthen the regulation of river water resources to avoid sudden drops in water level during floods. A slower water level change is beneficial for their protection.
- (4)
- The numerical model established only calculates and analyzes the Lanxi’s ancient city wall, but it has a certain universality and can be applied to the calculation of other waterfront ancient city walls. In the calculation process of the ancient city wall stability, this paper only considers the impact of changes in flood levels. In fact, this is just one of the important factors affecting the stability of ancient city walls. Due to their long construction period, the surrounding living environment and hydrogeological conditions are extremely complex, which cannot be fully considered in the calculation. In the future, more in-depth research will be conducted on the damage mechanism and protection measures of the waterfront ancient city walls, providing a theoretical basis for revealing their instability mechanism and selecting protective measures.
Author Contributions
Funding
Data Availability Statement
Acknowledgments
Conflicts of Interest
References
- Zhang, Z.; Qian, M.; Wei, S.; Chen, J. Failure mechanism of the Qianjiangping slope in Three Gorges Reservoir Area, China. Geofluids 2018, 3503697. [Google Scholar] [CrossRef]
- Ku, C.Y.; Liu, C.Y.; Tsai, F.T.C. A novel radial basis function approach for infiltration-induced landslides in unsaturated soils. Water 2022, 14, 1036. [Google Scholar] [CrossRef]
- Nsabimana, G.; Hong, L.; Yuhai, B.; de Dieu Nambajimana, J.; Jinlin, L.; Ntacyabukura, T.; Xiubin, H. Soil aggregate disintegration effects on soil erodibility in the water level fluctuation zone of the Three Gorges Reservoir, China. Environ. Res. 2023, 217, 114928. [Google Scholar] [CrossRef] [PubMed]
- Yang, B.; Yin, K.; Xiao, T.; Chen, L.; Du, J. Annual variation of landslide stability under the effect of water level fluctuation and rainfall in the Three Gorges Reservoir, China. Environ. Earth Sci. 2017, 76, 564. [Google Scholar] [CrossRef]
- Al-Labban, S.; Chopra, M. Effect of the core on the upstream stability of dams under sudden drawdown conditions. In Proceedings of the International Foundation Congress and Equipment Expo 2018, Orlando, FL, USA, 5–10 March 2018; pp. 324–332. [Google Scholar]
- Dykes, A.P.; Bromhead, E.N. New, simplified and improved interpretation of the Vaiont landslide mechanics. Landslides 2018, 15, 2001–2015. [Google Scholar] [CrossRef]
- Maihemuti, B.; Wang, E.; Hudan, T.; Xu, Q. Numerical simulation analysis of reservoir bank fractured rock-slope deformation and failure processes. Int. J. Geomech. 2016, 16, 04015058. [Google Scholar] [CrossRef]
- Li, S.; Sun, Q.; Zhang, Z.; Luo, X. Physical modelling and numerical analysis of slope instability subjected to reservoir impoundment of the Three Gorges. Environ. Earth Sci. 2018, 77, 138. [Google Scholar] [CrossRef]
- Sun, G.; Lin, S.; Jiang, W.; Yang, Y. A simplified solution for calculating the phreatic line and slope stability during a sudden drawdown of the reservoir water level. Geofluids 2018, 1859285. [Google Scholar] [CrossRef]
- Shi, L.; Sun, G. Improvement of the finite-element-based limit equilibrium method to include changes in groundwater: A case study of a deforming bank slope from the Three Gorges Reservoir. Environ. Earth Sci. 2018, 77, 333. [Google Scholar] [CrossRef]
- Song, K.; Lu, G.; Zhang, G.; Liu, Y. Influence of uncertainty in the initial groundwater table on long-term stability of reservoir landslides. Bull. Eng. Geol. Environ. 2016, 76, 901–908. [Google Scholar] [CrossRef]
- Huang, F.; Luo, X.; Liu, W. Stability analysis of hydrodynamic pressure landslides with different permeability coefficients affected by reservoir water level fluctuations and rainstorms. Water 2017, 9, 450. [Google Scholar] [CrossRef]
- Li, D.; Li, L.; Cheng, Y.; Hu, J.; Lu, S.; Li, C.; Meng, K. Reservoir slope reliability analysis under water level drawdown considering spatial variability and degradation of soil properties. Comput. Geotech. 2022, 151, 104947. [Google Scholar] [CrossRef]
- Fan, L.; Zhang, G.; Li, B.; Tang, H. Deformation and failure of the Xiaochatou Landslide under rapid drawdown of the reservoir water level based on centrifuge tests. Bull. Eng. Geol. Environ. 2017, 76, 891–900. [Google Scholar] [CrossRef]
- Babanouri, N.; Dehghani, H. Investigating a potential reservoir landslide and suggesting its treatment using limit-equilibrium and numerical methods. J. Mt. Sci. 2017, 14, 432–441. [Google Scholar] [CrossRef]
- Nagy-Göde, F.K.; Török, Á. Rainfall-induced or lake-water-level-controlled landslide? An example from the steep slopes of Lake Balaton, Hungary. Water 2022, 14, 1169. [Google Scholar] [CrossRef]
- Jiao, Y.Y.; Song, L.; Tang, H.M.; Li, Y.A. Material weakening of slip zone soils induced by water level fluctuation in the ancient landslides of Three Gorges Reservoir. Adv. Mater. Sci. Eng. 2014, 2014, 202340. [Google Scholar] [CrossRef]
- Zou, Z.; Luo, T.; Zhang, S.; Duan, H.; Li, S.; Wang, J.; Deng, Y.; Wang, J. A novel method to evaluate the time-dependent stability of reservoir landslides: Exemplified by Outang landslide in the Three Gorges Reservoir. Landslides 2023, 20, 1731–1746. [Google Scholar] [CrossRef]
- Wei, J.; Shi, B.; Li, J.; Li, S.; He, X. Shear strength of purple soil bunds under different soil water contents and dry densities: A case study in the Three Gorges Reservoir Area, China. Catena 2018, 166, 124–133. [Google Scholar] [CrossRef]
- Jiang, Q.; Wei, W.; Xie, N.; Zhou, C. Stability analysis and treatment of a reservoir landslide under impounding conditions: A case study. Environ. Earth Sci. 2015, 75, 2. [Google Scholar] [CrossRef]
- Zhang, S. The Protection and Development of Shouchun Ancient City Wall and the Historical Building; Fujian Normal University: Fuzhou, China, 2010. (In Chinese) [Google Scholar]
- Li, Q. Research on the Protection and Renewal Design of Suzhou Ancient City Wall and Its Environment: Take Pingmen Section as an Example; Suzhou University: Suzhou, China, 2020. (In Chinese) [Google Scholar]
- Wang, X. Xi’an Ming City Wall Surrounding on the Public Space Design Strategy Research; Chang’an University: Xi’an, China, 2011. (In Chinese) [Google Scholar]
- Deng, X. A Study on Culture Connotation and Landscape Planning of Waterfront Space for Jingzhou Historic City; Wuhan University of Technology: Wuhan, China, 2006. (In Chinese) [Google Scholar]
- Fu, X. Exploration of Chinese Ancient City Wall’s Protection; Beijing Forestry University: Beijing, China, 2007. (In Chinese) [Google Scholar]
- Zhang, Y. Exploration of City Walls’ Preventive Conservation in China; Beijing Architecture University: Beijing, China, 2019. (In Chinese) [Google Scholar]
- Liu, D.; Cao, K.; Tang, Y.; Zhang, J.; Meng, X.; Ao, T.; Zhang, H. Study on weathering corrosion characteristics of red sandstone of ancient buildings under the perspective of non-destructive testing. J. Build. Eng. 2024, 85, 108520. [Google Scholar] [CrossRef]
- Zhu, H.; Li, J. Geological engineering investigation of seepage and reinforce of the ancient circumvallation of Linhai city. J. Zhejiang Univ. Water Resour. Electr. Power 2000, 25–27. (In Chinese) [Google Scholar]
- Li, W. Comparative Study of Historic Cities with Completely Conserved Walls; Tongji University: Shanghai, China, 2006. (In Chinese) [Google Scholar]
- Chen, Q.; Tu, X.; Lv, Y.; Liu, W.; Shi, L. Experimental Study on Vertical Bearing and Deformation Characteristics of Qiantang River Ancient Seawall. Buildings 2023, 13, 2788. [Google Scholar] [CrossRef]
- Gara, F.; Nicoletti, V.; Arezzo, D.; Cipriani, L.; Leoni, G. Model updating of cultural heritage buildings through swarm intelligence algorithms. Int. J. Archit. Herit. 2023. [Google Scholar] [CrossRef]
- Song, K.; Yan, E.; Zhang, G.; Lu, S.; Yi, Q. Effect of hydraulic properties of soil and fluctuation velocity of reservoir water on landslide stability. Environ. Earth Sci. 2015, 74, 5319–5329. [Google Scholar] [CrossRef]
- Liu, K.; Vardon, P.J.; Hicks, M.A.; Arnold, P. Combined effect of hysteresis and heterogeneity on the stability of an embankment under transient seepage. Eng. Geol. 2017, 219, 140–150. [Google Scholar] [CrossRef]
- Clemens, C.; Radschun, M.; Jobst, A.; Himmel, J.; Kanoun, O. Detection of density changes in soils with impedance spectroscopy. Appl. Sci. 2021, 11, 1568. [Google Scholar] [CrossRef]
- Tang, M.; Xu, Q.; Yang, H.; Li, S.; Iqbal, J.; Fu, X.; Huang, X.; Cheng, W. Activity law and hydraulics mechanism of landslides with different sliding surface and permeability in the Three Gorges Reservoir Area, China. Eng. Geol. 2019, 260, 105212. [Google Scholar] [CrossRef]
- Lanxi Local chronicles Editorial Committee. Lanxi City Chronicles; Zhejiang People’s Publishing House: Hangzhou, China, 2013; p. 5. (In Chinese) [Google Scholar]
- Li, X.; Qin, Z.; Tian, Y.; Zhang, H.; Zhao, H.; Shen, J.; Shao, W.; Jiang, G.; Guo, X.; Zhang, J. Study on stability and ecological restoration of soil-covered rocky slope of an abandoned mine on an island in rainy regions. Sustainability 2022, 14, 12959. [Google Scholar] [CrossRef]
- Augusto Filho, O.; Fernandes, M.A. Landslide analysis of unsaturated soil slopes based on rainfall and matric suction data. Bull. Eng. Geol. Environ. 2019, 78, 4167–4185. [Google Scholar] [CrossRef]
- Bahrami, S.; Ardejani, F.D.; Baafi, E. Application of artificial neural network coupled with genetic algorithm and simulated annealing to solve groundwater inflow problem to an advancing open pit mine. J. Hydrol. 2016, 536, 471–484. [Google Scholar] [CrossRef]
- GEO-SLOPE International Ltd. Seepage Modeling with SEEP/W: An Engineering Methodology (July 2012 Edition); GEO-SLOPE International Ltd.: Calgary, AB, Canada, 2012; pp. 171–173. [Google Scholar]
- Wu, X.; Xia, J.; Zhan, C.; Jia, R.; Li, Y.; Qiao, Y.; Zou, L. Modeling soil salinization at the downstream of a lowland reservoir. Hydrol. Res. 2019, 50, 1202–1215. [Google Scholar] [CrossRef]
- Rivera-Hernandez, X.A.; Ellithy, G.S.; Vahedifard, F. Integrating field monitoring and numerical modeling to evaluate performance of a levee under climatic and tidal variations. J. Geotech. Geoenviron. Eng. 2019, 145, 05019009. [Google Scholar] [CrossRef]
- Chinkulkijniwat, A.; Tirametatiparat, T.; Supotayan, C.; Yubonchit, S.; Horpibulsuk, S.; Salee, R.; Voottipruex, P. Stability characteristics of shallow landslide triggered by rainfall. J. Mt. Sci. 2019, 16, 2171–2183. [Google Scholar] [CrossRef]
- Satyanaga, A.; Rahardjo, H. Stability of unsaturated soil slopes covered with Melastoma malabathricum in Singapore. Proc. Inst. Civ. Eng. Geotech. Eng. 2019, 172, 530–540. [Google Scholar] [CrossRef]
- Ng, C.W.W.; Zhan, L.T.; Bao, C.G.; Fredlund, D.G.; Gong, B.W. Performance of an unsaturated expansive soil slope subjected to artificial rainfall infiltration. Geótechnique 2003, 53, 143–157. [Google Scholar] [CrossRef]
- Zhang, G.; Wang, R.; Qian, J.; Zhang, J.M.; Qian, J. Effect study of cracks on behavior of soil slope under rainfall conditions. Soils Found. 2012, 52, 634–643. [Google Scholar] [CrossRef]
- Zhu, P.; Witt, K.J. The effect of depth dependency on stochastic infinite slope stability analysis. Environ. Geotech. 2019, 6, 307–319. [Google Scholar] [CrossRef]
- Toll, D.G.; Md Rahim, M.S.; Karthikeyan, M.; Tsaparas, I. Soil-atmosphere interactions for analyzing slopes in tropical soils in Singapore. Environ. Geotech. 2019, 6, 361–372. [Google Scholar] [CrossRef]
- Li, D.Q.; Wang, L.; Cao, Z.J.; Qi, X.H. Reliability analysis of unsaturated slope stability considering SWCC model selection and parameter uncertainties. Eng. Geol. 2019, 260, 105207. [Google Scholar] [CrossRef]
- Lu, N.; Likos, W.J. Unsaturated Soil Mechanics; John Wiley & Sons, Inc.: Hoboken, NJ, USA, 2004; pp. 229–247. [Google Scholar]
- Khan, R.M.A.; Shafighfard, T.; Ali, H.Q.; Mieloszyk, M.; Yildiz, M. Strength prediction and experimental damage investigations of plain woven CFRPs with interacting holes using multi-instrument measurements. Polym. Compos. 2023, 44, 3594–3609. [Google Scholar] [CrossRef]
- GEO-SLOPE International Ltd. Stability Modeling with SLOPE/W: An Engineering Methodology (July 2015 Edition); GEO-SLOPE International Ltd.: Calgary, AB, Canada, 2015; pp. 140–141. [Google Scholar]
- Qin, Z.; Lai, Y.; Tian, Y.; Zhang, M. Stability behaviour of a reservoir soil bank slope under freeze-thaw cycles in cold regions. Cold Reg. Sci. Technol. 2020, 181, 103181. [Google Scholar] [CrossRef]
- Coleman, J.L.; Bolisetti, C.; Whittaker, A.S. Time-domain soil-structure interaction analysis of nuclear facilities. Nucl. Eng. Des. 2016, 298, 264–270. [Google Scholar] [CrossRef]
- Qin, Z.; Tian, Y.; Gao, S.; Zhou, J.; He, X.; He, W.; Gao, J. Stability behavior of the Lanxi ancient flood control levee after reinforcement with upside-down hanging wells and grouting curtain. J. Mt. Sci. 2024, 21, 84–99. [Google Scholar] [CrossRef]
- Qin, Z.; Tian, Y.; Gao, S.; Zhou, J.; Zhao, H.; Guo, Z.; Chen, T.; Hua, Z. Numerical investigation of the upside-down hanging well combined with curtain grouting for strengthening a flood control ancient levee. Sustainability 2023, 13, 4287. [Google Scholar] [CrossRef]
- Forcellini, D. The assessment of the interaction between base isolation (BI) technique and soil structure interaction (SSI) effects with 3D numerical simulations. Structures 2022, 45, 1452–1460. [Google Scholar] [CrossRef]
- Qin, Z.; Lai, Y.; Tian, Y. Study on failure mechanism of a plain irrigation reservoir soil bank slope under wind wave erosion. Nat. Hazards 2021, 109, 567–592. [Google Scholar] [CrossRef]
- Chen, Y.; Zhang, G.; Chan, D. Cyclic response and modeling of saturated silty clay due to fluctuations in reservoir water level of the Three Gorges Dam, China. Soils Found. 2018, 58, 702–715. [Google Scholar] [CrossRef]
- Iqbal, J.; Dai, F.; Hong, M.; Tu, X.; Xie, Q. Failure mechanism and stability analysis of an active landslide in the Xiangjiaba reservoir area, southwest China. J. Earth Sci. 2018, 29, 646–661. [Google Scholar] [CrossRef]
- Shi, C.; Si, X.; Zhang, Y.; Yang, J.; Dong, J. A simplified model for stability analysis of reservoir bank slopes under water level dropping condition. Granul. Matter 2022, 24, 90. [Google Scholar] [CrossRef]
- Zhu, J.; Lv, Q.; Xie, D.; Zeng, R.; Wang, N.; Qiao, J.; Cai, W. Physical model test on the deformation mechanism of reservoir bank slopes with sand layers under coupled hydro-mechanical conditions. Front. Earth Sci. 2022, 10, 863370. [Google Scholar] [CrossRef]
- Guardiani, C.; Soranzo, E.; Wu, W. Time-dependent reliability analysis of unsaturated slopes under rapid drawdown with intelligent surrogate models. Acta Geotech. 2022, 17, 1071–1096. [Google Scholar] [CrossRef]
- Dou, L.; Wang, H.; Li, B.; Yang, Y.; Di, D. Impact of groundwater fluctuations on the stability of super-large-diameter caissons before and after reinforcement. Appl. Sci. 2024, 14, 4971. [Google Scholar] [CrossRef]


| Material Names | Dry Density (g/cm3) | Seepage Coefficient of Saturated Soil (m/s) | Compressive Modulus (MPa) | Effective Cohesion (kPa) | Effective Internal Friction Angle (°) | Poisson’s Ratio |
|---|---|---|---|---|---|---|
| Artificial filling (I1) | 1.57 | 9.60 × 10⁻⁴ | 2520.0 | 2.5 | 25 | 0.33 |
| Artificial filling (I2) | 1.68 | 5.79 × 10⁻⁴ | 25.0 | 2.0 | 30 | 0.33 |
| Sandy gravel (ΙΙ) | 1.92 | 1.74 × 10⁻³ | 35.0 | 0.0 | 35 | 0.30 |
| Pelitic siltstone (ΙΙΙ) | 2.05 | 5.50 × 10⁻⁶ | 40.0 | 5.0 | 37 | 0.25 |
| Red sandstone | 2.10 | 2.32 × 10⁻³ | 10,000.0 | 200.0 | 45 | 0.21 |
Disclaimer/Publisher’s Note: The statements, opinions and data contained in all publications are solely those of the individual author(s) and contributor(s) and not of MDPI and/or the editor(s). MDPI and/or the editor(s) disclaim responsibility for any injury to people or property resulting from any ideas, methods, instructions or products referred to in the content. |
© 2024 by the authors. Licensee MDPI, Basel, Switzerland. This article is an open access article distributed under the terms and conditions of the Creative Commons Attribution (CC BY) license (https://creativecommons.org/licenses/by/4.0/).
Share and Cite
Qin, Z.; Tian, Y.; Li, Q.; He, W.; He, X.; Zhu, Q.; Gao, J. Numerical Investigation on Stability of Lanxi’s Ancient City Wall during a Major Flood Propagation Process. Buildings 2024, 14, 2767. https://doi.org/10.3390/buildings14092767
Qin Z, Tian Y, Li Q, He W, He X, Zhu Q, Gao J. Numerical Investigation on Stability of Lanxi’s Ancient City Wall during a Major Flood Propagation Process. Buildings. 2024; 14(9):2767. https://doi.org/10.3390/buildings14092767
Chicago/Turabian StyleQin, Zipeng, Yan Tian, Qian Li, Weizhong He, Xiaohui He, Qingliang Zhu, and Jingquan Gao. 2024. "Numerical Investigation on Stability of Lanxi’s Ancient City Wall during a Major Flood Propagation Process" Buildings 14, no. 9: 2767. https://doi.org/10.3390/buildings14092767