Article

Study of the Mechanical Behavior of High-Strength Lightweight Concrete and Its Application to Bridge Pavements

1
Hainan CCCC Expressway Investment and Construction Co., Ltd., Haikou 813000, China
2
School of Civil Engineering and Architecture, Wuhan University of Technology, 122 Luoshi Rd., Wuhan 430070, China
3
Sanya Science and Education Innovation Park, Wuhan University of Technology, Sanya 572000, China
4
Key Laboratory of Roadway Bridge and Structure Engineering, Wuhan University of Technology, Wuhan 430070, China
*
Authors to whom correspondence should be addressed.
Buildings 2024, 14(9), 2783; https://doi.org/10.3390/buildings14092783
Submission received: 10 August 2024 / Revised: 25 August 2024 / Accepted: 30 August 2024 / Published: 4 September 2024
(This article belongs to the Special Issue Solid Mechanics as Applied to Civil Engineering)

Abstract

:
High-strength lightweight concrete (HSLC) is increasingly in demand for reducing the self-weight of concrete structures, achieved in this study using shale ceramsite aggregate. Despite its potential, HSLC has been underutilized in field projects due to concerns about its strength and long-term stability. This study investigates the impact of shale ceramsite content on the mechanical properties of HSLC through uniaxial compression, flexural, and bending tests. The results reveal that ceramsite content significantly influences the concrete’s mechanical properties and failure mechanisms. An optimal design of HSLC was proposed in this study and further used in a real field highway project, demonstrating its applicability to bridge pavements. Newly developed fiber Bragg grating sensors were installed in the material to monitor the performance of the HSLC. Concrete performance monitoring was conducted using a new type of fiber Bragg grating sensor independently developed by the research team. The results showed that the higher the ceramsite content, the greater the shrinkage deformation. And similarly, the higher the strength, the greater the shrinkage deformation. The outcome of this study would provide an alternative approach for the application of HSLC in civil infrastructures.

1. Introduction

High-Strength Lightweight Concrete (HSLC) is an important branch of concrete technology, combining the characteristics of Lightweight Concrete (LWC) and High-Strength Concrete (HSC). HSLC typically has a density lower 1950 kg/m3, which is significantly lower than conventional concrete. The compressive strength of HSLC is designed to exceed 35 MPa. Due to its light weight and high strength, HSLC aligns well with the modern architectural trends towards large-span spatial structures, super high-rise buildings, and heavy loading [1,2].
Research on LWC began as early as the 1920s internationally. In Kansas, USA, the first factory producing lightweight aggregates was established, and bridges were built using expanded shale as coarse aggregate. This marked the formal introduction of LWC into the public view. By the 1970s, over 200 bridges in the USA and Canada had been constructed using LWC, reflecting its initial development stage [3,4]. By the mid-20th century, the use of LWC in building structures increased significantly, achieving notable economic benefits, not only in bridge construction but also expanding into high-rise buildings such as the Prudential Plaza and Marina City in Chicago. In the 1990s, countries like Norway and Japan began researching HSLC based on LWC, focusing on mix proportions, high-performance ceramsite, and production processes. Additionally, research on aerated lightweight concrete using materials such as aluminum lathe and pumice under elevated temperatures has shown enhanced thermal insulation properties and improved fire resistance, which are critical for maintaining structural integrity in extreme conditions. These studies greatly improved the workability and durability of HSLC, with research outcomes widely applied globally [5]. For example, Norway has successfully used HSLC to build large pre-stressed cantilever bridges, and the UK has used HSLC for large off-shore oil platforms. The rationale for selecting HSLC was to reduce the self-weight of the bridge pavement while maintaining high mechanical strength. This is crucial for extending the service life of bridges by reducing dead loads and improving their load-bearing efficiency. Despite the numerous research and application achievements of HSLC, practical engineering applications still face issues such as significant lightweight aggregate segregation and poor flowability, leading to substantial economic losses. Therefore, understanding the mechanical properties of HSLC is urgent [6].
HSLC, as a three-phase composite material, consists of a mortar matrix, Interfacial Transition Zone (ITZ), and coarse aggregates. The factors affecting the mechanical properties of HSLC are complex, making it difficult to explore their intrinsic connections by considering a single variable alone [7]. Although HSLC uses lightweight aggregates, thus reducing its average weight by 25–35%, its load-bearing capacity and basic mechanical properties remain comparable to ordinary concrete, with strengths reaching up to 83 MPa [8,9]. This characteristic has intrigued many researchers, prompting extensive investigations into the reasons behind this phenomenon. As an essential material for HSLC preparation, lightweight aggregates profoundly impact the concrete’s mechanical properties. He et al. [10] measured the physical properties of clay ceramsite and shale ceramsite using digital image processing, including particle size, gradation, and shape, and studied the roughness of the lightweight aggregate interface using fractal theory. The results indicated that increasing the volume fraction of lightweight aggregates reduces concrete’s elastic modulus and significantly affects its compressive strength. Similarly, Cui et al. studied six types of lightweight aggregates, exploring the impact on concrete’s elastic modulus and compressive strength by controlling the volume fraction and quality of the aggregates. The results showed that the elastic modulus and peak stress decreased with the increase in lightweight aggregate volume fraction. Additionally, the density, particle shape, and crushing strength of lightweight aggregates significantly affect concrete’s elastic modulus and compressive strength [11]. Yang Jianhui et al. studied the mechanical properties of concrete with shale ceramsite content ranging from 0% to 50%, finding that the compressive, flexural, and split tensile strengths initially increased and then decreased with an increase in the crushed stone replacement rate [12]. Furthermore, numerous studies have shown that the pre-wetting degree of lightweight aggregates is a crucial factor affecting the mechanical properties of concrete [13]. Similar factors include the composition and content of cementitious materials, with lightweight aggregates also impacting the durability and thermal conductivity of concrete to varying degrees [14,15].
Regarding the early deformation patterns of High Performance Concrete (HPC), researchers worldwide have discussed this using various monitoring methods. Lepage et al. [16] monitored the early shrinkage development of HPC, finding that concrete exhibits slight expansion within 4 to 16 h, with the actual total shrinkage significantly less than the autogenous shrinkage within the first 50 h due to temperature rise. Yun and Jang used embedded Fiber Bragg Grating (FBG) sensors [17,18] to monitor the early deformation characteristics of HPC, noting a rapid deformation increase in the early stages of pouring, followed by an overall shrinkage trend after two weeks [19]. Silva et al. showed that the exothermic reaction of cement hydration is the primary cause of the sharp increase in early deformation within the first 20 h of pouring, after which the concrete begins to shrink gradually [20]. Similar studies, such as those by Yun et al. [21] and Yazdizadeh et al. [22], also confirmed the characteristic of initial expansion followed by shrinkage in HPC. Among these methods, fiber optic sensors have demonstrated stability, and successfully captured the full deformation [23] characteristics of concrete, and thus are widely used for their valuable application potential.
Recently, the early shrinkage deformation characteristics of ordinary concrete and HPC have been extensively studied, achieving significant results and revealing the principles of early expansion and shrinkage. However, there are few studies on the deformation characteristics of HSLC during curing. Due to the special structural properties of lightweight aggregates like shale ceramsite, researching their impact on HSLC’s deformation characteristics during curing has significant research and application value [24,25].
Fiber optic sensing technology, due to its high sensitivity, resistance to electromagnetic interference, corrosion resistance, and adaptability, has found widespread application in monitoring the performance of concrete structures [26,27]. Fiber optic sensing technology can accurately measure strain changes in concrete structures, helping engineers evaluate the behavior of structures under load. By placing fiber optic sensors at critical locations, real-time strain data can be monitored to identify potential structural damage [28,29]. Temperature changes have a significant impact on the strength and durability of concrete. Fiber optic temperature sensors provide high-precision temperature data and can operate normally in extreme environments, making them valuable in concrete hardening processes and long-term monitoring [30,31]. Fiber optic sensors can detect the formation and propagation of micro-cracks. By arranging optical fibers in concrete structures, the real-time monitoring of crack width and location can be achieved, providing data support for structural maintenance and reinforcement [32,33]. Despite the many advantages of fiber optic sensing technology in monitoring concrete structures, it still faces some challenges. For instance, fiber optic sensors generate large amounts of data, requiring effective data processing and analysis methods [1].
This paper develops a shale ceramsite concrete suitable for actual engineering construction needs. Using shale ceramsite concrete as the research object, uniaxial compression tests were conducted on shale ceramsite concrete samples to study the effect of strain rate on the mechanical properties of shale ceramsite concrete. The mechanical properties of shale ceramsite concrete were studied using SHPB apparatus, and its failure characteristics were analyzed. The compressive and flexural strength tests of HSLC concrete components were explored, and the failure modes and mechanisms of the samples were analyzed. The developed HSLC was demonstrated in actual engineering applications, and the internal strain development trend of ceramsite concrete was investigated using new optical fiber sensor technology, explaining the deformation patterns of ceramsite concrete in practical engineering applications.

2. Experimental Tests
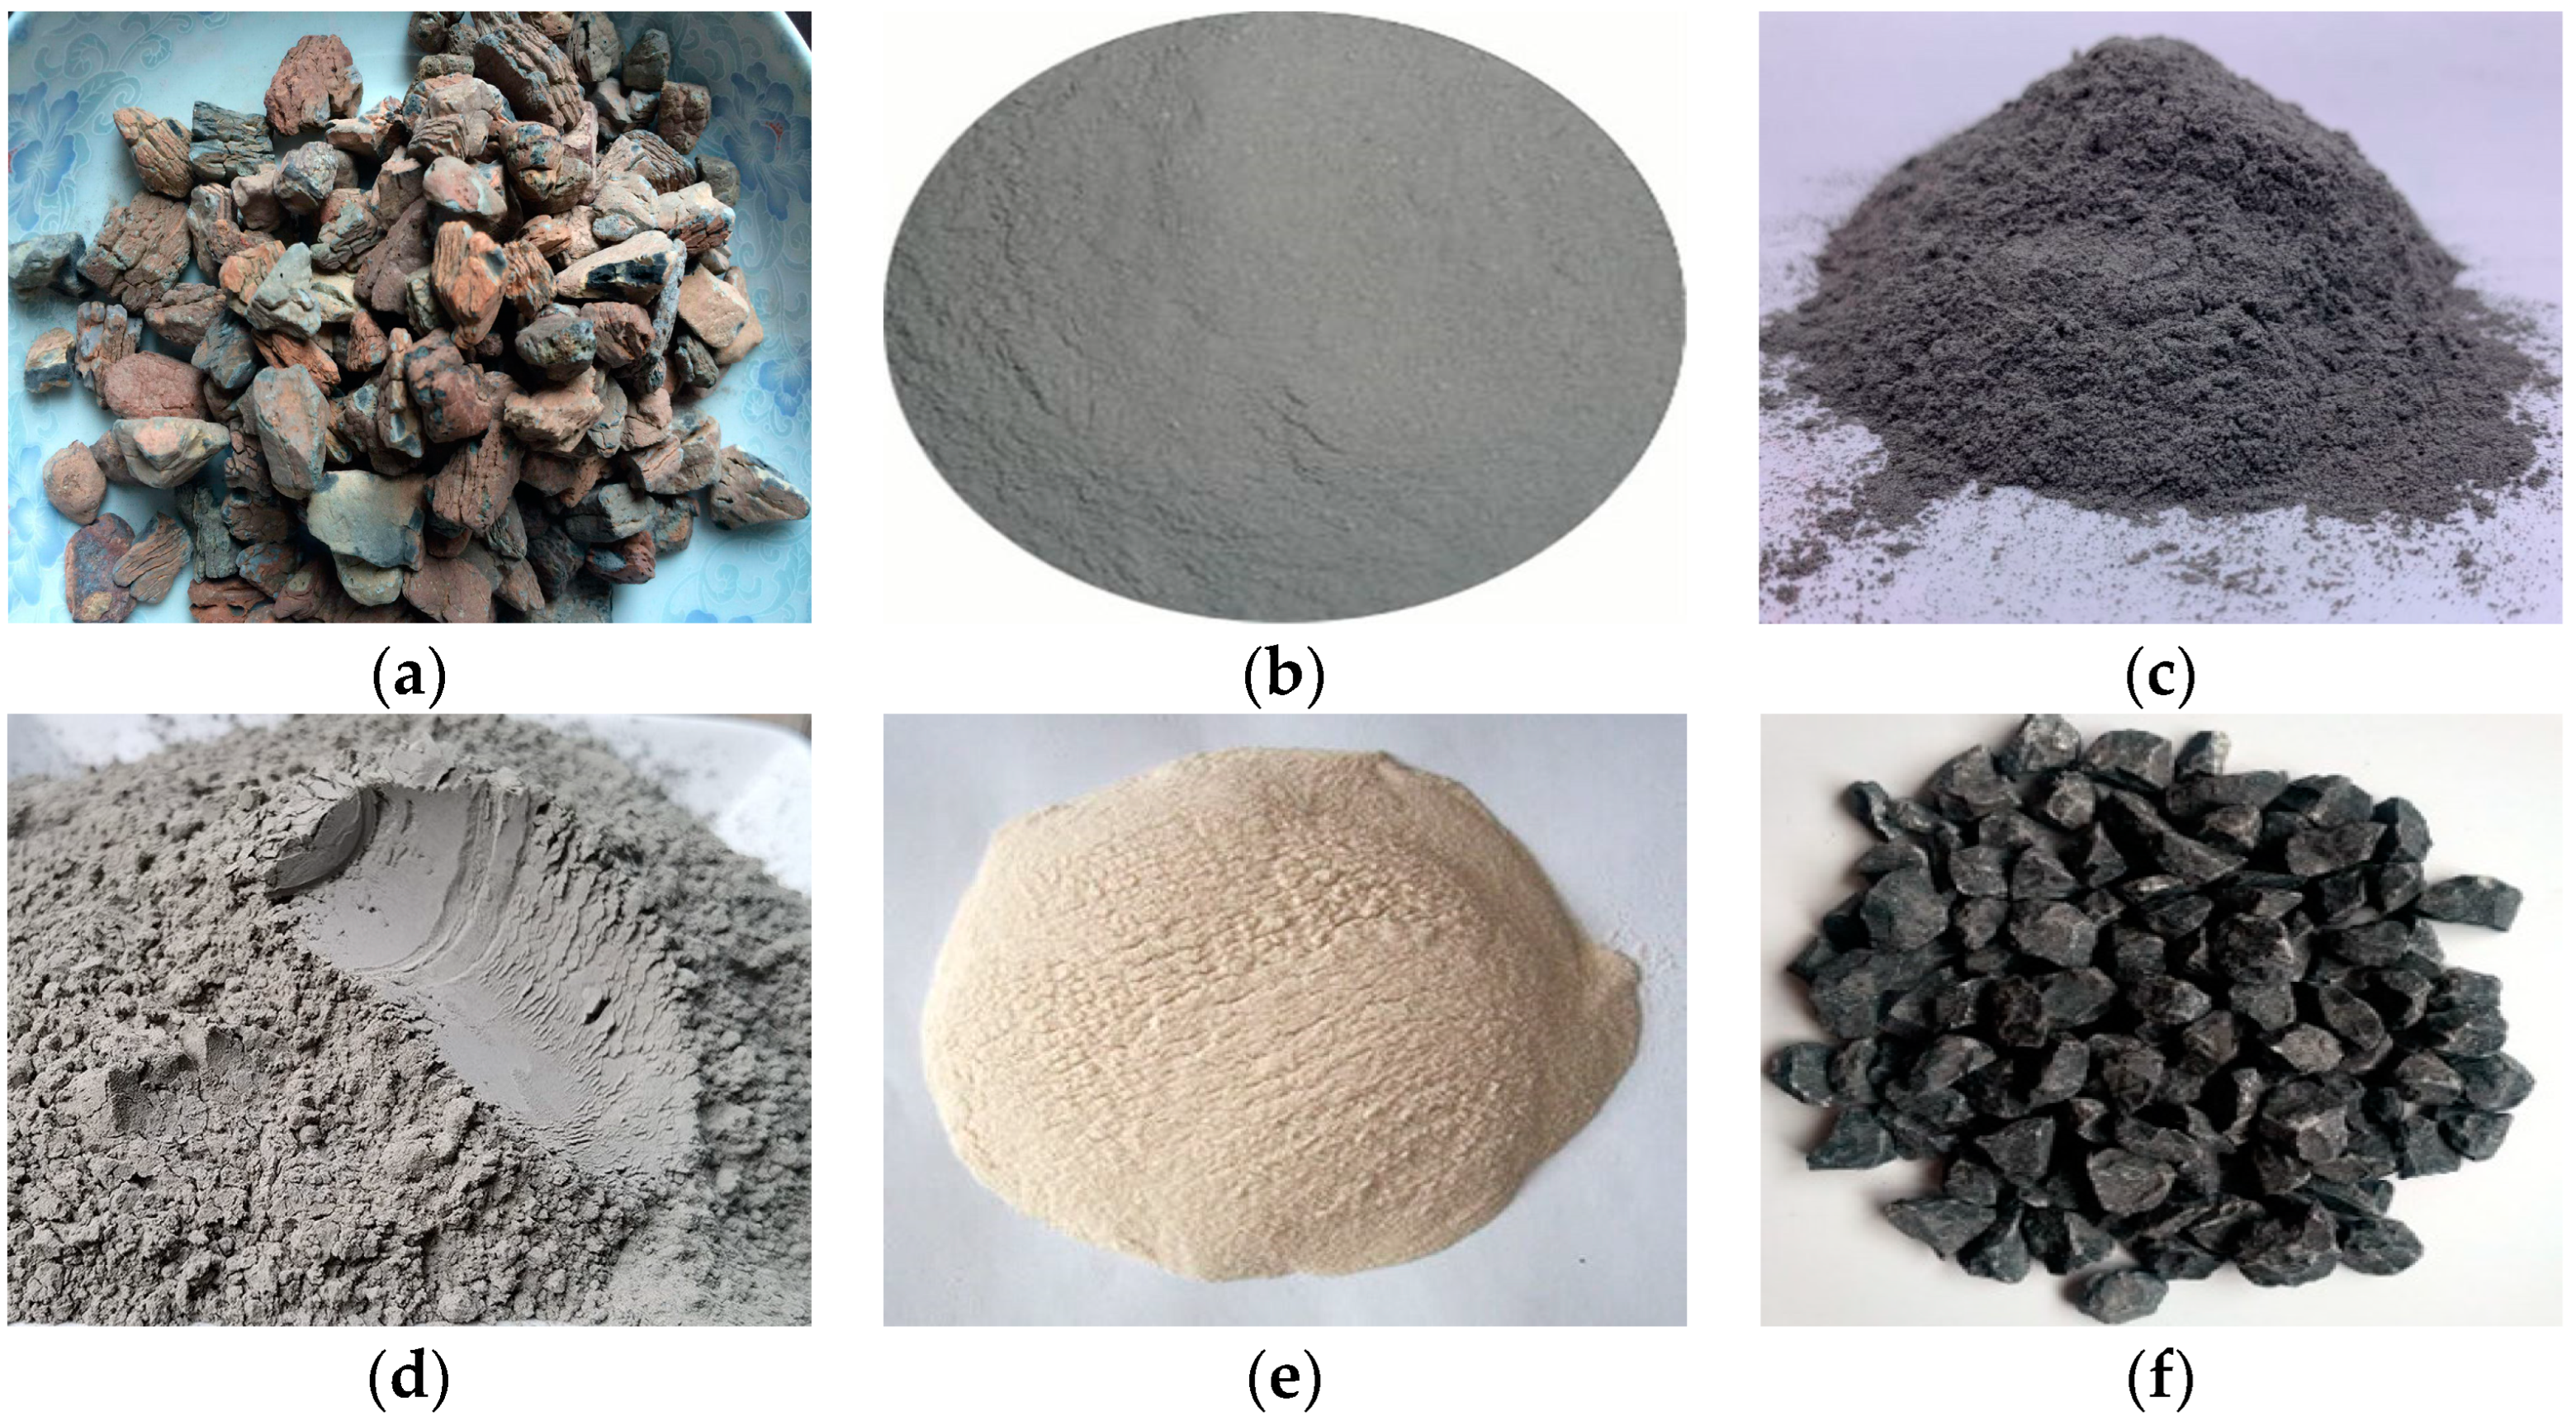
2.1. Materials

The test used P.O.42.5 grade ordinary Portland cement, high-quality first-grade fly ash, and silica fume (96% content) as the cementitious materials, and the physical and mechanical properties of the cement are summarized in Table 1. The fine aggregate was selected from medium sand with a fineness modulus of 2.85. The coarse aggregate was selected from 800 shale ceramsite and basalt crushed stone with particle sizes of 5–20 mm. The water–cement ratio of the test was 0.32.
The materials of the HSLC are shown in Figure 1. Since the variety of ordinary concrete aggregates in this study was certain, only its volume substitution was changed, replacing the same volume of basalt with different proportions (0%, 25%, 50%, 75%, and 100%) of shale ceramsite, respectively, to be used as different ceramsite admixture concrete proportions. The specimens of ordinary concrete, mixed aggregate concrete, and light aggregate concrete were numbered C0, C25, C50, C75, and C100, respectively. Five 100-mm-cubic specimens were prepared according to the ratios in Table 2, and the concrete was tested after curing for 28 days under standard conditions.
The test method used the UCT to measure the compressive strength of concrete specimens under zero circumferential pressure. The uniaxial compressive strength is given by the following equation:
σ c = P A 0
where P is the peak load and A 0 is the initial cross-sectional area of the specimen.

2.2. Mix Proportions and Strength Calculation

Typically, the configuration strength f c u , 0 is expressed as follows:
f c u , 0 f c u , k + 1.645 σ
where f c u , 0 is the strength of the prepared specimen; f c u , k is the designed strength of the HSLC specimen; σ is the standard deviation of the strength.
The mixture proportions were selected to achieve the desired strength while maintaining low density for bridge pavement applications. In this study, the strength of the HSLC should be larger than 35 MPa. Based on this requirement, the configuration strength of the lightweight aggregate concrete was 40 MPa. Given that σ\sigmaσ is 6 N/mm2, according to the standard, the design strength of the lightweight aggregate concrete was 49.87 MPa. The standard specifies that the density grade of ceramsite should not be lower than 600, and the maximum particle size should not exceed 25 mm. This study used grade 800 shale ceramsite with a particle size range of 5–20 mm in continuous grading. Based on the aggregate grade and configuration strength, ordinary Portland cement with a strength grade of C42.5 was selected, with a usage amount of 510 kg/m3. According to the literature [34], the sand ratio for lightweight aggregate concrete with a strength of LC40 generally ranges from 42% to 50%. However, an excessive sand ratio increases the density difference between the mortar and lightweight aggregate, causing segregation within the concrete and reducing its strength. Therefore, the sand ratio for this study was set at 43%. Based on previous research and standards [35,36], the water–cement ratio was set at 0.28, 0.3, 0.32, and 0.34 for the mix proportion tests. Fly ash, which increases the workability of concrete, was used to replace 15% of the cement based on Tian Xiaoxia’s research that indicates higher fly ash content lowers strength [34]. According to Tian’s research [34], adding silica fume increases concrete strength but reduces slump. Hence, 5% of silica fume was used to replace the cement. The amount of water reducer was gradually determined during the mixing process, reaching 1.5% of the cementitious materials. The mix proportions and test results are shown in Table 2.
Table 2 indicates that the water–cement ratio significantly affects the strength and slump of the concrete. Mix ID ③ meets the design requirements in terms of workability and strength. The final mix proportions of the HSLC can be found in Table 3.
Based on the mix proportions in Table 3, basalt crushed stone with a diameter of 5–20 mm was used to replace shale ceramsite. The specific mix proportions are listed in Table 4. The concrete samples used in this study, with varying mix proportions, had densities ranging from 1900 kg/m3 to 2450 kg/m3, depending on the ceramsite content. Five mix proportions were prepared: LWSCC-0%, LWSCC-25%, LWSCC-50%, LWSCC-75%, and LWSCC-100%, representing the replacement ratios of shale ceramsite with basalt crushed stone.

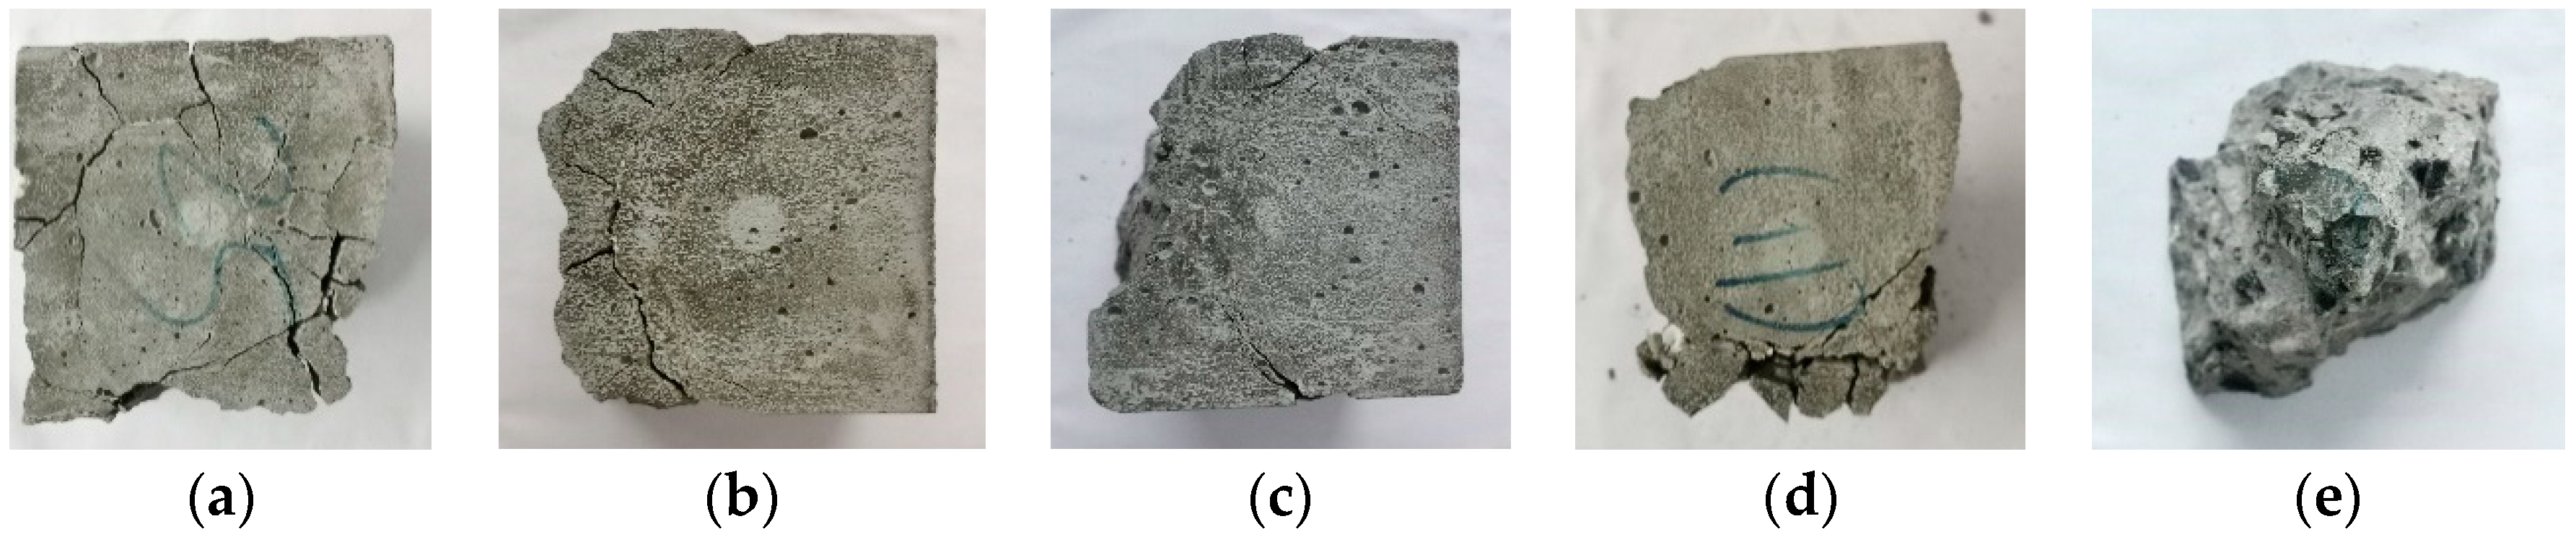
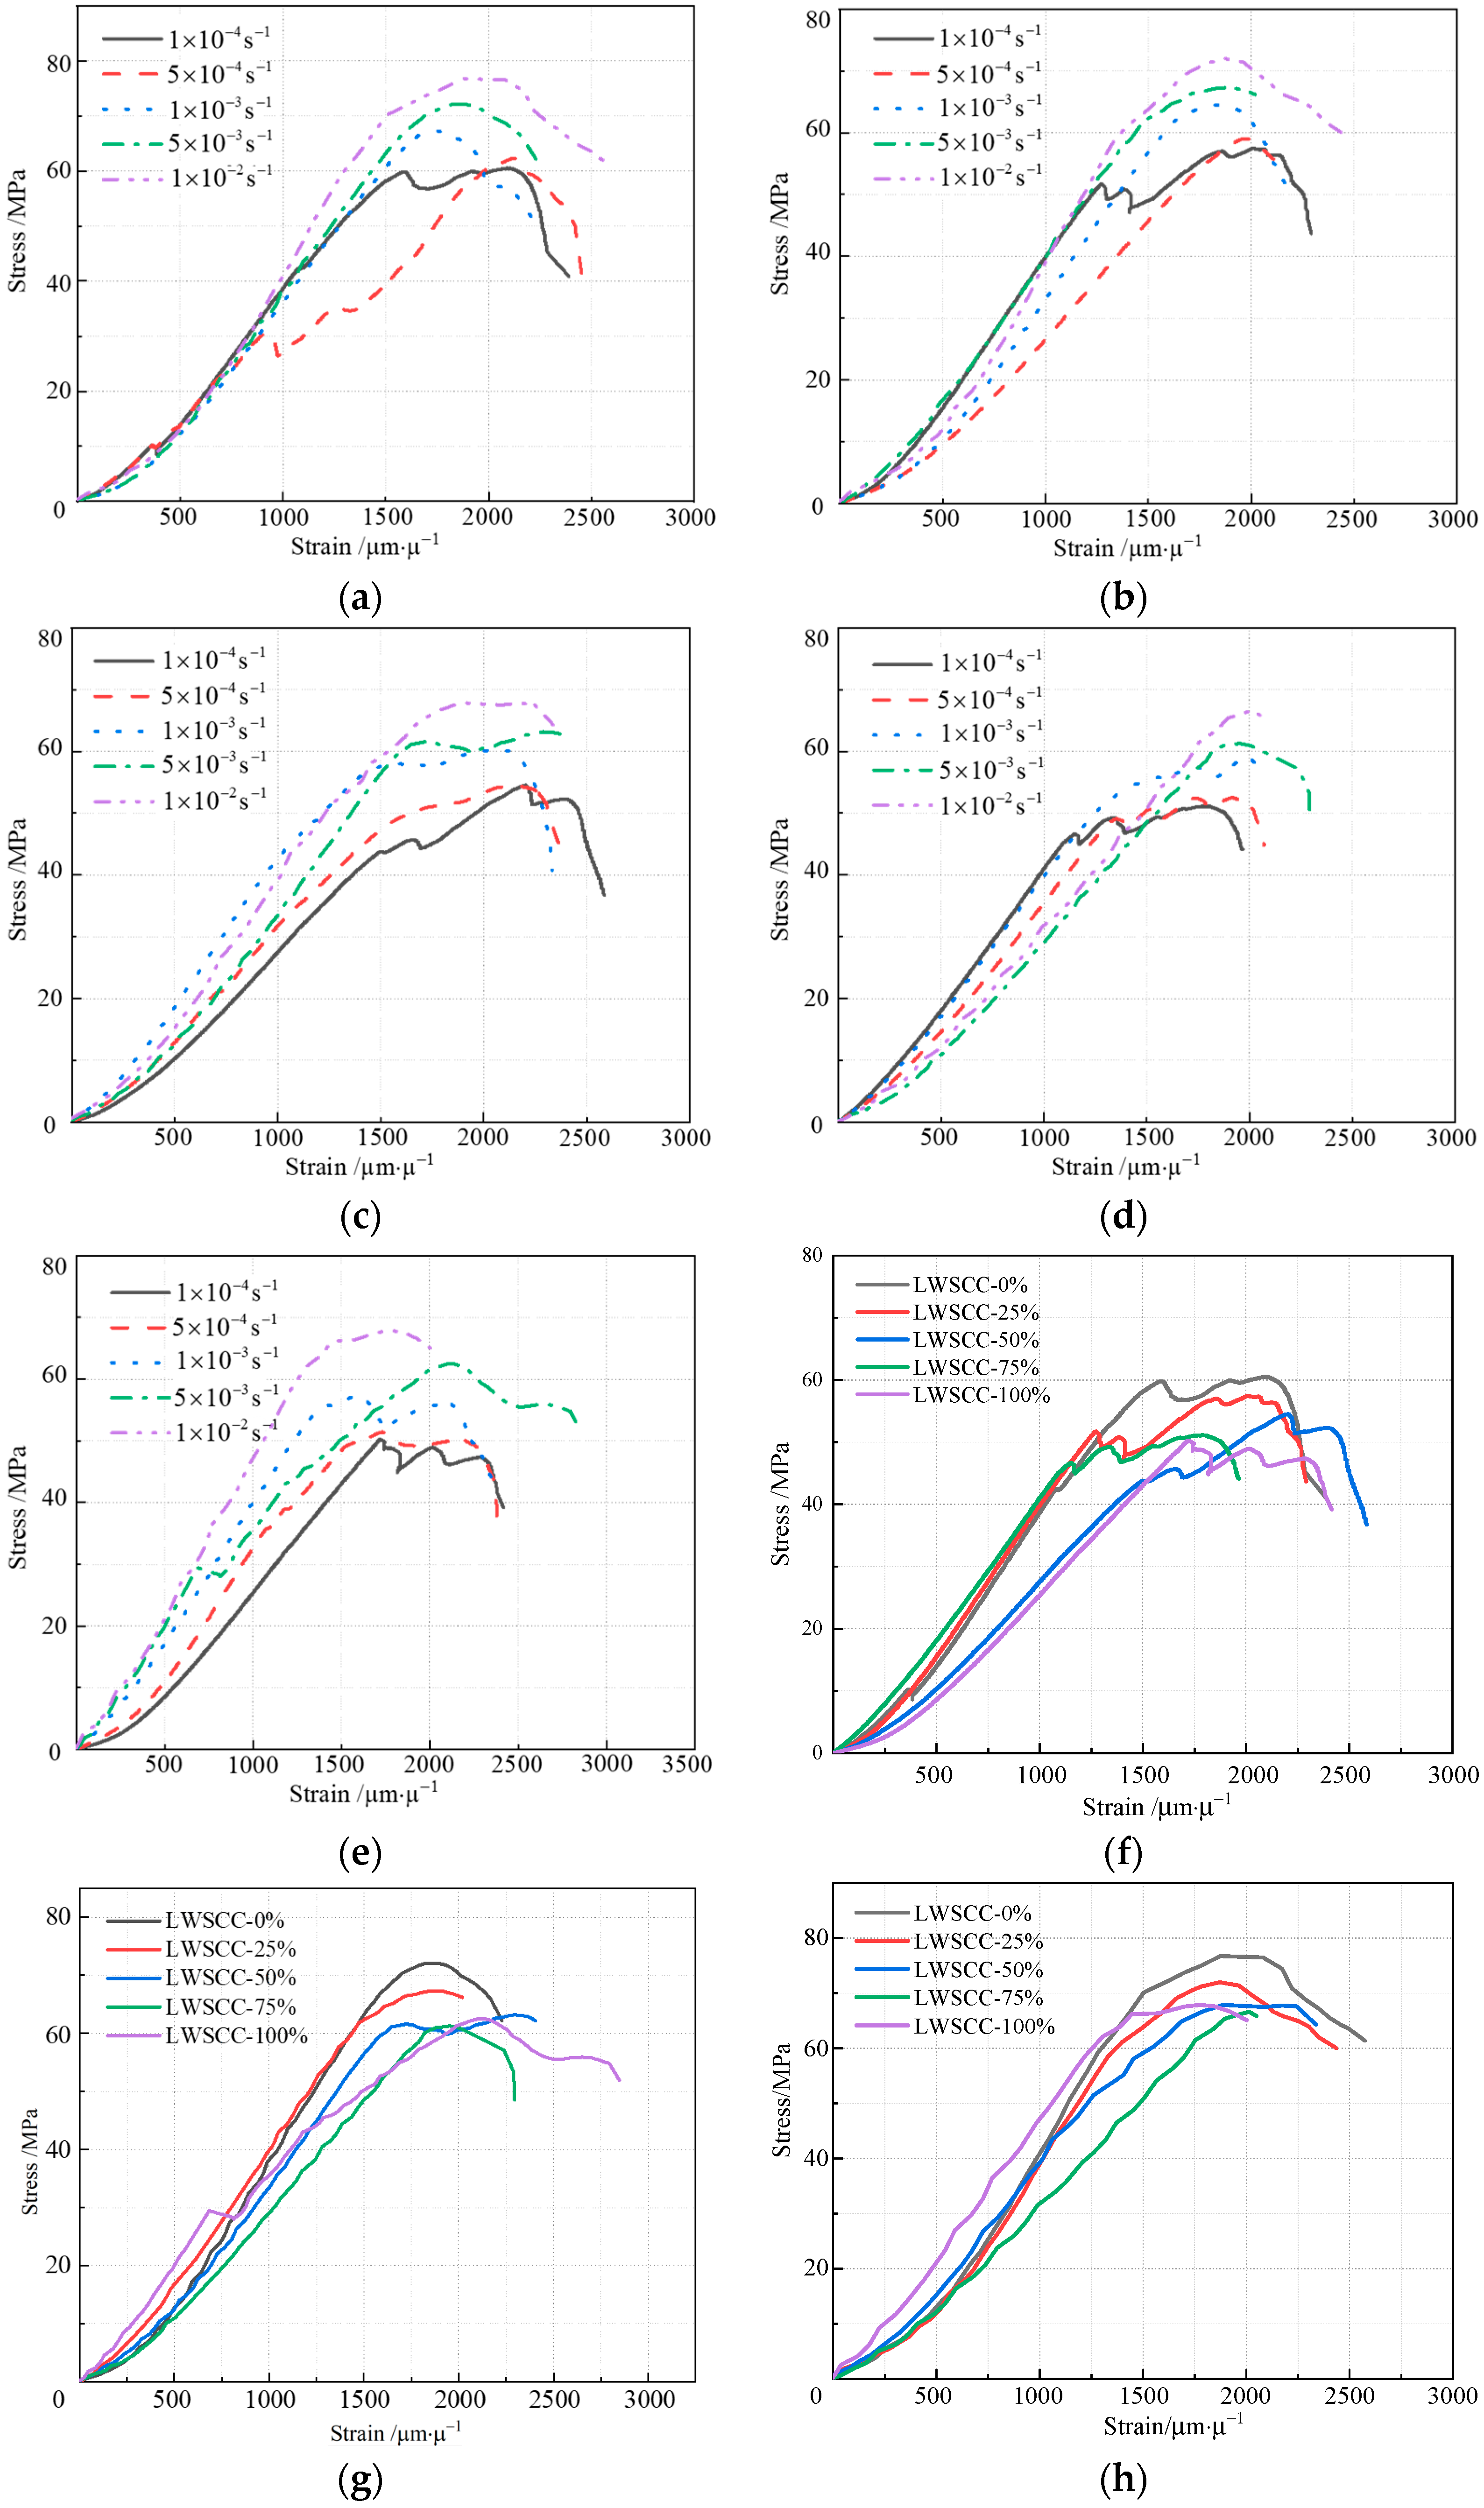
2.3. Uniaxial Compression Test Results of Shale Ceramsite Concrete

Before the formal loading of the specimens, a preloading process was required. During preloading, the load was increased from 0 MPa to 50% of the design strength, and then unloaded back to 0 MPa. This process was repeated three times before formal loading. In the formal loading process, displacement control was adopted, starting from 0 mm until the specimen failed.
Figure 2 and Figure 3a–e show the failure modes of LWSCC-25% concrete specimens under strain rates of 1 × 10⁴/s, 5 × 10⁴/s, 1 × 10³/s, 5 × 10³/s, and 1 × 10²/s. As seen in Figure 2 and Figure 3a, under the static loading strain rate, the cracks in the concrete were evenly distributed on the loading surface. According to Wang’s research [37], the failure modes of shale ceramsite concrete and ordinary concrete differ. For ordinary concrete, cracks often initiate and propagate at the interface between basalt crushed stone and the cement paste. In contrast, for shale ceramsite concrete, cracks typically initiate and propagate within the ceramsite itself, leading to failure. From the failure sections under the five different loading rates, it can be observed that the basalt crushed stone in Figure 2a,b did not fail, and the cracks traversed the interface between the cement paste, basalt crushed stone, and ceramsite. However, in Figure 2c,d, some basalt crushed stones experienced fracture failure. This could be because, at lower loading strain rates, the concrete specimen had a longer load-bearing time, allowing the load to increase slowly and giving cracks ample time to develop. As the loading rate increased, the number of cracks also increased, which required a large amount of energy. Due to the shorter load application time, the cracks did not have sufficient time to develop, so the energy could only be absorbed by increasing the stress. When the stress exceeded the strength of the basalt crushed stone, the stone fractured.
Uniaxial compression tests were conducted on LWSCC-0%, LWSCC-25%, LWSCC-50%, LWSCC-75%, and LWSCC-100%. During the experiments, different loading rates were applied to each type of concrete specimen, resulting in the stress–strain curves for LWSCC-0%, LWSCC-25%, LWSCC-50%, LWSCC-75%, and LWSCC-100%, as shown in Figure 3. From these curves, the peak stress and peak strain of the concrete could be obtained, and the elastic modulus of the concrete could be calculated. These mechanical indicators were used to analyze the dynamic characteristics of the concrete.

3. Mechanical Behavior of the HSLC Slab

3.1. Model Preparation

To simulate the damage conditions of bridge deck pavement slabs under load in actual engineering, and to explore the impact of shale ceramsite content on the early deformation characteristics of concrete and the flexural performance of slabs, three groups of specimens were designed. The dimensions of the HSLC specimens were 1100 mm × 250 mm × 100 mm. The reinforcement of the specimens was consistent with actual engineering, using a 12 mm-diameter rebar, with a spacing of 100 mm between vertical and horizontal rebars, and a protective layer thickness of 25 mm. The rebar was fixed at the nodes with binding wire. The schematic and actual images of the rebar framework are shown in Figure 4.
To accurately monitor the time-dependent strain characteristics of the concrete slab in its early stages, and to ensure that the sensor arrangement does not affect the bonding performance between the concrete and the rebar, the sensor arrangement method was discussed prior to placement. UWFBG sensors were spaced 0.5 m apart, with a total length of 4 m. The center wavelengths of the sensors were calibrated, with three center wavelengths at 1530 nm, 1542 nm, and 1553 nm, respectively. The schematic of the UWFBG sensor arrangement is shown in Figure 4. The use of UWFBG sensors provided high-precision strain measurements, enabling the real-time monitoring of the concrete’s mechanical behavior.

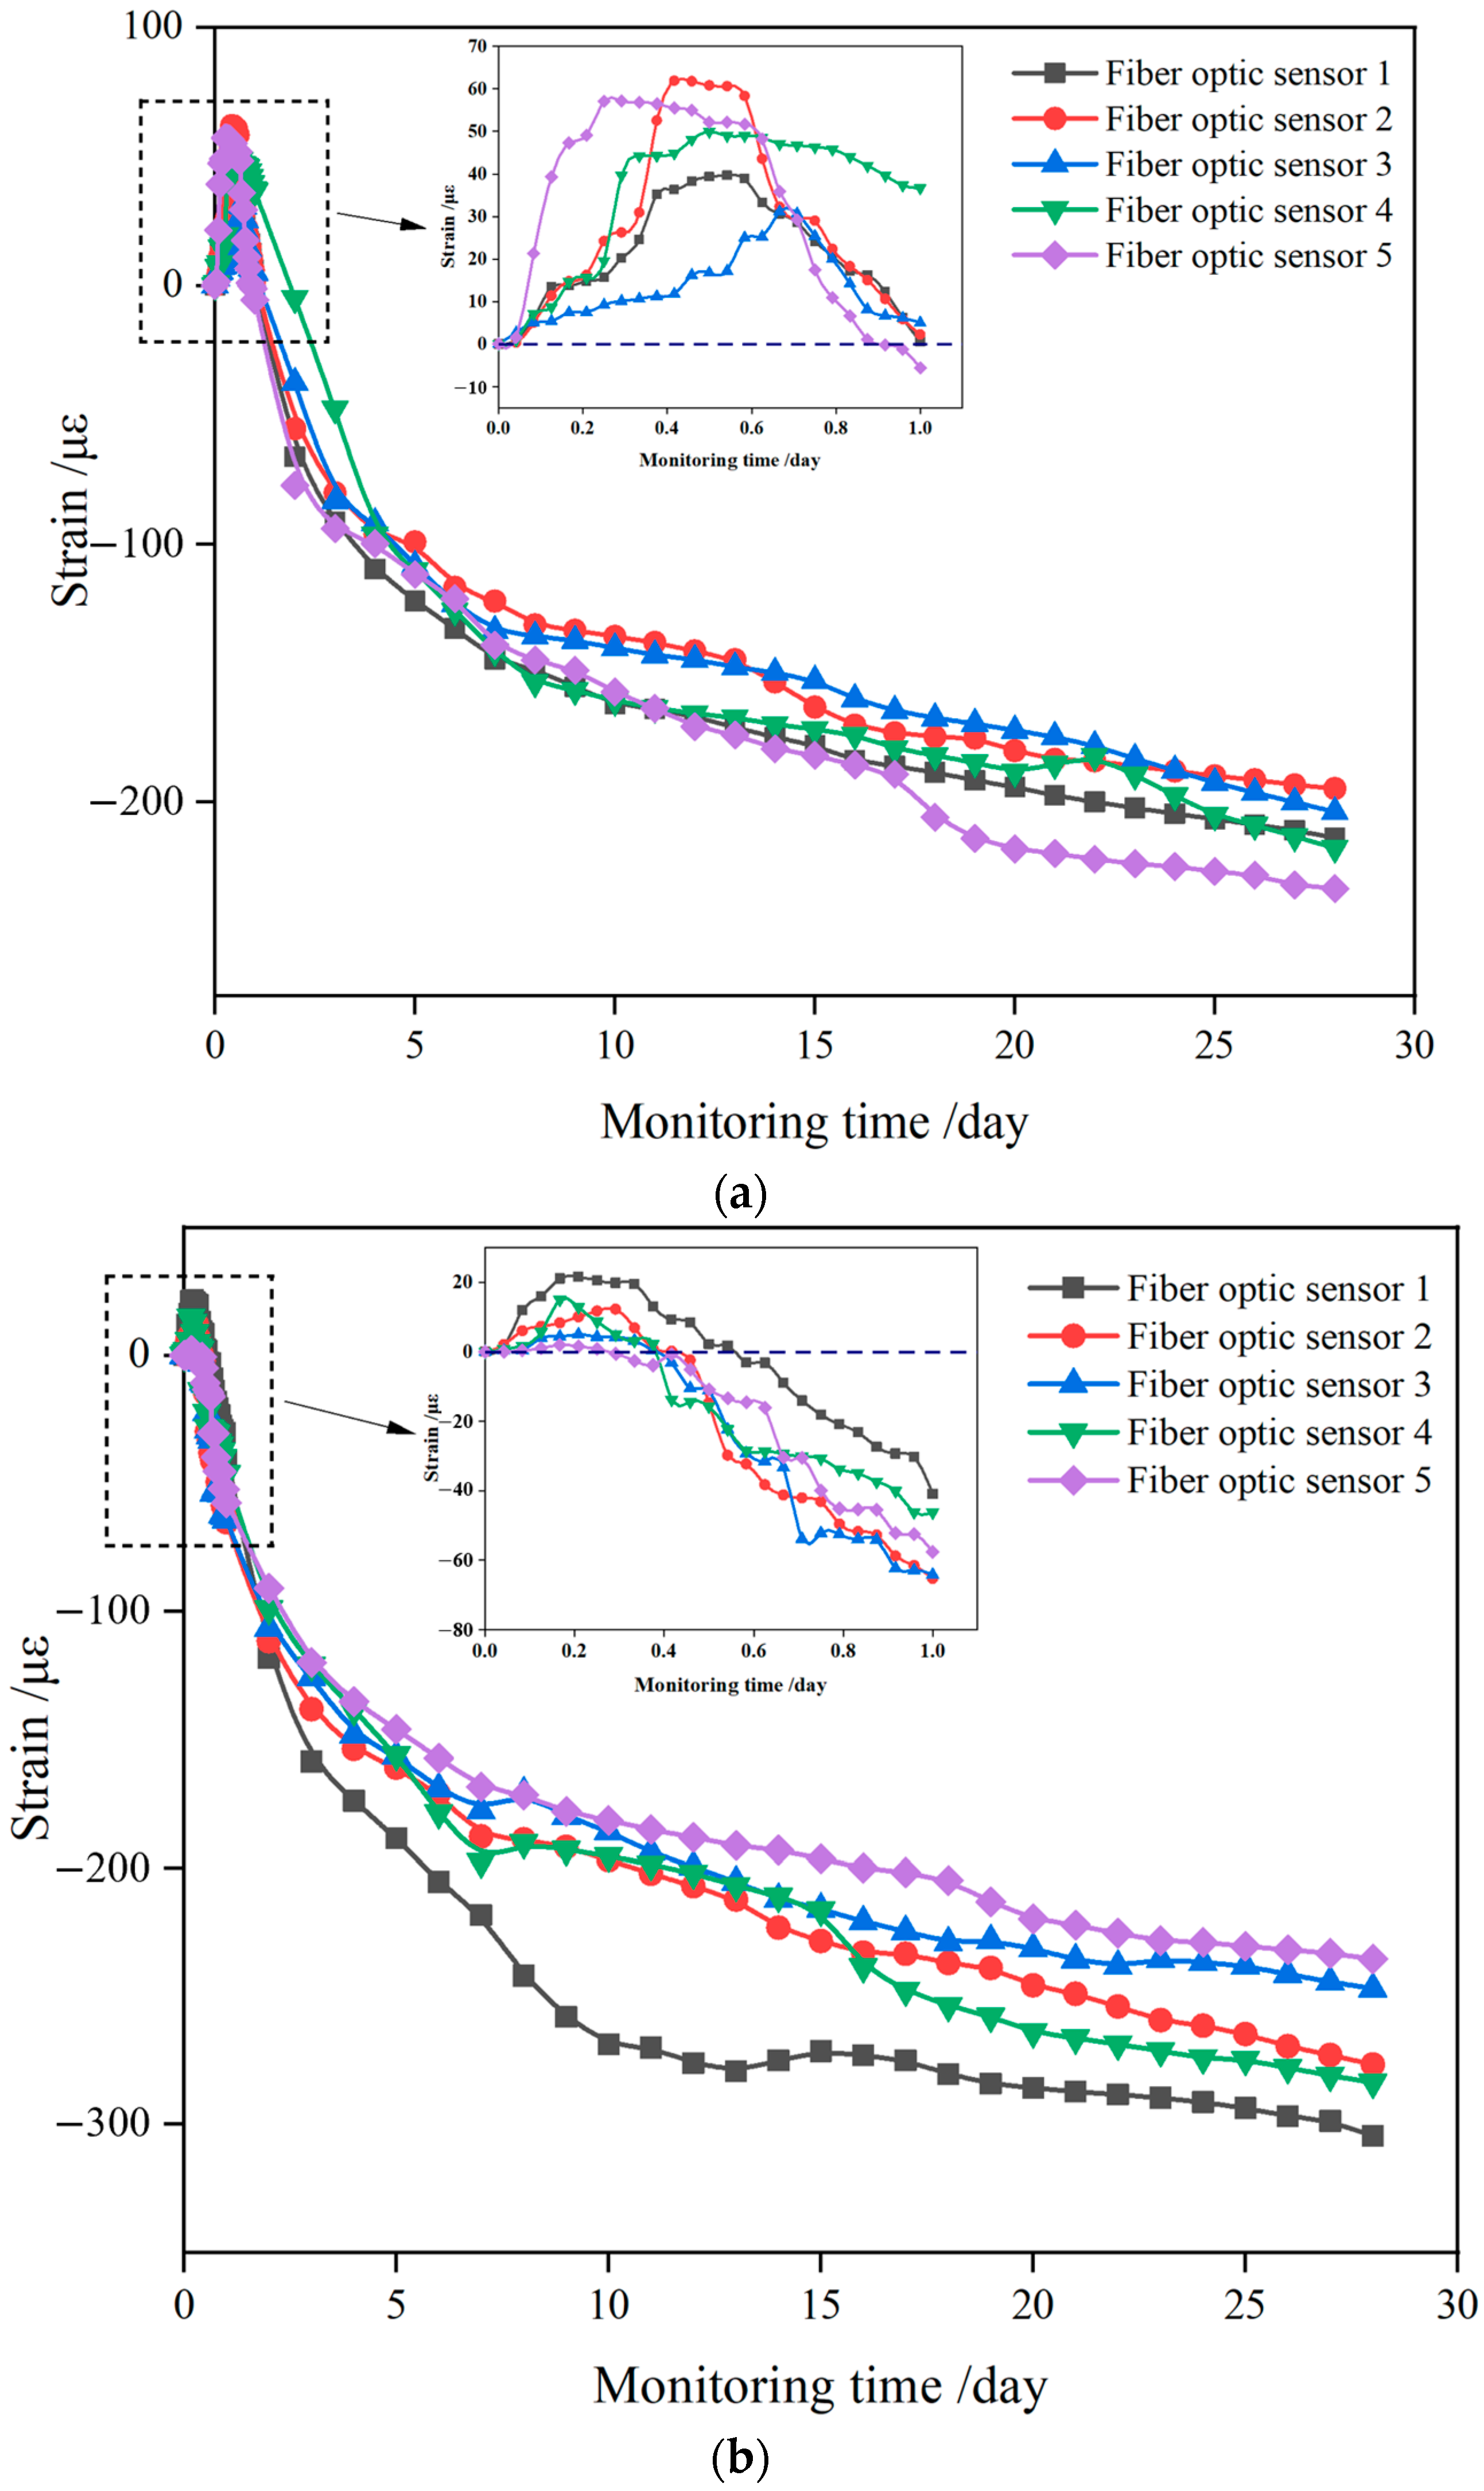
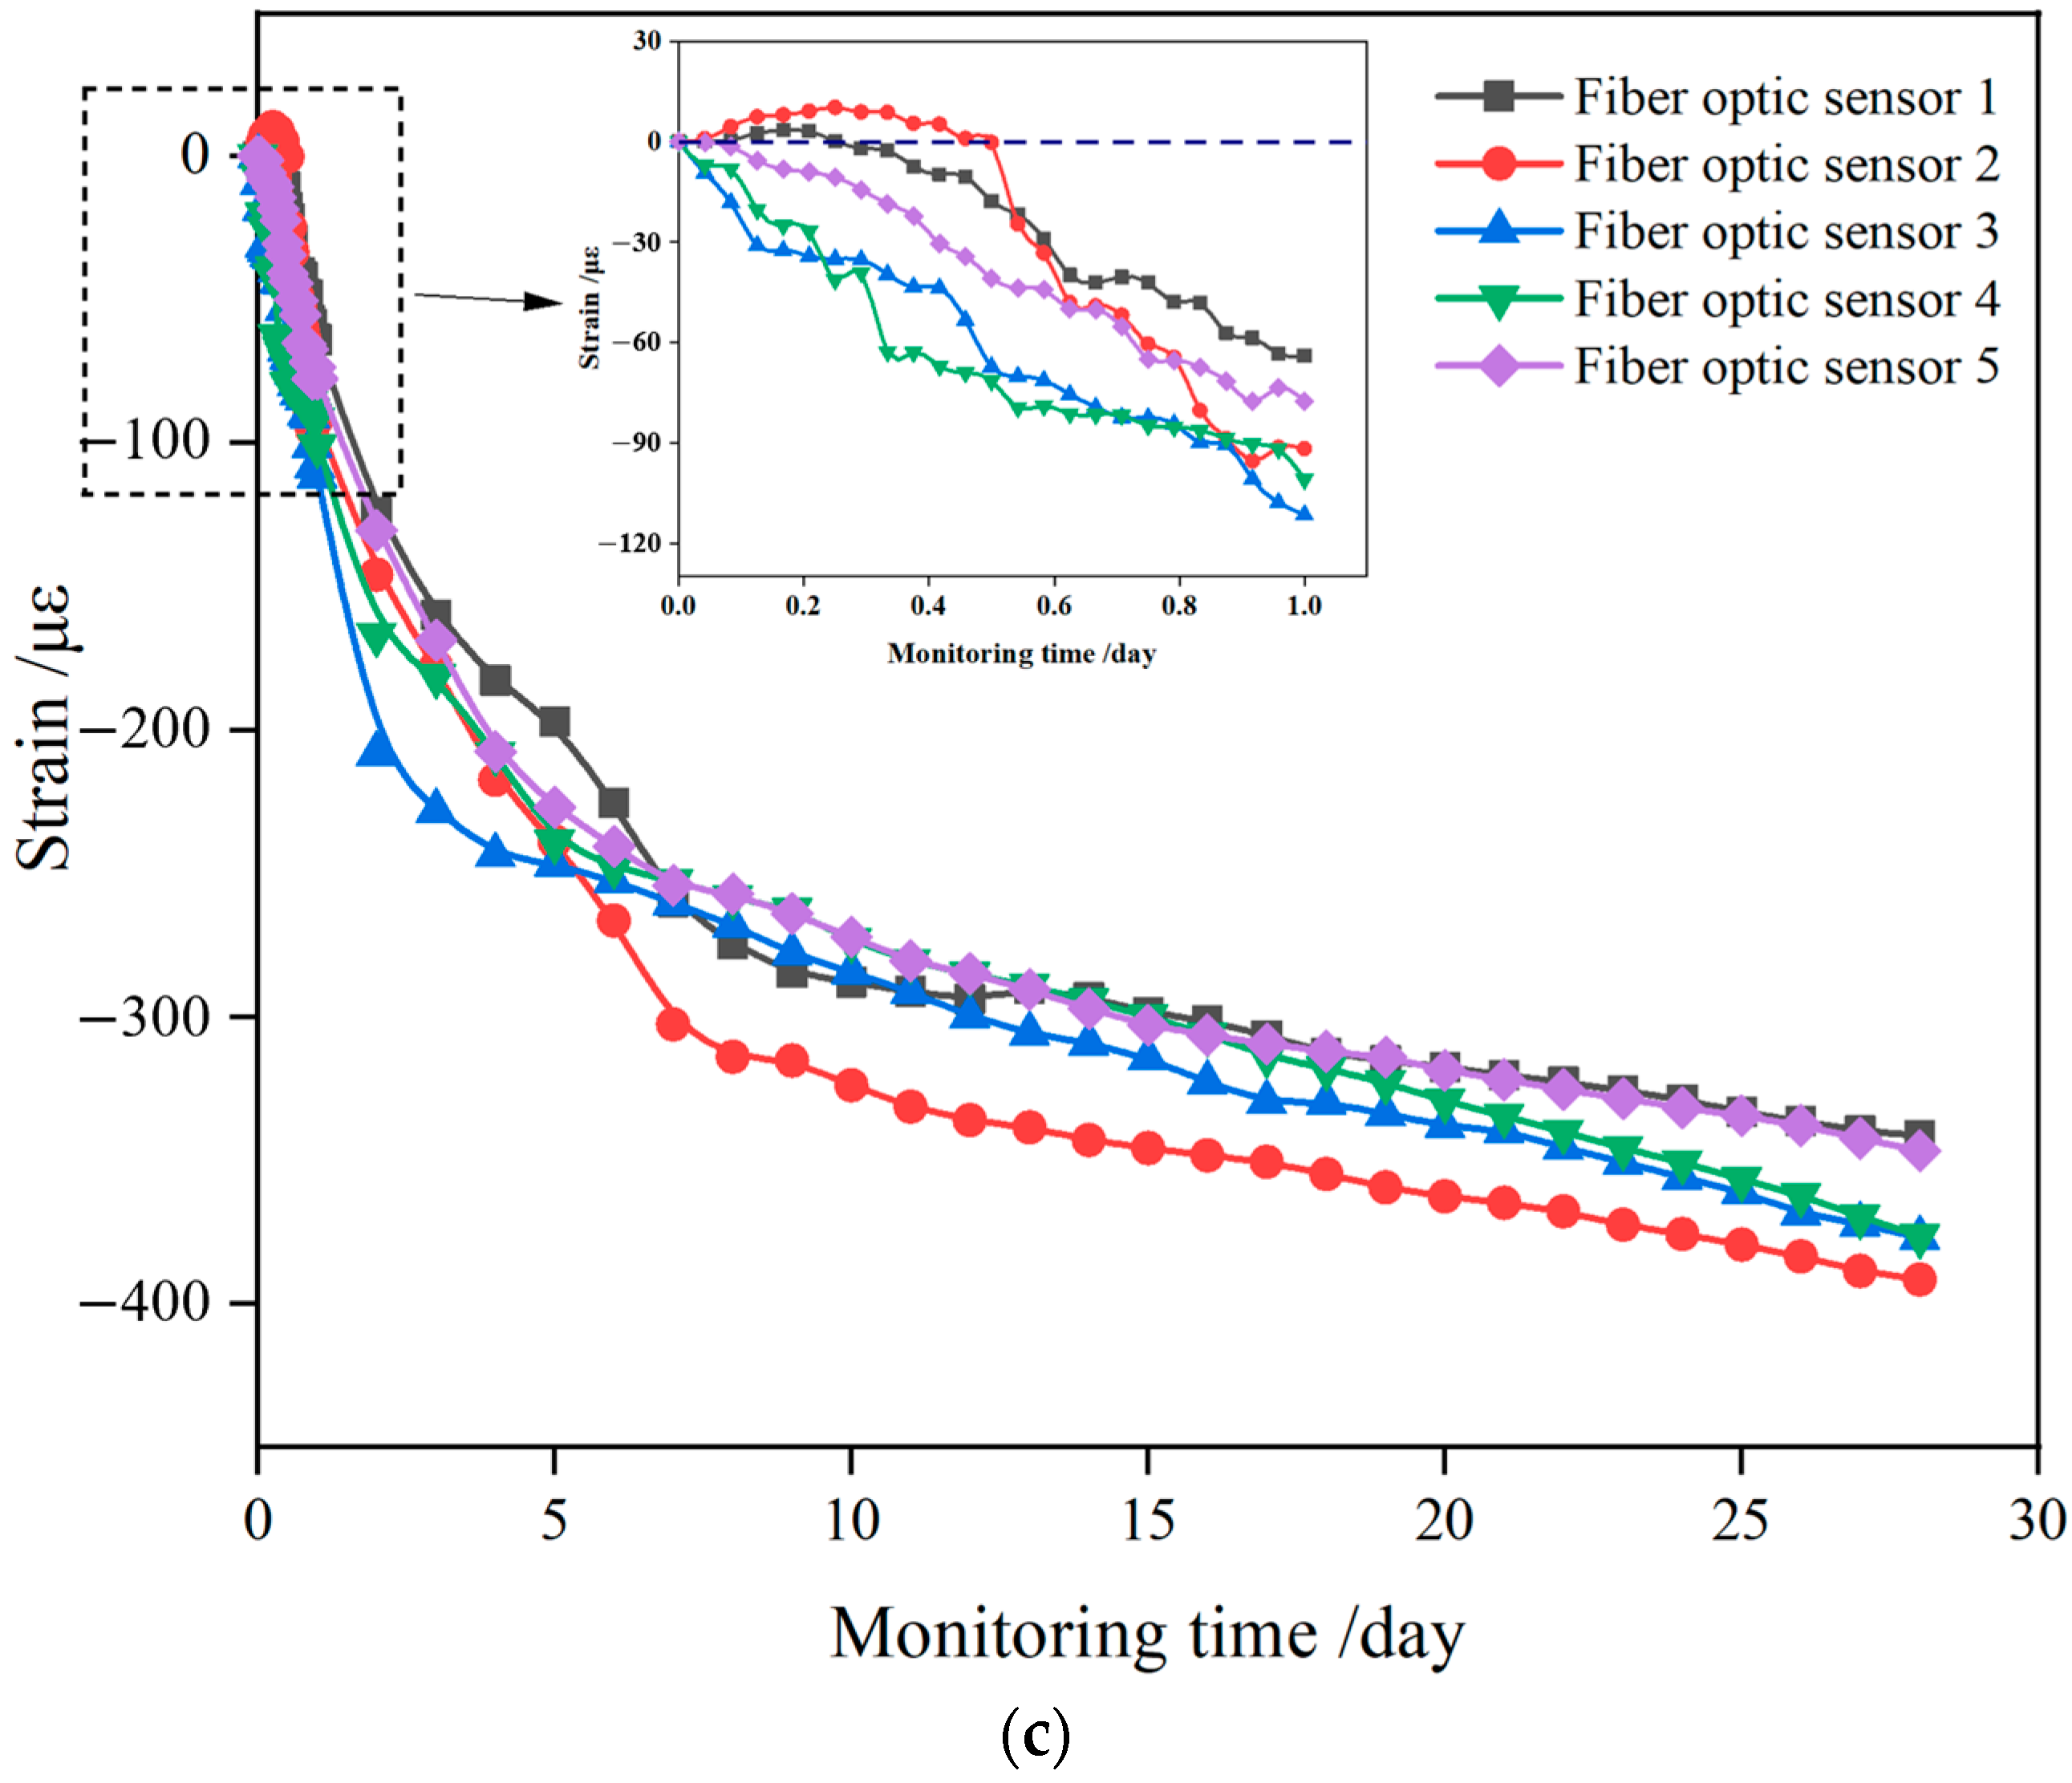
3.2. Analysis of Early Deformation Characteristics

Given the varying numbers of sensors in each group of specimens, five representative sensor data points from each group were selected for analysis and discussion. Figure 5 shows the strain variation trend with time during the curing period for CF0, CF50, and CF100 specimens. It can be observed that the internal strain of the specimens changed significantly in the initial stage after pouring, gradually decreasing over time and stabilizing at around 28 days. Early concrete deformation can be divided into expansion and shrinkage states. The curve trends indicate that the specimens are in an expansion state when the strain increases, and in a shrinkage state when the strain decreases. The discrepancy observed in the strain readings from Optical Sensor 5, compared to other sensors, can likely be attributed to localized material heterogeneity or slight variations in sensor placement during installation.
Overall, the internal strain of the three groups of specimens shows a decreasing trend. However, there are significant differences in internal strain changes on the first day of pouring. The CF0 specimen experienced rapid growth and a subsequent rapid decrease in internal strain during the initial stage, reaching a peak of 61.95 με within the first 17 h. This stage indicates an expansion state, followed by a gradual decrease in internal strain, reaching zero by the second day. Early concrete deformation is strongly influenced by the cement hydration reaction. During the initial pouring stage, the hydration reaction leads to a rapid temperature rise, resulting in thermal expansion. Additionally, some components of the cement expand upon hydration, and the bleeding phenomenon on the concrete surface contributes to the expansion trend. The CF0 specimen shows the most significant initial expansion trend, with CF50 showing a weaker expansion trend, and CF100 showing no detectable expansion trend, indicating that the ceramsite content affects the early expansion trend of the concrete. As the ceramsite content increases, the expansion trend weakens.
To study the effect of ceramsite on concrete shrinkage characteristics, the strain of specimens with different ceramsite contents was analyzed. The average total strains over 28 days for CF0, CF50, and CF100 specimens were −213, −270, and −367 με, respectively. These data clearly indicate that all three groups of specimens exhibited shrinkage strain, with increasing ceramsite content leading to greater shrinkage deformation. The shrinkage strain trend was consistent across different specimens. This phenomenon may be related to the water absorption capacity of the ceramsite. Without pre-wetting treatment, the ceramsite absorbed some water in the initial stage, causing the real water–cement ratio in CF50 and CF100 specimens to be lower than in CF0 specimens. This reduced the free water available for cement hydration. As hydration progressed, the capillary water was gradually consumed, increasing capillary tension and leading to a shrinkage trend in the concrete, thus significantly increasing shrinkage strain. The average shrinkage strain within the first seven days accounted for 64.06%, 70.51%, and 72.54% of the total shrinkage strain for CF0, CF50, and CF100 specimens, respectively. After seven days, the strain change rates of different ceramsite content specimens were almost identical, indicating that most shrinkage deformation occurred within the first seven days. Therefore, enhancing early curing of ceramsite concrete is crucial.

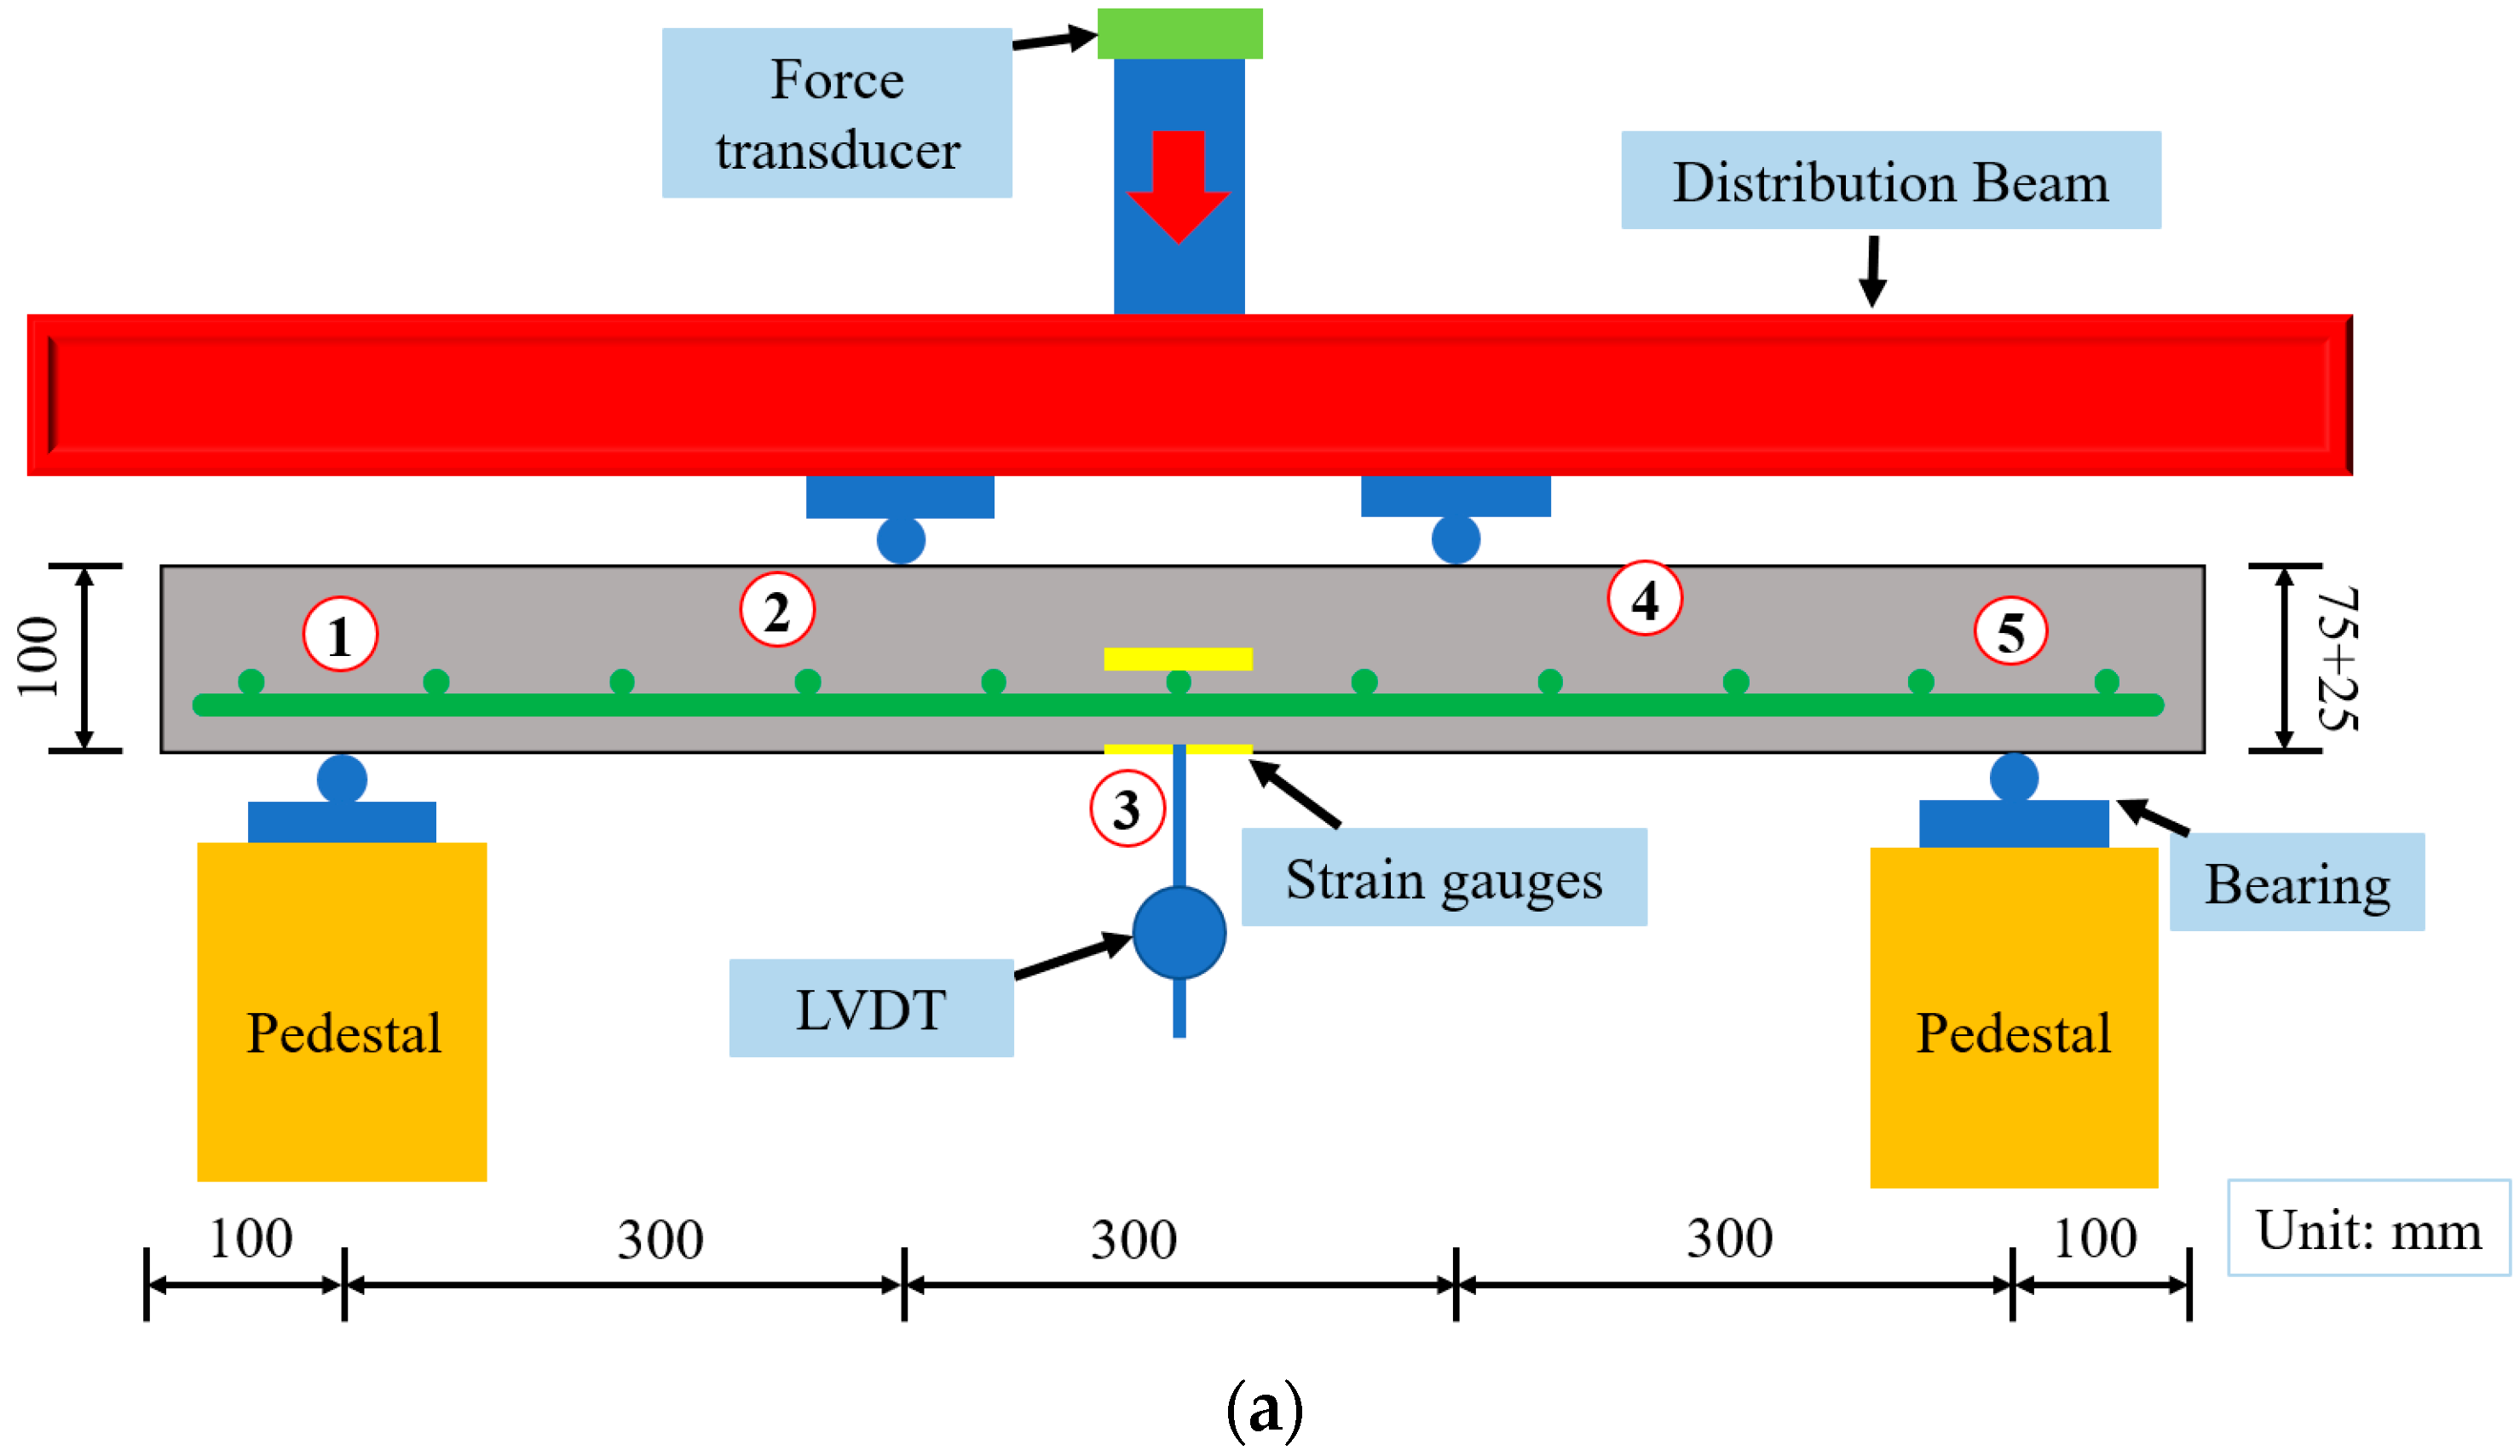
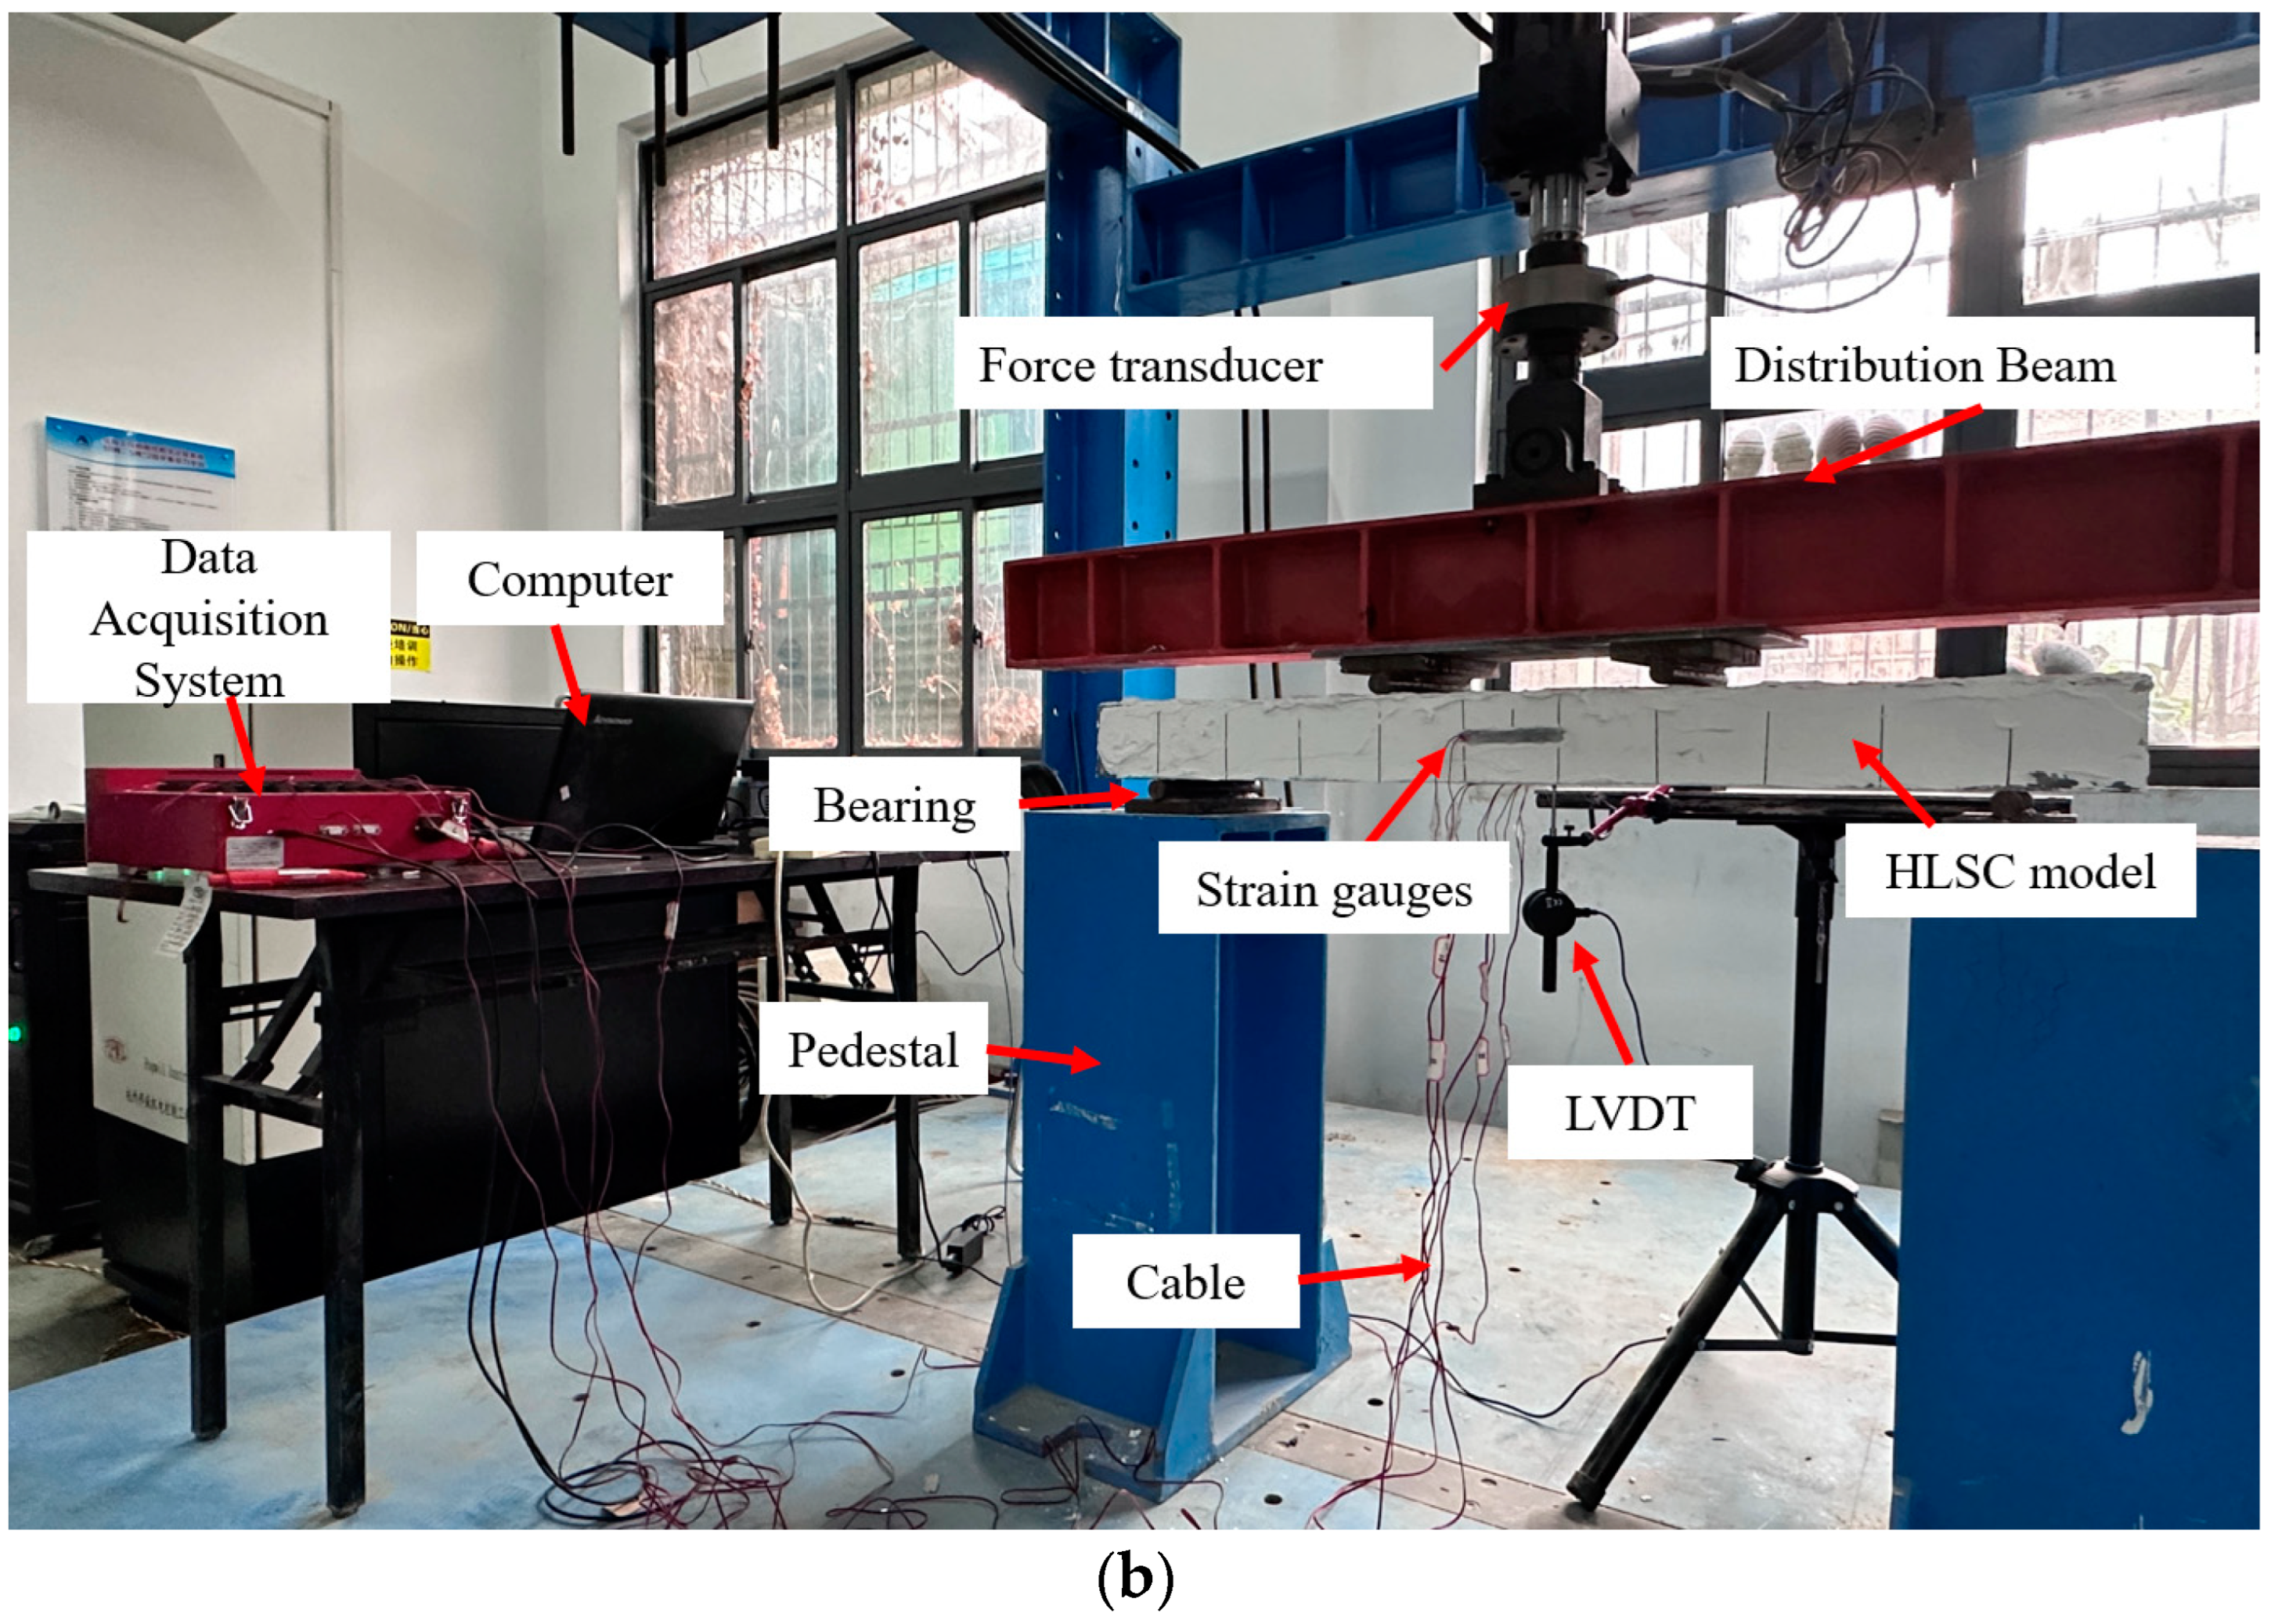
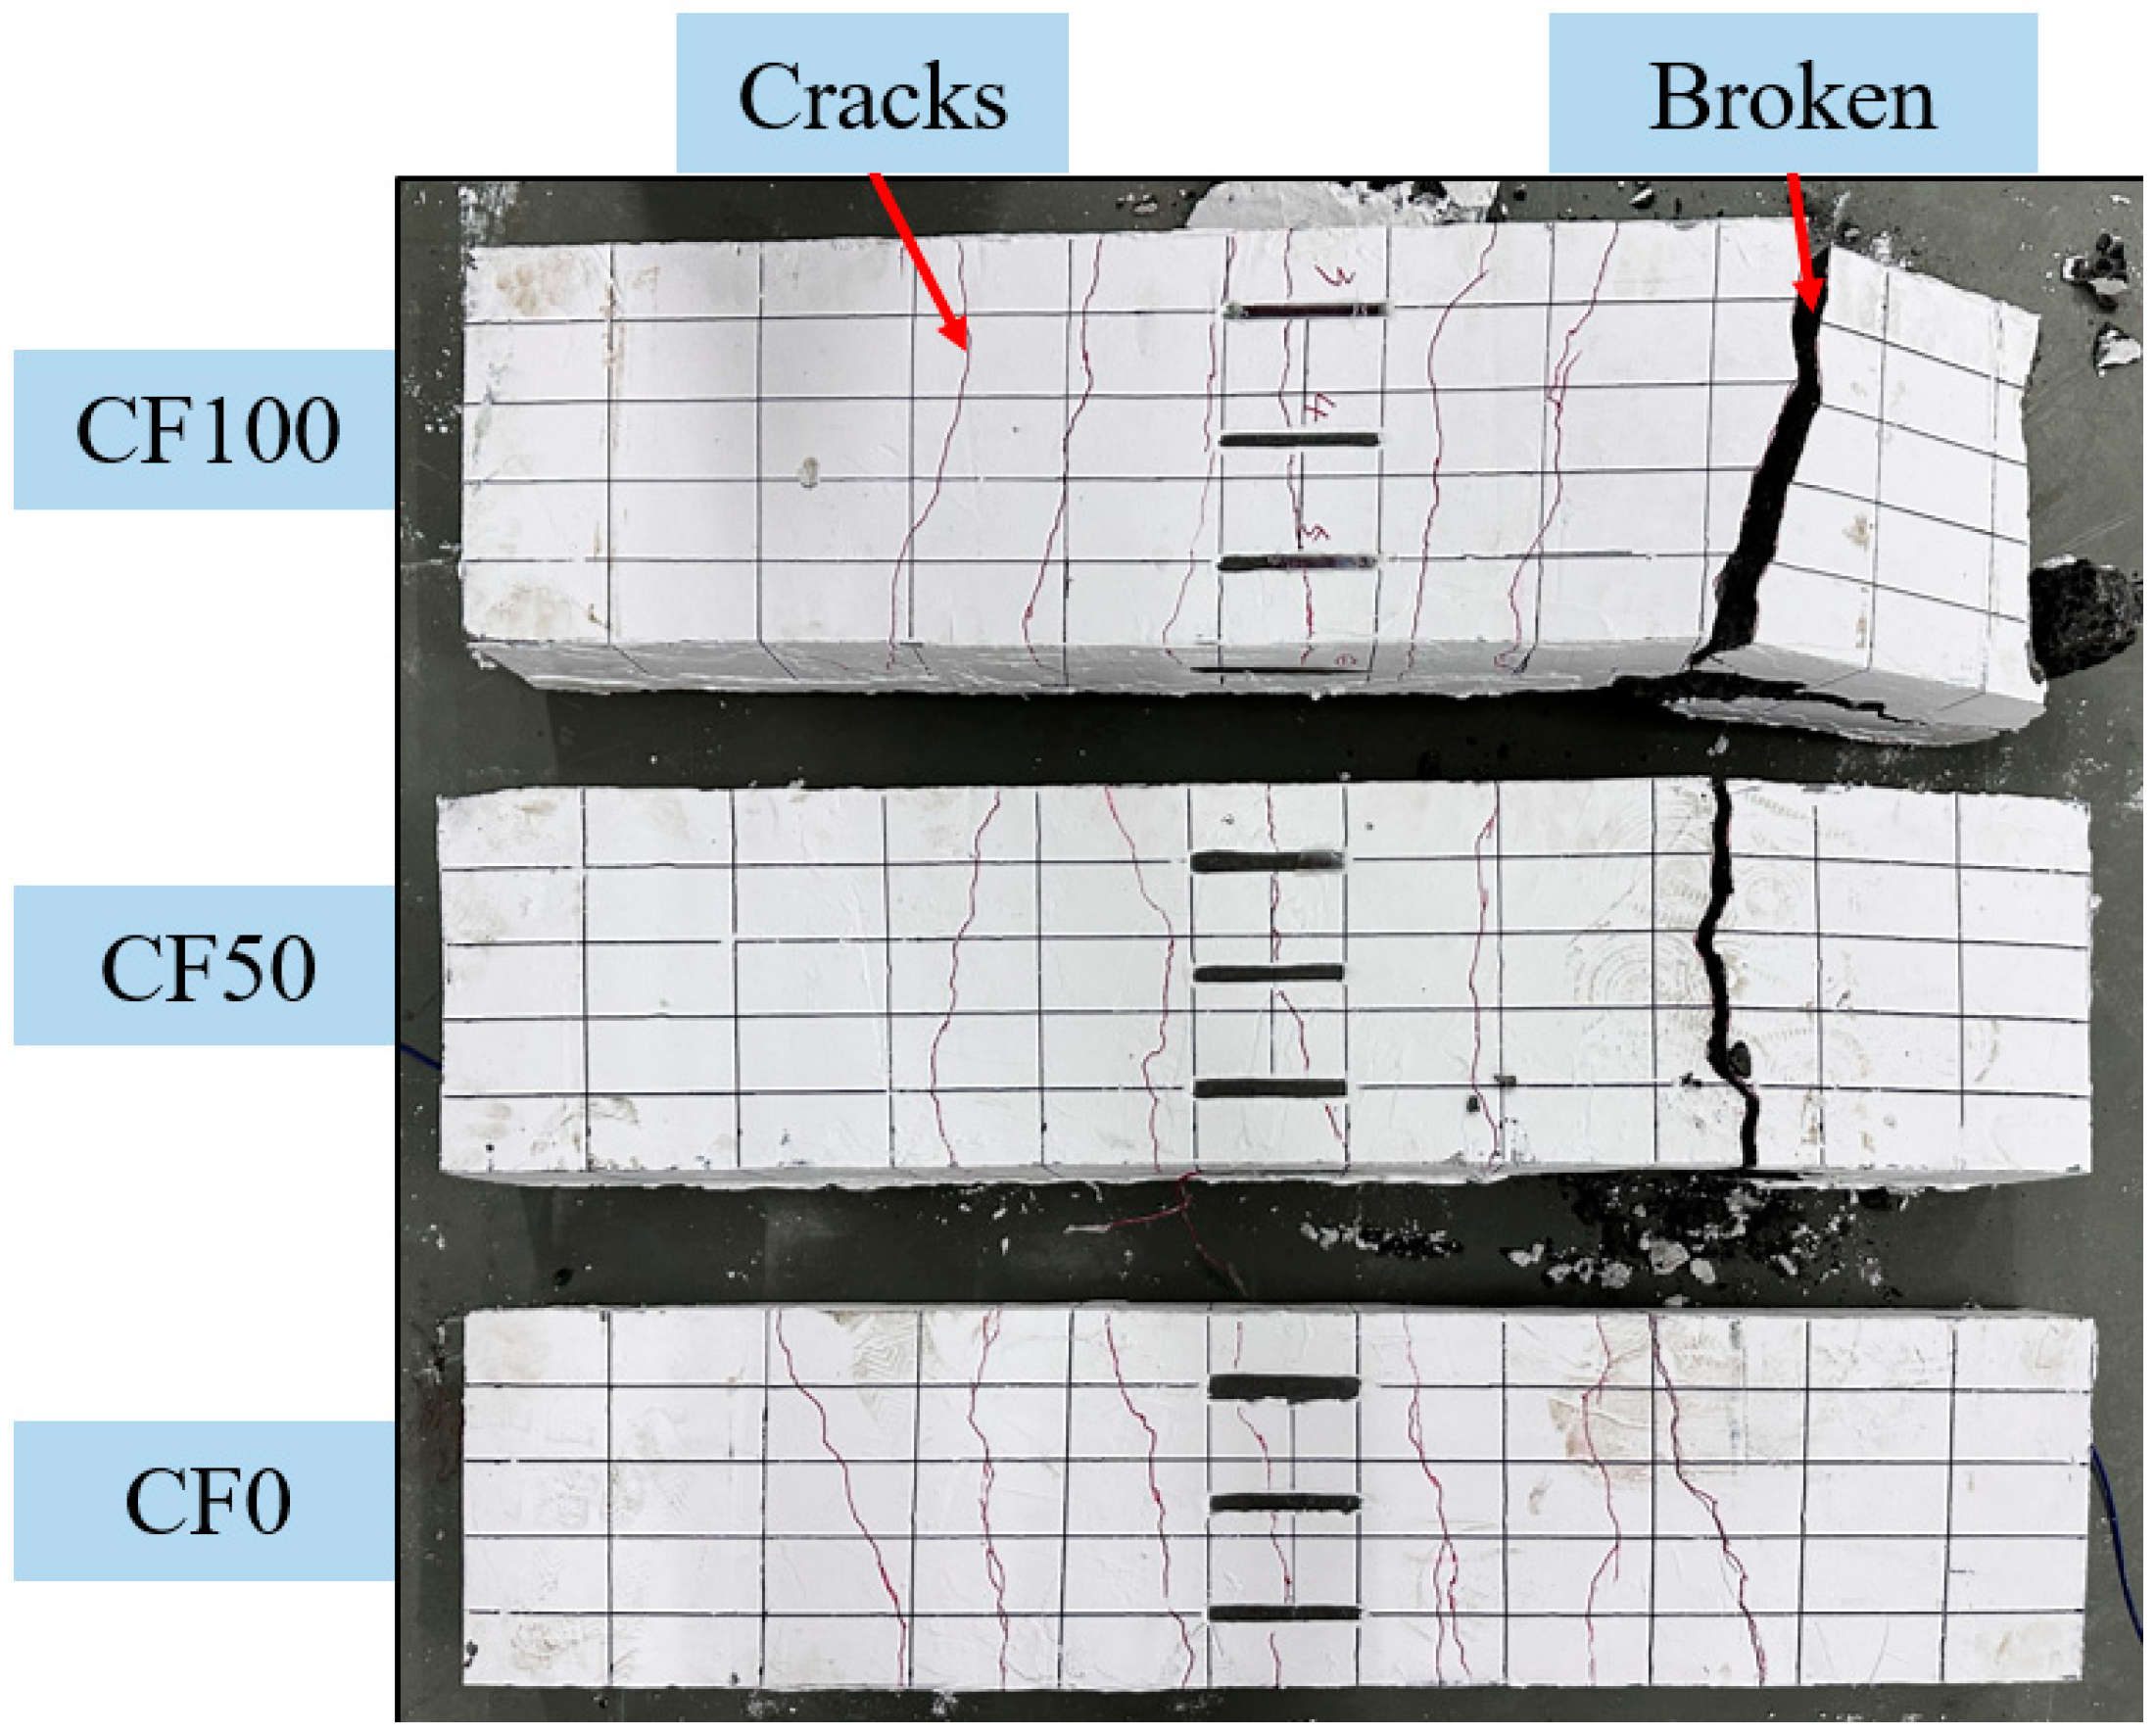
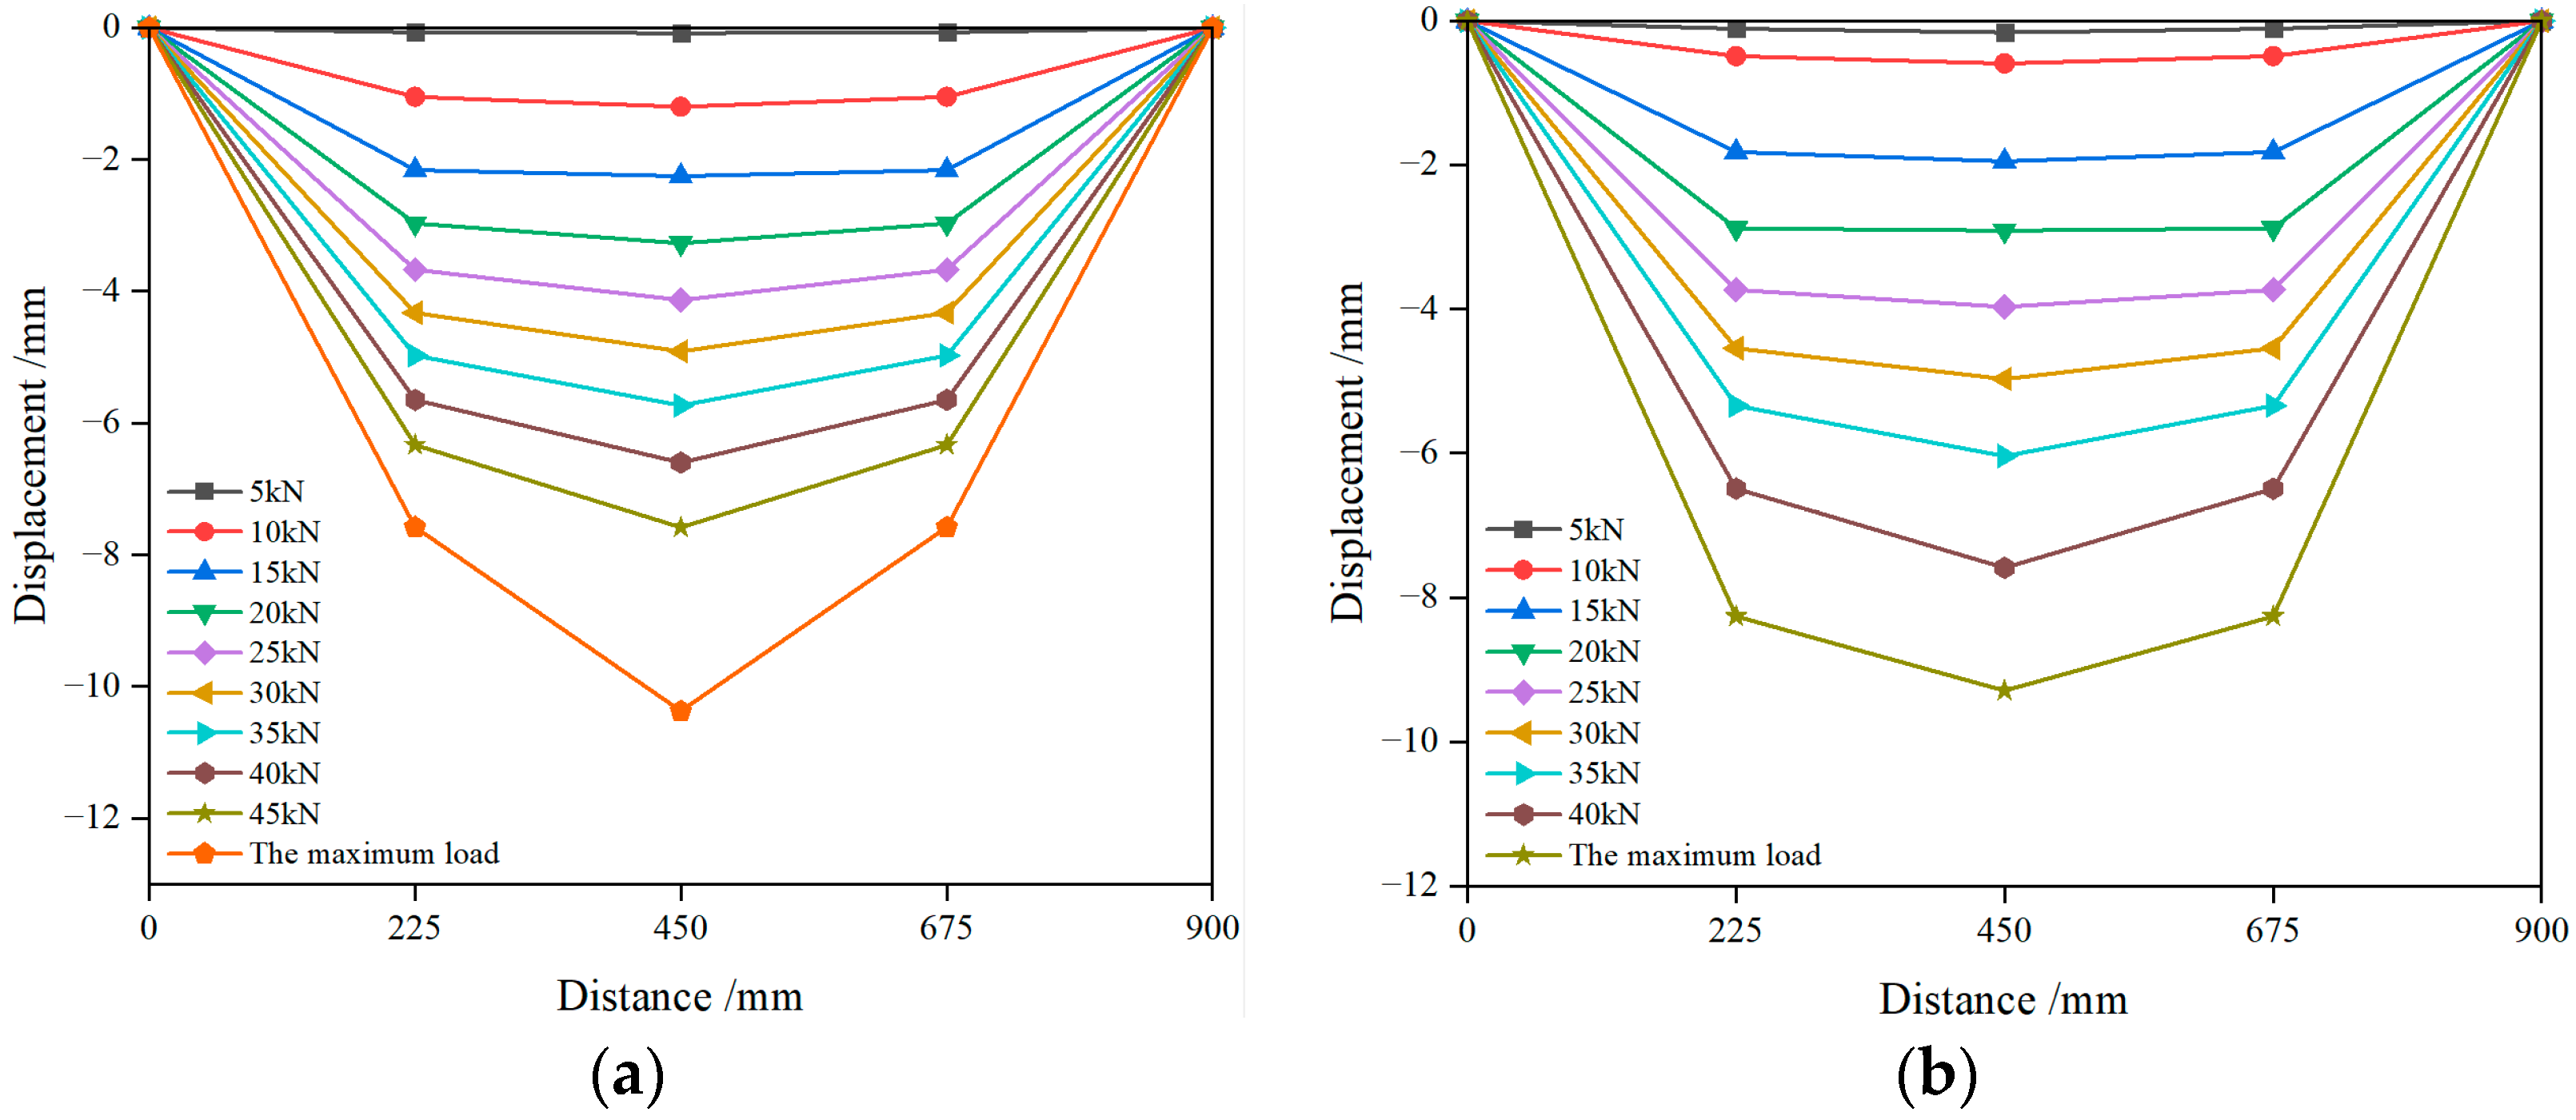
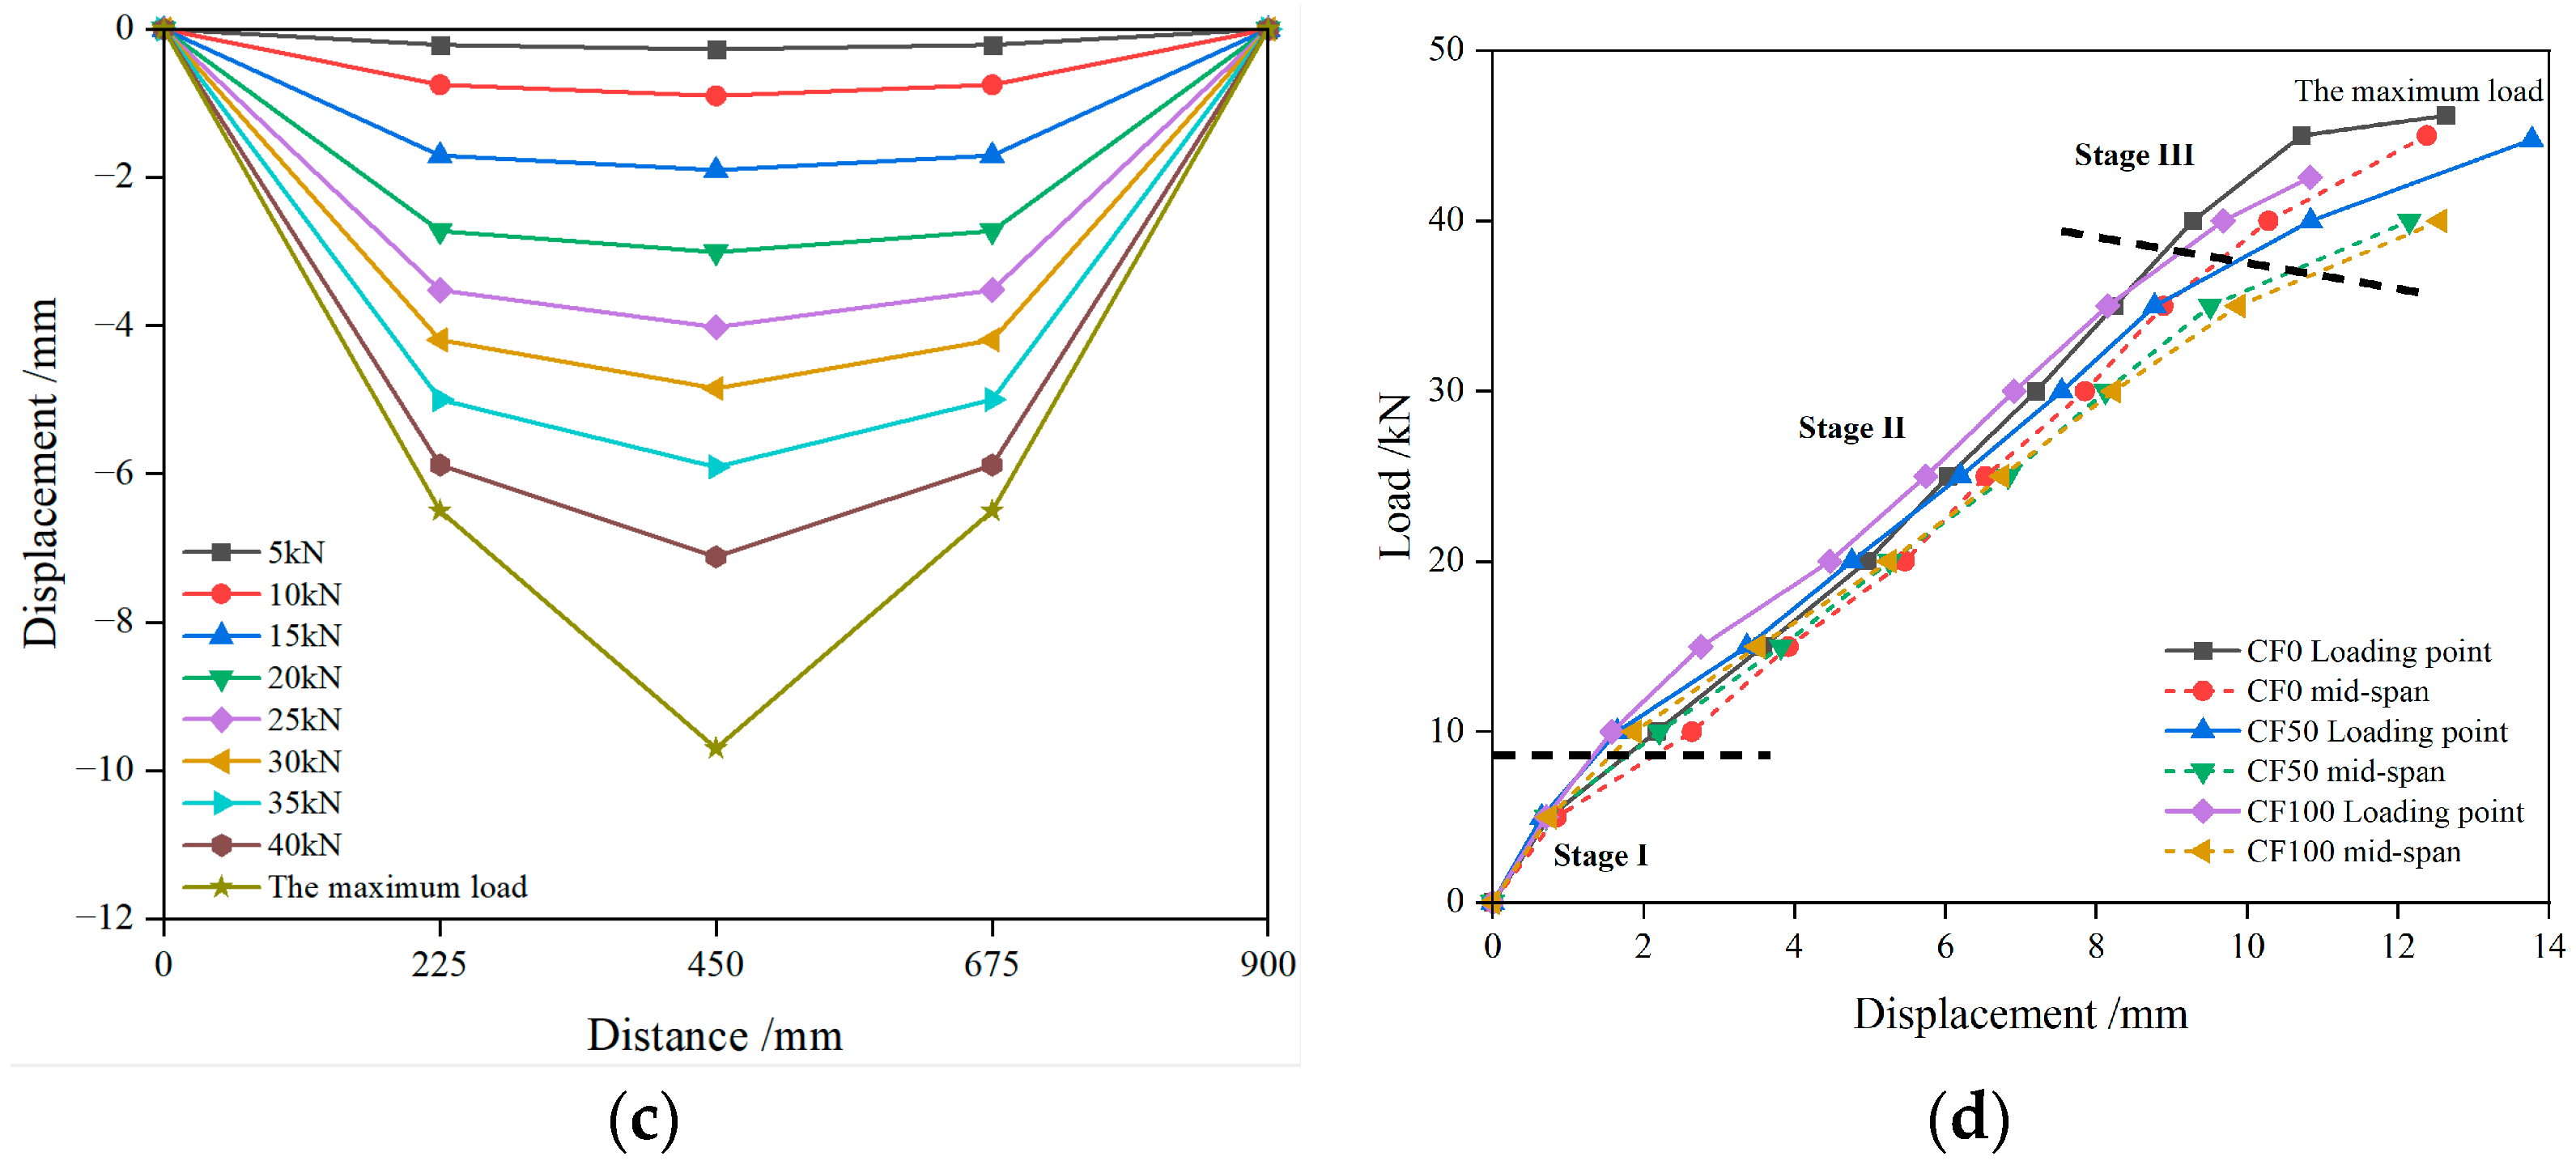
3.3. Flexural Performance Test of Bridge Deck Pavement Slabs

To test the flexural performance of the concrete slabs, static bending tests were conducted. The sample preparation process was consistent with UCT and flexural tests, and the details of specimen setup and test procedures are shown in Figure 6. The concrete slabs were subjected to a four-point bending test, with a pure bending segment of 300 mm in the mid-span to study the flexural and crack resistance performance of the slabs. The load applied by the self-balancing reaction platform was transferred to two loading points through a distribution beam. The displacement at the loading points was recorded by instruments, and the mid-span displacement was recorded by a displacement meter, with five displacement recording points marked. The specimens were loaded in a step-wise manner, with a loading speed of 5 kN/min, pausing for 2 min after each 5 kN increment until specimen failure. Strain gauges were installed at the mid-span bottom and sides of the specimens to measure strain.
Before the test, a 0.05 kN preload was applied to ensure stable contact. At a load of 5 kN, no significant deformation was observed in CF0, CF50, or CF100 specimens, and the mid-span displacement remained stable during the 2-min pause at each load increment. At 10 kN, cracks appeared at the loading points and near the mid-span bottom in all three groups of specimens. The initial crack propagation was slow due to the rebar framework, but the number of cracks increased. At 40 kN, the mid-span deflection and the width and depth of the initial cracks increased rapidly, although the number of cracks remained constant. The rebar yielded with a slight additional load, leading to specimen failure. The final failure of all specimens occurred due to the connection of cracks between the support and loading points. The bottom crack patterns of the specimens after failure are shown in Figure 7.
(1)
Load-Deflection Behavior
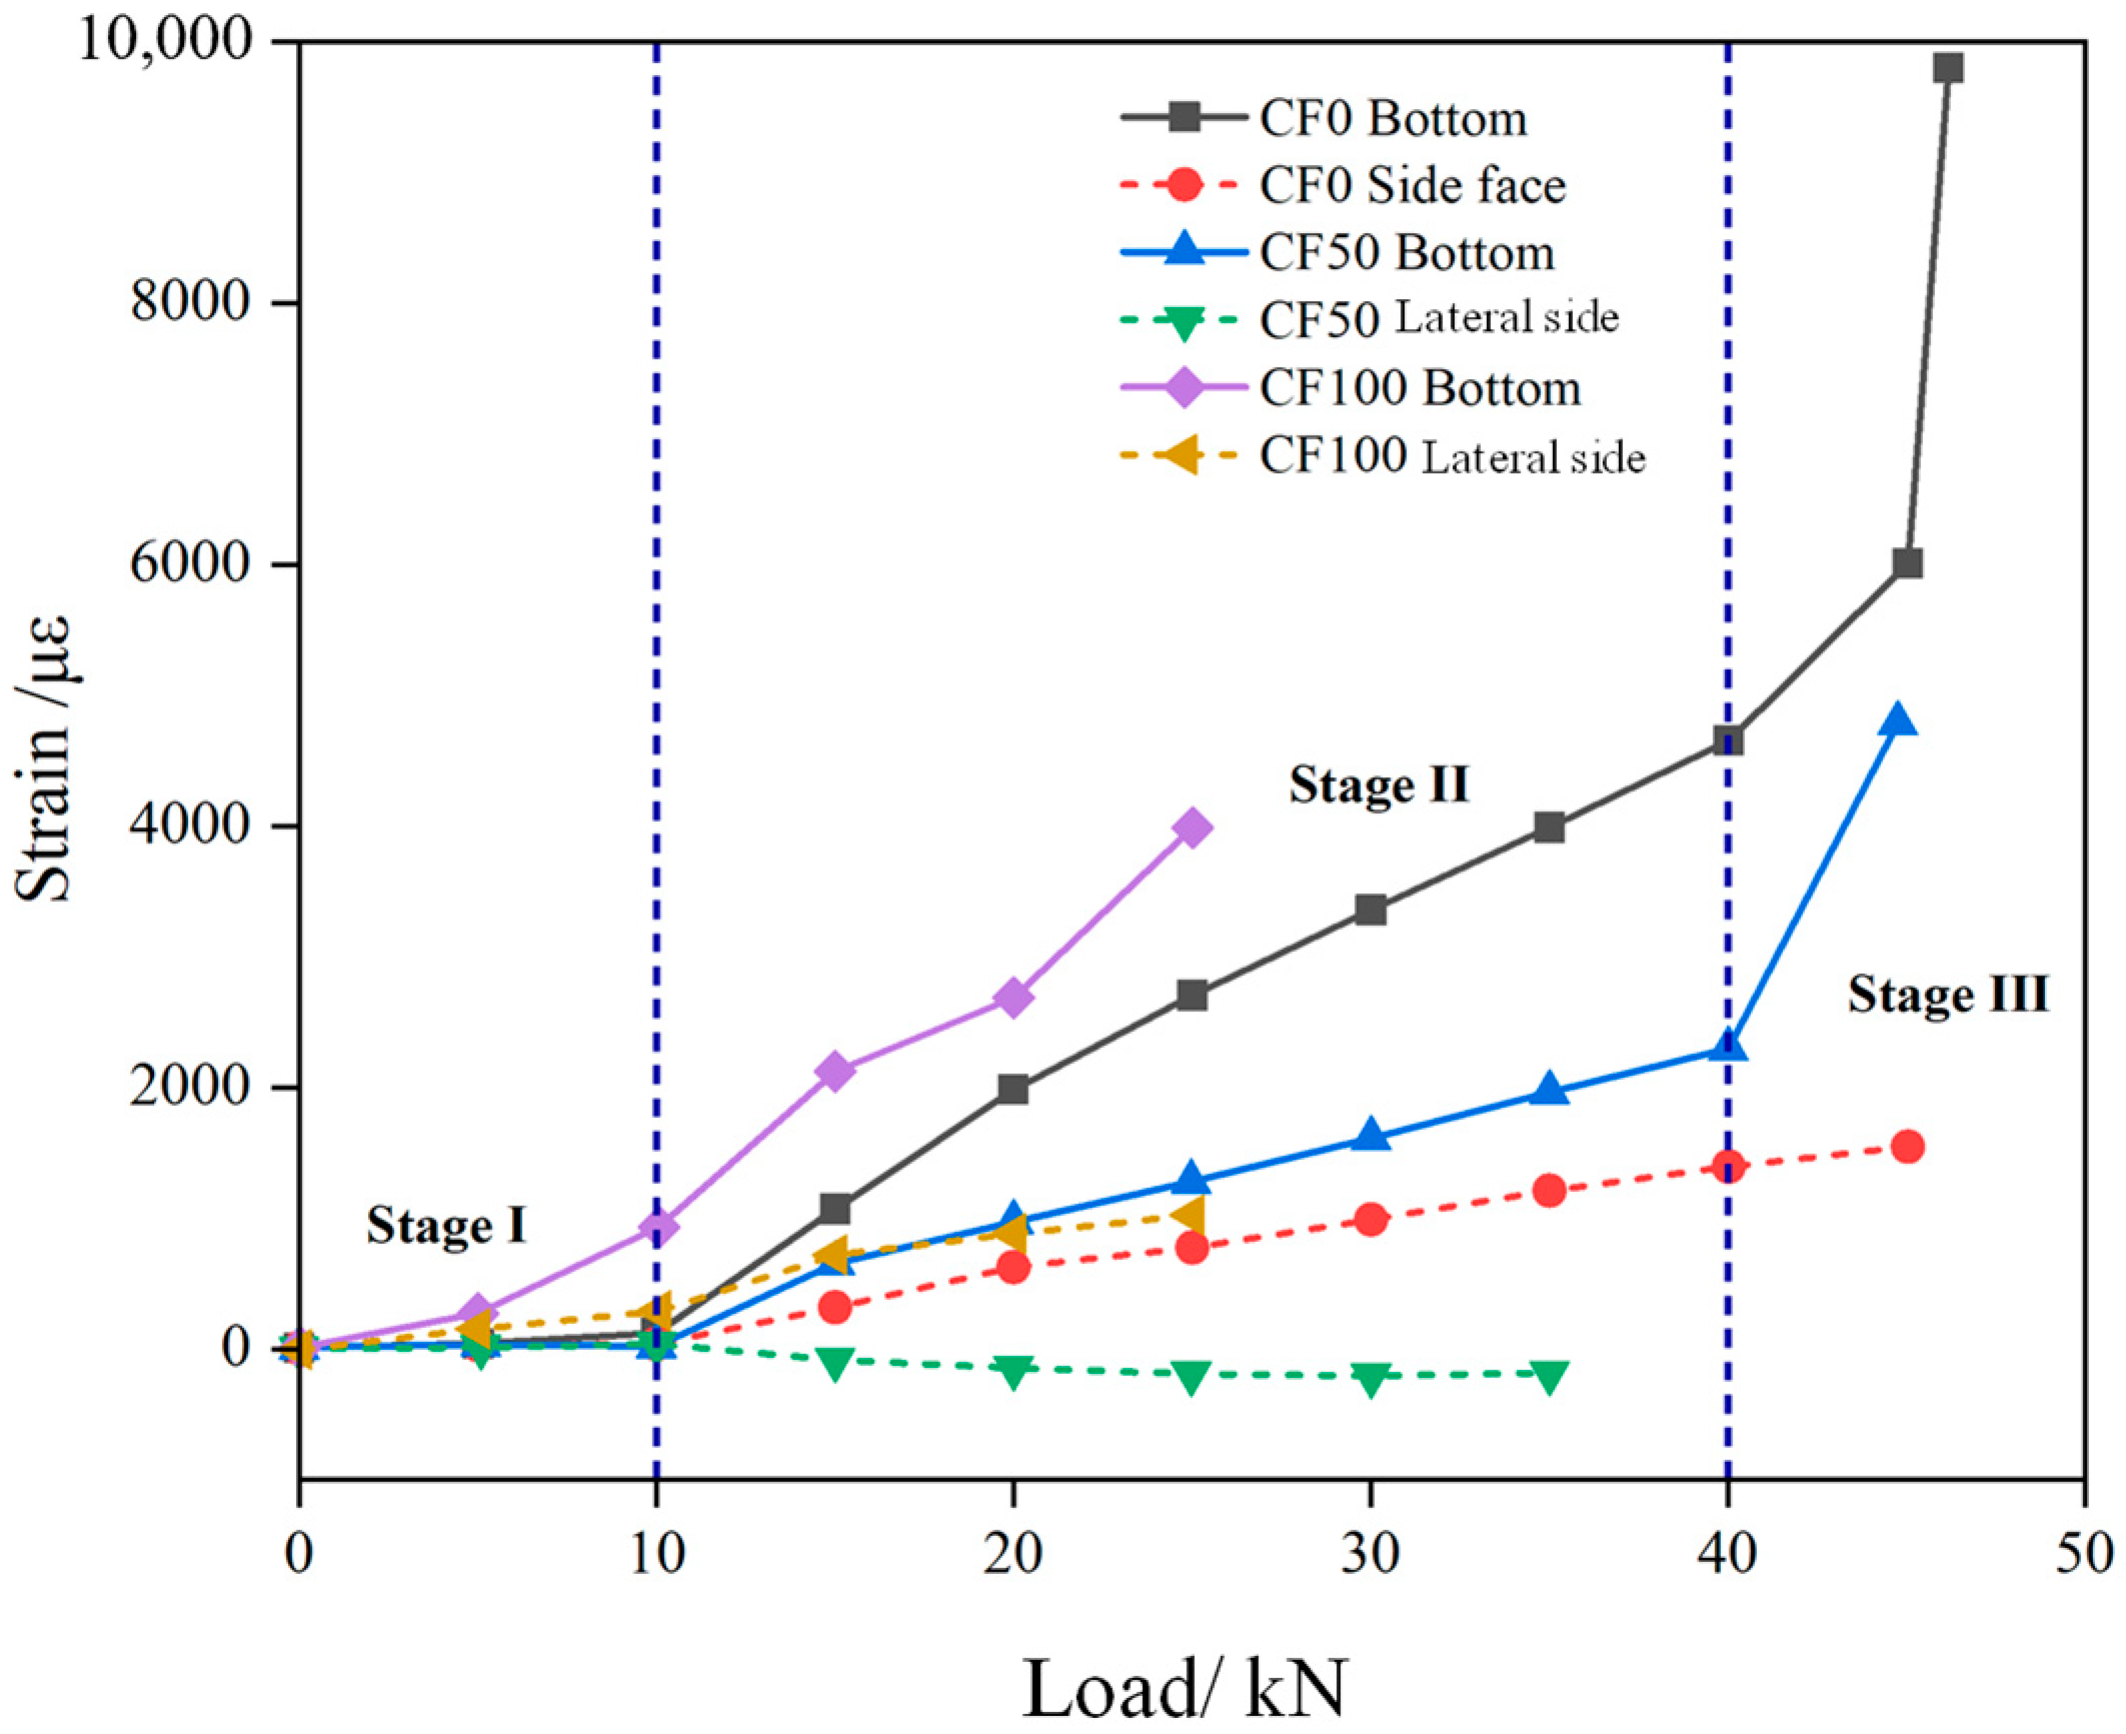
Figure 8 and Figure 9 show the load-displacement curves of the specimens. Assuming zero displacement at the supports, the displacement at the loading points was monitored by instruments, with the displacements at monitoring points 2 and 4 considered equal. The curves indicate three stages: elastic stage, crack development stage, and yielding stage.
Before cracking, the specimens were in the elastic stage, with a linear relationship between mid-span deflection and load. In this stage, no significant cracks were observed. The maximum deflections in the elastic stage for CF0, CF50, and CF100 specimens were 0.08 mm, 0.59 mm, and 0.9 mm, respectively, indicating that increasing ceramsite content reduces the stiffness of the specimens. When entering the second stage, cracks appeared at the bottom of the specimens, significantly increasing displacement at the loading points and mid-span. The load was mainly borne by the rebar framework at this stage. The deflections at the onset of cracking were 187.5%, 122.6%, and 211.1% of the elastic stage deflections for CF0, CF50, and CF100 specimens, respectively. The crack development stage was much longer than the elastic stage, with a non-linear increase in deflection with load. The deflections increased to 6.6 mm, 7.59 mm, and 7.12 mm, far exceeding the elastic stage displacements. In the third stage, the initial crack width increased rapidly, and the displacement increase rate also rose sharply. Once the rebar yielded, the specimens reached peak load and failed, with peak loads of 46.18 kN, 44.76 kN, and 42.56 kN for CF0, CF50, and CF100 specimens, respectively.
The peak load analysis indicates that increasing ceramsite content reduces the flexural strength of the specimens. The step-wise loading scheme and the simultaneous observation of cracks at 10 kN for all specimens indicate that the specimens entered the crack development stage at the second load level. The reinforcement ratio and dimensions of all specimens were the same, making it challenging to observe the order of crack occurrence during loading. However, increasing ceramsite content reduces the tensile strength at the bottom and compressive strength at the top of the specimens, deteriorating crack resistance. In the elastic stage, both concrete and rebar bear the external load, and specimens with poorer crack resistance crack earlier, entering the crack development stage. After rebar yielding, the compressive failure of the concrete in the compression zone leads to specimen failure. Lower compressive strength results in lower flexural strength. Therefore, the order of crack occurrence can be inferred based on this principle, noting that severe floating of lightweight aggregates exacerbates this phenomenon.
(2)
Load–Strain Behavior
To further reveal the failure mechanism of ceramsite concrete slabs, strain values at the mid-span bottom and sides of the specimens were measured. Due to some strain gauges being damaged during loading, only incomplete test data were available. Partial data were selected to plot the load–strain curves shown in Figure 9. Negative strain indicated compression, while positive strain indicated tension. The strain variation trends also showed three stages, similar to the phenomena observed in the load-displacement curves. In the first stage, the strains of CF0 and CF50 specimens had a linear relationship with the load, while the strains in the CF100 specimen were significantly higher. However, the strain in the CF100 specimen showed a non-linear increase between 5 kN and 10 kN, indicating that cracks formed in the CF100 specimen at the initial stage of the second load level. This supports the conclusion that increased ceramsite content reduces the crack resistance of concrete. In the second stage, the mid-span strain increased significantly as the load increased. Initial cracks continued to develop, and the strain increased non-linearly with the load. At the end of the second stage, the strains were 4651 με for CF0, 2297 με for CF50, and similar to CF0 for CF100 based on the trend, with CF50 showing the smallest strain. The side strains included both tensile and compressive strains, possibly due to the strain gauge positions deviating from the initial neutral axis. However, the overall strain variation on the sides was relatively smooth. The third stage showed the largest strain variations, reflecting yielding and ultimate failure of the specimens.

4. Field Applications

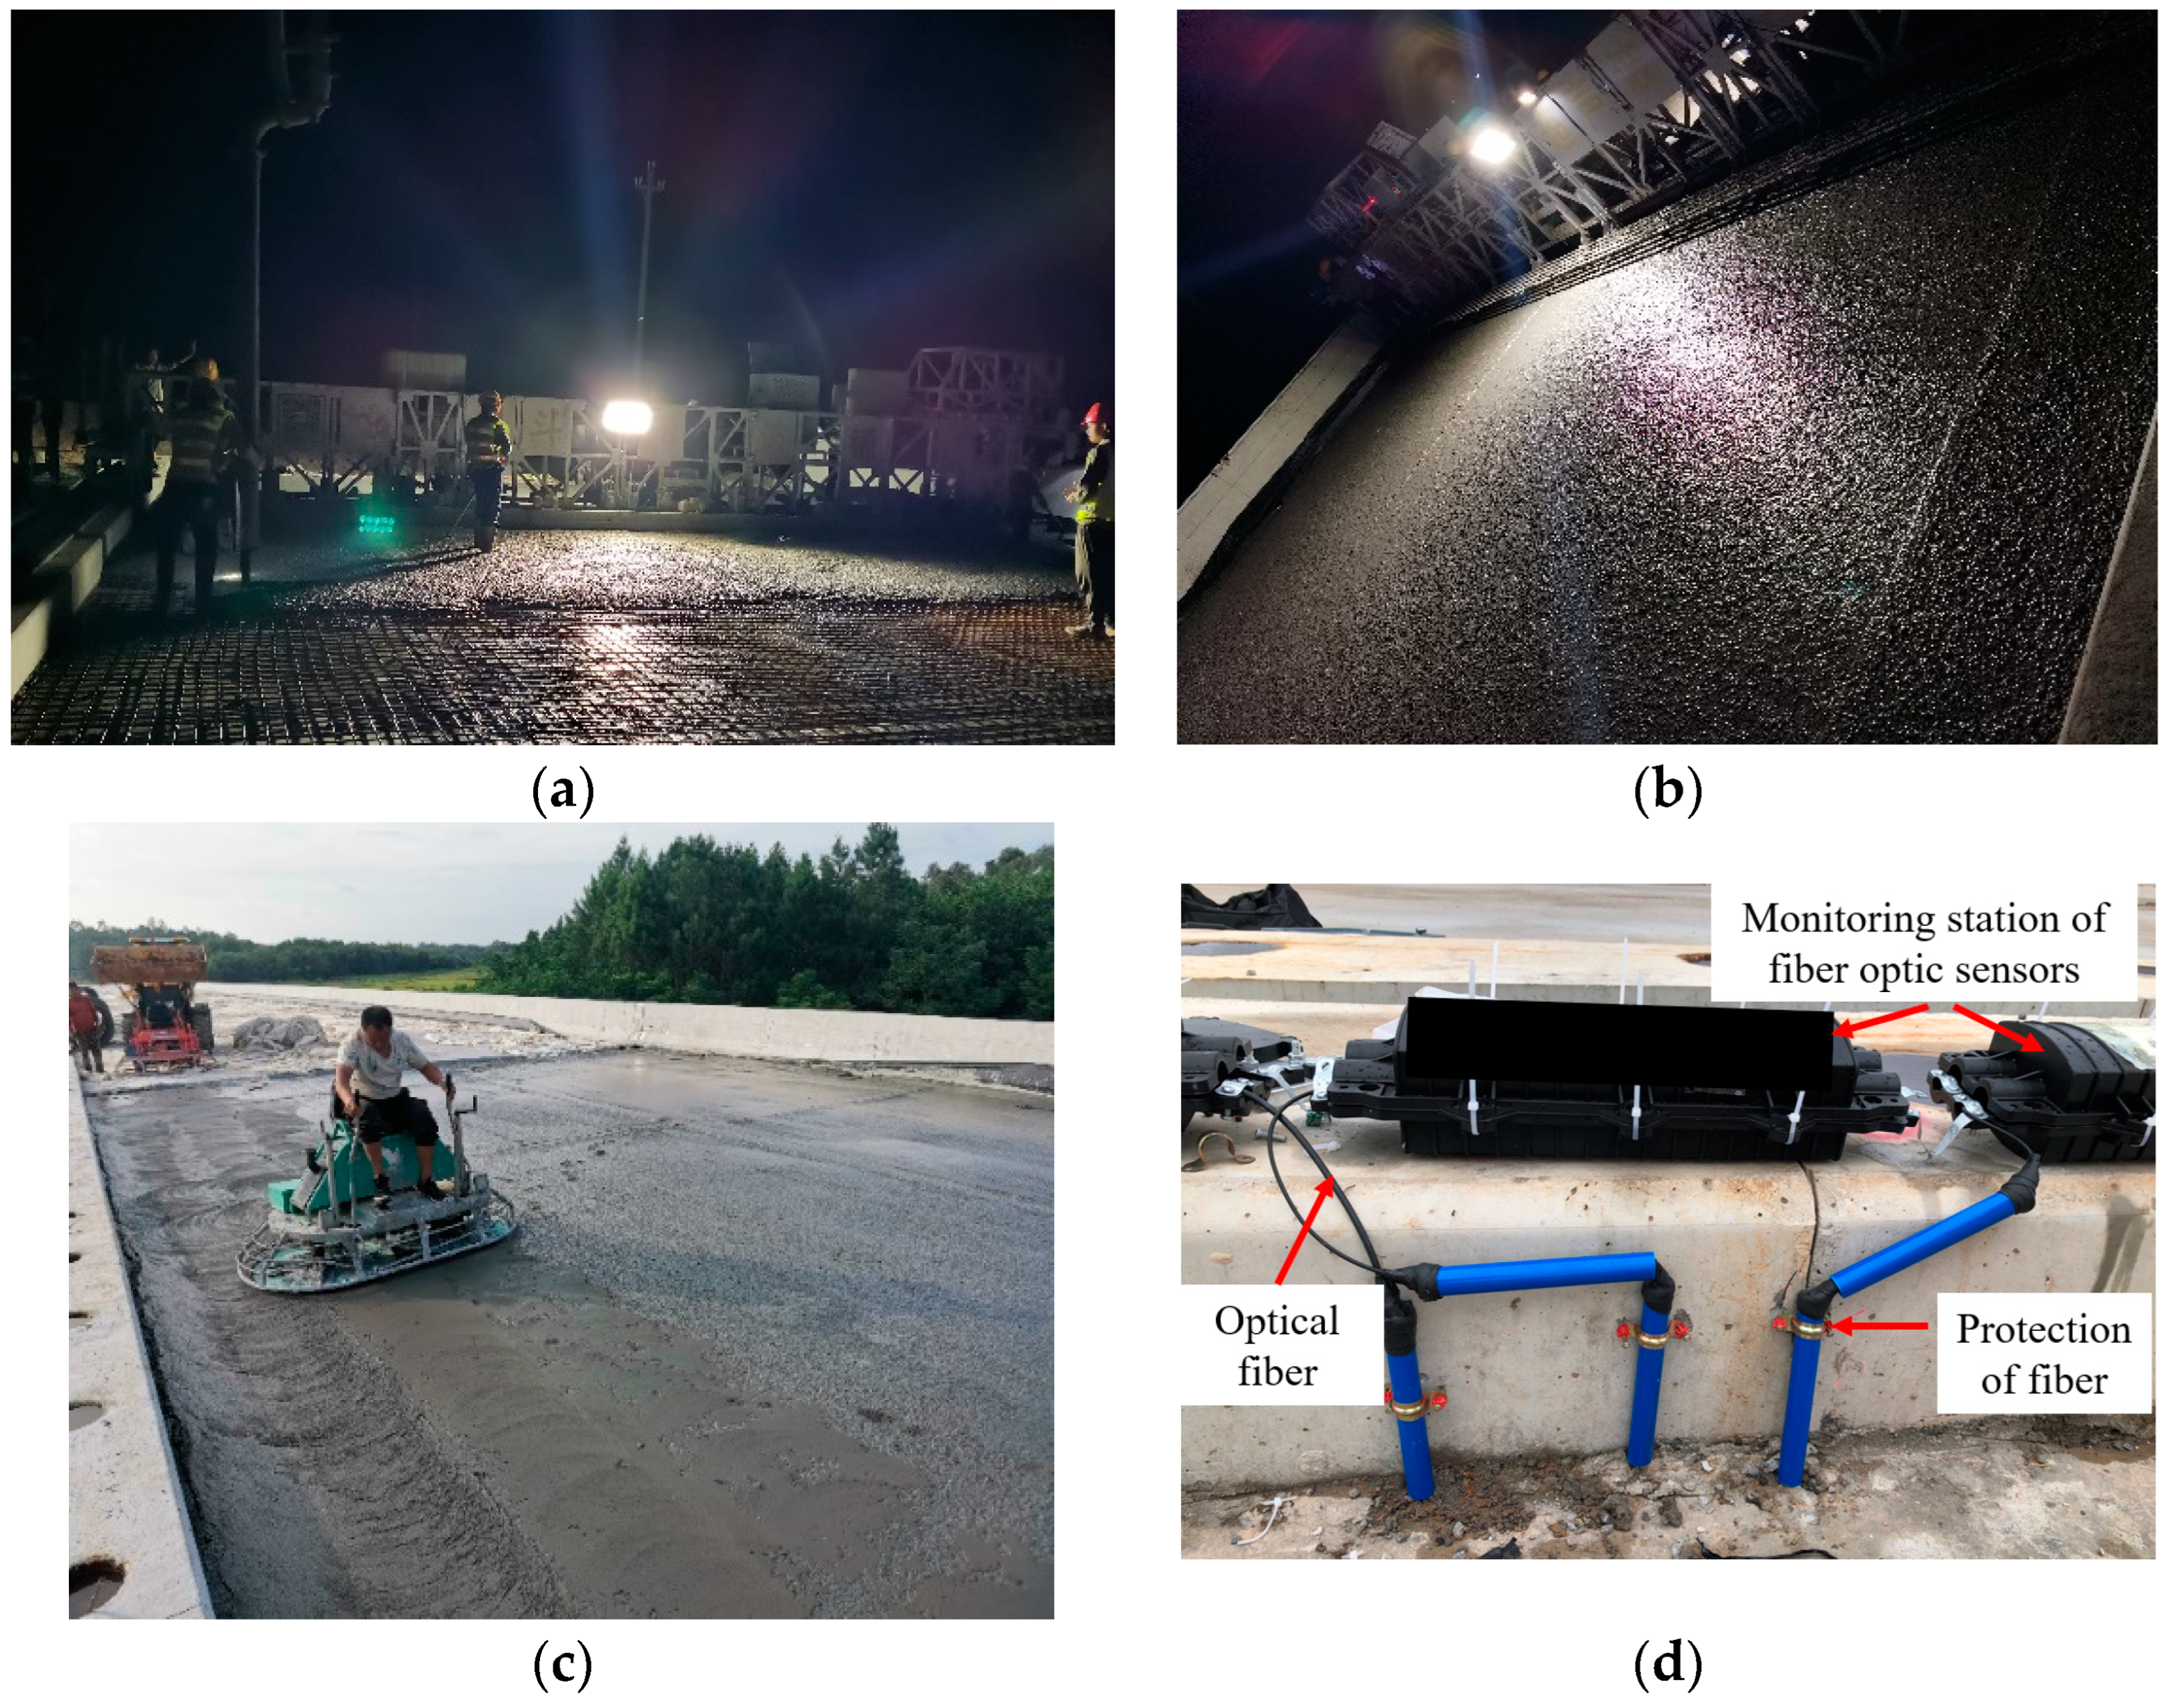
4.1. Field Instrumentations

The Cangjunxi Bridge is located in Chengmai County, Hainan Province, along the Wenlin Highway. It serves as a crucial transportation route connecting Wenchang City and Lingao County. The bridge site is characterized by a wavy plain with mountain-front erosion and deposition, featuring flat terrain suitable for agricultural activities. A rural road passes through the bridge site, providing convenient transportation access. The total length of the bridge is 305.68 m, and it has a width of 26 m, accommodating a dual carriageway with four lanes. The cross-sectional view of the bridge is shown in Figure 10.
The installation of sensors on the bridge deck is a complex task. In this study, three strain sensors and three temperature sensors were installed on the bridge deck. Figure 11 shows the layout of the sensor installation points and the actual sensors.
The strain of fiber optic sensors can be calculated as follows:
ε = ( λ i k T Δ T ) λ 0 k ε
where λi is the Bragg wavelength; λ0 is the initial wavelength; ΔT is varied temperature; kT is coefficient of temperature; kε is the coefficient of strain. The temperature can be calculated as:
T i = k T + k T 2 4 η ( λ 0 λ i ) 2 η
where η = 0.00001. The parameters of fiber optic sensors used in this study are listed in Table 5.
To retain the strength of concrete while reducing its self-weight, a mix proportion with 50% ceramsite content was adopted. The concrete was paved using ultrasonic pavers made by Xingdou in Tangshan, China, compacted with tamping rollers and manual levelled after initial setting. The specific process is illustrated in the figure. After pouring, the initial wavelengths of each sensor were collected for later data analysis. Once the concrete had hardened, some optical cables were exposed on the surface. Therefore, PVC pipes and cable boxes were used to protect the exposed optical cables on the bridge surface, as shown in Figure 12.

4.2. Results Analysis

The changes in the average daily strain after temperature compensation are shown in Figure 13. The overall deformation of the concrete exhibited a shrinkage trend, similar to the indoor deformation pattern. Likewise, the shrinkage deformation of the on-site poured concrete primarily occurred within the first seven days, particularly during the first three days. On the third day, the average shrinkage strain at the three monitoring points was −273 με, accounting for 73% of the seventh day’s average strain. Comparing indoor and outdoor shrinkage deformation, the 28-day indoor average shrinkage strain was 64.3% of the on-site shrinkage strain. Considering that temperatures in Haikou remain high in November, the rapid evaporation of water during the initial pouring stage leads to significant drying shrinkage in the on-site ceramsite concrete. Additionally, ceramsite absorbs some water, exacerbating the heat of hydration and causing further water loss in the concrete, resulting in more pronounced early shrinkage deformation than indoors. Therefore, early curing must be enhanced to reduce drying shrinkage deformation and prevent microcracks caused by uneven shrinkage. Considering the construction process and small vehicle loads, differences in shrinkage strain at different monitoring points are reasonable.
Furthermore, the concrete shrinkage is a continuous behavior, with three main stages: plastic shrinkage, drying shrinkage, and carbonation shrinkage. After pouring, the concrete transitions from a fluid to a solid state. During this process, the heat of hydration, water evaporation, and loss cause a significant volume reduction, making the first stage of shrinkage deformation most noticeable. As the concrete hardens, further internal water loss occurs. During this phase, since the concrete has become solid, the evaporation rate of internal water slows down. Even after the concrete has dried, shrinkage deformation continues due to changes in the pore structure and hydration products, predominantly occurring on the concrete surface. The shrinkage deformation rate is very slow in the third stage but lasts a long time.
These shrinkage deformation stages occur throughout the concrete’s lifecycle. Understanding and analyzing the different stages of concrete shrinkage deformation helps in the rational design of concrete structures and the formulation of appropriate construction measures to minimize deformation and cracking due to shrinkage, ensuring the stability and durability of the bridge deck pavement.
This study suggests that HSLC has significant potential for civil infrastructure projects, such as bridge deck pavements and high-rise buildings, where reducing self-weight is crucial. HSLC could also be beneficial in marine structures due to its lightweight nature, which reduces material costs and construction demands. However, the study has limitations, particularly the short monitoring period, which may not fully capture the long-term behavior of HSLC, including creep and shrinkage. Additionally, the variability in HSLC performance under different environmental conditions and construction practices requires further investigation. Future research should focus on extending monitoring durations to better understand HSLC’s long-term durability, and on developing guidelines for its use across different applications.

5. Conclusions

In this study, HSLC was analyzed with experimental and numerical approaches. The multiphase meso-structure of HSLC was considered in the model, which includes mortar matrix, ITZ, shale ceramsite, and basaltic aggregates. The spatial distribution and shape of coarse aggregates were randomized, and a parallel bond model was used to define the contact characteristics of different media. Meanwhile, the meso-parameters of different media were calibrated by physical experimental results and phenomena. Finally, the calibrated meso-mechanics numerical model was used to investigate the effect of ITZ and coarse aggregate strength on the compressive strength and damage mechanism of HSLC specimens. The following conclusions were obtained:
1.
Physical uniaxial compression tests revealed that the compressive strength of HSLC decreases as the shale ceramsite content increases;
2.
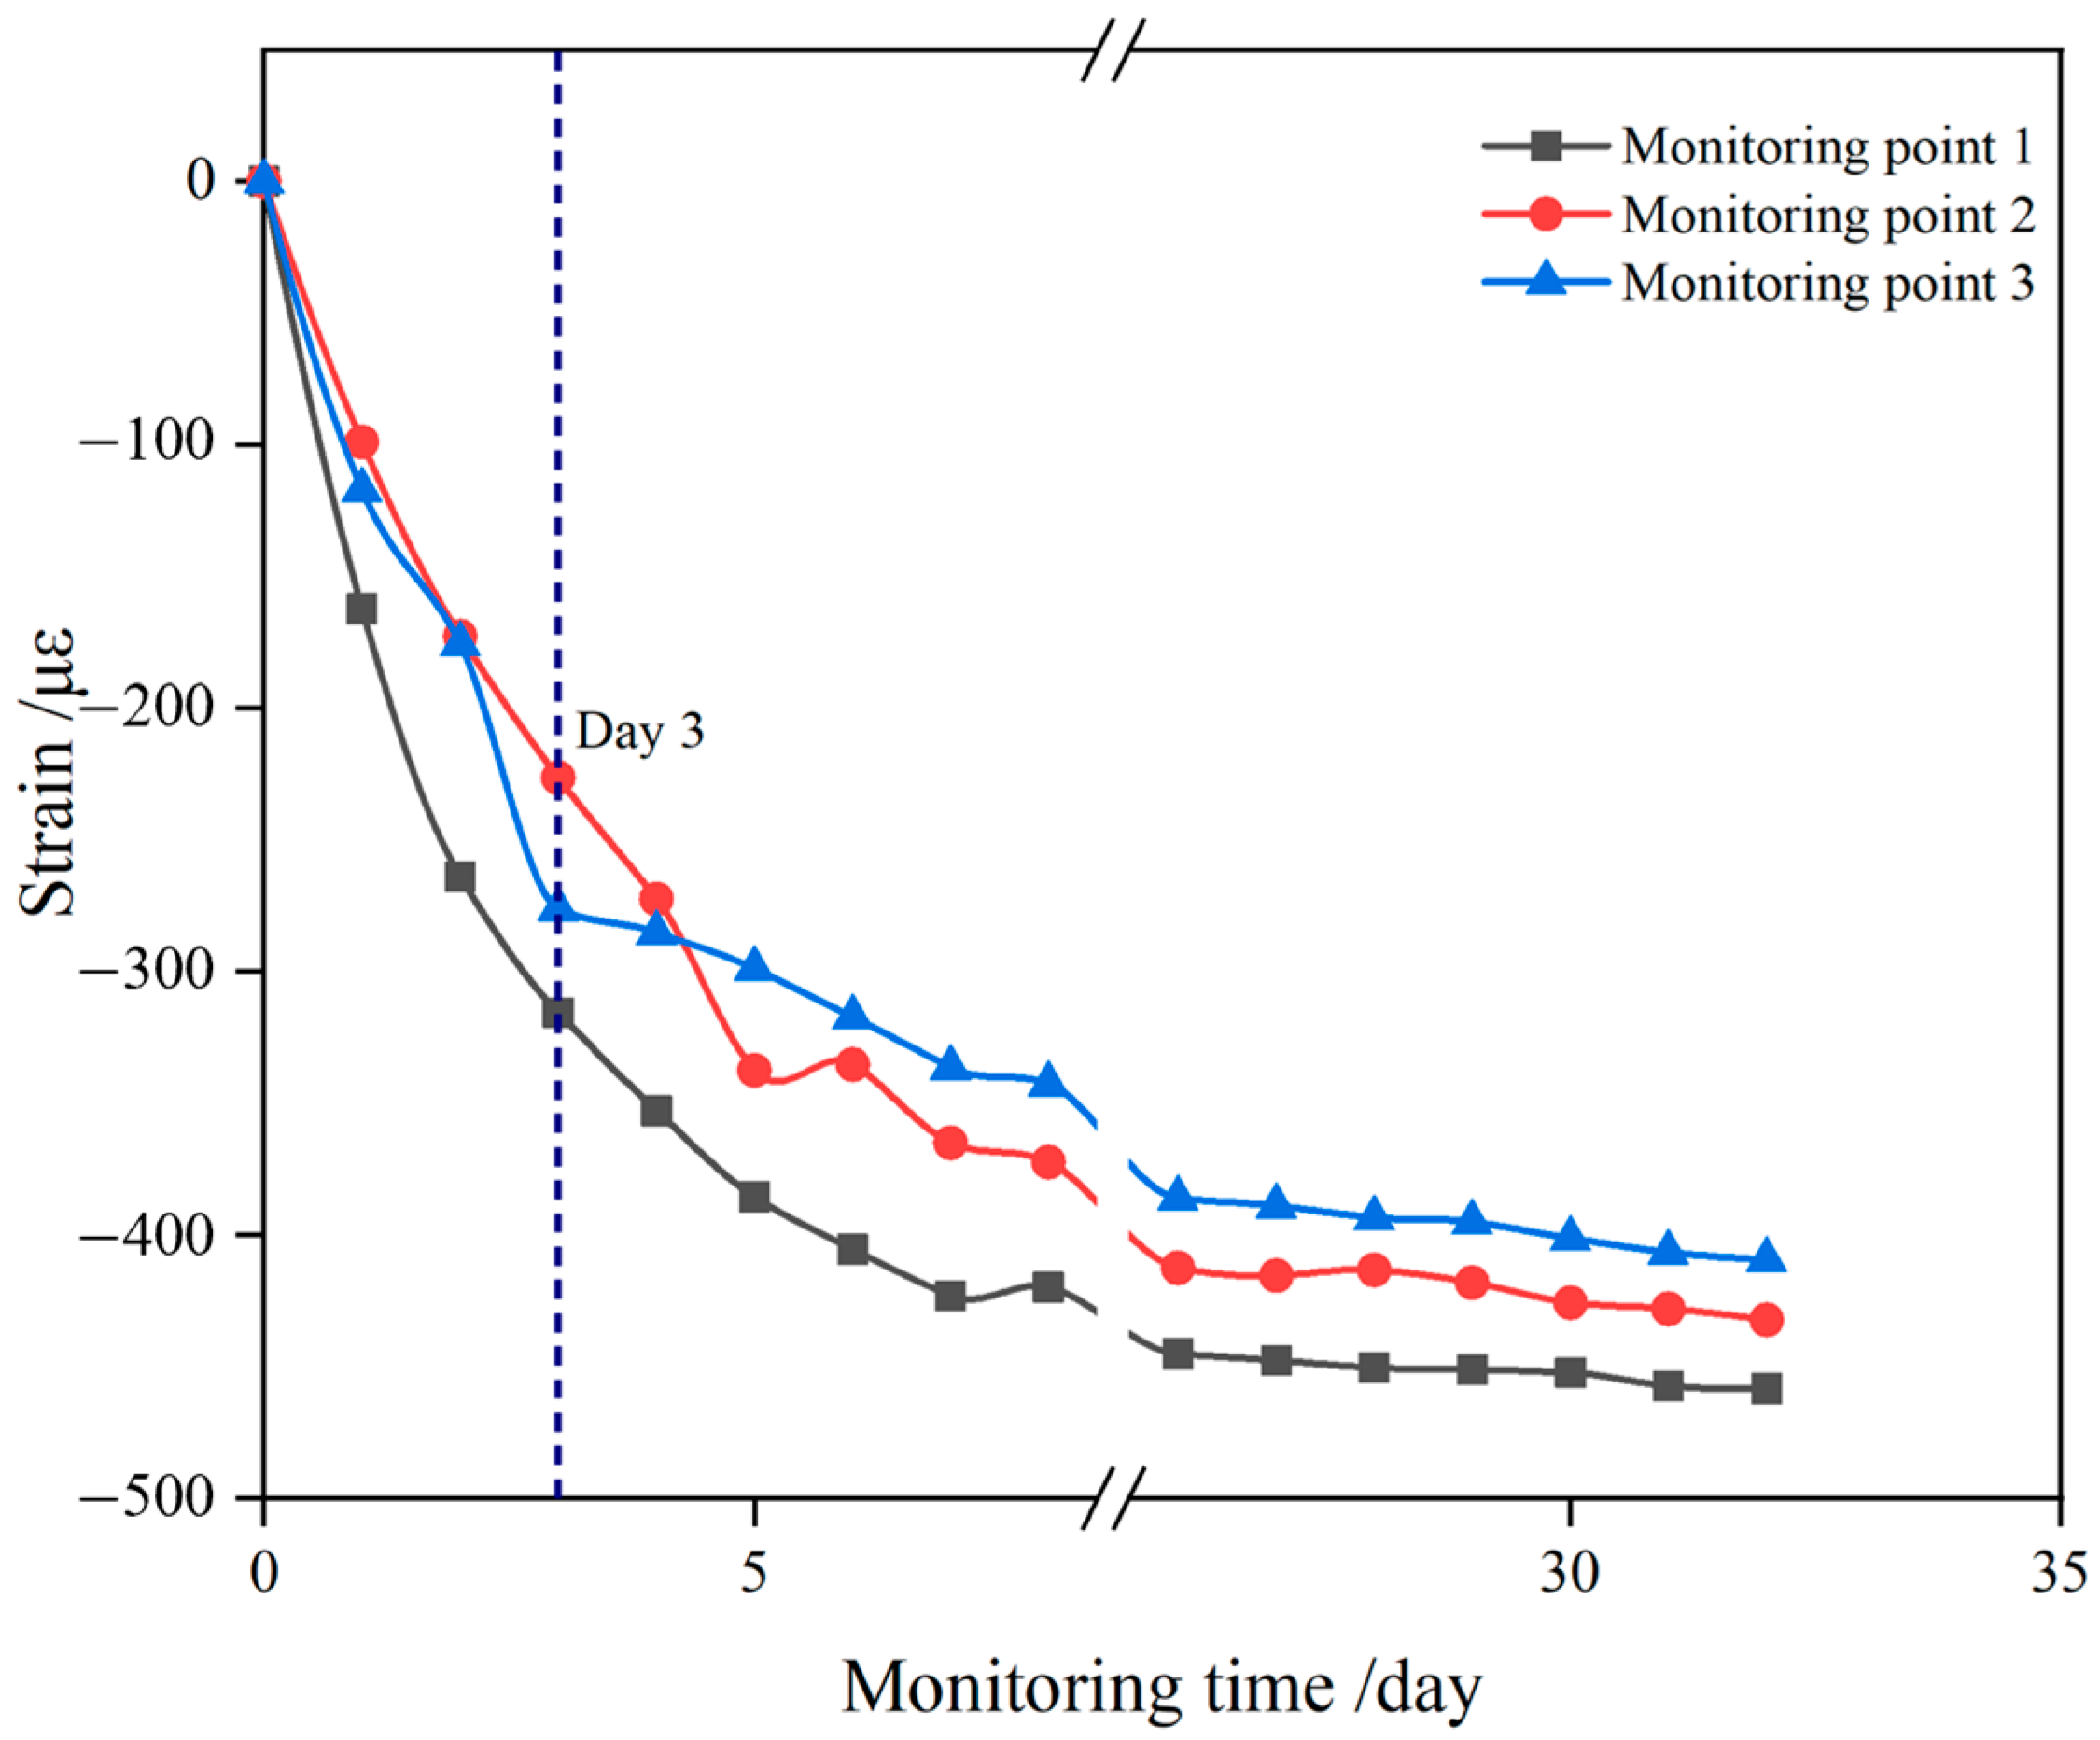
By appropriately installing and deploying FBG sensors, the deformation performance of concrete in actual engineering projects was monitored. The results indicated that the trend of shrinkage deformation of the on-site concrete was largely consistent with that observed indoors. As the concrete strength increased, its shrinkage deformation tended to stabilize. This indirectly demonstrates that the on-site concrete has good deformation stability and mechanical properties, making it suitable for normal use in field conditions;
3.
According to on-site monitoring results, the shrinkage strain of the concrete was more pronounced than indoors, particularly noticeable during the first three days. Therefore, it is necessary to enhance early-stage curing of the concrete to reduce drying shrinkage deformation. Given the impact of external environmental factors and construction practices, it is reasonable to observe some differences in shrinkage deformation between indoor and outdoor lightweight aggregate concrete.

Author Contributions

Conceptualization, Q.S.; methodology, Y.Q.; software, Y.Q.; validation, H.G.; formal analysis, C.H.; investigation, H.G.; investigation, M.L.; data curation, Q.S.; writing—original draft preparation, Y.Q.; writing—review and editing, C.H.; visualization, Y.Q.; supervision, C.H.; project administration, H.G.; funding acquisition, Y.Q. and C.H. All authors have read and agreed to the published version of the manuscript.

Funding

This research was funded by the Fundamental Research Funds for the National Natural Science Foundation of China [Project No. 42177127], the Fundamental Research Funds for the Central Universities (WUT: 104972024RSCbs0043), and the China Post-doctoral Science Foundation under Grant Number 2024M752501 and GZC20241299.

Data Availability Statement

The original contributions presented in the study are included in the article, further inquiries can be directed to the corresponding authors.

Conflicts of Interest

Author Qi Song was employed by the company Hainan CCCC Expressway Investment and Construction Co., Ltd. The remaining authors declare that the research was conducted in the absence of any commercial or financial relationships that could be construed as a potential conflict of interest.

References

  1. Xu, D.S.; Zhang, Z.J.; Qin, Y.; Liu, T.; Cheng, Z. Effect of particle size distribution on dynamic properties of cemented coral sand under SHPB impact loading. Soil Dyn. Earthq. Eng. 2022, 162, 107438. [Google Scholar] [CrossRef]
  2. Qin, Y.; Wang, Q.K.; Xu, D.S.; Fan, X.C. Study of the effects of fine coral powder and salinity on the mechanical behaviour of coral sand-seawater cement mortar. Constr. Build. Mater. 2021, 313, 125476. [Google Scholar] [CrossRef]
  3. Raithby, K.; Lydon, F. Lightweight concrete in highway bridges. Int. J. Cem. Compos. Lightweight Concr. 1981, 3, 133–146. [Google Scholar] [CrossRef]
  4. Chandra, S.; Berntsson, L. Lightweight Aggregate Concrete; Elsevier: Amsterdam, The Netherlands, 2002. [Google Scholar]
  5. Mohamed, S.; Brabha, N.; Julian, T.; Keerthan, P.; Marco, C. Development and prospectives of lightweight high strength concrete using lightweight aggregates. Constr. Build. Mater. 2023, 362, 129628. [Google Scholar]
  6. Blanco, F.; García, P.; Mateos, P.; Ayala, J. Characteristics and properties of lightweight concrete manufactured with cenospheres. Cem. Concr. Res. 2000, 30, 1715–1722. [Google Scholar] [CrossRef]
  7. Qin, Y.; Xu, D.S.; Zhang, S.S.; Fan, X.C. Dynamic behavior of carbon nanotubes and basalt fiber reinforced coral sand cement mortar at high strain rates. Constr. Build. Mater. 2022, 340, 127396. [Google Scholar] [CrossRef]
  8. Kahn, L.F. Lightweight Concrete for High Strength/High Performance Precast Prestressed; Georgia Institute of Technology: Atlanta, GA, USA, 2004. [Google Scholar]
  9. Harmon, K.S. Engineering Properties of Structural Lightweight Concrete; Carolina Stalite Company: Salisbury, NC, USA, 2007. [Google Scholar]
  10. He, Y.; Zhang, X.; Zhang, Y.; Zhou, Y. Effects of particle characteristics of lightweight aggregate on mechanical properties of lightweight aggregate concrete. Constr. Build. Mater. 2014, 72, 270–282. [Google Scholar] [CrossRef]
  11. Cui, H.; Lo, T.Y.; Memon, S.A.; Xu, W. Effect of lightweight aggregates on the mechanical properties and brittleness of lightweight aggregate concrete. Constr. Build. Mater. 2012, 35, 149–158. [Google Scholar] [CrossRef]
  12. Yang, J.H.; Xu, L.; Fan, X.; Yu, J.Y. Strength tests of shale ceramsite concrete with part gravel coarse aggregates. Mater. Adminicle 2015, 82–86. [Google Scholar]
  13. Ding, Q.; Xiang, W.; Zhang, G.; Hu, C. Effect of pre-wetting lightweight aggregates on the mechanical performances and microstructure of cement pastes. J. Wuhan Univ. Technol.-Mater Sci. Ed. 2020, 35, 140–146. [Google Scholar] [CrossRef]
  14. Nguyen, L.; Beaucour, A.-L.; Ortola, S.; Noumowé, A. Influence of the volume fraction and the nature of fine lightweight aggregates on the thermal and mechanical properties of structural concrete. Constr. Build. Mater. 2014, 51, 121–132. [Google Scholar] [CrossRef]
  15. Chung, S.-Y.; Sikora, P.; Kim, D.J.; El Madawy, M.E.; Elrahman, M.A. Effect of different expanded aggregates on durability-related characteristics of lightweight aggregate concrete. Mater. Charact. 2021, 173, 110907. [Google Scholar] [CrossRef]
  16. Lepage, S.; Baalbaki, M.; Dallaire, E.; Aïtcin, P. Early shrinkage development in a high performance concrete. Cem. Concr. Aggreg. 1999, 21, 31–35. [Google Scholar] [CrossRef]
  17. Xu, D.S.; Dong, L.J.; Lalit, B.; Liu, H.B. Early-warning system with quasi-distributed fiber optic sensor networks and cloud computing for soil slopes. IEEE Access 2017, 5, 25437–25444. [Google Scholar] [CrossRef]
  18. Xu, D.S.; Zhao, Y.M.; Liu, H.B.; Zhu, H.H. Deformation monitoring of metro tunnel with a new ultrasonic-based system. Sensors 2017, 17, 1758. [Google Scholar] [CrossRef] [PubMed]
  19. Yun, Y.-W.; Jang, I.-Y. Research on early age deformation of high performance concrete by fiber bragg grating sensor. KSCE J. Civ. Eng. 2008, 12, 323–328. [Google Scholar] [CrossRef]
  20. Silva KK, S.; Silva, F.N.; Mahfoud, T.; Khelidj, A.; Brientin, A.; Azevedo, A.C.; Delgado, J.M.; de Lima, A.B. On the use of embedded fiber optic sensors for measuring early-age strains in concrete. Sensors 2021, 21, 4171. [Google Scholar] [CrossRef]
  21. Yun, Y.W.; Jang, I.Y.; Kim, S.K.; Park, S.M. Early-age autogenous shrinkage of high-performance concrete columns by embedded fiber bragg-grating sensor. Trans Tech Publ. 2009, 419–420, 1–4. [Google Scholar] [CrossRef]
  22. Yazdizadeh, Z.; Marzouk, H.; Hadianfard, M.A. Monitoring of concrete shrinkage and creep using Fiber Bragg Grating sensors. Constr. Build. Mater. 2017, 137, 505–512. [Google Scholar] [CrossRef]
  23. Jia, W.Y. Continual Rigid Frame Bridge SpanDown-Warping Prevention and Control; Changan University: Xi’an, China, 2011. [Google Scholar]
  24. Qin, Y.; Wang, Q.K.; Xu, D.S.; Yan, J.M.; Zhang, S.S. A fiber Bragg grating based earth and water pressures transducer with three-dimensional fused deposition modeling for soil mass. J. Rock Mech. Geotech. Eng. 2022, 14, 663–669. [Google Scholar] [CrossRef]
  25. Xu, D.S.; Su, Z.Q.; Qin, Y.; Lalit, B. A hybrid FBG-based pressure and vibration transducer with a 3D fused deposition modelling approach. Meas. Sci. Technol. 2022, 33, 065106. [Google Scholar] [CrossRef]
  26. Feng, W.Q.; Zhang, T.Y.; Li, Y.X.; Xu, D.S. Experimental Study of Interface Performance between Calcareous Sand and Steel Pile with Different Surface Roughness and Temperatures. Ocean Eng. 2024, 292, 116469. [Google Scholar] [CrossRef]
  27. Xu, D.S.; Jiang, L.; Qin, Y.; Shen, H.; Ji, B.F. High-precision FBG-based sensor for soil settlement monitoring: A comparative study with magnetic settlement gauges and PIV technique. Sens. Actuators A Phys. 2024, 366, 114935. [Google Scholar] [CrossRef]
  28. Singh, M.J.; Choudhary, S.; Chen, W.B.; Wu, P.C.; Goyal, M.K.; Rajput, A.; Borana, L. Applications of fibre Bragg grating sensors for monitoring geotechnical structures: A comprehensive review. Measurement 2023, 218, 113171. [Google Scholar] [CrossRef]
  29. Shen, J.H.; Hu, M.J.; Wang, X.; Zhang, C.Y.; Xu, D.S. SWCC of Calcareous Silty Sand Under Different Fines Contents and dry Densities. Front. Environ. Sci. 2021, 9, 682907. [Google Scholar] [CrossRef]
  30. Xu, D.S.; Yan, J.M.; Liu, Q.C. Behavior of discrete fiber-reinforced sandy soil in large-scale simple shear tests. Geosynth. Int. 2021, 28, 598–608. [Google Scholar] [CrossRef]
  31. Zhang, X.L.; Peng, X.B.; Li, X.J.; Zhou, Z.; Xu, C.; Dou, Z.; Liu, B. Three-Dimensional Seismic Response in Complex Site Conditions: A New Approach Based on an Auxiliary-Model Method. J. Earth Sci. 2021, 32, 1152–1165. [Google Scholar] [CrossRef]
  32. Zhang, T.Y.; Zhang, C.C.; Shi, B.; Chen, Z.Y.; Zhao, X.Y.; Wang, Z. Artificial intelligence-based distributed acoustic sensing enables automated identification of wire breaks in prestressed concrete cylinder pipe. J. Appl. Geophys. 2024, 224, 105378. [Google Scholar] [CrossRef]
  33. Ma, P.H.; Peng, J.B.; Zhuang, J.Q.; Zhu, X.; Liu, C.; Cheng, Y.; Zhang, Z. Initiation Mechanism of Loess Mudflows by Flume Experiments. J. Earth Sci. 2022, 33, 1166–1178. [Google Scholar] [CrossRef]
  34. Tian, X.X. The Producing and Properties Studying of Lightweight and High Strength Concrete Applied in Bridge Pavement; South China University of Technology: Guangzhou, China, 2015. [Google Scholar]
  35. Cheng, L. Design of Mixture Proportions and Study on Performance of LC50 Lightweight Aggregate Concretes; Changsha University of Science & Technology: Changsha, China, 2013. [Google Scholar]
  36. Yang, Y.T. Research on strength performance of haycite for light aggregate concrete of bridge deck pavement. N. Commun. 2018, 85–88. [Google Scholar]
  37. Wang, S.; Zhao, J.; Wu, X.; Yang, J.; Wang, Q. Elastic properties and damage evolution analysis for lightweight shale ceramsite concrete. Int. J. Appl. Mech. 2023, 15, 2350040. [Google Scholar] [CrossRef]
Figure 1. Material of the HSLC: (a) shale ceramsite; (b) cement; (c) fly ash; (d) silica fume; (e) water reducer; (f) basalt.
Buildings 14 02783 g001
Figure 2. Failure modes of LWSCC-25% specimens under different strain rates: (a) 1 × 10⁻⁴/s; (b) 5 × 10⁻⁴/s; (c) 1 × 10⁻³/s; (d) 5 × 10⁻³/s; (e) 1 × 10⁻²/s.
Buildings 14 02783 g002
Figure 3. Stress–strain curves at different strain rates: (a) LWSCC-0%; (b) LWSCC-25%; (c) LWSCC-50%; (d) LWSCC-75%; (e) LWSCC-100%; (f) stress–strain curve when ε = 1 × 10⁻⁴/s; (g) stress–strain curve when ε = 5 × 10⁻³/s; (h) stress–strain curve when ε = 1 × 10⁻²/s.
Buildings 14 02783 g003
Figure 4. UWFBG Sensor Arrangement: (a) layout diagram of UWFBG; (b) actual layout UWFB; (c) HSLC structure.
Buildings 14 02783 g004
Figure 5. Strain variation trends during curing: (a) specimen CF0; (b) specimen CF50; (c) specimen CF100.
Buildings 14 02783 g005aBuildings 14 02783 g005b
Figure 6. Static four-point bending test: (a) specimen loading details; (b) test equipment.
Buildings 14 02783 g006aBuildings 14 02783 g006b
Figure 7. Bottom Crack Patterns of Specimens.
Buildings 14 02783 g007
Figure 8. Load-displacement curves of specimens: (a) CF0; (b) CF50; (c) CF100; (d) load-displacement curves at different measuring points.
Buildings 14 02783 g008aBuildings 14 02783 g008b
Figure 9. Load–strain curves at different measuring points.
Buildings 14 02783 g009
Figure 10. Cross section of the newly constructed highway with HSLC.
Buildings 14 02783 g010
Figure 11. Filed instrumentations.
Buildings 14 02783 g011
Figure 12. Photos of field construction of HSLC concrete and fiber optic sensors: (a) pouring of concrete; (b) leveling with paver; (c) manual leveling; (d) optical cable protection measures.
Buildings 14 02783 g012
Figure 13. Filed monitoring results of internal strains.
Buildings 14 02783 g013
Table 1. Main properties of shale ceramsite.
AggregateMud Content(%)Cylinder Compressive Strength
(MPa)
Apparent Density
(kg/m3)
Bulk Density
(kg/m3)
Water Absorption
(%)
Bulk Void Ratio
(%)
Maximum Particle Size
(mm)
60 min
Shale ceramsite0.86.813507803355~20
Table 2. Mix proportions and compressive strength.
No.Gel Materials
(kg)
Cement
(kg)
Water–Cement RatioSand RatioFly Ash
(kg)
Silica Fume
(kg)
Water Reducer
(kg)
Ceramsite RatioSlump
(mm)
28-Day Strength (Mean)
(MPa)
5104080.2843%76.525.57.65100%10856.3
5104080.343%76.525.57.65100%16455.4
5104080.3243%76.525.57.65100%22452.5
5104080.3443%76.525.57.65100%24541.24
Table 3. Lightweight concrete mix proportions and mixing performance.
Cement
(kg/m3)
Silica Fume
(kg/m3)
Fly Ash
(kg/m3)
Shale Ceramsite
(kg/m3)
Medium Sand
(kg/m3)
Net Water Amount
(kg/m3)
Water Reducer
(kg/m3)
Slump
(mm)
40825.576.5517.2745.8163.27.65224
Table 4. Mix ratio of shale ceramsite concrete.
SpecimenAggregate
kg/m3
Gel material
kg/m3
Additive
kg/m3
Water
kg/m3
CeramsiteBasaltSandCementSilica FumeFlyashWater Reducer
LWSCC-0%/1015.4745.840825.576.57.65163.2
LWSCC-25%129.3761.55745.840825.576.57.65163.2
LWSCC-50%258.6507.7745.840825.576.57.65163.2
LWSCC-75%387.9253.85745.840825.576.57.65163.2
LWSCC-100%517.2/745.840825.576.57.65163.2
Table 5. Parameters of fiber optic sensors used in this study.
No.Initial Wavelength
(nm)
kε
( nm / μ ε )
kT
(nm/°C)
Strain sensor 11538.3860.007120.0168
Strain sensor 21548.0870.007120.0163
Strain sensor 31559.6500.007120.0162
Temperature 11535.969-0.0097
Temperature 21553.737-0.0096
Temperature 31541.932-0.0098
Disclaimer/Publisher’s Note: The statements, opinions and data contained in all publications are solely those of the individual author(s) and contributor(s) and not of MDPI and/or the editor(s). MDPI and/or the editor(s) disclaim responsibility for any injury to people or property resulting from any ideas, methods, instructions or products referred to in the content.

