
Factorial Experiments of Soil Conditioning for Earth Pressure Balance Shield Tunnelling in Water-Rich Gravel Sand and Conditioning Effects’ Prediction Based on Particle Swarm Optimization–Relevance Vector Machine Algorithm

Abstract
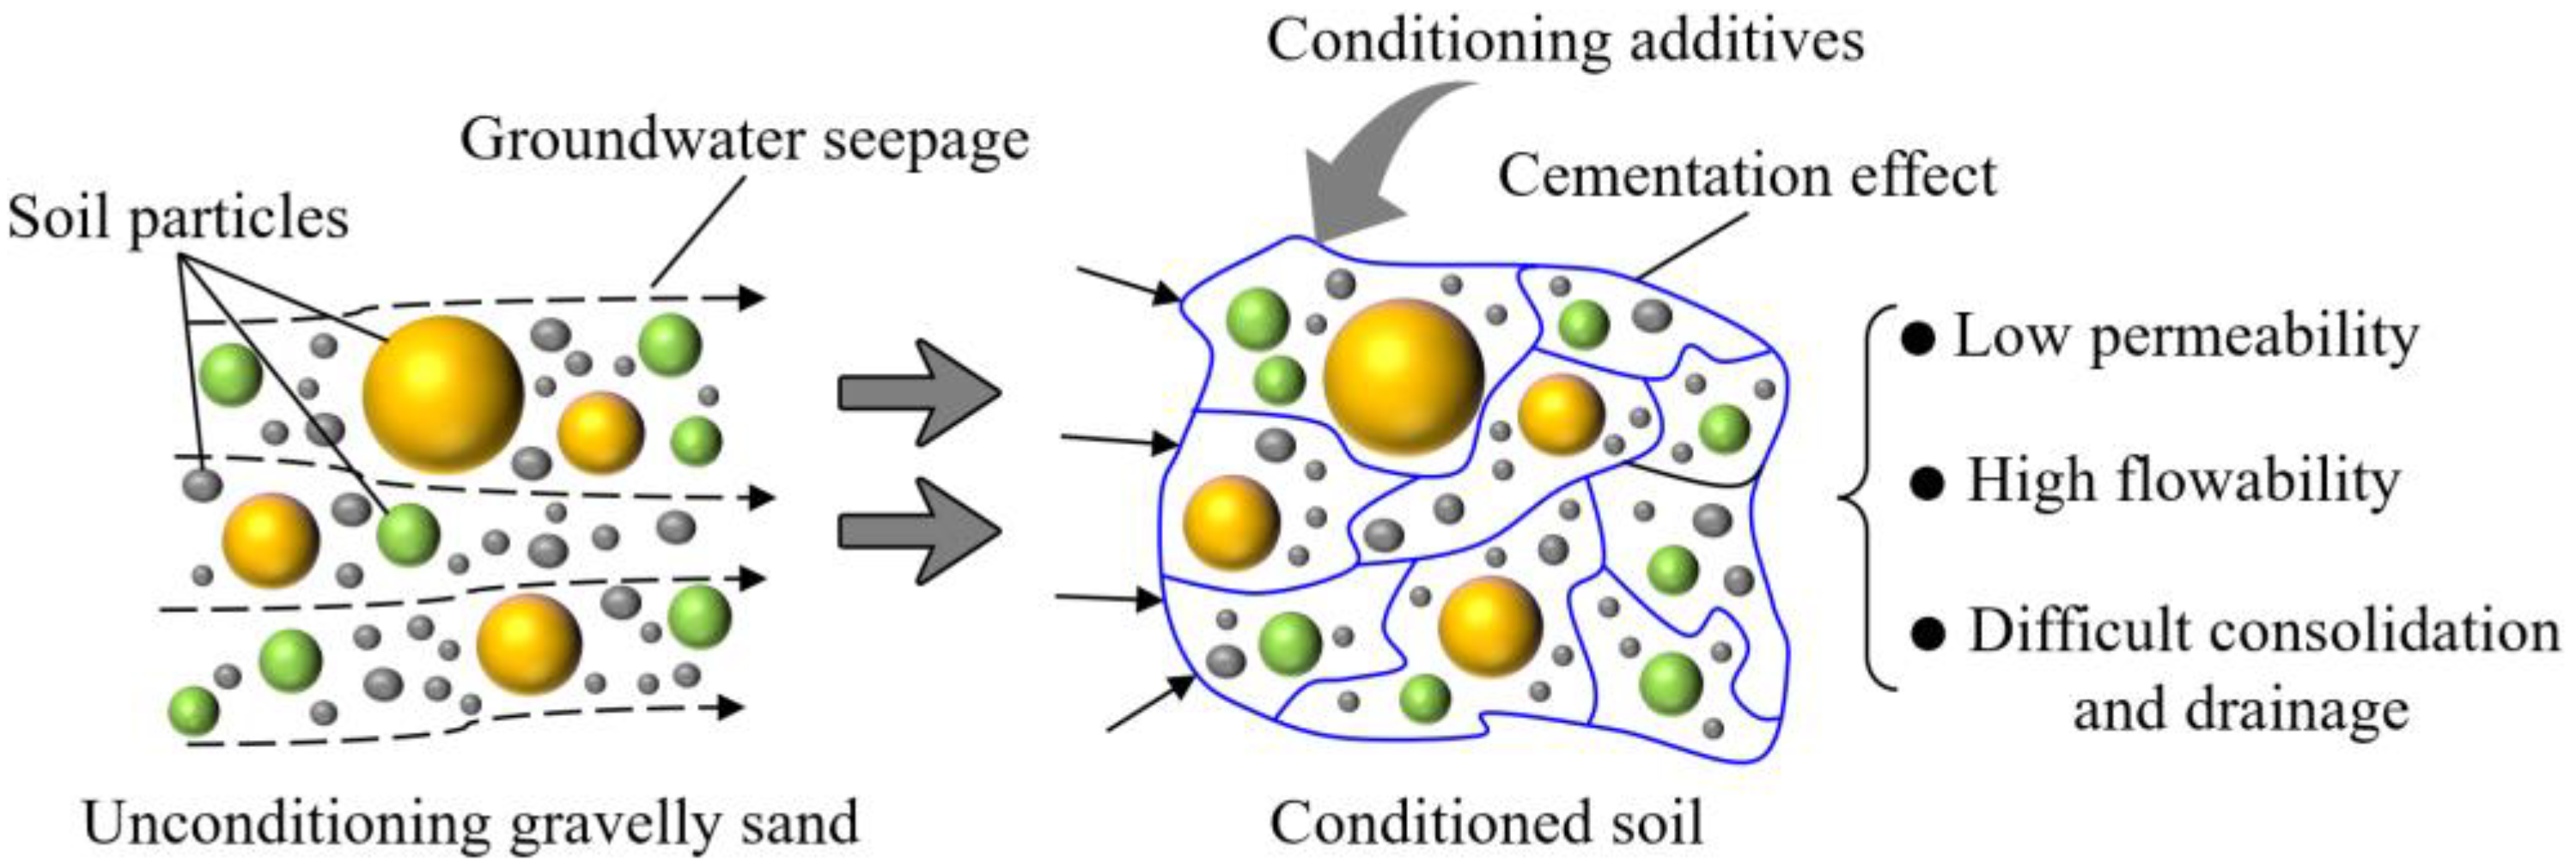
1. Introduction
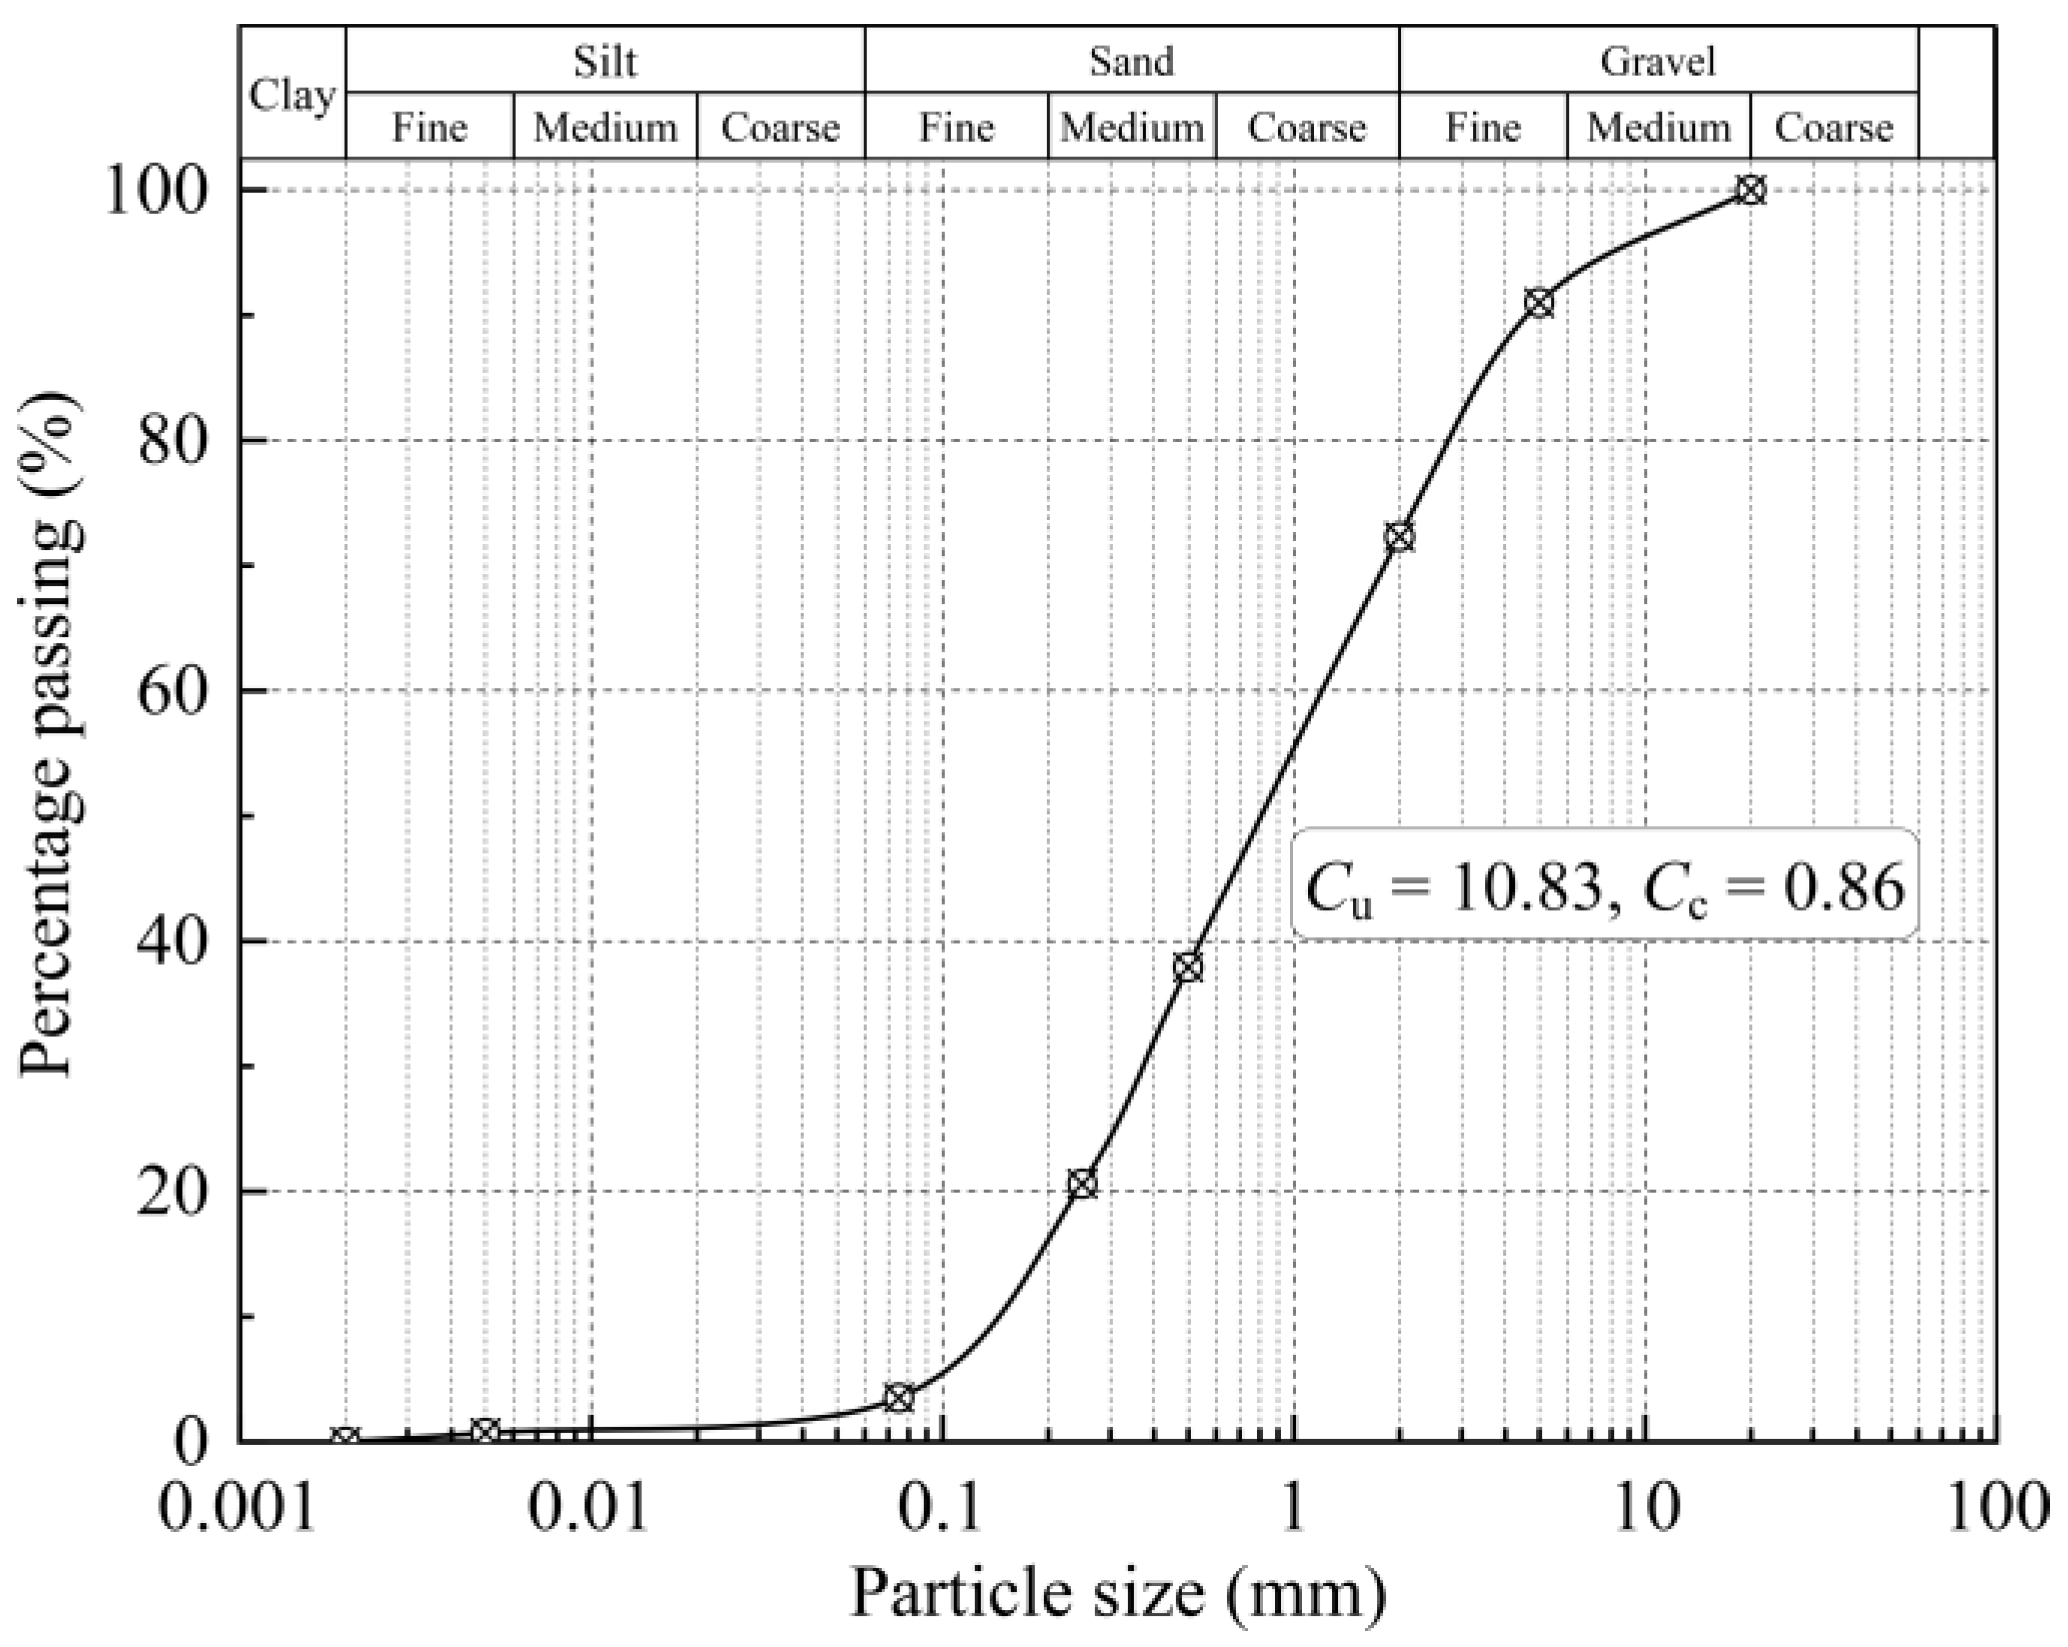
2. Tunnel Overview and Engineering Geology
3. Laboratory Tests on Soil Conditioning
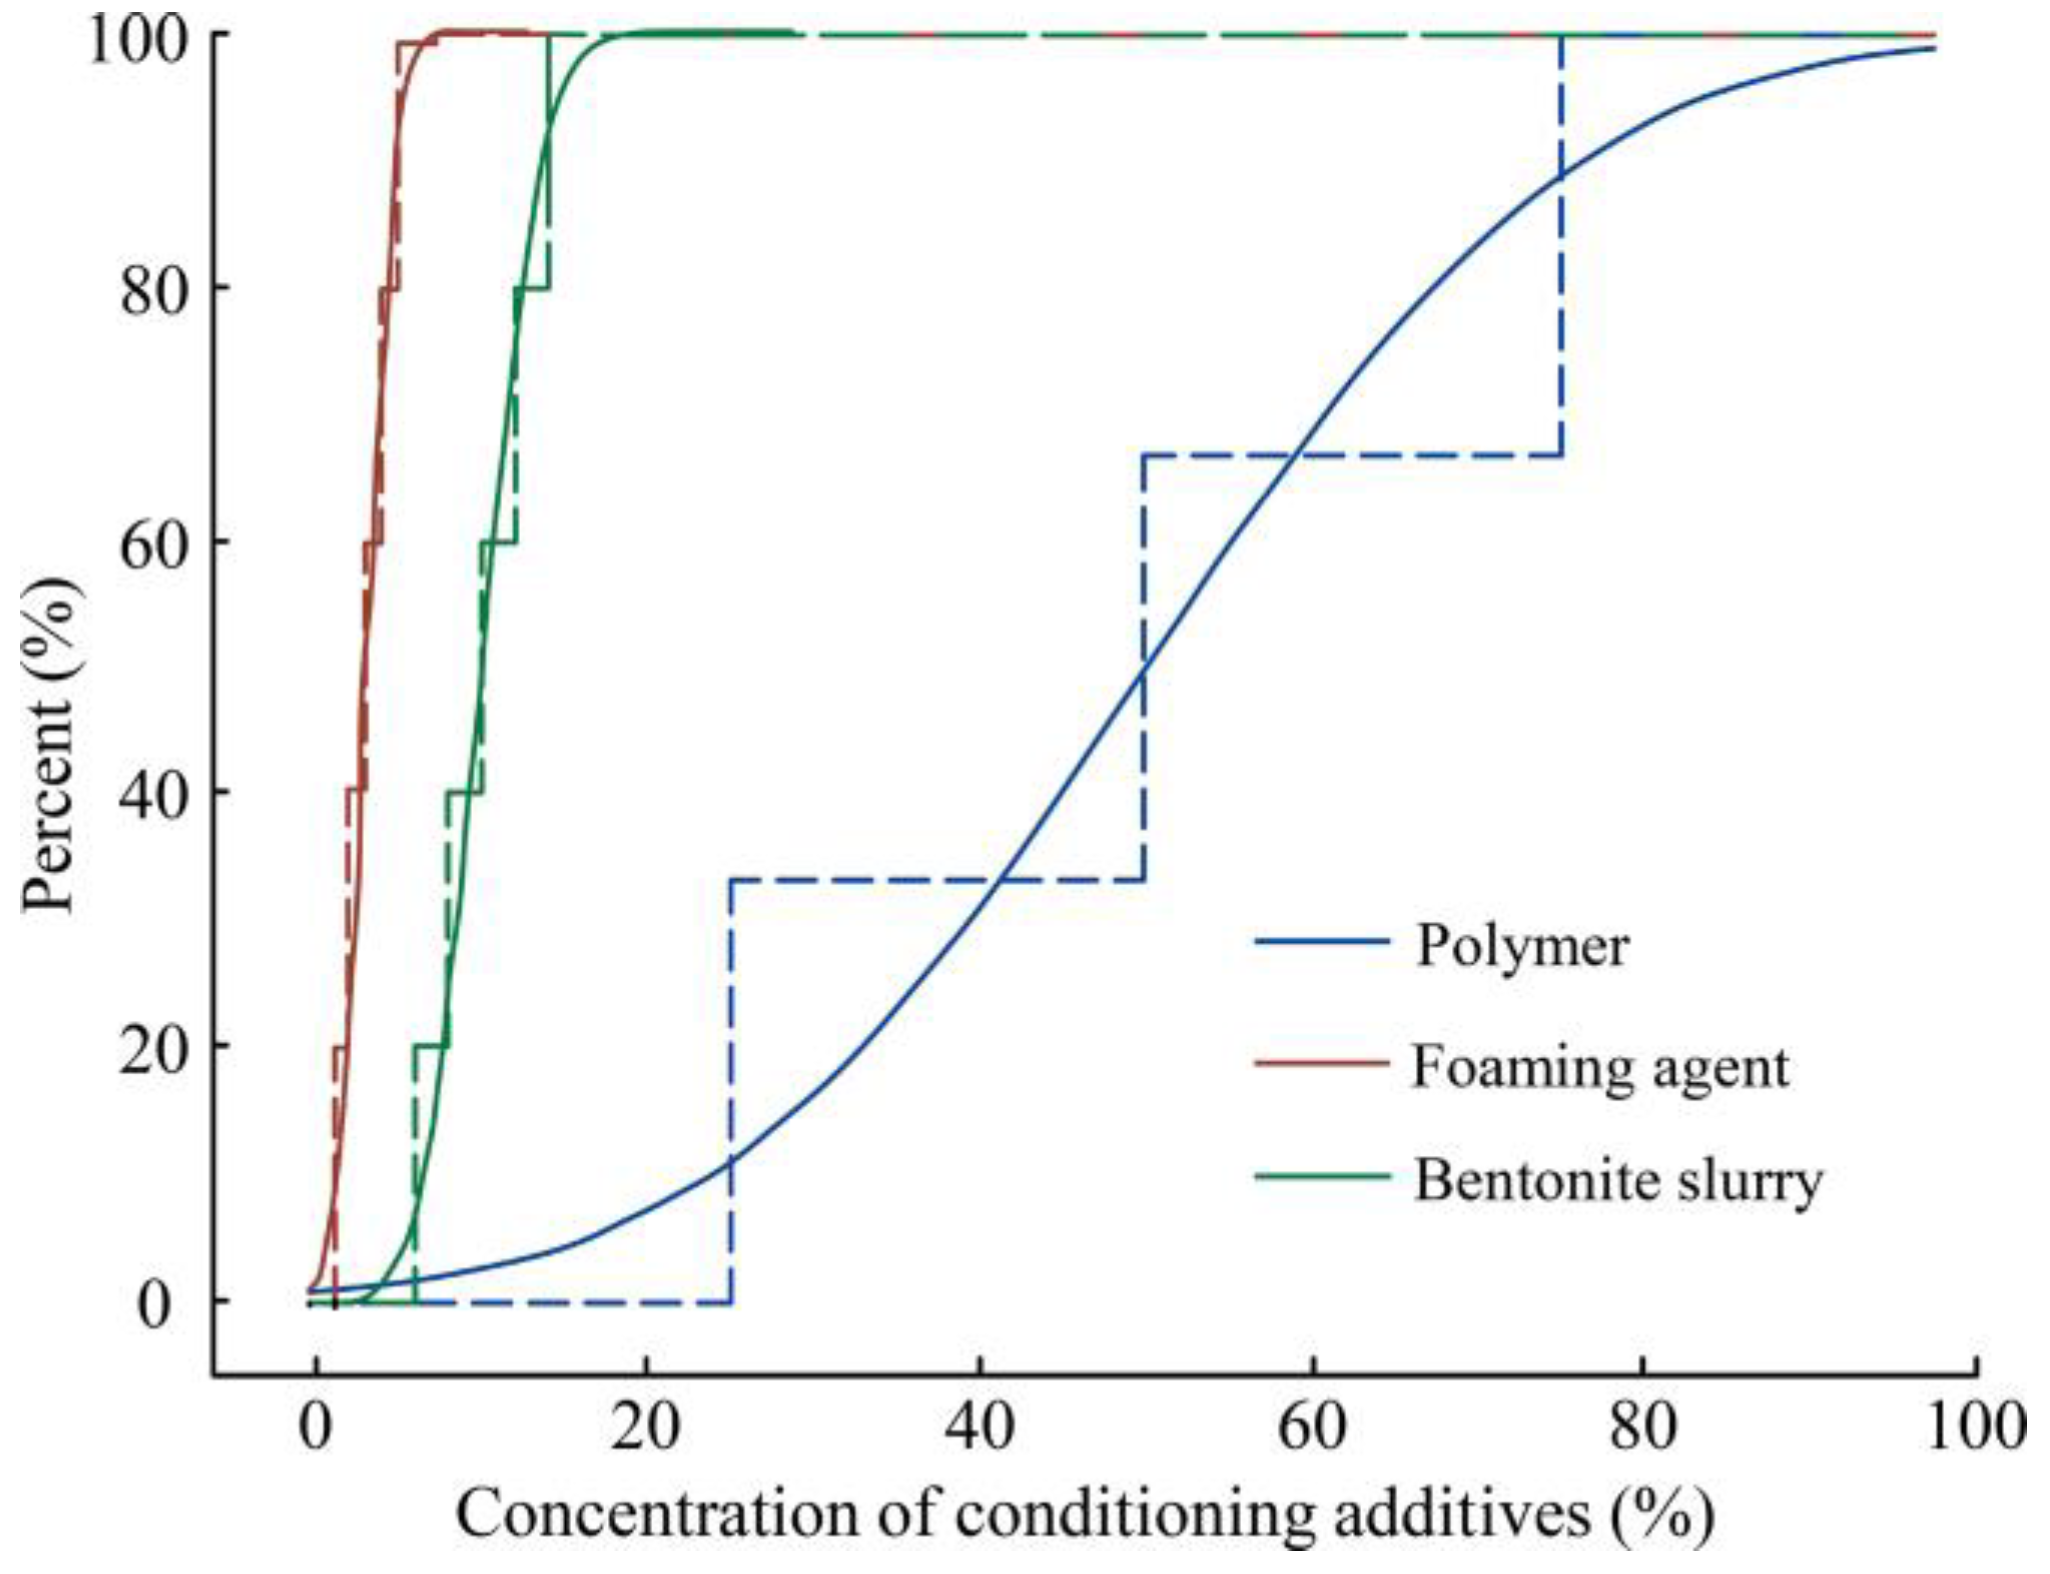
3.1. Factorial Experimental Design
- (1)
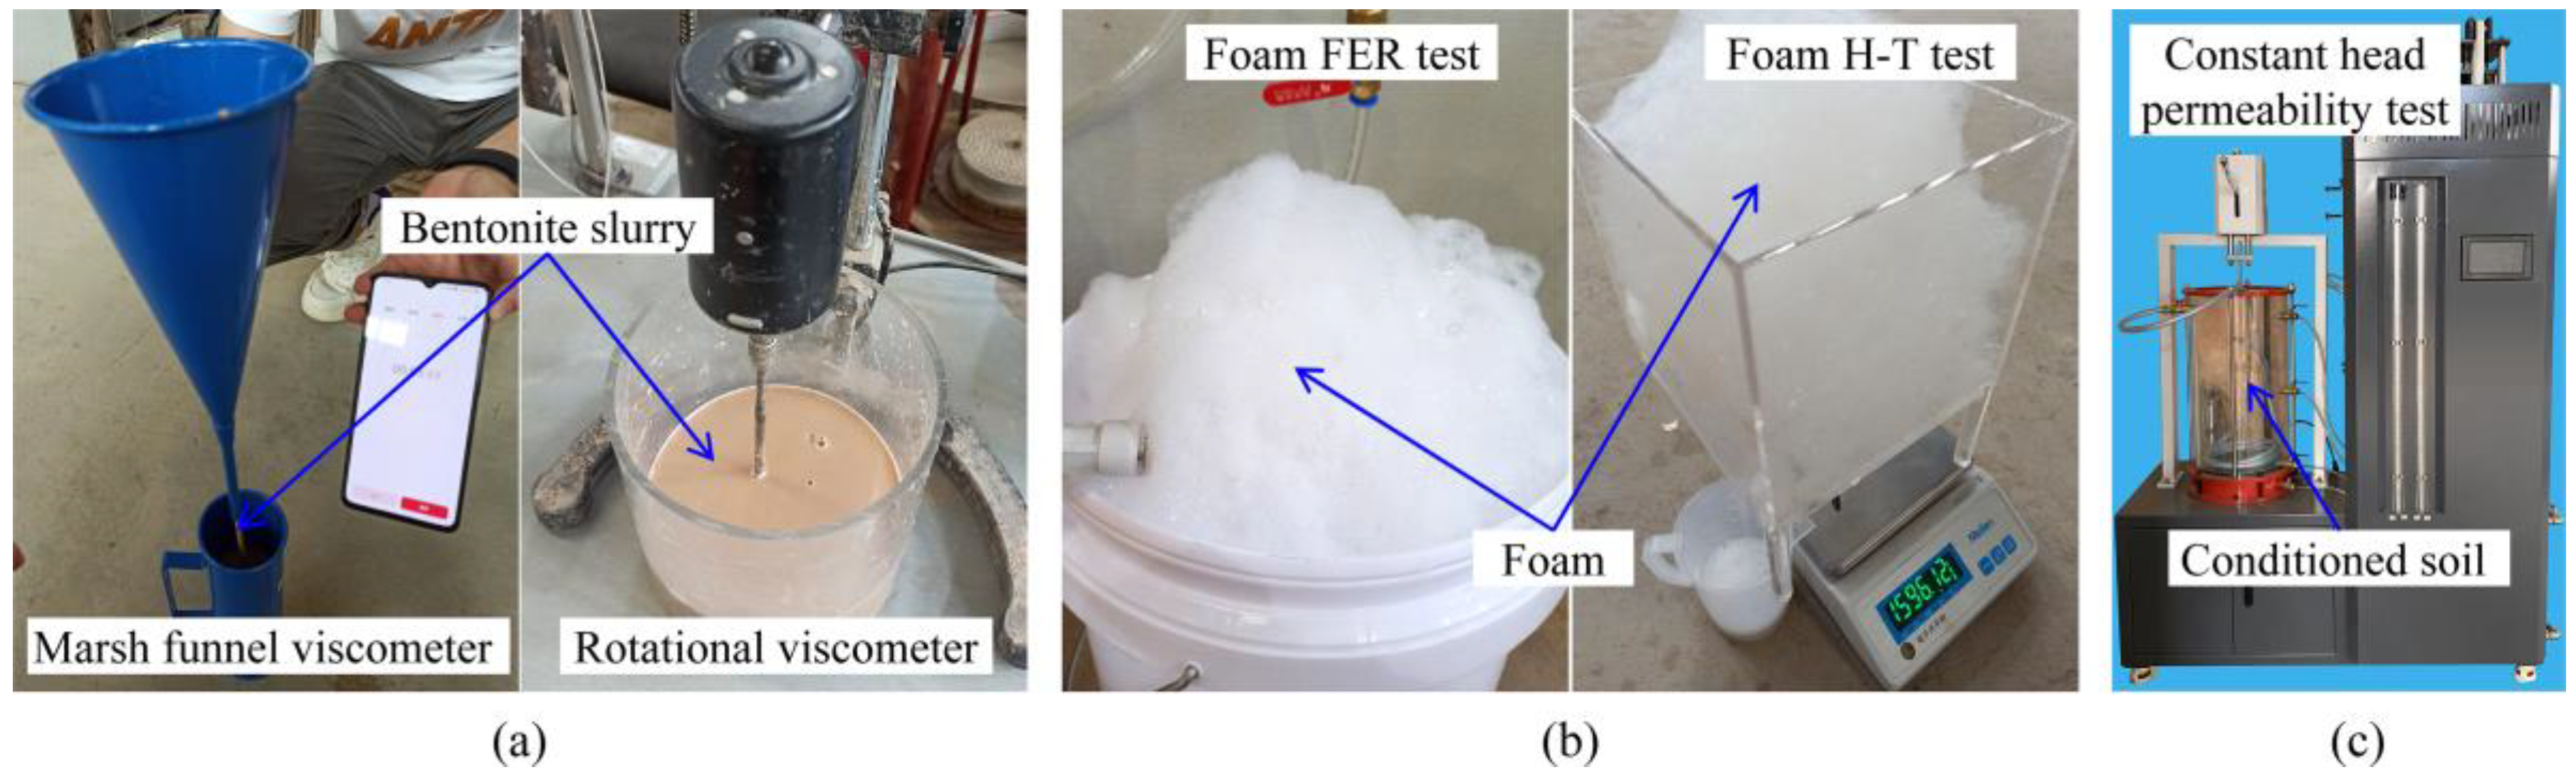
- Bentonite slurry performance test: We prepared bentonite slurry with different concentrations, and then tested the rheological properties of the slurry using a Marsh funnel and a rotational viscometer. We studied the variation law of the rheological properties of the bentonite slurry with time and concentration.
- (2)
- Foam performance test: The foam expansion ratio (FER) and half-life time (H-T) are important parameters reflecting the quality of the foaming agent and the foam’s performance. During the experiment, the gas–liquid flow ratio was maintained at 9. The foaming pressure was 3 bar. The H-T and FER were tested under standard atmospheric pressure conditions.
- (3)
- Constant head permeability test: This test studied the variation in permeability of saturated gravel sand before and after conditioning following the GB/T 50123-2019 [36] specification.
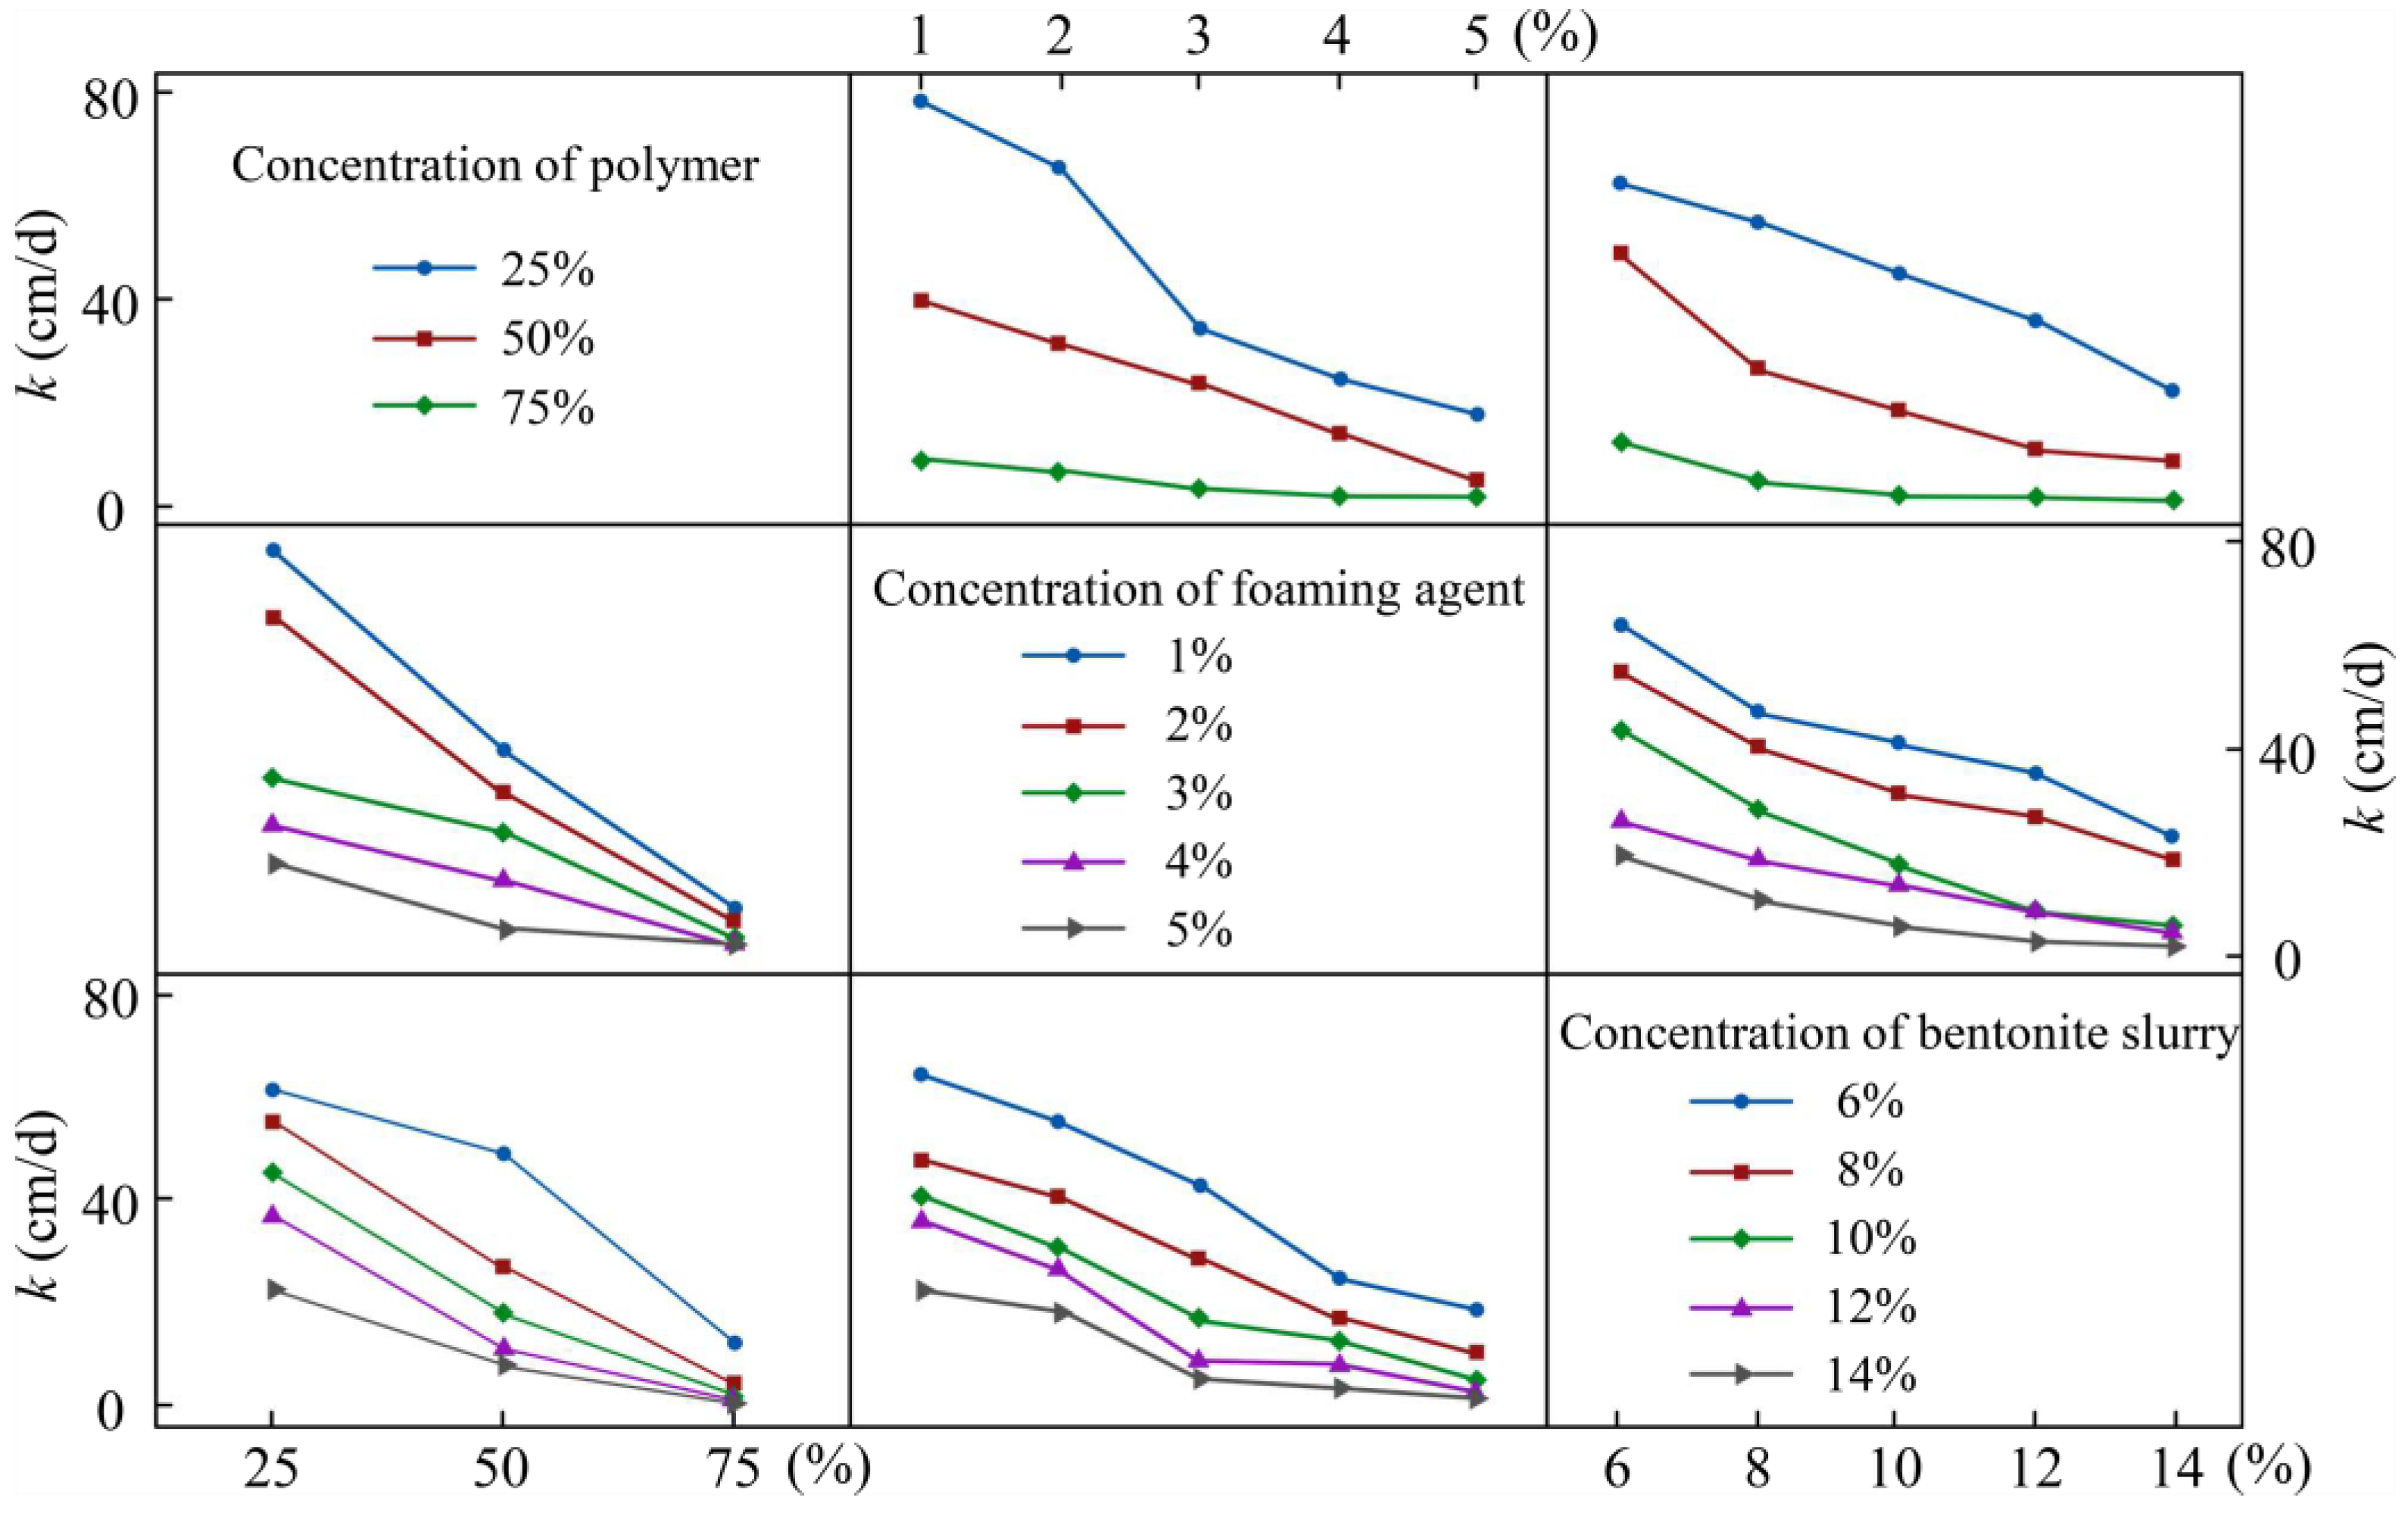
3.2. Analysis of Test Results
3.3. Normalized Effect Analysis
3.4. Main Effect Analysis
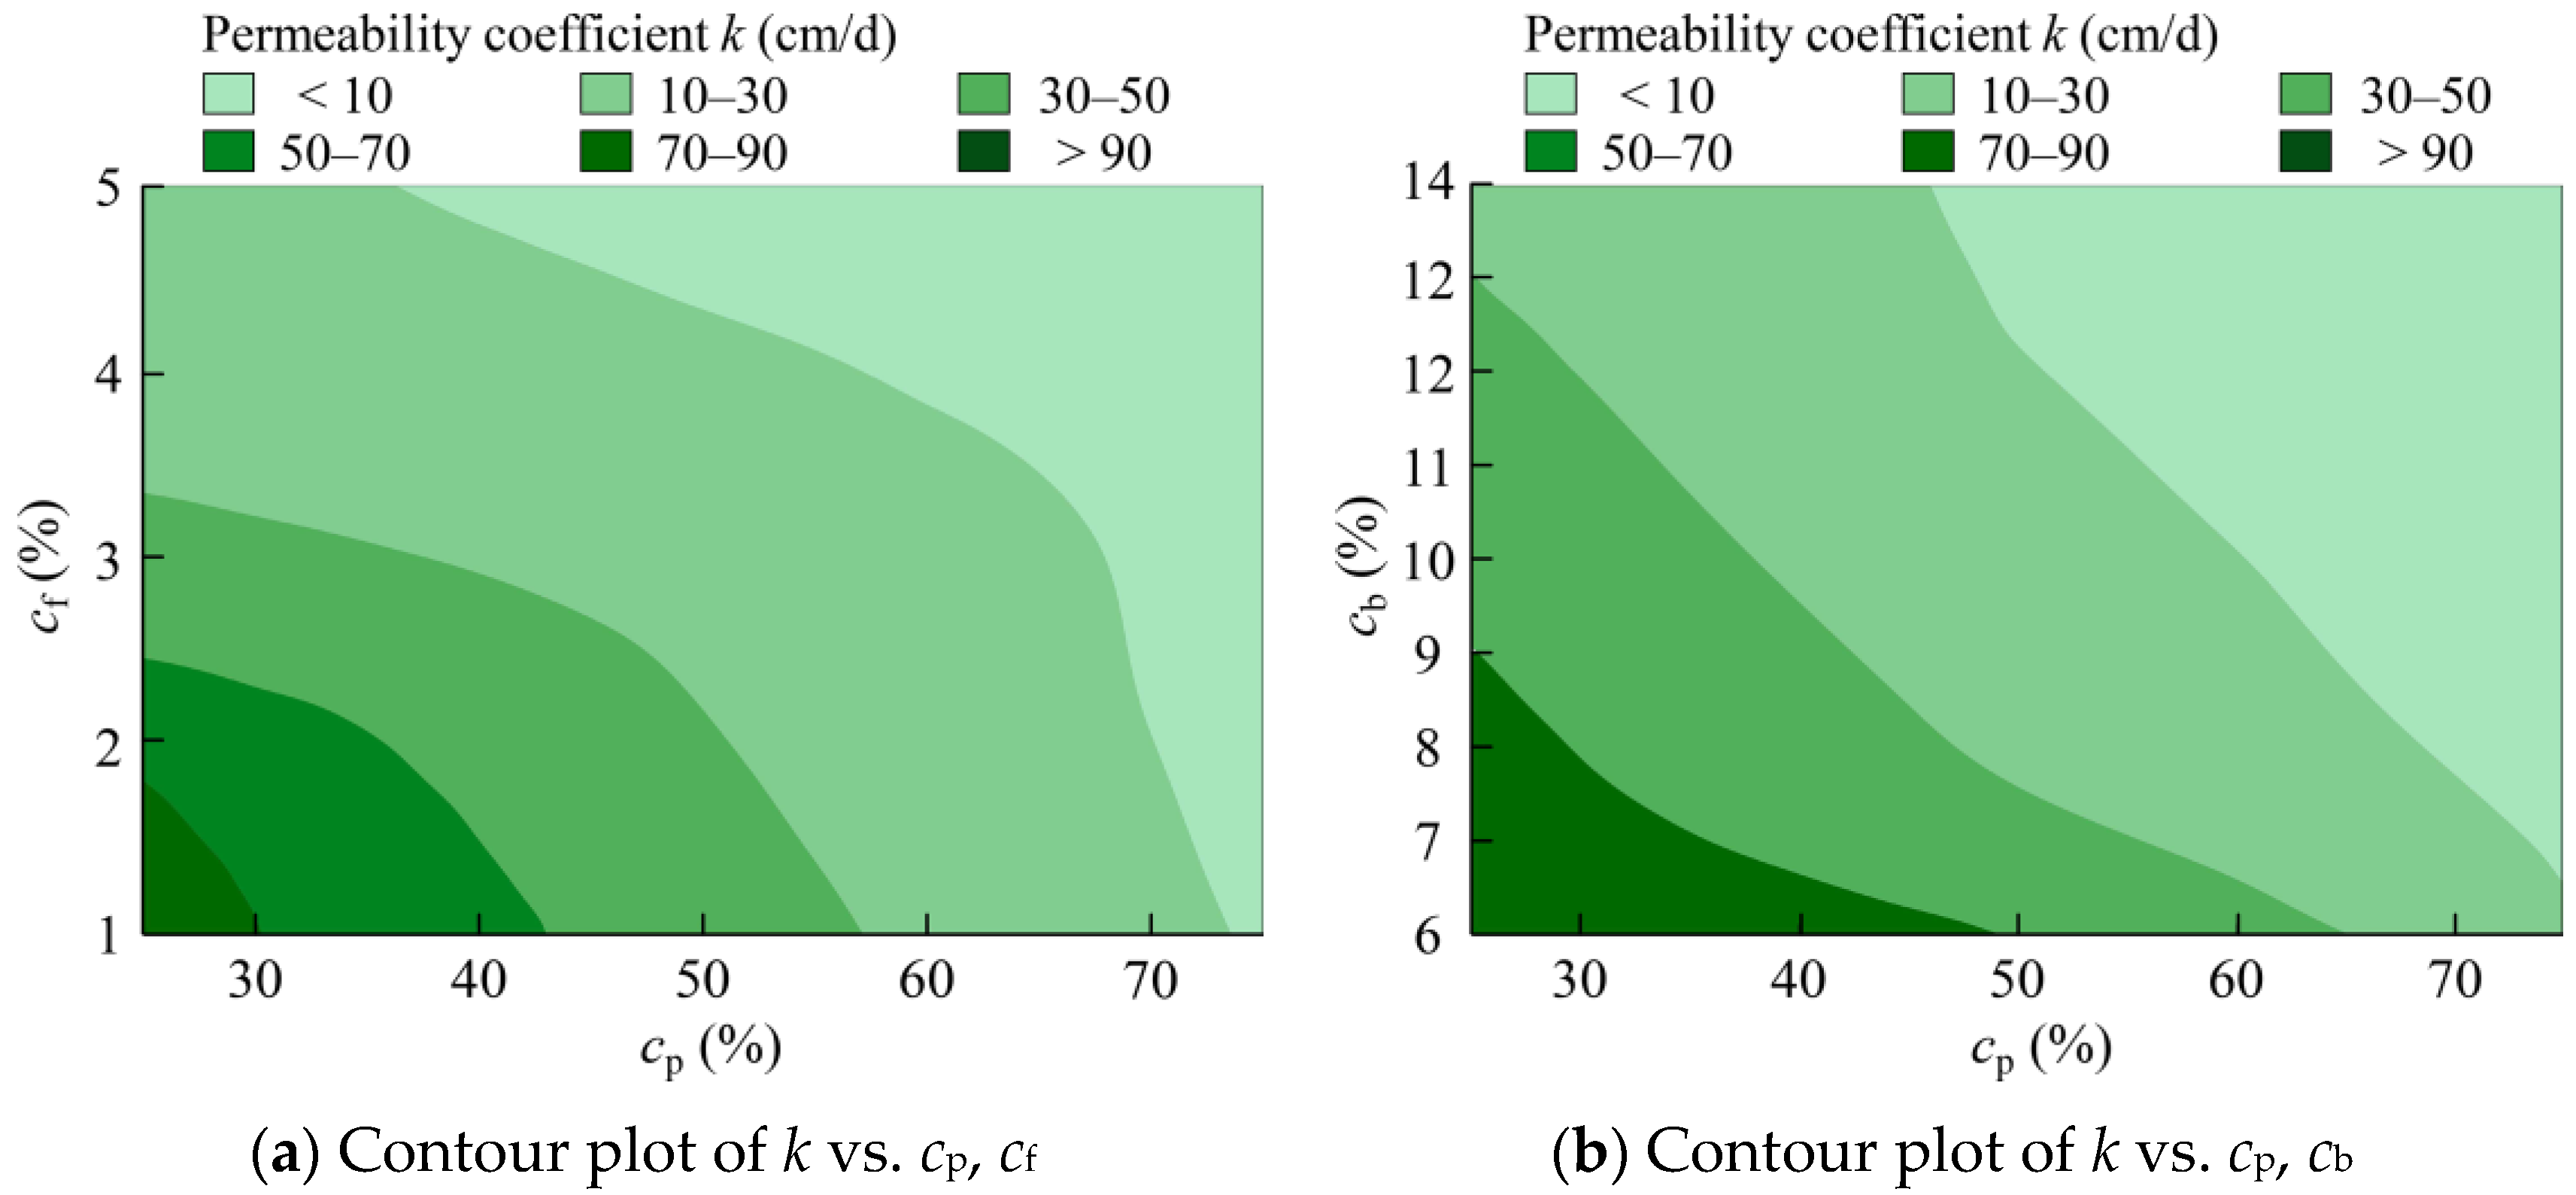
3.5. Interaction Analysis
3.6. Equivalence Relationship Prediction
4. Soil Conditioning Prediction Based on PSO–RVM
4.1. PSO–RVM Algorithm
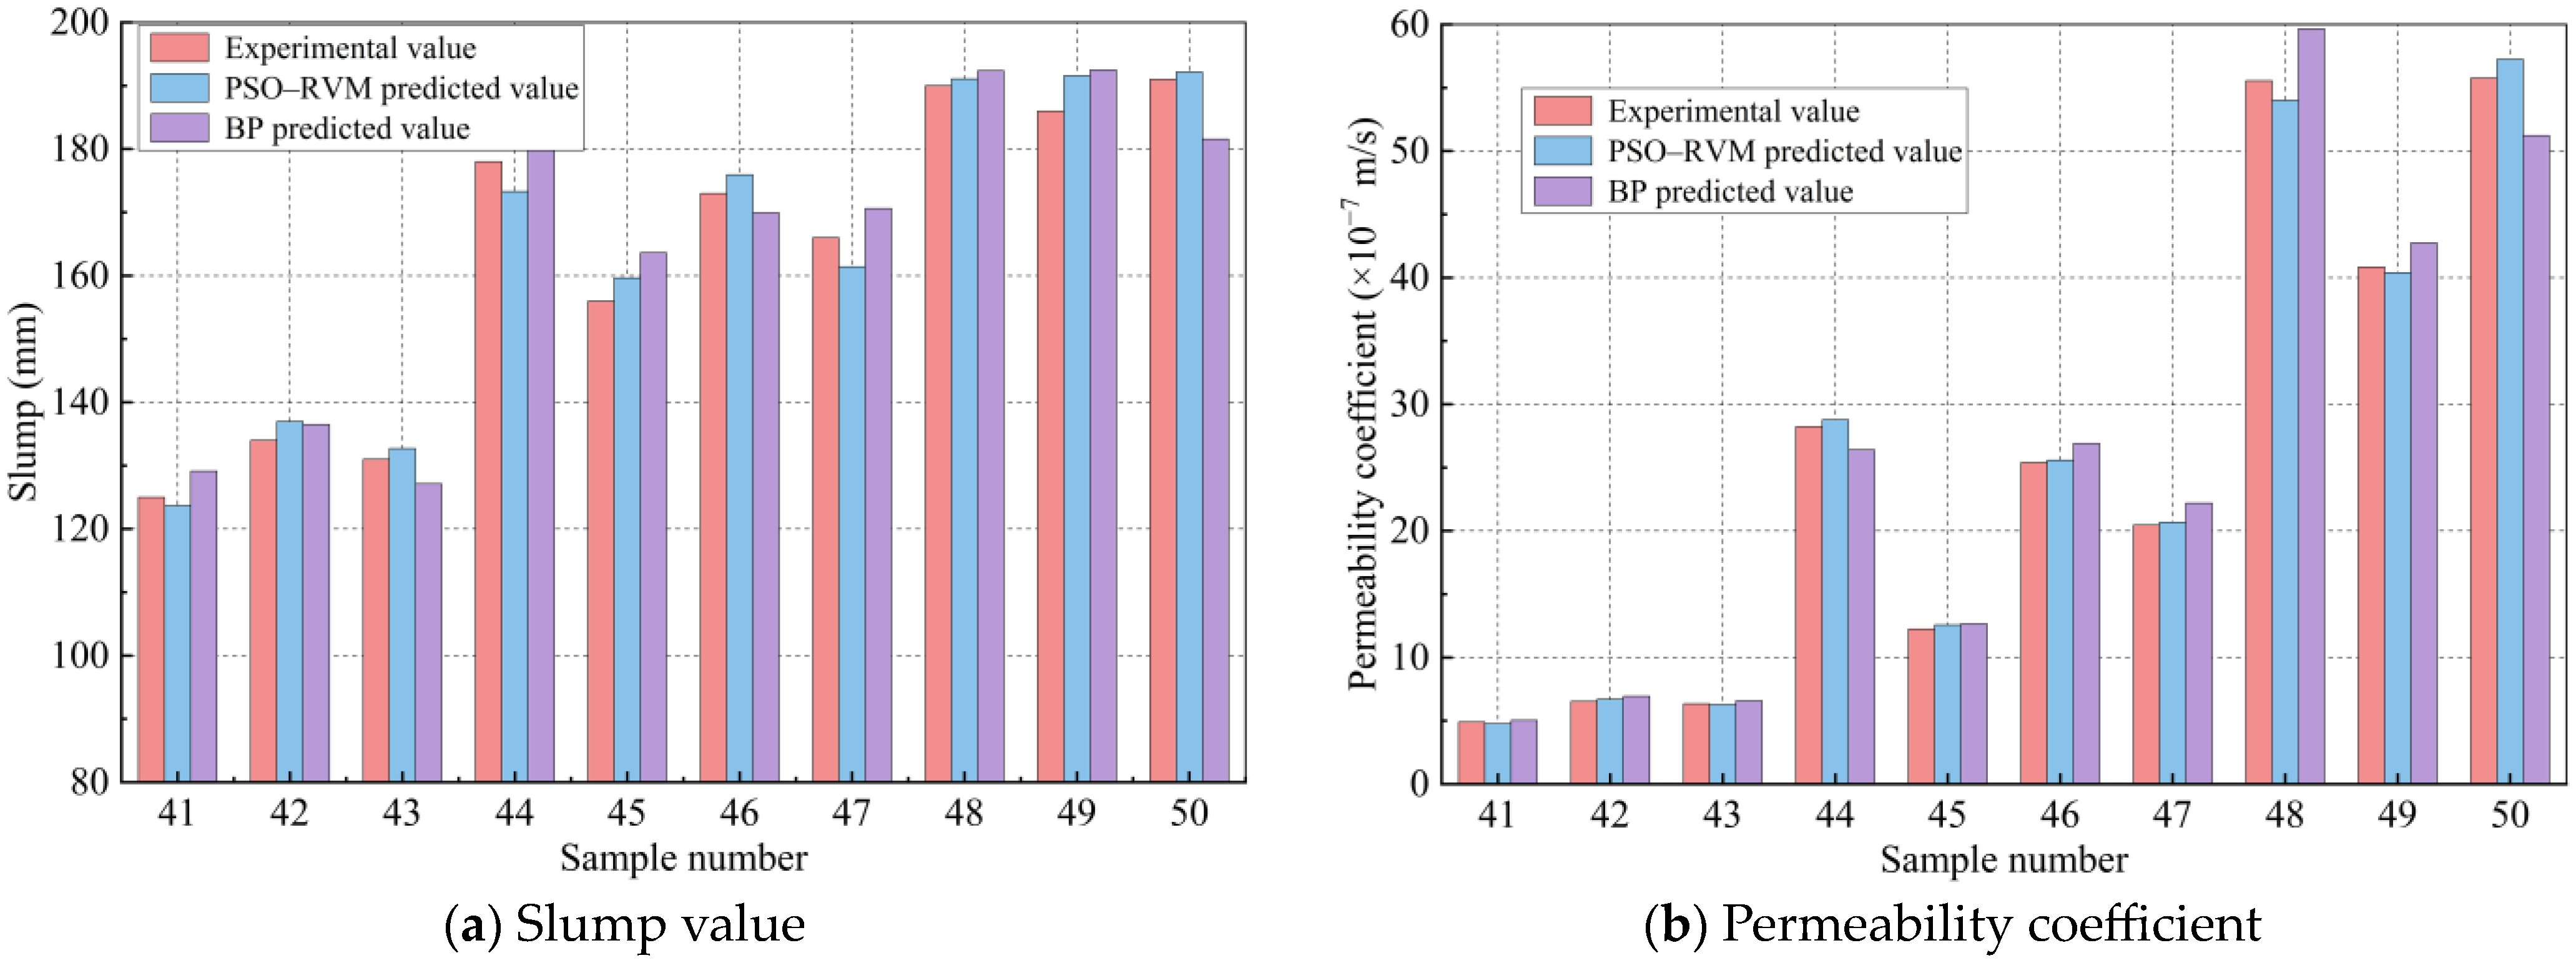
4.2. Case Study
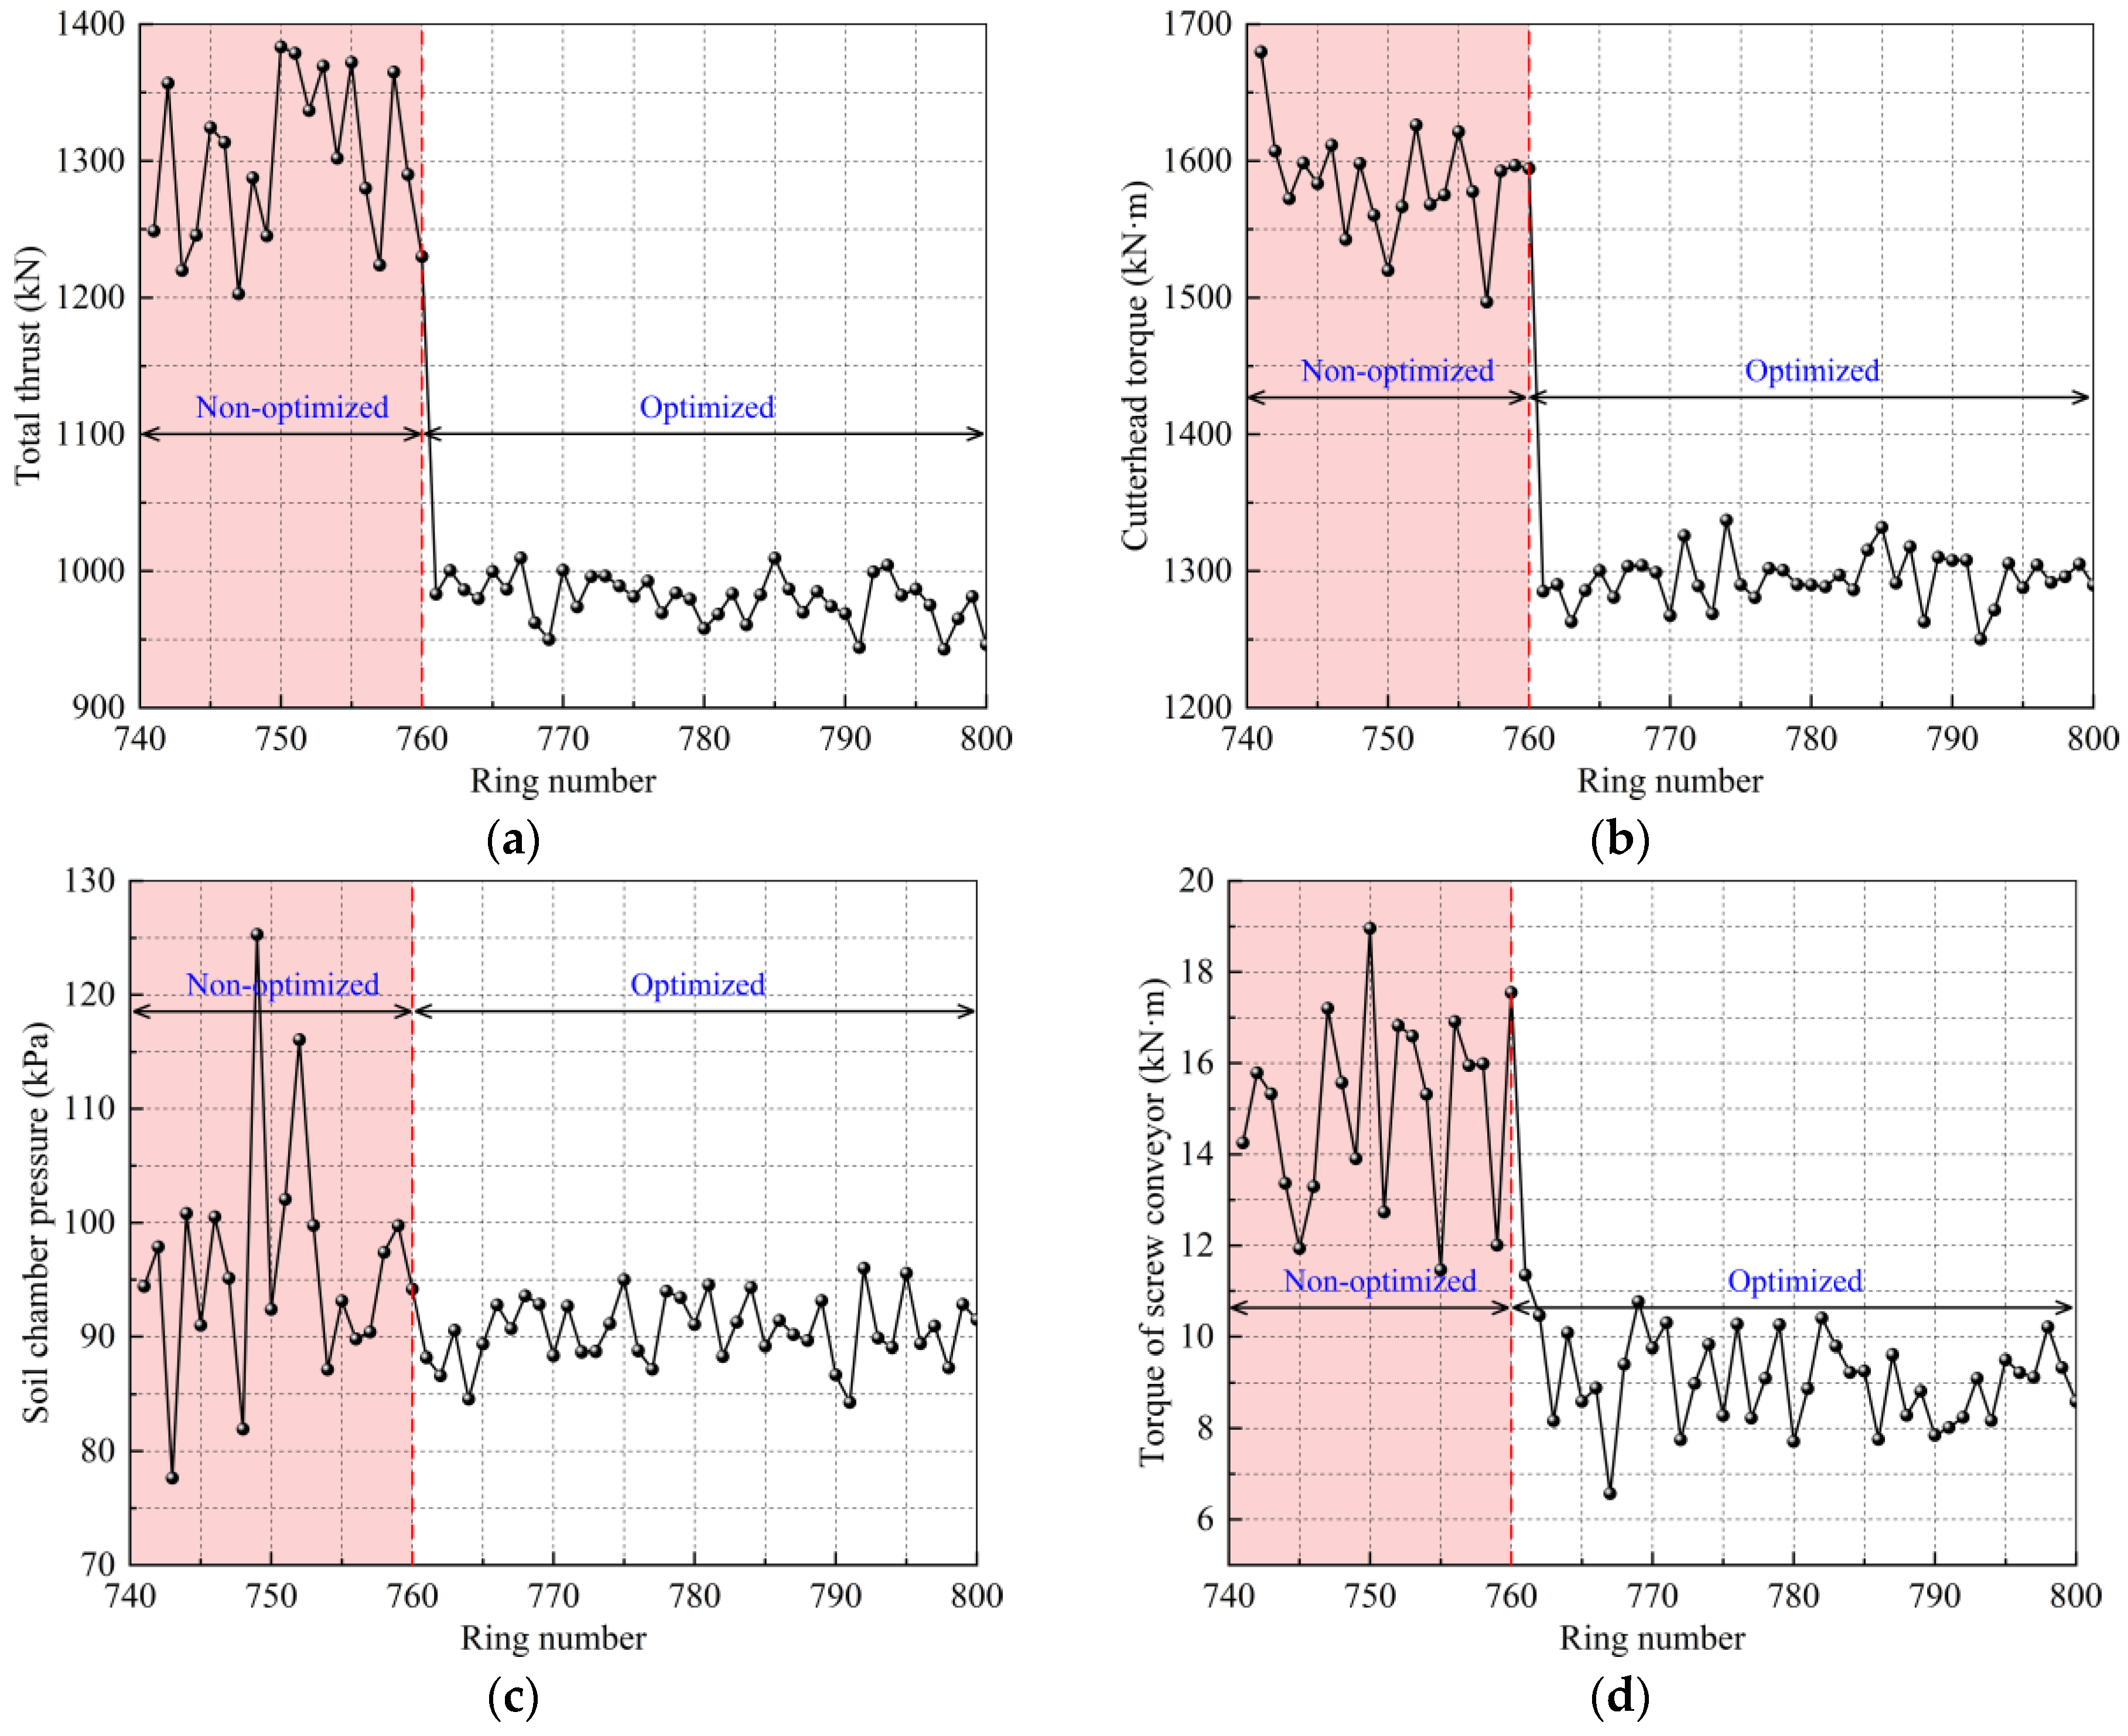
5. Field Application
6. Conclusions
- (1)
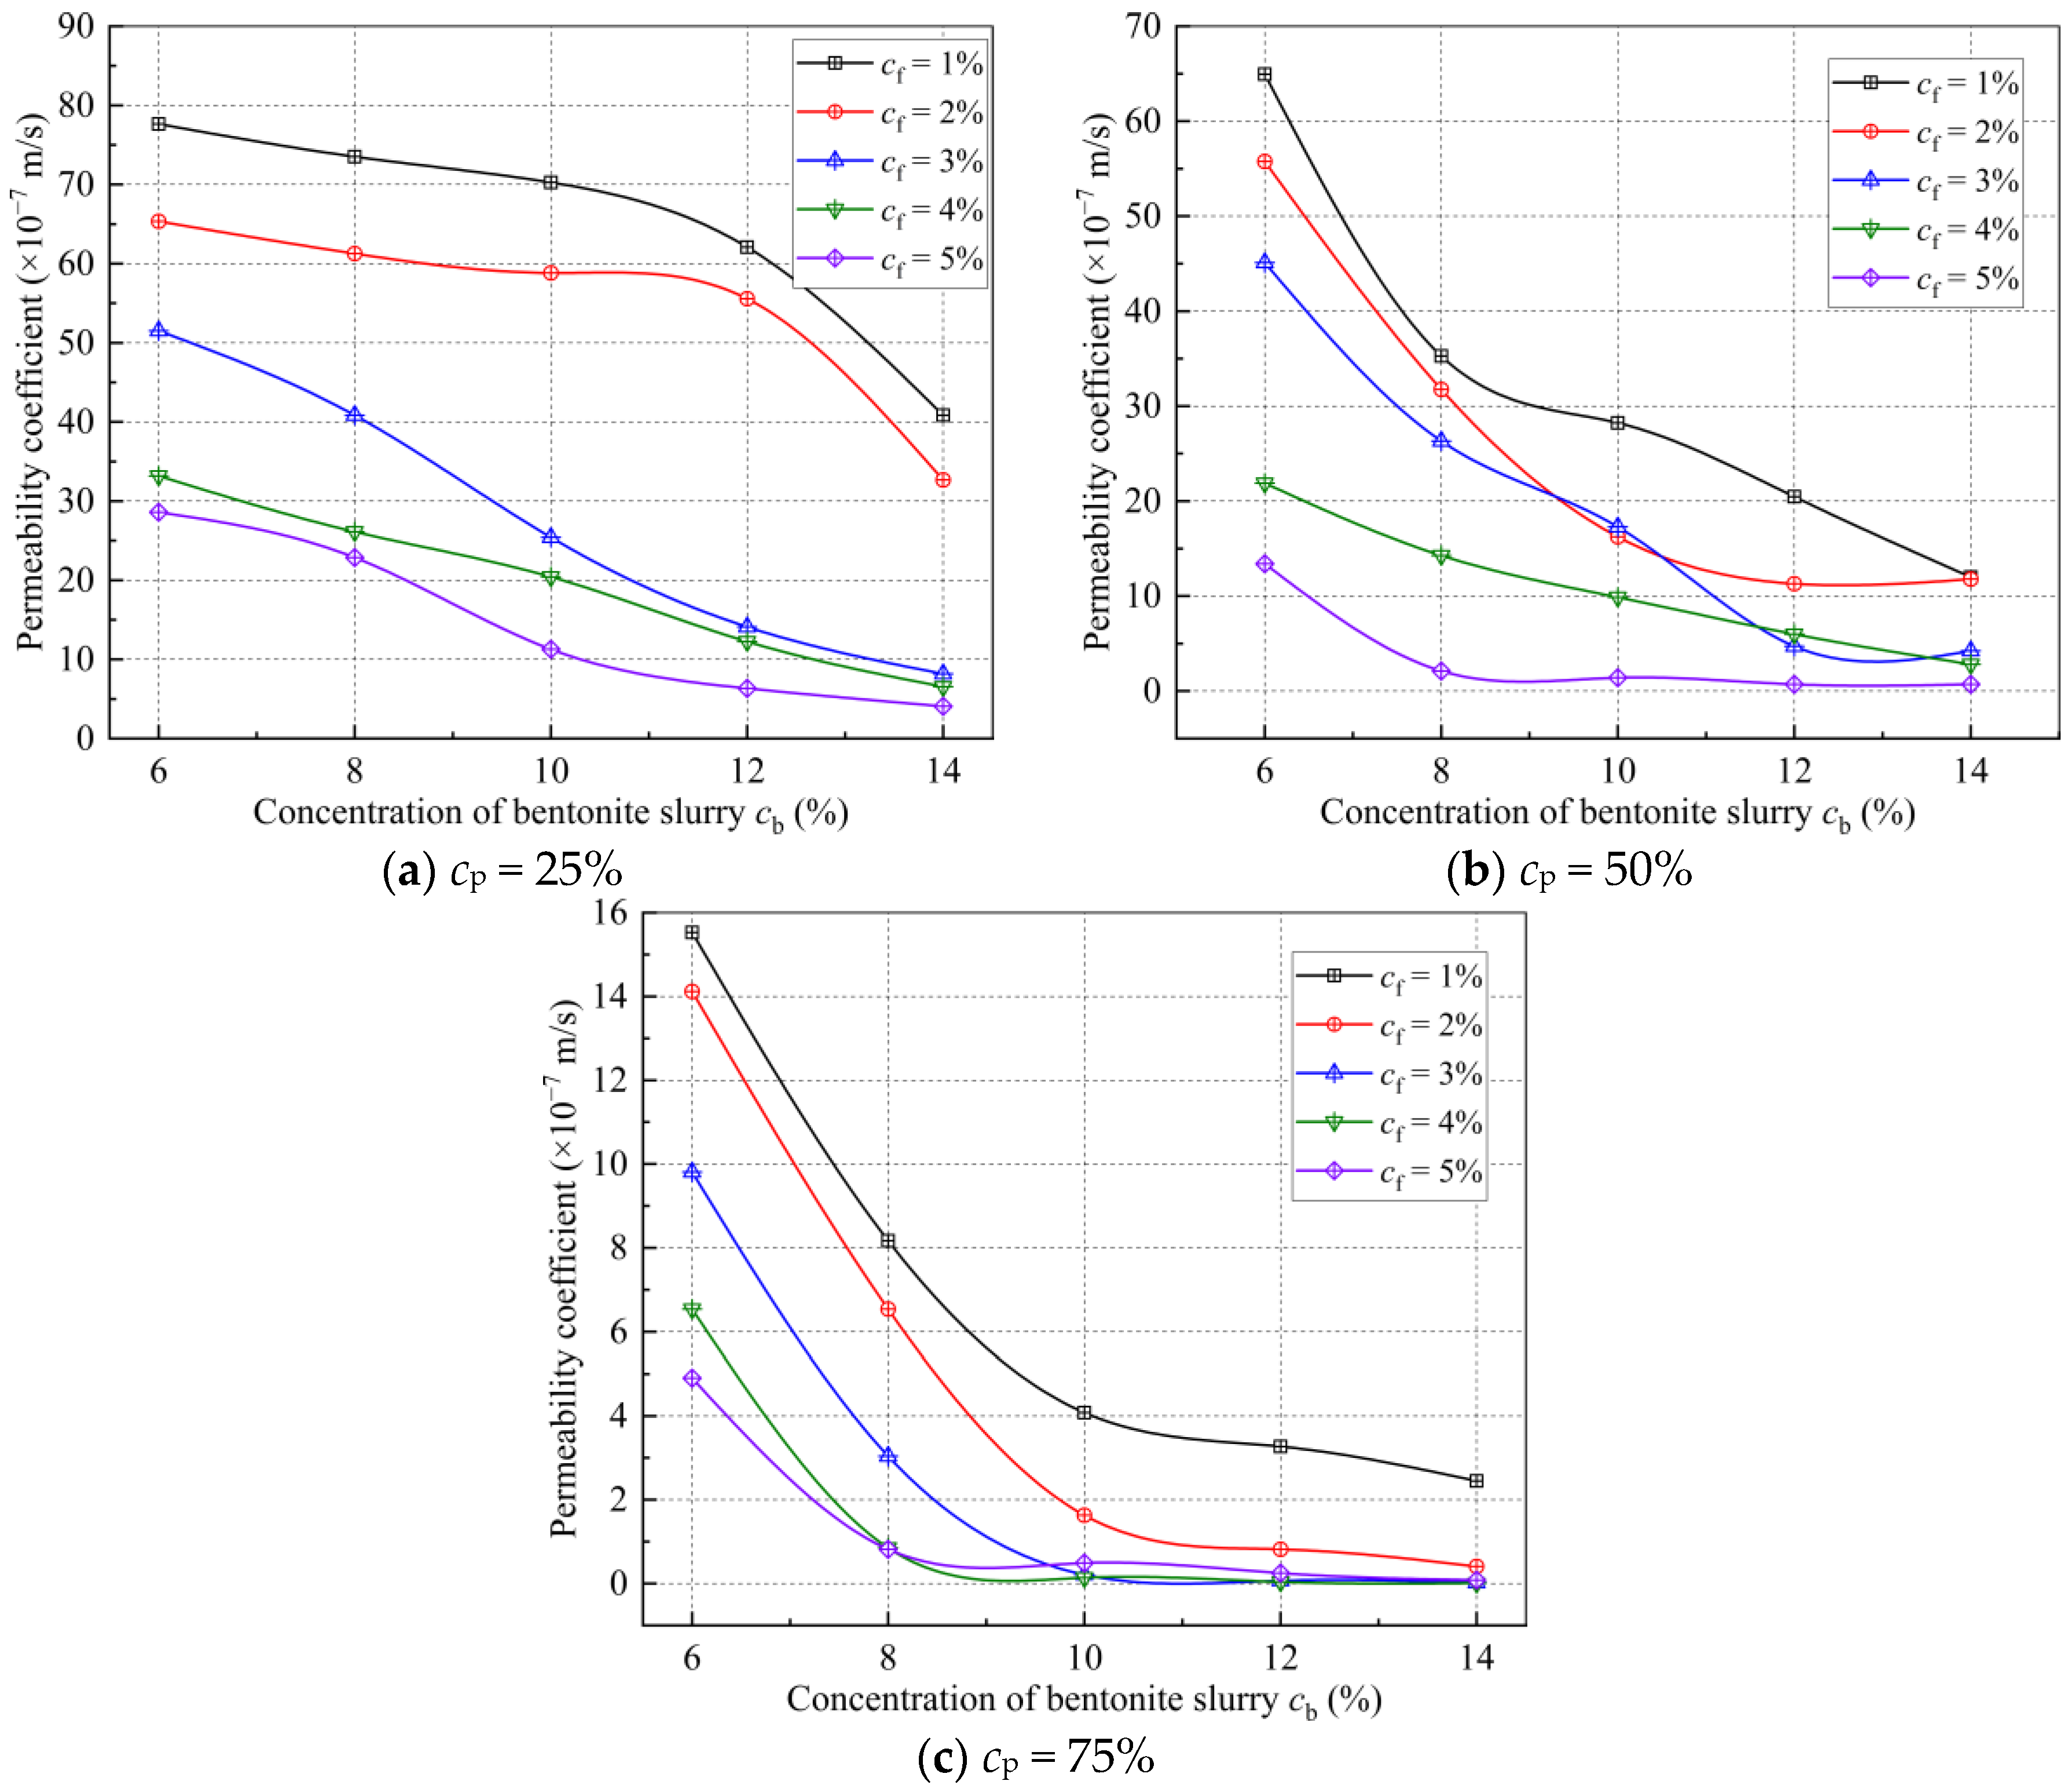
- As the concentration of bentonite slurry increased, the foaming agent’s improvement effect on the permeability of the conditioned soil gradually weakened. Under conditions of high polymer concentration (75%) and a concentration of bentonite slurry exceeding 10%, further increasing the concentrations of bentonite slurry and foaming agent had a weak impact on the permeability coefficient.
- (2)
- The significance of main effects, first-order, and second-order interactions on the permeability of conditioned soil were as follows: concentration of polymer (A) > concentration of foaming agent (B) > concentration of bentonite slurry (C) > first-order interactions (A × B, A × C, B × C) > second-order interaction (A × B × C).
- (3)
- The interaction relationship was mainly characterized by synergistic effects with antagonistic effects as secondary. The first-order interactions A × B, A × C, B × C mainly manifested as synergistic effects, while the second-order interaction A × B × C mainly exhibited antagonistic effects.
- (4)
- The PSO algorithm was utilized for parameter optimization. A shield tunneling soil conditioning prediction model based on the PSO–RVM algorithm was proposed, with the PSO model finding the optimal parameters for the RVM model. The maximum relative error between the predicted values based on the PSO–RVM model and the experimental values was less than 3%.
Author Contributions
Funding
Data Availability Statement
Conflicts of Interest
References
- Zou, B.; Yin, J.; Liu, Z.; Long, X. Transient rock breaking characteristics by successive impact of shield disc cutters under confining pressure conditions. Tunn. Undergr. Space Technol. 2024, 150, 105861. [Google Scholar] [CrossRef]
- Moghtader, T.; Sharafati, A.; Naderpour, H.; Gharouni Nik, M. Estimating maximum surface settlement caused by EPB shield tunneling utilizing an intelligent approach. Buildings 2023, 13, 1051. [Google Scholar] [CrossRef]
- Koohsari, A.; Kalatehjari, R.; Moosazadeh, S.; Hajihassani, M.; Van, B. A Critical Investigation on the Reliability, Availability, and Maintainability of EPB Machines: A Case Study. Appl. Sci. 2022, 12, 11245. [Google Scholar] [CrossRef]
- Wu, Y.; Nazem, A.; Meng, F.; Mooney, M.A. Experimental study on the stability of foam-conditioned sand under pressure in the EPBM chamber. Tunn. Undergr. Space Technol. 2020, 106, 103590. [Google Scholar] [CrossRef]
- Liu, Z.; Wang, S.; Qu, T.; Geng, X. The role of foam in improving the workability of sand: Insights from DEM. Minerals 2022, 12, 186. [Google Scholar] [CrossRef]
- Li, S.; Wan, Z.; Zhao, S.; Ma, P.; Wang, M.; Xiong, B. Soil conditioning tests on sandy soil for earth pressure balance shield tunneling and field applications. Tunn. Undergr. Space Technol. 2022, 120, 104271. [Google Scholar] [CrossRef]
- Ling, F.; Wang, S.; Hu, Q.; Huang, S.; Feng, Z. Effect of bentonite slurry on the function of foam for changing the permeability characteristics of sand under high hydraulic gradients. Can. Geotech. J. 2022, 59, 1061–1070. [Google Scholar] [CrossRef]
- Dai, Z.; Peng, L.; Qin, S. Experimental and numerical investigation on the mechanism of ground collapse induced by underground drainage pipe leakage. Environ. Earth Sci. 2024, 83, 32. [Google Scholar] [CrossRef]
- Hu, W.; Rostami, J. Evaluating rheology of conditioned soil using commercially available surfactants (foam) for simulation of material flow through EPB machine. Tunn. Undergr. Space Technol. 2021, 112, 103881. [Google Scholar] [CrossRef]
- Hu, Q.; Wang, S.; Qu, T.; Xu, T.; Huang, S.; Wang, H. Effect of hydraulic gradient on the permeability characteristics of foam-conditioned sand for mechanized tunnelling. Tunn. Undergr. Space Technol. 2020, 99, 103377. [Google Scholar] [CrossRef]
- Wang, S.; Ni, Z.; Qu, T.; Wang, H.; Pan, Q. A novel index to evaluate the workability of conditioned coarse-grained soil for EPB shield tunnelling. J. Constr. Eng. Manag. 2022, 148, 04022028. [Google Scholar] [CrossRef]
- Mori, L.; Mooney, M.; Cha, M. Characterizing the influence of stress on foam conditioned sand for EPB tunneling. Tunn. Undergr. Space Technol. 2018, 71, 454–465. [Google Scholar] [CrossRef]
- Sun, Y.; Zhao, D. Research and Experimental application of new slurry proportioning for slag improvement of EPB shield crossing sand and gravel layer. Coatings 2022, 12, 1961. [Google Scholar] [CrossRef]
- Souwaissi, N.E.; Djeran-Maigre, I.; Boulange, L.; Trottin, J.L. Effects of the physical characteristics of foams on conditioned soil’s flow behavior: A case study. Tunn. Undergr. Space Technol. 2023, 137, 105111. [Google Scholar] [CrossRef]
- Huang, Z.; Wang, C.; Dong, J.; Zhou, J.; Yang, J.; Li, Y. Conditioning experiment on sand and cobble soil for shield tunneling. Tunn. Undergr. Space Technol. 2019, 87, 187–194. [Google Scholar] [CrossRef]
- Budach, C.; Thewes, M. Application ranges of EPB shields in coarse ground based on laboratory research. Tunn. Undergr. Space Technol. 2015, 50, 296–304. [Google Scholar] [CrossRef]
- Wang, S.; Hu, Q.; Wang, H.; Thewes, M.; Ge, L.; Yang, J.; Liu, P. Permeability characteristics of poorly graded sand conditioned with foam in different conditioning states. J. Test. Eval. 2021, 49, 3620–3636. [Google Scholar] [CrossRef]
- Yang, Z.; Yang, X.; Ding, Y.; Jiang, Y.; Qi, W.; Sun, Z.; Shao, X. Characteristics of conditioned sand for EPB shield and its influence on cutterhead torque. Acta Geotech. 2022, 17, 5813–5828. [Google Scholar] [CrossRef]
- Lin, X.; Zhou, X.; Yang, Y. A new soil conditioner for highly permeable sandy gravel stratum in EPBs. Appl. Sci. 2021, 11, 2109. [Google Scholar] [CrossRef]
- Jafari, S.; Farhanieh, B.; Afshin, H. Effects of fire parameters on critical velocity in curved tunnels: A numerical study and response surface analysis. Fire Technol. 2024, 60, 1769–1802. [Google Scholar] [CrossRef]
- Xu, Q.; Zhang, L.; Zhu, H.; Gong, Z.; Liu, J.; Zhu, Y. Laboratory tests on conditioning the sandy cobble soil for EPB shield tunnelling and its field application. Tunn. Undergr. Space Technol. 2020, 105, 103512. [Google Scholar] [CrossRef]
- Kong, G.; Wu, D.; Wei, Y. Experimental and numerical investigations on the energy and structural performance of a full-scale energy utility tunnel. Tunn. Undergr. Space Technol. 2023, 139, 105208. [Google Scholar] [CrossRef]
- Huang, Z.; Cheng, Y.; Zhang, D.; Yan, D.; Shen, Y. Seismic fragility and resilience assessment of shallowly buried large-section underground civil defense structure in soft soils: Framework and application. Tunn. Undergr. Space Technol. 2024, 146, 105640. [Google Scholar] [CrossRef]
- Deng, L.C.; Zhang, W.; Deng, L.; Shi, Y.H.; Zi, J.J.; He, X.; Zhu, H.H. Forecasting and early warning of shield tunnelling-induced ground collapse in rock-soil interface mixed ground using multivariate data fusion and Catastrophe Theory. Eng. Geol. 2024, 335, 107548. [Google Scholar] [CrossRef]
- Shi, M.; Hu, W.; Li, M.; Zhang, J.; Song, X.; Sun, W. Ensemble regression based on polynomial regression-based decision tree and its application in the in-situ data of tunnel boring machine. Mech. Syst. Signal Process. 2023, 188, 110022. [Google Scholar] [CrossRef]
- Liu, H.; Yue, Y.; Lian, Y.; Meng, X.; Du, Y.; Cui, J. Reverse-time migration of GPR data for imaging cavities behind a reinforced shield tunnel. Tunn. Undergr. Space Technol. 2024, 146, 105649. [Google Scholar] [CrossRef]
- Zhu, L.; Chen, D.; Feng, P. Equipment operational reliability evaluation method based on RVM and PCA-Fused features. Math. Probl. Eng. 2021, 2021, 6687248. [Google Scholar] [CrossRef]
- Suprajitno, H. Long-term forecasting of crop water requirement with BP-RVM algorithm for food security and harvest risk reduction. Int. J. Saf. Secur. Eng. 2023, 13, 565–575. [Google Scholar] [CrossRef]
- Lu, C.T. Noise reduction using three-step gain factor and iterative-directional-median filter. Appl. Acoust. 2014, 76, 249–261. [Google Scholar] [CrossRef]
- Zhang, Y.; Wang, Z.; Kuang, H.; Fu, F.; Yu, A. Prediction of surface settlement in shield-tunneling construction process using PCA-PSO-RVM machine learning. J. Perform. Constr. Facil. 2023, 37, 04023012. [Google Scholar] [CrossRef]
- ASTM D2488-17e1; Standard Practice for Description and Identification of Soils (Visual-Manual Procedures). ASTM International: West Conshohocken, PA, USA, 2017. [CrossRef]
- Avunduk, E.M.R.E.; Copur, H.; Tolouei, S.; Tumac, D.; Balci, C.; Bilgin, N.; Shaterpour–Mamaghani, A. Possibility of using torvane shear testing device for soil conditioning optimization. Tunn. Undergr. Space Technol. 2021, 107, 103665. [Google Scholar] [CrossRef]
- Lee, H.; Kwak, J.; Choi, J.; Hwang, B.; Choi, H. A lab-scale experimental approach to evaluate rheological properties of foam-conditioned soil for EPB shield tunnelling. Tunn. Undergr. Space Technol. 2022, 128, 104667. [Google Scholar] [CrossRef]
- Carigi, A.; Luciani, A.; Todaro, C.; Martinelli, D.; Peila, D. Influence of conditioning on the behaviour of alluvial soils with cobbles. Tunn. Undergr. Space Technol. 2020, 96, 103225. [Google Scholar] [CrossRef]
- Peila, D.; Picchio, A.; Martinelli, D.; Negro, E.D. Laboratory tests on soil conditioning of clayey soil. Acta Geotech. 2016, 11, 1061–1074. [Google Scholar] [CrossRef]
- GB/T 50123-2019; Standard for Geotechnical Testing Method. China Planning Press: Beijing, China, 2019.


| A1 | A2 | A3 | |||||||||||||
|---|---|---|---|---|---|---|---|---|---|---|---|---|---|---|---|
| B1 | B2 | B3 | B4 | B5 | B1 | B2 | B3 | B4 | B5 | B1 | B2 | B3 | B4 | B5 | |
| C1 | A1B1C1 | A1B2C1 | A1B3C1 | A1B4C1 | A1B5C1 | A2B1C1 | A2B2C1 | A2B3C1 | A2B4C1 | A2B5C1 | A3B1C1 | A3B2C1 | A3B3C1 | A3B4C1 | A3B5C1 |
| C2 | A1B1C2 | A1B2C2 | A1B3C2 | A1B4C2 | A1B5C2 | A2B1C2 | A2B2C2 | A2B3C2 | A2B4C2 | A2B5C2 | A3B1C2 | A3B2C2 | A3B3C2 | A3B4C2 | A3B5C2 |
| C3 | A1B1C3 | A1B2C3 | A1B3C3 | A1B4C3 | A1B5C3 | A2B1C3 | A2B2C3 | A2B3C3 | A2B4C3 | A2B5C3 | A3B1C3 | A3B2C3 | A3B3C3 | A3B4C3 | A3B5C3 |
| C4 | A1B1C4 | A1B2C4 | A1B3C4 | A1B4C4 | A1B5C4 | A2B1C4 | A2B2C4 | A2B3C4 | A2B4C4 | A2B5C4 | A3B1C4 | A3B2C4 | A3B3C4 | A3B4C4 | A3B5C4 |
| C5 | A1B1C5 | A1B2C5 | A1B3C5 | A1B4C5 | A1B5C5 | A2B1C5 | A2B2C5 | A2B3C5 | A2B4C5 | A2B5C5 | A3B1C5 | A3B2C5 | A3B3C5 | A3B4C5 | A3B5C5 |
| Data Source | Degree of Freedom | Adjusted Sum of Squares | Adjusted Mean Squares | T-Value | F-Value | p-Value |
|---|---|---|---|---|---|---|
| A | 2 | 60,784 | 30,391.8 | −178.69 | 37,947.47 | 0.0011 |
| B | 4 | 37,638 | 9409.5 | −139.66 | 11,748.75 | 0.0013 |
| C | 4 | 26,362 | 6590.5 | −110.60 | 8229.01 | 0.0041 |
| A × B | 8 | 18,060 | 2257.5 | 102.17 | 2818.77 | 0.0062 |
| A × C | 8 | 6833 | 854.2 | 61.44 | 1066.52 | 0.0068 |
| B × C | 16 | 2766 | 172.9 | 31.16 | 215.83 | 0.0071 |
| A × B × C | 32 | 3070 | 95.9 | −7.45 | 119.80 | 0.0077 |
| Sample Number | Input Variables | Output Variables | |||||
|---|---|---|---|---|---|---|---|
| cp (%) | cf (%) | cb (%) | Permeability Coefficient (Before Conditioning) (×10−4 m/s) | Resistivity of Sand (Ω·m) | Slump Value (mm) | Permeability Coefficient (After Conditioning) (×10−7 m/s) | |
| 1 | 25 | 5 | 14 | 8.98 | 54.24 | 121 | 4.08 |
| 2 | 50 | 4 | 10 | 8.90 | 54.10 | 143 | 9.88 |
| 3 | 75 | 2 | 14 | 9.12 | 56.44 | 55 | 0.41 |
| 4 | 50 | 4 | 6 | 9.05 | 53.63 | 168 | 21.88 |
| 5 | 75 | 3 | 10 | 9.09 | 54.68 | 51 | 0.21 |
| 6 | 25 | 2 | 10 | 9.25 | 56.67 | 192 | 58.82 |
| 7 | 50 | 3 | 6 | 8.70 | 53.13 | 187 | 45.11 |
| 8 | 75 | 5 | 10 | 8.95 | 55.89 | 57 | 0.49 |
| 9 | 25 | 1 | 8 | 8.89 | 54.94 | 205 | 73.53 |
| 10 | 50 | 3 | 12 | 8.98 | 55.37 | 124 | 4.73 |
| 11 | 75 | 4 | 10 | 9.13 | 51.58 | 50 | 0.14 |
| 12 | 25 | 5 | 6 | 9.11 | 55.23 | 180 | 28.59 |
| 13 | 50 | 3 | 8 | 9.14 | 56.49 | 176 | 26.33 |
| 14 | 25 | 3 | 8 | 8.96 | 51.42 | 186 | 40.85 |
| 15 | 50 | 2 | 10 | 9.24 | 53.44 | 162 | 16.24 |
| 16 | 25 | 1 | 12 | 9.13 | 53.44 | 195 | 62.09 |
| 17 | 50 | 2 | 8 | 8.87 | 56.40 | 181 | 31.76 |
| 18 | 25 | 2 | 14 | 9.27 | 53.18 | 182 | 32.68 |
| 19 | 75 | 3 | 8 | 9.22 | 55.54 | 117 | 3.04 |
| 20 | 25 | 5 | 10 | 8.80 | 55.99 | 148 | 11.29 |
| 21 | 50 | 1 | 8 | 8.59 | 52.25 | 184 | 35.29 |
| 22 | 75 | 2 | 6 | 8.83 | 51.83 | 159 | 14.12 |
| 23 | 50 | 4 | 14 | 8.79 | 53.74 | 113 | 2.82 |
| 24 | 75 | 1 | 12 | 8.94 | 53.50 | 118 | 3.27 |
| 25 | 50 | 5 | 10 | 9.04 | 54.93 | 100 | 1.41 |
| 26 | 75 | 3 | 14 | 9.09 | 54.15 | 33 | 0.02 |
| 27 | 25 | 3 | 14 | 8.73 | 54.54 | 140 | 8.17 |
| 28 | 25 | 2 | 8 | 9.15 | 54.80 | 193 | 61.27 |
| 29 | 50 | 1 | 6 | 9.23 | 55.28 | 196 | 64.94 |
| 30 | 75 | 5 | 14 | 8.62 | 54.98 | 46 | 0.08 |
| 31 | 25 | 3 | 12 | 8.71 | 53.06 | 159 | 14.12 |
| 32 | 75 | 3 | 12 | 8.69 | 55.85 | 41 | 0.07 |
| 33 | 50 | 3 | 14 | 8.95 | 56.57 | 124 | 4.24 |
| 34 | 25 | 4 | 6 | 9.09 | 55.14 | 183 | 33.18 |
| 35 | 50 | 4 | 8 | 8.99 | 56.66 | 160 | 14.26 |
| 36 | 75 | 1 | 8 | 9.13 | 56.15 | 140 | 8.17 |
| 37 | 25 | 5 | 8 | 8.91 | 54.14 | 169 | 22.88 |
| 38 | 75 | 1 | 6 | 8.96 | 52.54 | 161 | 15.53 |
| 39 | 25 | 1 | 10 | 8.62 | 52.35 | 200 | 70.26 |
| 40 | 75 | 1 | 14 | 8.70 | 55.02 | 110 | 2.45 |
| 41 | 75 | 5 | 6 | 8.93 | 55.39 | To be predicted | To be predicted |
| 42 | 25 | 4 | 14 | 9.27 | 55.81 | ||
| 43 | 25 | 5 | 12 | 8.83 | 56.13 | ||
| 44 | 50 | 1 | 10 | 9.18 | 52.78 | ||
| 45 | 25 | 4 | 12 | 8.72 | 54.51 | ||
| 46 | 25 | 3 | 10 | 9.26 | 56.66 | ||
| 47 | 50 | 1 | 12 | 9.23 | 55.51 | ||
| 48 | 25 | 2 | 12 | 8.73 | 51.44 | ||
| 49 | 25 | 1 | 14 | 9.03 | 56.44 | ||
| 50 | 50 | 2 | 6 | 9.17 | 55.12 | ||
| Variables | Minimum | Maximum | Standard Deviation | Dispersion Coefficient | Coefficient of Skewness | Coefficient of Kurtosis | |
|---|---|---|---|---|---|---|---|
| Input layer | cp (%) | 25 | 75 | 20.530 | 0.416 | 0.046 | −1.516 |
| cf (%) | 1 | 5 | 1.382 | 0.481 | 0.111 | −1.164 | |
| cb (%) | 6 | 14 | 2.810 | 0.282 | 0.153 | −1.253 | |
| Permeability coefficient (before conditioning) (m/s) | 8.59 | 9.27 | 0.190 | 0.021 | −0.302 | −0.933 | |
| Resistivity of sand (Ω·m) | 51.42 | 56.67 | 1.479 | 0.027 | −0.327 | −0.833 | |
| Output layer | Slump value (mm) | 33 | 205 | 50.752 | 0.362 | −0.771 | −0.606 |
| Permeability coefficient (after conditioning) (m/s) | 0.02 | 73.53 | 22.260 | 1.049 | 0.996 | −0.233 |
Disclaimer/Publisher’s Note: The statements, opinions and data contained in all publications are solely those of the individual author(s) and contributor(s) and not of MDPI and/or the editor(s). MDPI and/or the editor(s) disclaim responsibility for any injury to people or property resulting from any ideas, methods, instructions or products referred to in the content. |
© 2024 by the authors. Licensee MDPI, Basel, Switzerland. This article is an open access article distributed under the terms and conditions of the Creative Commons Attribution (CC BY) license (https://creativecommons.org/licenses/by/4.0/).
Share and Cite
Nong, X.; Bai, W.; Chen, J.; Zhang, L. Factorial Experiments of Soil Conditioning for Earth Pressure Balance Shield Tunnelling in Water-Rich Gravel Sand and Conditioning Effects’ Prediction Based on Particle Swarm Optimization–Relevance Vector Machine Algorithm. Buildings 2024, 14, 2800. https://doi.org/10.3390/buildings14092800
Nong X, Bai W, Chen J, Zhang L. Factorial Experiments of Soil Conditioning for Earth Pressure Balance Shield Tunnelling in Water-Rich Gravel Sand and Conditioning Effects’ Prediction Based on Particle Swarm Optimization–Relevance Vector Machine Algorithm. Buildings. 2024; 14(9):2800. https://doi.org/10.3390/buildings14092800
Chicago/Turabian StyleNong, Xingzhong, Wenfeng Bai, Jiandang Chen, and Lihui Zhang. 2024. "Factorial Experiments of Soil Conditioning for Earth Pressure Balance Shield Tunnelling in Water-Rich Gravel Sand and Conditioning Effects’ Prediction Based on Particle Swarm Optimization–Relevance Vector Machine Algorithm" Buildings 14, no. 9: 2800. https://doi.org/10.3390/buildings14092800
APA StyleNong, X., Bai, W., Chen, J., & Zhang, L. (2024). Factorial Experiments of Soil Conditioning for Earth Pressure Balance Shield Tunnelling in Water-Rich Gravel Sand and Conditioning Effects’ Prediction Based on Particle Swarm Optimization–Relevance Vector Machine Algorithm. Buildings, 14(9), 2800. https://doi.org/10.3390/buildings14092800