Article

Microscopic Transport and Degradation Behavior of CO2 in C-S-H with Varying Ca/Si Ratios during Carbonation

by
Wangzhe Sun
1,
Chengbo Liu
1,
Fen Hong
1,
Pan Wang
1,
Yue Zhang
1,
Xinpeng Wang
1,
Dongshuai Hou
1,2 and
Muhan Wang
1,2,3,*
1
Department of Civil Engineering, Qingdao University of Technology, Qingdao 266033, China
2
Engineering Research Center of Concrete Technology under Marine Environment, Ministry of Education, Qingdao 266520, China
3
State Key Laboratory of Hydraulic Engineering Simulation and Safety, Tianjin University, Tianjin 300072, China
*
Author to whom correspondence should be addressed.
Buildings 2024, 14(9), 2808; https://doi.org/10.3390/buildings14092808
Submission received: 1 August 2024 / Revised: 29 August 2024 / Accepted: 3 September 2024 / Published: 6 September 2024
(This article belongs to the Special Issue Research on Properties of Cement-Based Materials and Concrete)

Abstract

:
Carbonation is a critical factor contributing to the degradation of reinforced concrete systems. Understanding the micro-mechanism of concrete carbonation is essential for mitigating corrosion losses. This study investigates the transport and reaction processes of water and CO2 in CSH pores with varying calcium–silica ratios using reactive force field molecular dynamics. Simulation results reveal that CO2 and its hydration products occupy adsorption sites on the CSH, hindering solution transport within the pores. As the Ca/Si ratio increases, the adsorption of Ca ions on the CSH matrix weakens, facilitating Ca’s reaction with CO2 and its displacement from the CSH surface. Consequently, a wider distribution of Ca on the surface occurs, and CO2 directly adsorbs onto the CSH matrix, widening the transport space and accelerating transport speed. Furthermore, the impact of bridging silica–oxygen on the CSH surface is analyzed, indicating that the absence of bridging silica–oxygen enhances adsorption sites for Ca ions, thus intensifying their adsorption on CSH.

1. Introduction

Carbonation significantly compromises the performance of concrete structures [1,2,3,4,5]. Primarily, it induces a decrease in the alkalinity of concrete, triggering depassivation of the reinforcement’s protective film and subsequent corrosion [6,7,8]. This corrosion yields products two to six times larger in volume than the original iron, leading to concrete expansion, cracking, and exacerbating structural damage [9,10,11,12]. Additionally, carbonation contributes to matrix deterioration, as CO2 must traverse within the matrix to reach reinforcement surfaces, where it further reacts, thereby diminishing concrete strength [2,3,13]. Given concrete’s status as the most widely utilized engineered material, concerns regarding its durability are paramount. The substantial annual economic losses attributed to carbonation-induced degradation underscore the urgent need for comprehensive studies on carbon dioxide transport within concrete matrices [11,14].
As outlined, this study comprises two distinct facets: CO2 transport and its subsequent reaction with the matrix. Firstly, concrete, being porous, facilitates CO2 intrusion into its internal structure [13,15]. The rate and depth of this transport are influenced by factors such as CO2 concentration, purity, gas pressure, environmental conditions (temperature, humidity), carbonation duration, and concrete composition [16,17,18,19,20]. Secondly, during transmission, CO2 dissolves in the concrete pore solution, yielding CO32− and HCO3, subsequently reacting with Ca(OH)2 to form CaCO3 and free water [1,2]. This carbonation reaction alters the microstructure within voids, reducing total concrete porosity and thereby potentially enhancing concrete strength, but at the expense of increased capillary porosity [21].
Furthermore, it lowers the concrete pH to approximately 9, leading to the dissolution of chemically bound chlorides in Friedel’s salt, consequently releasing chlorides into the aqueous phase [22,23]. This combined effect renders the reinforcement more susceptible to corrosion. If exposed to a carbonated environment over an extended period, carbon dioxide will additionally react with CSH gel, depleting calcium hydroxide and forming amorphous silica gel [24]. This scenario is highly detrimental to reinforced concrete systems, underscoring the critical importance of studying carbonation transport and reaction processes to mitigate concrete carbonation. Mi’s findings indicate that corrosion of reinforcing bars precedes carbonation reaching the reinforced concrete interface [25]. This prompts the hypothesis that trace amounts of CO2 may permeate finer pores, altering the interfacial environment and leading to reinforcement corrosion. While previous studies have assessed carbonation depth or products using phenolphthalein reagent, XRD, infrared spectroscopy, and SEM, the intricate details of CO2 transport and reaction processes remain elusive [17,19,26]. Understanding CO2 transport in concrete pore solution is pivotal in comprehending carbonation. Thus, there is an urgent need for methodologies to visualize CO2 transport within the intricate pores of concrete.
In recent years, the advancement of molecular dynamics (MD) simulation technology has provided effective solutions to the challenges. Hou utilized molecular dynamics to simulate water and ion adsorption and transport within CSH gel pores [15]. Subsequently, the transport processes of water and NaCl within CSH nanocone tubes were investigated [27]. Wang delved into sulfate transport within CSH pore solutions and the detachment of Ca ions at varying temperatures [28]. Tu illustrates the coupling of ions (SO42−, Cl-, NO2) within the concrete, revealing that sulfate ions diminish the rust-prevention effect of nitrite ions [29]. While numerous studies have employed MD methods to simulate ion and water transport in concrete pore solutions, there exists a notable gap in research concerning carbon dioxide—a major contributor to the durability deterioration of reinforced concrete systems. Given that carbon dioxide concurrently transports and reacts within concrete pores, this study employs the reactive force field (ReaxFF) molecular simulation method to explore carbon dioxide and water transport and reaction processes within concrete pores featuring diverse calcium-to-silicon ratios. As a comparative measure, the transport process of pure water within these pores is also scrutinized. The findings indicate that CO2 and its hydration products impede solution transport within the pores. Moreover, an elevated Ca/Si ratio renders the matrix more prone to reacting with CO2 and its hydration products, consequently expediting solution transport within the pores.

2. Modeling and Simulation Details

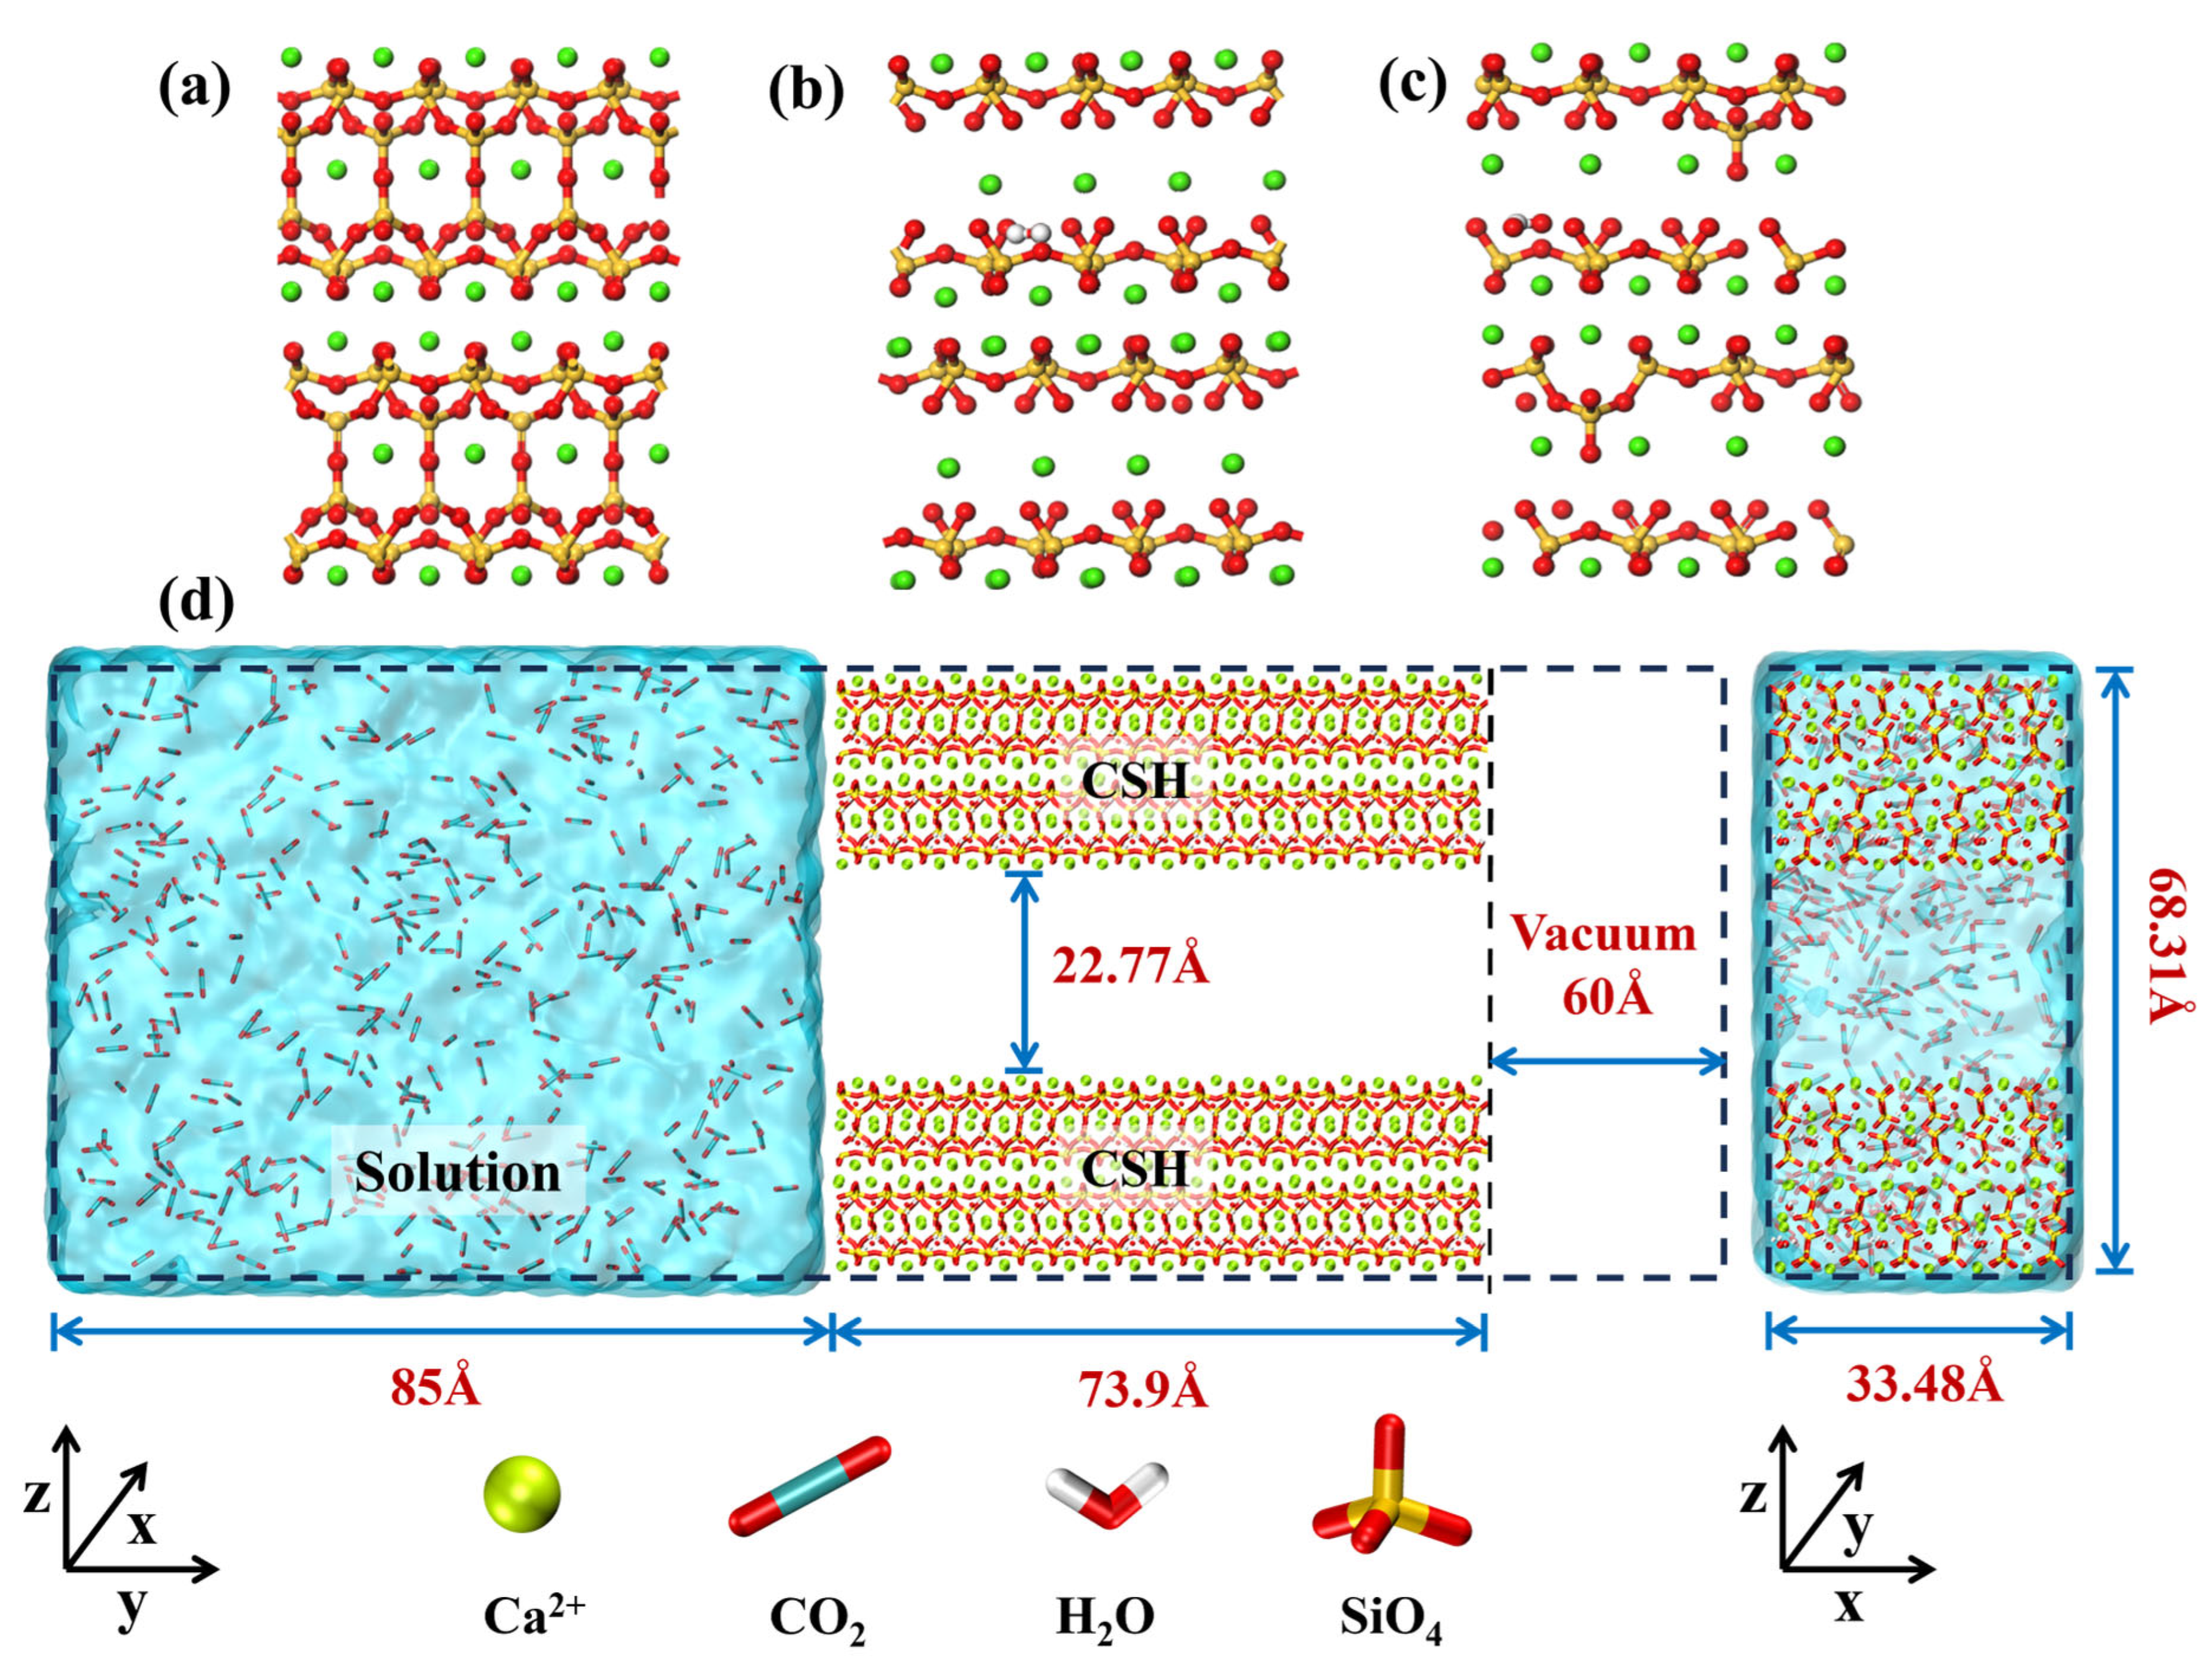
2.1. Model Construction

The models employed in this study were constructed based on the 11 Å tobermorite model and the realistic cement hydration model proposed by Pellenq et al. [30]. Given that carbonation significantly impacts CSH with different Ca/Si ratios—a crucial factor in carbonation studies—three CSH models with distinct Ca/Si ratios were initially constructed to analyze this effect: Ca/Si = 1, Ca/Si = 1.5, and Ca/Si = 1.5 (no bridging silica–oxygen). Among these, the Ca/Si = 1.5 (no bridging silica–oxygen) model, obtained by eliminating all bridging-site silica–oxygen from the 11 Å tobermorite model, was deemed ideal. This choice aimed to investigate whether variations in Ca-Si ratios influenced the extent of surface bridging-site silica–oxygen deletion, thereby affecting the degree of carbonation. Subsequently, the CSH with the three different Ca-Si ratios was scaled up by a factor of two along the z-axis direction of the unit cell. The middle part of the substrate was then removed from the (001) plane, leaving a thickness of 22.77 Å for both upper and lower substrates. The substrates were enlarged by a factor of three along the x-axis and a factor of 10 along the y-axis, resulting in parallel CSH substrates measuring 33.48 Å × 73.9 Å × 22.77 Å. Additionally, a packmol procedure introduced 6000 water molecules and 400 carbon dioxide molecules into a space of approximately 85 Å on the left side of the y-direction substrate [31]. To prevent water and ions from escaping, a vacuum layer of approximately 60 Å was retained on the right side of the y-direction substrate and on the left side of the solution. The finalized model, depicted in Figure 1, featured dimensional parameters of a = 33.48 Å, b = 218.9 Å, c = 68.31 Å, α = 90°, β = 90°, and γ = 90°.

2.2. Force Field and Molecular Dynamics Programs

The reactive force field (ReaxFF) is a sophisticated molecular simulation technique designed to capture a wide range of chemical reactions and interactions at the atomic level. It is particularly well suited for studying systems where bond formation and breaking occur, such as in the reaction of CO2 with the CSH matrix in our study. In this study, we employed the reactive force field (ReaxFF) to capture atom interactions throughout the simulation. ReaxFF uses a bond-order potential function to represent the interaction between atoms. This function adapts dynamically to changes in the bonding environment, allowing for the accurate simulation of bond formation, breaking, and changes in bond order during chemical reactions. The parameters for ReaxFF are derived from empirical data and quantum mechanical calculations. Force field parameters were adopted from the works of Nabankur Dasgupta et al., Fedkin et al. [32], and Subbaraman et al. [33]. These parameters define the interactions between the atoms in the system and are essential for capturing the chemical behavior of the materials under study. The entire molecular dynamics (MD) simulation was conducted using the LAMMPS Stable Release version under the NVT ensemble. Initially, an invisible wall was placed at the entrance of the nanopore channel to prevent water molecules and ions from entering the pore during the simulation’s initial phase. Subsequently, a Nosé–Hoover thermostat was employed to stabilize the system’s temperature at 298 K [34]. The system was then allowed to equilibrate under the NVT ensemble for 0.5 ns. Finally, the wall at the pore entrance was removed to enable the free transport of water and ions into the pore. The simulation spanned 2 ns with a time step of 0.25 fs, and atomic trajectory frames were outputted every 1000 steps to ensure data stability for subsequent analysis. Visualization of simulation results and trajectory sections was conducted using the VMD 1.9.3 software post-simulation [35]. The reactive force field (ReaxFF) is used to model and observe the chemical reactions between CO2 and the CSH matrix, including bond formation, reaction products, and changes in material structure.

3. Results and Discussion

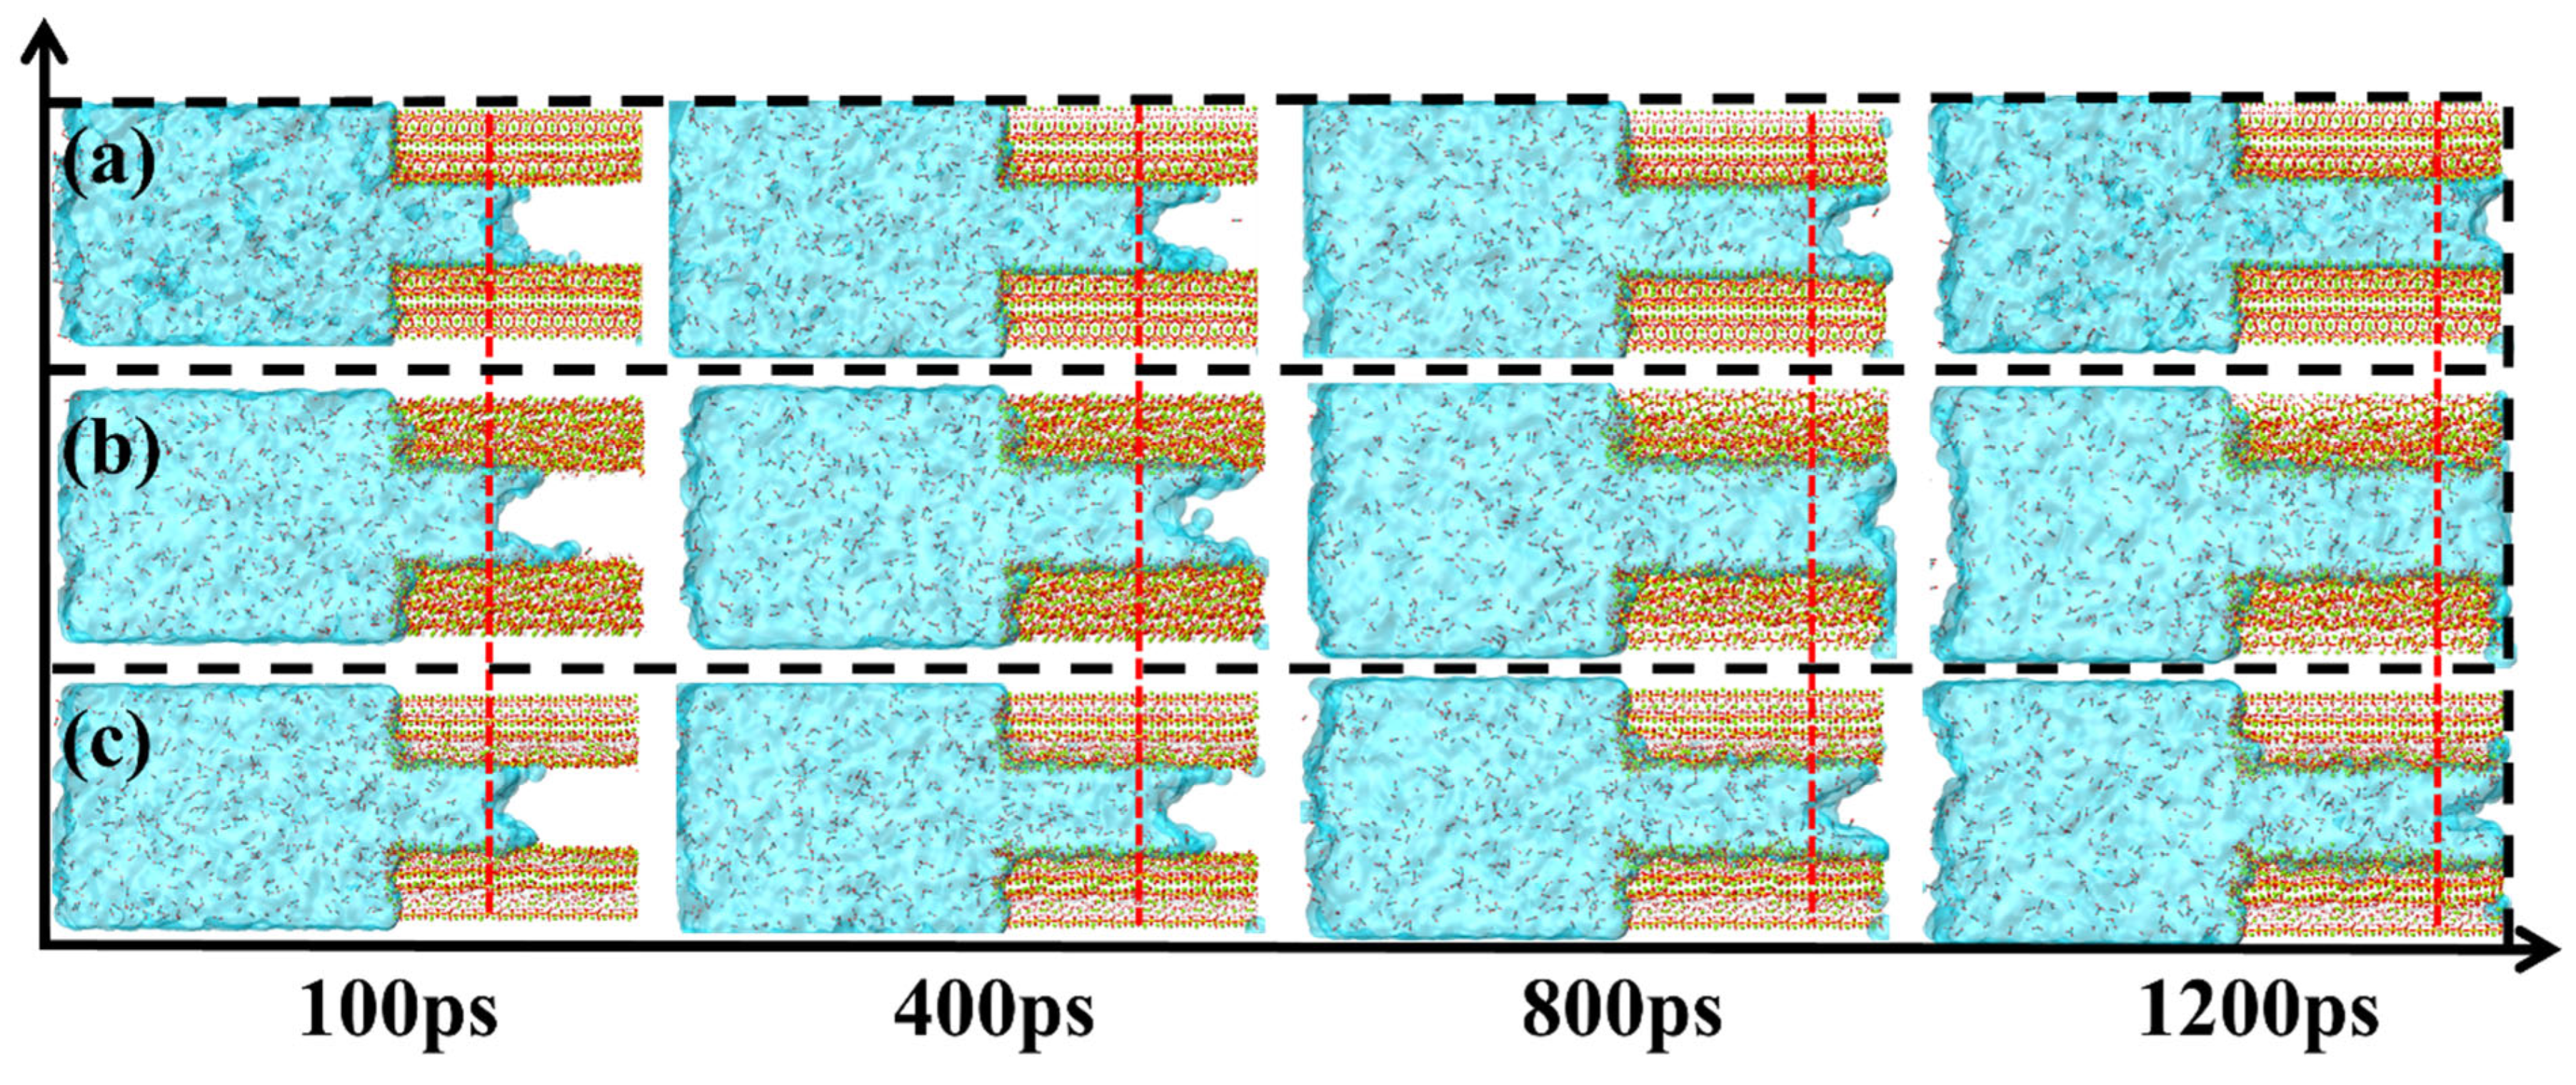
3.1. Solution and Ion Transport Processes

Figure 2 illustrates the migration of an aqueous solution containing CO2 from the solution system into CSH pores with Ca/Si = 1, Ca/Si = 1.5 (no bridging silica–oxygen), and Ca/Si = 1.5 configurations over a duration of 1500 ps. Notably, the leading interface of the solution inside the CSH nanopores adopts a distinct concave shape, and the contact angle of the liquid–solid interface measures less than 90°, indicative of the remarkable hydrophilicity of CSH. Surprisingly, Ca/Si = 1.5 (Figure 2b) exhibits the fastest transport, followed by Ca/Si = 1 (Figure 2a), while Ca/Si = 1.5 (no bridging silica–oxygen) (Figure 2c) displays the slowest transport; moreover, it was noted that at the entrance of the CSH pores, the matrix protrudes slightly, accompanied by the diffusion of silica–oxygen tetrahedra into the channels. This suggests that the transport rate of the solution within CSH pores is not solely influenced by surface structure variations due to differences in the Ca/Si ratio and the absence of bridging silicon–oxygen sites, which contributes to the instability of the CSH matrix.
To quantitatively assess the impact of varying calcium–silica ratios and solutions, we tracked the passage of water and ions through the channels over simulation time and determined the transport depth by measuring the distance of the intermediate level of the solution inside the pore. As depicted in Figure 3, the system with CO2 initially enters the pore channel slightly faster than the pure water solution. However, in the latter half of the transport, the depth of transport is not as fast as that of the pure water system. This discrepancy may stem from CO2 gas presence, which initially accelerates solution diffusion but subsequently leads to CO2, CO32−, or HCO3 occupying adsorption sites or reacting with the substrate, thereby narrowing the pore channel and slowing solution transport [27].
Furthermore, we observed that the transport of CO2, CO32−, and HCO3 is contingent on the aqueous solution, with water serving as their transport medium. Figure 4 presents a comparison of different Ca/Si ratios, revealing that solution transport is fastest in the Ca/Si = 1.5 system (Figure 4b), followed by Ca/Si = 1 (Figure 4a), and Ca/Si = 1.5 (no bridging silica–oxygen) system (Figure 4b) exhibiting the slowest transport. This prompts the following question: what is the underlying mechanism driving this phenomenon? Let us delve into the specific mechanism.
We first analyze the effect of water adsorption. The density distribution of the calculated order parameter (Sm) of water is shown in Figure 5. The order parameter is a relevant metric for assessing molecular arrangement and is calculated as follows [36,37]:
S m = 1 2 ( 3 c o s 2 2 β 1 )
where β represents the angle between the two directions of the water dipole. A Sm value close to 1 indicates high water ordering, while a value close to −0.5 suggests low ordering and a disordered state. As depicted in Figure 5, the system with a Ca/Si ratio of 1 exhibits the highest degree of water ordering, implying greater water involvement in its adsorption, followed by the system with a Ca/Si ratio of 1.5. Conversely, the system with a Ca/Si ratio of 1.5 (no bridging silica–oxygen) displays the lowest degree of ordering. This discrepancy arises from the tendency of water to adsorb onto the oxygen of the silicon chain on the CSH surface, forming stronger hydrogen bonding interactions compared to Ca ions. Furthermore, oxygen at the bridging position is closer to the surface and facilitates water adsorption more readily. Consequently, differences in the bridging position of silicon–oxygen among the three systems result in varying degrees of water ordering.
Additionally, as depicted in Figure 6, the dipole profiles of water molecules in the three systems illustrate the distribution of water in each direction. Remarkably, the addition of CO2 has minimal effect on water distribution. Given the hydrophilicity of CSH, water dipoles are predominantly distributed at angles of 180° and 300° to 360°.

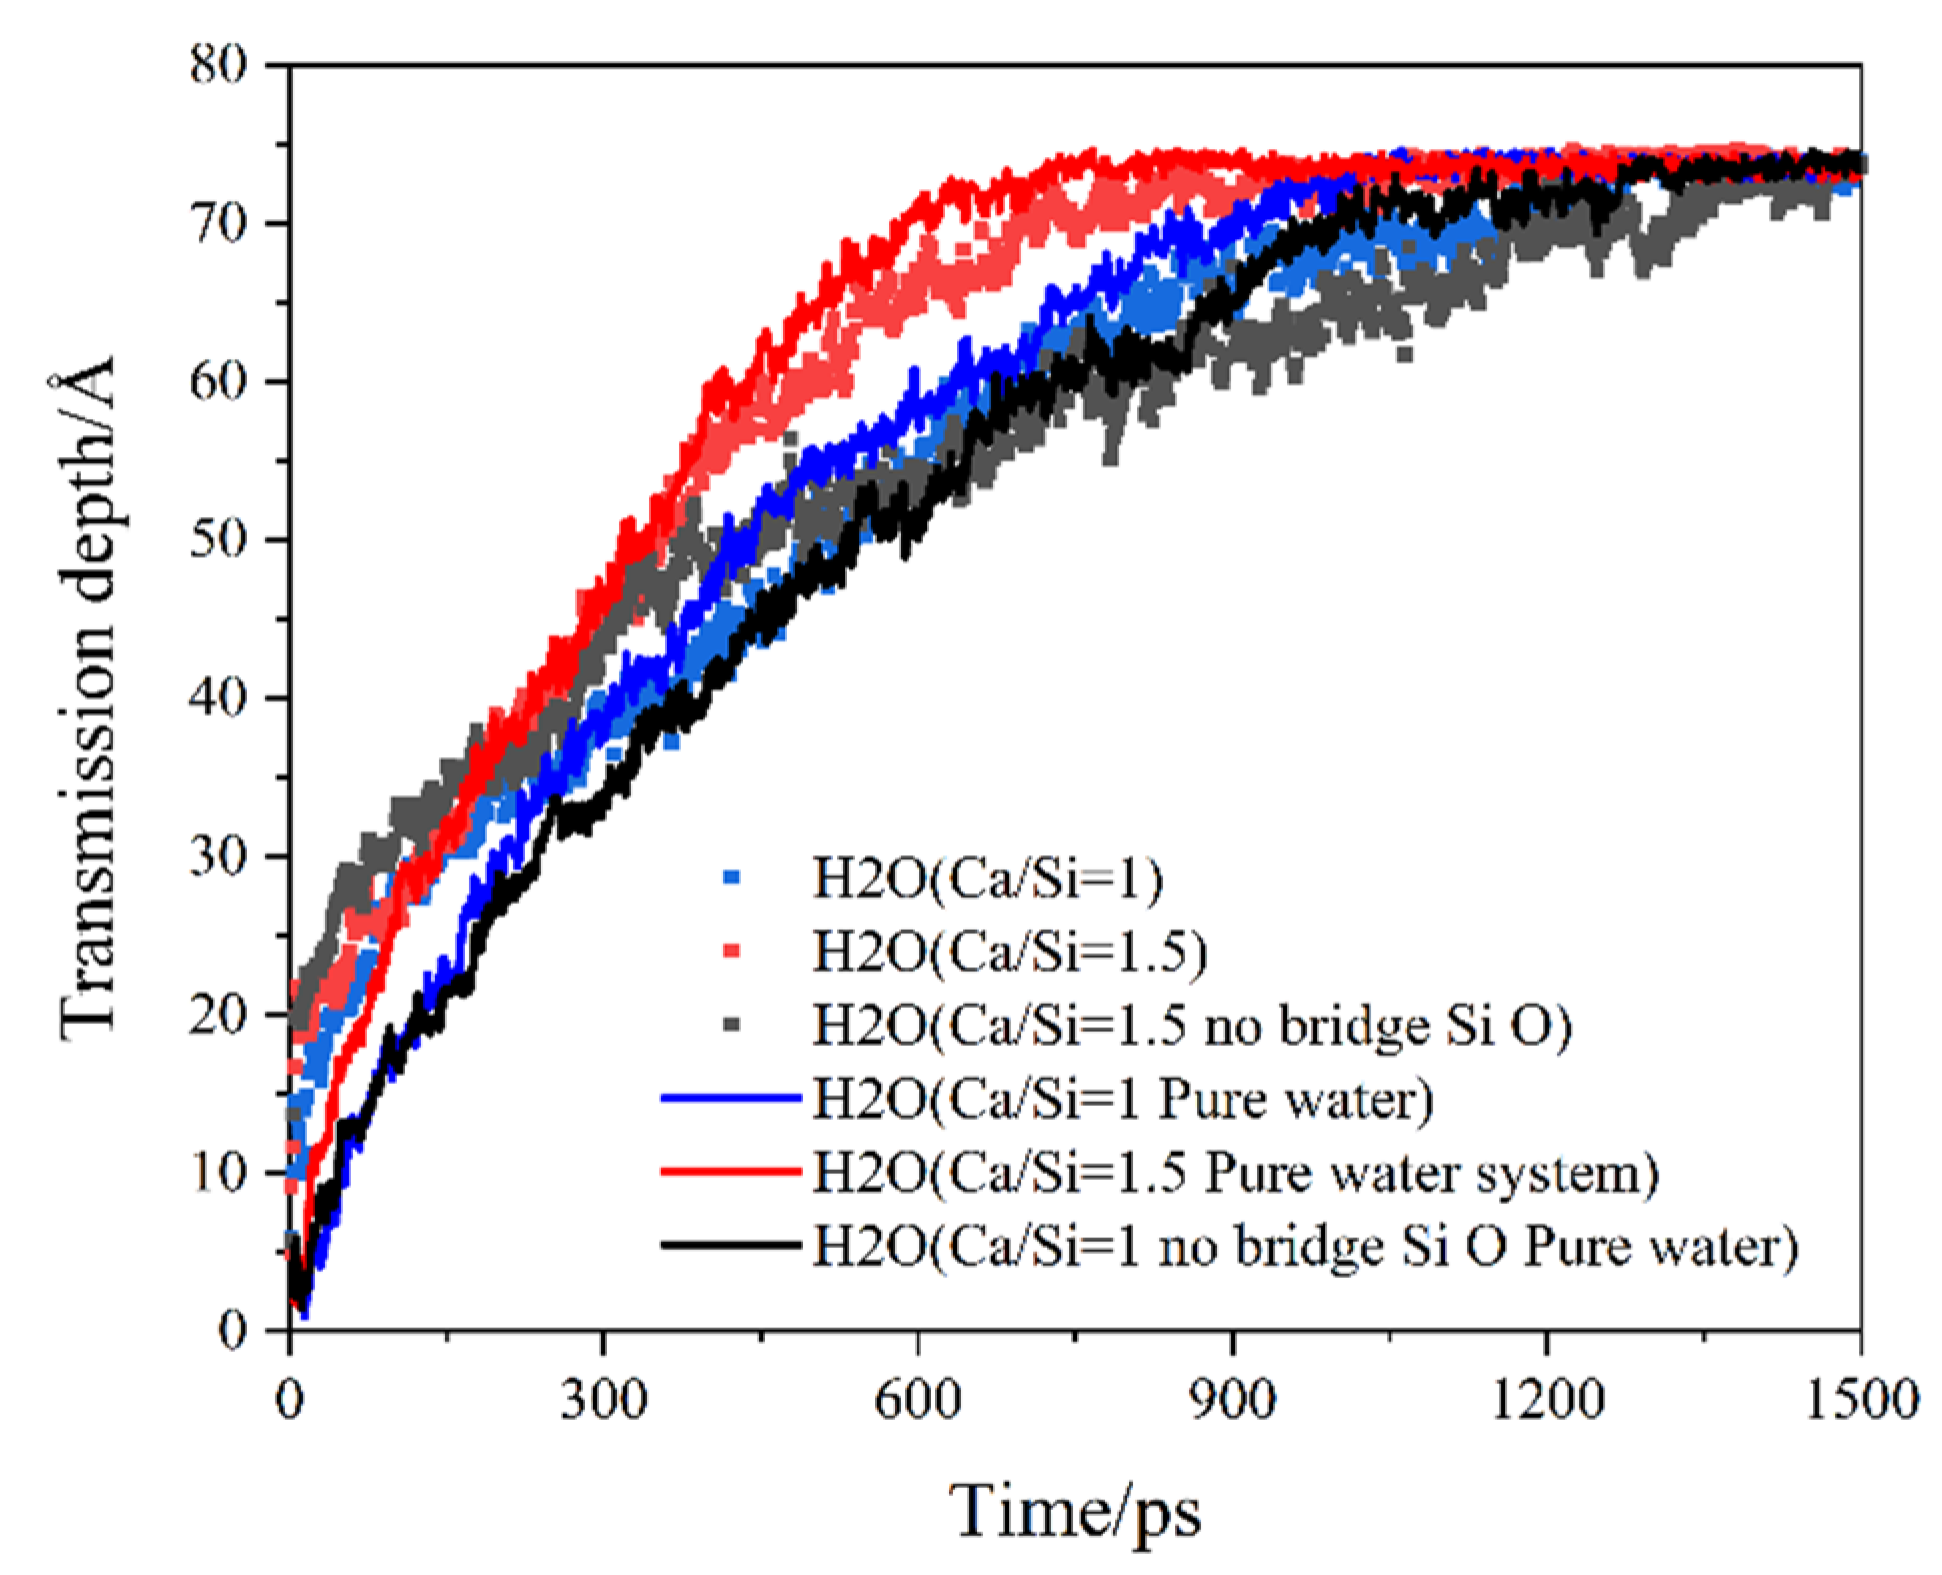
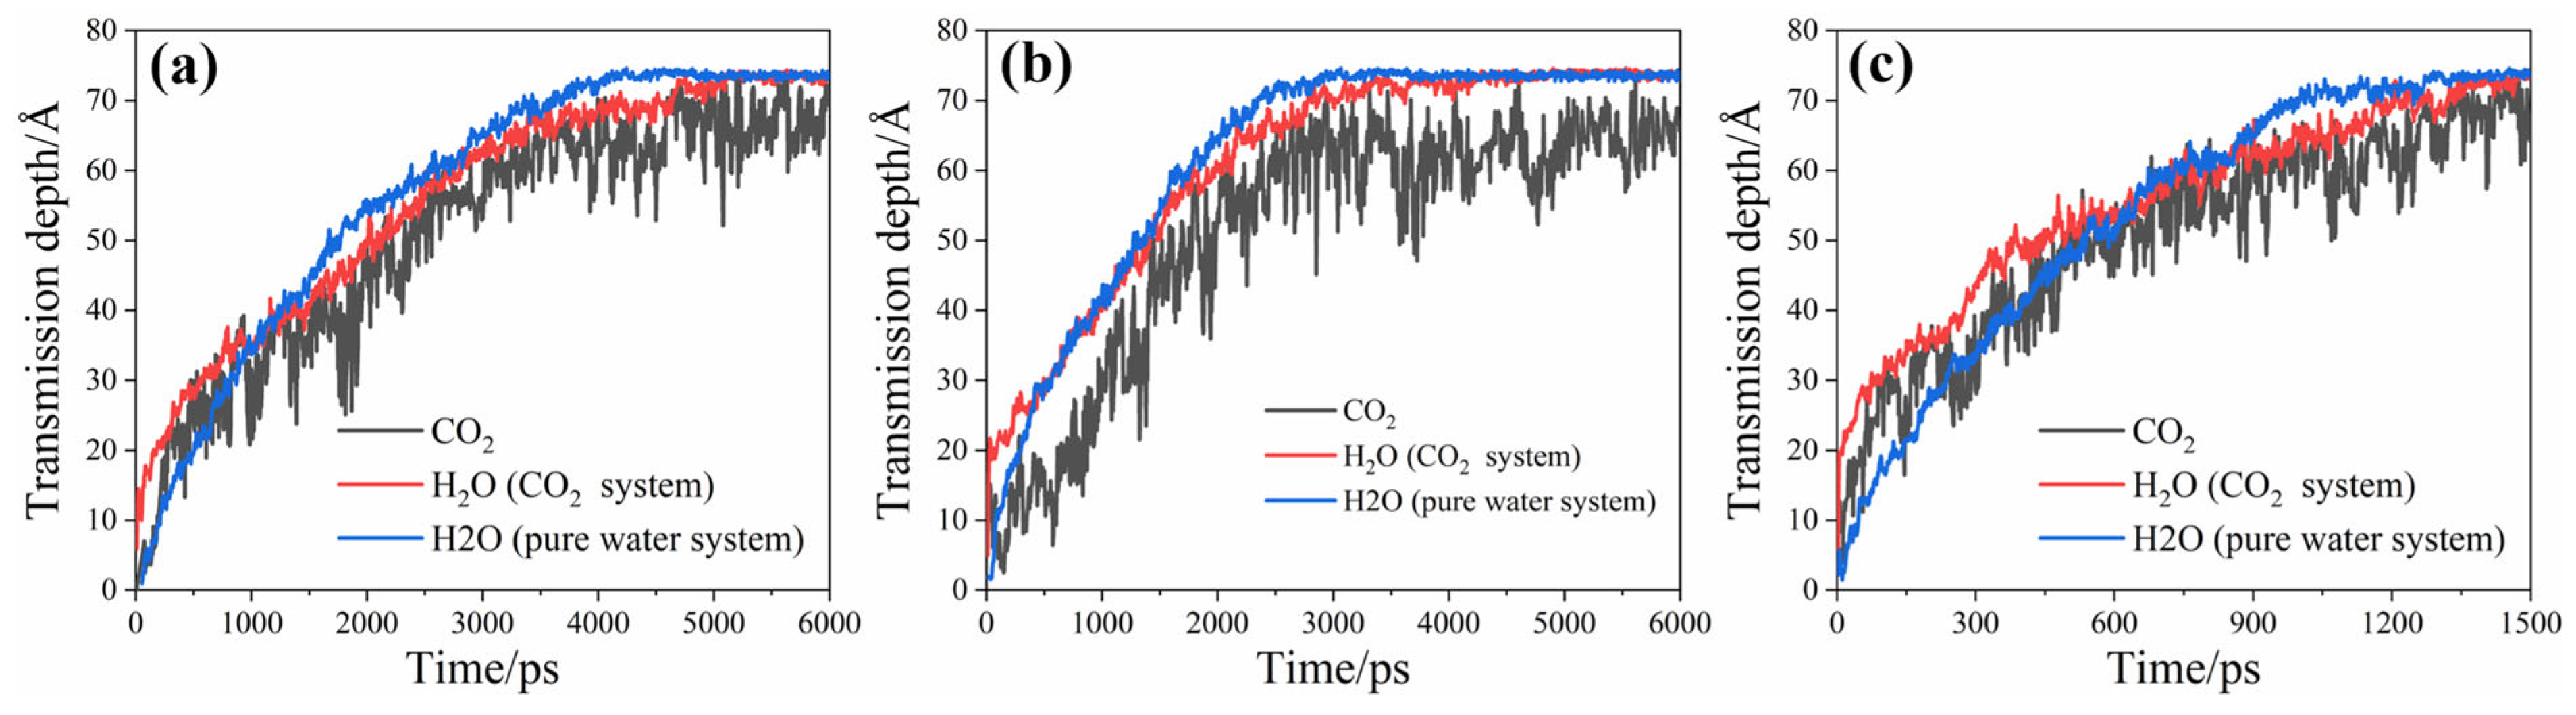
3.2. Distribution and Transmission Rate of H2O and CO2

The transport and adsorption of water and carbon dioxide can be intuitively visualized through their density distributions. Figure 7 presents the one-dimensional density distribution of water and carbon dioxide, along with silicon atoms, while Figure 8 illustrates the two-dimensional density distribution of carbon dioxide and silicon atoms.
In the Ca/Si = 1 system (Figure 7a), two distinct water peaks near the surface of CSH are evident, reaffirming the highly ordered nature of water adsorption. Both Figure 7a and Figure 8a3 indicate a noticeable gap between carbon dioxide and the CSH surface, showcasing the well-ordered distribution of Si atoms.
The distribution of Ca/Si = 1.5 (no bridging silica–oxygen) and carbon dioxide is depicted in Figure 8, illustrating the density distribution of carbon dioxide. In Ca/Si = 1.5 (no bridging silica–oxygen) (Figure 7c and Figure 8c), the absence of bridging SiO2 leads to water adsorption closer to the CSH surface, with slight intrusion into the matrix. Although carbon dioxide adsorption on the CSH surface still exhibits a gap, it displays a stronger peak due to the increased pore structure and adsorption sites provided by CSH without bridging SiO2. Additionally, the matrix is more ordered in Ca/Si = 1.5 (no bridging silica–oxygen).
Contrastingly, in Ca/Si = 1.5 (Figure 7b and Figure 8b), the matrix appears more disordered, with carbon dioxide directly adsorbed onto the CSH matrix rather than the water layer. Both water and carbon dioxide intrude on the matrix surface, resulting in an expanded transport area. This phenomenon may contribute to the faster transport rate of Ca/Si = 1.5. However, the intrusion of water and carbon dioxide inevitably leads to significant matrix damage, the effects of which are analyzed by mean square displacement (MSD).
The effect of the adsorption and stripping phenomena of CSH by fluids and CO2 on kinetic properties can be analyzed through mean square displacement (MSD), as illustrated in Figure 9. Mean square displacement (MSD) represents the average of statistical particle displacements over time and is utilized to assess the kinematic properties of molecules and ions. The MSD is calculated as follows:
M S D t = i = 1 n < | r i t r i ( 0 ) | 2 > n
where ri(t) denotes the position of atom i at moment t, ri(0) denotes the initial position of atom i, and n denotes the n atoms involved in the calculation.
In Figure 9a, the carbon dioxide transmission rates in the three models are depicted. It is notable that CO2 in Ca/Si=1.5 exhibits the fastest transmission rate. Traditionally, in previous pore transmission studies, wider pores correlate with faster transmission rates. Therefore, as observed in Figure 7b and Figure 8b3, CO2 in Ca/Si = 1.5 is directly adsorbed onto the surface of the CSH, enlarging the transmission area of CO2. This phenomenon may explain the rapid transmission rate of CO2 in this model.
Furthermore, Ca/Si = 1.5 (no bridging silica–oxygen) demonstrates a faster transmission rate. The absence of bridging silica–oxygen widens the transmission pore of CO2, consequently accelerating its transmission rate compared to Ca/Si = 1.
In Figure 9b, the transport velocities of water molecules in the six systems are presented. It is observed that there is not a substantial difference among all the systems, possibly due to similar water transport spaces across the three models. Additionally, it is noteworthy that water transport speeds within the same model system containing CO2 are slower than those in pure water, implying that the presence of carbon dioxide inhibits water transport within the pores. To comprehend the cause of these phenomena, further analysis of intermolecular interactions is required.

3.3. Reasons for Transmission Differences

The main interactions between atoms are analyzed through radial distribution functions (RDF) [37,38,39,40], commonly used to represent structural properties and reflect interatomic interactions in molecular dynamics simulations. Subsequently, the stability of bonding between RDF pairs is qualitatively assessed using the time correlation function (TCF) [41,42,43,44], calculated as follows:
C t = < δ b ( t ) δ b ( 0 ) > < δ b ( 0 ) δ b ( 0 ) >
Indeed, δb(t) represents a binary operator. When a non-covalent bond is formed or not formed, δb(t) equals 1 or 0, respectively. As time progresses, the interaction deteriorates, leading to a transition in TCF value from 1 to 0. Consequently, the average lifetime of various bonds can be assessed by calculating the TCF.
Figure 10 and Figure 11 illustrate the radial distribution functions (RDF) and time correlation function (TCF) plots of calcium (Ca) on the CSH matrix with oxygen on the matrix Si (OSi) and oxygen in carbon dioxide (OC), respectively. Table 1 presents their coordination numbers.
In Figure 10a, the RDF peaks of Ca/Si = 1 and Ca/Si = 1.5 (no bridging silica–oxygen) with OSi are nearly identical, with peaks around 2.7 Å. However, the peak of Ca/Si = 1.5 (unbridged silica–oxygen) is slightly higher, and its peak position is farther from the peaks of the other two systems, at approximately 3.7 Å. Additionally, its peak is wider, indicating a higher coordination number. In Figure 10b, the RDFs of Ca and OC for the three systems exhibit peaks at similar positions, with Ca/Si = 1 displaying the highest peak, followed by Ca/Si = 1 and Ca/Si = 1.5 (no bridging silica–oxygen) displaying the smallest peak. Analysis of the RDF and coordination number suggests that in the Ca/Si = 1.5 system, Ca distribution on the surface is wider, and more Ca is adsorbed by CO2. This phenomenon is attributed to the intrusion of water and CO2 on the surface of the Ca/Si = 1.5 system, weakening its Ca adsorption on the surface. Meanwhile, constant adsorption of Ca by CO2, transported along with it, results in loosely distributed Ca on the CSH surface. Conversely, in the system without bridging silica–oxygen, stronger Ca adsorption on the surface occurs due to more available adsorption sites, reducing CO2 competition for Ca.
The TCF plots in Figure 11a indicate that the difference in adsorption stability of the three systems for Ca is not substantial. However, the stability of CO2 adsorption for Ca (Figure 11b) shows significant variation, with Ca/Si = 1.5 exhibiting the worst stability. This instability contributes to the fast transport of CO2 in the Ca/Si = 1.5 system. Further analysis of the remaining two systems will be conducted in conjunction with the BTE.
The time evolution of (non)covalent bonds (BTE) is used to represent the change in bond number with time [37,45,46,47]. As shown in Figure 12a, the Osi-Ca bond number fluctuates greatly with time in all three systems, with a tendency to oscillate periodically.
In Figure 12b, it is evident that the Oc-Ca bond number fluctuates only in the system with Ca/Si = 1.5. This fluctuation is attributed to the constant breaking of the Oc-Ca bond, with the generation of surface Ca and the diffusion of CO2 continuously pulling away from the surface of the CSH. This phenomenon contributes to the observed differences in the position of the RDF peaks in Figure 12a. Additionally, the Ca/Si = 1.5 (no bridging silica–oxygen) bond number shows no fluctuation at all, while Ca/Si = 1 exhibits slight fluctuation. Analysis of Table 2 reveals that the initial number of Oc-Ca bonds in Ca/Si = 1.5 (no bridging silica–oxygen) is only 4, significantly less than the 46 for Ca/Si = 1.5 and 20 for Ca/Si = 1. This finding further confirms that the absence of bridging silica–oxygen increases the adsorption sites of Ca in this system, leading to strong adsorption on the surface of CSH. However, only a small amount of Ca diffuses into the liquid to form strong adsorption with CO2 (Figure 13c). This observation also explains why the Oc-Ca bond is most stable in Figure 12b with Ca/Si = 1.5.
Through RDF analysis, it is evident that while the Ca/Si = 1 system also exhibits a stronger adsorption capacity for Ca, the amount of Ca diffused into the liquid is minimal. This Ca diffused into the solution forms a more stable bond with CO2. Conversely, in both Ca/Si = 1.5 and Ca/Si = 1.5 (no bridging silica–oxygen), CO2 reacts with the silica–oxygen tetrahedra (Figure 13d).

4. Conclusions

This study investigates the interaction of CO2 and its hydration products with the CSH matrix, focusing on their effects on adsorption sites and transport pores. It was found that CO2, along with its hydration products, reacts with the CSH matrix, occupying adsorption sites and narrowing transport pores, which subsequently inhibits solution transport within CSH pores.
As the Ca/Si ratio increases, CO2 directly adsorbs onto the CSH matrix, thereby expanding the transport space and accelerating the transport rate. The adsorption of calcium ions (Ca) on the CSH surface decreases, which facilitates an increased carbonation rate due to the higher reaction of CO2 with Ca. The continuous bonding and breaking interactions between CO2 and its hydration products with surface Ca ions result in a broader distribution of Ca ions on the CSH surface, further enhancing the carbonation rate.
Additionally, the observed phenomena are not solely attributed to the absence of surface-bridging silica–oxygen linked to different Ca/Si ratios. Instead, it is the lack of bridging silica–oxygen that provides more adsorption sites and space for Ca ions, influencing the stability and adsorption strength of Ca. While a higher Ca/Si ratio typically leads to stronger Ca adsorption, the absence of bridging silica–oxygen adversely affects the overall structural stability.

Author Contributions

Conceptualization, P.W., Y.Z., X.W., D.H. and M.W.; methodology, P.W., Y.Z. and X.W.; data curation, W.S., C.L. and F.H.; formal analysis, C.L. and F.H.; writing—original draft preparation, W.S.; writing—review and editing, D.H. and M.W.; supervision, M.W. All authors have read and agreed to the published version of the manuscript.

Funding

M.W. and D.H. received financial support from the National Key Research and Development project 2022YFE0133800, the National Natural Science Foundation of China under grants U2006224, 52308263, 51978352, and 52178221, Shandong Province Natural Science Foundation under grant ZR2022YQ55, 2019KJG010, Shandong Provincial Education Department under grant 2019KJG010, and Qingdao Research Program 16-5-1-96-jch, 111 Project TMduracon20220022.

Data Availability Statement

The data is available by requesting from the corresponding author.

Acknowledgments

All individuals have agreed to the confirmation.

Conflicts of Interest

The authors declare no conflict of interest.

References

  1. Chang, C.-F.; Chen, J.-W. The Experimental Investigation of Concrete Carbonation Depth. Cem. Concr. Res. 2006, 36, 1760–1767. [Google Scholar] [CrossRef]
  2. Tang, B.; Fan, M.; Yang, Z.; Sun, Y.; Yuan, L. A Comparison Study of Aggregate Carbonation and Concrete Carbonation for the Enhancement of Recycled Aggregate Pervious Concrete. Constr. Build. Mater. 2023, 371, 130797. [Google Scholar] [CrossRef]
  3. Qian, R.; Li, Q.; Fu, C.; Zhang, Y.; Wang, Y.; Jin, N.; Jin, X. Investigations on Atmospheric Carbonation Corrosion of Concrete Structure Beam Exposed to Real Marine-Environment for 7 Years. J. Build. Eng. 2023, 71, 106517. [Google Scholar] [CrossRef]
  4. Kahyarian, A.; Brown, B.; Nesic, S. Electrochemistry of CO2 Corrosion of Mild Steel: Effect of CO2 on Iron Dissolution Reaction. Corros. Sci. 2017, 129, 146–151. [Google Scholar] [CrossRef]
  5. Ai, Z.; Jiang, J.; Sun, W.; Jiang, X.; Yu, B.; Wang, K.; Zhang, Z.; Song, D.; Ma, H.; Zhang, J. Enhanced Passivation of Alloy Corrosion-Resistant Steel Cr10Mo1 under Carbonation—Passive Film Formation, the Kinetics and Mechanism Analysis. Cem. Concr. Compos. 2018, 92, 178–187. [Google Scholar] [CrossRef]
  6. Ming, J.; Wu, M.; Shi, J. Passive Film Modification by Concrete Carbonation: Re-Visiting a Corrosion-Resistant Steel with Cr and Mo. Cem. Concr. Compos. 2021, 123, 104178. [Google Scholar] [CrossRef]
  7. Roventi, G.; Bellezze, T.; Giuliani, G.; Conti, C. Corrosion Resistance of Galvanized Steel Reinforcements in Carbonated Concrete: Effect of Wet—Dry Cycles in Tap Water and in Chloride Solution on the Passivating Layer. Cem. Concr. Res. 2014, 65, 76–84. [Google Scholar] [CrossRef]
  8. Shi, J.; Geng, Z.; Zhou, X. Reinforcing Steels in Low-Carbon Mortars Subjected to Chloride Attack and Natural Carbonation: Contradictory Trends in Passivation Ability and Corrosion Resistance. Cem. Concr. Compos. 2024, 152, 105666. [Google Scholar] [CrossRef]
  9. Mei, K.; He, Z.; Yi, B.; Lin, X.; Wang, J.; Wang, H.; Liu, J. Study on Electrochemical Characteristics of Reinforced Concrete Corrosion under the Action of Carbonation and Chloride. Case Stud. Constr. Mater. 2022, 17, e01351. [Google Scholar] [CrossRef]
  10. Al Fuhaid, A.F.; Niaz, A. Carbonation and Corrosion Problems in Reinforced Concrete Structures. Buildings 2022, 12, 586. [Google Scholar] [CrossRef]
  11. Ramirez, D.E.A.; Meira, G.R.; Quattrone, M.; John, V.M. A Review on Reinforcement Corrosion Propagation in Carbonated Concrete—Influence of Material and Environmental Characteristics. Cem. Concr. Compos. 2023, 140, 105085. [Google Scholar] [CrossRef]
  12. Angst, U.; Moro, F.; Geiker, M.; Kessler, S.; Beushausen, H.; Andrade, C.; Lahdensivu, J.; Köliö, A.; Imamoto, K.; von Greve-Dierfeld, S.; et al. Corrosion of Steel in Carbonated Concrete: Mechanisms, Practical Experience, and Research Priorities—A Critical Review by RILEM TC 281-CCC. RILEM Tech. Lett. 2020, 5, 85–100. [Google Scholar] [CrossRef]
  13. Rusheng, Q.; Yunsheng, Z.; Yu, Z.; Chuanqing, F.; Cheng, L.; Lin, Y.; Guojian, L. Various Gas Transport Properties in Concrete Considering Transporting Mechanisms and Testing Methods-A Review. Constr. Build. Mater. 2023, 389, 131636. [Google Scholar] [CrossRef]
  14. Holland, B.; Alapati, P.; Kurtis, K.E.; Kahn, L. Effect of Different Concrete Materials on the Corrosion of the Embedded Reinforcing Steel. In Corrosion of Steel in Concrete Structures; Elsevier: Amsterdam, The Netherlands, 2023; pp. 199–218. [Google Scholar]
  15. Hou, D.; Li, Z. Molecular Dynamics Study of Water and Ions Transport in Nano-Pore of Layered Structure: A Case Study of Tobermorite. Microporous Mesoporous Mater. 2014, 195, 9–20. [Google Scholar] [CrossRef]
  16. Kaddah, F.; Ranaivomanana, H.; Amiri, O.; Rozière, E. Accelerated Carbonation of Recycled Concrete Aggregates: Investigation on the Microstructure and Transport Properties at Cement Paste and Mortar Scales. J. CO2 Util. 2022, 57, 101885. [Google Scholar] [CrossRef]
  17. Auroy, M.; Poyet, S.; Le Bescop, P.; Torrenti, J.-M.; Charpentier, T.; Moskura, M.; Bourbon, X. Impact of Carbonation on Unsaturated Water Transport Properties of Cement-Based Materials. Cem. Concr. Res. 2015, 74, 44–58. [Google Scholar] [CrossRef]
  18. Phung, Q.T.; Maes, N.; Jacques, D.; De Schutter, G.; Ye, G.; Perko, J. Modelling the Carbonation of Cement Pastes under a CO2 Pressure Gradient Considering Both Diffusive and Convective Transport. Constr. Build. Mater. 2016, 114, 333–351. [Google Scholar] [CrossRef]
  19. Kari, O.-P.; Puttonen, J.; Skantz, E. Reactive Transport Modelling of Long-Term Carbonation. Cem. Concr. Compos. 2014, 52, 42–53. [Google Scholar] [CrossRef]
  20. Sharmilan, S.; Stang, H.; Michel, A. A Multi-Species Reactive Transport Model Based on Gas-Ion-Solid Phase Interaction for the Carbonation of Cement-Based Materials. Cem. Concr. Res. 2024, 175, 107349. [Google Scholar] [CrossRef]
  21. Xie, M.; Dangla, P.; Li, K. Reactive Transport Modelling of Concurrent Chloride Ingress and Carbonation in Concrete. Mater. Struct. 2021, 54, 177. [Google Scholar] [CrossRef]
  22. Wang, X.; Kong, L.; Zhao, W.; Liu, Y. Chloride Transport Resistance of Alkali-Activated Concrete Exposed to Combined Chloride, Sulfate and Carbonation Environment. Constr. Build. Mater. 2023, 367, 130353. [Google Scholar] [CrossRef]
  23. Georget, F.; Soja, W.; Scrivener, K.L. Characteristic Lengths of the Carbonation Front in Naturally Carbonated Cement Pastes: Implications for Reactive Transport Models. Cem. Concr. Res. 2020, 134, 106080. [Google Scholar] [CrossRef]
  24. Sevelsted, T.F.; Skibsted, J. Carbonation of C–S–H and C–A–S–H Samples Studied by 13 C, 27 Al and 29 Si MAS NMR Spectroscopy. Cem. Concr. Res. 2015, 71, 56–65. [Google Scholar] [CrossRef]
  25. Mi, T.; Li, Y.; Liu, W.; Dong, Z.; Gong, Q.; Min, C.; Xing, F.; Wang, Y.; Chu, S.H. The Effect of Carbonation on Chloride Redistribution and Corrosion of Steel Reinforcement. Constr. Build. Mater. 2023, 363, 129641. [Google Scholar] [CrossRef]
  26. Bui, H.; Delattre, F.; Levacher, D. Experimental Methods to Evaluate the Carbonation Degree in Concrete—State of the Art Review. Appl. Sci. 2023, 13, 2533. [Google Scholar] [CrossRef]
  27. Hou, D.; Zheng, H.; Wang, P.; Wan, X.; Yin, B.; Wang, M.; Zhang, J. Molecular Dynamics Study on Sodium Chloride Solution Transport through the Calcium-Silicate-Hydrate Nanocone Channel. Constr. Build. Mater. 2022, 342, 128068. [Google Scholar] [CrossRef]
  28. Wang, F.; Zhang, Y.; Jiang, J.; Yin, B.; Li, Z. Effect of Temperature on the Capillary Transport of Sodium Sulfate Solution in Calcium Silicate Hydrate Nanopore: A Molecular Dynamics Study. Constr. Build. Mater. 2020, 231, 117111. [Google Scholar] [CrossRef]
  29. Tu, Y.; Cao, J.; Wen, R.; Shi, P.; Yuan, L.; Ji, Y.; Das, O.; Försth, M.; Sas, G.; Elfgren, L. Molecular Dynamics Simulation Study of the Transport of Pairwise Coupled Ions Confined in C-S-H Gel Nanopores. Constr. Build. Mater. 2022, 318, 126172. [Google Scholar] [CrossRef]
  30. Pellenq, R.J.-M.; Kushima, A.; Shahsavari, R.; Van Vliet, K.J.; Buehler, M.J.; Yip, S.; Ulm, F.-J. A Realistic Molecular Model of Cement Hydrates. Proc. Natl. Acad. Sci. USA 2009, 106, 16102–16107. [Google Scholar] [CrossRef]
  31. Martínez, L.; Andrade, R.; Birgin, E.G.; Martínez, J.M. PACKMOL: A Package for Building Initial Configurations for Molecular Dynamics Simulations. J. Comput. Chem. 2009, 30, 2157–2164. [Google Scholar] [CrossRef]
  32. Fedkin, M.V.; Shin, Y.K.; Dasgupta, N.; Yeon, J.; Zhang, W.; Van Duin, D.; Van Duin, A.C.T.; Mori, K.; Fujiwara, A.; Machida, M.; et al. Development of the ReaxFF Methodology for Electrolyte—Water Systems. J. Phys. Chem. A 2019, 123, 2125–2141. [Google Scholar] [CrossRef]
  33. Subbaraman, R.; Deshmukh, S.A.; Sankaranarayanan, S.K.R.S. Atomistic Insights into Early Stage Oxidation and Nanoscale Oxide Growth on Fe (100), Fe (111) and Fe (110) Surfaces. J. Phys. Chem. C 2013, 117, 5195–5207. [Google Scholar] [CrossRef]
  34. Nosé, S. A Unified Formulation of the Constant Temperature Molecular Dynamics Methods. J. Chem. Phys. 1984, 81, 511–519. [Google Scholar] [CrossRef]
  35. William, H. VMD-Visual Molecular Dynamics. J. Mol. Graph. 1996, 14, 33–38. [Google Scholar]
  36. Hou, D.; Zhang, K.; Hong, F.; Wu, S.; Wang, Z.; Li, M.; Wang, M. The Corrosion Deterioration of Reinforced Passivation Film: The Impact of Defects. Appl. Surf. Sci. 2022, 582, 152408. [Google Scholar] [CrossRef]
  37. Wang, M.; Zhang, K.; Ji, X.; Wang, P.; Ma, H.; Zhang, J.; Hou, D. Molecular Insight into the Fluidity of Cement Pastes: Nano-Boundary Lubrication of Cementitious Materials. Constr. Build. Mater. 2022, 316, 125800. [Google Scholar] [CrossRef]
  38. Kirkwood, J.G.; Boggs, E.M. The Radial Distribution Function in Liquids. J. Chem. Phys. 1942, 10, 394–402. [Google Scholar] [CrossRef]
  39. Zimm, B.H. The Scattering of Light and the Radial Distribution Function of High Polymer Solutions. J. Chem. Phys. 1948, 16, 1093–1099. [Google Scholar] [CrossRef]
  40. Hou, D.; Wang, M.; Sun, H.; Wang, P.; Zhang, J.; Wang, M. Structural Deterioration of Calcium Aluminosilicate Hydrate by Sulfate Attack: Atomic Processes of Al-Si Chain Breaking. Constr. Build. Mater. 2023, 401, 132867. [Google Scholar] [CrossRef]
  41. Hong, F.; Yu, S.; Hou, D.; Li, Z.; Sun, H.; Wang, P.; Wang, M. Study on the Mechanical Properties, Gelling Products and Alkalization Process of Alkali-Activated Metakaolin: From Experiment to Molecular Dynamics Simulation. J. Build. Eng. 2023, 79, 107705. [Google Scholar] [CrossRef]
  42. Hou, D.; Yu, J.; Liu, Q.; Dong, B.; Wang, X.; Wang, P.; Wang, M. Nanoscale Insight on the Epoxy-Cement Interface in Salt Solution: A Molecular Dynamics Study. Appl. Surf. Sci. 2020, 509, 145322. [Google Scholar] [CrossRef]
  43. Wang, M.; Sun, H.; Zhou, X.; Wang, P.; Zhang, Y.; Wang, X.; Zhang, X.; Hou, D.; Wang, M. Atomistic Insights into the Deposition of Corrosion Products on the Surfaces of Steels and Passivation Films. Langmuir 2023, 39, 6812–6822. [Google Scholar] [CrossRef] [PubMed]
  44. Hong, F.; Wang, M.; Dong, B.; Diao, X.; Zhang, X.; Pang, K.; Zhang, Y.; Hou, D. Molecular Insight into the Pozzolanic Reaction of Metakaolin and Calcium Hydroxide. Langmuir 2023, 39, 3601–3609. [Google Scholar] [CrossRef] [PubMed]
  45. Xin, L.; Ji, X.; Yang, X.; Hong, F.; Hou, D.; Wang, M. Nanoscale Insight into Fluidity Improvement of Supplementary Cementitious Materials on Concrete: The Nano-Lubrication Process. J. Build. Eng. 2024, 82, 108193. [Google Scholar] [CrossRef]
  46. Wang, M.; Ji, X.; Manzano, H.; Hou, D.; Li, Z. Unlocking Cementitious Performance: Nano-Lubrication via Polycarboxylate Superplasticizers. J. Am. Ceram. Soc. 2024, 107, 3055–3067. [Google Scholar] [CrossRef]
  47. Wang, M.; Sun, H.; Zhou, X.; Wang, P.; Li, Z.; Hou, D. Surface Engineering of Migratory Corrosion Inhibitors: Controlling the Wettability of Calcium Silicate Hydrate in the Nanoscale. Langmuir 2023, 39, 17110–17121. [Google Scholar] [CrossRef]
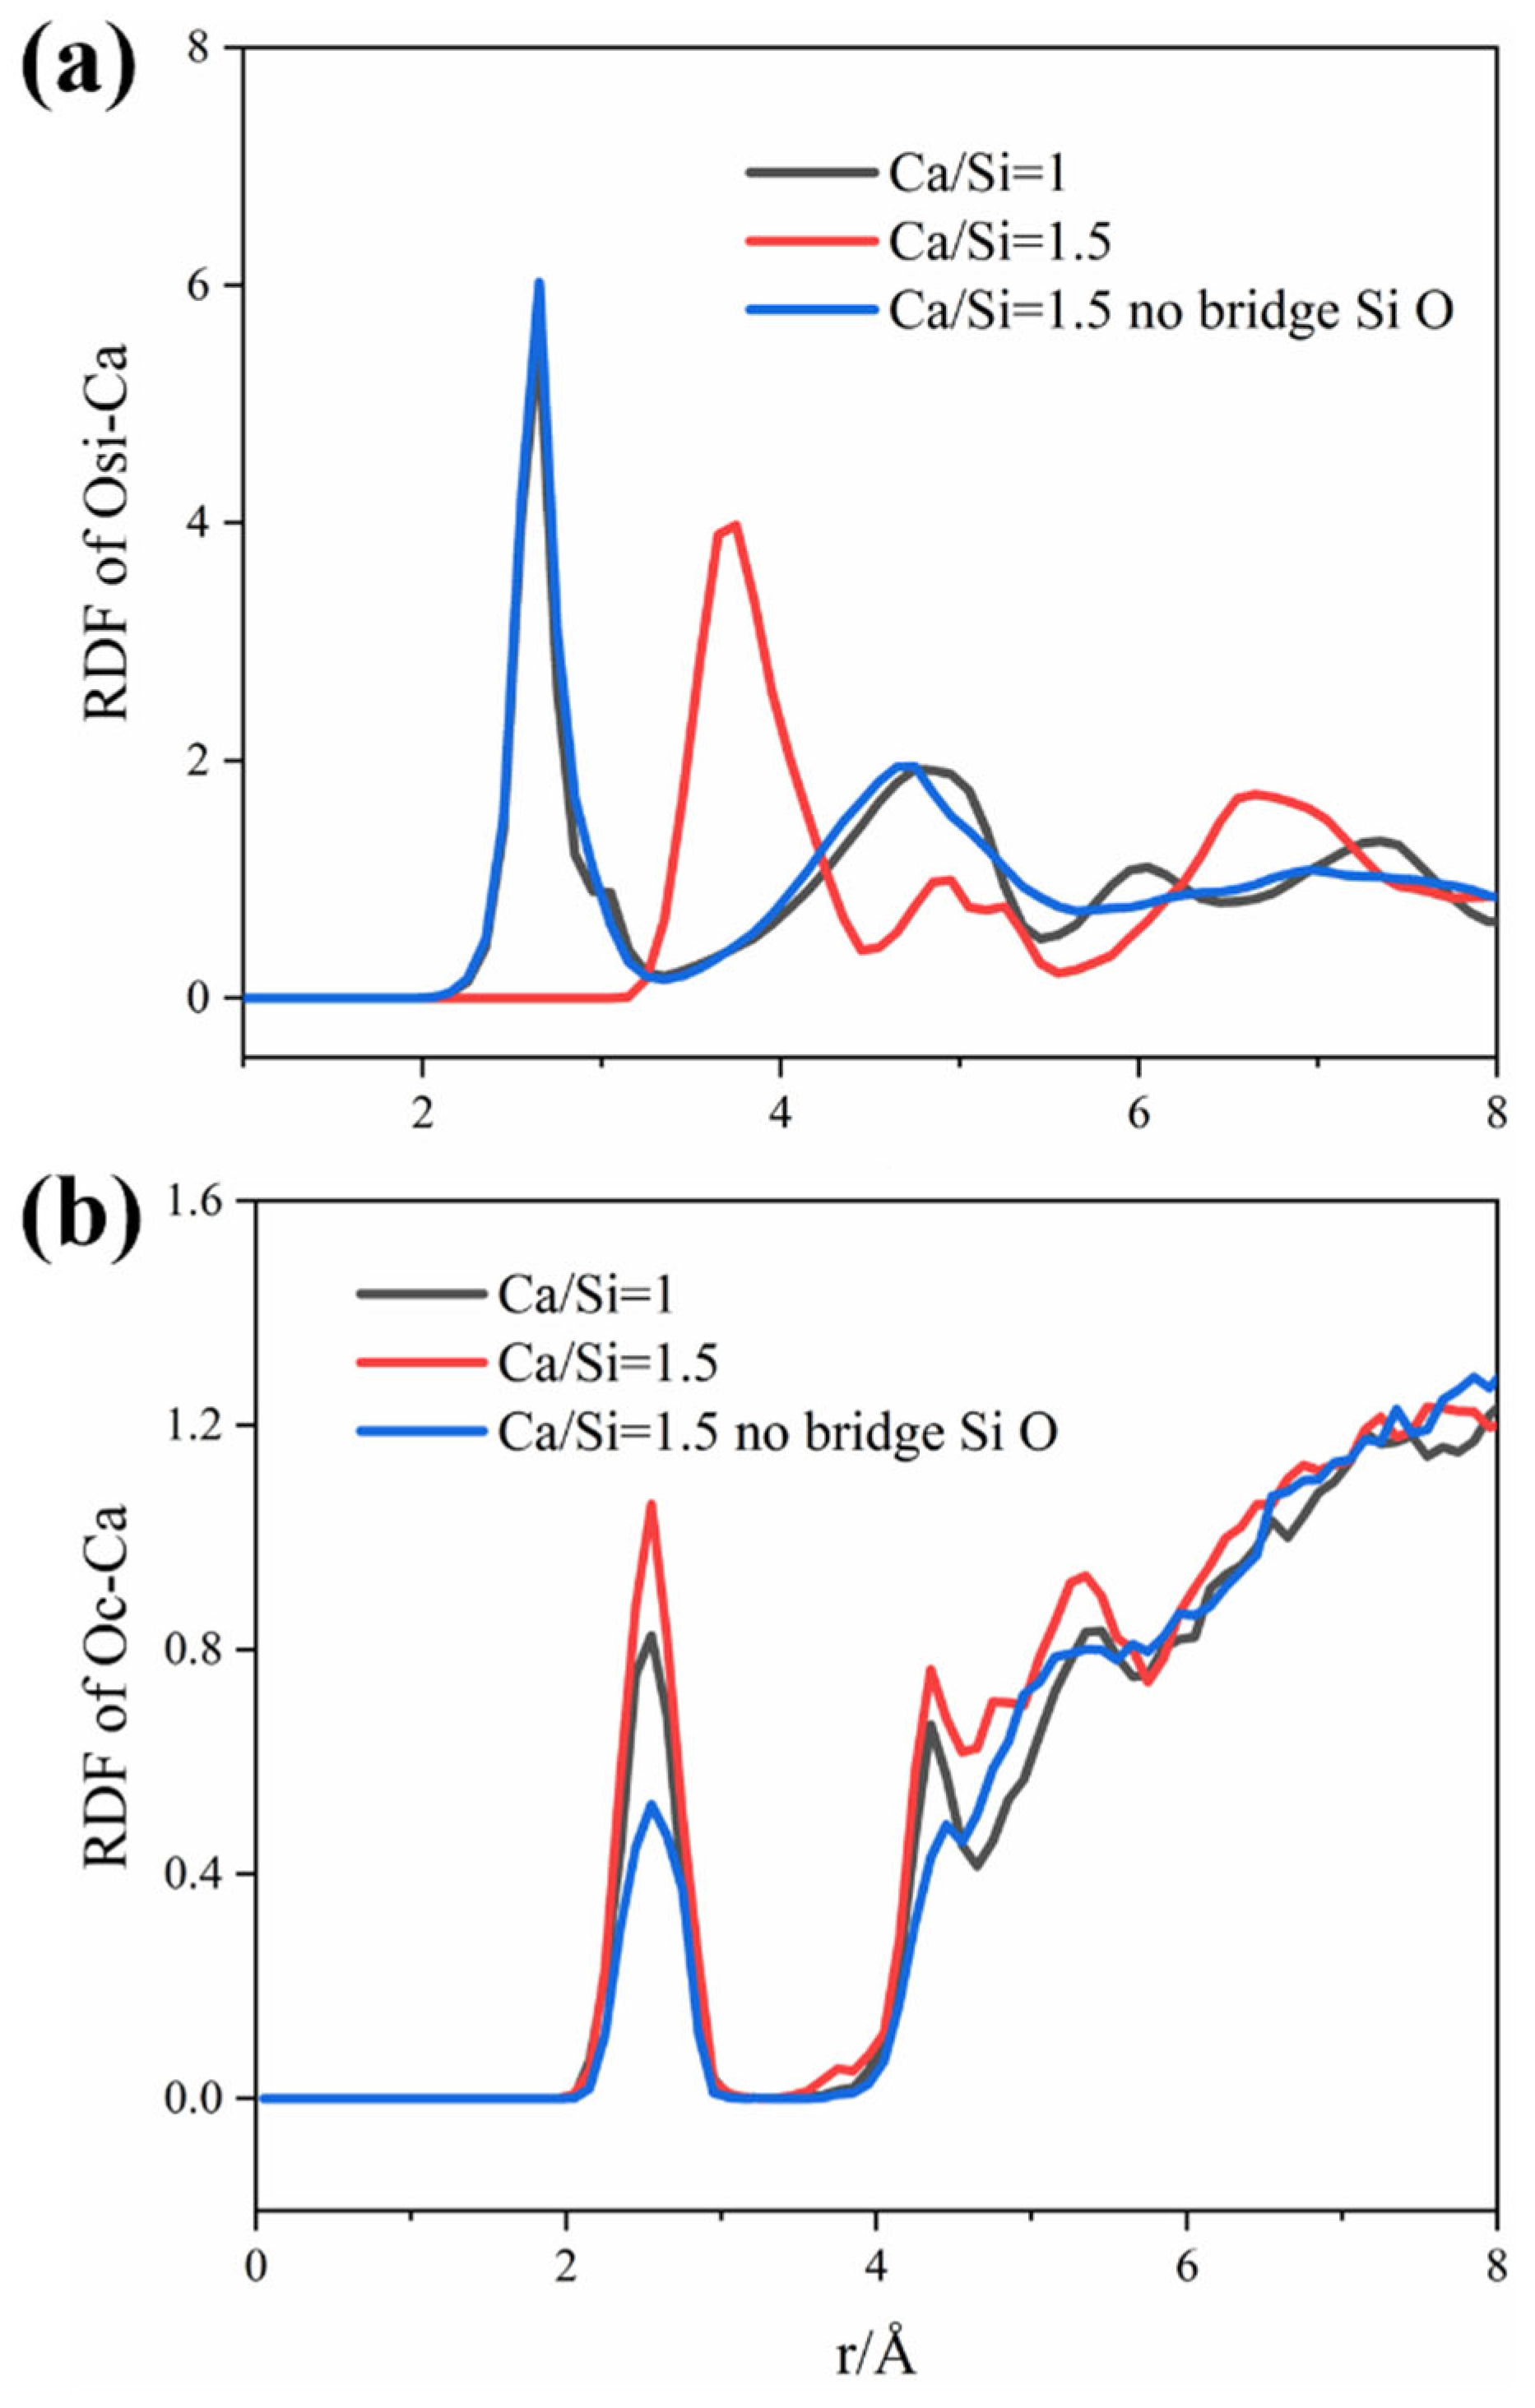
Figure 1. (ac) show the initial unit cells for models with C/S = 1, C/S = 1.5 with non-bridging silicate–oxygen, and C/S = 1.5, respectively. After undergoing Monte Carlo simulations for water absorption to saturation, the cells were expanded, and selected atoms were removed to form pore channels. A water box containing CO2 was then placed on the left side of the pore channel to create the C-S-H pore transport model, illustrated in (d).
Buildings 14 02808 g001
Figure 2. Snapshots of the transport of H2O and CO2 within the capillary channels of CSH gels in Ca/Si = 1 (a), Ca/Si = 1.5 (b), and Ca/Si = 1.5 (no bridging silica–oxygen) (c), the red line represents a vertical extension from the lowest point of the liquid level across the three models, allowing us to observe the differences in transmission depth.
Buildings 14 02808 g002
Figure 3. The depth of transport for H2O and CO2 within CSH nanopores under three Ca-Si ratios, with the presence of a CO2 system.
Buildings 14 02808 g003
Figure 4. Depth of transport within the CSH gel pores for H2O and CO2 in the CO2 system and H2O in the pure water system, under different Ca/Si ratios: (a) Ca/Si = 1, (b) Ca/Si = 1.5, and (c) Ca/Si = 1.5 (no bridging silica–oxygen).
Buildings 14 02808 g004
Figure 5. Order parameter of water molecules for three calcium–silica ratios (with CO2 system).
Buildings 14 02808 g005
Figure 6. Dipole moment profiles of water molecules for three different systems: (a) Ca/Si = 1, (b) Ca/Si = 1.5, and (c) Ca/Si = 1.5 with non-bridging silica–oxygen, both in the presence of CO2 and with pure water. These profiles illustrate the orientation and behavior of water molecules within the CSH matrix under varying Ca/Si ratios, highlighting the effect of CO2 on the water dipole moments and structural changes in the C-S-H phases.
Buildings 14 02808 g006
Figure 7. One-dimensional density distributions of Si atoms, H2O, and CO2 in the CO2 system for different Ca/Si ratios are presented as follows: (a) Ca/Si = 1, (b) Ca/Si = 1.5, and (c) Ca/Si = 2.0 (excluding bridging silica–oxygen). The density distributions were extracted from the final 500 frames of the simulation, corresponding to the time range from 1.5 ns to 2.0 ns. In these distributions, the x-axis represents the z-coordinate direction, and the y-axis shows the density within the model.
Buildings 14 02808 g007
Figure 8. Two-dimensional density distributions of Si atoms and CO2 in the CO2 system for different Ca/Si ratios are shown in the following figures: (a) Ca/Si = 1, (b) Ca/Si = 1.5, and (c) Ca/Si = 2.0 (excluding bridging silica–oxygen). The density distributions were extracted from the final 500 frames of the simulation, spanning the time range from 1.5 ns to 2.0 ns. In these distributions, the x-axis represents the z-coordinate direction, and the y-axis indicates the density within the model, the red box highlights the comparison of CO2 adsorption in CSH.
Buildings 14 02808 g008
Figure 9. Mean square displacement (MSD) curves of (a) CO2 and (b) H2O for three different calcium-to-silicon ratios: Ca/Si = 1, Ca/Si = 1.5, and Ca/Si = 1.5 with non-bridging silica–oxygen. These curves demonstrate the mobility of CO2 and H2O molecules within the C-S-H pore structures, showing how varying Ca/Si ratios influence the diffusion behavior of these molecules in the CO2 system.
Buildings 14 02808 g009
Figure 10. Radial distribution functions (RDF) of oxygen (O) and surface calcium ions (Ca) in (a) silica–oxygen tetrahedra and (b) in CO2 and its hydration products for three calcium–silica ratios in CO2-containing systems.
Buildings 14 02808 g010
Figure 11. Time correlation function (TCF) of oxygen (O) and surface calcium ions (Ca) in (a) silica–oxygen tetrahedra and (b) CO2 and its hydration products for systems with three different calcium-to-silica ratios: Ca/Si = 1, Ca/Si = 1.5, and Ca/Si = 1.5 with non-bridging silica–oxygen. These plots illustrate the interaction dynamics and stability of surface calcium ions with oxygen in the C-S-H matrix under CO2 exposure.
Buildings 14 02808 g011
Figure 12. Binding energy (BTE) profiles of oxygen (O) and surface calcium ions (Ca) in (a) silica–oxygen tetrahedra and (b) CO2 and its hydration products for systems with three different calcium-to-silica ratios: Ca/Si = 1, Ca/Si = 1.5, and Ca/Si = 1.5 with non-bridging silica–oxygen. These figures demonstrate the binding interactions and stability of surface calcium ions with oxygen in the C-S-H matrix when exposed to CO2.
Buildings 14 02808 g012
Figure 13. Reaction of bicarbonate ions (HCO3) (a), carbonic acid (H2CO3) (b), calcium carbonate (CaCO3) (c), and carbonic acid with CSH substrate (d) in three calcium-to-silica ratios within the CO2 system, as well as Ca/Si = 1.5 and Ca/Si = 1.5 (no bridging silica–oxygen).
Buildings 14 02808 g013
Table 1. Coordination number of oxygen (O) and surface calcium ions (Ca) in (a) silica–oxygen tetrahedra and (b) in CO2 and its hydration products for three calcium–silica ratios in CO2-containing systems.
Coordination NumberOsi-CaOC-Ca
Ca/Si = 10.1100.019
Ca/Si = 1.50.3030.024
Ca/Si = 1.5 (no bridging)0.1180.013
Table 2. Number of bonds of oxygen (O) and surface calcium ions (Ca) in (a) silica–oxygen tetrahedra and (b) in CO2 and its hydration products for three calcium–silica ratios in CO2-containing systems.
Number of BondsOsi-CaOC-Ca
Ca/Si = 1109546
Ca/Si = 1.598029
Ca/Si = 1.5 (no bridging)5865
Disclaimer/Publisher’s Note: The statements, opinions and data contained in all publications are solely those of the individual author(s) and contributor(s) and not of MDPI and/or the editor(s). MDPI and/or the editor(s) disclaim responsibility for any injury to people or property resulting from any ideas, methods, instructions or products referred to in the content.

