Article

Flexural Behavior of Precast Rectangular Reinforced Concrete Beams with Intermediate Connection Filled with High-Performance Concrete

1
Civil Engineering Department, Faculty of Engineering, Kafrelsheikh University, Kafrelsheikh 6860404, Egypt
2
Structural Engineering Department, Faculty of Engineering, Zagazig University, Zagazig 44519, Egypt
3
Centre for Infrastructure Monitoring and Protection, School of Civil and Mechanical Engineering, Curtin University, Kent Street, Bentley, WA 6102, Australia
4
Department of Civil Engineering, College of Engineering, King Saud University, Riyadh 11421, Saudi Arabia
5
School of Computing, Engineering and Mathematical Sciences, La Trobe University, Bendigo, VIC 3552, Australia
*
Author to whom correspondence should be addressed.
Buildings 2024, 14(9), 2823; https://doi.org/10.3390/buildings14092823 (registering DOI)
Submission received: 1 August 2024 / Revised: 2 September 2024 / Accepted: 5 September 2024 / Published: 7 September 2024
(This article belongs to the Special Issue Sustainable Development of Concrete and Composite Structures)

Abstract

:
Precast rectangular reinforced concrete (PRRC) beams are joined on construction sites using concrete in situ to achieve the desired length. Limited research exists on the effect of intermediate connection shapes and the types of infilled concrete on the flexural performance of PRRC beams. This paper presents a comprehensive experimental and numerical investigation into the performance of PRRC beams with various intermediate connection geometries and infilled materials under flexural loading. The study examines rectangular, triangular, and semi-circular intermediate connections, along with the performance of beams infilled with normal concrete (NC), engineered cementitious composites (ECC), ultra-high-performance ECC (UHPECC), and rubberized ECC (RECC). The experimental results indicate that the rectangular intermediate connection exhibits superior performance in terms of strength and energy absorption compared to the triangular and semi-circular shapes. Beams incorporating UHPECC demonstrated the most significant improvements in strength and energy absorption, outperforming those with ECC and RECC for any shape of intermediate connection. Moreover, beams with rectangular connections and UHPECC infill exhibited the most significant increase in energy absorption and ultimate load compared to the beams with ECC and RECC. The ultimate load of the beams with UHPECC and tensile reinforcement bar diameters of 10 mm and 12 mm increased by 13% and 29%, respectively, compared to the control beam. The energy absorption of the beams with tensile reinforcement bar diameters of 10 and 12 mm was found to be 75% and 184% higher, respectively, than the control beam. In addition, an increase in tensile bar diameter was found to enhance both the energy absorption and the ultimate load capacity of the beams, regardless of the type of infill concrete. Beams incorporating UHPECC demonstrated the most significant improvements in strength and energy absorption, outperforming those with ECC and RECC. In particular, beams with rectangular connections and UHPECC infill exhibited an increase in energy absorption and ultimate load of up to 184% and 29%, respectively. UHPC was calculated to be as high as 184%, and 29%, respectively, compared to the control beams. In addition, an increase in tensile bar diameter was found to enhance both energy absorption and ultimate load capacity. Finite element modeling (FEM) was developed and validated against the experimental results to ensure accuracy. A parametric study was conducted to study the effects of various concrete types in triangular and semi-circular connections, as well as the influence of intermediate connection length on semi-circular connections under flexural loads. The findings reveal that increasing the length of intermediate connections increases the ultimate load of the beams.

1. Introduction

Precast concrete (PC) members are increasingly used in the construction industry to reduce the construction costs associated with formwork and labor, while also accelerating construction timelines [1,2,3,4]. Casting these members in a controlled environment further guarantees their performance quality [5]. On construction sites, multiple precast members can be connected to achieve the desired structural length. While mechanical connections are an option to avoid concrete casting in situ, connections utilizing in situ concrete generally exhibit superior strength and stiffness compared to their mechanical counterparts [6]. The intermediate connection plays a critical role in the overall performance of the joined members. As highlighted by Ravasini et al. [7], effective stress transfer within the intermediate connection is vital, as this zone can become the weakest link under load if not properly designed. To enhance the stress transfer mechanism within intermediate connections, the use of infill materials with high tensile strength is recommended.
Engineered cementitious composites (ECC) represent a high-performance concrete (HPC) that is composed of cement, mineral admixtures, quartz sand, and fibers, offering superior ductility and durability compared to normal concrete (NC) [8,9]. ECC features the characteristics of pseudo-strain-hardening and multiple cracking in tension [10,11] and is also known for its ultra-high toughness and fracture energy [10,12]. Owing to its excellent deformation capacity, ECC is used in large-deformation structures and impact-resistant structures, as well as for strengthening existing structures [13,14,15,16,17]. The application of ECC has been shown to enhance the capacity and ductility of reinforced concrete (RC) members, improving both flexural and shear strength [18,19,20]. However, ECC exhibits a lower elastic modulus compared to NC, which results in reduced member stiffness, potentially leading to greater deformation under load [21]. Recently, ultra-high-performance ECC (UHPECC) has been developed, offering significantly higher compressive and tensile strengths than conventional ECC. UHPECC exhibits tensile strengths exceeding 10 MPa, whereas ECC strength typically ranges from 3 to 6 MPa [21]. Similarly, the compressive strength of UHPECC surpasses 100 MPa, compared to around 60 MPa for ECC. A notable drawback of ECC is its explosive spalling behavior under high temperatures. To mitigate this issue, rubberized ECC (RECC) was developed, incorporating crumb rubber that melts at high temperatures, thereby filling pores and creating pathways for vapor to escape [22]. However, the addition of crumb rubber reduces the compressive strength of ECC. The smaller crack width and tighter crack spacing achieved with ECC, UHPECC, and RECC enhance stress distribution in the reinforcement bar and concrete matrix regions. Consequently, these types of HPC have proven to be effective in strengthening RC members [23,24,25,26].
Hamoda et al. [25] investigated the application of ECC for shear strengthening in RC beams with shear deficits. Their study examined the effect of ECC thickness on the shear performance of these beams. The results indicated that ECC application in shear-deficient regions significantly enhanced the structural performance of RC beams, altering the failure mode from brittle to ductile. The ultimate strength of the RC beams increased by 74%, 55%, and 36% for ECC ratios of 60%, 40%, and 20%, respectively. Similarly, AbdelAleem and Hassan [27] utilized RECC for the flexural strengthening of RC beams, studying the effects of crumb rubber size and repair location (compression or tension zone). They reported that beams fully cast with RECC exhibited higher deformability compared to normal beams. In addition, RECC enhanced the ductility and energy absorption capacity of the beams relative to the control specimens. However, they also noted that the bond between RECC and NC surfaces required improvement, especially in the tension regions, due to unexpected debonding failures. Zhu et al. [28] proposed the use of UHPECC reinforced with fiber-reinforced polymer (FRP) bars or grids for concrete panels that have been designed for marine structures. Their study explored the effects of reinforcement types and water types (fresh or sea) on the flexural performance of the panels. The findings showed that FRP-reinforced UHPECC exhibited superior strength, stiffness, and deformation capacity. More recently, Hamoda et al. [29] examined the use of HPC as infill material for intermediate connections in precast circular slender columns, reporting that ECC infill increased the energy absorption capacity of the slender columns by 107% compared to the control columns.
Despite these advancements, no research has been conducted on the flexural behavior of precast rectangular reinforced concrete (PRRC) beams with intermediate connections filled with HPC. There is a lack of understanding of the effects of various intermediate connection geometries and infilled materials on the performance of PRRC beams subjected to flexural loading. Such knowledge is crucial for understanding their failure patterns, ultimate load, load-displacement behavior, and elastic and energy absorption capacities for better and more economical design purposes. This study addresses this gap through experimental and numerical investigations of PRRC beams under flexural loading. The test results provide detailed information on crack formation, ultimate load, load-displacement behavior, and the elastic and energy absorption capacities of the beams. In addition, a finite element model (FEM) is developed to simulate the performance of the tested beams and is then validated against the experimental results.

2. Experimental Program

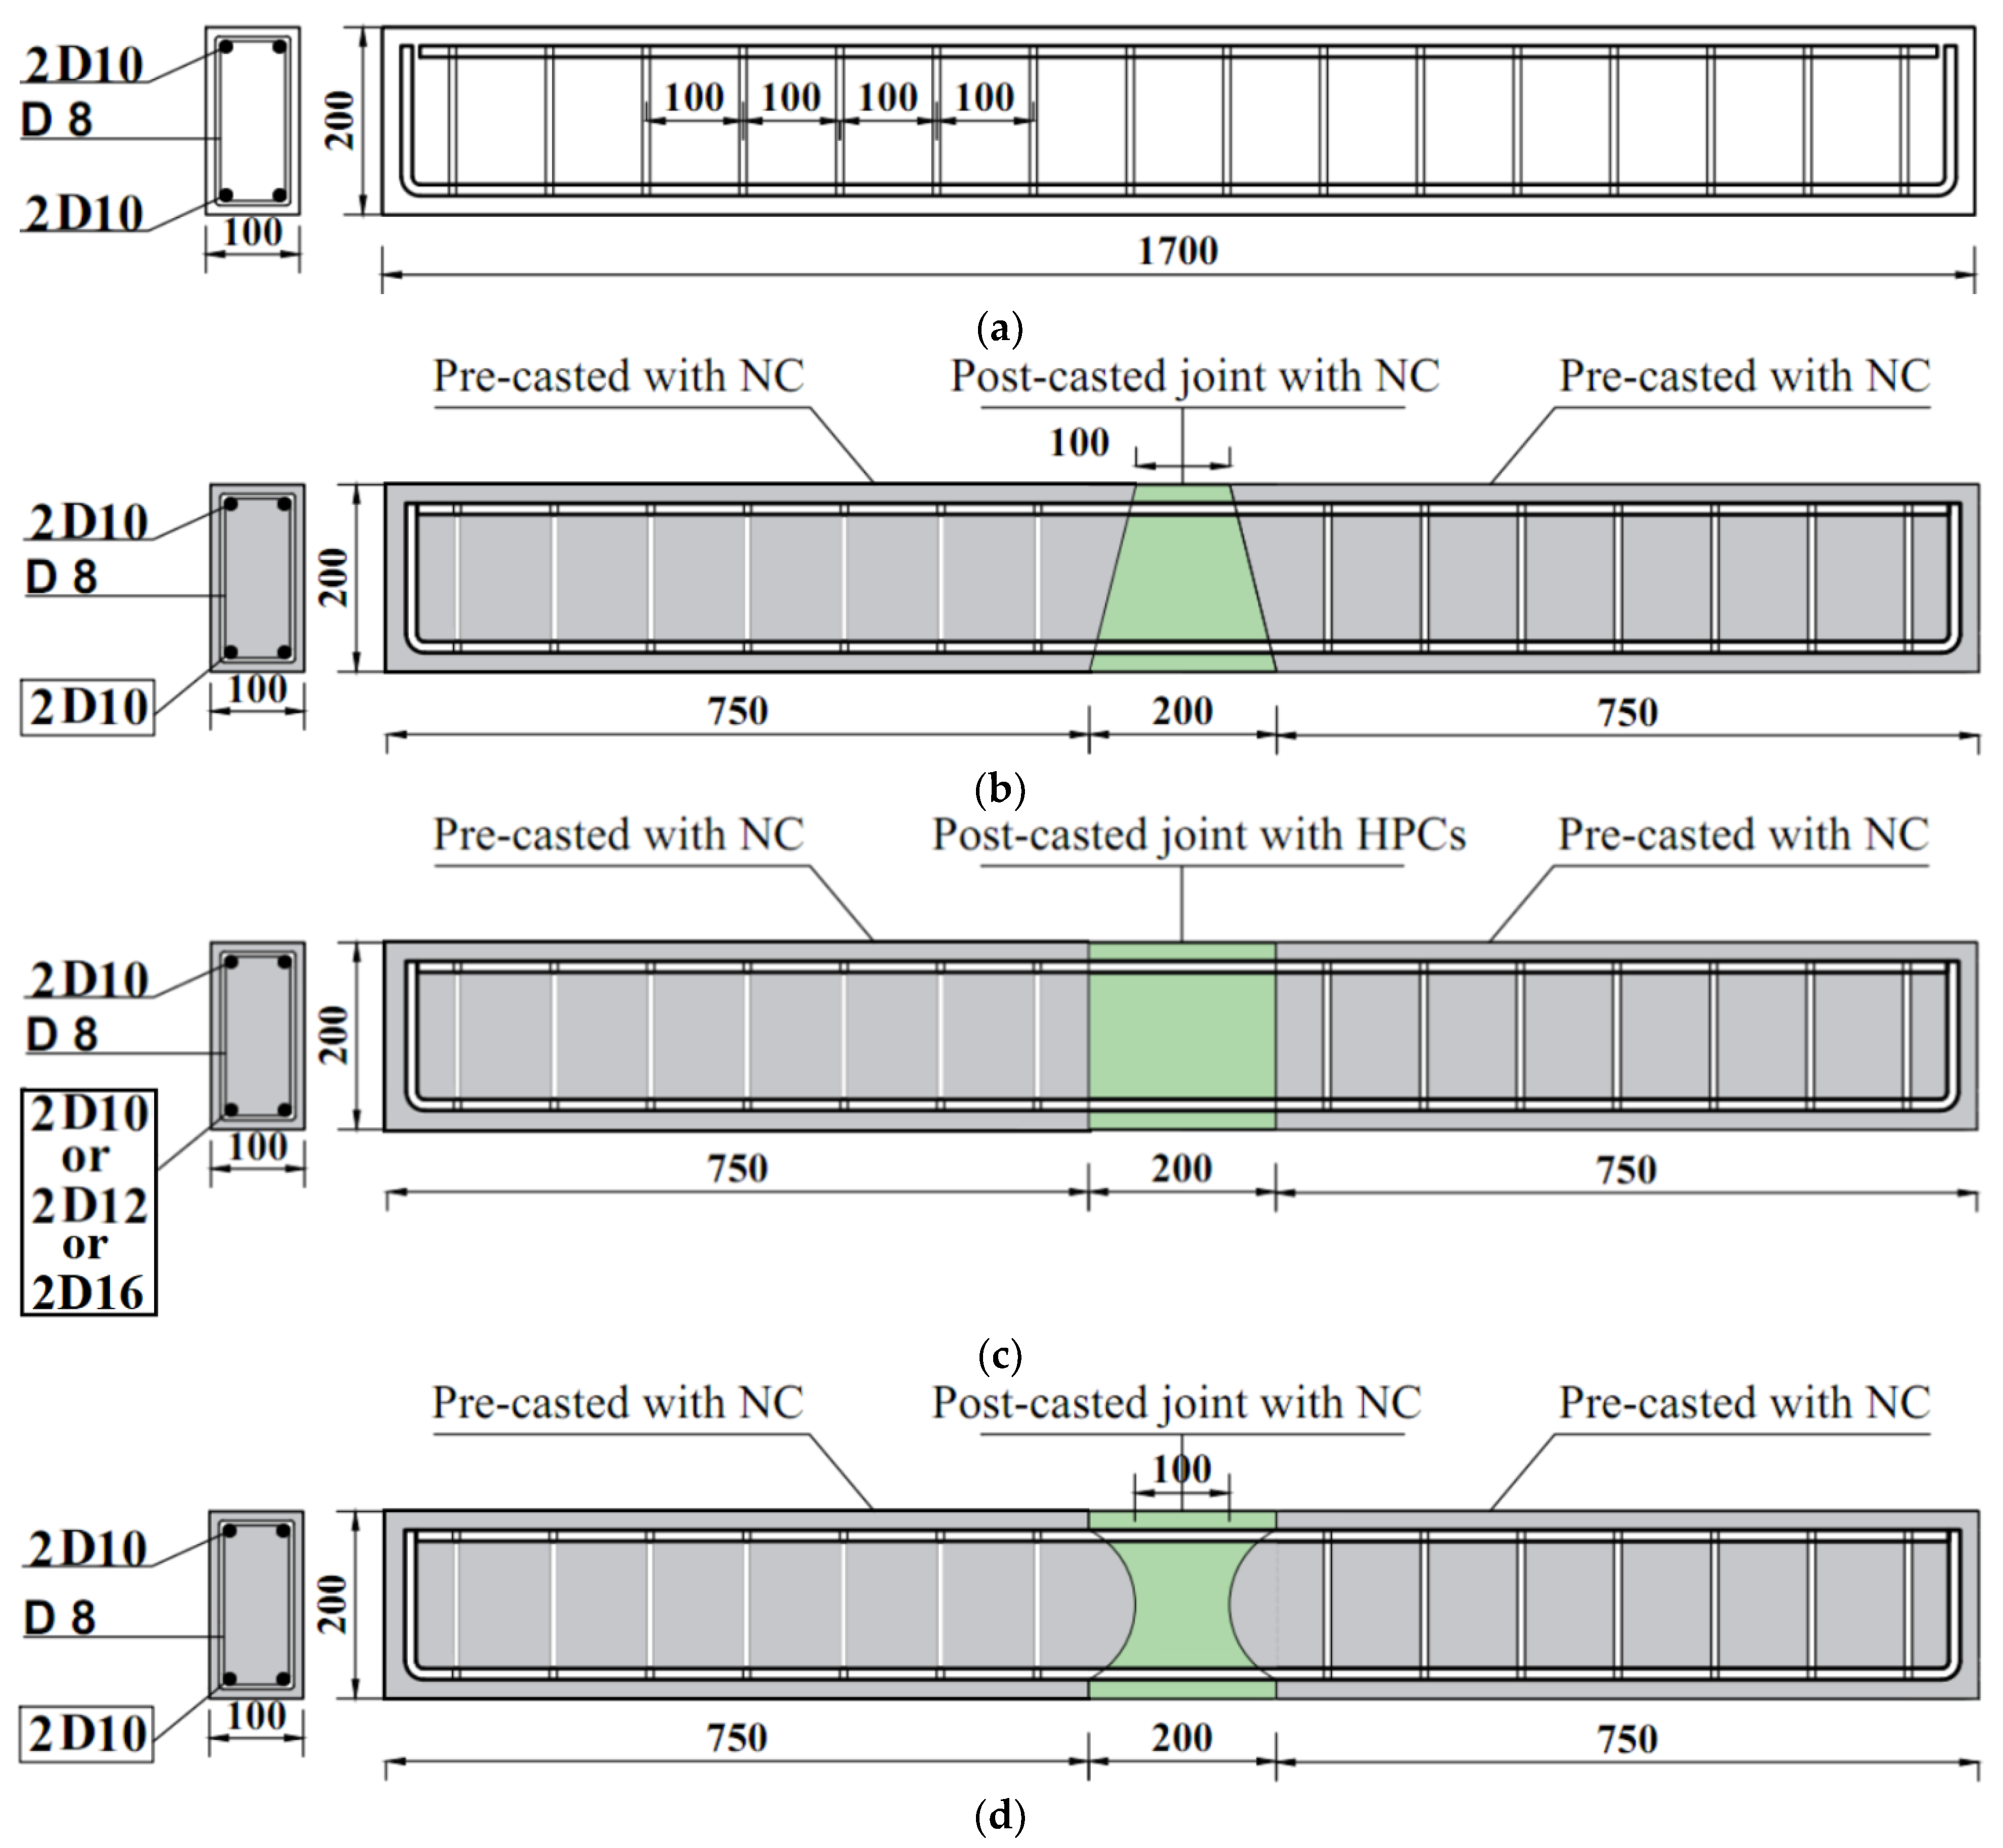
2.1. Specimens’ Details

A total of 11 precast rectangular reinforced concrete (PRRC) beams were tested to failure, including 1 normal concrete (NC) beam (B0) that served as a control specimen for comparison purposes. The configurations of the beams are illustrated in Figure 1, and detailed specifications are provided in Table 1. Each beam had a total length of 1700 mm, comprising two precast sections, each 750 mm long, with an intermediate connection length of 200 mm. The cross-sectional dimensions of the PRRC specimens were 100 mm × 200 mm. For specimens in Group G-N, two ɸ10 mm reinforcement bars were utilized in both the compression and tension regions. In other groups, the tensile reinforcement bar diameters were varied (10 mm, 12 mm, or 16 mm) to assess the effects of bar diameter on the intermediate connection’s performance (see Table 1). In addition, ɸ8 mm bars were used as stirrups, spaced at 100 mm intervals. The PRRC specimens featured three different shapes for the intermediate connections: triangular, rectangular, and semi-circular, designated as models B, C, and D, respectively (see Table 1). The control specimen configuration was referred to as model A. Intermediate connections were filled with various types of concrete, including NC, engineered cementitious composites (ECC), ultra-high-performance ECC (UHPECC), and rubberized ECC (RECC). In the naming convention of the groups, the letter following ‘G’ indicates the type of infill concrete (e.g., G-N for NC, G-U for UHPECC, G-E for ECC, and G-RE for RECC). The number following the letter represents the effects of the tensile reinforcement bar diameter on the length of the construction joint measured in the flexural zone (Lc). A rectangular-shaped intermediate connection is expected to provide the most resistance under load, whereas triangular- and semi-circular-shaped intermediate connections offer savings in the cost of casting materials, due to the smaller surface area to be cast, yet these may still provide performance close to a rectangular-shaped intermediate connection. The different types of infill concrete used in this study offer a unique understanding of their contribution to the flexural performance of PRRC beams, owing to their distinguishing characteristics.

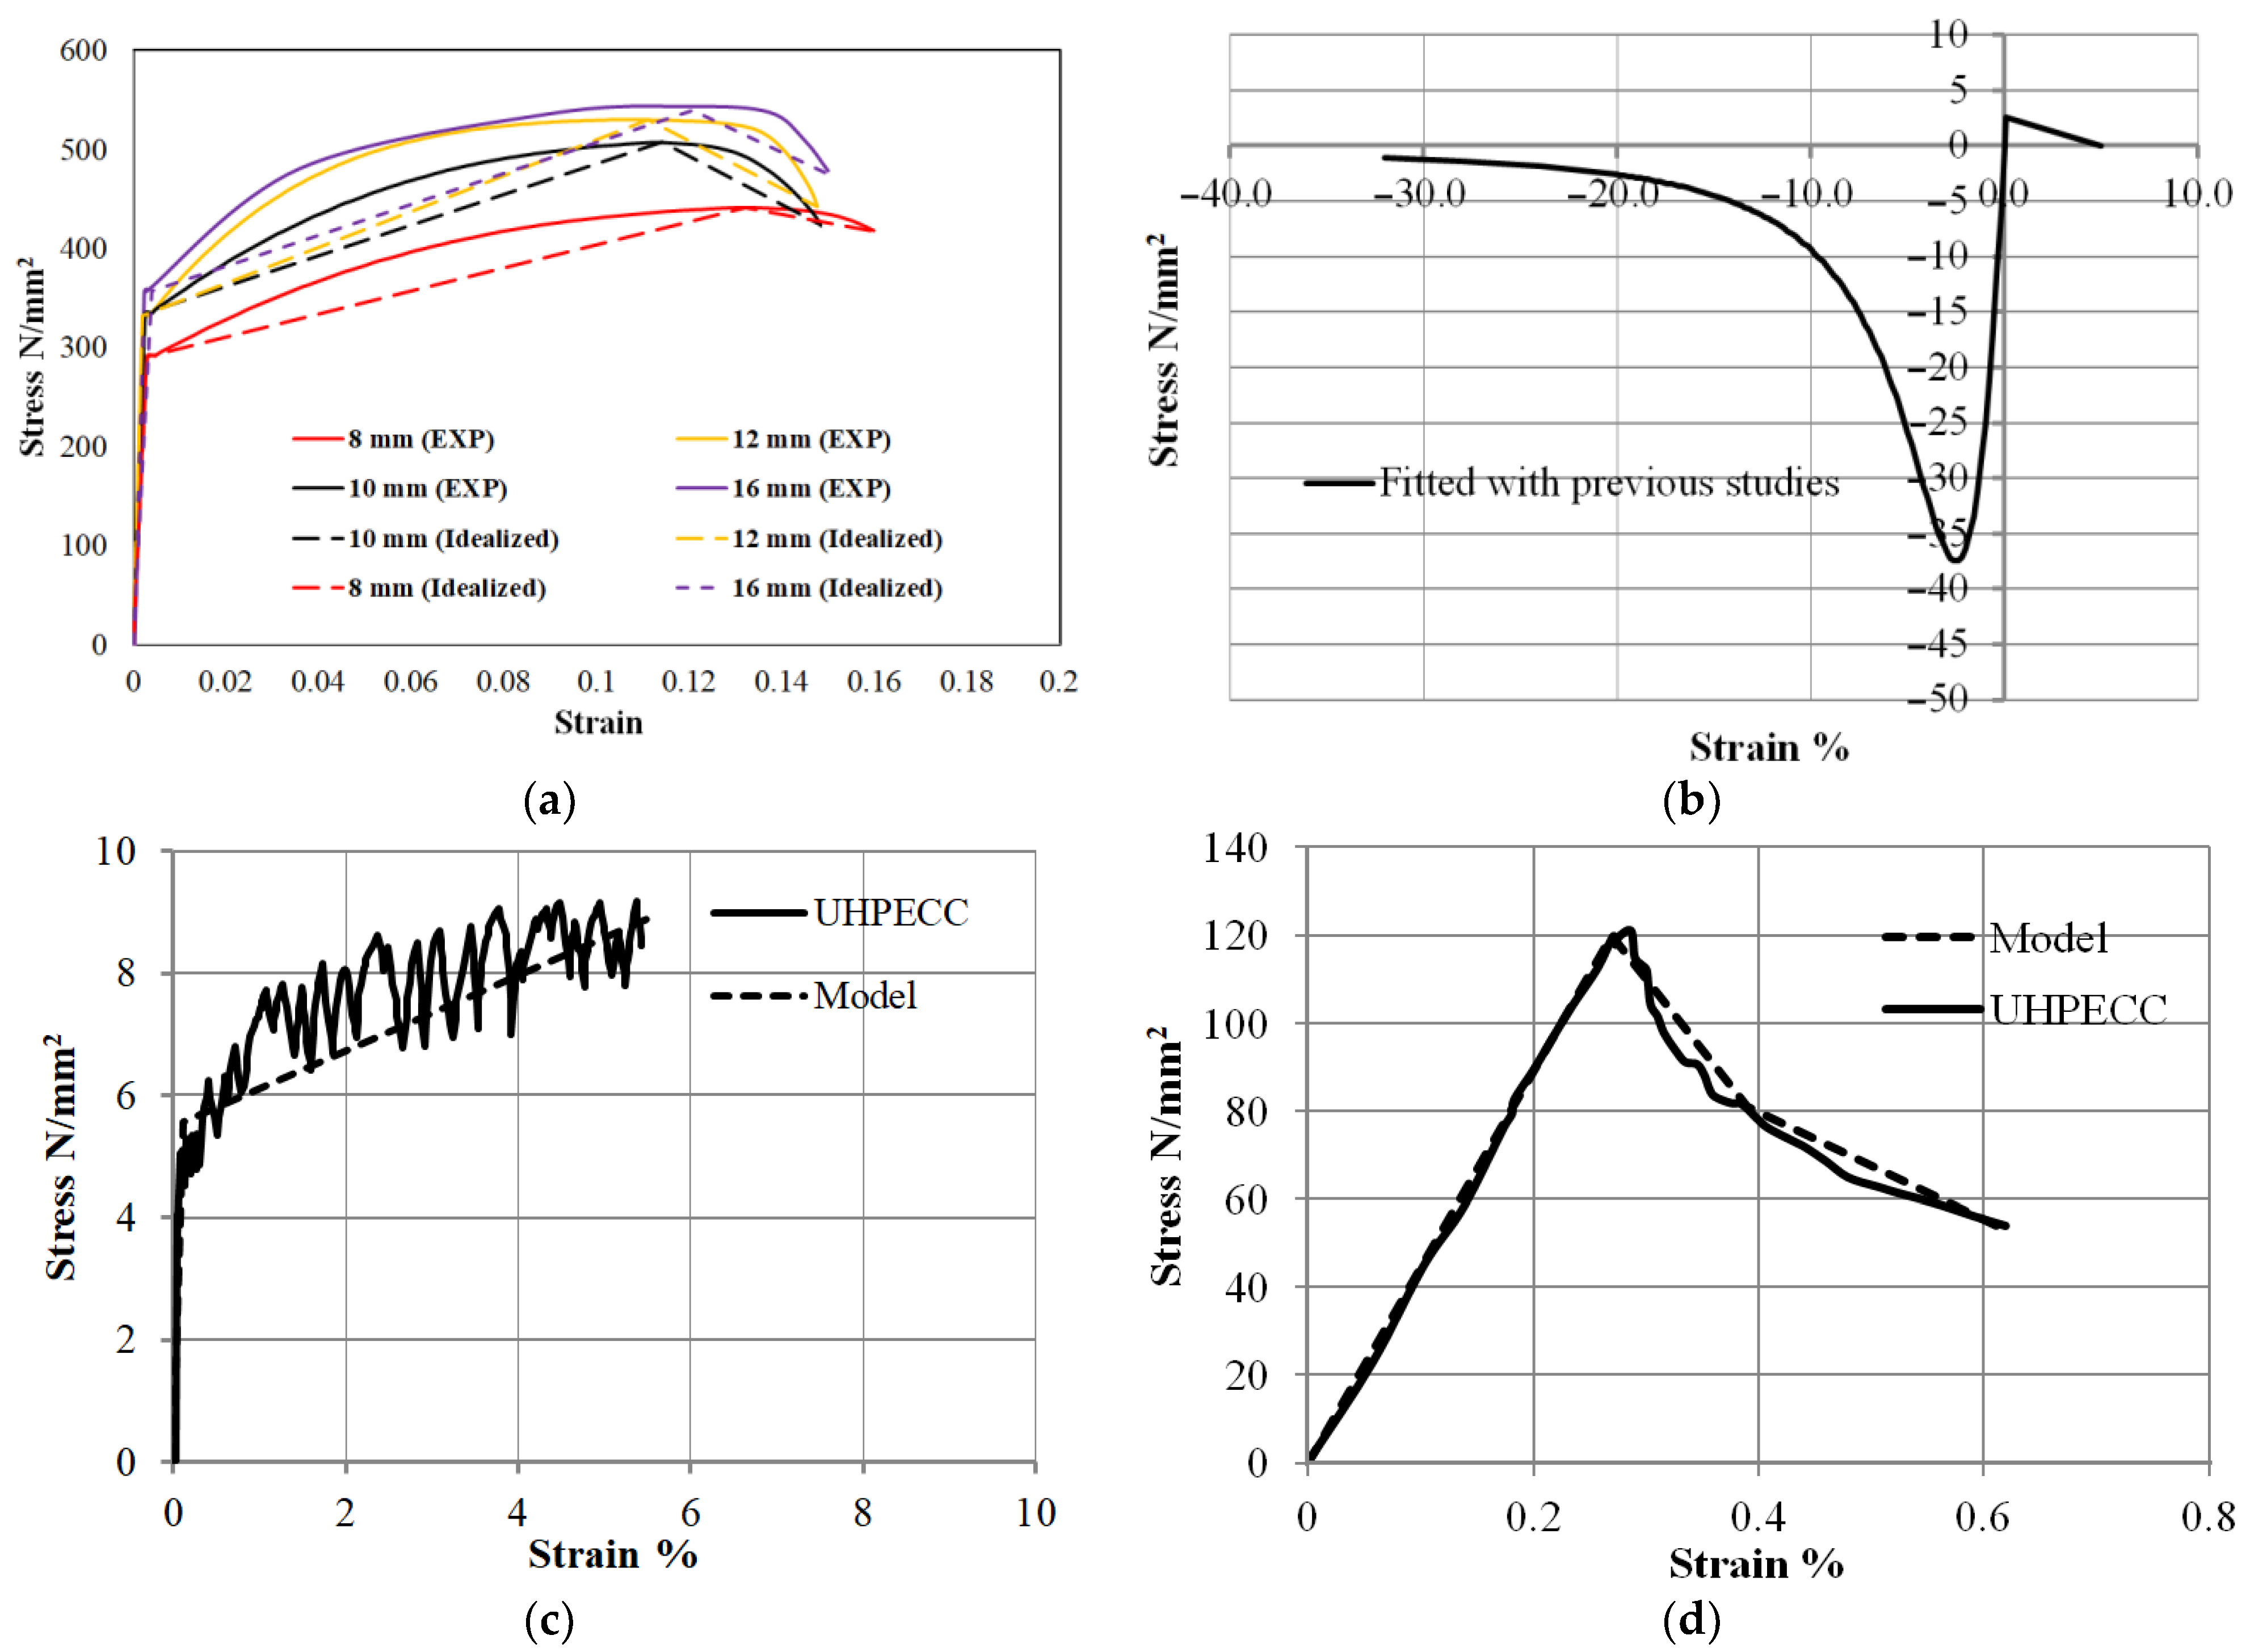
2.2. Material Properties

The material properties of concrete and steel were measured through compression and tensile coupon testing. The tensile strength of bars with different diameters is listed in Table 2. The typical stress–strain curves of the bars are illustrated in Figure 2a. In this study, four different types of concrete, namely, NC, ECC, UHPECC, and RECC, were used. Table 3 provides the mix design of each type of concrete, along with the measured compressive and tensile strength averaged from three samples. The stress–strain curves of the different types of concrete under compressive and tensile loads are given in Figure 2b–f. The compressive strengths of NC, ECC, UHPECC, and RECC were measured at 33, 52, 129, and 42 MPa, respectively. The tensile strengths of NC, ECC, UHPECC, and RECC were 2.98, 4.43, 11.85, and 3.82 MPa, respectively. As can be seen from Figure 2c,e, UHPECC exhibits higher strain-hardening characteristics compared to ECC. Furthermore, the ultimate strain of UHPECC is significantly higher than that of ECC.

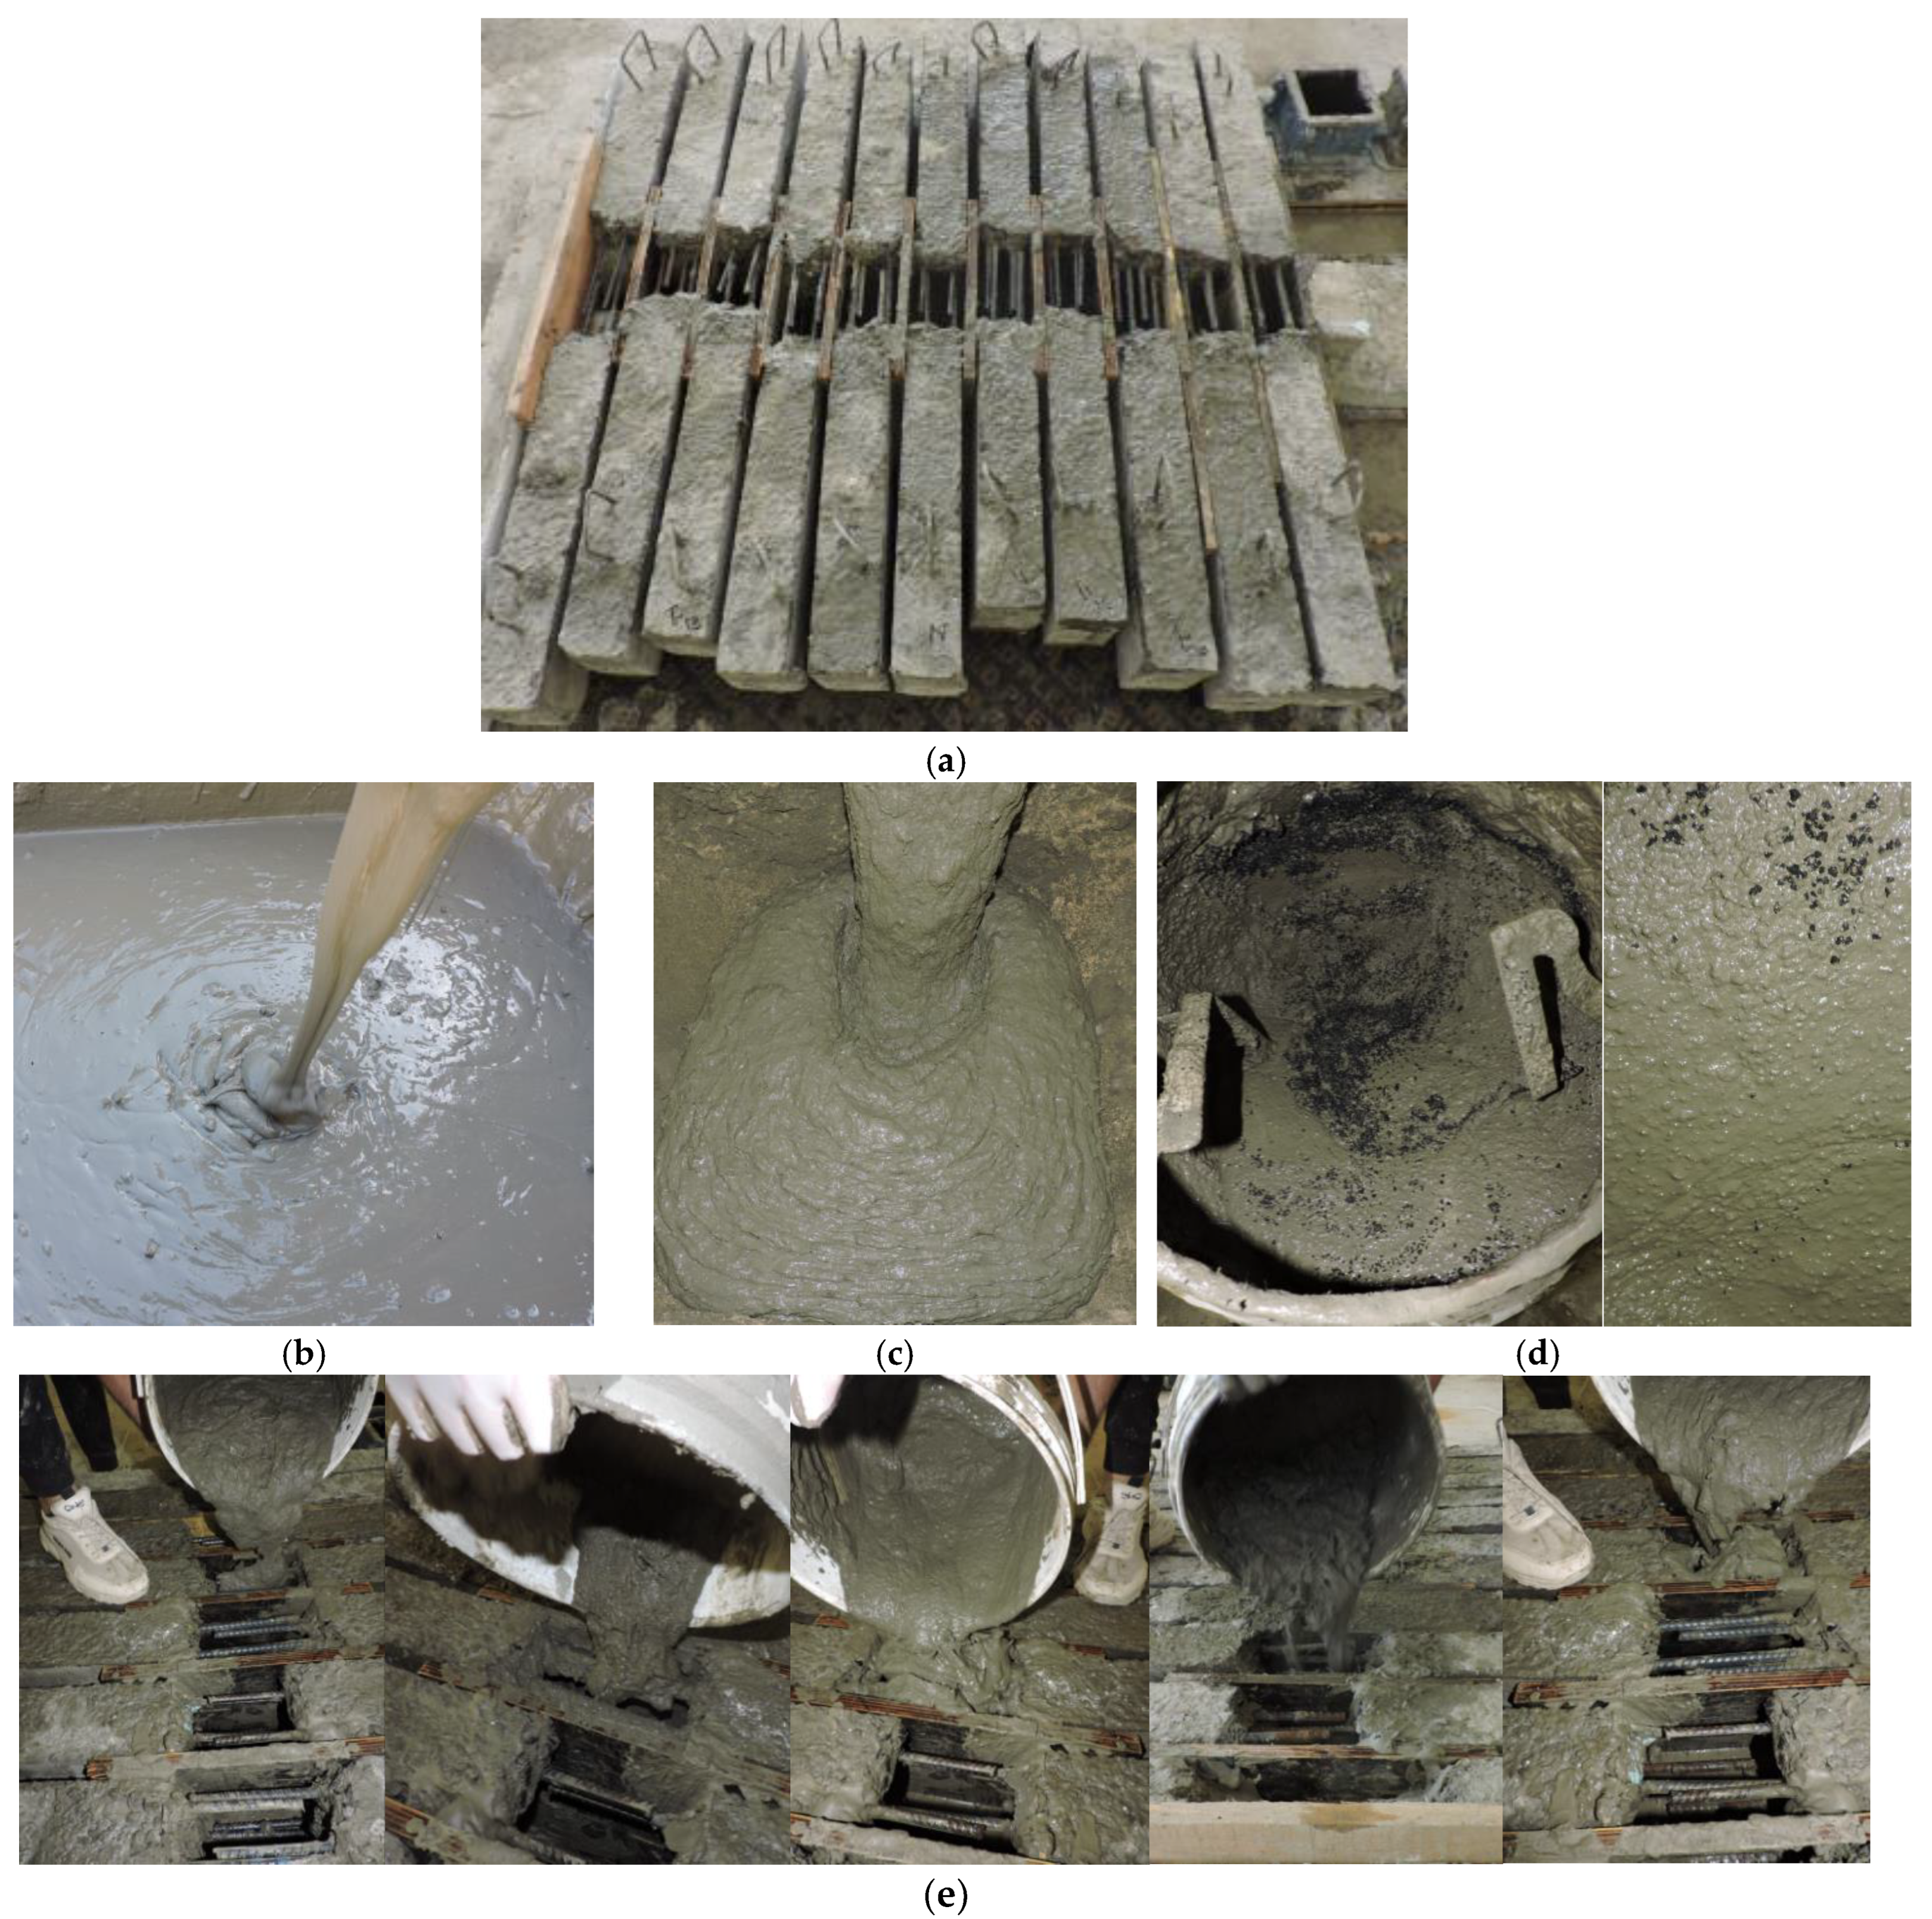
2.3. Preparation of Tested Specimens
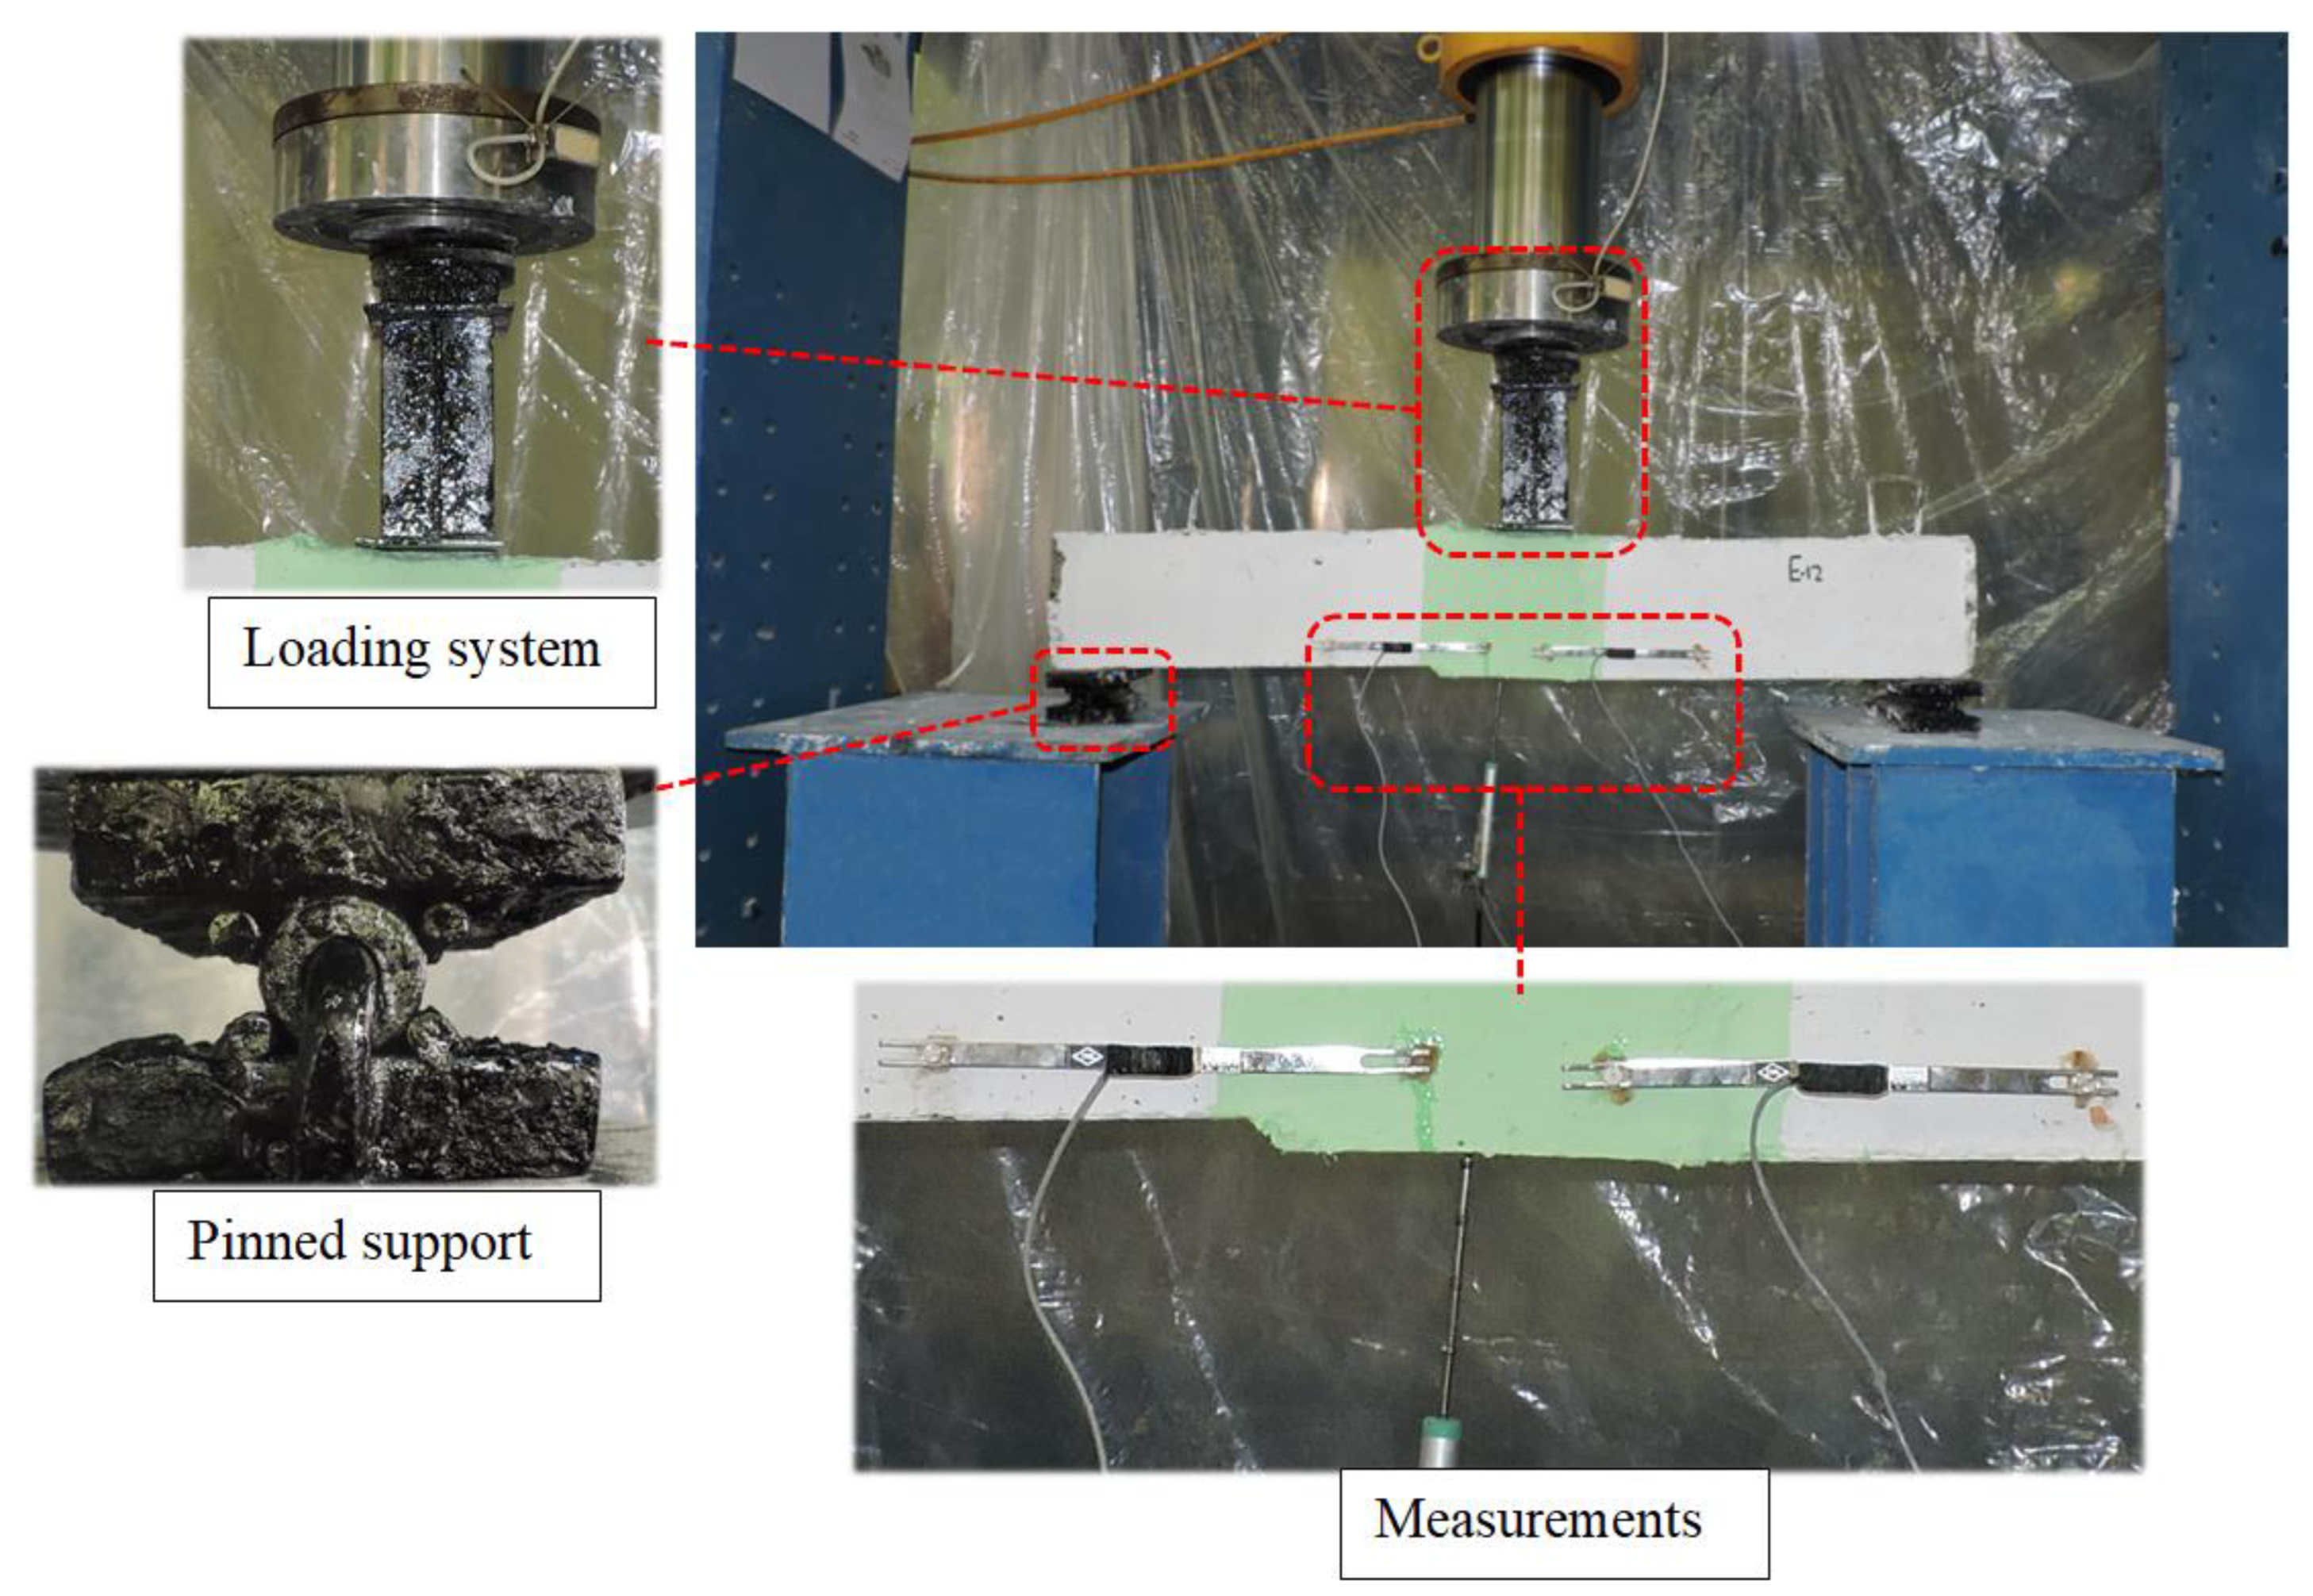
The preparation of the samples involved two stages: casting the PC sections and then connecting the two PC sections using different types of concrete. In the first stage, formwork was set up to shape the PC sections, and a reinforcement cage was installed within the formwork. Concrete was then poured into the formwork and allowed to cure for 24 h before the formwork was removed. During this process, three 150 × 300 mm cylinders were also cast to measure the compressive strength of the concrete, and the tensile samples were prepared for subsequent tensile testing. The PC sections were left to air-dry for 28 days, and the cylinders and tensile coupon samples were cured under identical conditions to ensure uniformity. After 28 days of curing, the second stage began with positioning two PC sections in opposite directions with an intermediate connection length of 200 mm. This connection was cast using different types of concrete, as listed in Table 1. The surface of the intermediate connection was painted green to facilitate better visualization of cracking during testing. Figure 3 illustrates the various stages of the construction process for the PRRC specimens.

2.4. Test Setup

The experimental testing was conducted in the structures laboratory at Kafrelsheikh University, Egypt. The specimens were subjected to a three-point bending test with pin–pin end conditions, ensuring the accurate simulation of bending stresses. Each specimen was placed in the loading frame with a 50 mm overhang on either end. A hydraulic machine with a capacity of 500 kN was utilized to apply the load incrementally. The displacement at the mid-span of the specimen was measured using a linear variable displacement transducer (LVDT), which provided precise data on the specimen’s deformation. To monitor crack development in the intermediate connection region, two electrical pi-gauges were strategically installed. This setup allowed for the detailed observation and measurement of crack propagation during testing. The load was increased at a controlled rate of 5 kN/min, ensuring a gradual application of stress to the specimen. A data logger system was employed to continuously record all relevant data throughout the test. Cracks were marked as they appeared, and observations continued until the specimen ultimately failed. Figure 4 provides a visual representation of the test setup, including the positioning of the LVDT and pi-gauges.

3. Test Outcome and Discussions

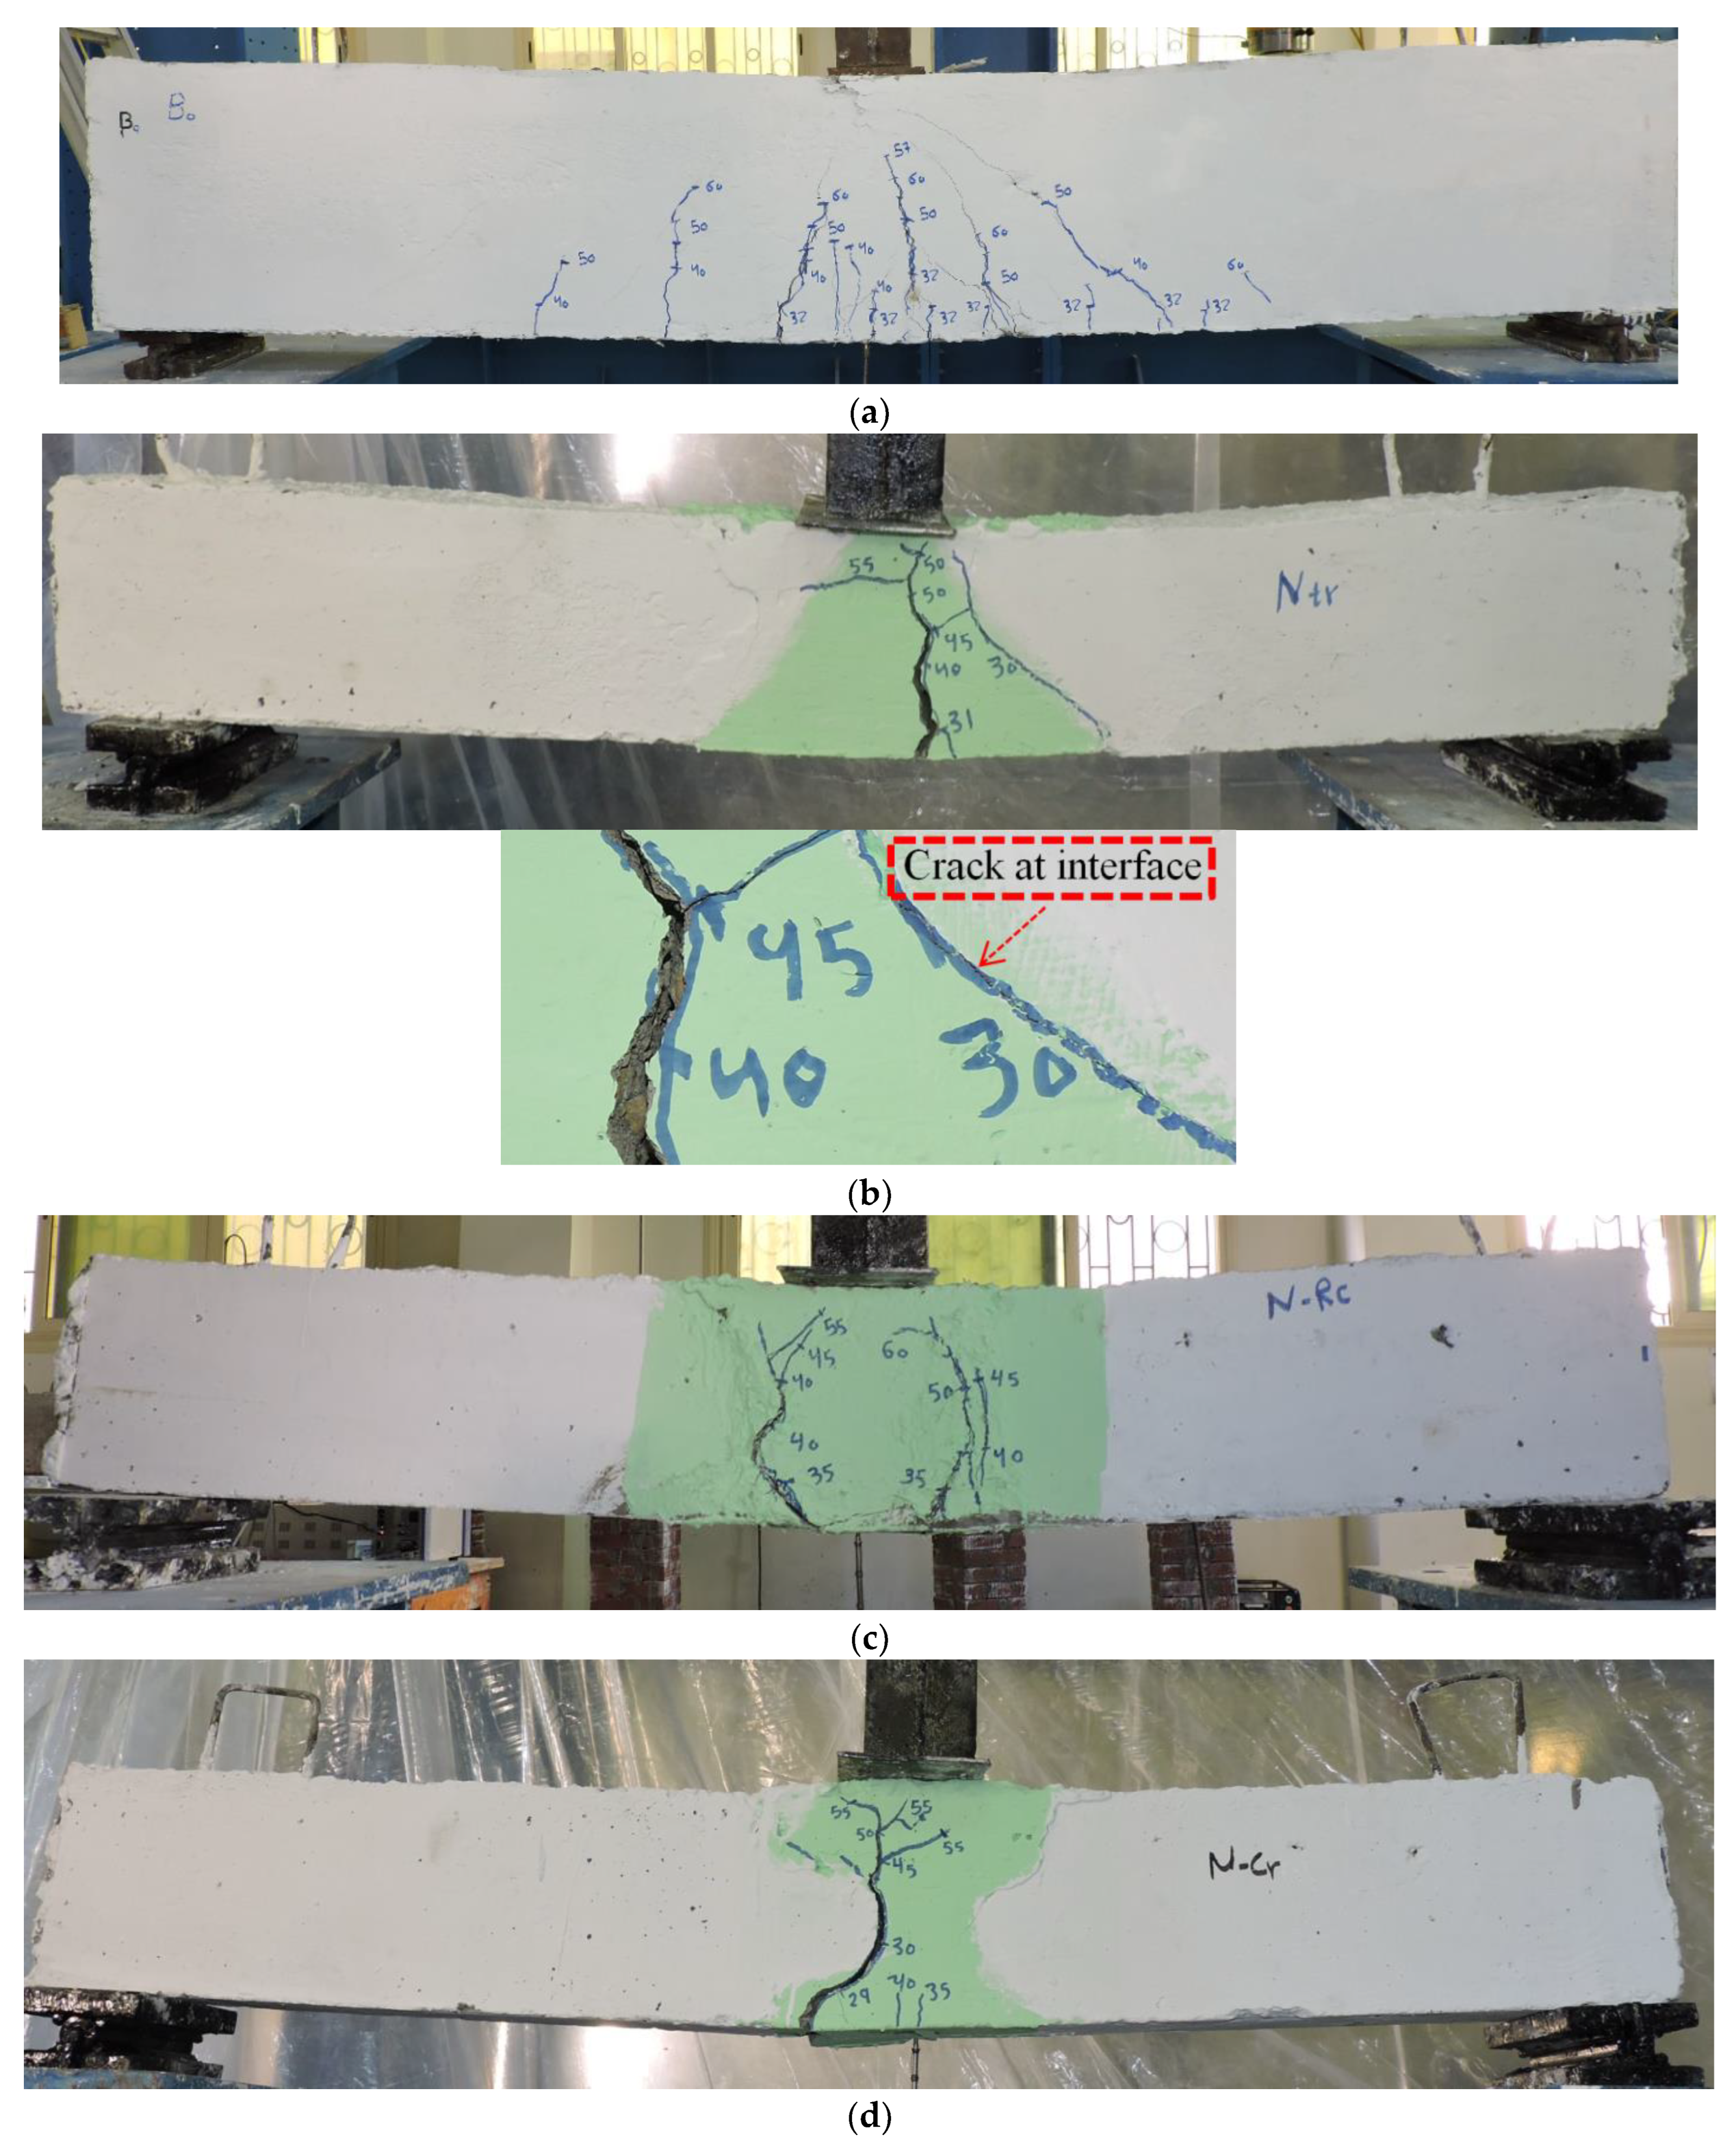
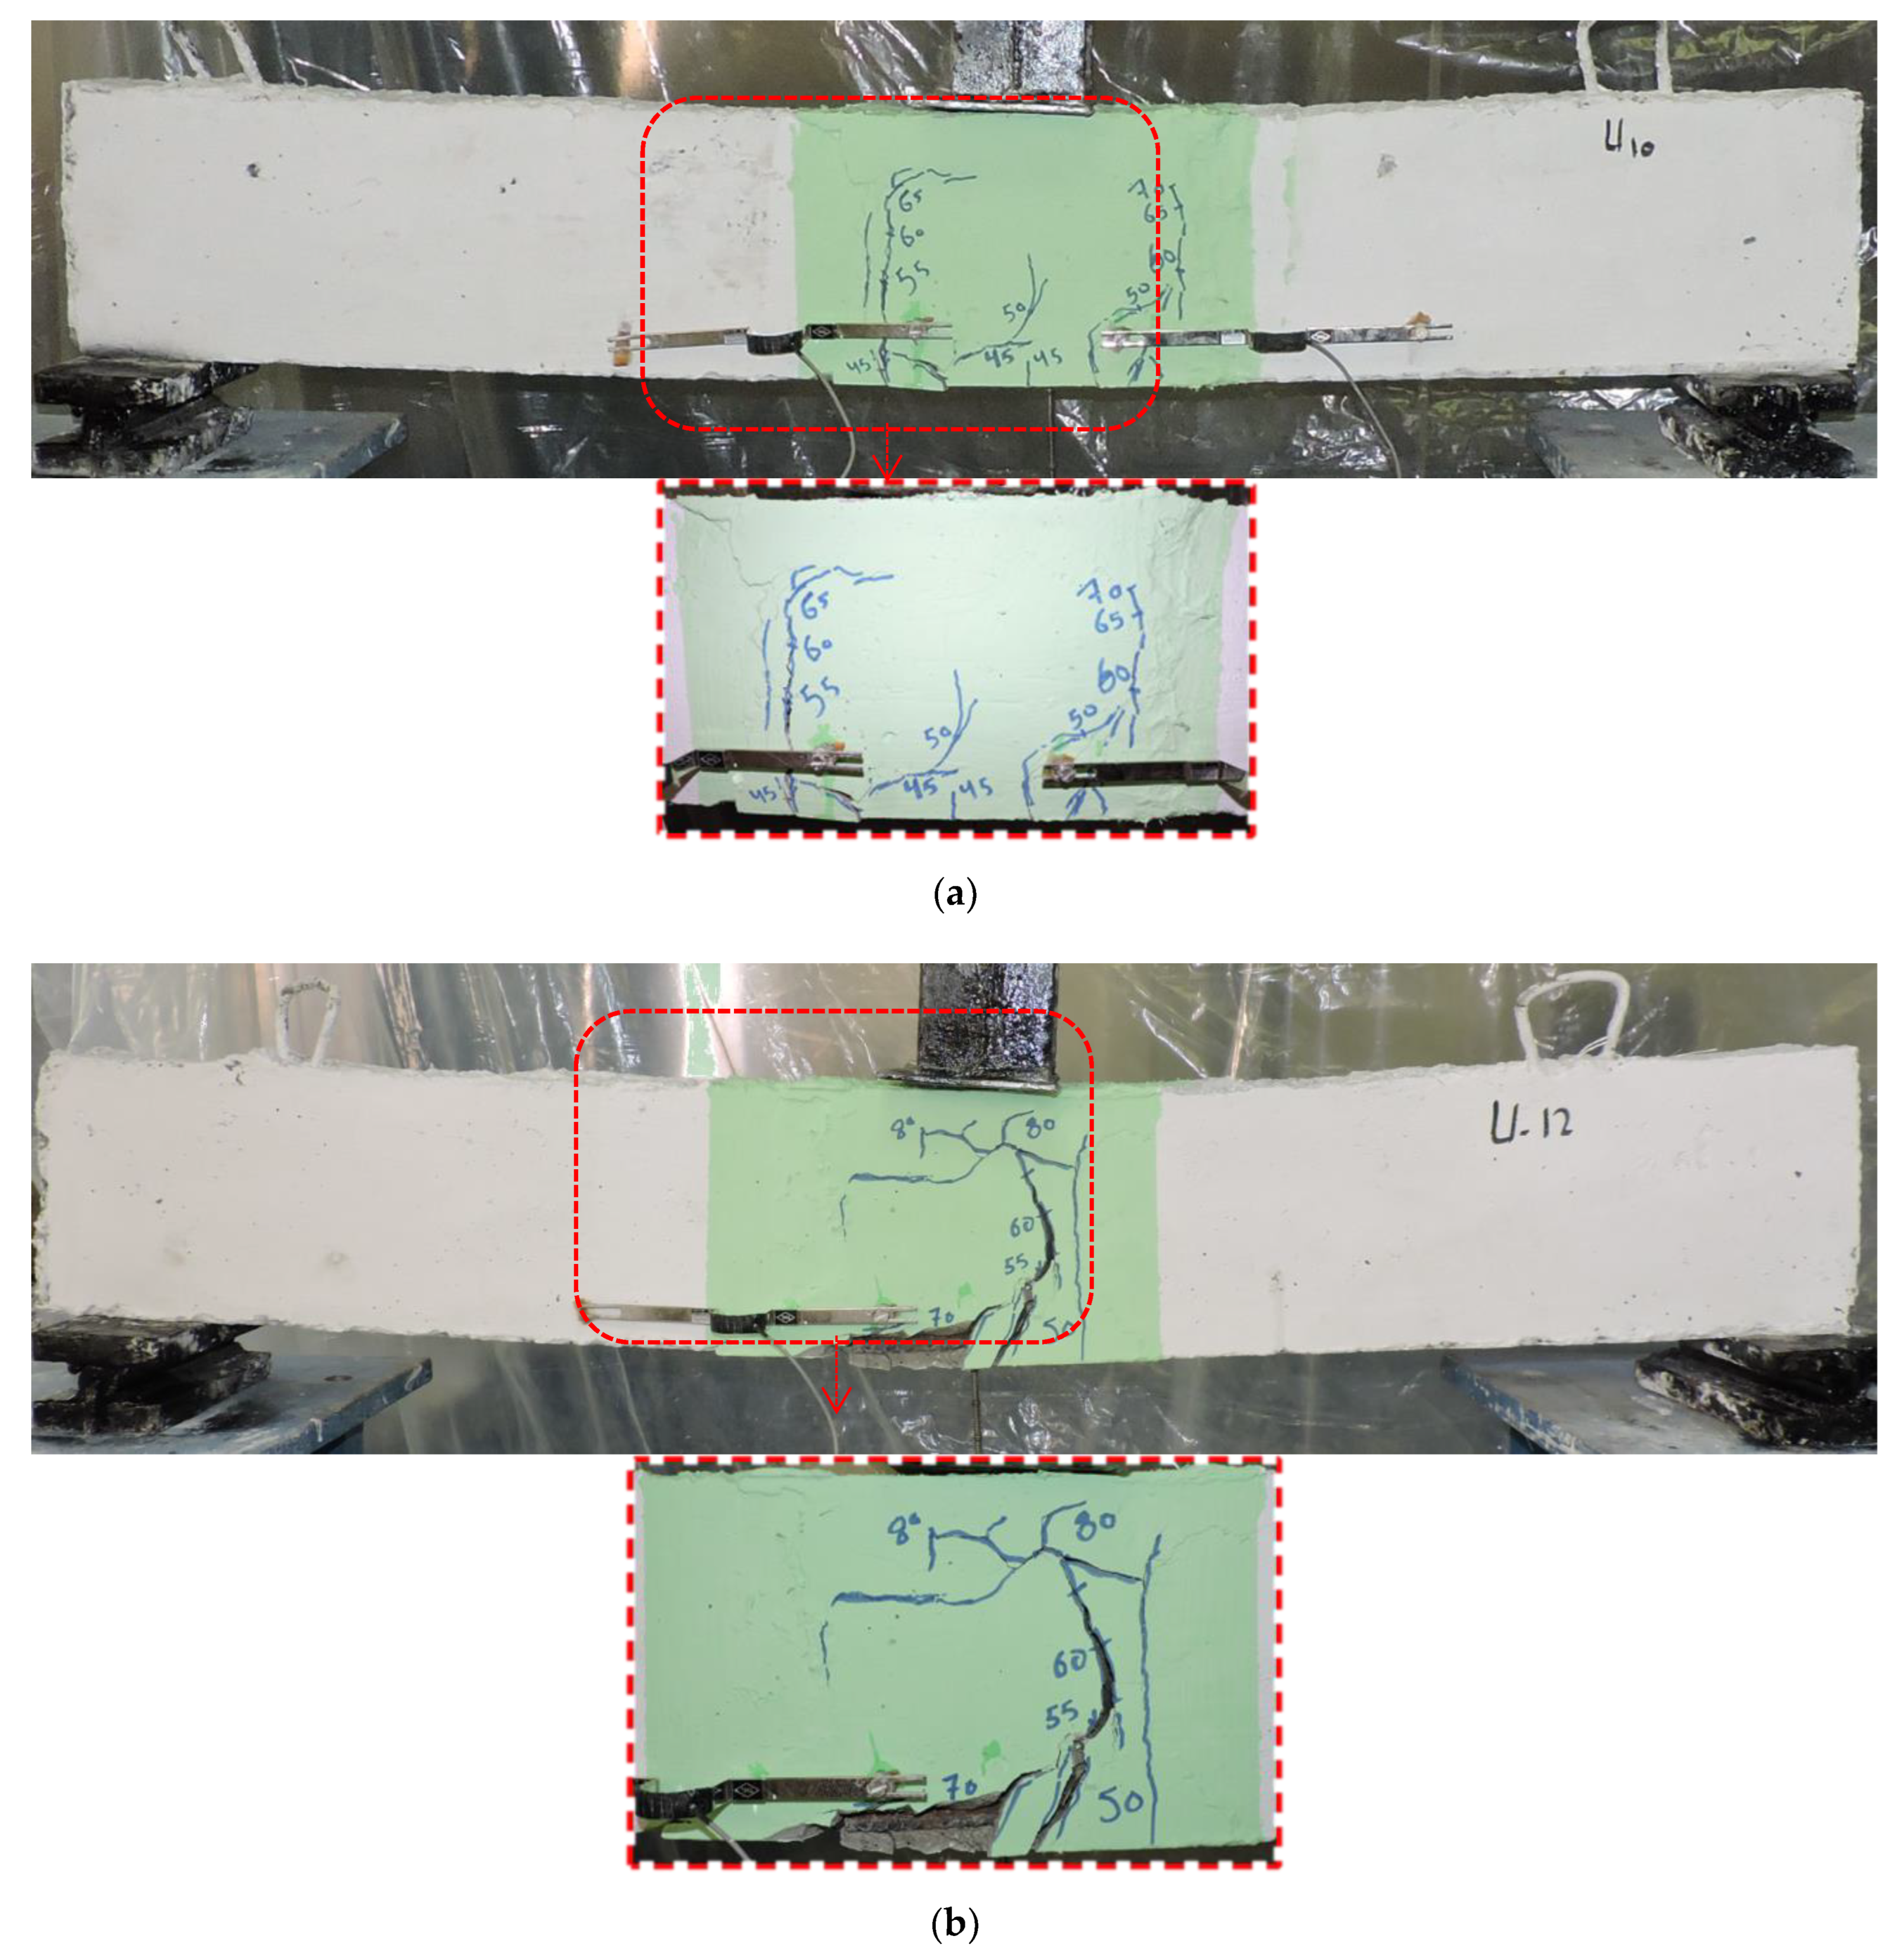
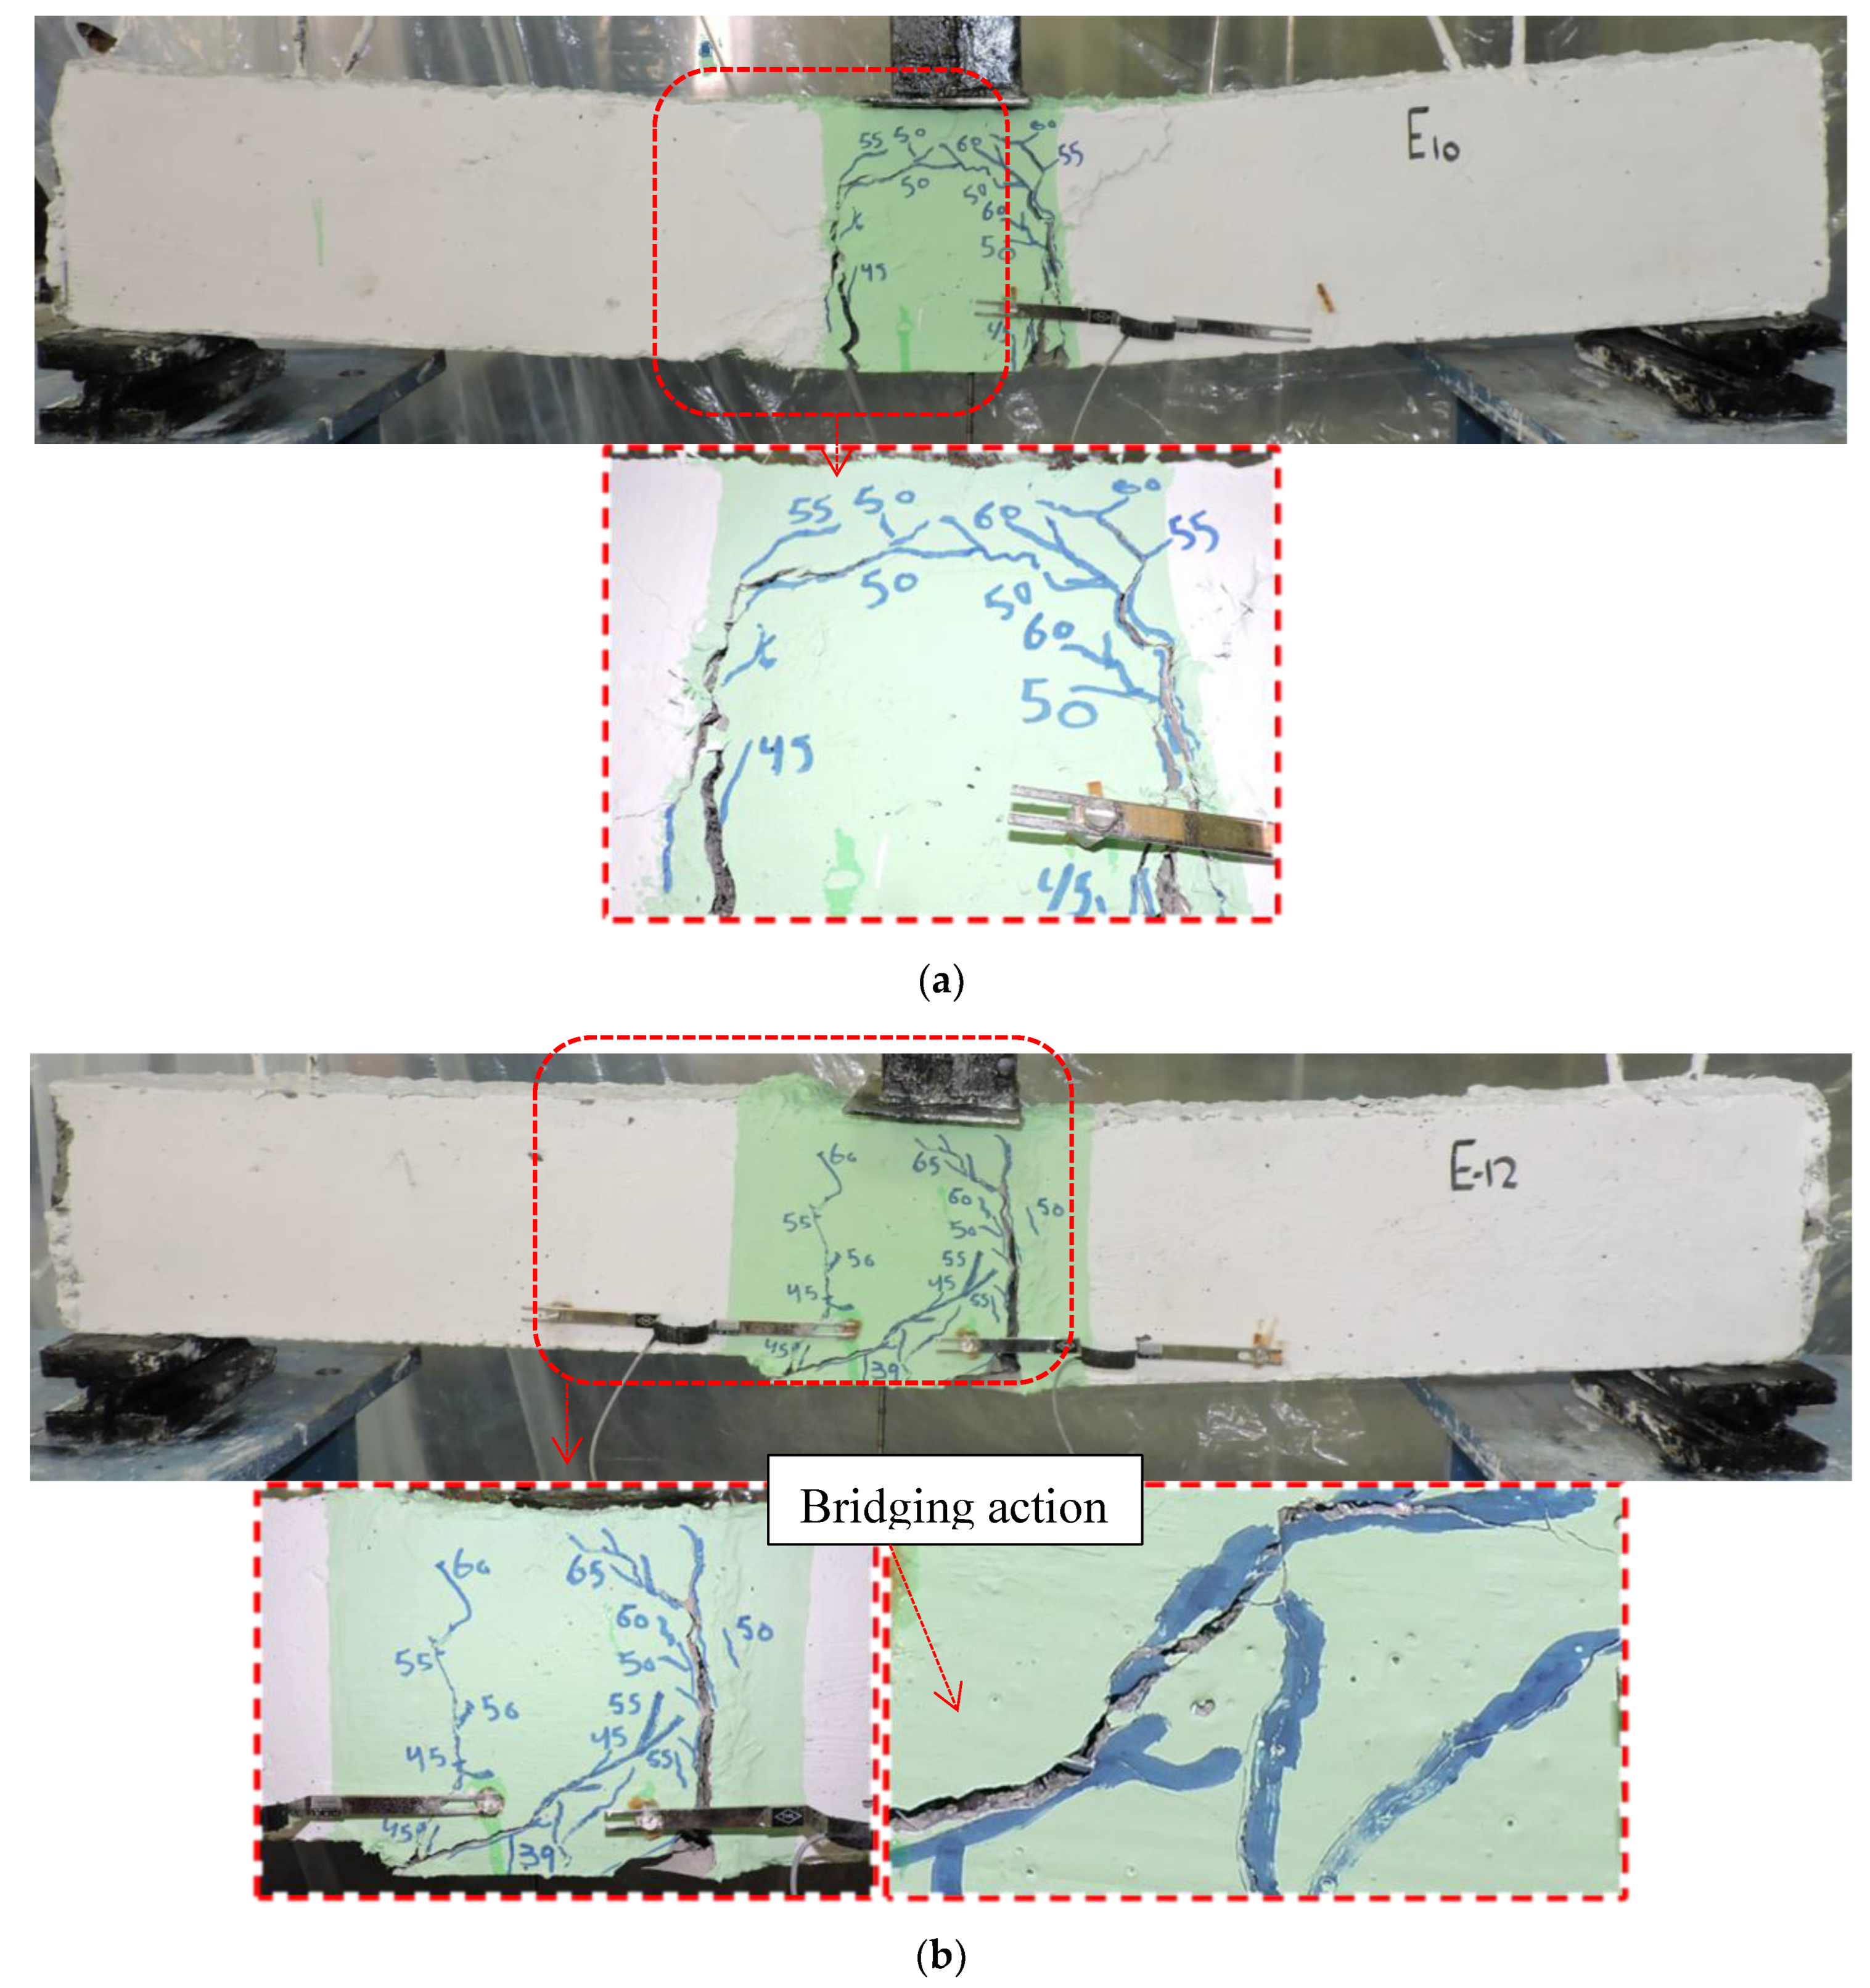
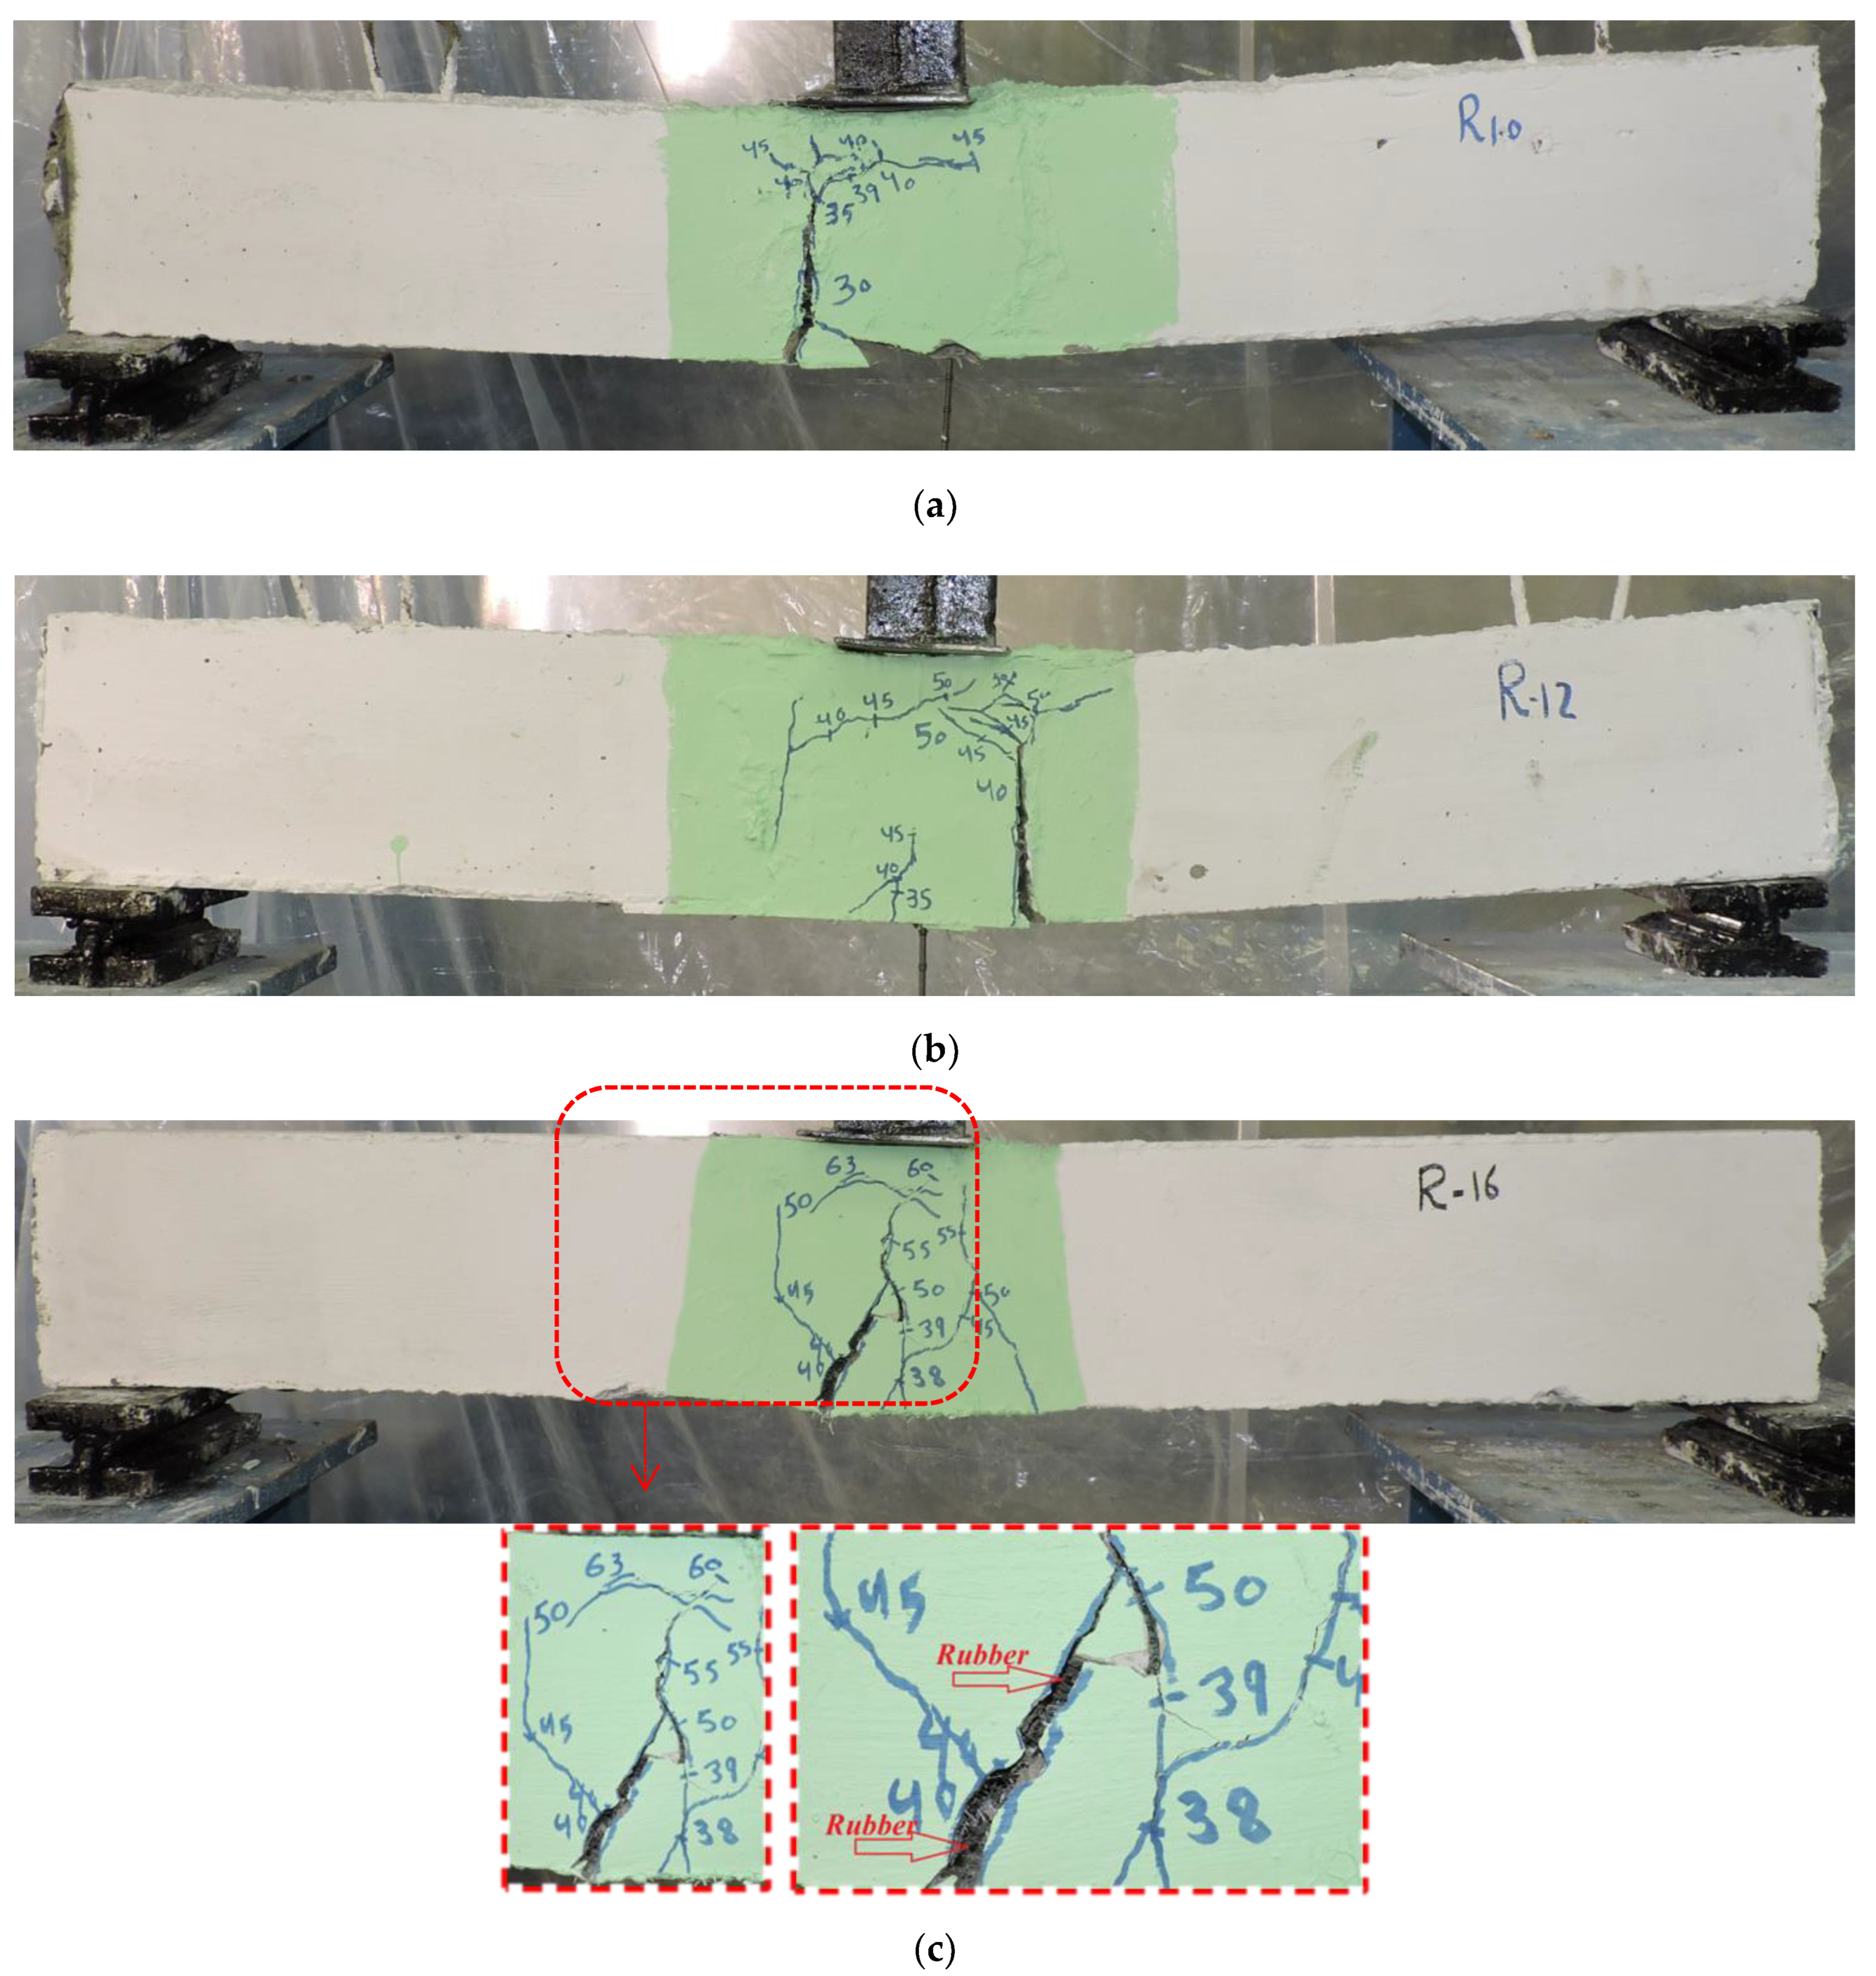
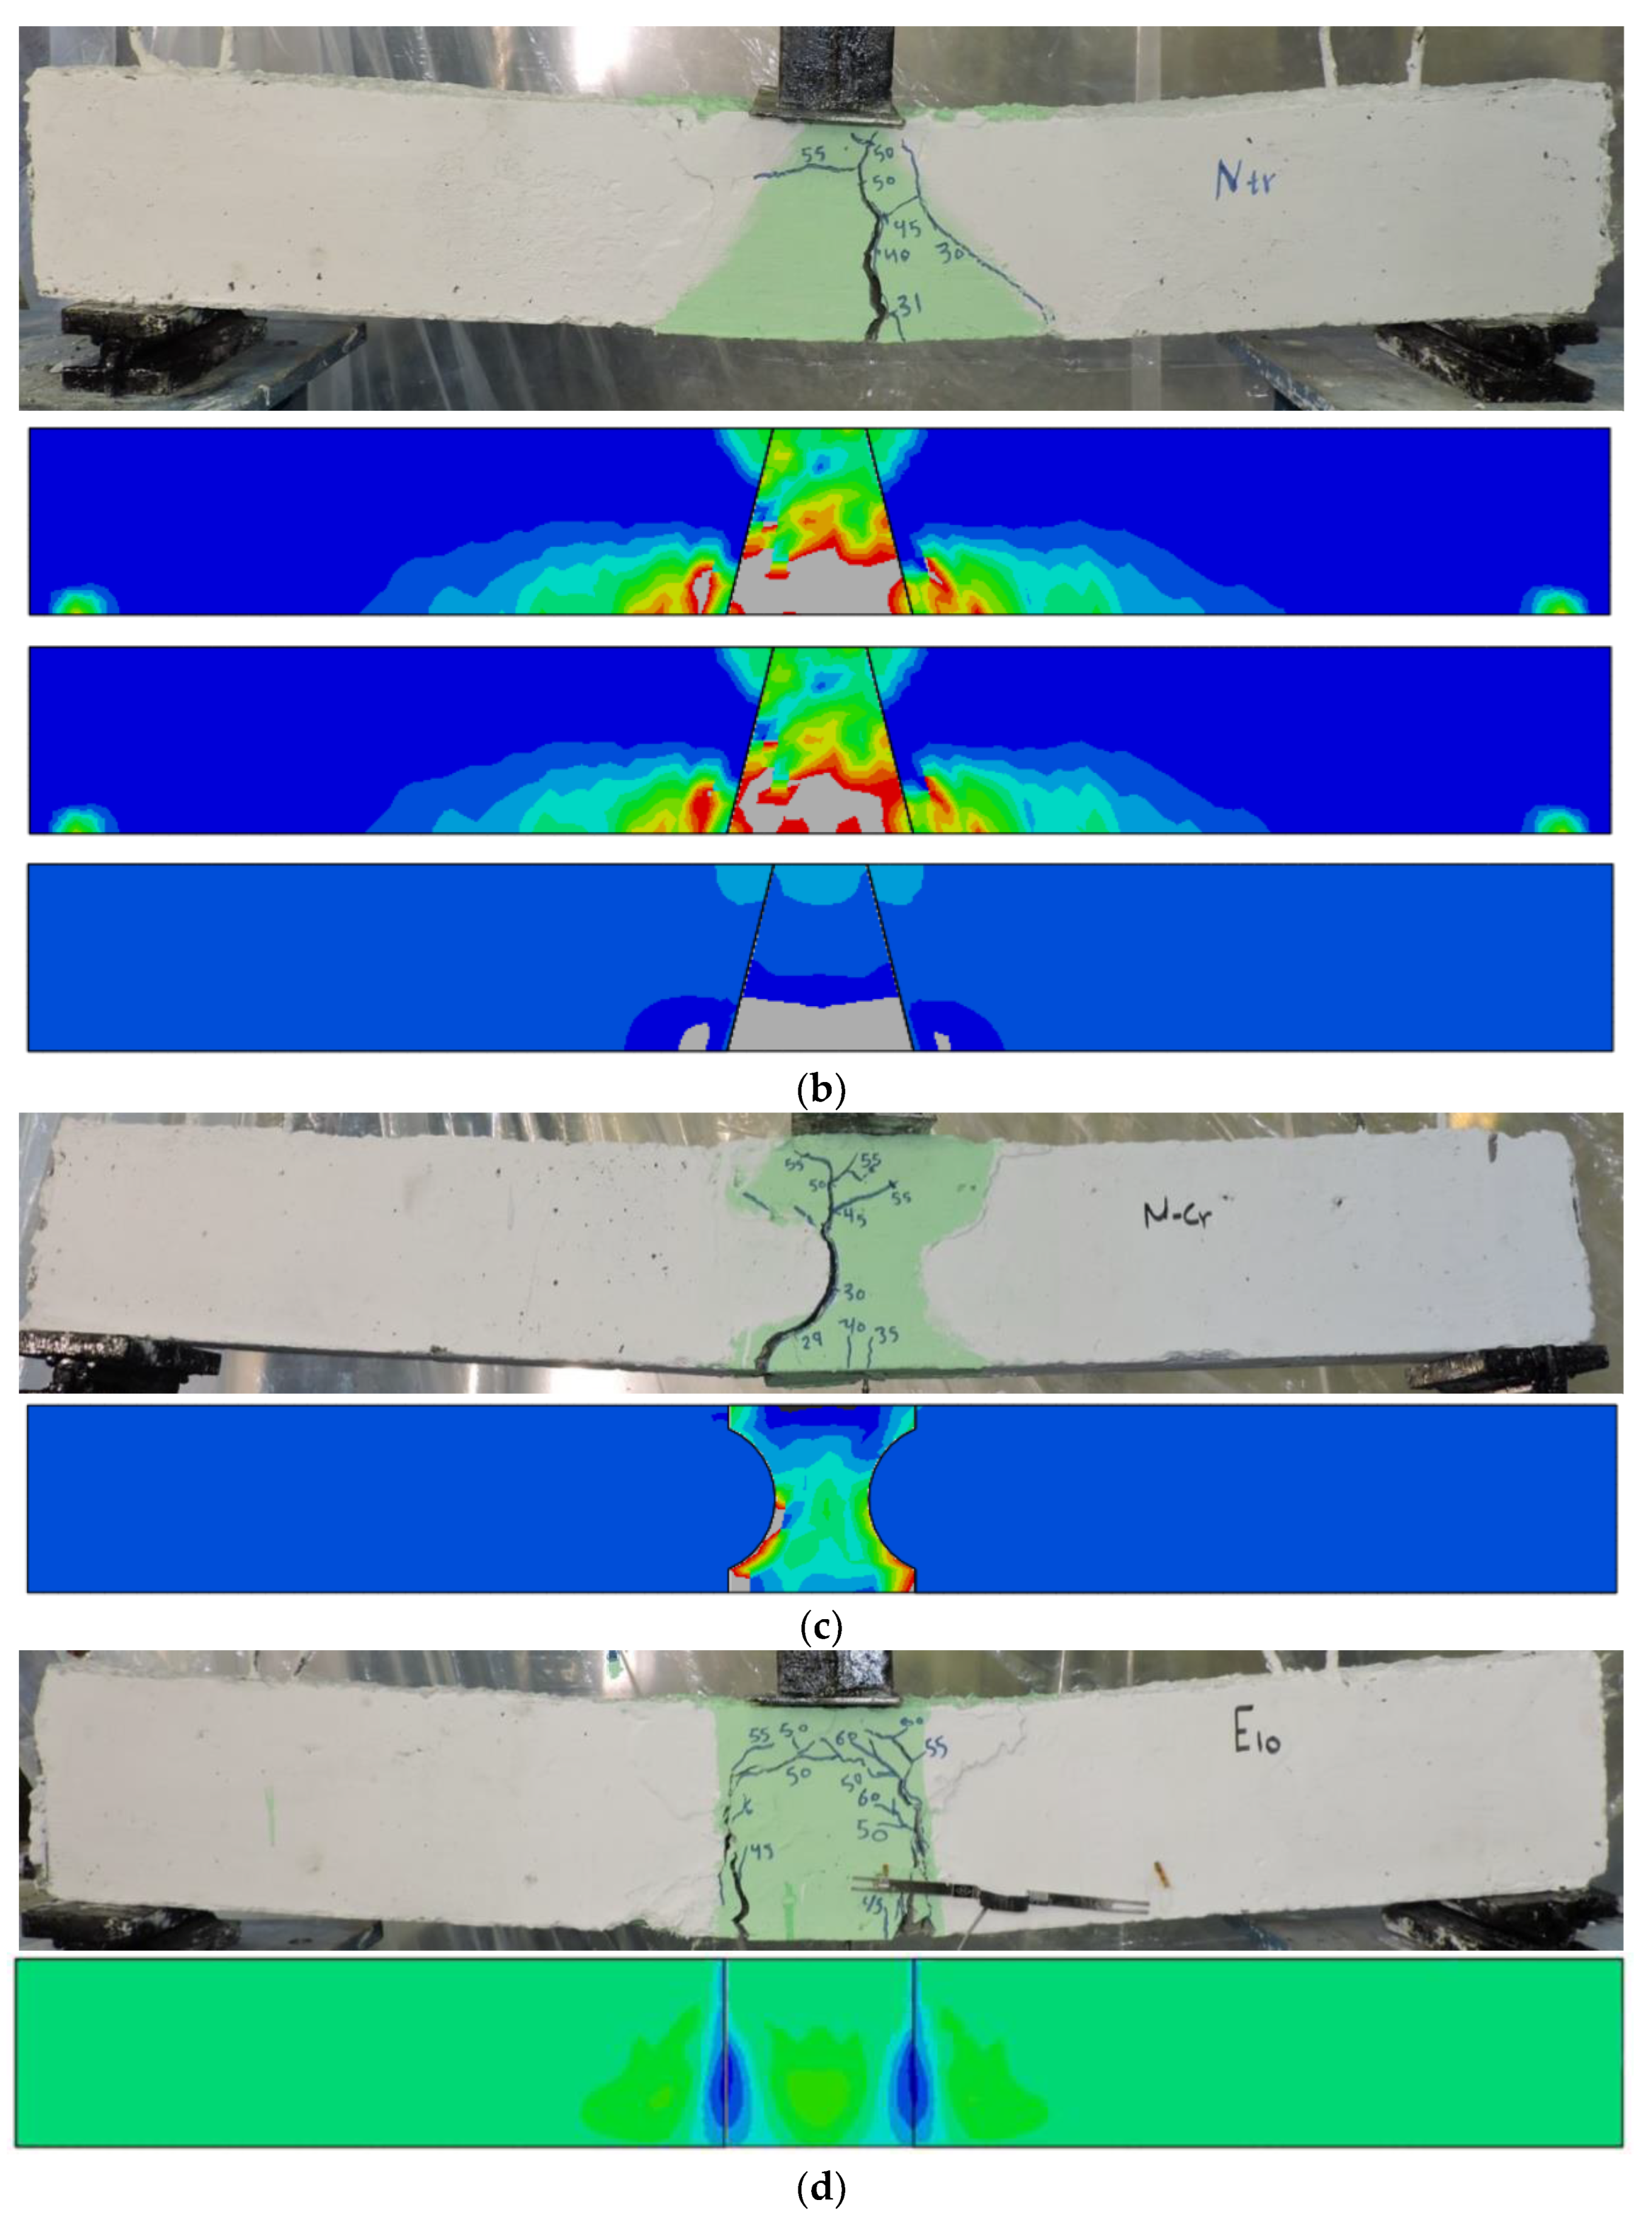
3.1. Failure Patterns

The failure patterns of the tested specimens are depicted in Figure 5, Figure 6, Figure 7 and Figure 8. For beam B0, the initial crack emerged at 32 kN, at approximately 52% of its ultimate load. This crack propagated upward toward the loading cell as the load continued to increase (see Figure 5a). The width of the primary flexural cracks expanded, becoming the predominant cause of failure for the beam, which ultimately failed at 62 kN. In the case of specimen N-tr, the first crack appeared at 31 kN, about 62% of its ultimate load (Pu), and was located at the bottom of the tensile zone. As the load increased, the crack widened and progressed toward the loading cell. In addition, a crack developed at the interface of the connecting region (see Figure 5b). The specimen failed at 50 kN. For specimen N-rec, initial cracking occurred at 35 kN, around 58% of its Pu. The superior stress transfer characteristic of this connection type delayed crack initiation compared to other connection types. Two major cracks originating from the bottom tensile zone advanced toward the loading cell as the load increased. Specimen N-cr exhibited an earlier onset of the first crack at 29 kN, about 56% of its ultimate load, compared to other connection types. As shown in Figure 5d, the crack developed at the interface of the connection, which became the weakest zone as the crack widened under an increased load.
As shown in Figure 6, beams with UHPECC demonstrated significantly improved failure patterns compared to beams in Group G-N. Small, tightly spaced hairline cracks appeared at the cracking load. For specimens U-10 and U-12, the initial cracks emerged at loads of 45 kN and 50 kN, respectively, representing increases of 41% and 56% compared to B0. At 70 kN, specimen U-12 exhibited some concrete spalling in the tensile zone. This group of beams showed the most significant improvement in failure pattern among all tested groups.
Similarly, the specimens in Group G-E displayed better failure patterns than B0. The first cracks appeared at 45 kN and 39 kN, which were 41% and 22% higher than B0, respectively. Numerous hairline cracks emerged around the major cracks near the interface, moving toward the loading cell as the load increased.
In Group G-RE, RECC-10 showed earlier crack initiation compared to B0. However, RECC-12 and RECC-16 experienced their first crack initiations at 35 kN and 38 kN, respectively, which were 9% and 19% higher than B0. The cracks near the tensile zone were wider, exposing some crumb rubber, as shown in Figure 8c. Similar to other ECC specimens, this group also exhibited a large number of tightly spaced hairline cracks, which can be attributed to the characteristics of ECC. Except for RECC-16, the other specimens in this group failed earlier than B0.

3.2. Cracking and Ultimate Load

From Table 4, it can be seen that the cracking load for specimen N-rec was 9% higher than that of B0, while N-tr and N-cr exhibited cracking loads that were 3% and 9% lower than B0, respectively. In terms of ultimate load, N-tr, N-rec, and N-cr displayed reductions of 19%, 3%, and 16% compared to B0. This analysis indicates that the rectangular connection configuration (N-rec) exhibited greater stiffness and strength among the three connection types. Examining the influence of different concrete types on cracking and ultimate loads, specimens in Group G-U, namely, U-10 and U-12, showed cracking loads that were 41% and 56% higher than B0, respectively. Their ultimate loads were 13% and 29% higher than B0. The superior compressive and tensile strengths of UHP-ECC significantly delayed crack propagation, resulting in higher cracking and ultimate loads. In Group G-E, the cracking loads for E-10 and E-12 were 41% and 22% higher than B0, respectively. In Group G-RE, specimens RECC-12 and RECC-16 had cracking loads that were 9% and 19% higher than B0. The ultimate loads for E-12 and RECC-16 were 5% and 2% higher than B0, respectively, while other specimens within these groups exhibited lower ultimate loads compared to B0. The analysis further revealed that increasing the diameter of the tensile reinforcement bars positively impacted both cracking and ultimate loads across all groups. For instance, in Group G-U, increasing the bar diameter from 10 mm to 12 mm resulted in a 15% increase in cracking load and a 16% increase in ultimate load.

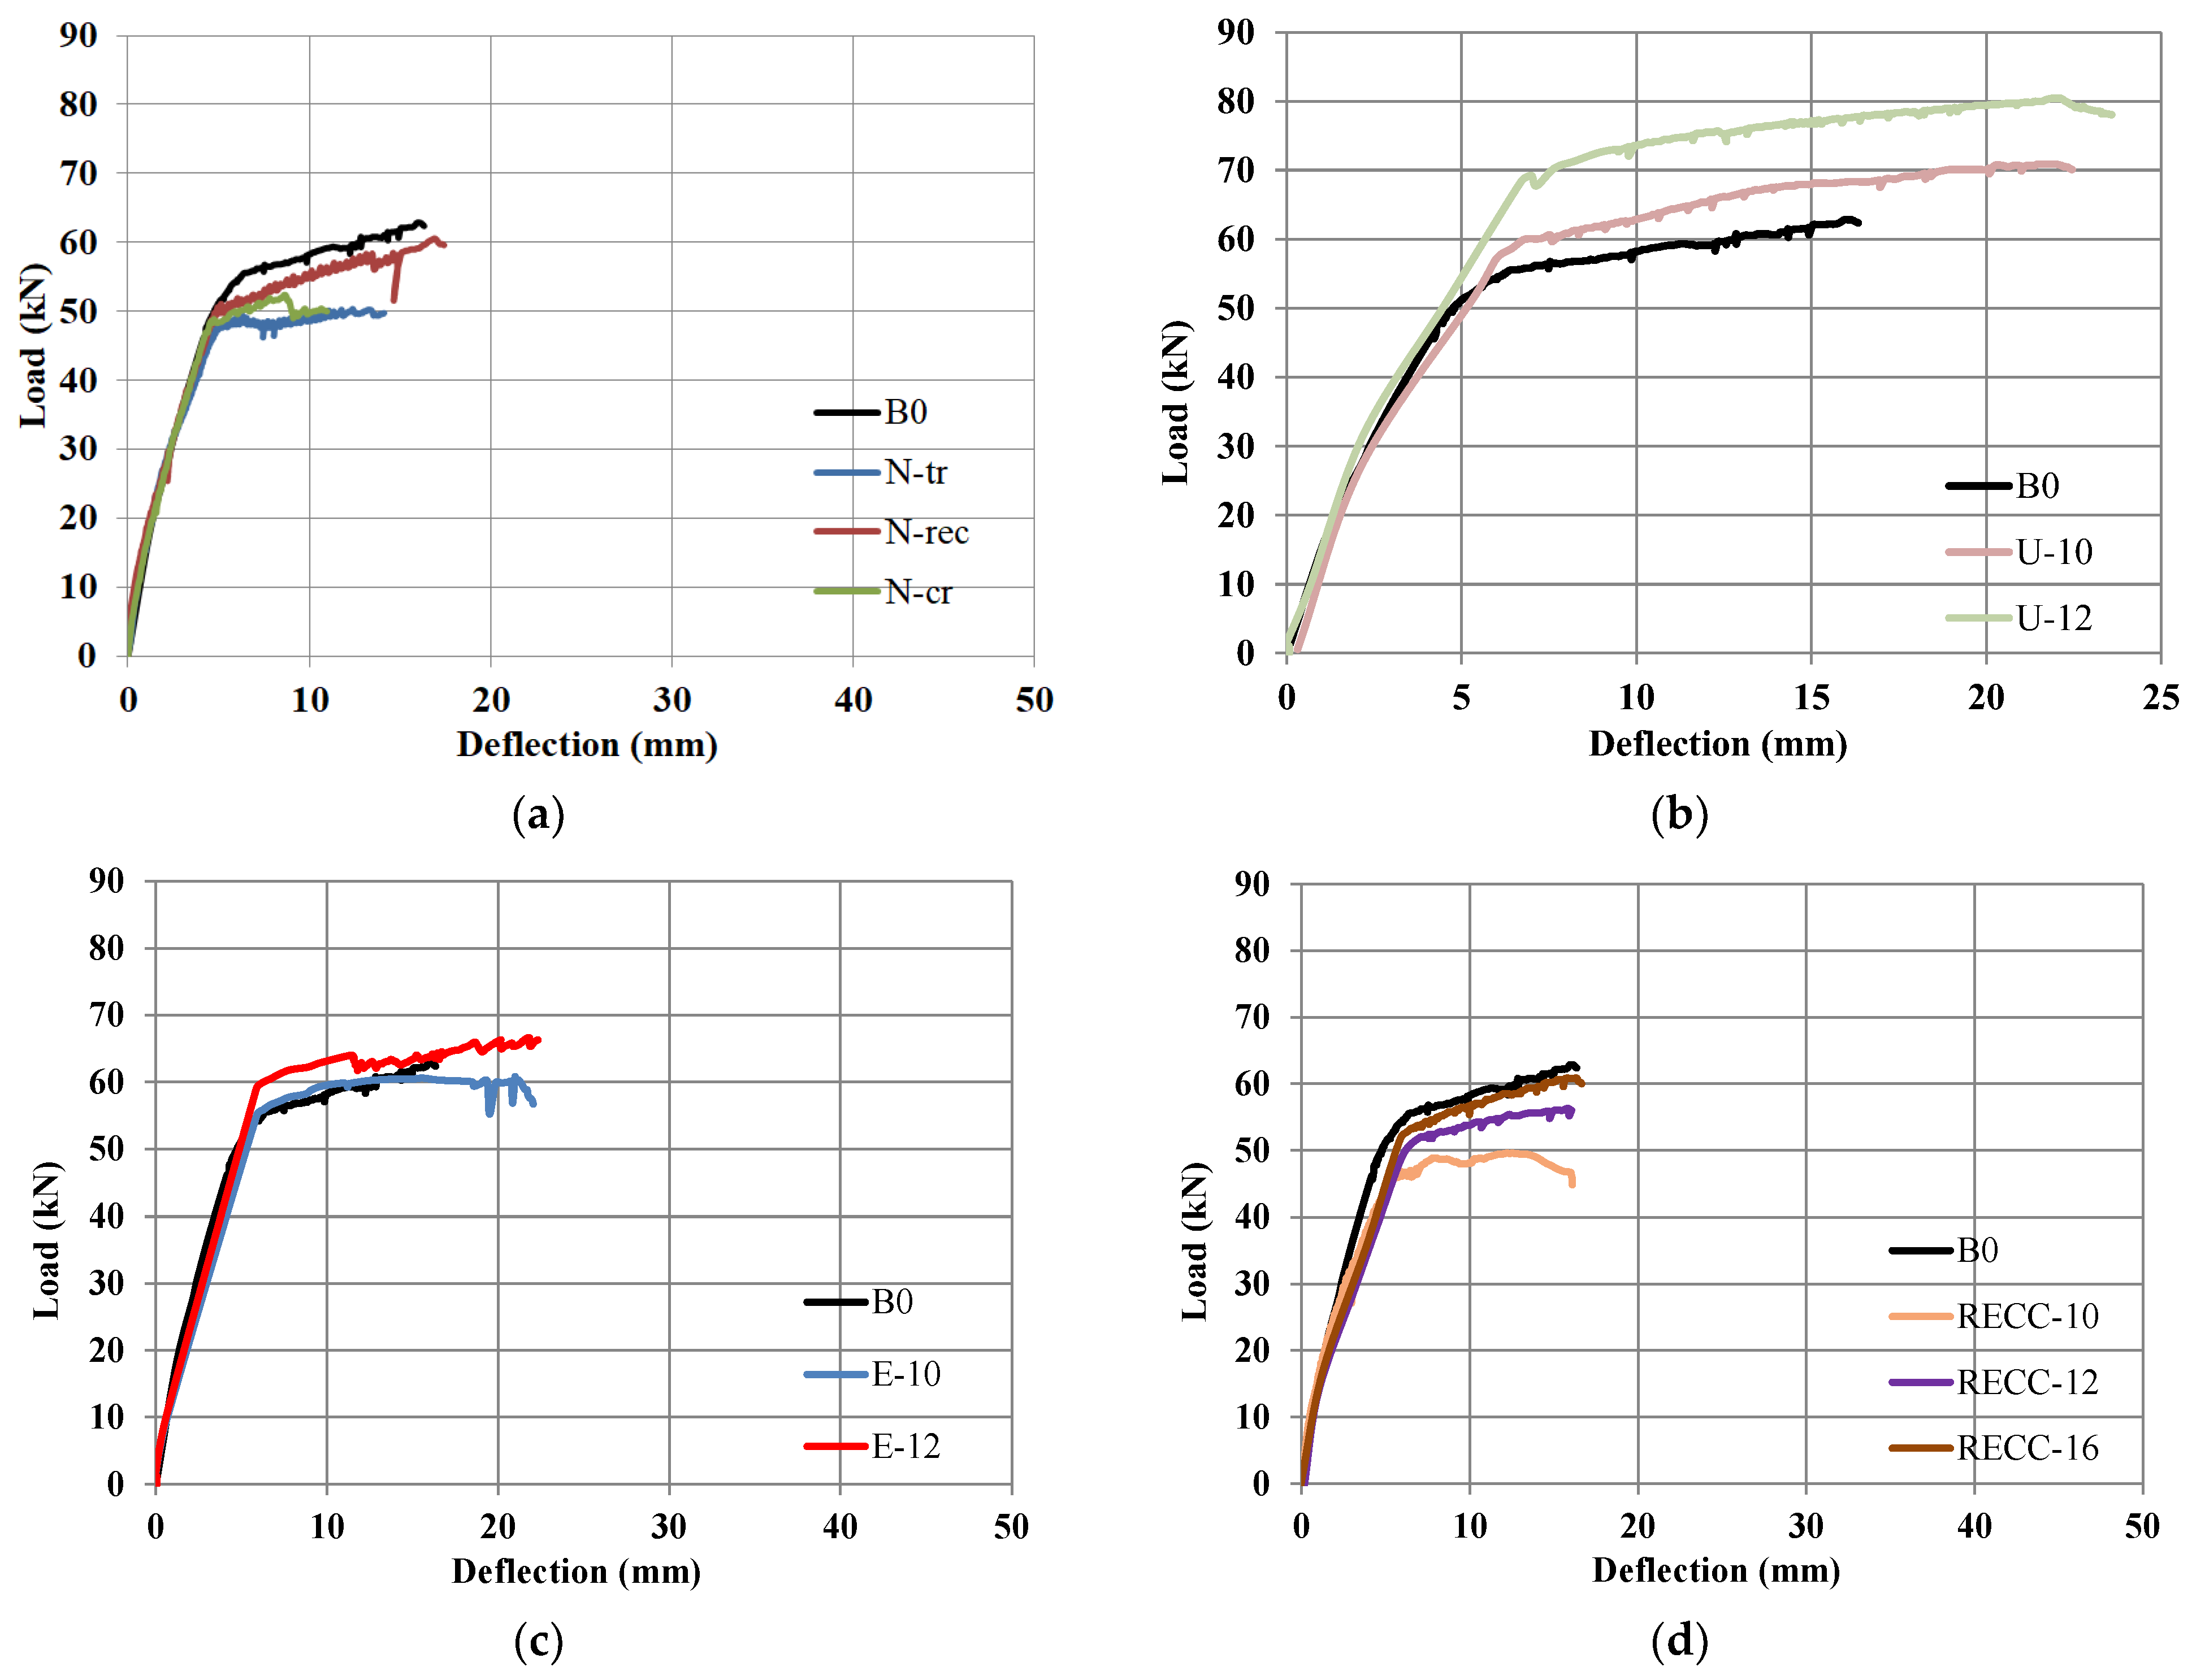
3.3. Load-Displacement Curves

The load-displacement curves of the tested specimens, depicted in Figure 9, provide insights into the structural performance and behavior of samples under loading. The initial stiffness in the load-displacement curves appears to be minimally affected by the different connection configurations. Specifically, the beam with the rectangular intermediate connection (N-rec) demonstrated a strain-hardening behavior similar to the reference beam, B0. This similarity can be attributed to the comparable stress distribution observed in beams with rectangular intermediate connections and normal beams. For beam N-tr, the load-displacement relationship flattened significantly after reaching the peak load, indicating a reduction in load-carrying capacity post-peak. In contrast, beam N-cr exhibited limited strain hardening, followed by a sudden drop in load, as shown in Figure 9a. This sudden drop suggests a brittle failure mode, likely due to the weak interface at the connection. When examining the effects of UHPECC as the fill material, beam U-12 displayed superior ductility compared to U-10. This superior ductility can be attributed to the capability of U-12 to sustain the load for an additional 10 mm of deflection compared to U-10 after the peak load had dropped. This extended ductility is indicative of UHPECC’s enhanced tensile and compressive properties, which delay the onset of cracking and maintain structural integrity for a longer duration under increasing loads. In Group G-E, beam E-10 exhibited a flattening load-displacement curve before failure, suggesting a more gradual transition to collapse. The higher steel ratio in E-12 resulted in a higher load capacity and the sample exhibited strain-hardening behavior. This behavior indicates that E-12 could better resist deformation under loading conditions. However, the increase in ductility is not as significant as that seen in U-12, due to the lack of capability of E-12 to sustain the load for an additional significant amount of deflection, as seen in U-10. For beams in Group G-RE, an increase in the tensile bar diameter corresponded with an enhanced degree of strain hardening. This improvement is evident in specimens such as RECC-16, which exhibited a higher ultimate load compared to RECC-10 and RECC-12. The increased bar diameter provides greater resistance against tensile stresses, improving the overall structural performance. The increase in the ultimate load, elastic stiffness, and energy absorption capacity due to the increase in the bar diameter offers economic benefits by allowing an additional external load to be carried out by the PRRC beams.

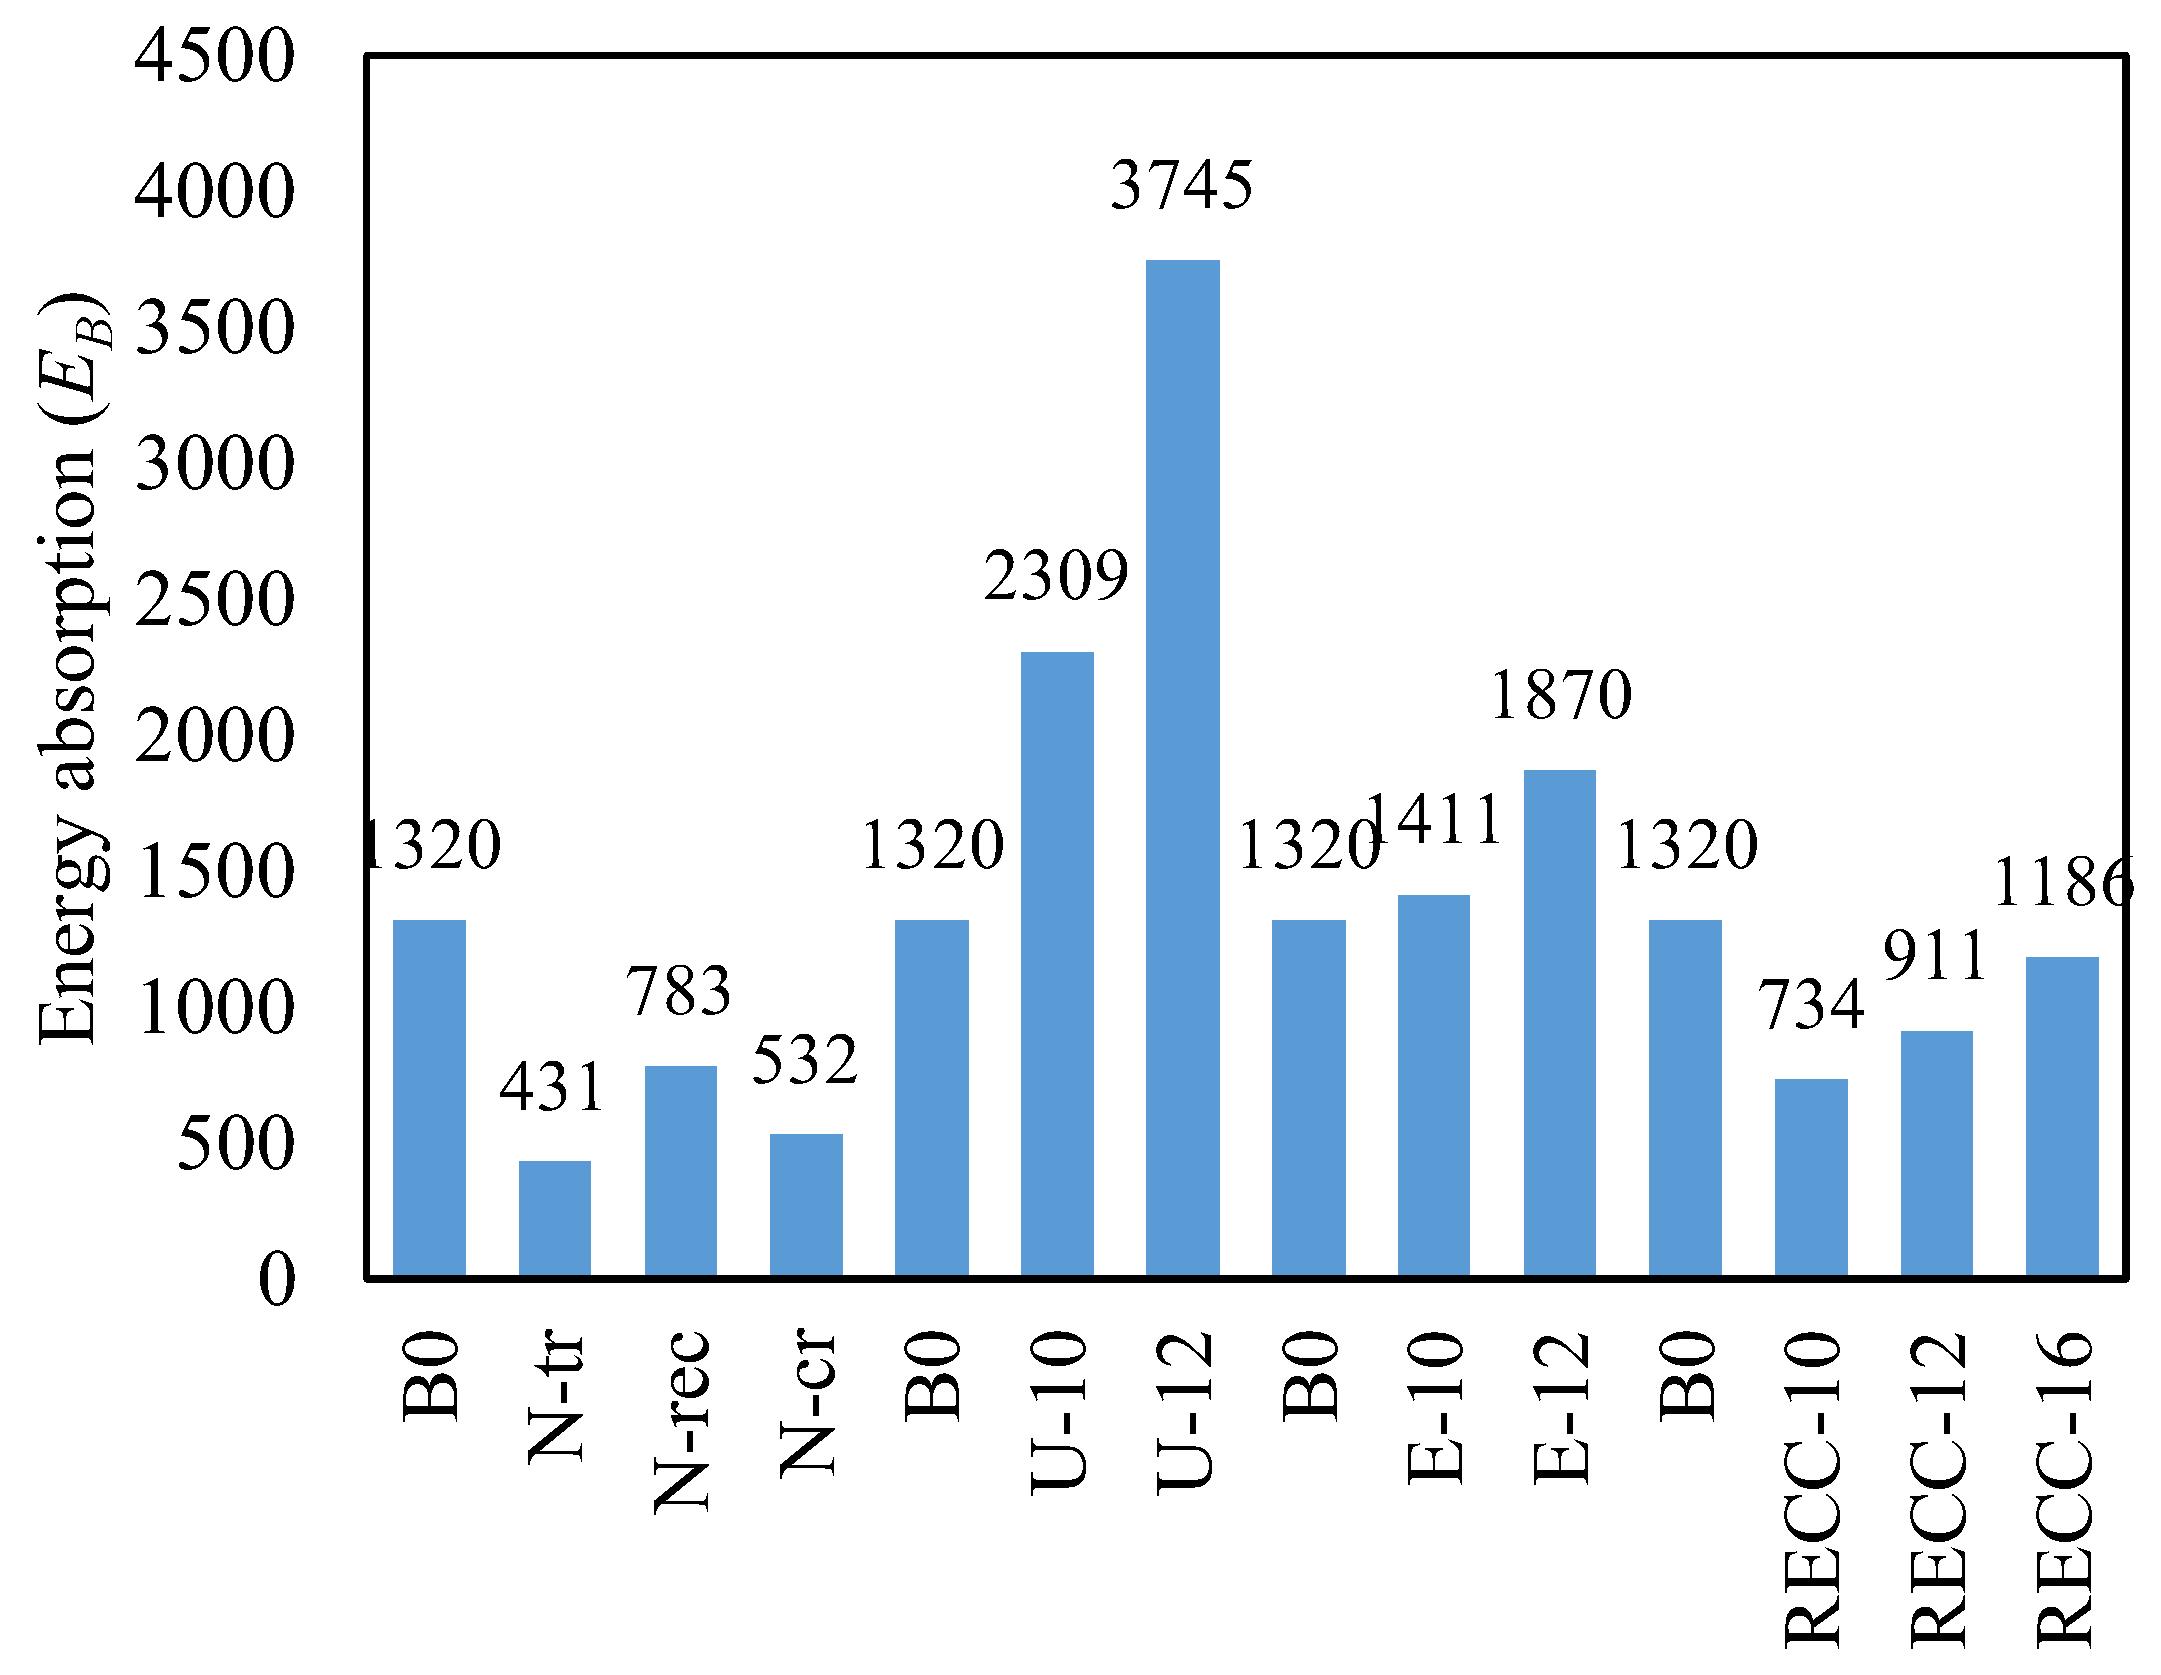
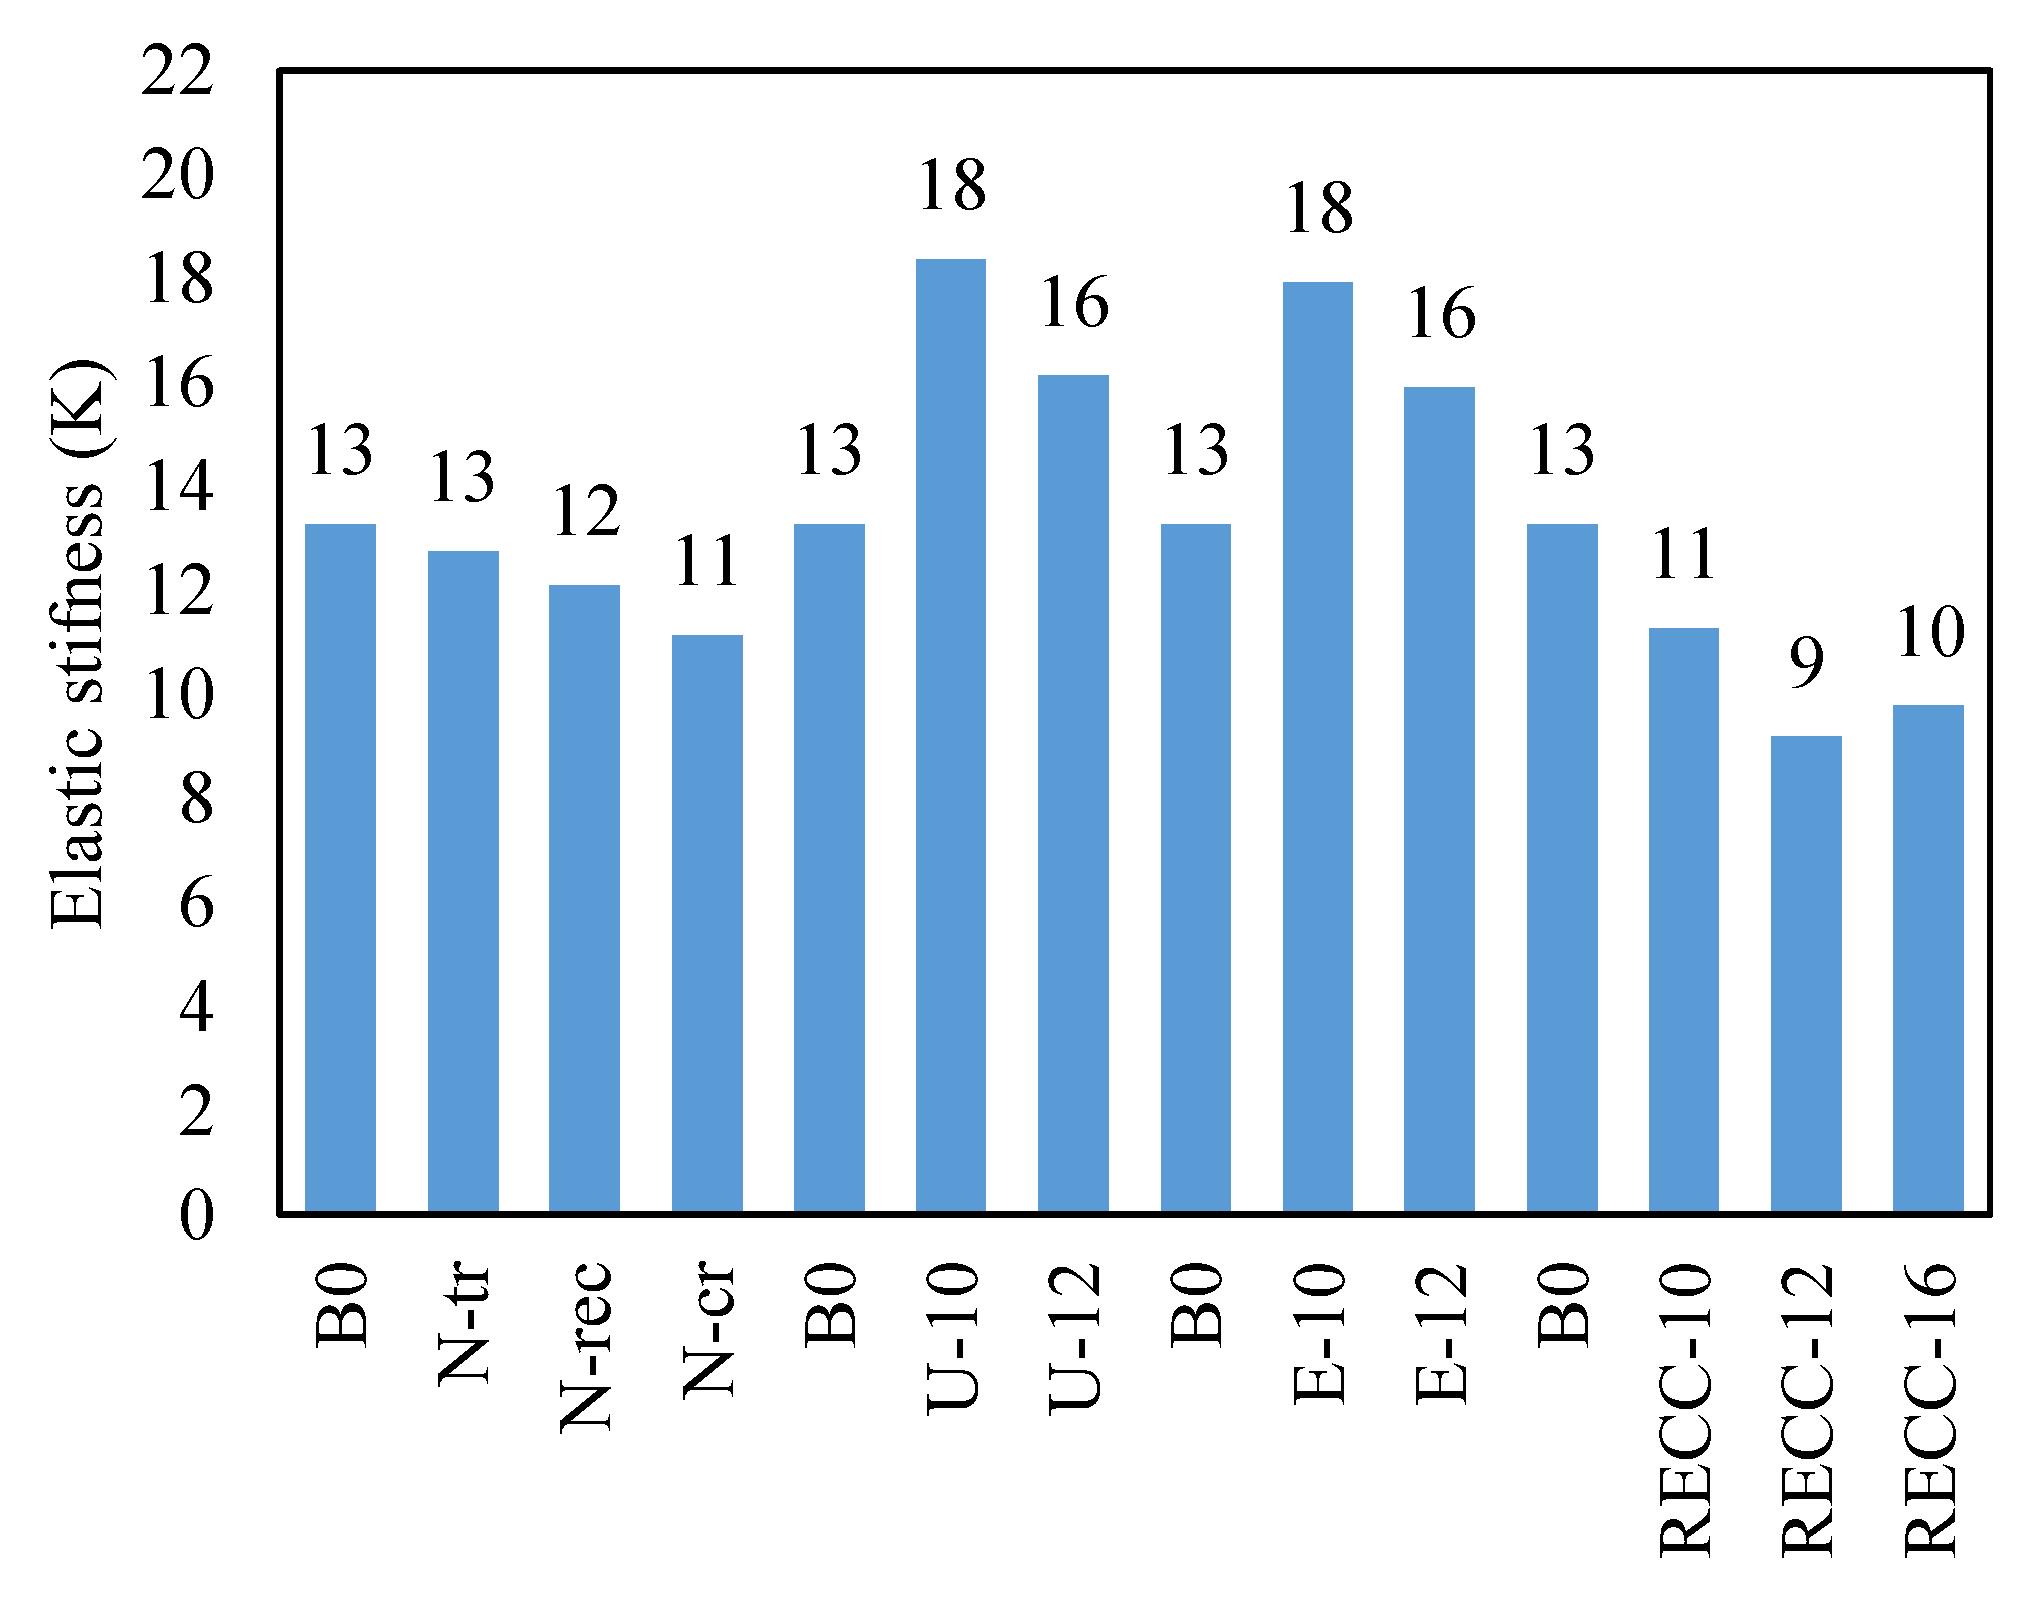
3.4. Energy Absorption Capacity and Elastic Stiffness

Energy absorption capacity, calculated as the area under the load-displacement curves, indicates the ability of a specimen to absorb and dissipate energy during loading, as shown in Figure 10. This parameter is crucial for evaluating the toughness and ductility of structural elements. For specimens in Group G-N, the energy absorption capacities of N-tr, N-rec, and N-cr were significantly lower than that of the control beam B0, at 33%, 59%, and 40%, respectively. This reduced energy absorption suggests that the intermediate connection types in Group G-N are less effective in dissipating energy, resulting in a more brittle failure. Similarly, Group G-RE specimens exhibited lower energy absorption capacities compared to B0. Specifically, RECC-10, RECC-12, and RECC-16 absorbed 56%, 69%, and 90% of the energy absorbed by B0, respectively. The reduced energy absorption in these specimens highlights the limited ductility and energy dissipation capabilities of rubberized ECC under loading. Conversely, the specimens filled with UHPCECC in Group G-U showed significant improvements in energy absorption. U-10 and U-12 exhibited energy absorption increases of 75% and 184%, respectively, compared to B0. This substantial enhancement can be attributed to the superior mechanical properties of UHPCECC, which provide greater resistance to crack propagation and allow for higher energy dissipation.
Elastic stiffness, calculated as the slope of the initial linear portion of the load-displacement curve, reflects the specimen’s resistance to elastic deformation under loading and is shown in Figure 11. In Group G-N, the elastic stiffness values of N-tr, N-rec, and N-cr were 4%, 9%, and 16% lower than that of B0, respectively. This reduction indicates that these intermediate connection shapes offer less resistance to initial deformation, leading to a more flexible response under loading. For specimens in Group G-RE, the elastic stiffness values of RECC-10, RECC-12, and RECC-16 were 15%, 31%, and 26% lower than that of B0, respectively. The decreased stiffness in these specimens suggests that rubberized ECC reduces the overall rigidity of the beams, resulting in greater initial deformation under load. In contrast, the specimens filled with UHPCECC in Group G-U showed higher elastic stiffness compared to B0. U-10 and U-12 exhibited increases of 38% and 21% in elastic stiffness, respectively. The higher stiffness in these specimens is attributed to the superior mechanical properties of UHPCECC, which enhance the specimen’s resistance to initial deformation. Similarly, in Group G-E, specimens E-10 and E-12 exhibited increases in elastic stiffness of 35% and 20%, respectively, compared to B0. The higher stiffness in these specimens is due to the increased tensile bar diameter and the mechanical properties of ECC, which provide greater resistance to elastic deformation.

4. Finite Element Simulation

A three-dimensional (3D) finite element model (FEM) was developed using ABAQUS 14 software to simulate the experimental behavior of the tested specimens. The following section describes in detail the 3D modeling and materials modeling of the tested specimens. The accuracy of the FEM was validated against the experimental results.

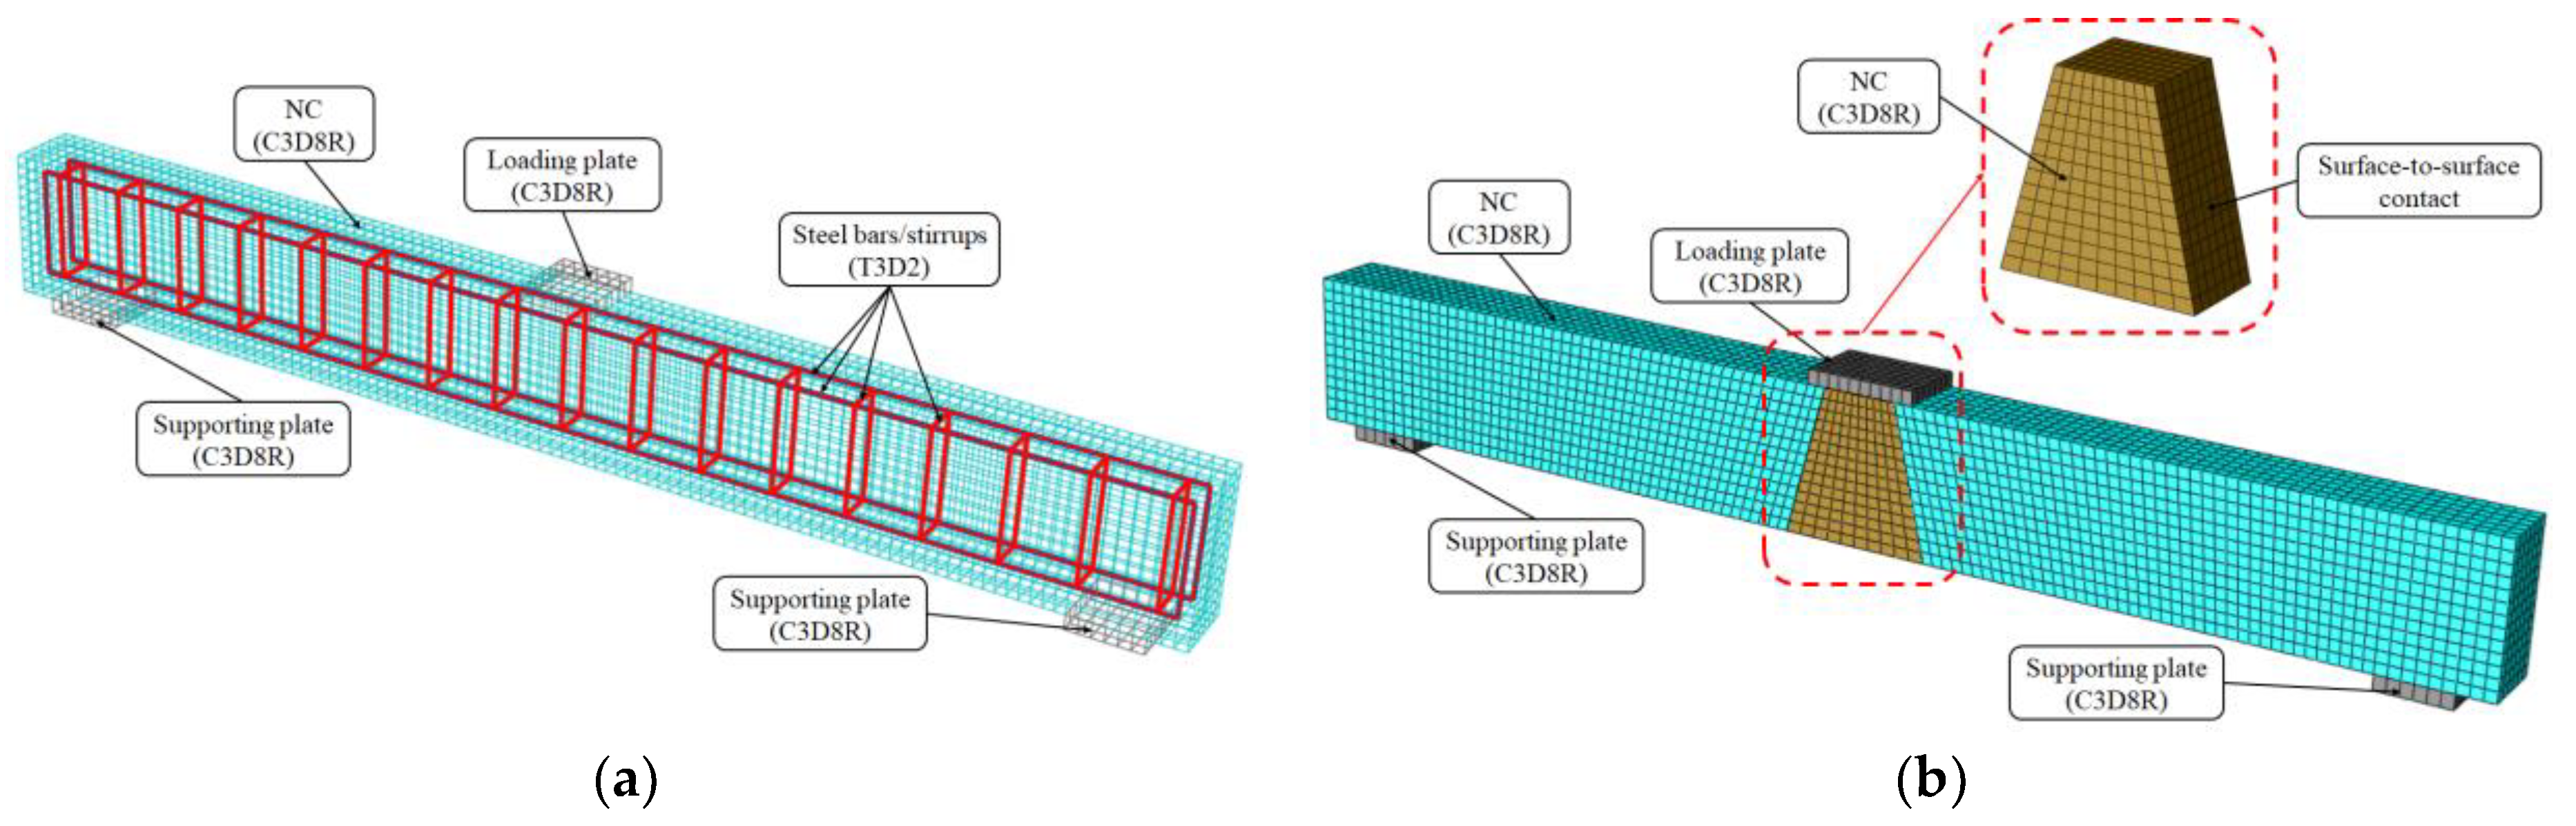
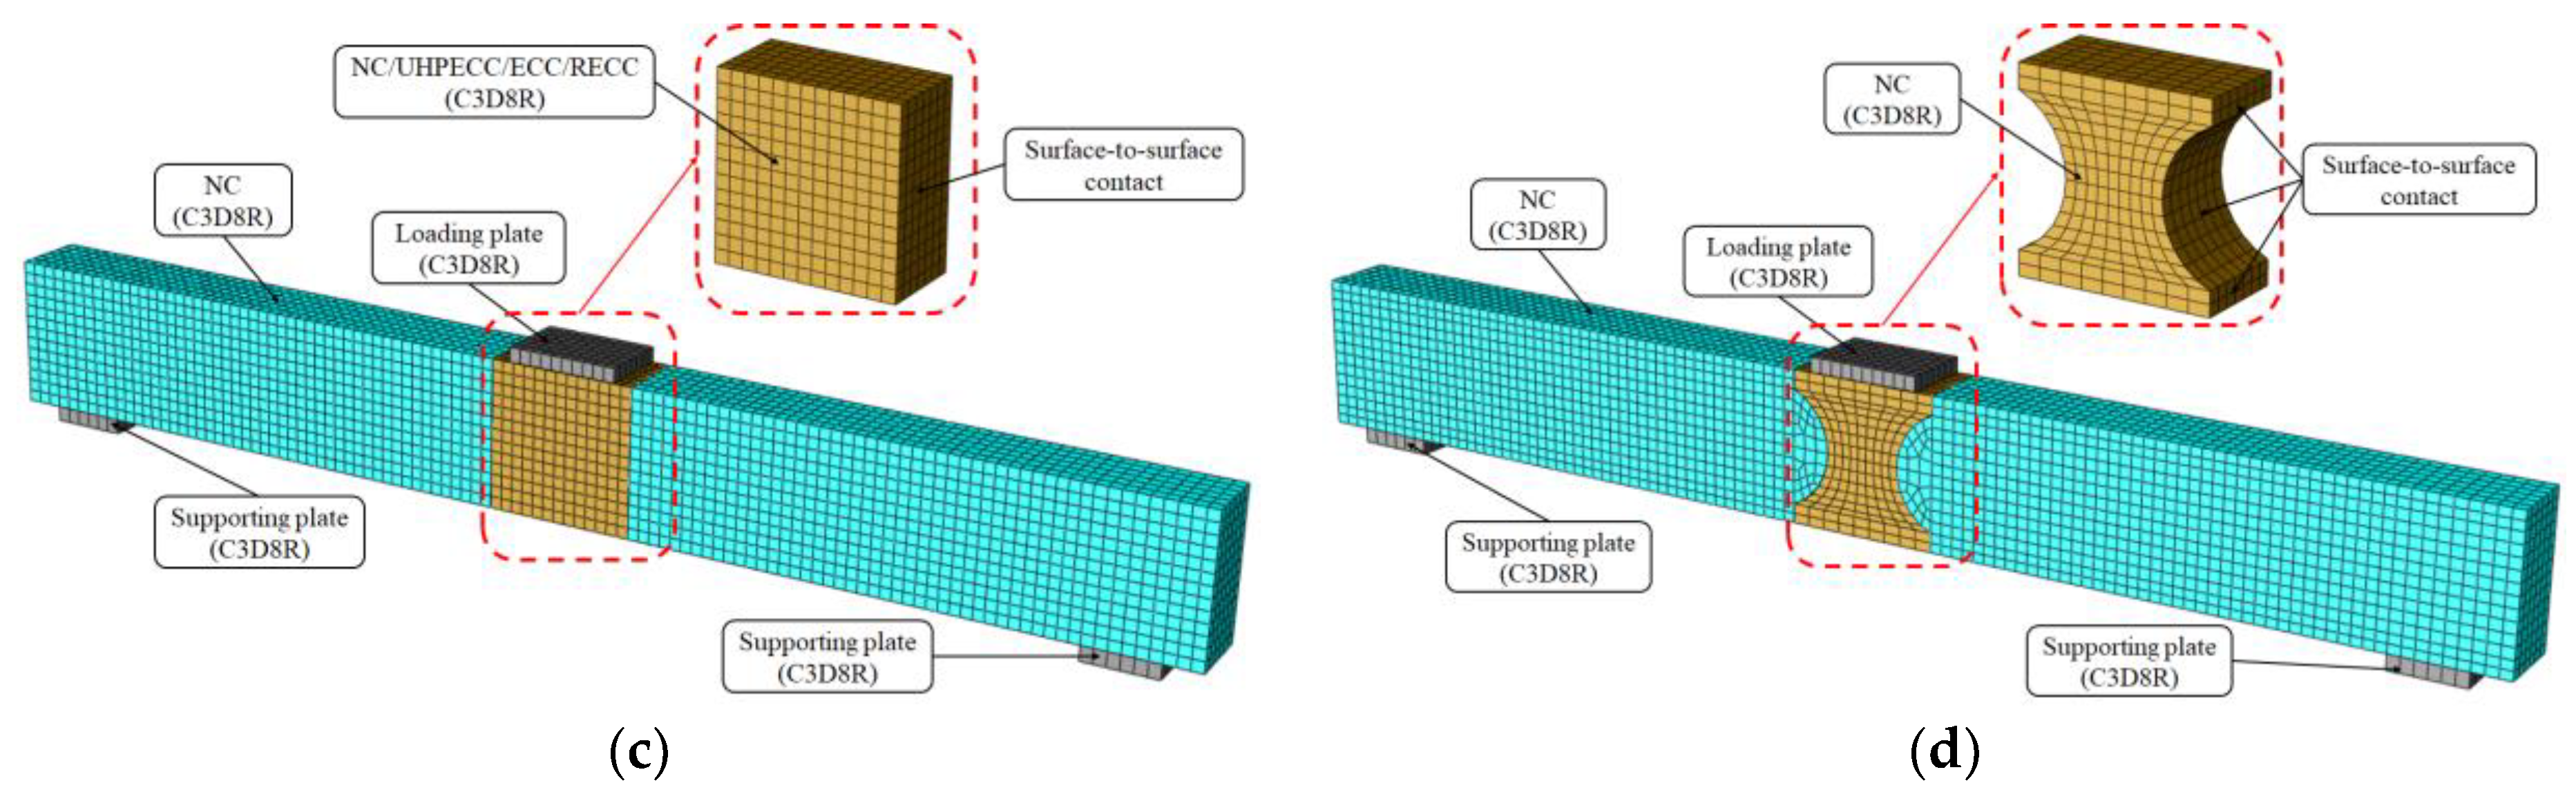
4.1. Model Built-Up, Interaction Properties, and Boundary Conditions

To accurately recreate the experimental conditions, the numerical simulation aimed to generate reliable results regarding the behavior of the investigated PRRC beams. Eight-node linear reduced integration solid elements (C3D8R) were utilized to model all the concrete components, including NC, ECC, UHPCECC, and RECC. These elements were chosen for their capability to capture the complex nonlinearities of concrete under various loading conditions. Two-node linear 3D truss elements (T3D2) were employed to simulate the steel reinforcement bars and stirrups. This element type accurately models the uniaxial behavior of steel, including both tensile and compressive responses. A three-point loading scheme was implemented in the FEM model to replicate the experimental setup. The load was applied through a reference point linked to a rigid loading plate, which mirrored the setup used in the physical experiments (see Figure 12). The boundary conditions that were applied accurately replicated the experimental constraints (pinned support) by preventing vertical movement but allowing rotational moment. Boundary conditions were applied to the reference points attached to the loading plates through coupling constraints.
The interaction between the concrete and its steel reinforcement was modeled using an embedded-region approach. In this model, concrete was considered as the host material, with steel reinforcement embedded within it. This modeling approach realistically captures the bond behavior between concrete and steel, which is crucial for accurate load transfer and structural performance. For simulating the interactions between different concrete materials (NC/ECC, UHPECC, RECC), a surface-to-surface contact approach was used. A friction coefficient of 0.6 was applied in the tangential direction to account for frictional resistance during potential sliding between different concrete materials, based on a previous study of precast beams with intermediate connections, as carried out by the authors [29]. Hard contact was assumed in the normal direction to prevent material penetration, ensuring a realistic simulation of the material interactions. The adopted interaction modeling was found to accurately reflect the performance of precast beams with intermediate connections under flexural load, as carried out by the authors [29]. A full-bond condition was applied between the concrete beam and the loading and supporting plates. This modeling choice ensures a strong connection at these interfaces, allowing for accurate force transfer and reflecting the actual behavior of the structural elements during loading. Based on the sensitivity analysis illustrated in Figure 13, a mesh size of 15 mm was adopted for modeling the PRRC beams.

4.2. Constitutive Modeling of Materials

To accurately capture the complex non-linear behavior of NC, ECC, UHPECC, and RECC, the concrete damage plasticity (CDP) model was employed. This versatile model effectively simulates both the compressive and the tensile behavior of these diverse concrete materials. Numerical trials were carried out to optimize the constitutive parameters for the CDP model, encompassing various concrete types. The parameters explored included eccentricity, the ratio of biaxial to uniaxial compressive yield stresses, the angle of dilation, the ratio of the second stress invariant, and the viscosity parameter. While theoretical ranges and default values existed for some parameters, the trials revealed superior consistency with specific choices: 0.66 for the ratio of the second stress invariant, 1.16 for the yield stress ratio, and material-specific dilation angles (35° for ECC and UHPECC, 30° for RECC, and the default 25° for NC). Additionally, a non-viscous material assumption (μ = 0.0) proved sufficient, while the default eccentricity (e = 0.1) was maintained. These findings establish the optimal CDP model parameters for various concrete types, paving the way for accurate simulations of their behavior under diverse loading conditions.
Accurate materials laws are important for the accuracy of numerical modeling. For NC, the established compressive stress–strain relationship proposed by Carreira and Chu [30], as shown in Figure 2b and Equations (1)–(3), was used to calculate the stress–strain curves. Conversely, the stress–strain relationships proposed by Ge et al. [20] for UHPECC and ECC were calibrated with experimental results presented in Figure 2c,e. Moreover, the stress–strain relationship developed by Aslani [31] was employed to simulate the behavior of RECC, and Equations (4)–(9) were used to determine the full stress–strain relationship. A bi-linear elastic-plastic behavior model with hardening (Figure 2a) was utilized to represent the steel reinforcement bars and stirrups.
f c = f c β ε c ε c 0 β 1 + ε c ε c 0 β
f t = f t u 1.2 ε t ε t 0 0.2 ε t ε t 0 6   0 ε t ε t 0     f t u ε t ε t 0 1.25 ε t ε t 0 1 2 ε t ε t 0   ε t 0 ε t
Here, f c and ε c introduce both concrete stress and strain, respectively, while f c and ε c 0 refer to the peaked stress and strain, respectively. The value of β factor can be computed by Equation (3) with respect to the stress–strain development.
β = f c 32.4 + 1.55
σ c f c = ρ m ε c ε c ρ m 1 + ε c ε c ρ m
ρ m = 1.02 1.17 E p E c 0.74   ε c ε c   1.02 1.17 E p E c 0.74 + φ + k t   ε c ε c
φ = 35 × 12.4 1.66 × 10 2 f c 0.9
k = 0.75 × e 0.911 f c
E p = f c E c ν ν 1
ν = f c 17 + 0.8
Here, σ c is the concrete stress; f c is the maximum concrete compressive strength; ε c is concrete strain; ε c is the strain corresponding with the maximum stress f c ; E c is the concrete modulus of elasticity; E p is the secant modulus of elasticity; ρ m is the material parameter; φ and k are coefficients of the linear equation.

5. Validation of the FE Model
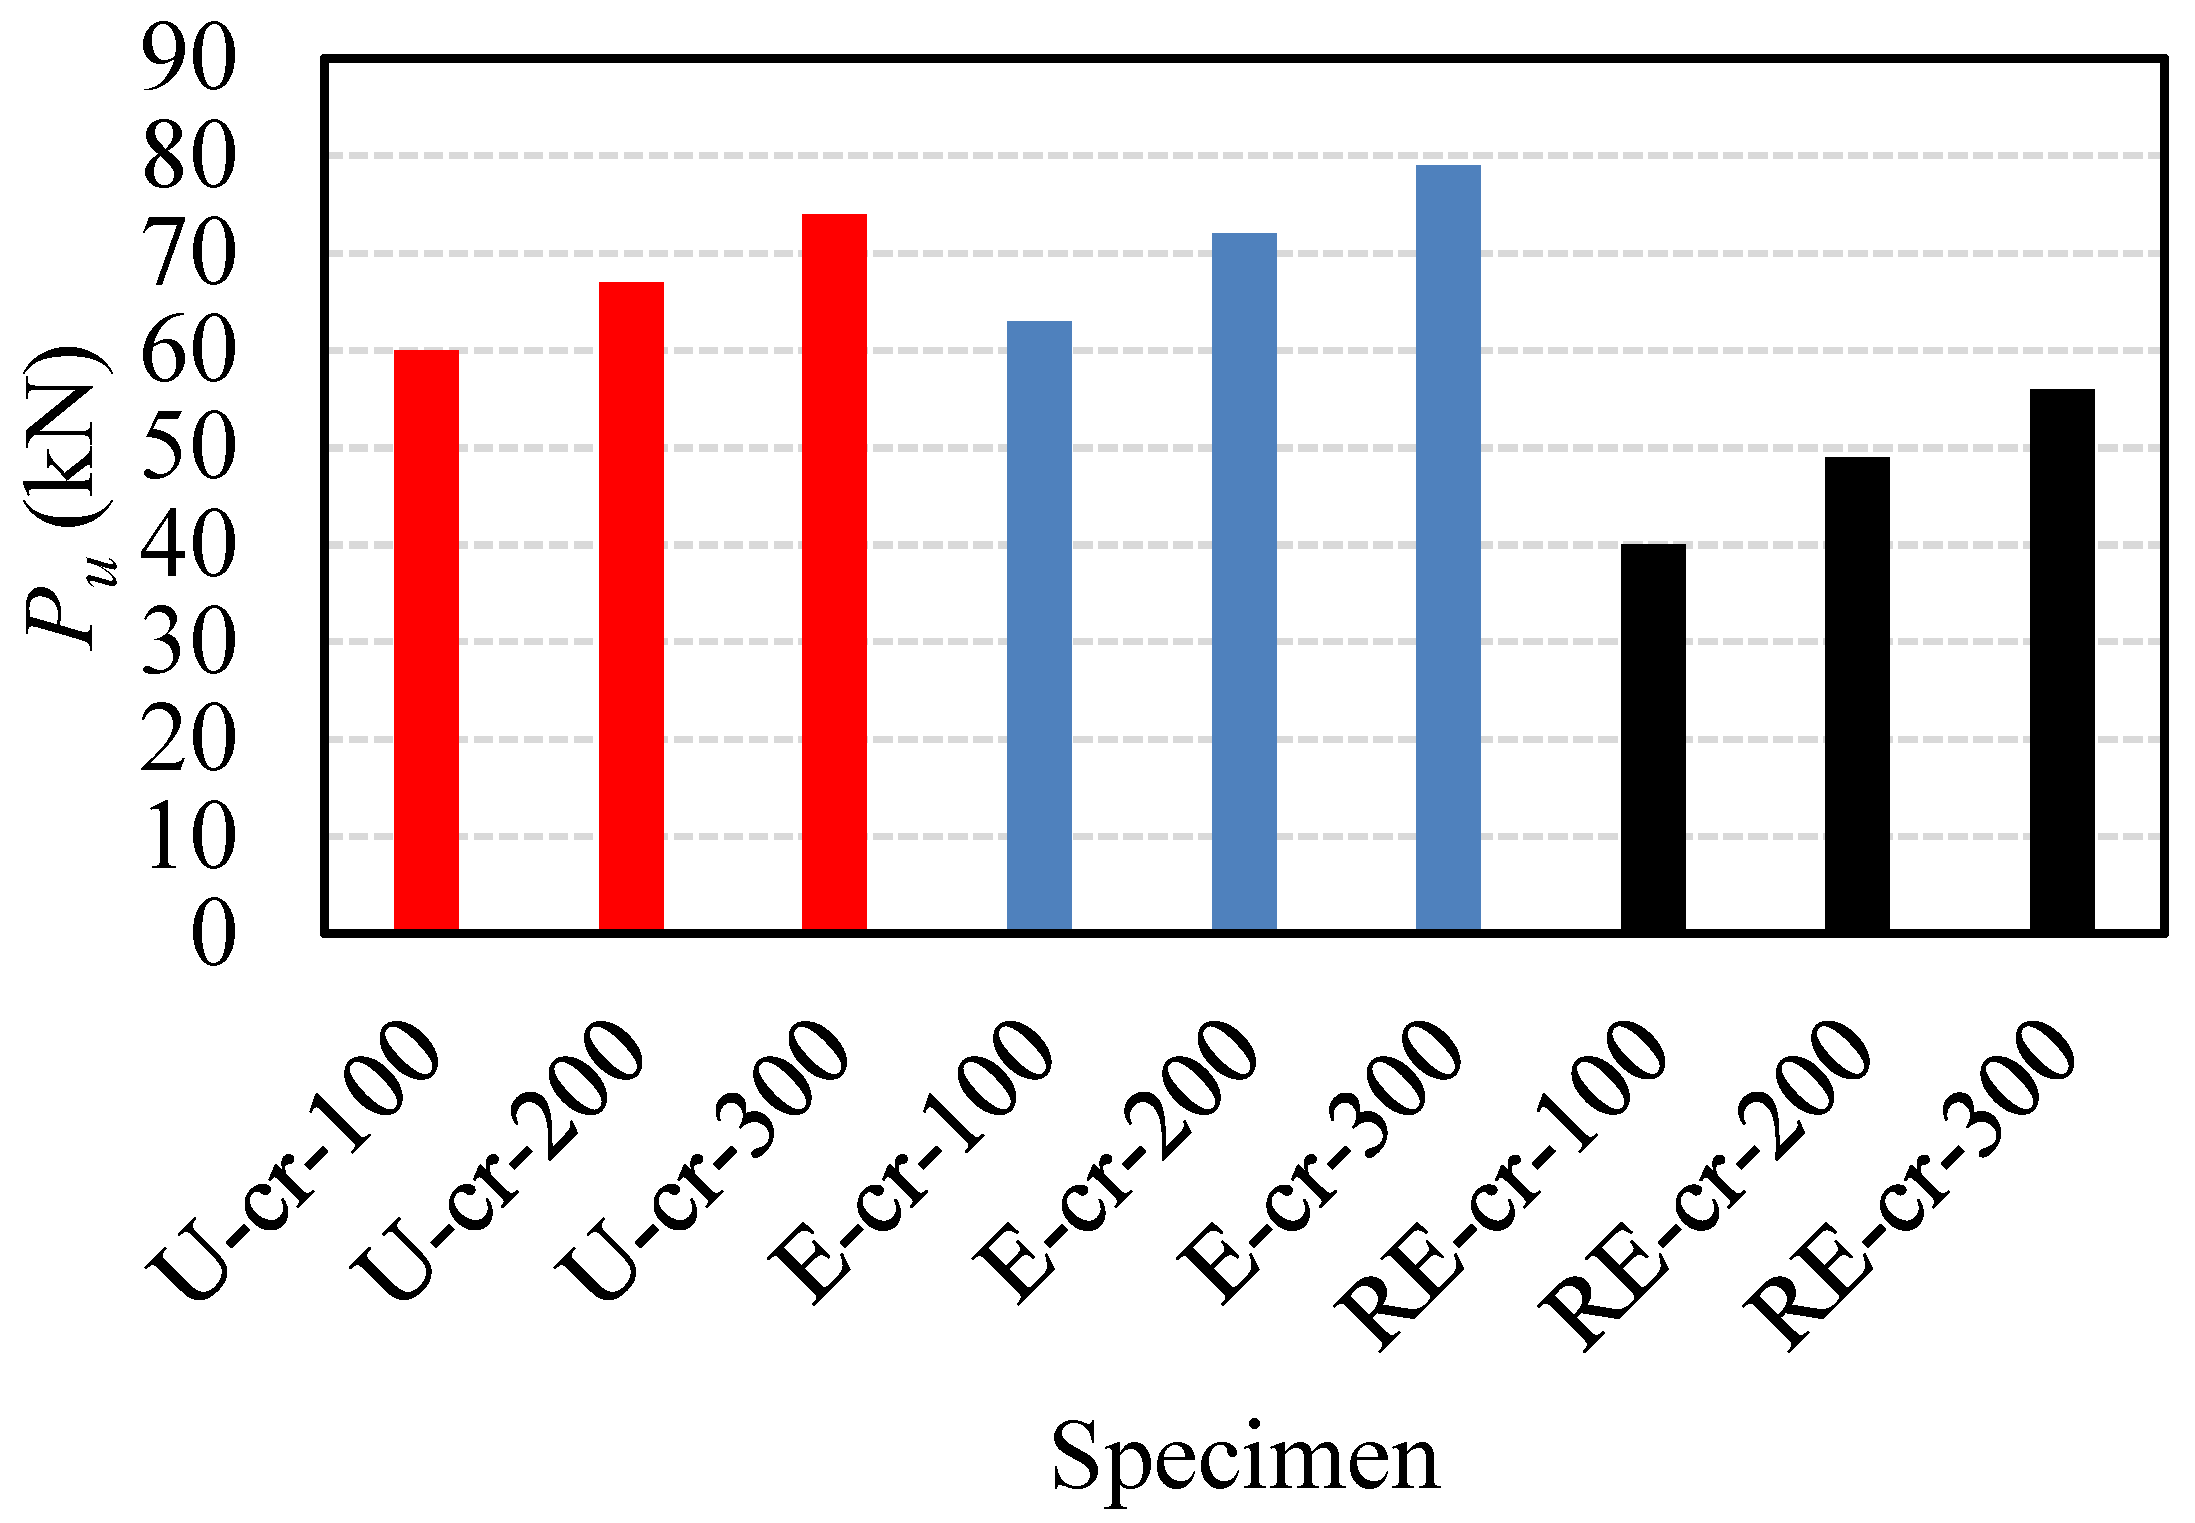
The accuracy of the finite element model (FEM) was validated against the experimental results obtained in this study. Table 5 provides a comprehensive comparison between the numerical results from the FEM and the experimental data. This comparison focuses on several critical parameters, including cracking load (Pcr), ultimate load (Pu), and their corresponding displacements (Δcr and Δu). At the cracking and ultimate stage, the average ratios between the prediction of the FEM and the experimental load are 1.052 and 1.045, respectively, with a standard deviation of 0.077 and 0.39. The accuracy of the FEM is further verified by comparing the predicted load-displacement relationships of the tested specimens with the experimental observations given in Figure 14. It is observed that there is a good match between the test and FEM predictions. The small difference between the test and observations can be attributed to the fact that average concrete strength was used for the predictions, which may be a little different from the actual strength of the beams. Furthermore, in Figure 15, the failure patterns of the tested beams and the FEM predictions are compared wherever a good agreement between the test and the predictions can be observed. It can be seen that the FEM can capture the highly stressed region of the specimens, which is consistent with the test observations.

6. Parametric Study

Following validation, the FEM was extended to conduct a parametric study to explore the influence of shape configuration (triangular, rectangular, and semi-circular) in the case of UHPECCC, ECC, and RECC-filled concrete. Table 6 lists the summary of the parameters of the analyzed beams. The effects of concrete types on the shapes of the intermediate connections are shown in Figure 16, where it is seen that when UHPECC was used, the rectangular-shaped intermediate connection resulted in a higher ultimate load than the other shapes, which is consistent with the NC performance observed in the test results. However, for intermediate connections filled with ECC and RECC, semi-circular-shaped connections provided higher strength, followed by rectangular- and triangular-shaped intermediate connections. When compared to the test results for N-tr, N-rec, and N-cr beams with NC reported in this study, it is evident that using UHPECC resulted in an increase in the ultimate load of N-tr, N-rec, and N-cr by 26%, 17%, and 29%, respectively. Similarly, for ECC-filled intermediate connections, N-tr, N-rec, and N-cr experienced an increase in their ultimate load by 4%, 0%, and 12%, respectively. However, when the intermediate connection was filled with RECC, the ultimate load of N-tr, N-rec, and N-cr decreased by 18%, 25%, and 17%, respectively, which is consistent with test observations.
Considering a semi-circular-shaped intermediate connection generally provides a higher ultimate load than triangular-shaped intermediate connections, this study further examines the effects of the length of intermediate connection of semi-circular-shaped configuration for various types of concrete used to fill the connections. As seen in Figure 17, increasing the length of the intermediate connection increased the ultimate load of the beams. Increasing the length of the intermediate connection from 100 to 200 and 300 mm resulted in an increase in the ultimate load by 12% and 23% for UHPECC, 14% and 25% for ECC, and 23% and 40% for RECC, respectively. Therefore, for connections filled with RECC, it is recommended that a greater length of intermediate connection should be used to improve the ultimate load of the beams.

7. Conclusions

This study presents experimental and numerical investigations into PRRC beams with an intermediate connection filled with NC, ECC, UHPECC, and RECC, which were subjected to flexural loading. The effects of different configurations and intermediate connections, namely, triangular, rectangular, or semi-circular connections, as well as the types of concrete used to fill the connection were examined. The results obtained from this study include the failure patterns of the beams, load-displacement curves, crack and ultimate load, elastic stiffness, and energy absorption capacities of the beams. A FEM was also developed and validated against the test data. A parametric study was carried out to explore the effects of the length of the intermediate connections and types of various concrete on the different shapes of connections.
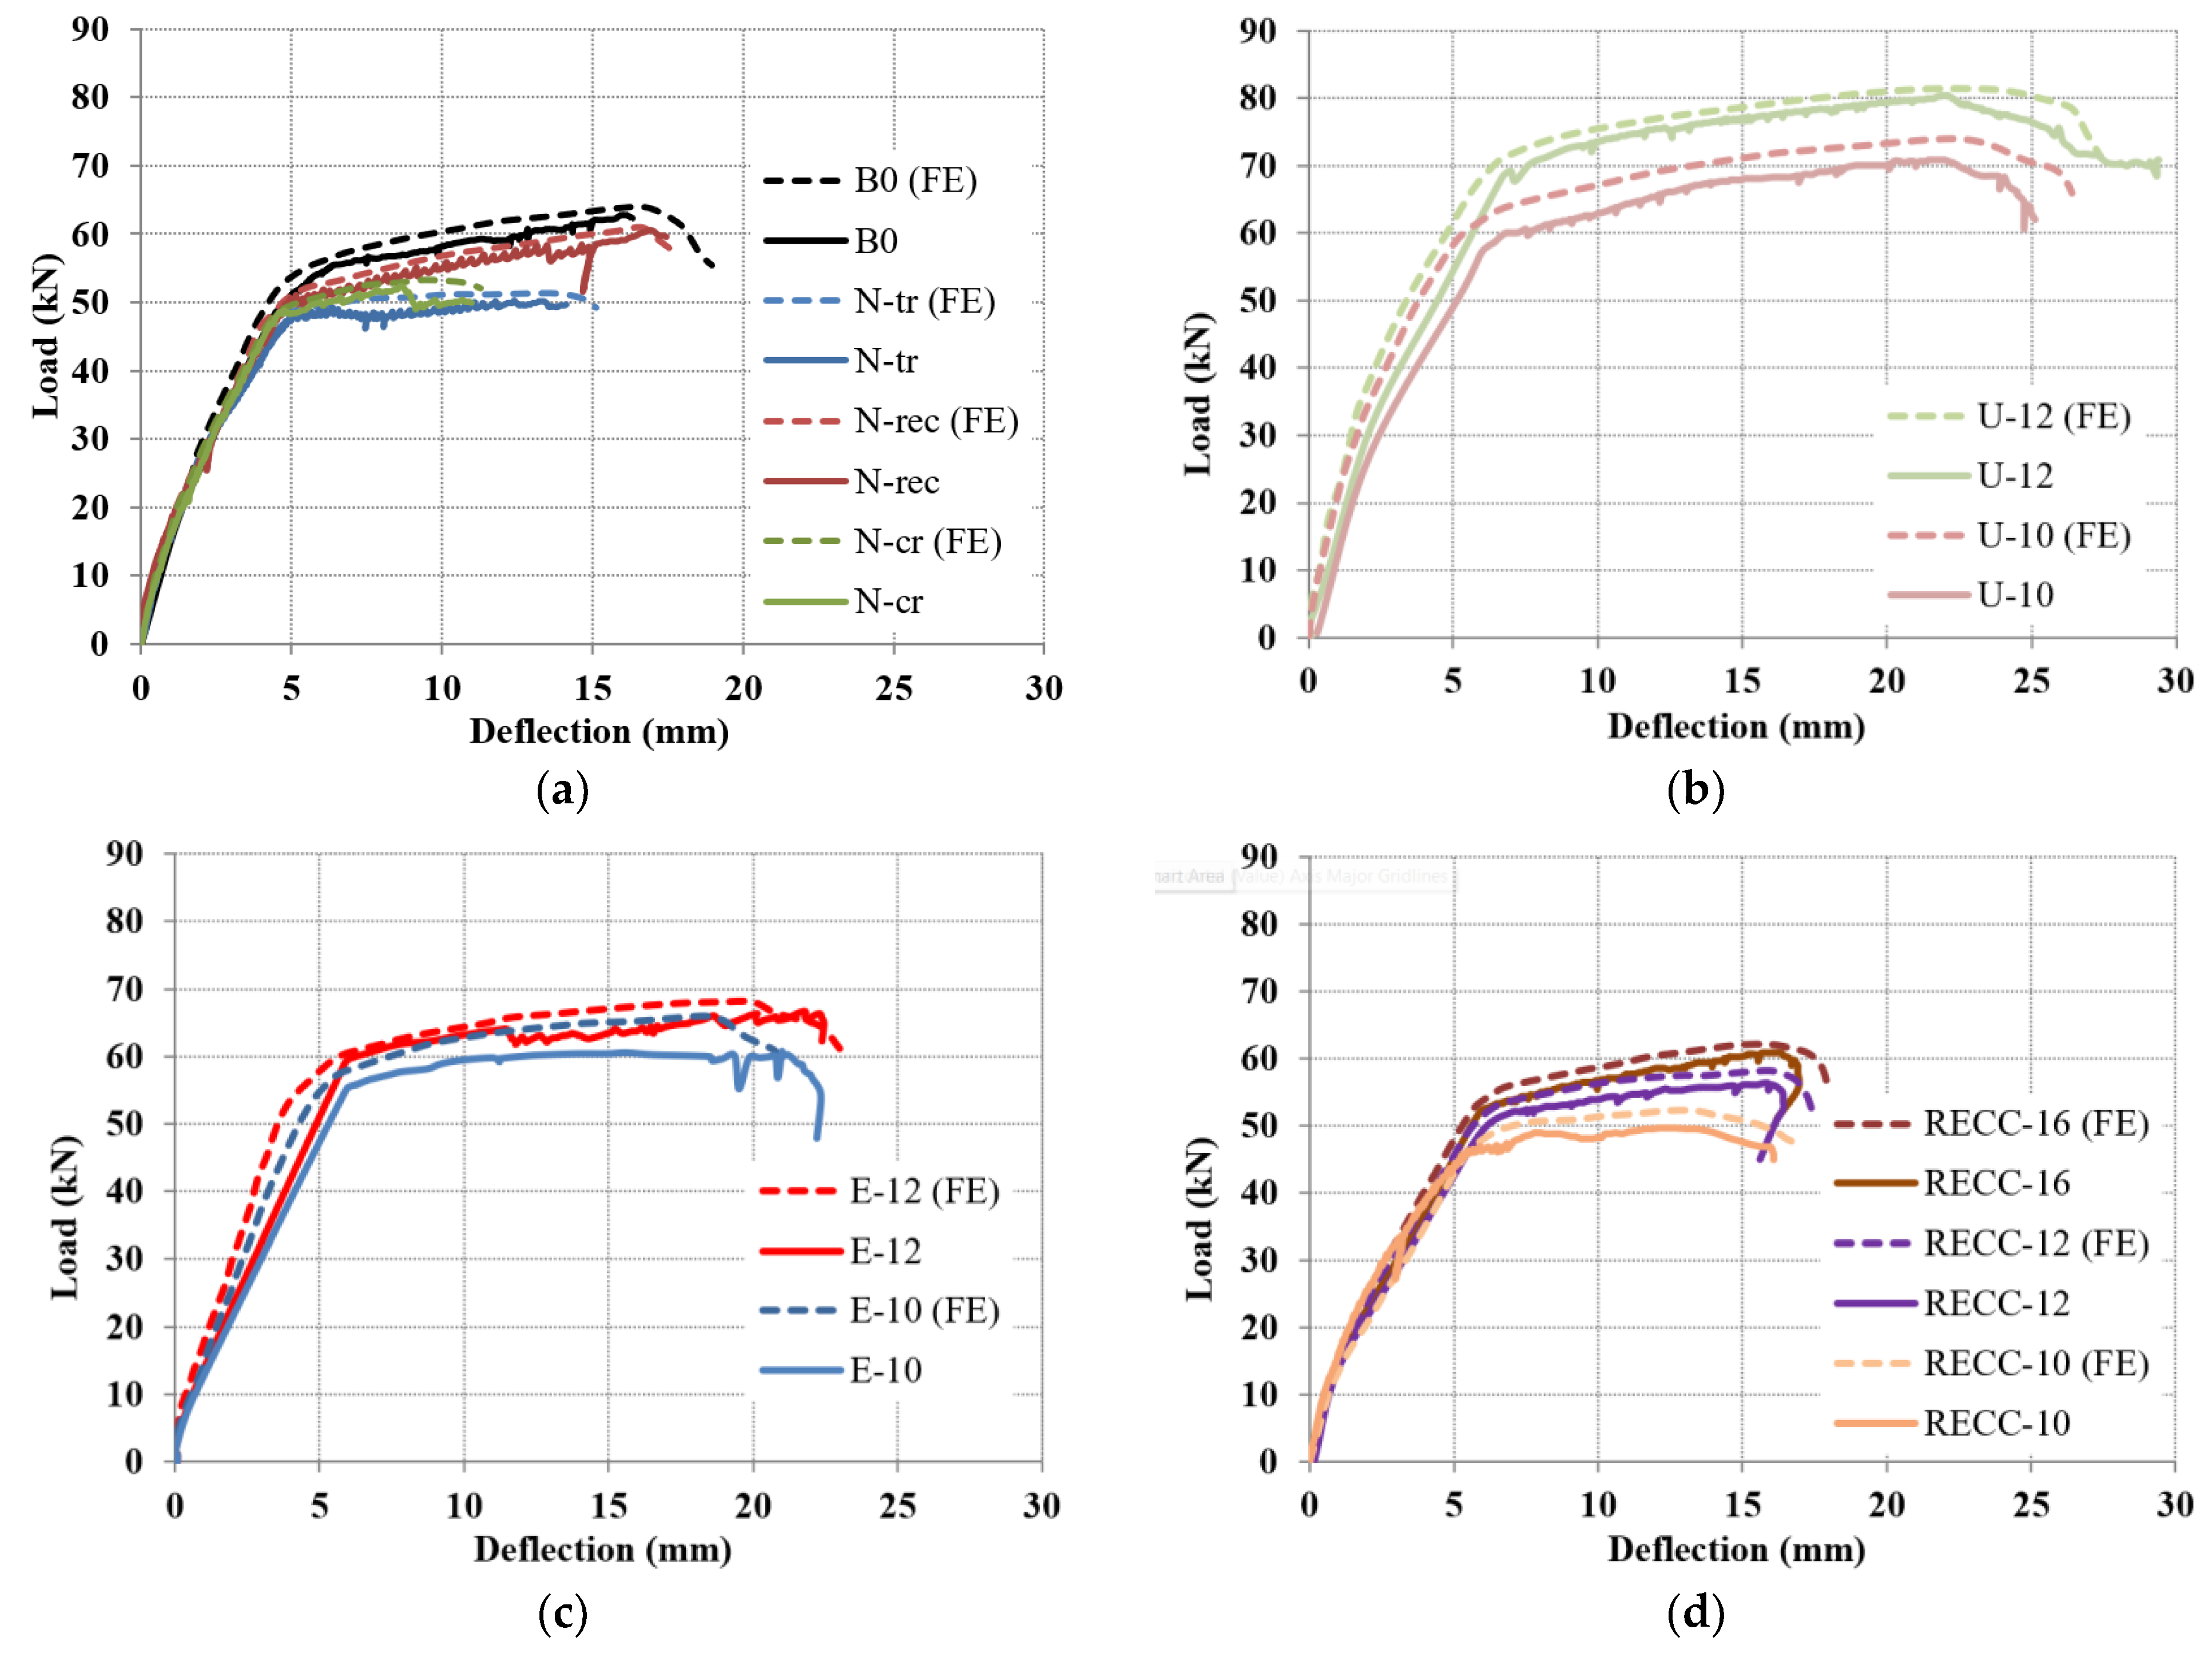
  • Test results showed that the rectangular-shaped intermediate connection provided a stiffer and stronger connection compared to the triangular and semi-circular types of intermediate connections. Moreover, by using HPC (UHPECC and ECC), the cracking and ultimate load were found to be higher than in the control beam. The ultimate load of the beams with UHPECC was found to be increased by 29% compared to the control beam.
  • The beams filled with UHPECC and ECC resulted in higher energy absorption. The increase in the energy absorptions of U-10, U-12, E-10, and E-12 was calculated as 75%, 184%, 7%, and 42%, respectively. The energy absorption capacity of the tested specimens increased with the increase in the tension bar diameter at the connecting zone.
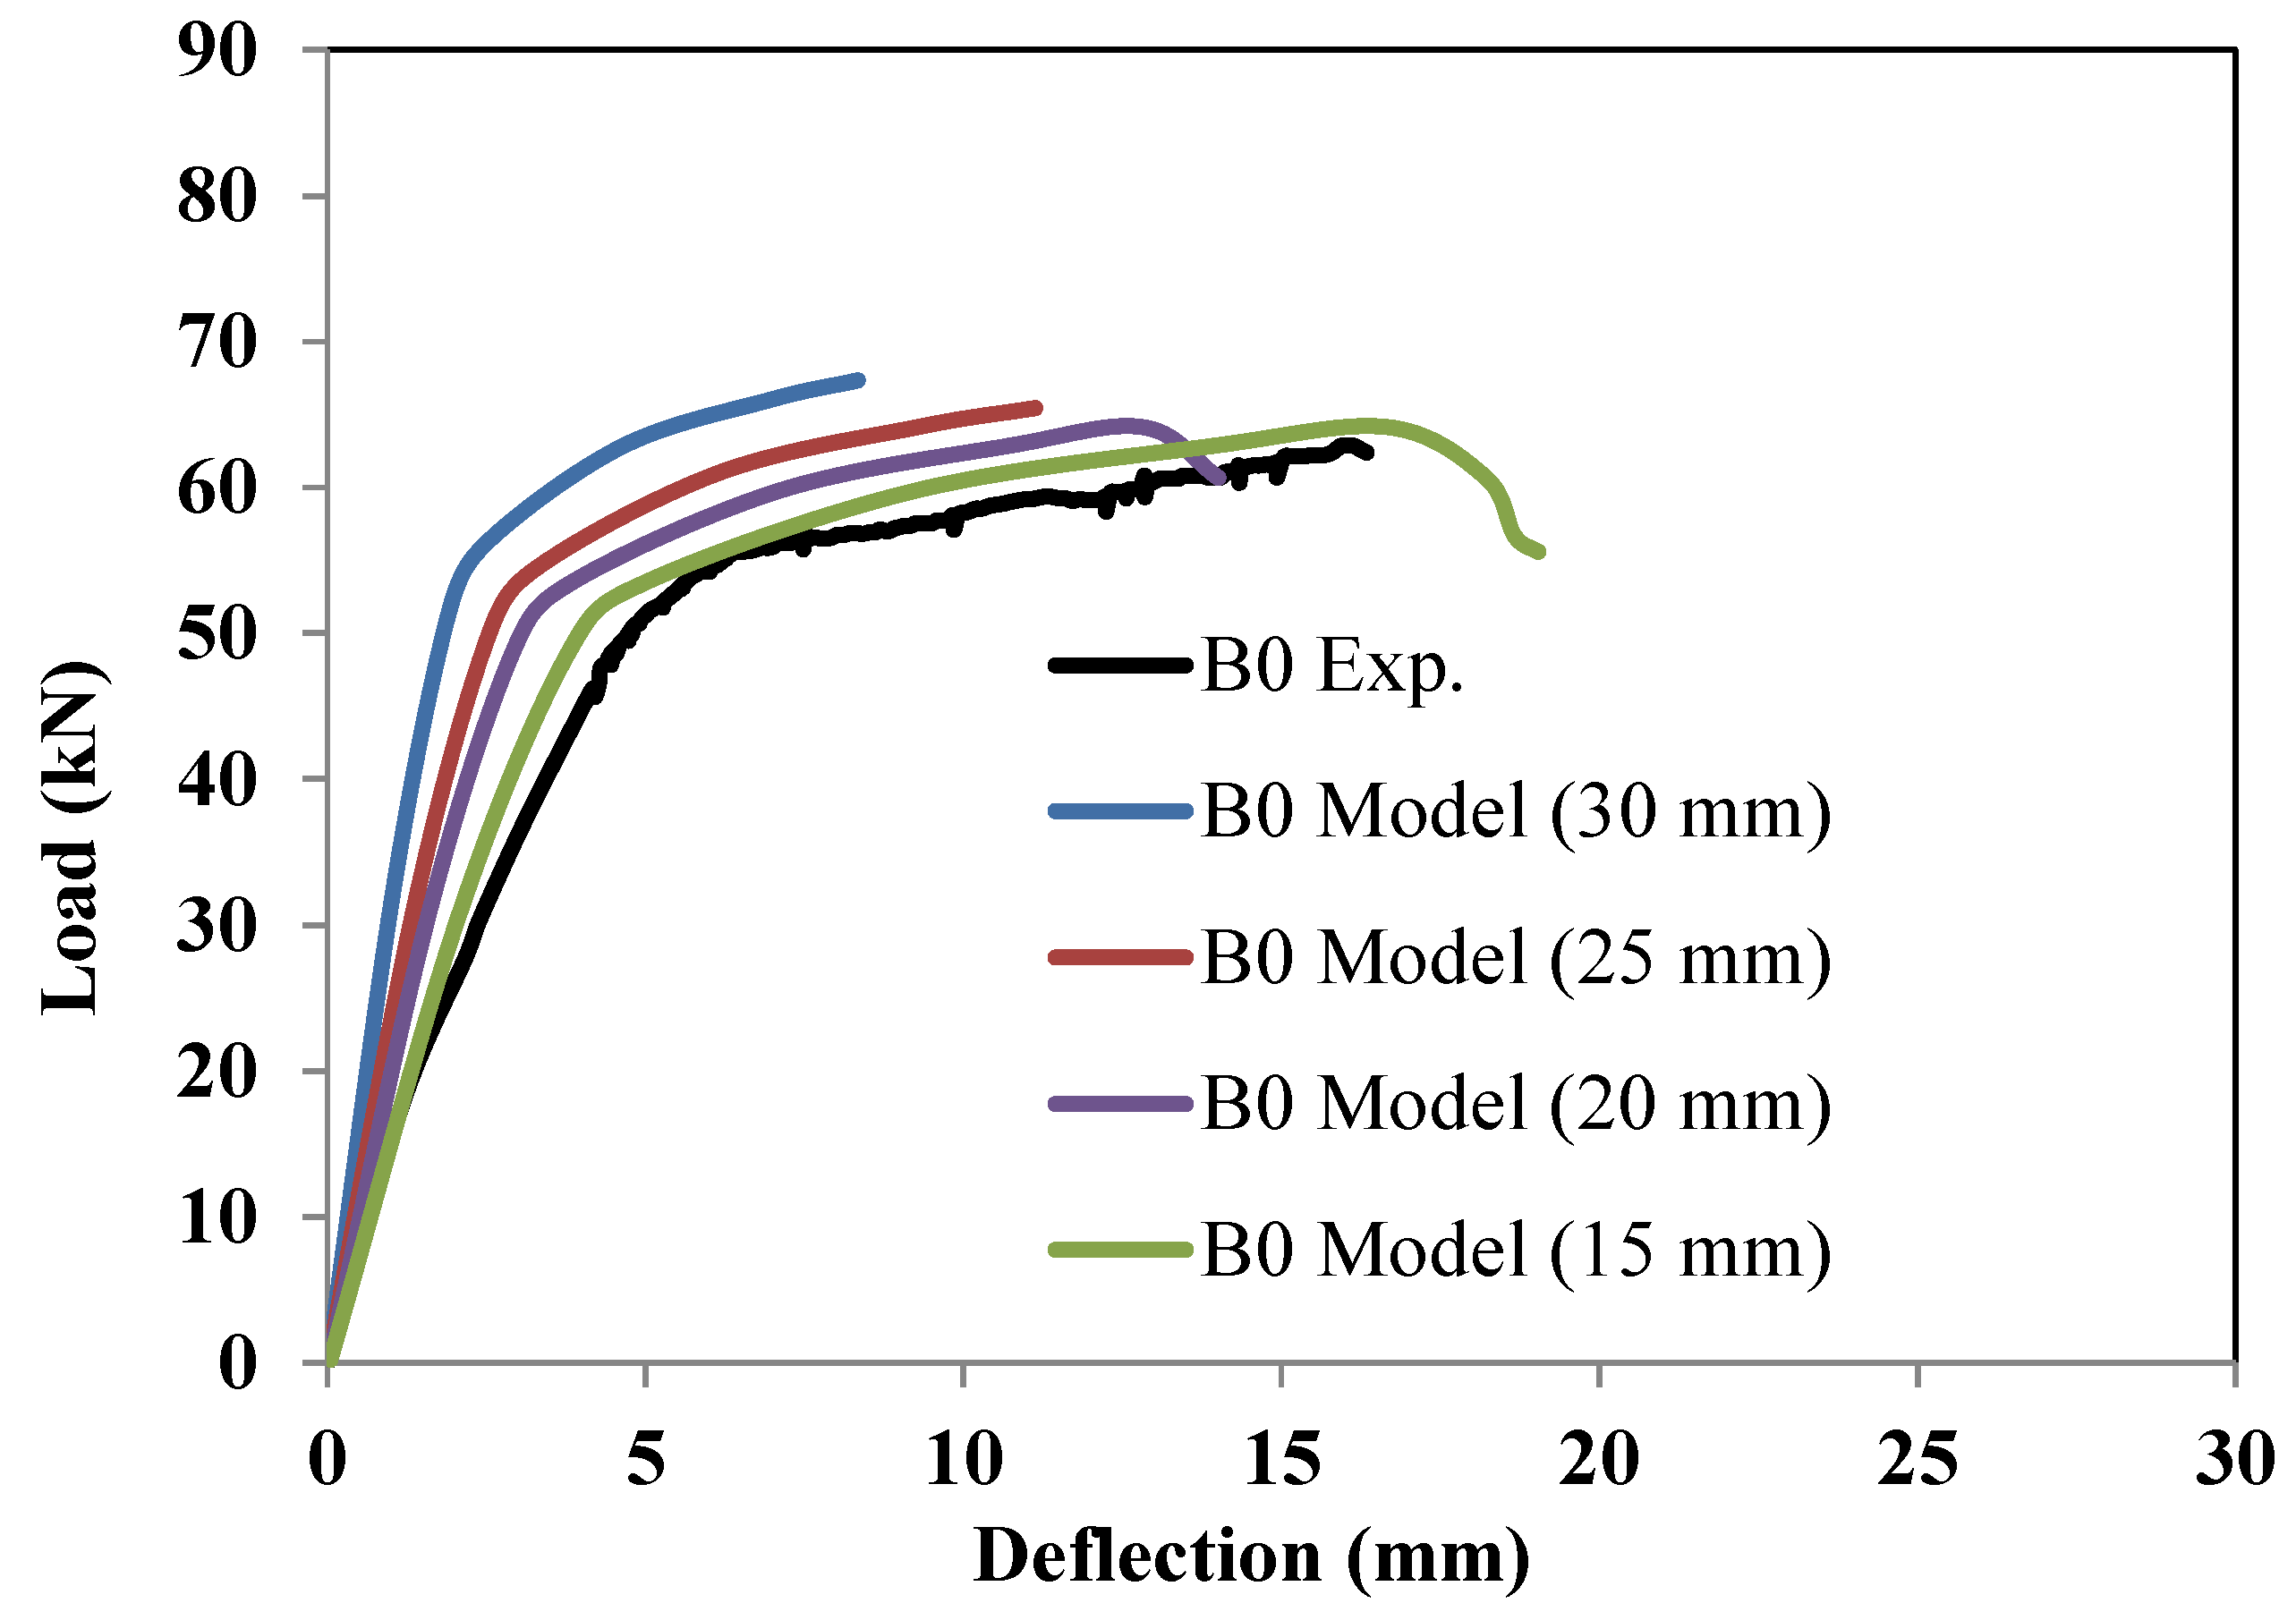
  • The FEM model developed herein was found to accurately predict the performance of the tested specimens, with an average error of maximum 5% observed between the FEM and the test results of the cracking and ultimate load prediction.
  • The parametric study shows that increasing the length of the intermediate connection of the semi-circular-shaped connection increased the ultimate load of the beams. However, the rate of the increase was higher for beams filled with RECC; thus, it is recommended that a greater length of intermediate connection should be used to improve the ultimate load of the beams.

Author Contributions

Conceptualization, A.H.; Methodology, A.H.; Software, A.H.; Validation, A.H.; Formal analysis, A.H. and M.E.; Investigation, A.H., M.E. and M.A.; Data curation, A.H., M.E., M.A. and A.A.A.; Writing—original draft, A.H. and M.A.; Writing—review & editing, M.E., M.A., A.A.A. and V.I.P.; Visualization, A.H., M.A., A.A.A. and V.I.P.; Project administration, A.H. All authors have read and agreed to the published version of the manuscript.

Funding

The study was supported by King Saud University in Riyadh, Saudi Arabia, under project number RSP2024R343. The authors acknowledge the personal funds provided by the first author to conduct the experimental program.

Data Availability Statement

The original contributions presented in the study are included in the article, further inquiries can be directed to the corresponding author.

Conflicts of Interest

The authors declare no conflict of interest.

References

  1. Hamoda, A.; Ahmed, M.; Ghalla, M.; Liang, Q.Q.; Abadel, A.A. Flexural performance of precast circular reinforced concrete members with intermediate connection filled with ultra-high-performance-concrete. Case Stud. Constr. Mater. 2023, 19, e02386. [Google Scholar] [CrossRef]
  2. Zhou, T.; Xu, Y.; Zhou, W.; Hu, Z.; Yu, C.; Liu, Z.; Mahmud, M.T.; Wang, L.; Wan, L. Flexural performance of precast WWCB-filled concrete floor slabs. Case Stud. Constr. Mater. 2024, 20, e02664. [Google Scholar] [CrossRef]
  3. Kolchunov, V.I.; Fedorova, N.V.; Savin, S.Y.; Kaydas, P.A. Progressive Collapse Behavior of a Precast Reinforced Concrete Frame System with Layered Beams. Buildings 2024, 14, 1776. [Google Scholar] [CrossRef]
  4. Xu, Q.; Qian, J.; Zhang, Y.; Tang, L.; Man, D.; Zhen, X.; Han, T. Analysis of Progressive Collapse Resistance in Precast Concrete Frame with a Novel Connection Method. Buildings 2024, 14, 1814. [Google Scholar] [CrossRef]
  5. Xu, C.; Chen, D.; Miramini, S.; Liu, X.; Xu, W.; Zhang, L. Experimental fire performance assessment of a new type of prestressed composite circular precast concrete columns. Eng. Struct. 2023, 278, 115509. [Google Scholar] [CrossRef]
  6. Beni, M.T.; Madhkhan, M. Experimental study on two innovative ductile moment-resisting precast concrete beam-column connections. Structures 2022, 39, 559–572. [Google Scholar] [CrossRef]
  7. Ravasini, S.; Vecchi, F.; Belletti, B.; Muttoni, A. Verification of deflections and cracking of RC flat slabs with numerical and analytical approaches. Eng. Struct. 2023, 284, 115926. [Google Scholar] [CrossRef]
  8. Hamoda, A.; Abdelazeem, F.; Emara, M. Concentric compressive behavior of hybrid concrete–stainless steel double-skin tubular columns incorporating high performance concretes. Thin-Walled Struct. 2021, 159, 107297. [Google Scholar] [CrossRef]
  9. Cai, M.; Zhu, H.; Chen, Q.; Rabczuk, T.; Zhuang, X. Performance of Engineered Cementitious Composites (ECC) in shield tunnel segmental joints: A comparative study with ordinary reinforced concrete. Case Stud. Constr. Mater. 2024, 20, e03138. [Google Scholar] [CrossRef]
  10. Li, V.C.; Wu, C.; Wang, S.; Ogawa, A.; Saito, T. Interface tailoring for strain-hardening polyvinyl alcohol-engineered cementitious composite (PVA-ECC). Mater. J. 2002, 99, 463–472. [Google Scholar]
  11. Naaman, A.E.; Reinhardt, H.-W. Proposed classification of HPFRC composites based on their tensile response. Mater. Struct. 2006, 39, 547–555. [Google Scholar] [CrossRef]
  12. Li, V.C. On engineered cementitious composites (ECC) a review of the material and its applications. J. Adv. Concr. Technol. 2003, 1, 215–230. [Google Scholar] [CrossRef]
  13. Esmaeeli, E.; Manning, E.; Barros, J.A. Strain hardening fibre reinforced cement composites for the flexural strengthening of masonry elements of ancient structures. Constr. Build. Mater. 2013, 38, 1010–1021. [Google Scholar] [CrossRef]
  14. Kyriakides, M.; Billington, S.L. Cyclic response of nonductile reinforced concrete frames with unreinforced masonry infills retrofitted with engineered cementitious composites. J. Struct. Eng. 2014, 140, 04013046. [Google Scholar] [CrossRef]
  15. Suryanto, B.; Reynaud, R.; Cockburn, B. Sectional analysis of engineered cementitious composite beams. Mag. Concr. Res. 2018, 70, 1135–1148. [Google Scholar] [CrossRef]
  16. Ayatar, M.E.; Canbay, E.; Binici, B. Strengthening of reinforced concrete frames with engineered cementitious composite panels. Proc. Inst. Civ. Eng.-Struct. Build. 2020, 173, 237–251. [Google Scholar] [CrossRef]
  17. Billington, S.L.; Yoon, J. Cyclic response of unbonded posttensioned precast columns with ductile fiber-reinforced concrete. J. Bridge Eng. 2004, 9, 353–363. [Google Scholar] [CrossRef]
  18. Hamoda, A.; Emara, M.; Abdelazeem, F.; Ahmed, M. Experimental and numerical analysis of RC beams strengthened with ECC and stainless steel strips. Mag. Concr. Res. 2022, 75, 251–270. [Google Scholar] [CrossRef]
  19. Hung, C.-C.; Chen, Y.-S. Innovative ECC jacketing for retrofitting shear-deficient RC members. Constr. Build. Mater. 2016, 111, 408–418. [Google Scholar] [CrossRef]
  20. Ge, W.-J.; Ashour, A.F.; Ji, X.; Cai, C.; Cao, D.-F. Flexural behavior of ECC-concrete composite beams reinforced with steel bars. Constr. Build. Mater. 2018, 159, 175–188. [Google Scholar] [CrossRef]
  21. Ding, Y.; Yu, K.-Q.; Yu, J.-t.; Xu, S.-l. Structural behaviors of ultra-high performance engineered cementitious composites (UHP-ECC) beams subjected to bending-experimental study. Constr. Build. Mater. 2018, 177, 102–115. [Google Scholar] [CrossRef]
  22. Al-Fakih, A.; Mohammed, B.S.; Liew, M. On rubberized engineered cementitious composites (R-ECC): A review of the constituent material. Case Stud. Constr. Mater. 2021, 14, e00536. [Google Scholar] [CrossRef]
  23. Dadvar, S.A.; Mostofinejad, D.; Bahmani, H. Strengthening of RC columns by ultra-high performance fiber reinforced concrete (UHPFRC) jacketing. Constr. Build. Mater. 2020, 235, 117485. [Google Scholar] [CrossRef]
  24. Elsayed, M.; Tayeh, B.A.; Abou Elmaaty, M.; Aldahshoory, Y. Behaviour of RC columns strengthened with ultra-high performance fiber reinforced concrete (UHPFRC) under eccentric loading. J. Build. Eng. 2022, 47, 103857. [Google Scholar] [CrossRef]
  25. Hamoda, A.; Ahmed, M.; Sennah, K. Experimental and numerical investigations of the effectiveness of engineered cementitious composites and stainless steel plates in shear strengthening of reinforced concrete beams. Struct. Concr. 2023, 24, 2778–2799. [Google Scholar] [CrossRef]
  26. Arulanandam, P.M.; Kanakubo, T.; Singh, S.; Sivasubramanian, M.V. Effect of ECC layer thickness and reinforcement ratio on the load carrying capacity of steel-reinforced composite beams. Struct. Concr. 2023, 24, 2280–2306. [Google Scholar] [CrossRef]
  27. AbdelAleem, B.H.; Hassan, A.A. Use of rubberized engineered cementitious composite in strengthening flexural concrete beams. Eng. Struct. 2022, 262, 114304. [Google Scholar] [CrossRef]
  28. Zhu, J.-X.; Weng, K.-F.; Huang, B.-T.; Xu, L.-Y.; Dai, J.-G. Ultra-High-Strength Engineered Cementitious Composites (UHS-ECC) panel reinforced with FRP bar/grid: Development and flexural performance. Eng. Struct. 2024, 302, 117193. [Google Scholar] [CrossRef]
  29. Hamoda, A.A.; Ahmed, M.; Abadel, A.A.; Ghalla, M.; Patel, V.I.; Liang, Q.Q. Experimental and numerical studies of circular precast concrete slender columns with intermediate connection filled with high-performance concrete. Structures 2023, 57, 105204. [Google Scholar] [CrossRef]
  30. Carreira, D.J.; Chu, K.-H. Stress-strain relationship for plain concrete in compression. J. Proc. 1985, 82, 797–804. [Google Scholar]
  31. Aslani, F. Mechanical properties of waste tire rubber concrete. J. Mater. Civ. Eng. 2016, 28, 04015152. [Google Scholar] [CrossRef]
Figure 1. Schematic details of the reinforcement and joint configurations: (a) control specimen (Model A); (b) triangular intermediate connection (Model B); (c) rectangular intermediate connection (Model C); and (d) semi-circular intermediate connection (Model D).
Buildings 14 02823 g001
Figure 2. Stress–strain relationships of (a) reinforcement bars; (b) NC; (c) the tensile behavior of UHP-ECC; (d) the compression behavior of UHPECC; (e) the tensile behavior of ECC; and (f) the compression behavior of ECC.
Buildings 14 02823 g002aBuildings 14 02823 g002b
Figure 3. Constructing the intermediate connections: (a) forming the intermediate connections; (b) flowable UHPECC; (c) flowable ECC; (d) flowable rubberized ECC; and (e) casting the intermediate connections.
Buildings 14 02823 g003
Figure 4. Test setup and instrumentation.
Buildings 14 02823 g004
Figure 5. Failure modes of the beams of the first group, G-N: (a) beam B0; (b) beam N-tr; (c) N-rec; and (d) N-cr.
Buildings 14 02823 g005
Figure 6. The failure mode of beams of Group G-U (a) beam U-10; (b) beam U-12.
Buildings 14 02823 g006
Figure 7. Failure mode of the beams of Group G-E: (a) beam U-10; (b) beam U-12.
Buildings 14 02823 g007
Figure 8. The failure mode of beams of Group G-RE: (a) beam R-10; (b) beam R-12; and (c) beam R-16.
Buildings 14 02823 g008
Figure 9. Load-mid-span deflection: (a) Group G-N; (b) Group G-U; (c) Group G-E; and (d) Group G-RE.
Buildings 14 02823 g009
Figure 10. The energy absorption capacity of the tested beams.
Buildings 14 02823 g010
Figure 11. The elastic stiffness of the tested beams.
Buildings 14 02823 g011
Figure 12. The 3D finite element model: (a) control beam (Model A), (b) Model B, (c) Model C, and (d) Model D.
Buildings 14 02823 g012aBuildings 14 02823 g012b
Figure 13. Effects of mesh size on the accuracy of the load-deflection curves.
Buildings 14 02823 g013
Figure 14. Experimental observation vs. the FEM load mid-span deflection predictions of (a) Group GN; (b) Group GU; (c) Group GE; and (d) Group RECC.
Buildings 14 02823 g014
Figure 15. Experimental observation vs. the FEM failure modes predictions of (a) beam B0; (b) beam N-tr; (c) beam N-cr; and (d) beam E-10.
Buildings 14 02823 g015aBuildings 14 02823 g015b
Figure 16. Effect of the strengthening configuration on the ultimate capacity.
Buildings 14 02823 g016
Figure 17. Effect of the circular configuration length on the ultimate capacity.
Buildings 14 02823 g017
Table 1. Details of the tested specimens.
GroupBeam IDDetailsConcrete Used at the Construction JointType of Joint FormBar Diameter (D) (mm)LcLength Value (mm)
G-NB0Model A----------------------------------------
N-trModel BNCTriangular1020D200
N-recModel CNCRectangular1020D200
N-crModel DNCSemi-circle1020D200
G-UB0Model A----------------------------------------
U-10Model CUHPECCRectangular1020D200
U-12Model CUHPECCRectangular1216D200
G-EB0Model A----------------------------------------
E-10Model CECCRectangular1020D200
E-12Model CECCRectangular1216D200
G-REB0Model A----------------------------------------
RECC-10Model CRECCRectangular1020D200
RECC-12Model CRECCRectangular1216D200
RECC-16Model CRECCRectangular1612D200
Table 2. Material properties of reinforcement bars.
Steel ElementPositionYield StageUltimate StageE (GPa)Poisson’s Ratio
σy (MPa)εy(%)σu (MPa)εu(%)
8 mmShear 2910.15444313.211880.30
10 mmFlexural or compression 3340.17150711.421950.30
12 mmFlexural 3320.16853011.111970.30
16 mmFlexural3580.19654413.131970.3
σ: Stress; ε: strain; E: modulus of elasticity.
Table 3. Mix proportions and properties of the different grades of concrete.
ConcreteCement
(kg/m3)
F.Agg
(kg/m3)
C.Agg.
(kg/m3)
F.A.
(kg/m3)
S.F
(kg/m3)
Crumb Rubber
(kg/m3)
W/bPP (kg/m3)HRWR
(kg/m3)
fc` (N/mm2)ft
(N/mm2)
NC3496971151---------0.42------332.98
UHPECC800500---750150---0.221940 (S.P)12911.85
ECC558436---665------0.232015524.43
RECC556650---660---500.252014.5423.82
Table 4. Summary of the test results.
GroupSpecimenCracking StageUltimate StageElastic StiffnessEnergy Absorption
IDPcrPcrB/PcrB0ΔcrPuPuB/PuB0ΔPuK
(kN/mm)
KB/KB0EB
(kNmm2)
EB/EB0
(kN)(mm)(kN)(mm)
G-NB0321.002.41621.0016.2613.281.001320.241.00
N-tr310.972.43500.8112.4012.760.96430.920.33
N-rec351.092.89600.9717.1012.110.91783.280.59
N-cr290.912.6520.849.7611.150.84531.710.40
G-UB0321.002.41620.9216.2613.281.001320.241.00
U-10451.412.45701.1318.9418.371.382308.561.75
U-12501.563.1801.2921.3816.131.213745.482.84
G-EB0321.002.41620.9216.2613.281.001320.241.00
E-10451.412.51600.9715.6017.931.351410.521.07
E-12391.222.45651.0521.8115.921.201870.131.42
G-REB0321.002.41620.9216.2613.281.001320.241.00
RECC-10300.942.66450.735.8311.280.85733.790.56
RECC-12351.093.81550.8914.449.190.69910.690.69
RECC-16381.193.88631.0216.359.790.741185.750.90
Table 5. Validation of the FEM by the experimental results.
GroupSpecimenCrackingUltimate
P c r , F E
(kN)
P c r , exp
(kN)
P c r , F E P c r , exp Δ c r , F E
(mm)
Δ c r , exp
(mm)
Δ c r , F E Δ c r , exp P u , F E
(kN)
P u , e x p
(kN)
P u , F E P u , e x p Δ u , F E
(mm)
Δ u , e x p
(mm)
Δ u , F E Δ u , e x p
GNB035321.0942.752.411.14164621.03216.8716.261.038
N-tr33311.0652.732.431.12351501.02012.7912.401.031
N-rec33350.9432.622.890.90762601.03316.6417.100.973
N-cr34291.1722.762.61.06253521.0199.359.760.958
G-UB035321.0942.752.411.14164621.03216.8716.261.038
U-1050451.1113.642.451.48674701.05721.5218.941.136
U-1252501.0403.873.11.24882801.02523.1421.351.084
G-EB035321.0942.752.411.14164621.03216.8716.261.038
E-1043450.9563.112.511.23966601.10018.4115.601.180
E-1244391.1283.132.451.27868651.04618.9321.810.868
G-RECCB035321.0942.752.411.14164621.03216.8716.261.038
RECC-1032301.0673.422.661.28652451.15612.4311.281.102
RECC-1234350.9713.313.810.86958551.05515.929.191.732
RECC-1634380.8953.343.880.86162630.98415.949.791.628
Mean1.052 1.137 1.045 1.132
Standard deviation0.077 0.168 0.039 0.237
Coefficient of variation0.074 0.147 0.038 0.209
Table 6. Details of the beams analyzed for parametric study.
GroupBeam
ID
DetailsConcrete Used at the Construction JointType of Joint FormBar Diameter (D)
(mm)
LcLength Value (mm)
G-UU-trModel BUHPECCTriangular1020D200
U-recModel CUHPECCRectangular1020D200
U-crModel DUHPECCSemi-circle1020D200
G-EE-trModel BECCTriangular1020D200
E-recModel CECCRectangular1020D200
E-crModel DECCSemi-circle1020D200
G-RER-trModel BRECCTriangular1020D200
R-recModel CRECCRectangular1020D200
R-crModel DRECCSemi-circle1020D200
G-U-crU-cr-100Model DUHPECCSemi-circle1010D100
U-cr-200Model DUHPECCSemi-circle1020D200
U-cr-300Model DUHPECCSemi-circle1030D300
G-E-crE-cr-100Model DECCSemi-circle1010D100
E-cr-200Model DECCSemi-circle1020D200
E-cr-300Model DECCSemi-circle1030D300
G-RE-crR-cr-100Model DRECCSemi-circle1010D100
R-cr-200Model DRECCSemi-circle1020D200
R-cr-300Model DRECCSemi-circle1030D300
Disclaimer/Publisher’s Note: The statements, opinions and data contained in all publications are solely those of the individual author(s) and contributor(s) and not of MDPI and/or the editor(s). MDPI and/or the editor(s) disclaim responsibility for any injury to people or property resulting from any ideas, methods, instructions or products referred to in the content.

